
Night King Official
10.8k Posts

Night King Official
 Square Verified+
Report
Block User
Chief Strategist | Market Flow Analyst | Expert Content Creator | GEN KOL & Holder | High Stakes Trader
339 Following
33.4K+ Followers
12.4K+ Liked
Posts
Portfolio
PINNED
·
--
Bullish
Verified
The Proof Is Real But the Record Is the Real Test
Hey guys, let's look at Space and Time (SXT) the Microsoft-backed verifiable data play and see what's actually moving.
Proof of SQL is a working engine. It's a proprietary ZK coprocessor (described by the company as patented technology) that proves database queries ran correctly on committed records. The team says supported queries over a million rows can prove in under a second with GPU acceleration.
Enterprise made it concrete this month. On November 9, 2026, Space and Time launched Enterprise, letting businesses run Proof of SQL on their own servers. Launch partners include Maple Finance, Indomobil, Trenez and The Data Foundation.
The backing adds weight. Microsoft's M12 led a 20 million round and Grayscale launched an SXT trust in 2025.
But the boundary matters. Proof of SQL proves the calculation, not whether the source record was accurate. CEO Nate Holiday himself says an incorrect entry still needs to be caught through the business's data controls.
The market picture is mixed. Trading roughly 95% below its May 2025 all-time high of 0.187 on Binance, SXT also saw Coinbase Markets suspend its SXT-PERP perpetual futures contract on March 16, 2026, as part of a 25-contract liquidity cleanup. That's a market signal, not a verdict on the tech.
Coinbase Markets officially announced the suspension of SXT-PERP perpetual futures trading on March 16, 2026. This was part of a broader contract review, not necessarily a judgment on Space and Time's underlying technology.
So here's my open question: when a bank or AI agent leans on a proof for a decision that costs real money, can the verification carry that weight or does the real load always stay with the business's own data governance?
@SpaceandTimeDB $SXT #sxt
The Proof Is Real But the Record Is the Real Test
Hey guys, let's look at Space and Time (SXT) the Microsoft-backed verifiable data play and see what's actually moving.
Proof of SQL is a working engine. It's a proprietary ZK coprocessor (described by the company as patented technology) that proves database queries ran correctly on committed records. The team says supported queries over a million rows can prove in under a second with GPU acceleration.
Enterprise made it concrete this month. On November 9, 2026, Space and Time launched Enterprise, letting businesses run Proof of SQL on their own servers. Launch partners include Maple Finance, Indomobil, Trenez and The Data Foundation.
The backing adds weight. Microsoft's M12 led a 20 million round and Grayscale launched an SXT trust in 2025.
But the boundary matters. Proof of SQL proves the calculation, not whether the source record was accurate. CEO Nate Holiday himself says an incorrect entry still needs to be caught through the business's data controls.
The market picture is mixed. Trading roughly 95% below its May 2025 all-time high of 0.187 on Binance, SXT also saw Coinbase Markets suspend its SXT-PERP perpetual futures contract on March 16, 2026, as part of a 25-contract liquidity cleanup. That's a market signal, not a verdict on the tech.
Coinbase Markets officially announced the suspension of SXT-PERP perpetual futures trading on March 16, 2026. This was part of a broader contract review, not necessarily a judgment on Space and Time's underlying technology.
So here's my open question: when a bank or AI agent leans on a proof for a decision that costs real money, can the verification carry that weight or does the real load always stay with the business's own data governance?
@SpaceandTime $SXT #sxt
Hey guys, let's look at Space and Time (SXT) the Microsoft-backed verifiable data play and see what's actually moving.
Proof of SQL is a working engine. It's a proprietary ZK coprocessor (described by the company as patented technology) that proves database queries ran correctly on committed records. The team says supported queries over a million rows can prove in under a second with GPU acceleration.
Enterprise made it concrete this month. On November 9, 2026, Space and Time launched Enterprise, letting businesses run Proof of SQL on their own servers. Launch partners include Maple Finance, Indomobil, Trenez and The Data Foundation.
The backing adds weight. Microsoft's M12 led a 20 million round and Grayscale launched an SXT trust in 2025.
But the boundary matters. Proof of SQL proves the calculation, not whether the source record was accurate. CEO Nate Holiday himself says an incorrect entry still needs to be caught through the business's data controls.
The market picture is mixed. Trading roughly 95% below its May 2025 all-time high of 0.187 on Binance, SXT also saw Coinbase Markets suspend its SXT-PERP perpetual futures contract on March 16, 2026, as part of a 25-contract liquidity cleanup. That's a market signal, not a verdict on the tech.
Coinbase Markets officially announced the suspension of SXT-PERP perpetual futures trading on March 16, 2026. This was part of a broader contract review, not necessarily a judgment on Space and Time's underlying technology.
So here's my open question: when a bank or AI agent leans on a proof for a decision that costs real money, can the verification carry that weight or does the real load always stay with the business's own data governance?
@SpaceandTime $SXT #sxt

12
1.9k
·
--
Bullish
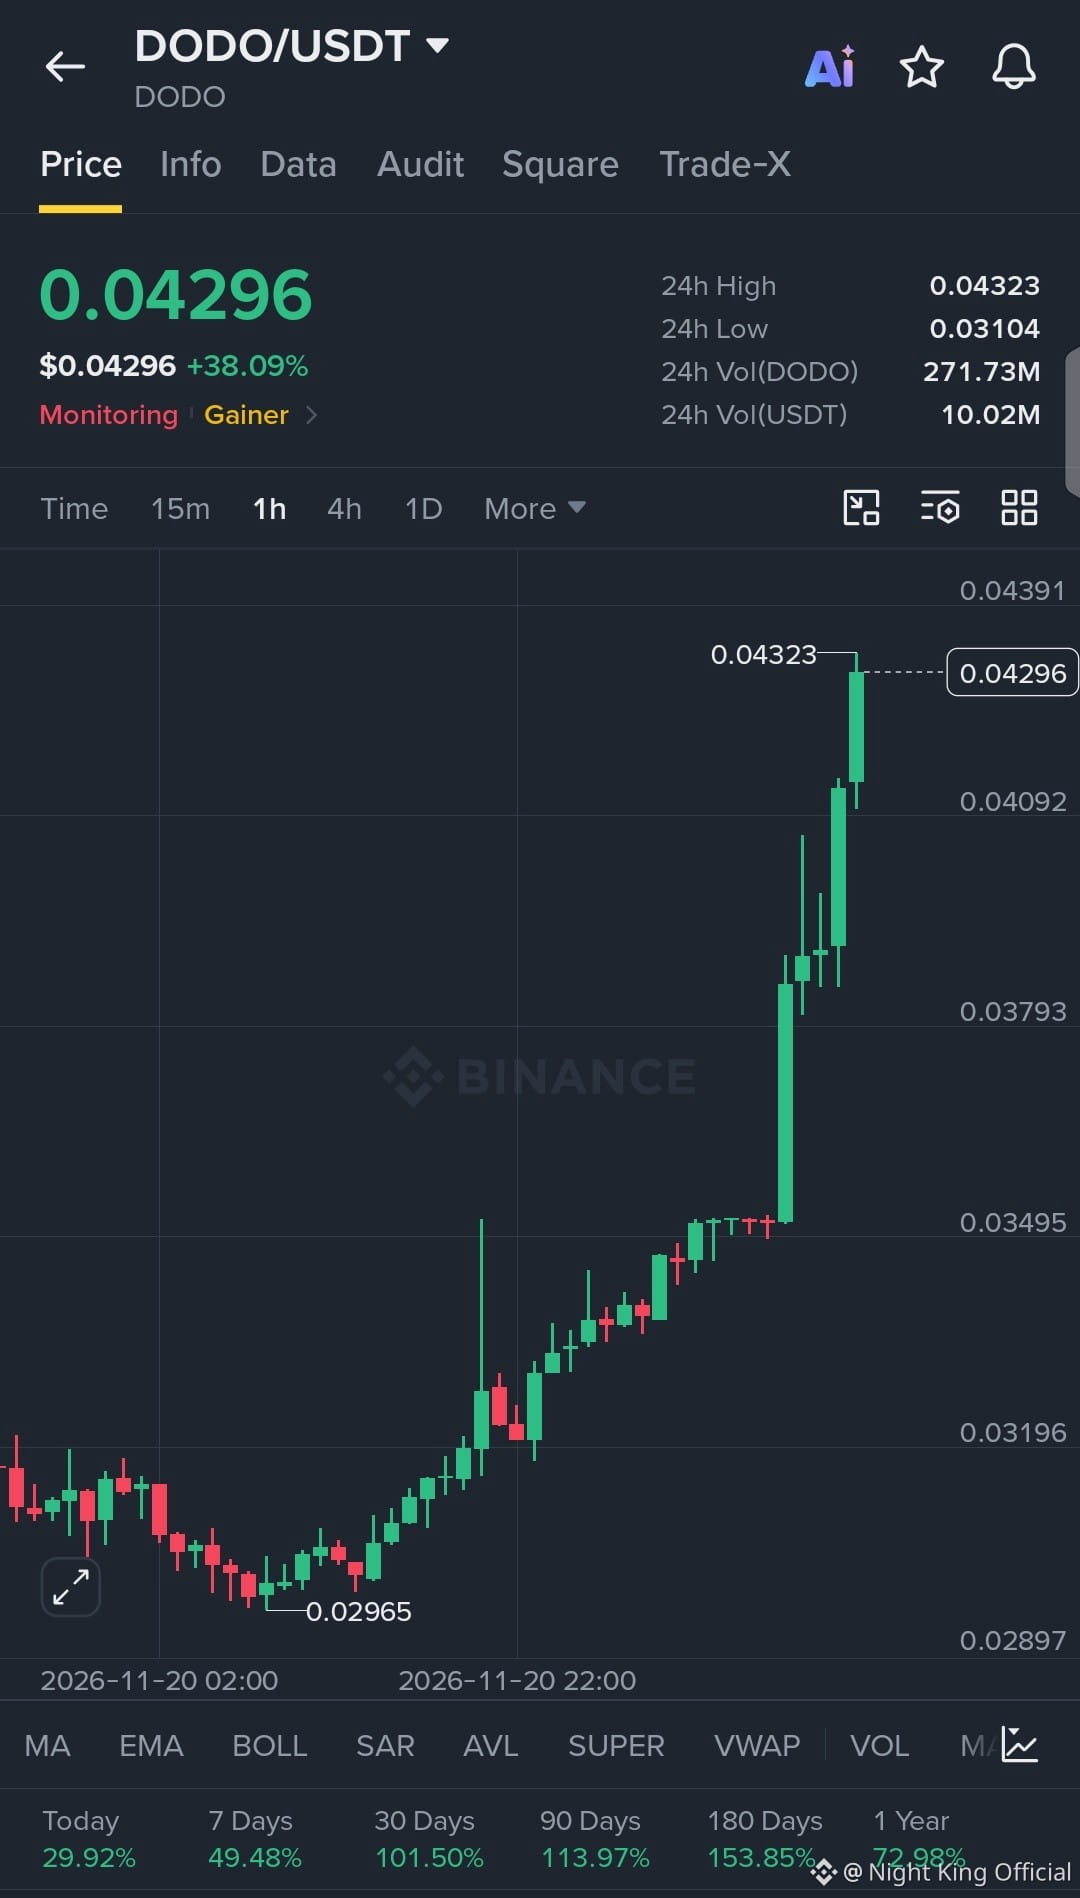
🔥 $DODO Vertical Run Toward 0.04323
Bias: LONG on a pullback
Entry Range: 0.03793 – 0.04092
TP1: 0.04296
TP2: 0.04323
TP3: 0.04391
SL: 0.03495
Momentum check: The 1H candles climbed from the 0.02965 low to a new 24h High at 0.04323 with barely any pullback, so price looks stretched and the entry zone sits well below the current level.
Do you chase this move, or wait for a dip toward 0.04092?
Not financial advice. DYOR.
#DODO #DODOUSDT #CryptoMomentum #BinanceSquare #Gainer
{spot}(DODOUSDT)
🔥 $DODO Vertical Run Toward 0.04323
Bias: LONG on a pullback
Entry Range: 0.03793 – 0.04092
TP1: 0.04296
TP2: 0.04323
TP3: 0.04391
SL: 0.03495
Momentum check: The 1H candles climbed from the 0.02965 low to a new 24h High at 0.04323 with barely any pullback, so price looks stretched and the entry zone sits well below the current level.
Do you chase this move, or wait for a dip toward 0.04092?
Not financial advice. DYOR.
#DODO #DODOUSDT #CryptoMomentum #BinanceSquare #Gainer
Bias: LONG on a pullback
Entry Range: 0.03793 – 0.04092
TP1: 0.04296
TP2: 0.04323
TP3: 0.04391
SL: 0.03495
Momentum check: The 1H candles climbed from the 0.02965 low to a new 24h High at 0.04323 with barely any pullback, so price looks stretched and the entry zone sits well below the current level.
Do you chase this move, or wait for a dip toward 0.04092?
Not financial advice. DYOR.
#DODO #DODOUSDT #CryptoMomentum #BinanceSquare #Gainer
287
·
--
Bullish
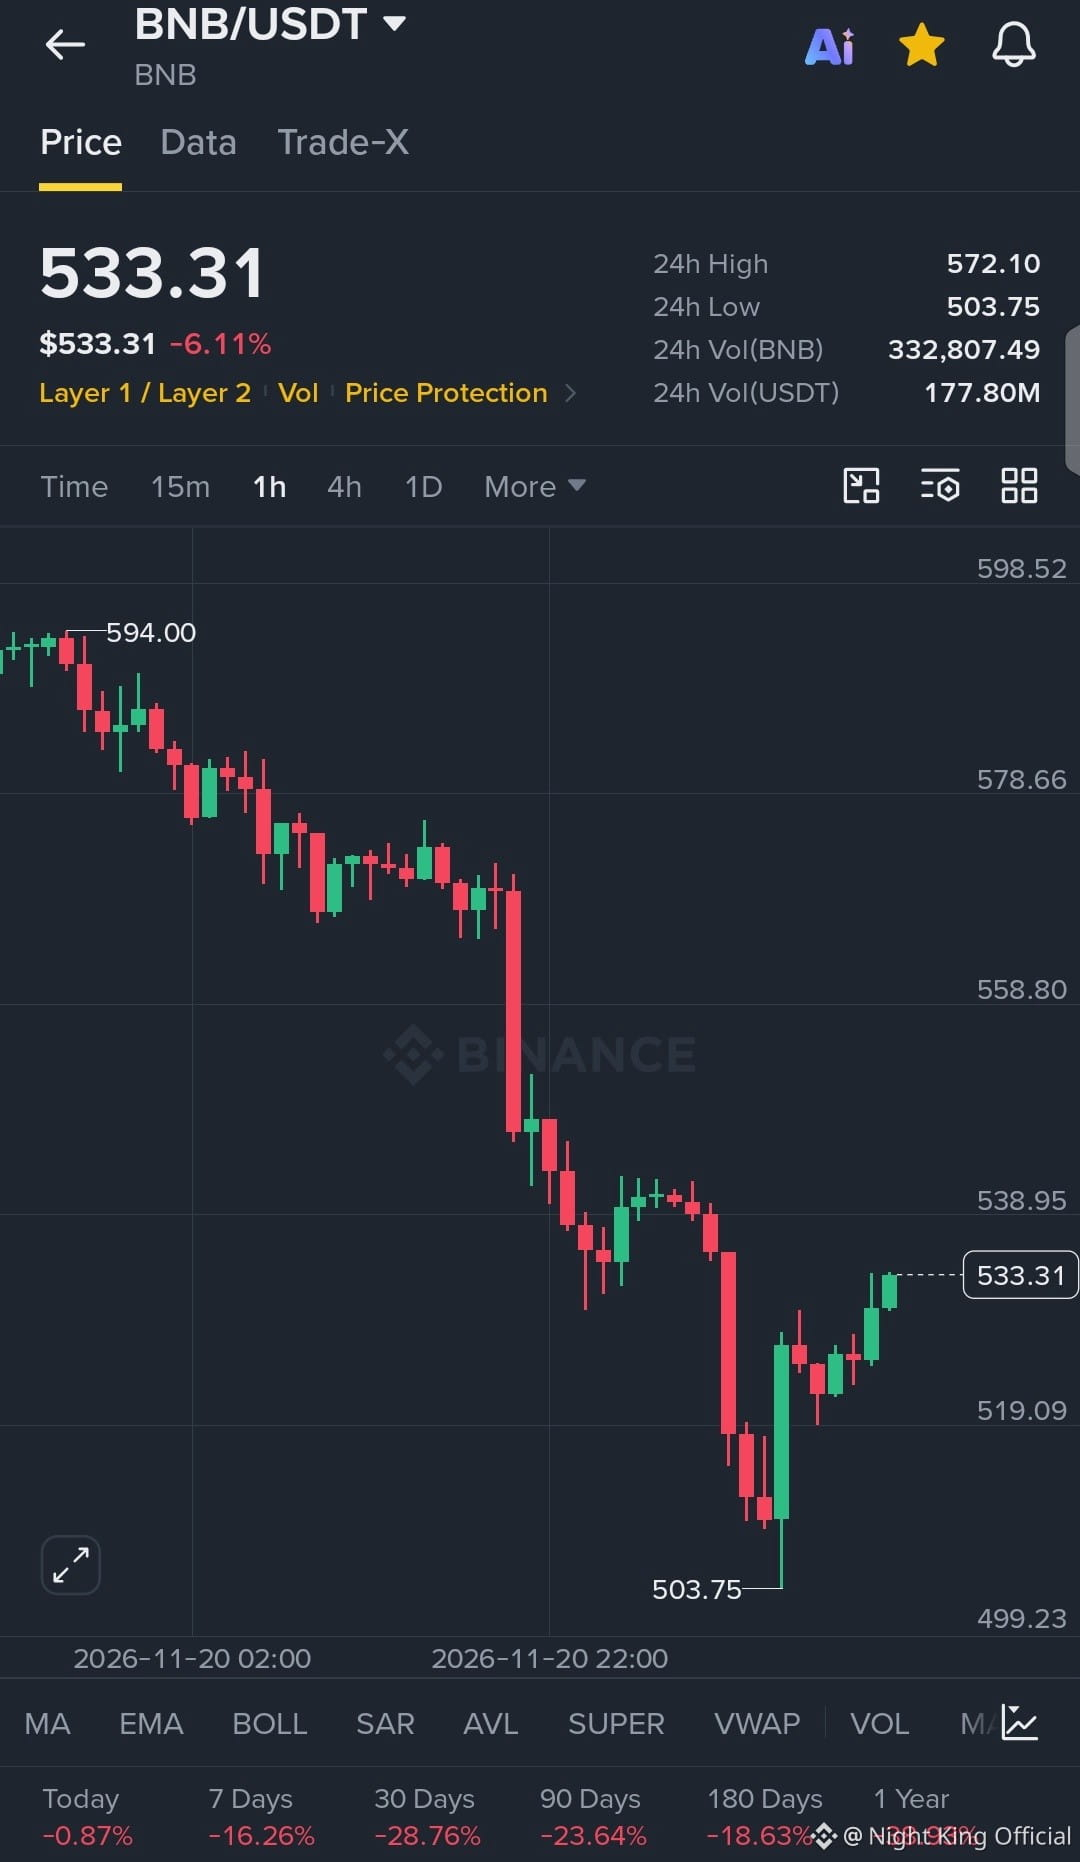
💥 $BNB Rebound From the 503.75 Low
LONG | Entry: 519.09 – 533.31
TP1: 538.95
TP2: 558.80
TP3: 572.10
SL: 503.75
Direct read: Price bounced from the 503.75 24h Low after a steep 1H drop from the 594.00 swing high, but it still trades below 538.95, so the rebound is unconfirmed.
Can BNB reclaim 538.95, or is this just a pause before another leg down?
Not financial advice. DYOR.
#BNB #CryptoSignals #BinanceSquare #LongSetup
{spot}(BNBUSDT)
💥 $BNB Rebound From the 503.75 Low
LONG | Entry: 519.09 – 533.31
TP1: 538.95
TP2: 558.80
TP3: 572.10
SL: 503.75
Direct read: Price bounced from the 503.75 24h Low after a steep 1H drop from the 594.00 swing high, but it still trades below 538.95, so the rebound is unconfirmed.
Can BNB reclaim 538.95, or is this just a pause before another leg down?
Not financial advice. DYOR.
#BNB #CryptoSignals #BinanceSquare #LongSetup
LONG | Entry: 519.09 – 533.31
TP1: 538.95
TP2: 558.80
TP3: 572.10
SL: 503.75
Direct read: Price bounced from the 503.75 24h Low after a steep 1H drop from the 594.00 swing high, but it still trades below 538.95, so the rebound is unconfirmed.
Can BNB reclaim 538.95, or is this just a pause before another leg down?
Not financial advice. DYOR.
#BNB #CryptoSignals #BinanceSquare #LongSetup
317
·
--
Bullish
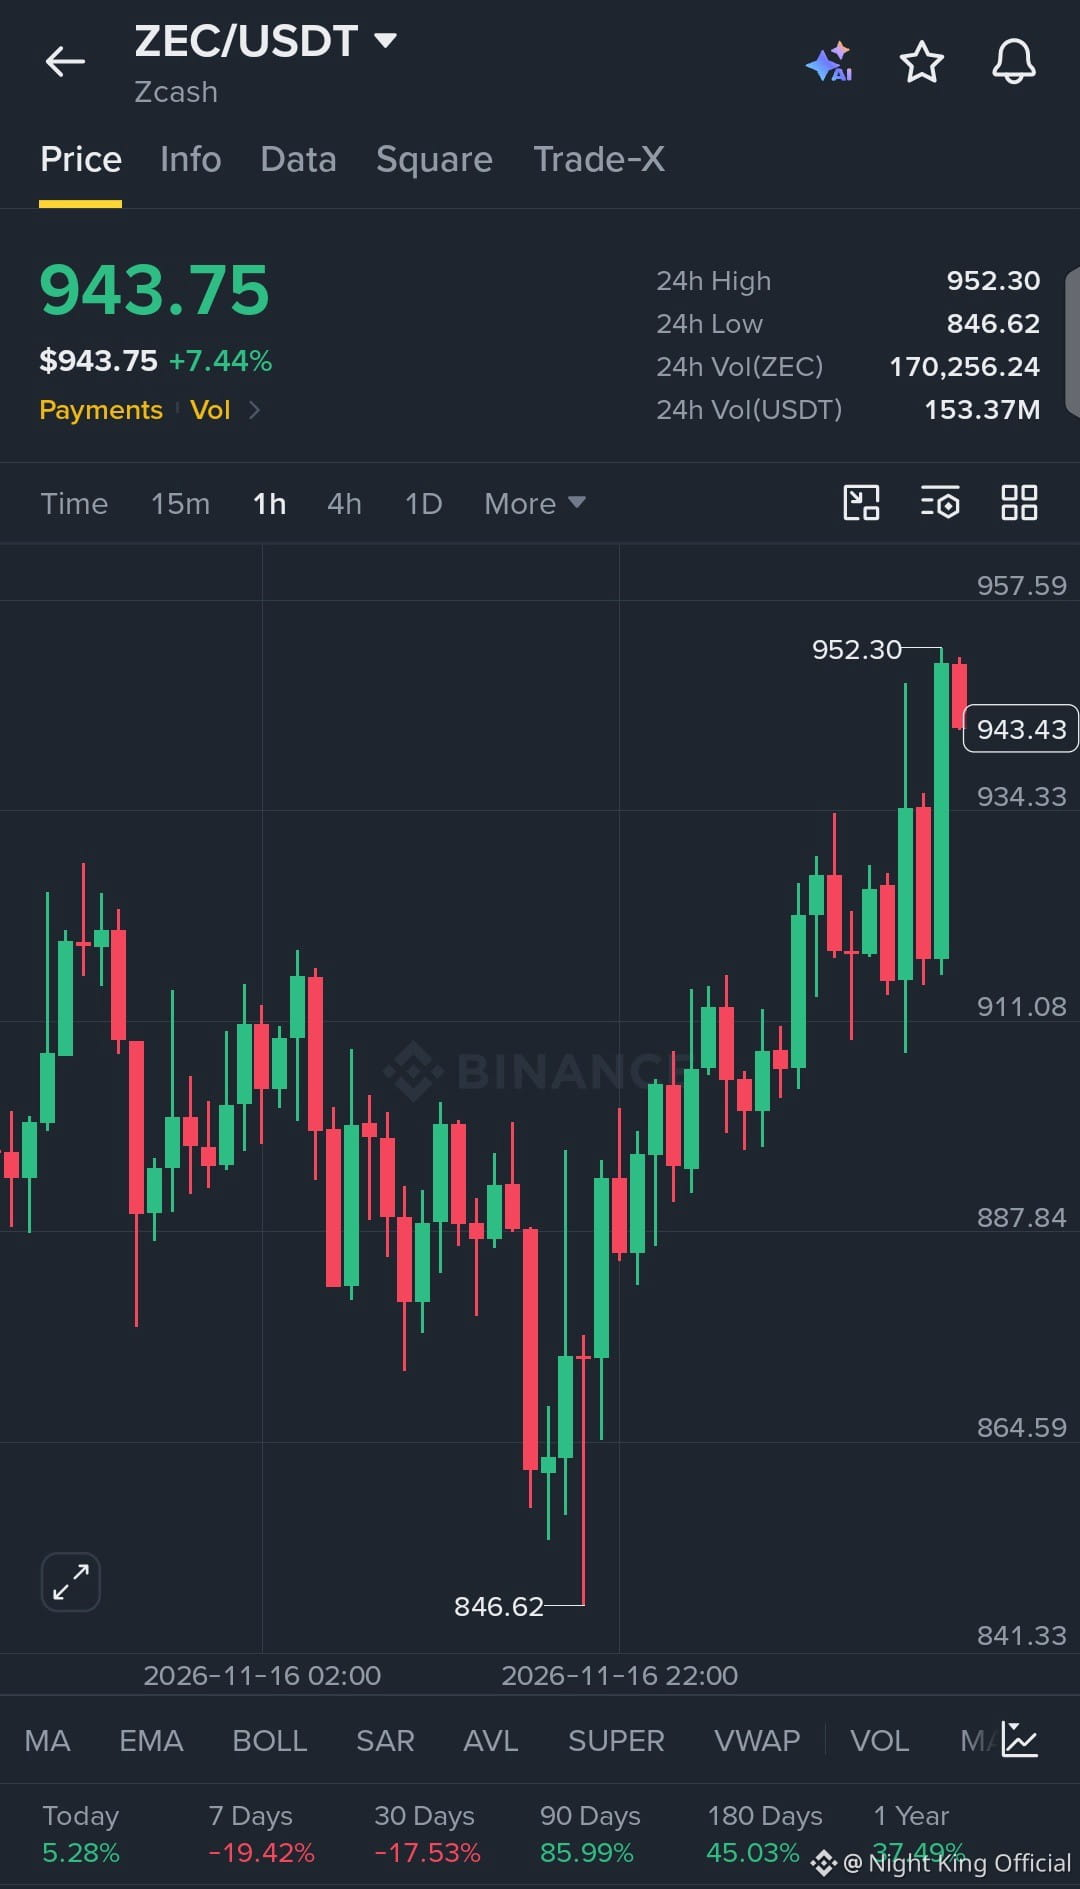
🚀 $ZEC Pullback Entry After the Push to 952.30
Direction: LONG
Entry Range: 911.08 – 934.33
TP1: 943.75
TP2: 952.30
TP3: 957.59
SL: 887.84
The 1H chart shows higher lows since the 846.62 24h Low, but the last candle turned red right under the 952.30 swing high, so a dip into the entry zone would be the cleaner level to watch.
Will ZEC clear 952.30, or pull back first?
Not financial advice. DYOR.
#ZEC #CryptoSignals #BinanceSquare #TradeSetup
{spot}(ZECUSDT)
🚀 $ZEC Pullback Entry After the Push to 952.30
Direction: LONG
Entry Range: 911.08 – 934.33
TP1: 943.75
TP2: 952.30
TP3: 957.59
SL: 887.84
The 1H chart shows higher lows since the 846.62 24h Low, but the last candle turned red right under the 952.30 swing high, so a dip into the entry zone would be the cleaner level to watch.
Will ZEC clear 952.30, or pull back first?
Not financial advice. DYOR.
#ZEC #CryptoSignals #BinanceSquare #TradeSetup
Direction: LONG
Entry Range: 911.08 – 934.33
TP1: 943.75
TP2: 952.30
TP3: 957.59
SL: 887.84
The 1H chart shows higher lows since the 846.62 24h Low, but the last candle turned red right under the 952.30 swing high, so a dip into the entry zone would be the cleaner level to watch.
Will ZEC clear 952.30, or pull back first?
Not financial advice. DYOR.
#ZEC #CryptoSignals #BinanceSquare #TradeSetup
1
1
272
·
--
Bullish
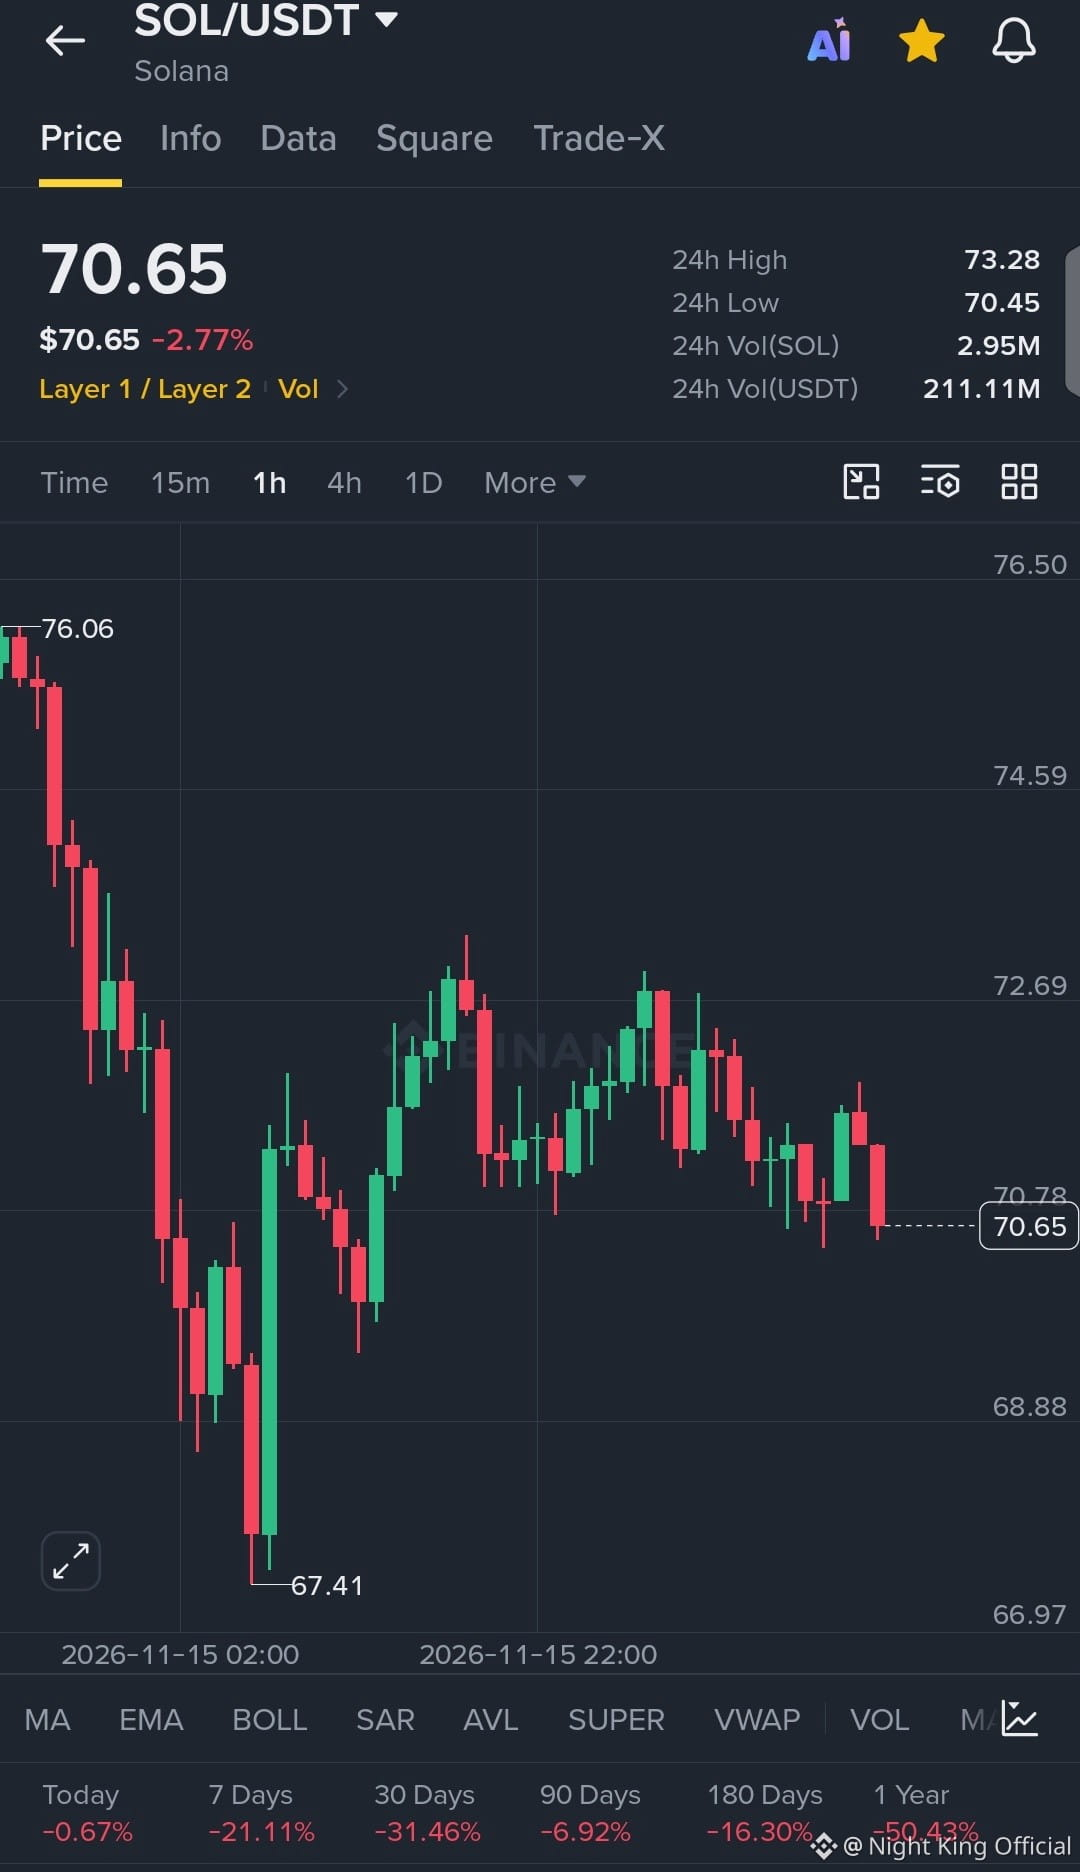
🚨 $SOL Pressing the 24h Low
Short setup:
Entry: 70.65 – 70.78
TP1: 68.88
TP2: 67.41
TP3: 66.97
SL: 72.69
Price is sitting just above the 70.45 24h Low, and the 1H candles show lower highs since the 76.06 swing high.
Does SOL lose 70.45, or bounce back toward 72.69?
Not financial advice. DYOR.
#SOL #CryptoSignals #BinanceSquare #TradeSetup
{spot}(SOLUSDT)
🚨 $SOL Pressing the 24h Low
Short setup:
Entry: 70.65 – 70.78
TP1: 68.88
TP2: 67.41
TP3: 66.97
SL: 72.69
Price is sitting just above the 70.45 24h Low, and the 1H candles show lower highs since the 76.06 swing high.
Does SOL lose 70.45, or bounce back toward 72.69?
Not financial advice. DYOR.
#SOL #CryptoSignals #BinanceSquare #TradeSetup
Short setup:
Entry: 70.65 – 70.78
TP1: 68.88
TP2: 67.41
TP3: 66.97
SL: 72.69
Price is sitting just above the 70.45 24h Low, and the 1H candles show lower highs since the 76.06 swing high.
Does SOL lose 70.45, or bounce back toward 72.69?
Not financial advice. DYOR.
#SOL #CryptoSignals #BinanceSquare #TradeSetup
1
1
282
·
--
Bullish
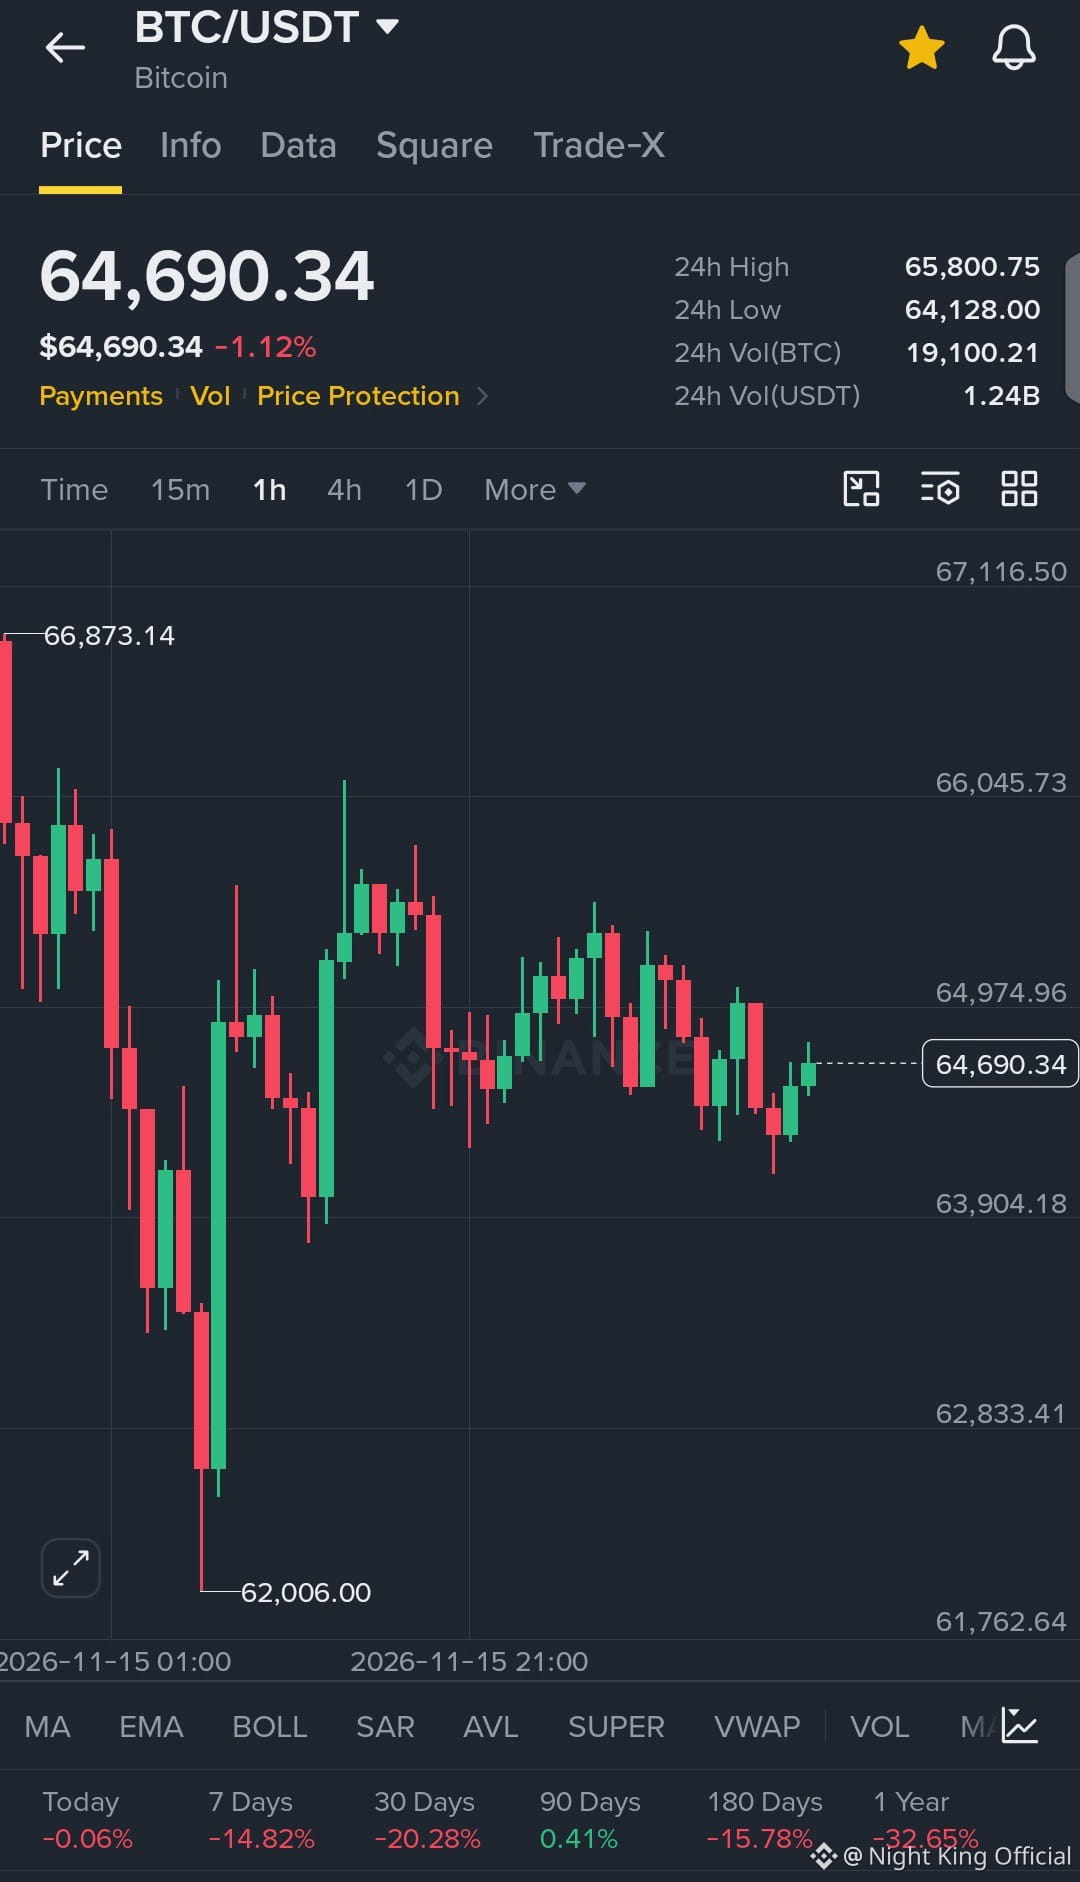
🛡️ $BTC Range Play Above 64,128.00
Direction: LONG
*Entry Range: 64,128.00 – 64,690.34
TP1: 64,974.96
TP2: 65,800.75
TP3: 66,045.73
SL: 63,904.18
Setup: The 1H candles are moving sideways between the 24h Low at 64,128.00 and 64,974.96 after the 62,006.00 low, so a long here depends on that 24h Low holding.
Question: Will BTC clear 64,974.96, or slip back toward 63,904.18?
Not financial advice. DYOR.
#BTC #Bitcoin #CryptoTrading #TradeSetup #BinanceSquare
{spot}(BTCUSDT)
🛡️ $BTC Range Play Above 64,128.00
Direction: LONG
*Entry Range: 64,128.00 – 64,690.34
TP1: 64,974.96
TP2: 65,800.75
TP3: 66,045.73
SL: 63,904.18
Setup: The 1H candles are moving sideways between the 24h Low at 64,128.00 and 64,974.96 after the 62,006.00 low, so a long here depends on that 24h Low holding.
Question: Will BTC clear 64,974.96, or slip back toward 63,904.18?
Not financial advice. DYOR.
#BTC #Bitcoin #CryptoTrading #TradeSetup #BinanceSquare
Direction: LONG
*Entry Range: 64,128.00 – 64,690.34
TP1: 64,974.96
TP2: 65,800.75
TP3: 66,045.73
SL: 63,904.18
Setup: The 1H candles are moving sideways between the 24h Low at 64,128.00 and 64,974.96 after the 62,006.00 low, so a long here depends on that 24h Low holding.
Question: Will BTC clear 64,974.96, or slip back toward 63,904.18?
Not financial advice. DYOR.
#BTC #Bitcoin #CryptoTrading #TradeSetup #BinanceSquare
1
297
·
--
Bullish
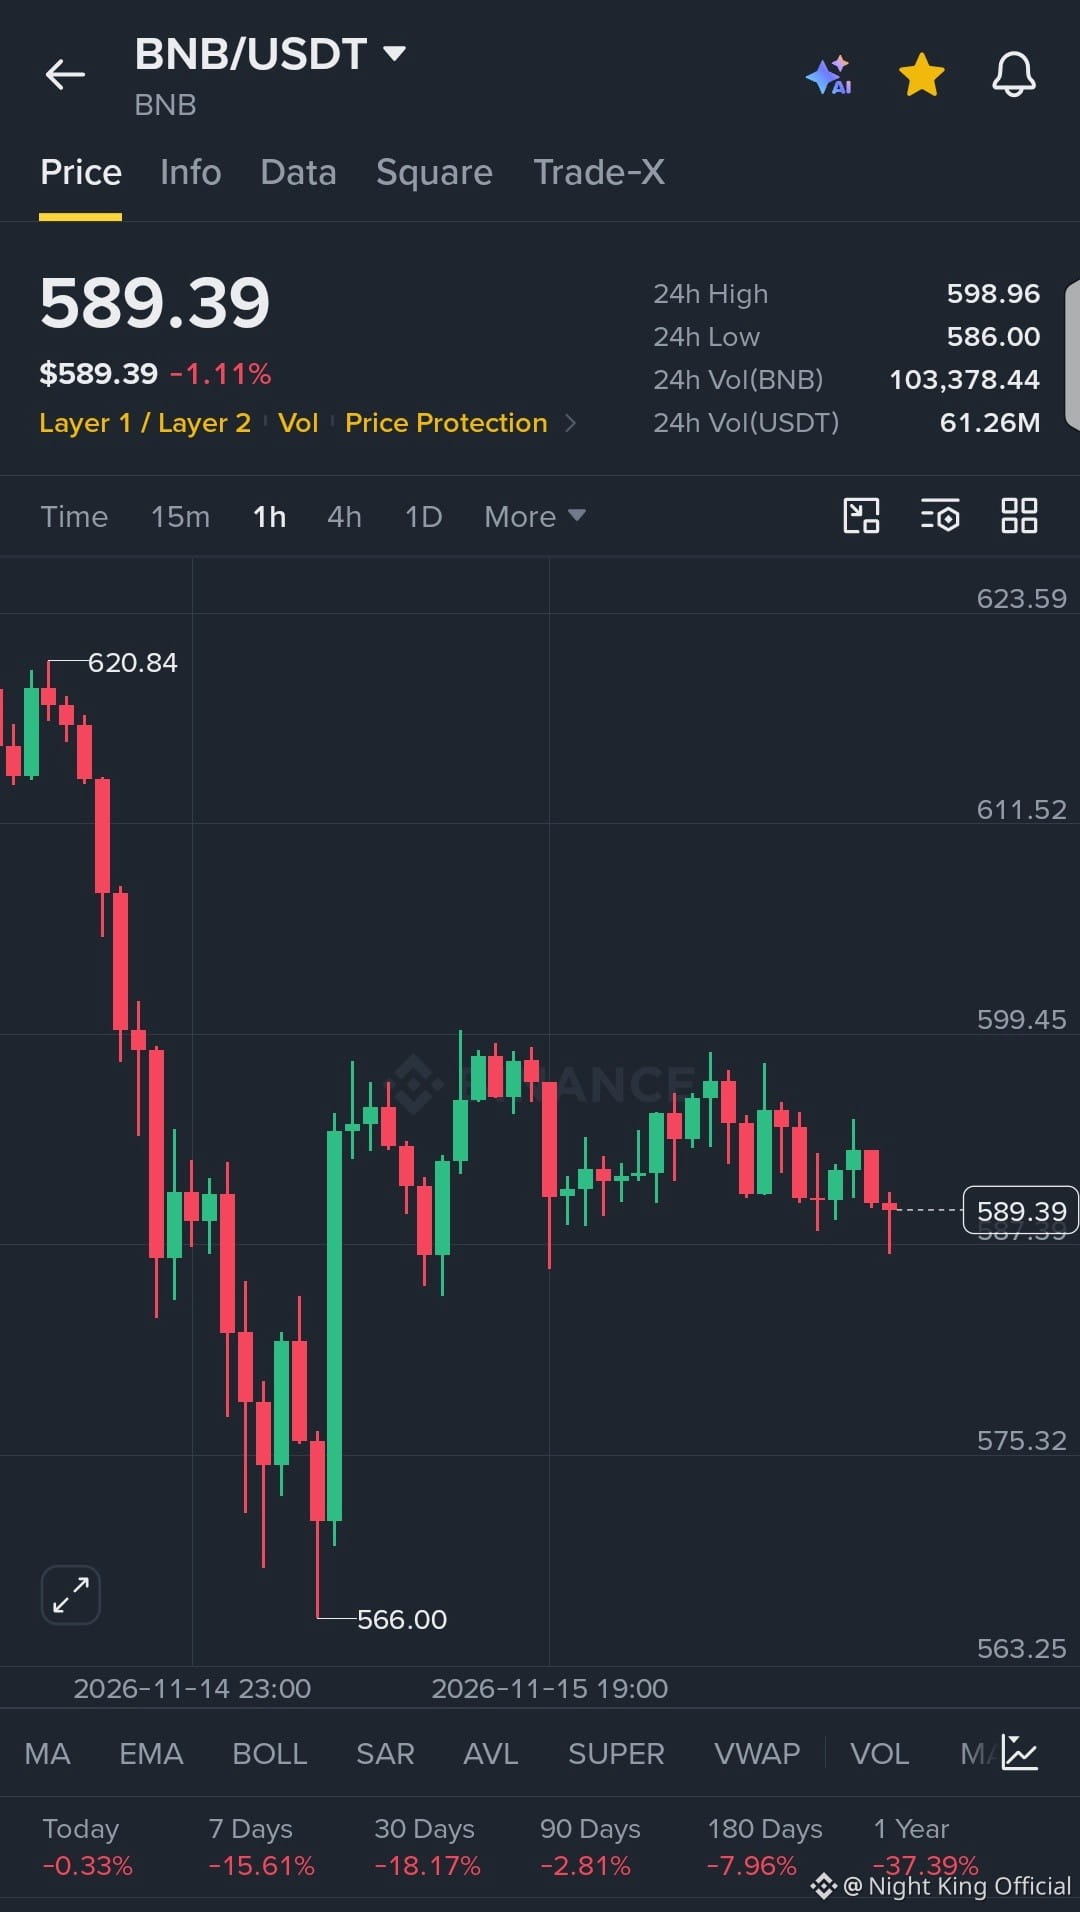
🧭 $BNB Stuck Below 599.45
Action: SHORT
Entry Range: 589.39 – 598.96
TP1: 586.00
TP2: 575.32
TP3: 566.00
SL: 4H close above 599.45
Read: On the 1H chart, price is moving sideways between 586.00 and 598.96 after the drop from the 620.84 swing high, so a break of the 24h Low is needed before the downside targets come into play.
Does 586.00 give way, or does BNB reclaim 599.45?
Not financial advice. DYOR.
#BNB #BNBChain #CryptoTrading #BinanceSquare #TradeIdeas
{spot}(BNBUSDT)
🧭 $BNB Stuck Below 599.45
Action: SHORT
Entry Range: 589.39 – 598.96
TP1: 586.00
TP2: 575.32
TP3: 566.00
SL: 4H close above 599.45
Read: On the 1H chart, price is moving sideways between 586.00 and 598.96 after the drop from the 620.84 swing high, so a break of the 24h Low is needed before the downside targets come into play.
Does 586.00 give way, or does BNB reclaim 599.45?
Not financial advice. DYOR.
#BNB #BNBChain #CryptoTrading #BinanceSquare #TradeIdeas
Action: SHORT
Entry Range: 589.39 – 598.96
TP1: 586.00
TP2: 575.32
TP3: 566.00
SL: 4H close above 599.45
Read: On the 1H chart, price is moving sideways between 586.00 and 598.96 after the drop from the 620.84 swing high, so a break of the 24h Low is needed before the downside targets come into play.
Does 586.00 give way, or does BNB reclaim 599.45?
Not financial advice. DYOR.
#BNB #BNBChain #CryptoTrading #BinanceSquare #TradeIdeas
1
1
203
·
--
Bullish
Is this a real recovery, or just a pause before the next leg lower?
That's what I'm asking while watching $ETH, $SOL and $XRP on the 1H charts. All three trade well above their 24h Lows but still sit far below their swing highs.
$ETH is near 1,827.30, with 1,880.68 overhead and 1,711.08 as the low to protect. $SOL is around 72.61, with 73.25 as the nearby level and 67.41 as the floor. XRP is near 0.9652, facing 0.9849, with 0.8930 below.
I'm not rushing into any of them. Small candles near these levels show buyers are still being tested, so I'd rather wait for a clean break than guess. Managing risk matters more than catching every move.
Which chart looks most convincing to you: $ETH, $SOL or $XRP?
Not financial advice. DYOR.
#ETH #SOL #XRP #CryptoMarket #BinanceSquare
Is this a real recovery, or just a pause before the next leg lower?
That's what I'm asking while watching $ETH , $SOL and $XRP on the 1H charts. All three trade well above their 24h Lows but still sit far below their swing highs.
$ETH is near 1,827.30, with 1,880.68 overhead and 1,711.08 as the low to protect. $SOL is around 72.61, with 73.25 as the nearby level and 67.41 as the floor. XRP is near 0.9652, facing 0.9849, with 0.8930 below.
I'm not rushing into any of them. Small candles near these levels show buyers are still being tested, so I'd rather wait for a clean break than guess. Managing risk matters more than catching every move.
Which chart looks most convincing to you: $ETH , $SOL or $XRP ?
Not financial advice. DYOR.
#ETH #SOL #XRP #CryptoMarket #BinanceSquare
That's what I'm asking while watching $ETH , $SOL and $XRP on the 1H charts. All three trade well above their 24h Lows but still sit far below their swing highs.
$ETH is near 1,827.30, with 1,880.68 overhead and 1,711.08 as the low to protect. $SOL is around 72.61, with 73.25 as the nearby level and 67.41 as the floor. XRP is near 0.9652, facing 0.9849, with 0.8930 below.
I'm not rushing into any of them. Small candles near these levels show buyers are still being tested, so I'd rather wait for a clean break than guess. Managing risk matters more than catching every move.
Which chart looks most convincing to you: $ETH , $SOL or $XRP ?
Not financial advice. DYOR.
#ETH #SOL #XRP #CryptoMarket #BinanceSquare
ETH
29%
SOL
29%
XRP
42%
82 votes • Voting closed
2
4
1.7k
·
--
Bullish
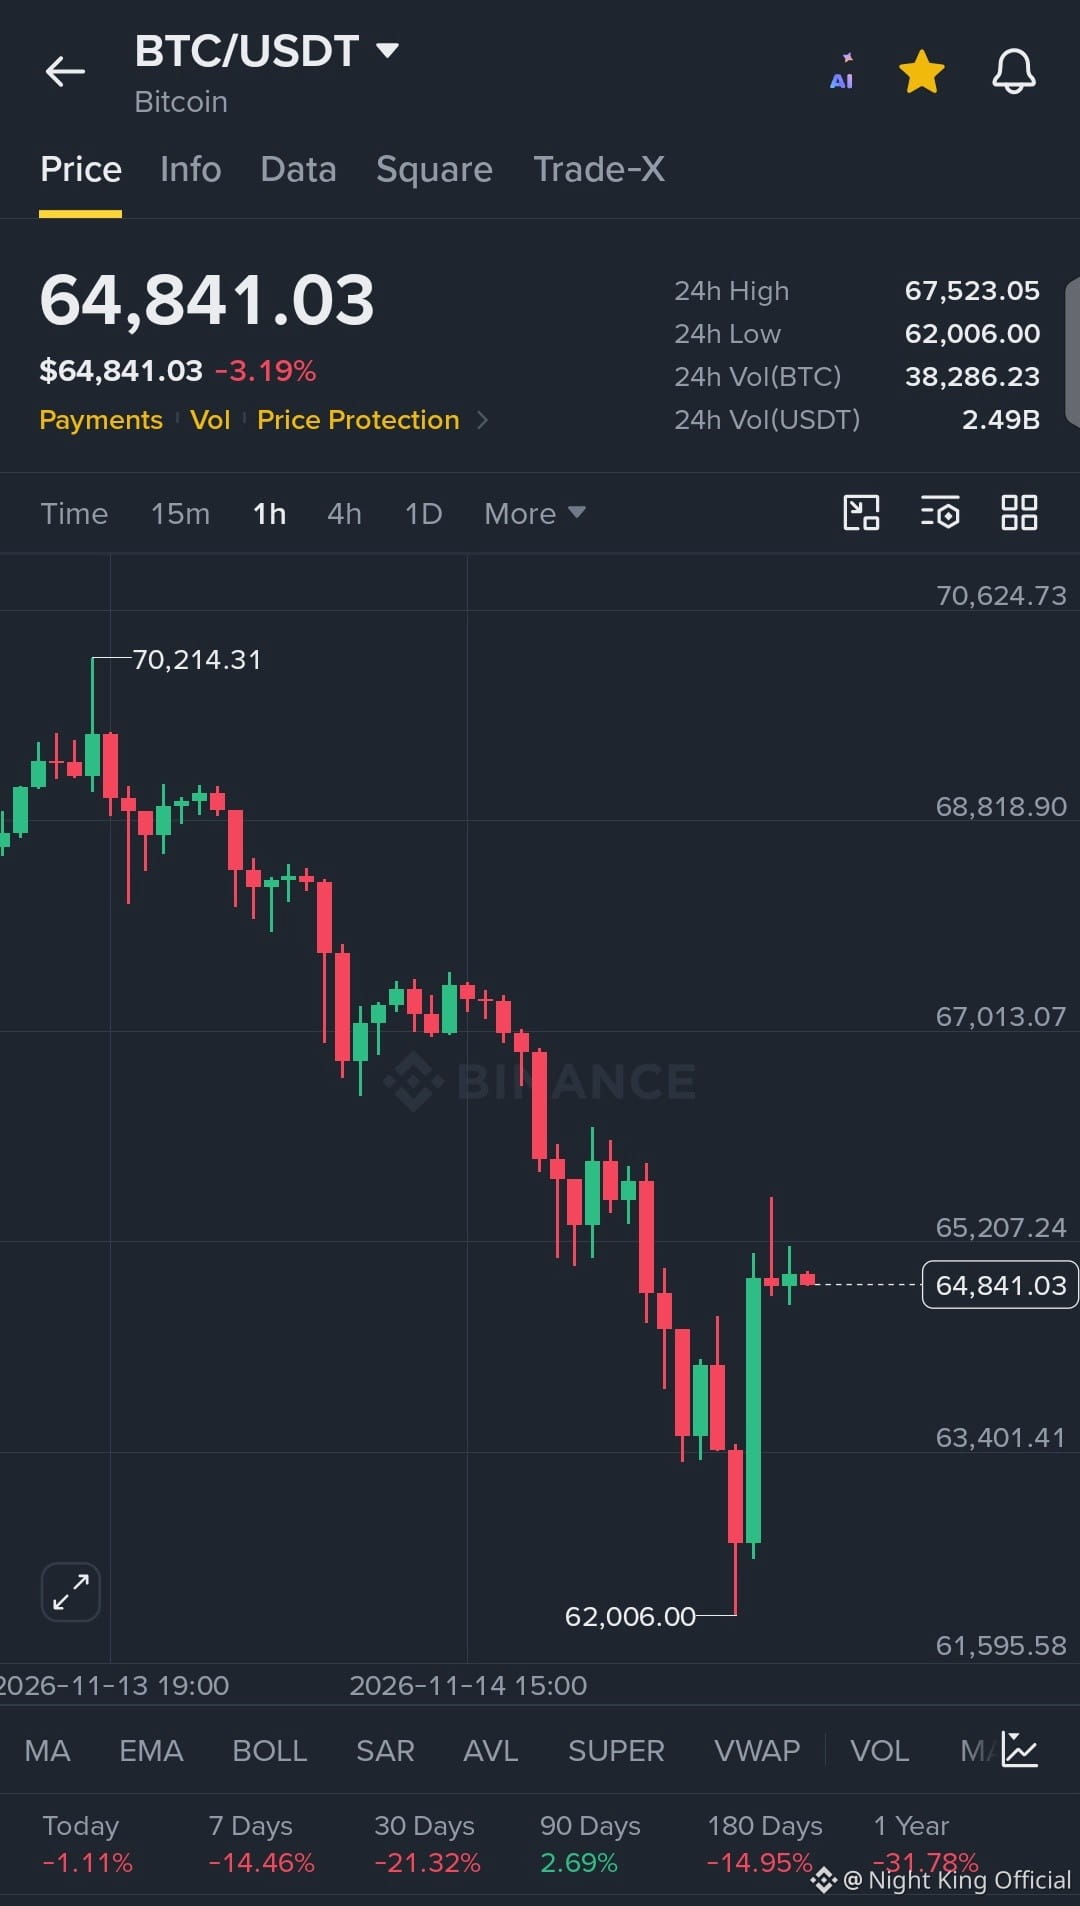
⚡ $BTC Snaps Back From the 62,006.00 Low
Bias: LONG
Entry Range: 63,401.41 – 64,841.03
TP1: 65,207.24
TP2: 67,013.07
TP3: 68,818.90
SL: 62,006.00
Why: A large green 1H candle rebounded from the 62,006.00 24h Low, but price is still well below the 70,214.31 swing high, so the recovery needs follow-through.
Where does BTC go next: 65,207.24 first, or a retest of the low?
Not financial advice. DYOR.
#BTC #CryptoSignals #BinanceSquare #WriteToEarn
{spot}(BTCUSDT)
⚡ $BTC Snaps Back From the 62,006.00 Low
Bias: LONG
Entry Range: 63,401.41 – 64,841.03
TP1: 65,207.24
TP2: 67,013.07
TP3: 68,818.90
SL: 62,006.00
Why: A large green 1H candle rebounded from the 62,006.00 24h Low, but price is still well below the 70,214.31 swing high, so the recovery needs follow-through.
Where does BTC go next: 65,207.24 first, or a retest of the low?
Not financial advice. DYOR.
#BTC #CryptoSignals #BinanceSquare #WriteToEarn
Bias: LONG
Entry Range: 63,401.41 – 64,841.03
TP1: 65,207.24
TP2: 67,013.07
TP3: 68,818.90
SL: 62,006.00
Why: A large green 1H candle rebounded from the 62,006.00 24h Low, but price is still well below the 70,214.31 swing high, so the recovery needs follow-through.
Where does BTC go next: 65,207.24 first, or a retest of the low?
Not financial advice. DYOR.
#BTC #CryptoSignals #BinanceSquare #WriteToEarn
1
1
294
·
--
Bullish
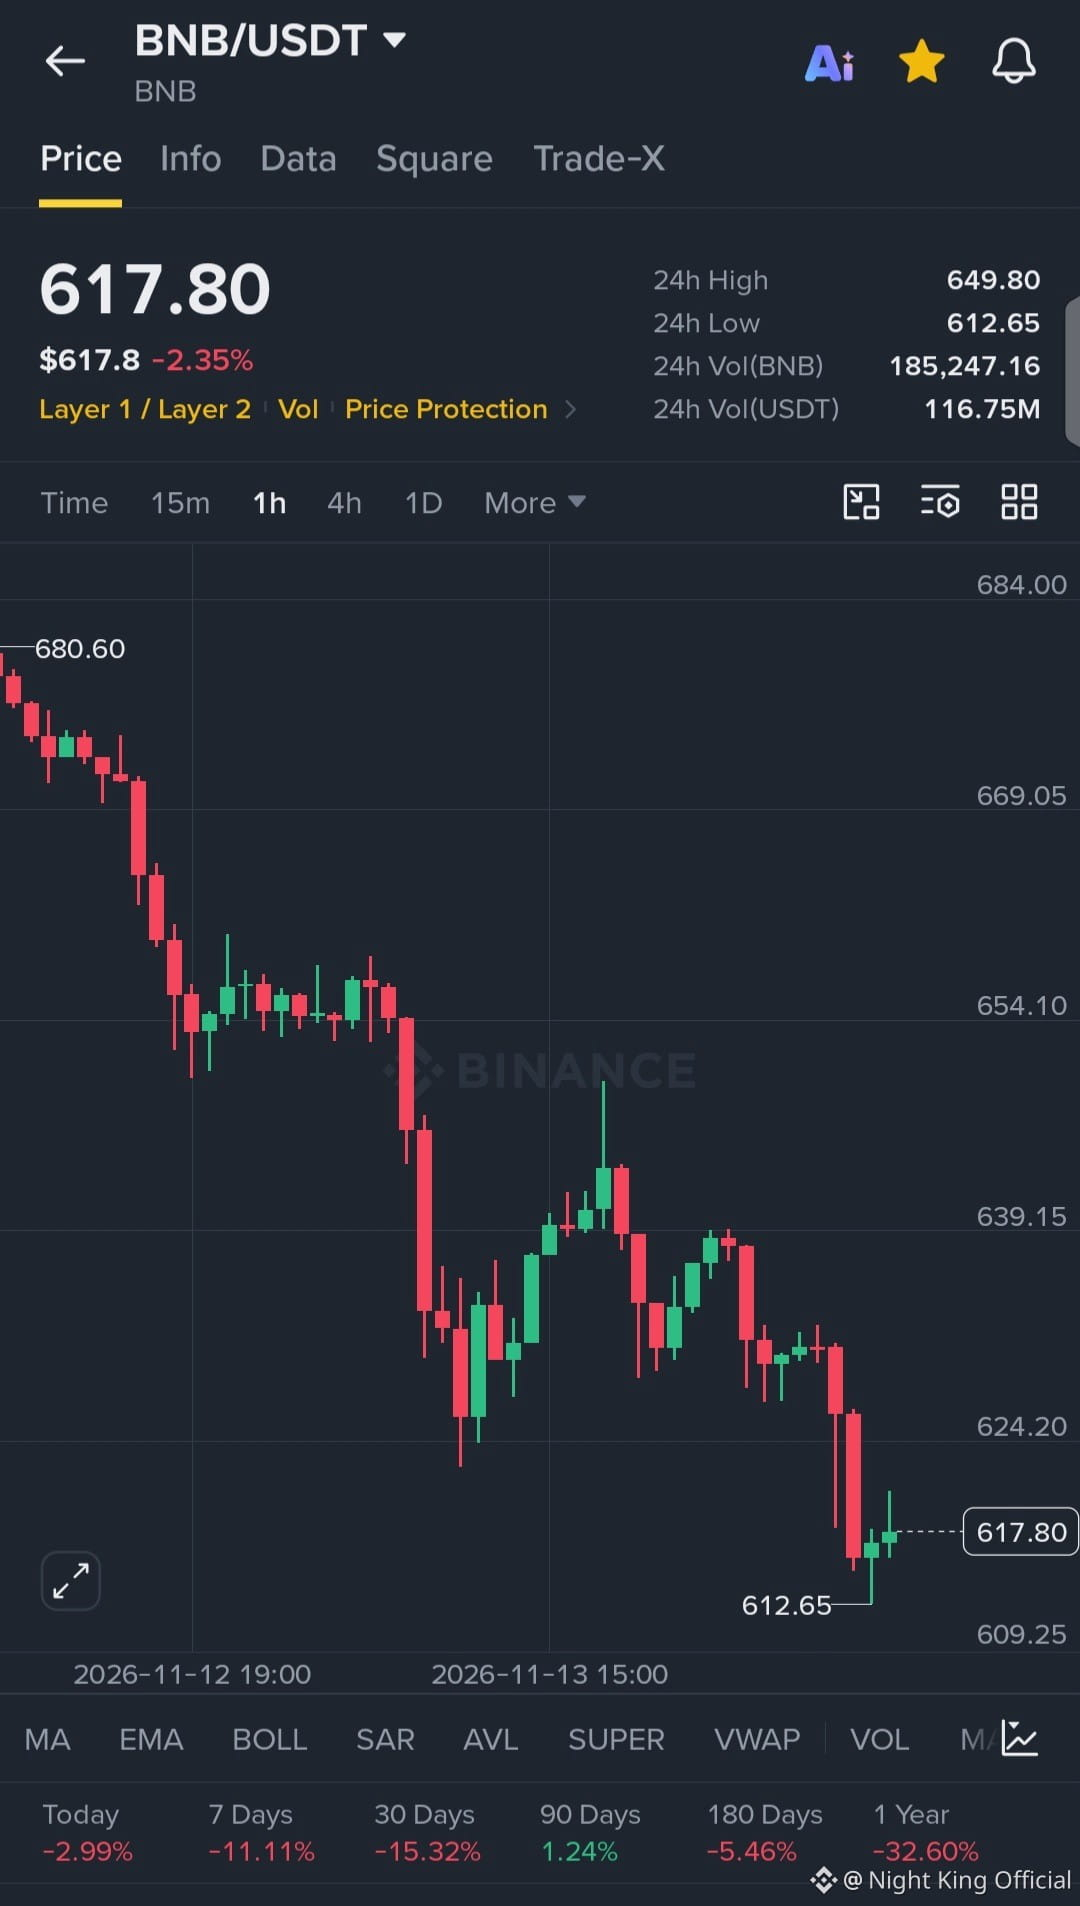
$BNB Tests the 612.65 Low
Direction: LONG
Entry Range: 617.80 – 624.20
TP1: 639.15
TP2: 649.80
TP3: 654.10
SL: 612.65
Read: The 1H chart shows a sequence of lower highs since the 680.60 swing high, and the latest candle is a small bounce off the 612.65 24h Low that has not confirmed a reversal.
Is 612.65 the floor for this move, or does it break?
Not financial advice. DYOR.
#BNB #BNBChain #CryptoSignals #TradeSetup #BinanceSquare
{spot}(BNBUSDT)
$BNB Tests the 612.65 Low
Direction: LONG
Entry Range: 617.80 – 624.20
TP1: 639.15
TP2: 649.80
TP3: 654.10
SL: 612.65
Read: The 1H chart shows a sequence of lower highs since the 680.60 swing high, and the latest candle is a small bounce off the 612.65 24h Low that has not confirmed a reversal.
Is 612.65 the floor for this move, or does it break?
Not financial advice. DYOR.
#BNB #BNBChain #CryptoSignals #TradeSetup #BinanceSquare
Direction: LONG
Entry Range: 617.80 – 624.20
TP1: 639.15
TP2: 649.80
TP3: 654.10
SL: 612.65
Read: The 1H chart shows a sequence of lower highs since the 680.60 swing high, and the latest candle is a small bounce off the 612.65 24h Low that has not confirmed a reversal.
Is 612.65 the floor for this move, or does it break?
Not financial advice. DYOR.
#BNB #BNBChain #CryptoSignals #TradeSetup #BinanceSquare
1
2
255
·
--
Bullish
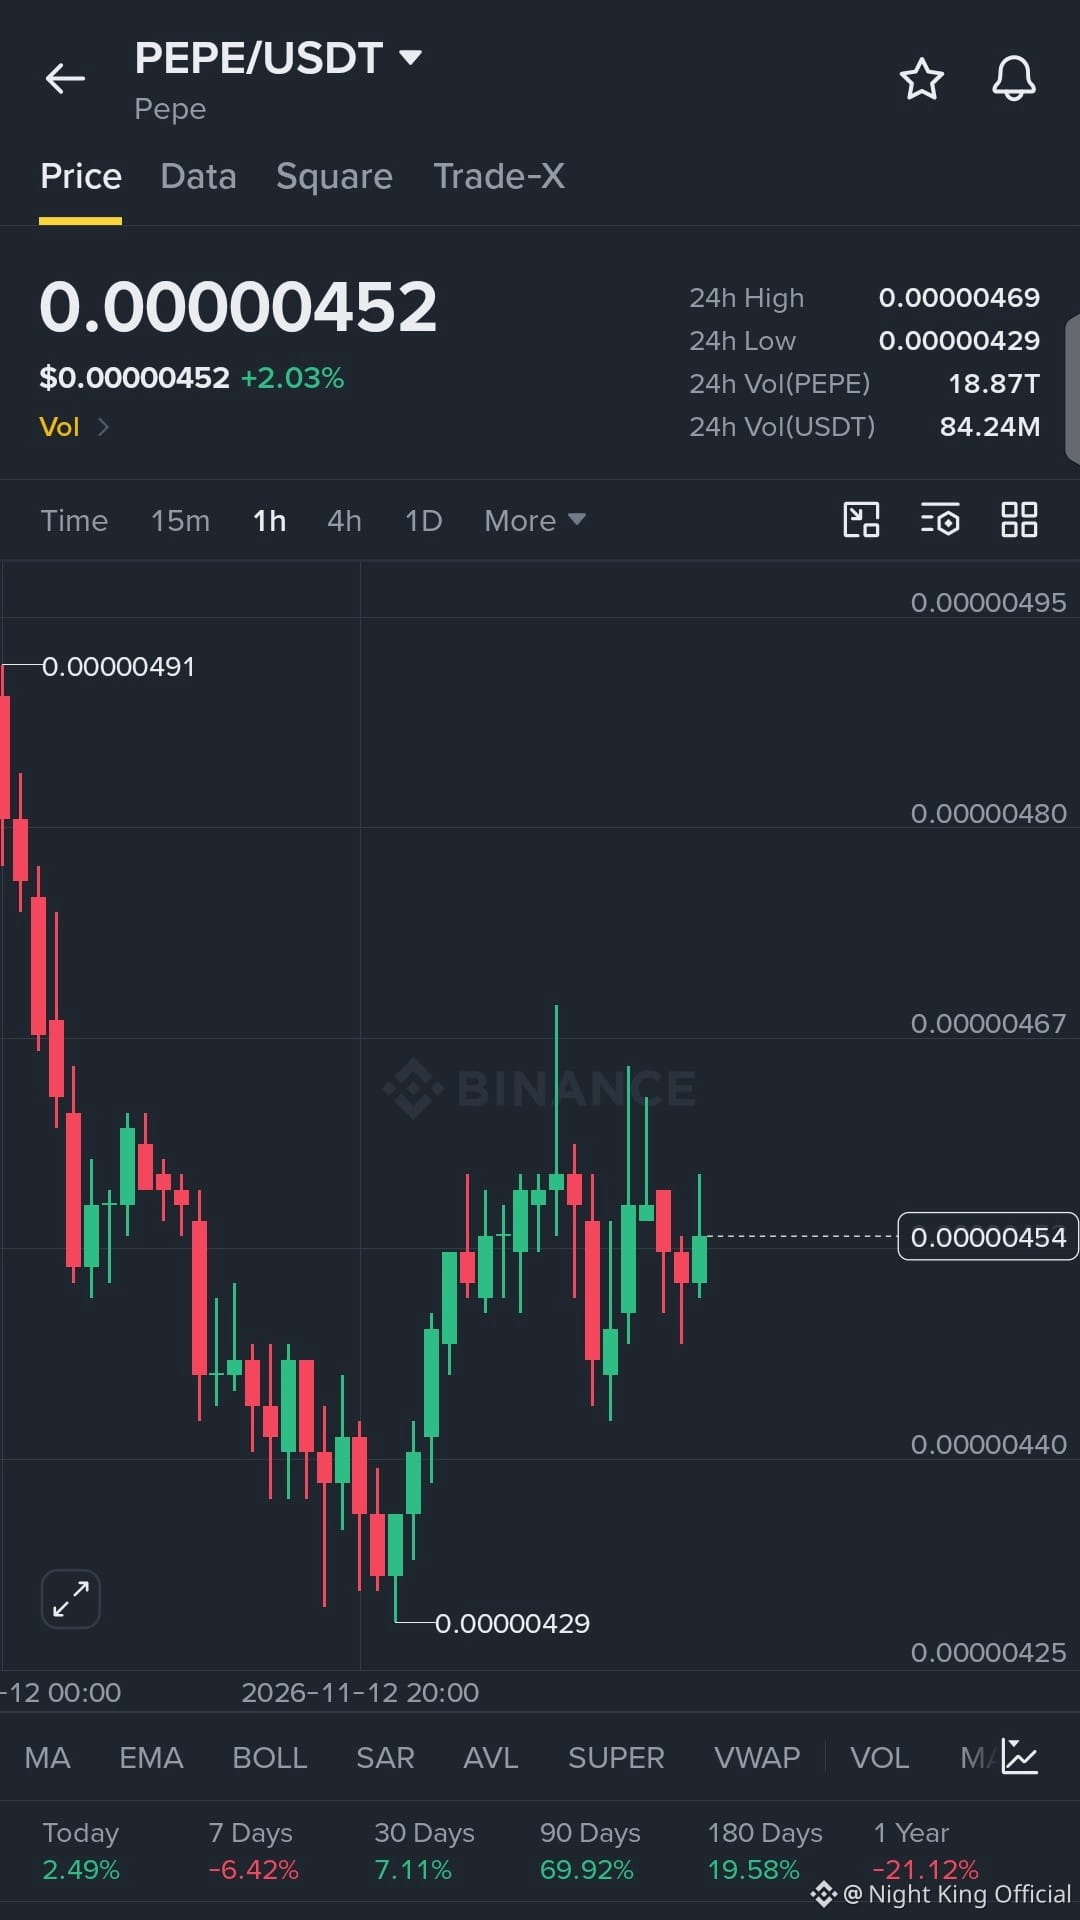
🐸 $PEPE Holding Above the 24h Low
Action: LONG
Entry Range: 0.00000440 – 0.00000454
TP1: 0.00000467
TP2: 0.00000480
TP3: 0.00000491
SL: 0.00000429
Analysis: On the 1H chart, price bounced from the 0.00000429 24h Low and is moving sideways below the 0.00000467 level, so a clean move above it is still needed.
Will PEPE break above 0.00000467 or fall back to the 24h Low?
Not financial advice. DYOR.
#PEPE #Memecoin #CryptoTrading #Binance #WriteToEarn
{spot}(PEPEUSDT)
🐸 $PEPE Holding Above the 24h Low
Action: LONG
Entry Range: 0.00000440 – 0.00000454
TP1: 0.00000467
TP2: 0.00000480
TP3: 0.00000491
SL: 0.00000429
Analysis: On the 1H chart, price bounced from the 0.00000429 24h Low and is moving sideways below the 0.00000467 level, so a clean move above it is still needed.
Will PEPE break above 0.00000467 or fall back to the 24h Low?
Not financial advice. DYOR.
#PEPE #Memecoin #CryptoTrading #Binance #WriteToEarn
Action: LONG
Entry Range: 0.00000440 – 0.00000454
TP1: 0.00000467
TP2: 0.00000480
TP3: 0.00000491
SL: 0.00000429
Analysis: On the 1H chart, price bounced from the 0.00000429 24h Low and is moving sideways below the 0.00000467 level, so a clean move above it is still needed.
Will PEPE break above 0.00000467 or fall back to the 24h Low?
Not financial advice. DYOR.
#PEPE #Memecoin #CryptoTrading #Binance #WriteToEarn
2
423
·
--
Bullish
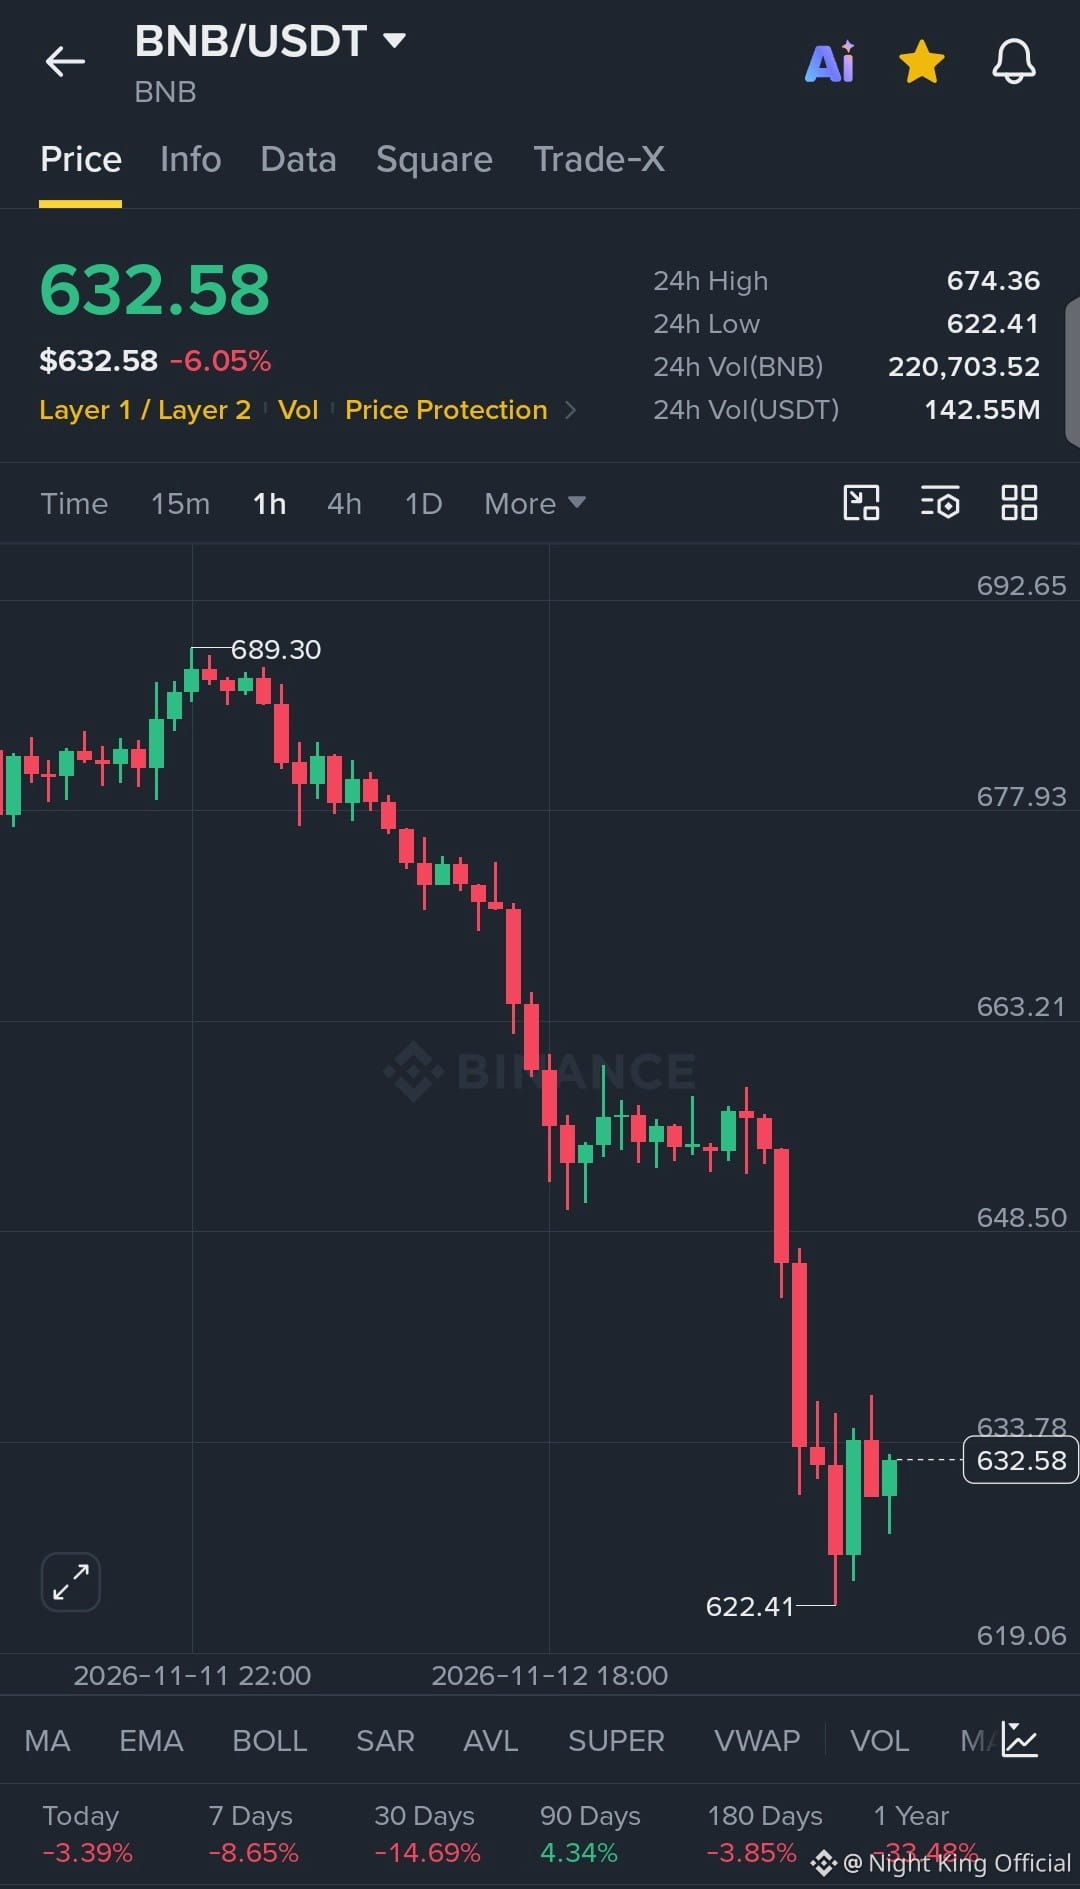
$BNB Bounce Setup Near the 24h Low 📈
Action: Long (counter-trend bounce)
Entry Range: 632.58 – 633.78
TP1: 648.50
TP2: 663.21
TP3: 677.93
SL: 622.41 (24h Low)
Technical view: After a sharp 1H slide from the 689.30 swing high, price printed a 622.41 low and is trying to hold above it. The broader trend is still down, so any bounce stays unconfirmed until price clears 648.50.
Question: Does 622.41 hold as support, or does price retest lower first?
Not financial advice. DYOR.
#BNB #Binance #CryptoSignals #Trading #WriteToEarn
{spot}(BNBUSDT)
$BNB Bounce Setup Near the 24h Low 📈
Action: Long (counter-trend bounce)
Entry Range: 632.58 – 633.78
TP1: 648.50
TP2: 663.21
TP3: 677.93
SL: 622.41 (24h Low)
Technical view: After a sharp 1H slide from the 689.30 swing high, price printed a 622.41 low and is trying to hold above it. The broader trend is still down, so any bounce stays unconfirmed until price clears 648.50.
Question: Does 622.41 hold as support, or does price retest lower first?
Not financial advice. DYOR.
#BNB #Binance #CryptoSignals #Trading #WriteToEarn
Action: Long (counter-trend bounce)
Entry Range: 632.58 – 633.78
TP1: 648.50
TP2: 663.21
TP3: 677.93
SL: 622.41 (24h Low)
Technical view: After a sharp 1H slide from the 689.30 swing high, price printed a 622.41 low and is trying to hold above it. The broader trend is still down, so any bounce stays unconfirmed until price clears 648.50.
Question: Does 622.41 hold as support, or does price retest lower first?
Not financial advice. DYOR.
#BNB #Binance #CryptoSignals #Trading #WriteToEarn
2
314
·
--
Bullish
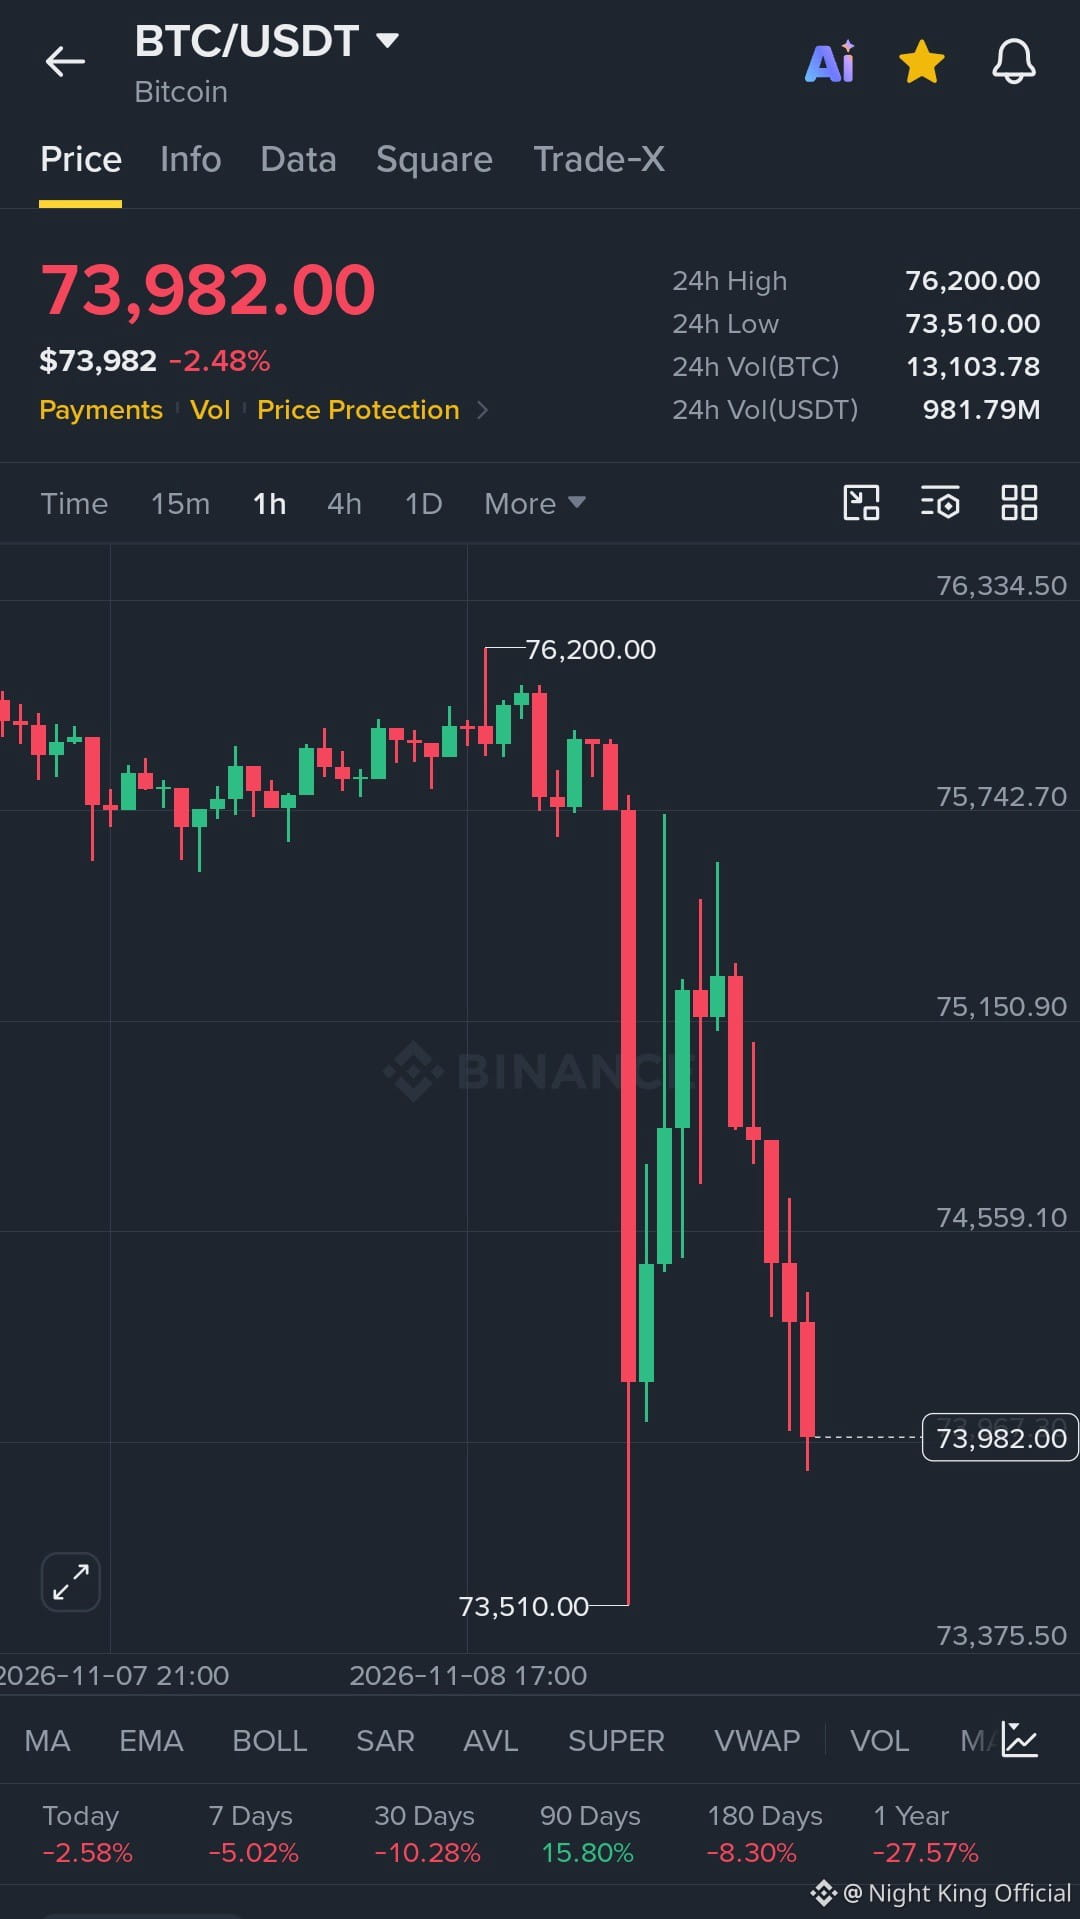
$BTC Keeps Sliding Toward the 73,510.00 24h Low on the 1H Chart 📉
Bias: Short
Entry Range: 73,982.00 – 74,559.10
TP1: 73,510.00
TP2: 73,375.50
TP3: 73,375.50 (24h Low zone retest)
SL: 75,150.90
Technical analysis: After the 76,200.00 swing high, $BTC dropped hard on a big red 1H candle, bounced briefly, and the latest 1H candles are red again at 73,982.00, with no clear sign of buyers yet.
Is 73,510.00 about to be retested, or will buyers defend it again? Drop your view below.
Not financial advice. DYOR.
#BTC #CryptoSignals #ShortSetup #WriteToEarn
{spot}(BTCUSDT)
$BTC Keeps Sliding Toward the 73,510.00 24h Low on the 1H Chart 📉
Bias: Short
Entry Range: 73,982.00 – 74,559.10
TP1: 73,510.00
TP2: 73,375.50
TP3: 73,375.50 (24h Low zone retest)
SL: 75,150.90
Technical analysis: After the 76,200.00 swing high, $BTC dropped hard on a big red 1H candle, bounced briefly, and the latest 1H candles are red again at 73,982.00, with no clear sign of buyers yet.
Is 73,510.00 about to be retested, or will buyers defend it again? Drop your view below.
Not financial advice. DYOR.
#BTC #CryptoSignals #ShortSetup #WriteToEarn
Bias: Short
Entry Range: 73,982.00 – 74,559.10
TP1: 73,510.00
TP2: 73,375.50
TP3: 73,375.50 (24h Low zone retest)
SL: 75,150.90
Technical analysis: After the 76,200.00 swing high, $BTC dropped hard on a big red 1H candle, bounced briefly, and the latest 1H candles are red again at 73,982.00, with no clear sign of buyers yet.
Is 73,510.00 about to be retested, or will buyers defend it again? Drop your view below.
Not financial advice. DYOR.
#BTC #CryptoSignals #ShortSetup #WriteToEarn
2
329
·
--
Bullish
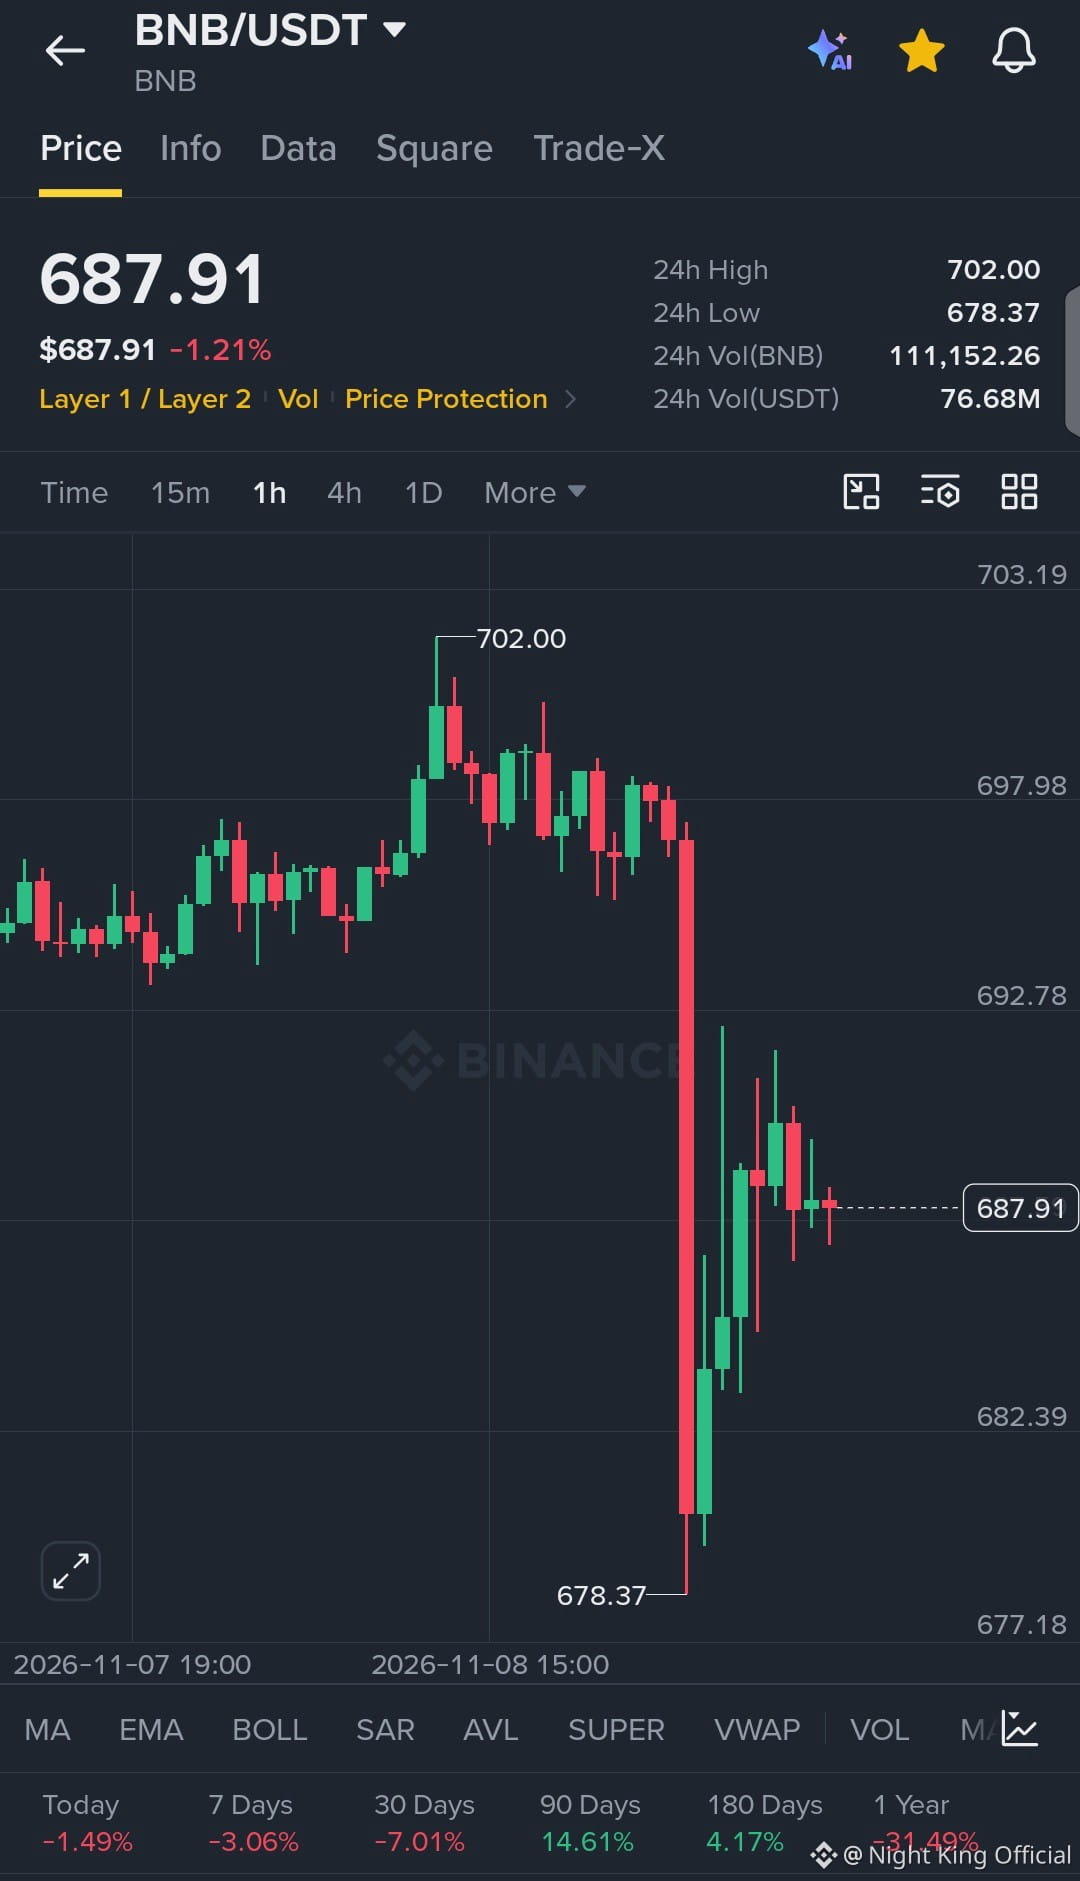
$BNB Holds Above the 678.37 24h Low After a Sudden 1H Flush 🧩
Plan: Long
Entry Range: 682.39 – 687.91
TP1: 692.78
TP2: 697.98
TP3: 702.00
SL: 1H close below 678.37
Direct take: After the sharp red 1H candle from the 702.00 swing high, $BNB wicked down to 678.37 and has been stabilizing in small 1H candles near 687.91, but it is still below 692.78 and needs a stronger close to confirm.
Is this the spot where buyers step back in, or will 678.37 get tested again first? Tell me your plan.
Not financial advice. DYOR.
#BNB #Binance #CryptoSignals #TradePlan #WriteToEarn
{spot}(BNBUSDT)
$BNB Holds Above the 678.37 24h Low After a Sudden 1H Flush 🧩
Plan: Long
Entry Range: 682.39 – 687.91
TP1: 692.78
TP2: 697.98
TP3: 702.00
SL: 1H close below 678.37
Direct take: After the sharp red 1H candle from the 702.00 swing high, $BNB wicked down to 678.37 and has been stabilizing in small 1H candles near 687.91, but it is still below 692.78 and needs a stronger close to confirm.
Is this the spot where buyers step back in, or will 678.37 get tested again first? Tell me your plan.
Not financial advice. DYOR.
#BNB #Binance #CryptoSignals #TradePlan #WriteToEarn
Plan: Long
Entry Range: 682.39 – 687.91
TP1: 692.78
TP2: 697.98
TP3: 702.00
SL: 1H close below 678.37
Direct take: After the sharp red 1H candle from the 702.00 swing high, $BNB wicked down to 678.37 and has been stabilizing in small 1H candles near 687.91, but it is still below 692.78 and needs a stronger close to confirm.
Is this the spot where buyers step back in, or will 678.37 get tested again first? Tell me your plan.
Not financial advice. DYOR.
#BNB #Binance #CryptoSignals #TradePlan #WriteToEarn
1
2
273
·
--
Bullish
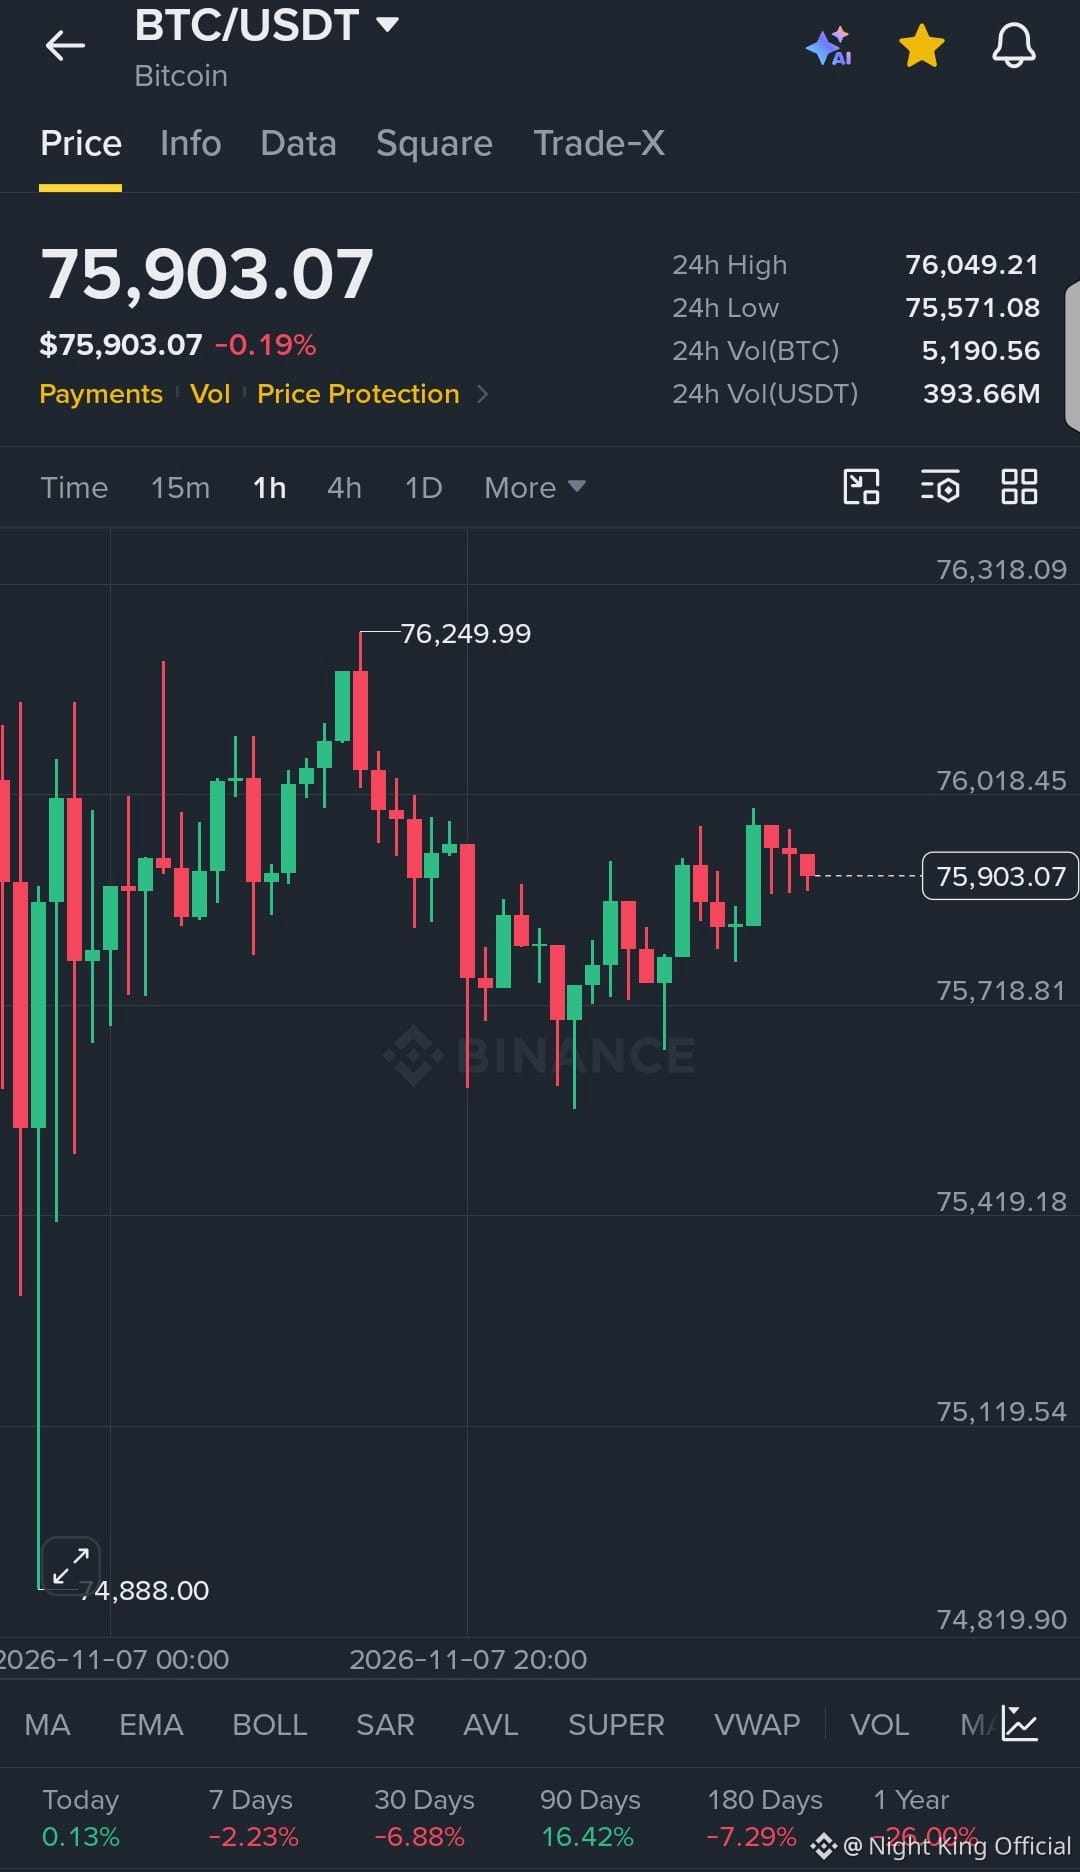
$BTC Slips Back From the 76,249.99 Swing High on the 1H Chart
Call: Short
Entry Range: 75,903.07 – 76,018.45
TP1: 75,718.81
TP2: 75,571.08
TP3: 75,419.18
SL: 76,249.99
Chart note: $BTC peaked at 76,249.99, then printed lower 1H highs, and the latest candles are small and red just under the 24h High at 76,049.21. The 24h Low at 75,571.08 sits below as the nearest test.
Will sellers keep $BTC under 76,049.21, or does one strong 1H candle flip this setup? Tell me your read.
Not financial advice. DYOR.
#BTC #CryptoSignals #ShortSetup #WriteToEarn
{spot}(BTCUSDT)
$BTC Slips Back From the 76,249.99 Swing High on the 1H Chart
Call: Short
Entry Range: 75,903.07 – 76,018.45
TP1: 75,718.81
TP2: 75,571.08
TP3: 75,419.18
SL: 76,249.99
Chart note: $BTC peaked at 76,249.99, then printed lower 1H highs, and the latest candles are small and red just under the 24h High at 76,049.21. The 24h Low at 75,571.08 sits below as the nearest test.
Will sellers keep $BTC under 76,049.21, or does one strong 1H candle flip this setup? Tell me your read.
Not financial advice. DYOR.
#BTC #CryptoSignals #ShortSetup #WriteToEarn
Call: Short
Entry Range: 75,903.07 – 76,018.45
TP1: 75,718.81
TP2: 75,571.08
TP3: 75,419.18
SL: 76,249.99
Chart note: $BTC peaked at 76,249.99, then printed lower 1H highs, and the latest candles are small and red just under the 24h High at 76,049.21. The 24h Low at 75,571.08 sits below as the nearest test.
Will sellers keep $BTC under 76,049.21, or does one strong 1H candle flip this setup? Tell me your read.
Not financial advice. DYOR.
#BTC #CryptoSignals #ShortSetup #WriteToEarn
2
323
·
--
Bullish
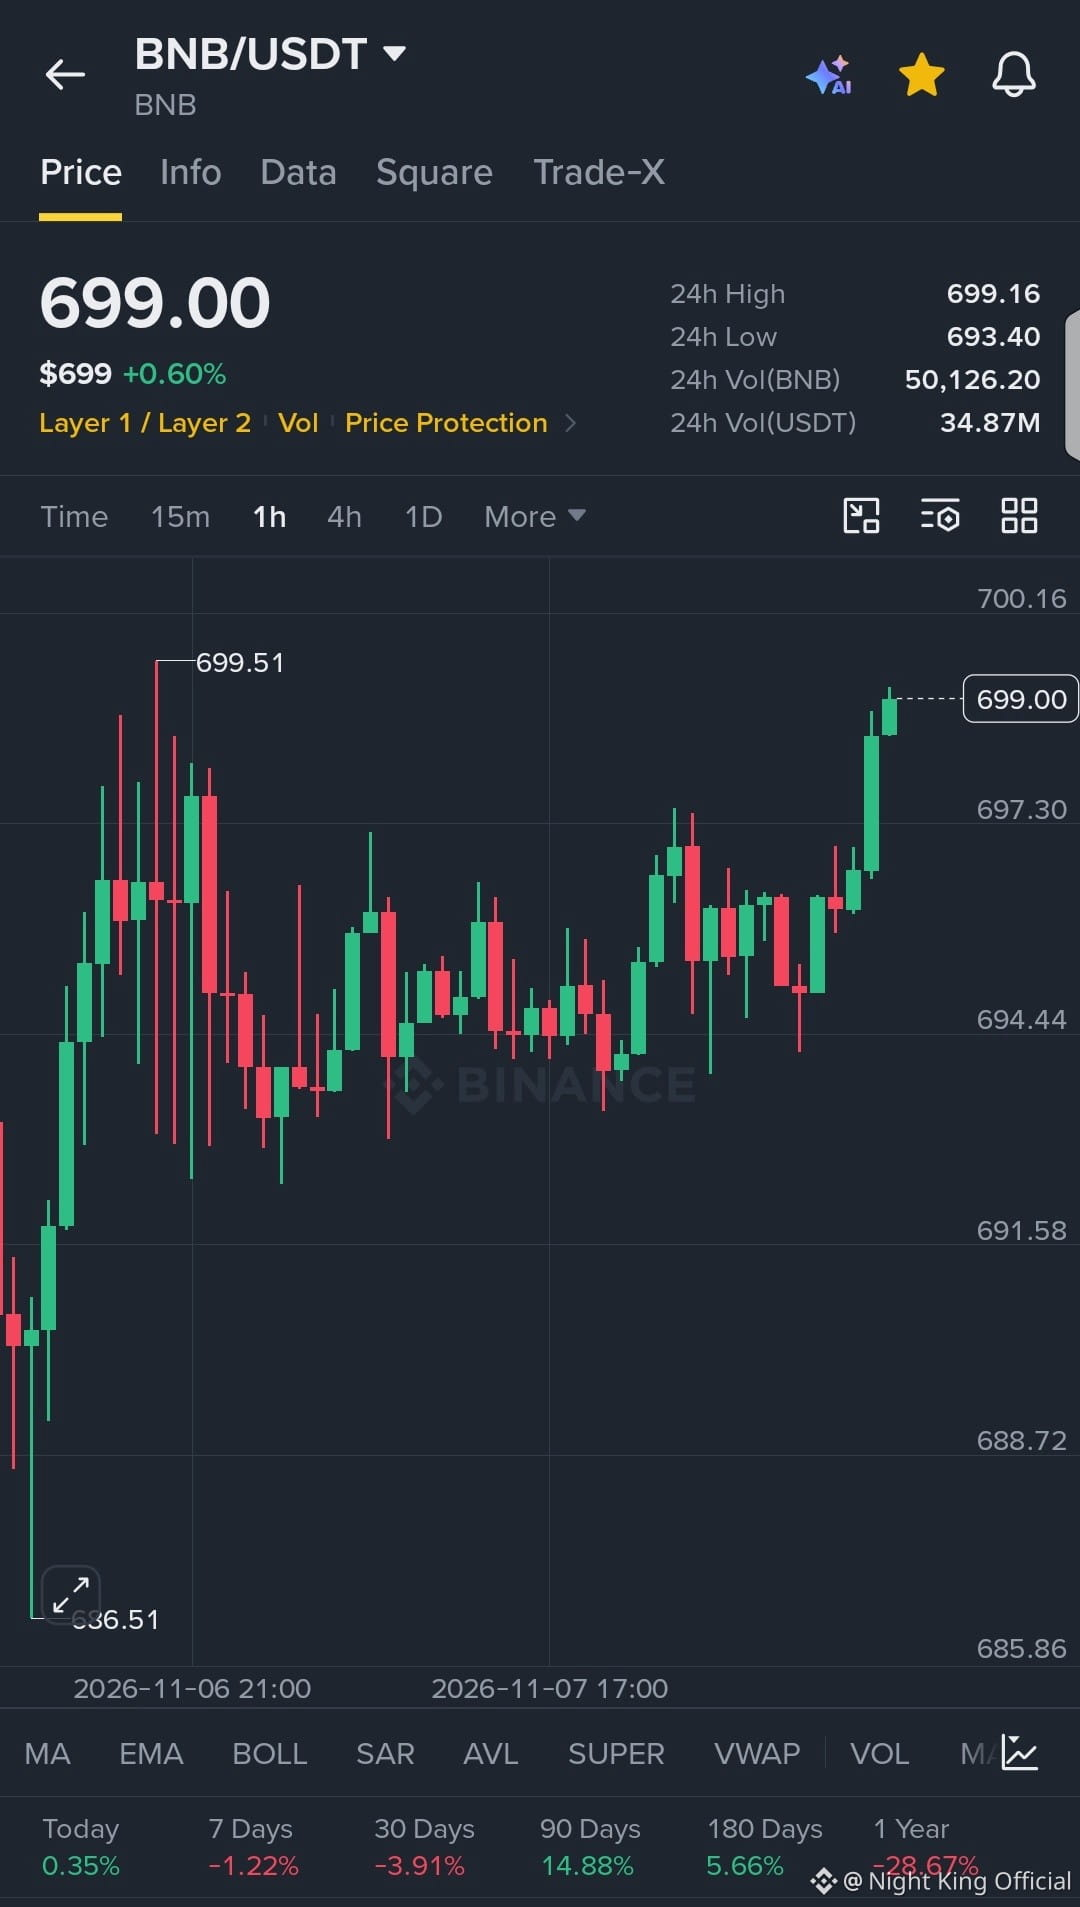
$BNB Pushes Up Into the 699.16 24h High on Strong 1H Candles 🚀
Bias: Long
Entry Range: 697.30 – 699.00
TP1: 699.16
TP2: 699.51
TP3: 700.16
SL: 1H close below 694.44
Momentum view: The last few 1H candles on $BNB are green and climbing, and price is now pressing right under the 699.51 swing high, but the range above is tight and a rejection there is possible.
Can $BNB close a 1H candle above 699.51, or does it get turned back again? Tell me what you think.
Not financial advice. DYOR.
#BNB #Binance #CryptoMomentum #1HChart #WriteToEarn
{spot}(BNBUSDT)
$BNB Pushes Up Into the 699.16 24h High on Strong 1H Candles 🚀
Bias: Long
Entry Range: 697.30 – 699.00
TP1: 699.16
TP2: 699.51
TP3: 700.16
SL: 1H close below 694.44
Momentum view: The last few 1H candles on $BNB are green and climbing, and price is now pressing right under the 699.51 swing high, but the range above is tight and a rejection there is possible.
Can $BNB close a 1H candle above 699.51, or does it get turned back again? Tell me what you think.
Not financial advice. DYOR.
#BNB #Binance #CryptoMomentum #1HChart #WriteToEarn
Bias: Long
Entry Range: 697.30 – 699.00
TP1: 699.16
TP2: 699.51
TP3: 700.16
SL: 1H close below 694.44
Momentum view: The last few 1H candles on $BNB are green and climbing, and price is now pressing right under the 699.51 swing high, but the range above is tight and a rejection there is possible.
Can $BNB close a 1H candle above 699.51, or does it get turned back again? Tell me what you think.
Not financial advice. DYOR.
#BNB #Binance #CryptoMomentum #1HChart #WriteToEarn
1
2
372
·
--
Bullish
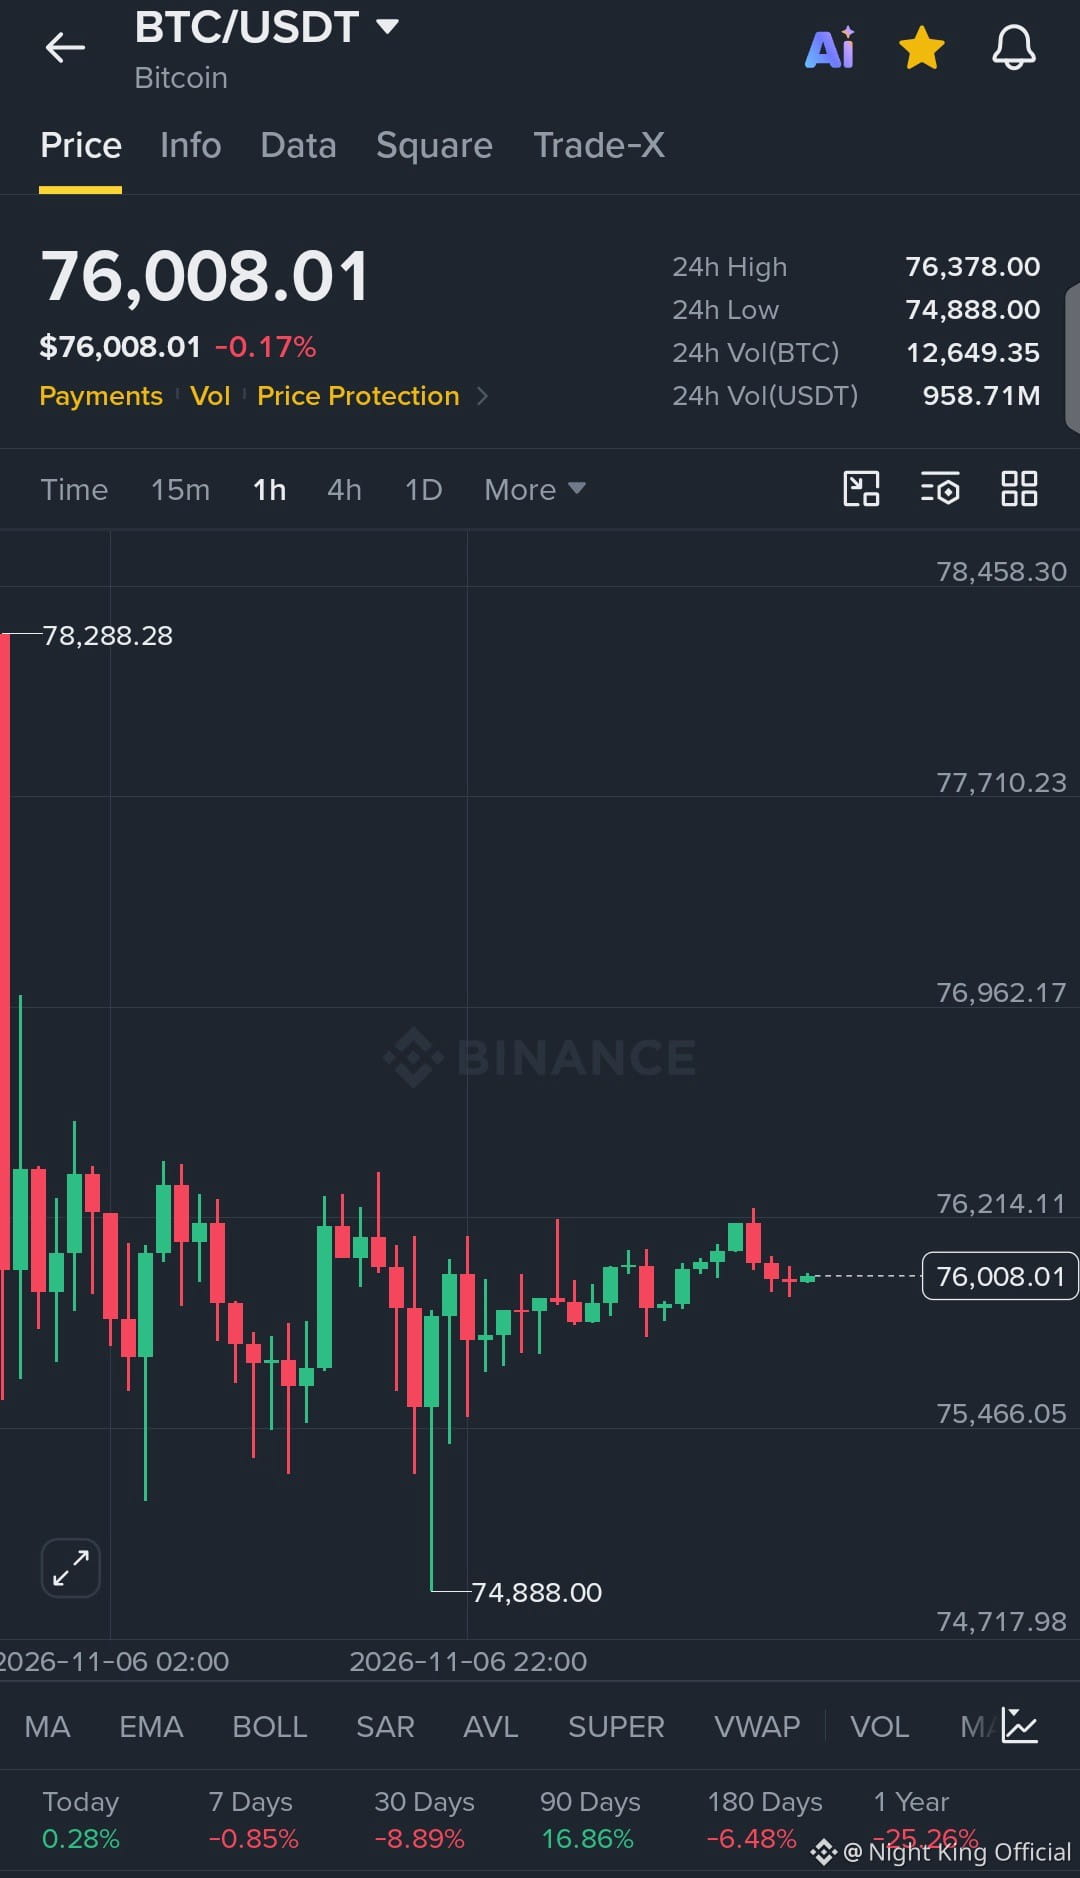
$BTC Coils Between 74,888.00 and 76,378.00 on the 1H Chart 🎯
Action: Short
Entry Range: 76,008.01 – 76,214.11
TP1: 75,466.05
TP2: 74,888.00
TP3: 74,717.98
SL: 1H close above 76,378.00
Chart note: After the sharp drop from the 78,288.28 swing high, $BTC has moved sideways in small 1H candles and failed to push above the 24h High at 76,378.00, while the 24h Low at 74,888.00 remains the key level underneath.
Does the 24h Low give way on the next test, or will buyers defend it again? Share your view below.
Not financial advice. DYOR.
#BTC #CryptoSignals #1HChart #WriteToEarn
{spot}(BTCUSDT)
$BTC Coils Between 74,888.00 and 76,378.00 on the 1H Chart 🎯
Action: Short
Entry Range: 76,008.01 – 76,214.11
TP1: 75,466.05
TP2: 74,888.00
TP3: 74,717.98
SL: 1H close above 76,378.00
Chart note: After the sharp drop from the 78,288.28 swing high, $BTC has moved sideways in small 1H candles and failed to push above the 24h High at 76,378.00, while the 24h Low at 74,888.00 remains the key level underneath.
Does the 24h Low give way on the next test, or will buyers defend it again? Share your view below.
Not financial advice. DYOR.
#BTC #CryptoSignals #1HChart #WriteToEarn
Action: Short
Entry Range: 76,008.01 – 76,214.11
TP1: 75,466.05
TP2: 74,888.00
TP3: 74,717.98
SL: 1H close above 76,378.00
Chart note: After the sharp drop from the 78,288.28 swing high, $BTC has moved sideways in small 1H candles and failed to push above the 24h High at 76,378.00, while the 24h Low at 74,888.00 remains the key level underneath.
Does the 24h Low give way on the next test, or will buyers defend it again? Share your view below.
Not financial advice. DYOR.
#BTC #CryptoSignals #1HChart #WriteToEarn
2
234
·
--
Bullish
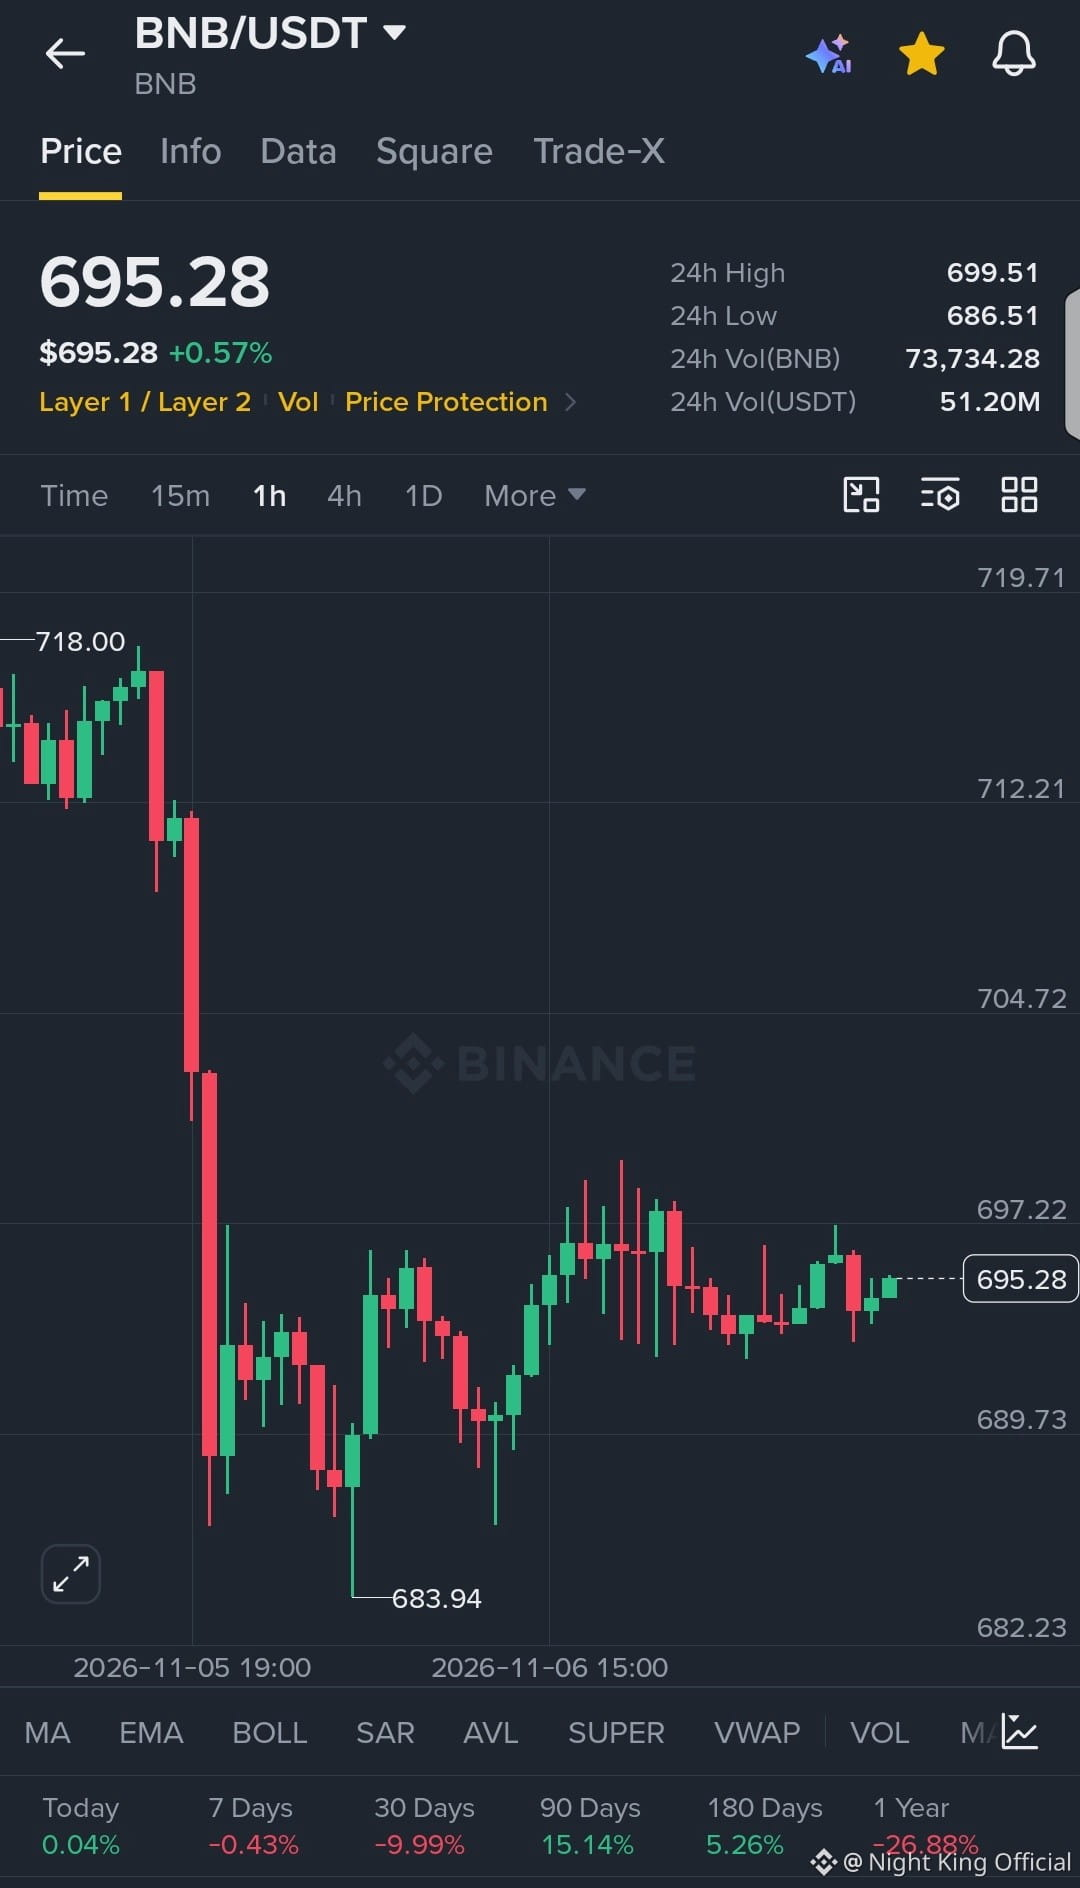
$BNB Ranges Tight Around 695.28 After the Drop From 718.00 ⏳
Setup: Long
Entry Range: 689.73 – 695.28
TP1: 697.22
TP2: 699.51
TP3: 704.72
SL: 1H close below 686.51
Technical view: After the sharp 1H sell-off from the 718.00 swing high down to 683.94, $BNB has been moving sideways in a narrow band between the 24h Low at 686.51 and the 24h High at 699.51, so direction is still unclear.
Which breaks first here, 699.51 or 686.51? Tell me your pick.
Not financial advice. DYOR.
#BNB #Binance #RangeTrading #CryptoSignals #WriteToEarn
{spot}(BNBUSDT)
$BNB Ranges Tight Around 695.28 After the Drop From 718.00 ⏳
Setup: Long
Entry Range: 689.73 – 695.28
TP1: 697.22
TP2: 699.51
TP3: 704.72
SL: 1H close below 686.51
Technical view: After the sharp 1H sell-off from the 718.00 swing high down to 683.94, $BNB has been moving sideways in a narrow band between the 24h Low at 686.51 and the 24h High at 699.51, so direction is still unclear.
Which breaks first here, 699.51 or 686.51? Tell me your pick.
Not financial advice. DYOR.
#BNB #Binance #RangeTrading #CryptoSignals #WriteToEarn
Setup: Long
Entry Range: 689.73 – 695.28
TP1: 697.22
TP2: 699.51
TP3: 704.72
SL: 1H close below 686.51
Technical view: After the sharp 1H sell-off from the 718.00 swing high down to 683.94, $BNB has been moving sideways in a narrow band between the 24h Low at 686.51 and the 24h High at 699.51, so direction is still unclear.
Which breaks first here, 699.51 or 686.51? Tell me your pick.
Not financial advice. DYOR.
#BNB #Binance #RangeTrading #CryptoSignals #WriteToEarn
1
1
249
·
--
Bullish
🔥 COMMUNITY REWARD ALERT! 🪐
🎁 3,000 Gifts waiting for YOU!
✅Follow
🔁Repost
💬Comment 666
🎁Claim your reward!
💥 Hurry! Your surprise is waiting! 🎁
🔥 COMMUNITY REWARD ALERT! 🪐
🎁 3,000 Gifts waiting for YOU!
✅Follow
🔁Repost
💬Comment 666
🎁Claim your reward!
💥 Hurry! Your surprise is waiting! 🎁
🎁 3,000 Gifts waiting for YOU!
✅Follow
🔁Repost
💬Comment 666
🎁Claim your reward!
💥 Hurry! Your surprise is waiting! 🎁

502
5
19
502
·
--
Bullish
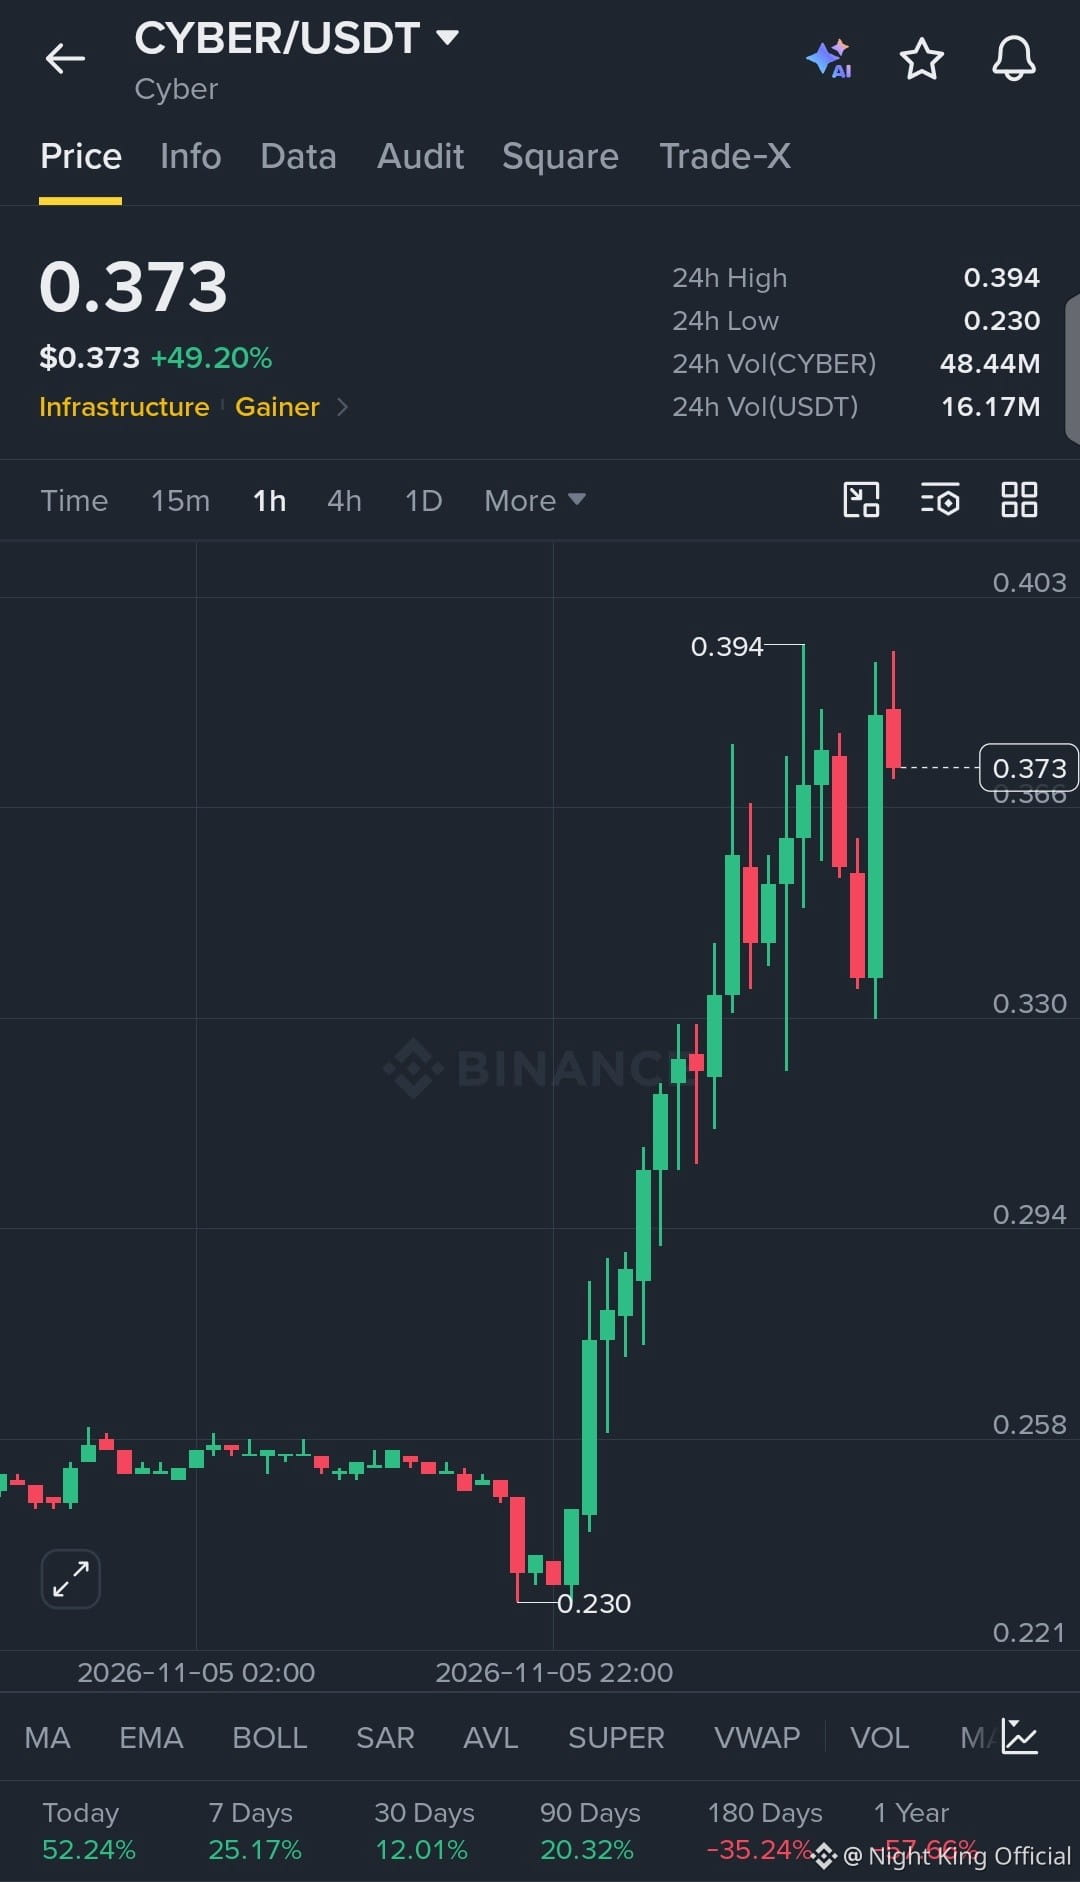
$CYBER Short Setup on 1H Rejection 📉
Action: Short
Entry Range: 0.373 - 0.394
TP1: 0.366
TP2: 0.330
TP3: 0.294
SL: 0.403
The 1H chart shows price rejected from 24h High 0.394 and pulled back to 0.373 after a sharp move up from 24h Low 0.230.
Will $CYBER close below 0.366 and head toward 0.330, or will it test 0.394 again?
Not financial advice. DYOR.
#CYBER #CryptoSignals #BinanceSquare #CryptoTrading
{spot}(CYBERUSDT)
$CYBER Short Setup on 1H Rejection 📉
Action: Short
Entry Range: 0.373 - 0.394
TP1: 0.366
TP2: 0.330
TP3: 0.294
SL: 0.403
The 1H chart shows price rejected from 24h High 0.394 and pulled back to 0.373 after a sharp move up from 24h Low 0.230.
Will $CYBER close below 0.366 and head toward 0.330, or will it test 0.394 again?
Not financial advice. DYOR.
#CYBER #CryptoSignals #BinanceSquare #CryptoTrading
Action: Short
Entry Range: 0.373 - 0.394
TP1: 0.366
TP2: 0.330
TP3: 0.294
SL: 0.403
The 1H chart shows price rejected from 24h High 0.394 and pulled back to 0.373 after a sharp move up from 24h Low 0.230.
Will $CYBER close below 0.366 and head toward 0.330, or will it test 0.394 again?
Not financial advice. DYOR.
#CYBER #CryptoSignals #BinanceSquare #CryptoTrading
1
131
Log in to explore more content
Join global crypto users on Binance Square
⚡️ Get latest and useful information about crypto.
💬 Trusted by the world’s largest crypto exchange.
👍 Discover real insights from verified creators.
Email / Phone number
Trending Topics
NvidiaLoses$2.7TrillionInMonthAndAHalf
22,528 views
143 Discussing
Nvidia’s $2.7 Trillion Wipeout: When Narrative Overrides Numbers 📉
Crypto With Faisal
·7 Likes
·5.7k views
CanBTCReboundAfterFallingBelow60K?
795,453 views
3,046 Discussing
GlobalStocksFaceLongestLosingStreakSince2023
291,601 views
2,038 Discussing