
khaled_abdo
2.1k Posts

khaled_abdo
Report
Block User
Open Trade
High-Frequency Trader
2.2 Years
20 Following
47 Followers
74 Liked
Posts
Portfolio
All
Quotes
·
--
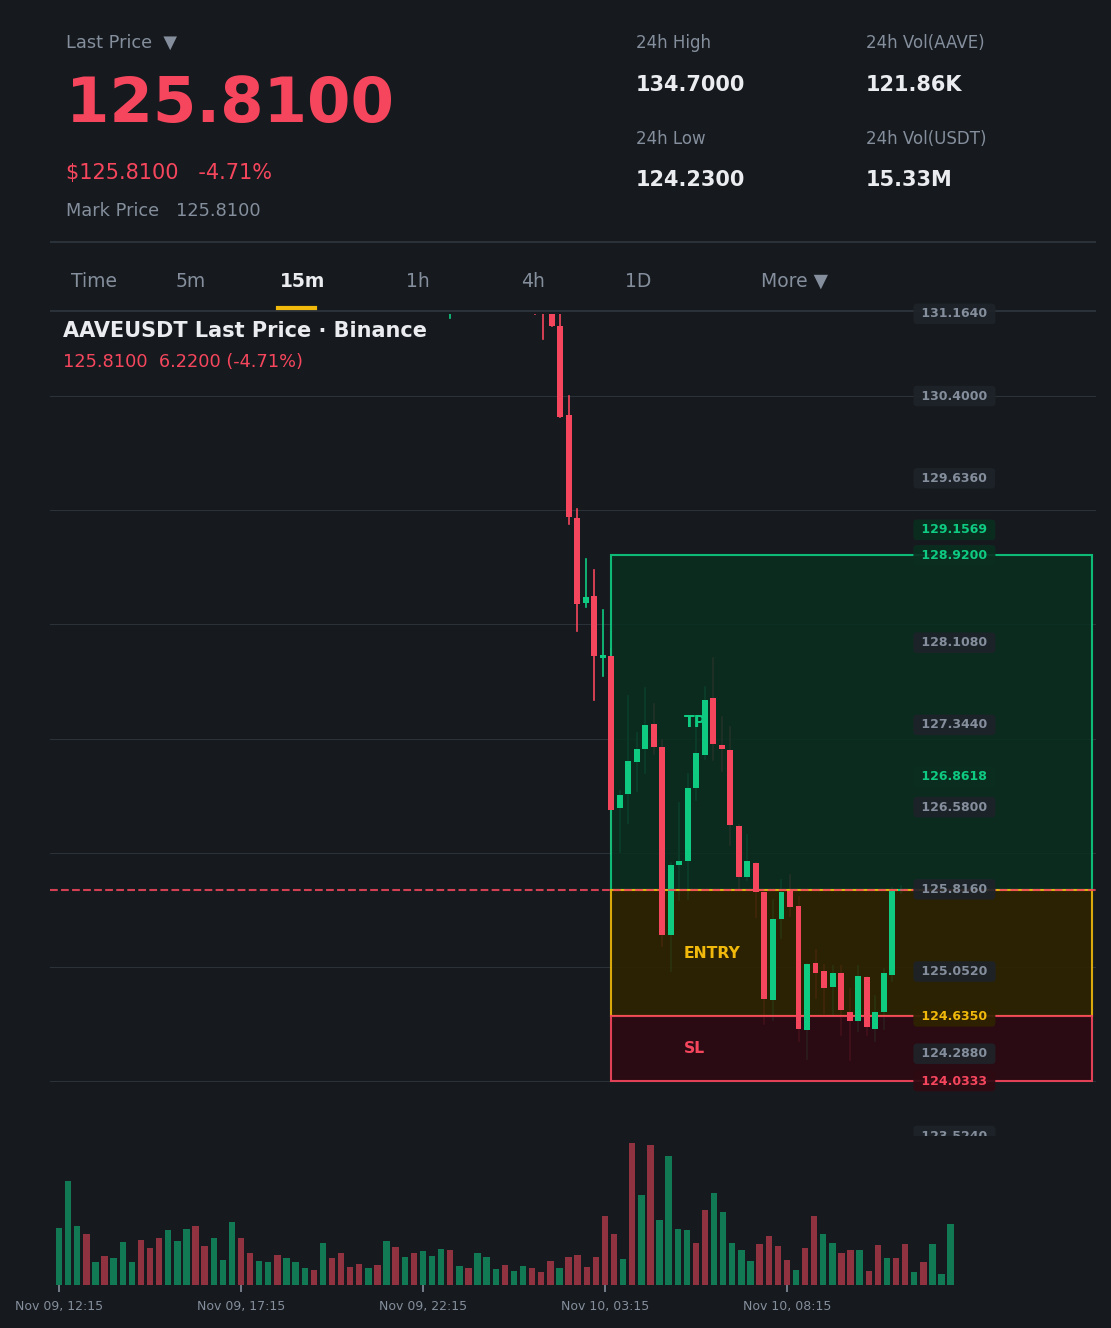
$AAVE Trapping the bears and gearing up for an explosion 🚀
$AAVE /USDT — Long 🟢
Trading plan:
Entry: 124.635 – 125.81
Stop loss: 124.0333
Target 1: 126.8618
Target 2: 128.92
Target 3: 129.1569
Why this setup?
Bollinger Band contraction (BBW 0.0167) signals strong pressure
Rising OBV confirms whale accumulation
Long ratio: 55.91% vs. 44.09% short
Have you secured your seat with us to ride the upward wave toward the first target of 126.8618, or will you just watch? 👇
$AAVE Timeframe:
This content is not investment advice. Do your own research (DYOR)
$AAVE Trapping the bears and gearing up for an explosion 🚀
$AAVE /USDT — Long 🟢
Trading plan:
Entry: 124.635 – 125.81
Stop loss: 124.0333
Target 1: 126.8618
Target 2: 128.92
Target 3: 129.1569
Why this setup?
Bollinger Band contraction (BBW 0.0167) signals strong pressure
Rising OBV confirms whale accumulation
Long ratio: 55.91% vs. 44.09% short
Have you secured your seat with us to ride the upward wave toward the first target of 126.8618, or will you just watch? 👇
$AAVE Timeframe:
This content is not investment advice. Do your own research (DYOR)
$AAVE /USDT — Long 🟢
Trading plan:
Entry: 124.635 – 125.81
Stop loss: 124.0333
Target 1: 126.8618
Target 2: 128.92
Target 3: 129.1569
Why this setup?
Bollinger Band contraction (BBW 0.0167) signals strong pressure
Rising OBV confirms whale accumulation
Long ratio: 55.91% vs. 44.09% short
Have you secured your seat with us to ride the upward wave toward the first target of 126.8618, or will you just watch? 👇
$AAVE Timeframe:
This content is not investment advice. Do your own research (DYOR)
·
--
$AAVE Tricking the bears and gearing up for an explosion 🚀
$AAVE /USDT — Long 🟢
Trading plan:
Entry: 124.635 – 125.81
Stop loss: 124.0333
Target 1: 126.8618
Target 2: 128.92
Target 3: 129.1569
Why this setup?
Bollinger Band contraction (BBW 0.0167) indicates strong pressure
Rising OBV confirms whale accumulation
Long ratio: 55.91% vs. 44.09% short
Have you secured your seat with us to ride the upward wave toward the first target of 126.8618, or will you just watch? 👇
$AAVE Timeframe:
This content is not investment advice. Do your own research (DYOR)
$AAVE Tricking the bears and gearing up for an explosion 🚀
$AAVE /USDT — Long 🟢
Trading plan:
Entry: 124.635 – 125.81
Stop loss: 124.0333
Target 1: 126.8618
Target 2: 128.92
Target 3: 129.1569
Why this setup?
Bollinger Band contraction (BBW 0.0167) indicates strong pressure
Rising OBV confirms whale accumulation
Long ratio: 55.91% vs. 44.09% short
Have you secured your seat with us to ride the upward wave toward the first target of 126.8618, or will you just watch? 👇
$AAVE Timeframe:
This content is not investment advice. Do your own research (DYOR)
$AAVE /USDT — Long 🟢
Trading plan:
Entry: 124.635 – 125.81
Stop loss: 124.0333
Target 1: 126.8618
Target 2: 128.92
Target 3: 129.1569
Why this setup?
Bollinger Band contraction (BBW 0.0167) indicates strong pressure
Rising OBV confirms whale accumulation
Long ratio: 55.91% vs. 44.09% short
Have you secured your seat with us to ride the upward wave toward the first target of 126.8618, or will you just watch? 👇
$AAVE Timeframe:
This content is not investment advice. Do your own research (DYOR)
·
--
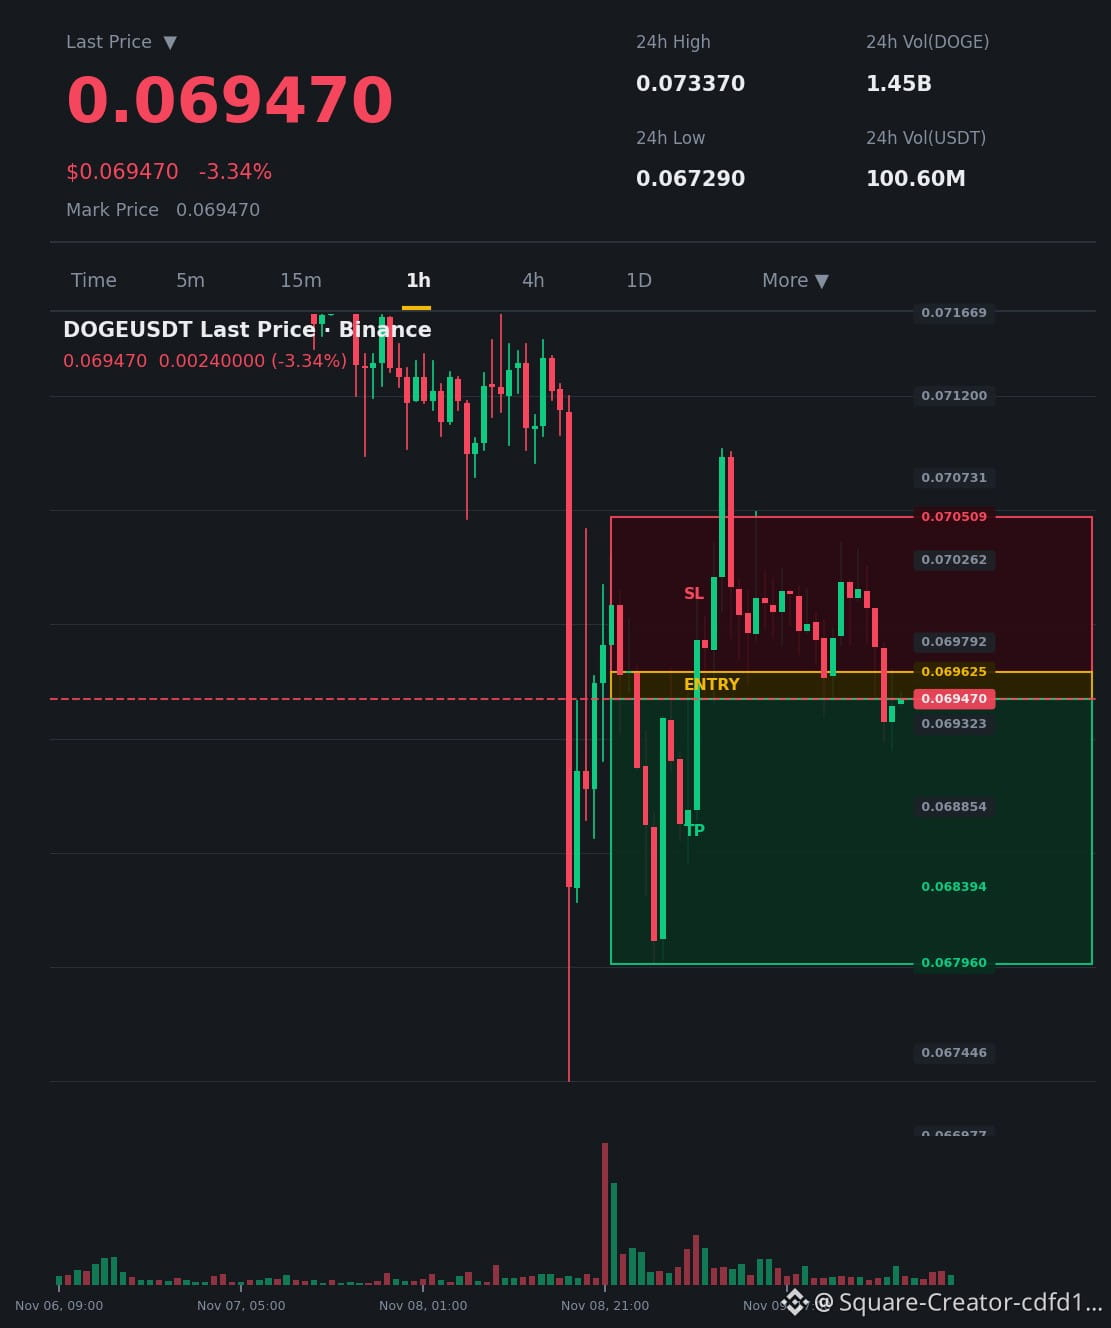
$DOGE Bulls are being trapped... the trap is set for a drop 🔴
$DOGE /USDT — Short 🔴
Trading plan:
Entry: 0.06947 – 0.069625
Stop loss: 0.070509
Target 1: 0.068394
Target 2: 0.06796
Target 3: 0.066577
Why this setup?
Bollinger Band Width (BBW) contraction at 0.0135 signals a strong move is imminent.
The rising OBV trend, combined with extreme long dominance at 72.14%, reinforces the likelihood of selling pressure.
A long-to-short ratio of 2.59 indicates an extreme buildup nearing a reversal.
Place your sell order now to capture downside profits toward the first target at 0.068394 before orders fill. Have you placed your sell order to capture profits, or will you wait until it’s too late? 👇
$DOGE Reminder: Timeframe: 1h | Event: Whale Accumulation Squeeze
This content is not investment advice. Do your own research (DYOR)
$DOGE Bulls are being trapped... the trap is set for a drop 🔴
$DOGE /USDT — Short 🔴
Trading plan:
Entry: 0.06947 – 0.069625
Stop loss: 0.070509
Target 1: 0.068394
Target 2: 0.06796
Target 3: 0.066577
Why this setup?
Bollinger Band Width (BBW) contraction at 0.0135 signals a strong move is imminent.
The rising OBV trend, combined with extreme long dominance at 72.14%, reinforces the likelihood of selling pressure.
A long-to-short ratio of 2.59 indicates an extreme buildup nearing a reversal.
Place your sell order now to capture downside profits toward the first target at 0.068394 before orders fill. Have you placed your sell order to capture profits, or will you wait until it’s too late? 👇
$DOGE Reminder: Timeframe: 1h | Event: Whale Accumulation Squeeze
This content is not investment advice. Do your own research (DYOR)
$DOGE /USDT — Short 🔴
Trading plan:
Entry: 0.06947 – 0.069625
Stop loss: 0.070509
Target 1: 0.068394
Target 2: 0.06796
Target 3: 0.066577
Why this setup?
Bollinger Band Width (BBW) contraction at 0.0135 signals a strong move is imminent.
The rising OBV trend, combined with extreme long dominance at 72.14%, reinforces the likelihood of selling pressure.
A long-to-short ratio of 2.59 indicates an extreme buildup nearing a reversal.
Place your sell order now to capture downside profits toward the first target at 0.068394 before orders fill. Have you placed your sell order to capture profits, or will you wait until it’s too late? 👇
$DOGE Reminder: Timeframe: 1h | Event: Whale Accumulation Squeeze
This content is not investment advice. Do your own research (DYOR)
1
·
--
$NEAR Bears are getting trapped amid whale accumulation pressure!
$NEAR /USDT — Long 🟢
Trading plan:
Entry: 3.5
This content is not investment advice. Do your own research (DYOR).
$NEAR Bears are getting trapped amid whale accumulation pressure!
$NEAR /USDT — Long 🟢
Trading plan:
Entry: 3.5
This content is not investment advice. Do your own research (DYOR).
$NEAR /USDT — Long 🟢
Trading plan:
Entry: 3.5
This content is not investment advice. Do your own research (DYOR).
2
·
--
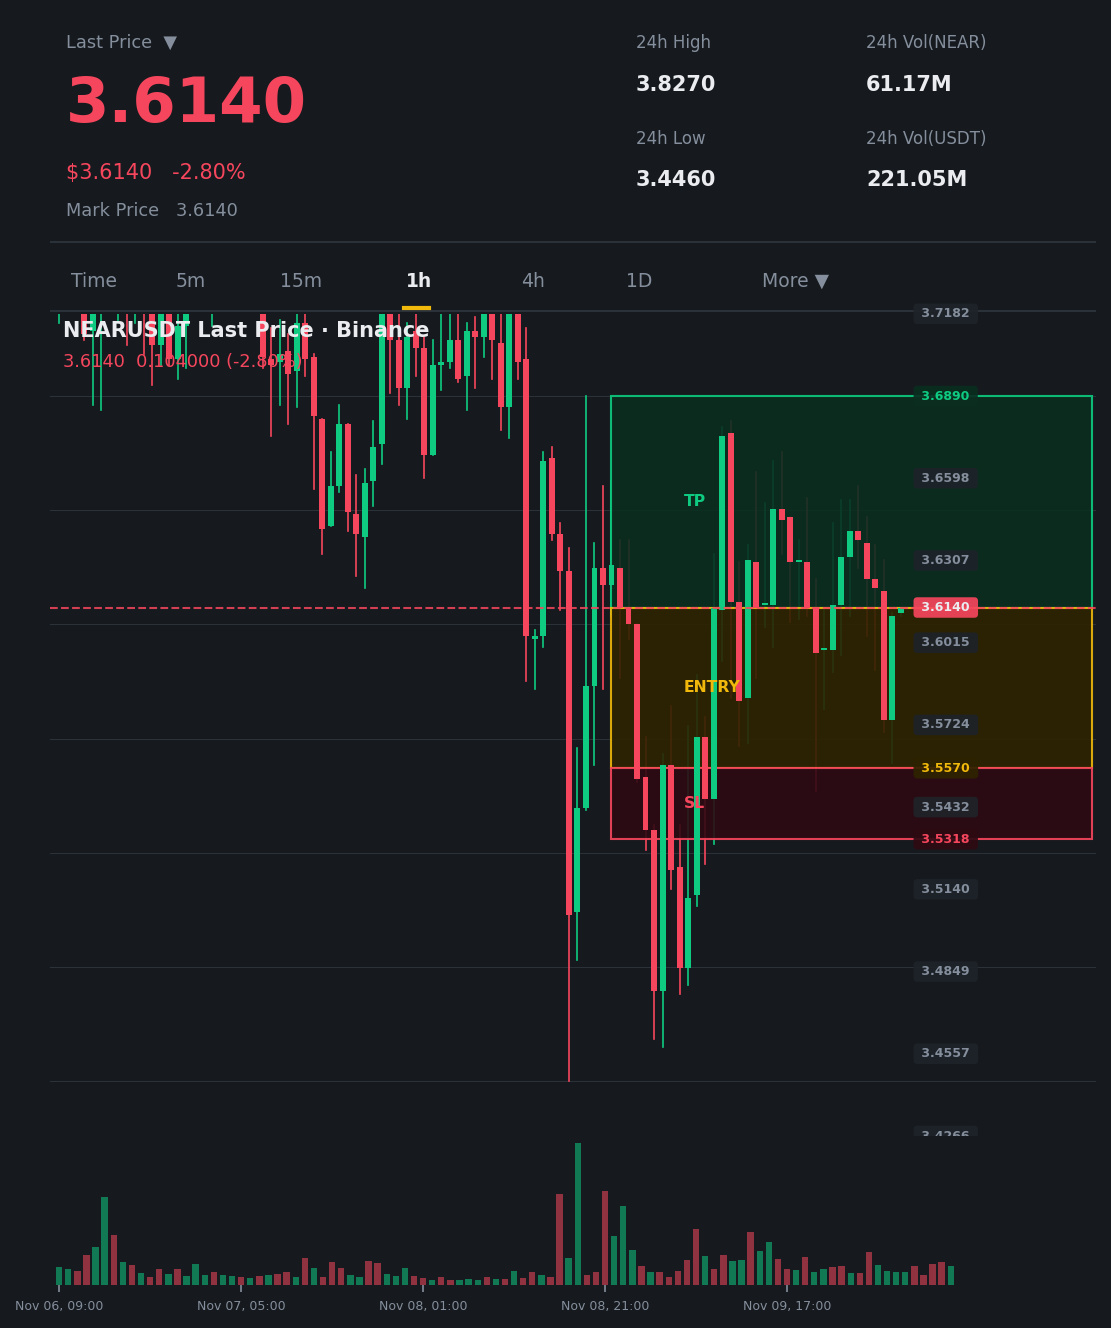
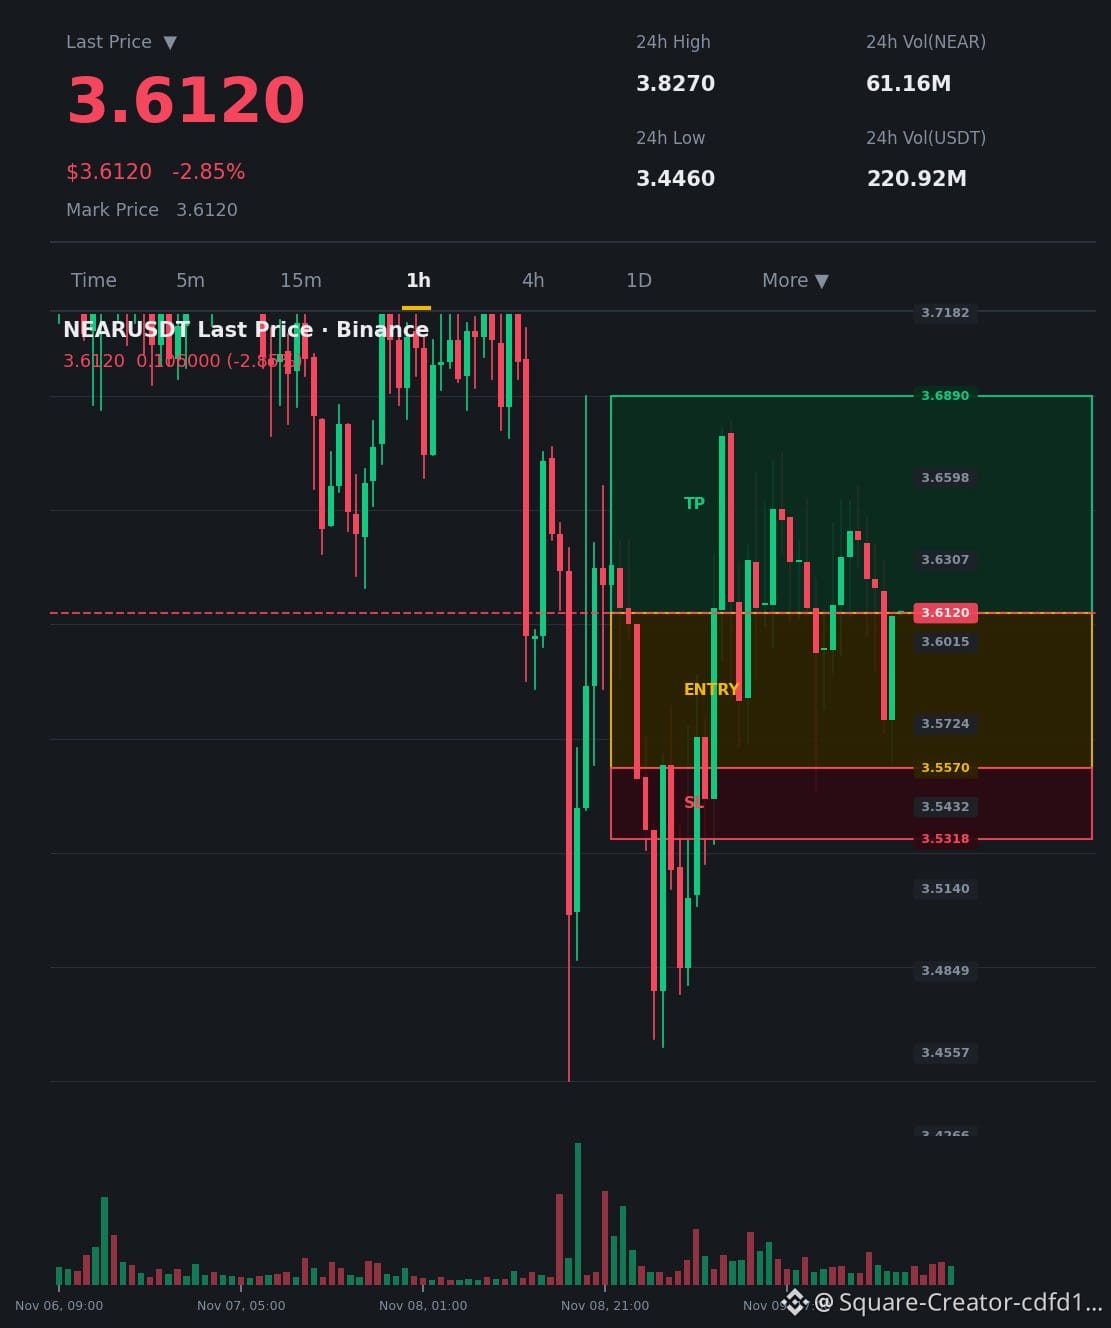
$NEAR Buyers are squeezing at 56.14% and the price range is tightening before the breakout! 🚀
$NEAR /USDT — Long 🟢
Trading plan:
Entry: 3.557 – 3.612
Stop loss: 3.5318
Target 1: 3.657
Target 2: 3.689
Target 3: 3.8864
Why this setup?
Bollinger Band width at 0.022 indicates strong candle compression
The OBV indicator shows accumulation alongside rising trading volume
The long-to-short ratio of 1.28 supports a bullish market bias
Get ready for buyers to push toward the first target at 3.657. Are you onboard for this upward ride, or would you rather wait on the sidelines? 👇
$NEAR (Reminder: Timeframe: 1h | Event: Whale Accumulation Squeeze)
This content is not investment advice. Do your own research (DYOR)
$NEAR Buyers are squeezing at 56.14% and the price range is tightening before the breakout! 🚀
$NEAR /USDT — Long 🟢
Trading plan:
Entry: 3.557 – 3.612
Stop loss: 3.5318
Target 1: 3.657
Target 2: 3.689
Target 3: 3.8864
Why this setup?
Bollinger Band width at 0.022 indicates strong candle compression
The OBV indicator shows accumulation alongside rising trading volume
The long-to-short ratio of 1.28 supports a bullish market bias
Get ready for buyers to push toward the first target at 3.657. Are you onboard for this upward ride, or would you rather wait on the sidelines? 👇
$NEAR (Reminder: Timeframe: 1h | Event: Whale Accumulation Squeeze)
This content is not investment advice. Do your own research (DYOR)
$NEAR /USDT — Long 🟢
Trading plan:
Entry: 3.557 – 3.612
Stop loss: 3.5318
Target 1: 3.657
Target 2: 3.689
Target 3: 3.8864
Why this setup?
Bollinger Band width at 0.022 indicates strong candle compression
The OBV indicator shows accumulation alongside rising trading volume
The long-to-short ratio of 1.28 supports a bullish market bias
Get ready for buyers to push toward the first target at 3.657. Are you onboard for this upward ride, or would you rather wait on the sidelines? 👇
$NEAR (Reminder: Timeframe: 1h | Event: Whale Accumulation Squeeze)
This content is not investment advice. Do your own research (DYOR)
·
--
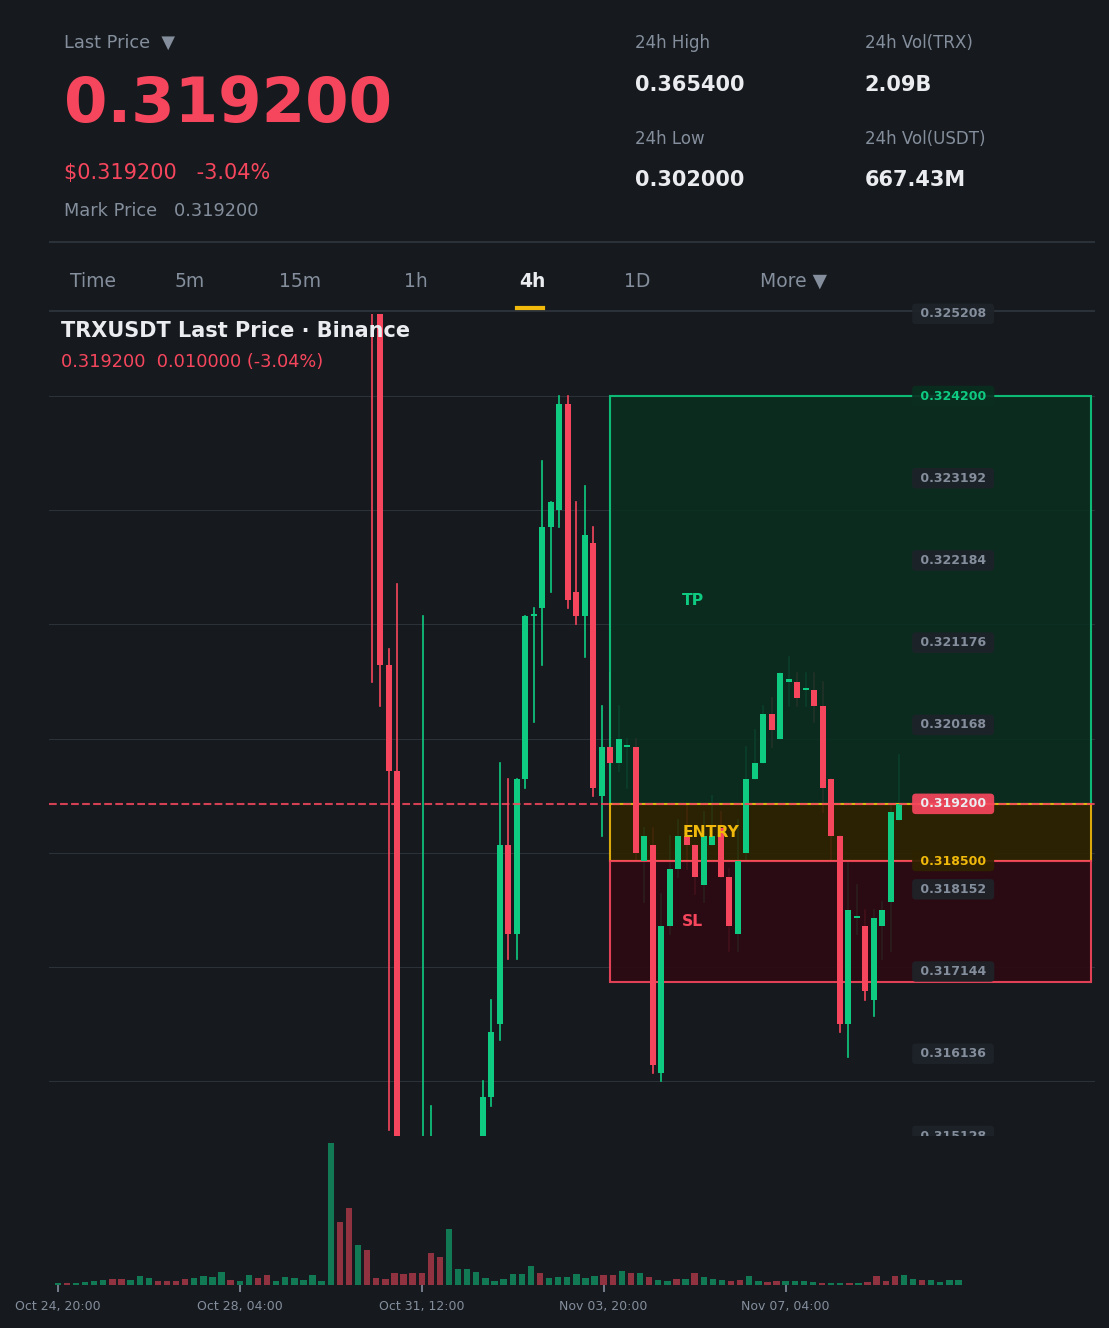
$TRX traps the bears and sets the stage for a price explosion 🔥
$TRX /USDT — Long 🟢
Trading Plan:
Entry: 0.3185 – 0.3192
0.317017: 0.317017
0.321049: 0.321049
0.3242: 0.3242
0.326503: 0.326503
Why this setup?
Bollinger Band Width (BBW) contraction at 0.0164 signals an imminent price squeeze.
OBV is trending upward, with clear whale accumulation.
Trading volume supports the upside, with a 53.21% long ratio versus 46.79% short.
Have you secured your seat with us to ride the upward wave toward the first target of 0.321049, or will you just watch? 👇
$TRX Timeframe: 4h | Event: Whale Accumulation Squeeze
This content is not investment advice. Do your own research (DYOR)
$TRX traps the bears and sets the stage for a price explosion 🔥
$TRX /USDT — Long 🟢
Trading Plan:
Entry: 0.3185 – 0.3192
0.317017: 0.317017
0.321049: 0.321049
0.3242: 0.3242
0.326503: 0.326503
Why this setup?
Bollinger Band Width (BBW) contraction at 0.0164 signals an imminent price squeeze.
OBV is trending upward, with clear whale accumulation.
Trading volume supports the upside, with a 53.21% long ratio versus 46.79% short.
Have you secured your seat with us to ride the upward wave toward the first target of 0.321049, or will you just watch? 👇
$TRX Timeframe: 4h | Event: Whale Accumulation Squeeze
This content is not investment advice. Do your own research (DYOR)
$TRX /USDT — Long 🟢
Trading Plan:
Entry: 0.3185 – 0.3192
0.317017: 0.317017
0.321049: 0.321049
0.3242: 0.3242
0.326503: 0.326503
Why this setup?
Bollinger Band Width (BBW) contraction at 0.0164 signals an imminent price squeeze.
OBV is trending upward, with clear whale accumulation.
Trading volume supports the upside, with a 53.21% long ratio versus 46.79% short.
Have you secured your seat with us to ride the upward wave toward the first target of 0.321049, or will you just watch? 👇
$TRX Timeframe: 4h | Event: Whale Accumulation Squeeze
This content is not investment advice. Do your own research (DYOR)
·
--
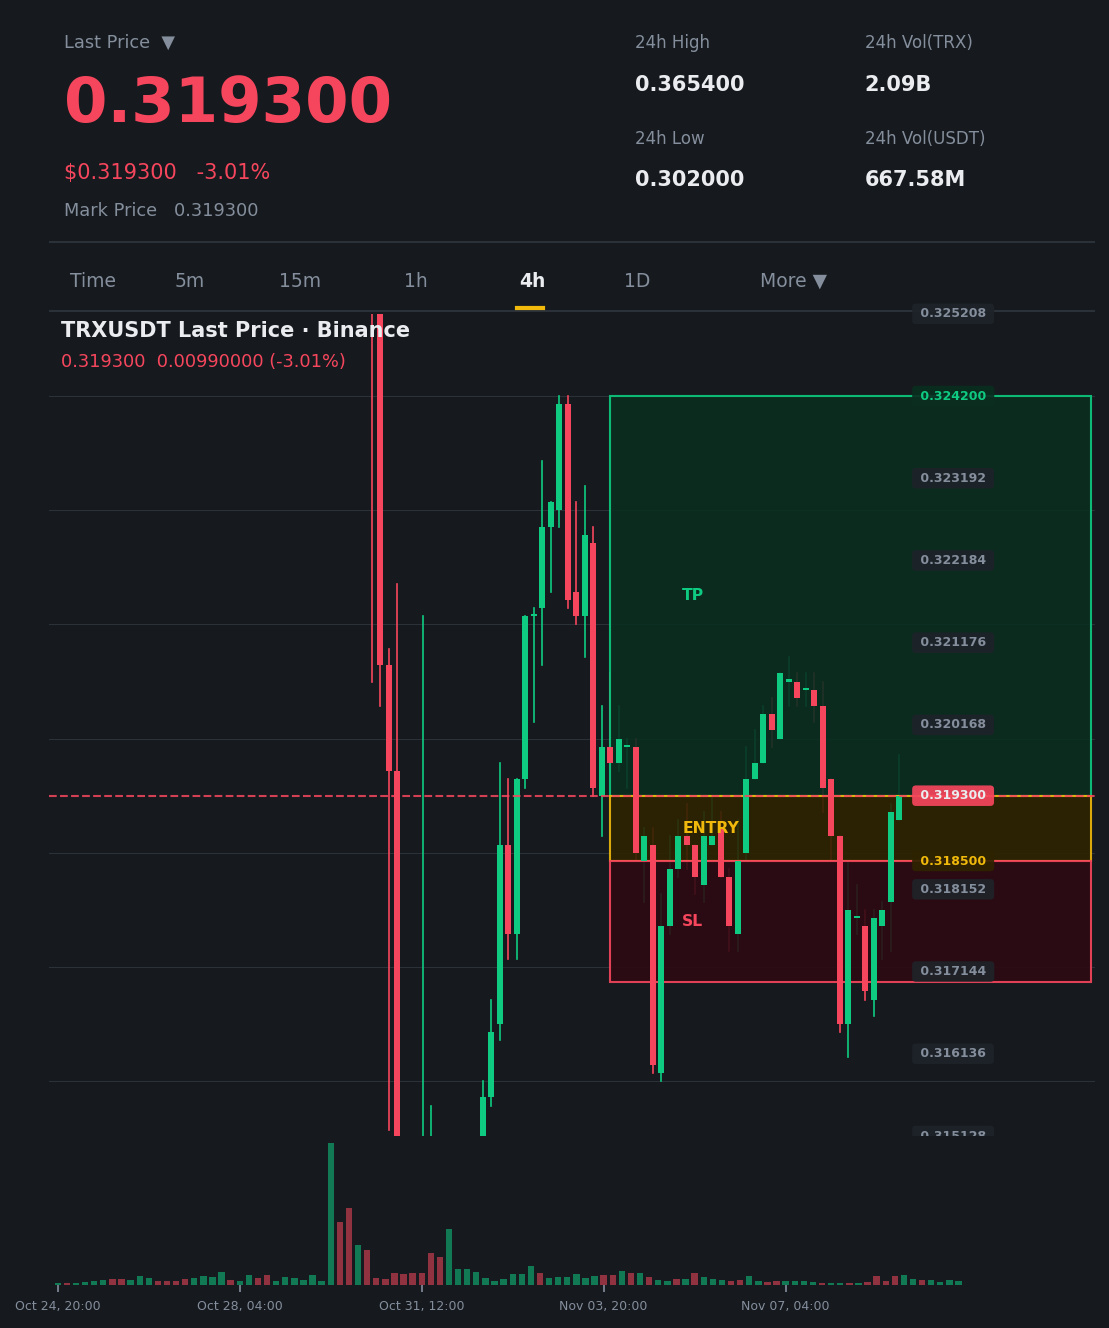
$TRX Whales are squeezing bears now! 🚀
$TRX /USDT — Long
This content is not investment advice. Do your own research (DYOR)
$TRX Whales are squeezing bears now! 🚀
$TRX /USDT — Long
This content is not investment advice. Do your own research (DYOR)
$TRX /USDT — Long
This content is not investment advice. Do your own research (DYOR)
3
·
--
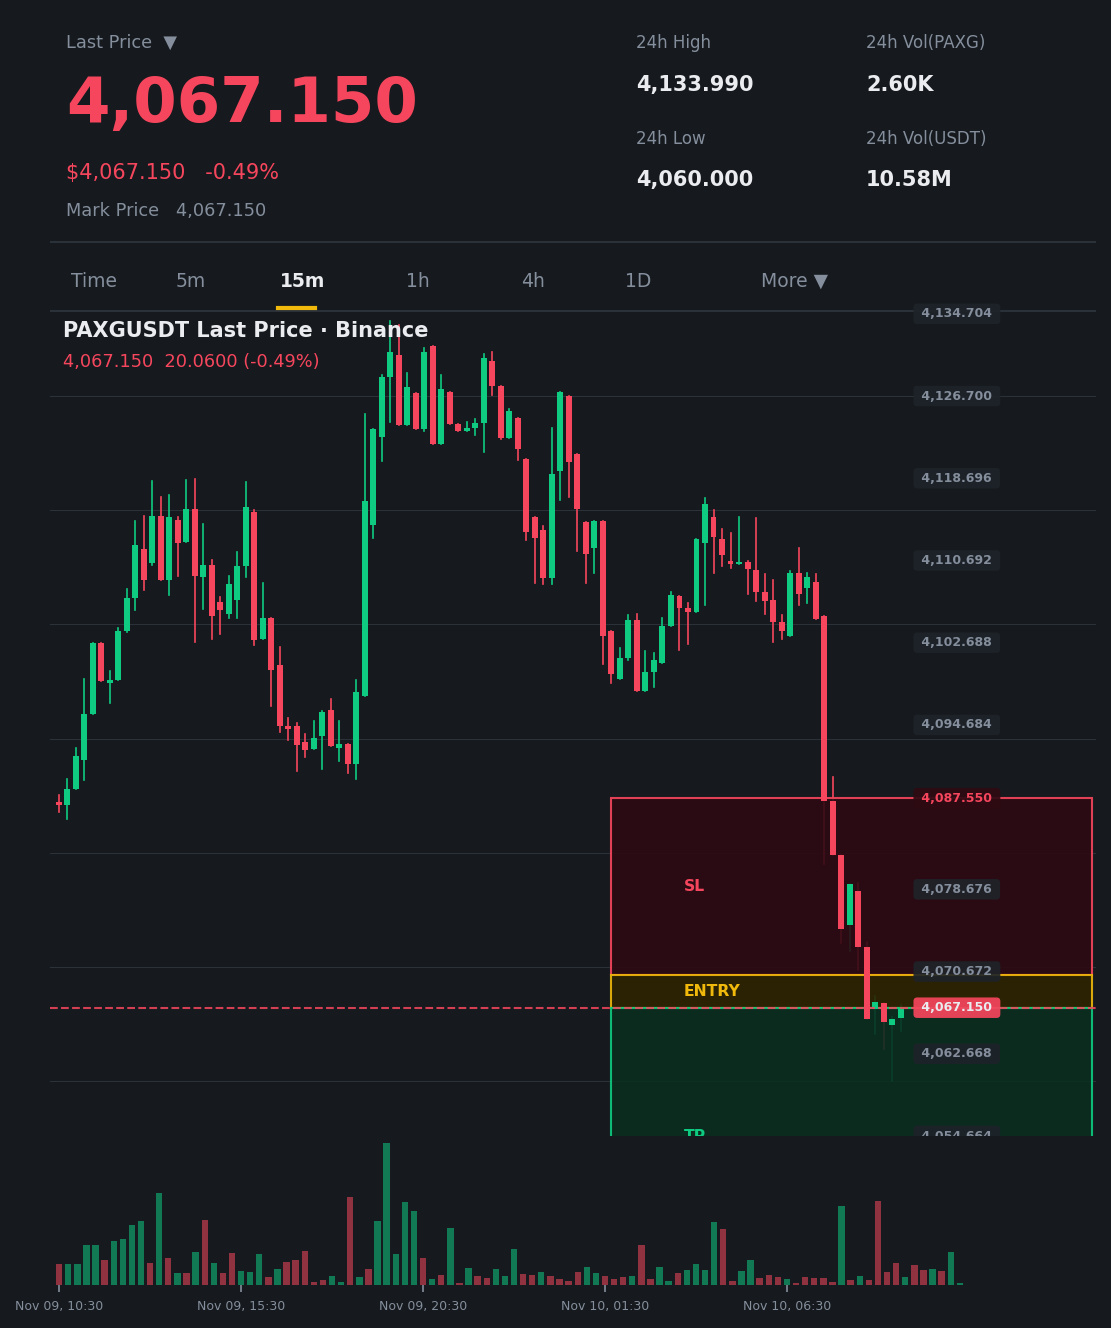
$PAXG About to trap buyers' positions with BBW 0.0181
$PAXG /USDT — Short 🔴
Trading plan:
Entry: 4067.15 – 4070.29
Stop loss: 4087.55
Target 1: 4053.03
Target 2: 4042.04
Target 3: 4031.05
Why this setup?
The contraction of the Bollinger Bands, with BBW at 0.0181, reflects imminent price pressure.
Rising OBV, alongside long positions dominating at 73.63%, supports the long squeeze scenario.
Declining trading volume near 4067–4070 increases the likelihood of a bearish reversal.
This content is not investment advice. Do your own research (DYOR).
$PAXG About to trap buyers' positions with BBW 0.0181
$PAXG /USDT — Short 🔴
Trading plan:
Entry: 4067.15 – 4070.29
Stop loss: 4087.55
Target 1: 4053.03
Target 2: 4042.04
Target 3: 4031.05
Why this setup?
The contraction of the Bollinger Bands, with BBW at 0.0181, reflects imminent price pressure.
Rising OBV, alongside long positions dominating at 73.63%, supports the long squeeze scenario.
Declining trading volume near 4067–4070 increases the likelihood of a bearish reversal.
This content is not investment advice. Do your own research (DYOR).
$PAXG /USDT — Short 🔴
Trading plan:
Entry: 4067.15 – 4070.29
Stop loss: 4087.55
Target 1: 4053.03
Target 2: 4042.04
Target 3: 4031.05
Why this setup?
The contraction of the Bollinger Bands, with BBW at 0.0181, reflects imminent price pressure.
Rising OBV, alongside long positions dominating at 73.63%, supports the long squeeze scenario.
Declining trading volume near 4067–4070 increases the likelihood of a bearish reversal.
This content is not investment advice. Do your own research (DYOR).
·
--
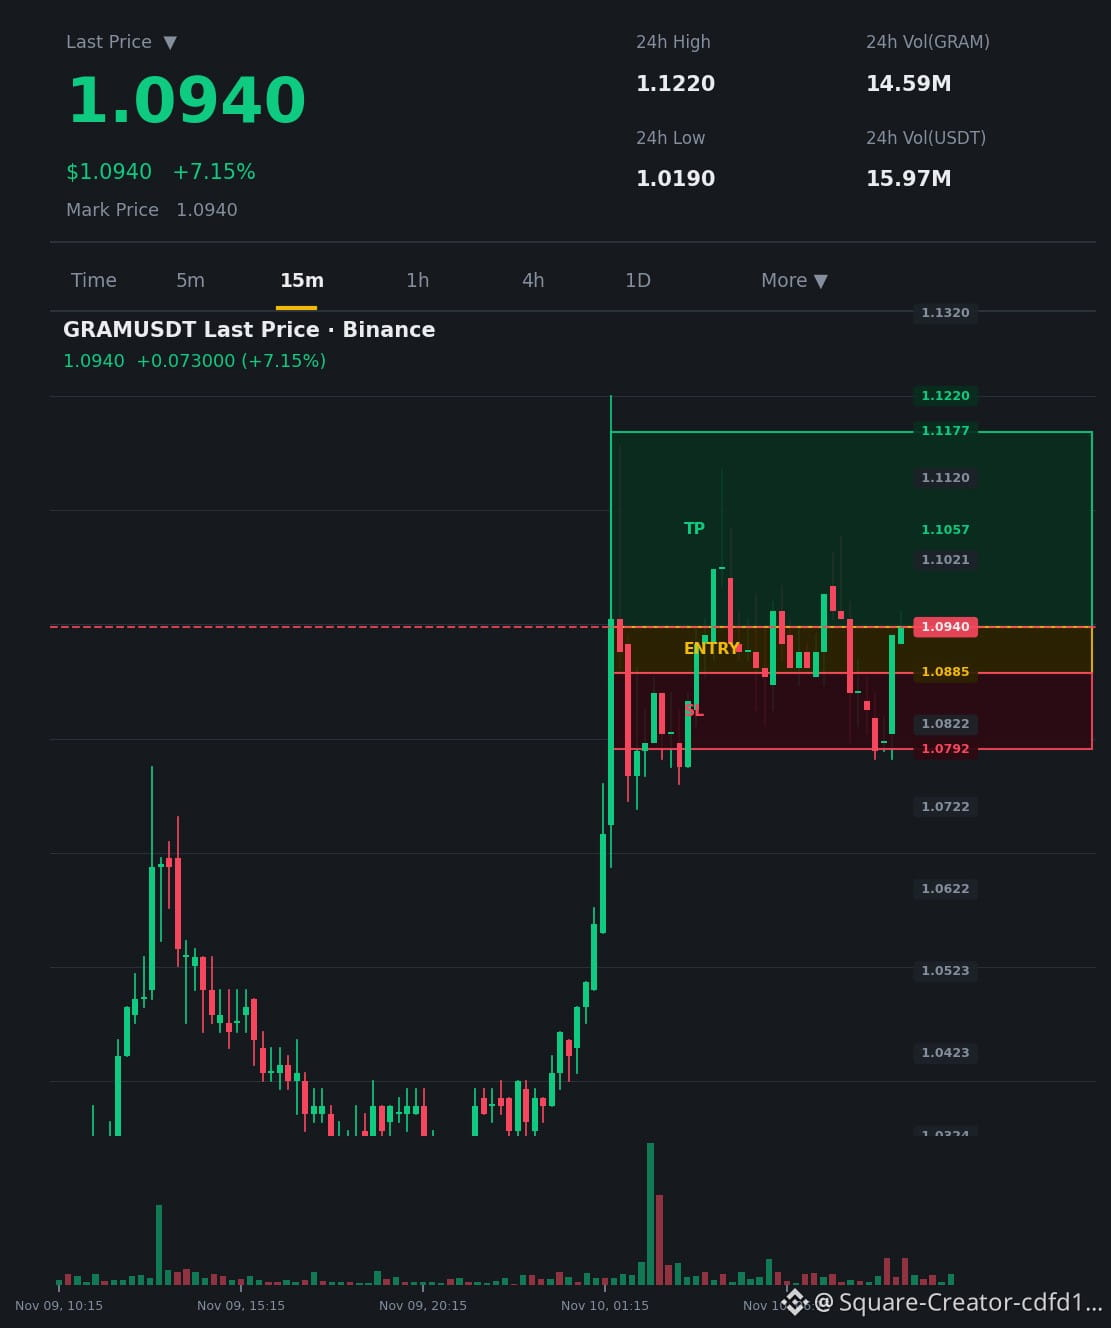
$GRAM Are the bears getting trapped before the breakout? 🚀
$GRAM /USDT — Long 🟢
Trading Plan:
Entry: 1.0885 – 1.094
Stop loss: 1.0792
Target 1: 1.1057
Target 2: 1.1177
Target 3: 1.122
Why this setup?
The Bollinger Band Width (BBW) squeeze at 0.0186 points to imminent price pressure
The upward OBV trend confirms whale accumulation
The long ratio of 51.65% versus 48.35% short supports a slight bullish bias
Ride the wave toward the first target at 1.1057. Have you secured your spot in the trade, or will you just watch? 👇
$GRAM Reminder: Timeframe 15m | Event: Whale Accumulation Squeeze
This content is not investment advice. Do your own research (DYOR)
$GRAM Are the bears getting trapped before the breakout? 🚀
$GRAM /USDT — Long 🟢
Trading Plan:
Entry: 1.0885 – 1.094
Stop loss: 1.0792
Target 1: 1.1057
Target 2: 1.1177
Target 3: 1.122
Why this setup?
The Bollinger Band Width (BBW) squeeze at 0.0186 points to imminent price pressure
The upward OBV trend confirms whale accumulation
The long ratio of 51.65% versus 48.35% short supports a slight bullish bias
Ride the wave toward the first target at 1.1057. Have you secured your spot in the trade, or will you just watch? 👇
$GRAM Reminder: Timeframe 15m | Event: Whale Accumulation Squeeze
This content is not investment advice. Do your own research (DYOR)
$GRAM /USDT — Long 🟢
Trading Plan:
Entry: 1.0885 – 1.094
Stop loss: 1.0792
Target 1: 1.1057
Target 2: 1.1177
Target 3: 1.122
Why this setup?
The Bollinger Band Width (BBW) squeeze at 0.0186 points to imminent price pressure
The upward OBV trend confirms whale accumulation
The long ratio of 51.65% versus 48.35% short supports a slight bullish bias
Ride the wave toward the first target at 1.1057. Have you secured your spot in the trade, or will you just watch? 👇
$GRAM Reminder: Timeframe 15m | Event: Whale Accumulation Squeeze
This content is not investment advice. Do your own research (DYOR)
·
--
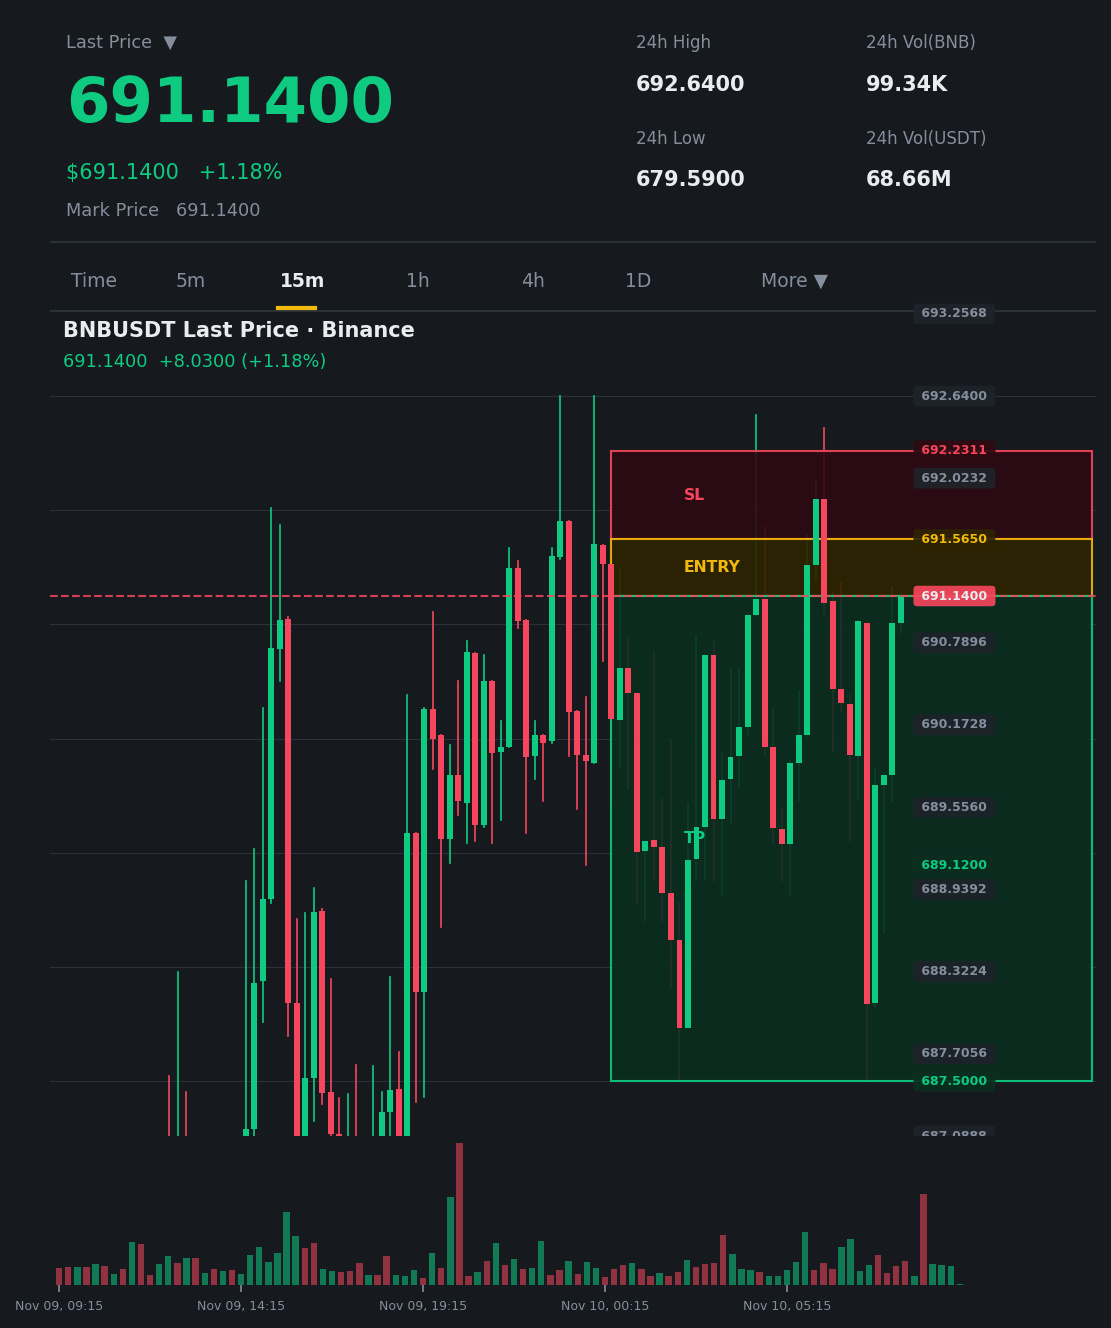
$BNB Bulls are trapped at 691.14 and the market is about to reverse!
$BNB /USDT — Short 🔴
Trading plan:
Entry:
This content is not investment advice. Do your own research (DYOR)
$BNB Bulls are trapped at 691.14 and the market is about to reverse!
$BNB /USDT — Short 🔴
Trading plan:
Entry:
This content is not investment advice. Do your own research (DYOR)
$BNB /USDT — Short 🔴
Trading plan:
Entry:
This content is not investment advice. Do your own research (DYOR)
1
·
--
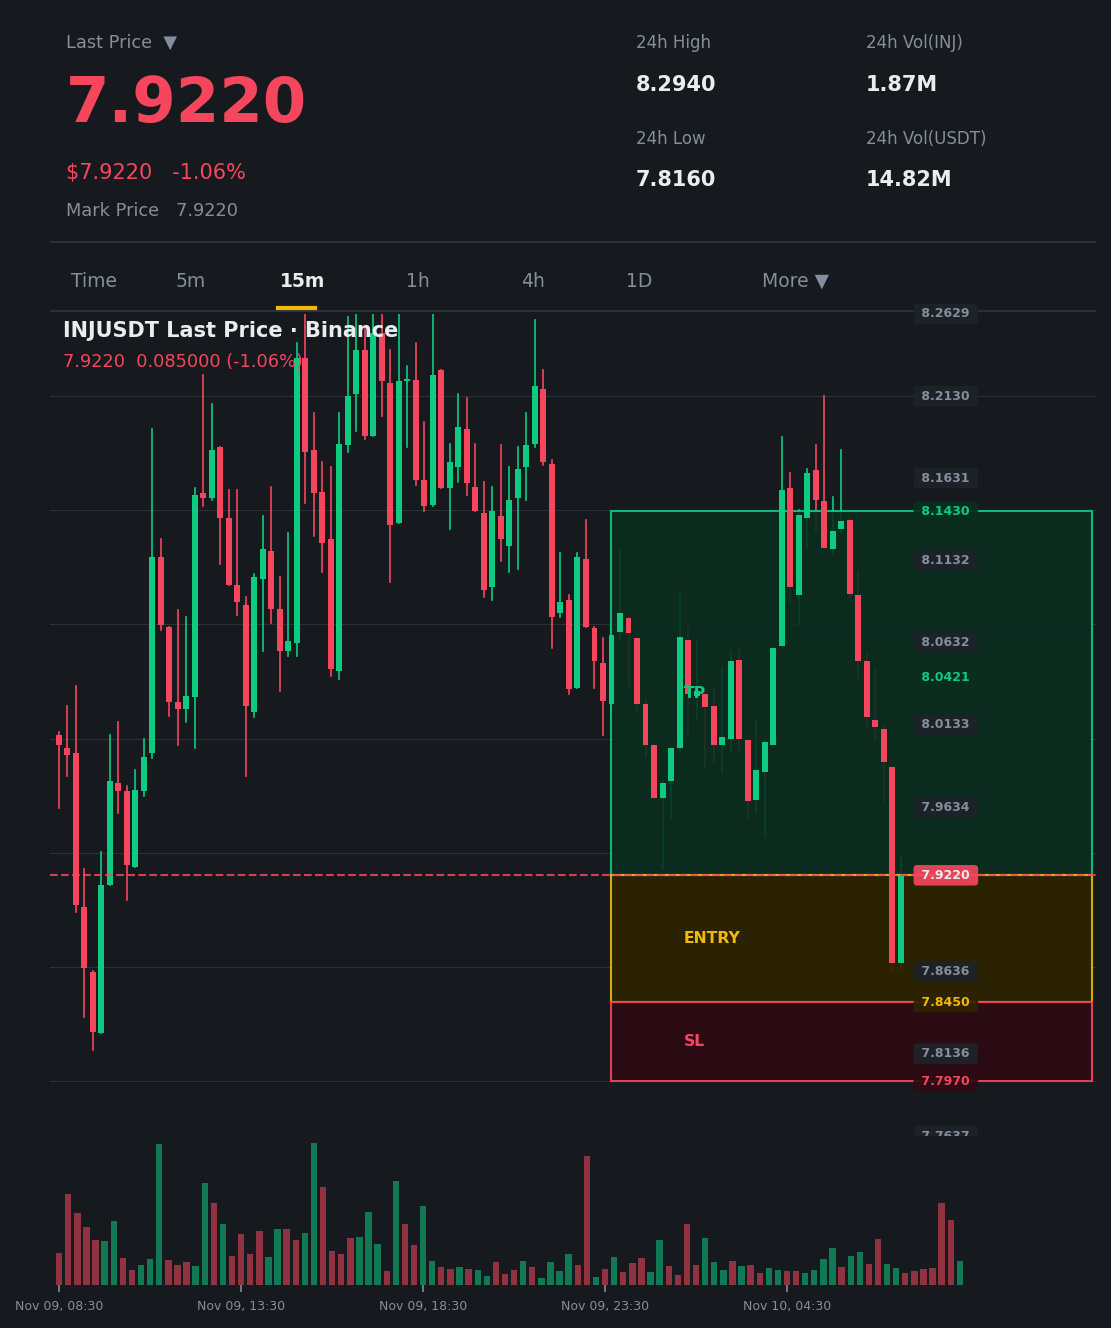
$INJ The bear trap breaks and hunters return to the surface 🚀
$INJ /USDT — Long 🟢
Trading plan:
Entry: 7.845 – 7.922
7.797: 7.797
8.0421: 8.0421
8.143: 8.143
8.264: 8.264
Why this setup?
RSI at 37.76 indicates oversold territory, with a potential rebound
Long positions at 59.91% versus 40.09% short positions, showing slight optimism
Testing the 7.797 level as support before moving toward the first target
Get ready to enter toward 8.0421 and ride the potential upward wave — have you placed your trade before the breakout, or will you just watch from the sidelines? 👇
$INJ (Reminder: Timeframe: 15m | Event: Bear Trap & Sniper Bounce)
This content is not investment advice. Do your own research (DYOR)
$INJ The bear trap breaks and hunters return to the surface 🚀
$INJ /USDT — Long 🟢
Trading plan:
Entry: 7.845 – 7.922
7.797: 7.797
8.0421: 8.0421
8.143: 8.143
8.264: 8.264
Why this setup?
RSI at 37.76 indicates oversold territory, with a potential rebound
Long positions at 59.91% versus 40.09% short positions, showing slight optimism
Testing the 7.797 level as support before moving toward the first target
Get ready to enter toward 8.0421 and ride the potential upward wave — have you placed your trade before the breakout, or will you just watch from the sidelines? 👇
$INJ (Reminder: Timeframe: 15m | Event: Bear Trap & Sniper Bounce)
This content is not investment advice. Do your own research (DYOR)
$INJ /USDT — Long 🟢
Trading plan:
Entry: 7.845 – 7.922
7.797: 7.797
8.0421: 8.0421
8.143: 8.143
8.264: 8.264
Why this setup?
RSI at 37.76 indicates oversold territory, with a potential rebound
Long positions at 59.91% versus 40.09% short positions, showing slight optimism
Testing the 7.797 level as support before moving toward the first target
Get ready to enter toward 8.0421 and ride the potential upward wave — have you placed your trade before the breakout, or will you just watch from the sidelines? 👇
$INJ (Reminder: Timeframe: 15m | Event: Bear Trap & Sniper Bounce)
This content is not investment advice. Do your own research (DYOR)
2
·
--
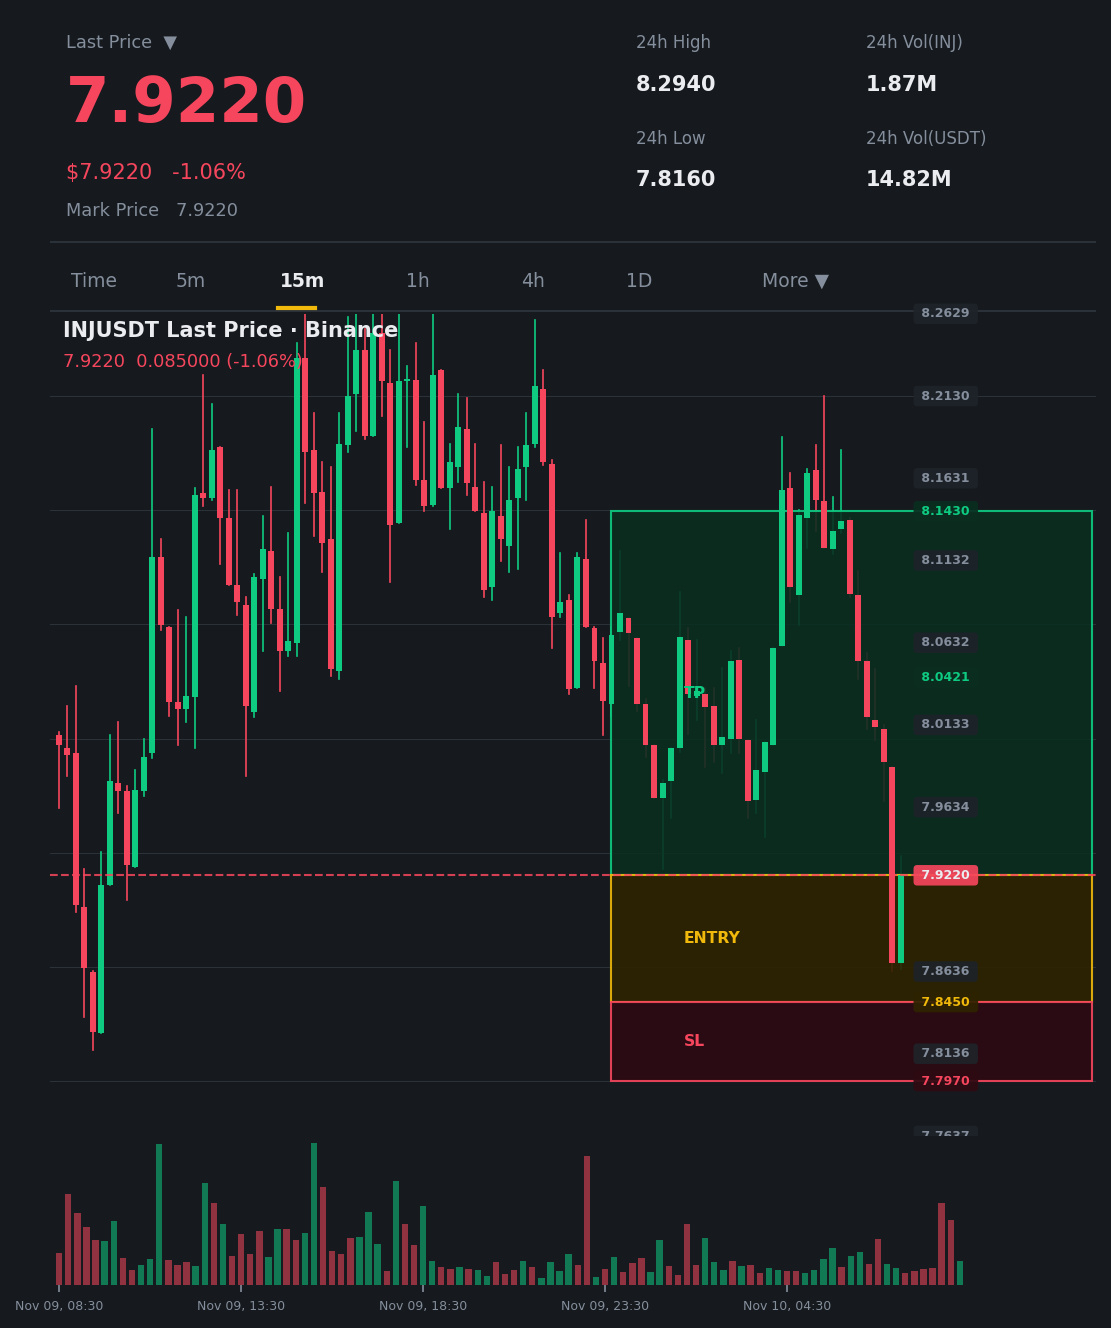
$INJ The bear trap breaks and hunters return to the surface 🚀
$INJ /USDT — Long 🟢
Trading plan:
Entry: 7.845 – 7.922
7.797: 7.797
8.0421: 8.0421
8.143: 8.143
8.264: 8.264
Why this setup?
RSI at 37.76 points to oversold territory, with a potential rebound
Long positions at 59.91% versus 40.09% short positions, indicating slight optimism
Testing 7.797 as support before moving toward the first target
Get ready to enter toward 8.0421 and ride the potential upward wave — have you secured your trade before the breakout, or will you just watch from the sidelines? 👇
$INJ (Reminder: Timeframe: 15m | Event: Bear Trap & Sniper Bounce)
This content is not investment advice. Do your own research (DYOR)
$INJ The bear trap breaks and hunters return to the surface 🚀
$INJ /USDT — Long 🟢
Trading plan:
Entry: 7.845 – 7.922
7.797: 7.797
8.0421: 8.0421
8.143: 8.143
8.264: 8.264
Why this setup?
RSI at 37.76 points to oversold territory, with a potential rebound
Long positions at 59.91% versus 40.09% short positions, indicating slight optimism
Testing 7.797 as support before moving toward the first target
Get ready to enter toward 8.0421 and ride the potential upward wave — have you secured your trade before the breakout, or will you just watch from the sidelines? 👇
$INJ (Reminder: Timeframe: 15m | Event: Bear Trap & Sniper Bounce)
This content is not investment advice. Do your own research (DYOR)
$INJ /USDT — Long 🟢
Trading plan:
Entry: 7.845 – 7.922
7.797: 7.797
8.0421: 8.0421
8.143: 8.143
8.264: 8.264
Why this setup?
RSI at 37.76 points to oversold territory, with a potential rebound
Long positions at 59.91% versus 40.09% short positions, indicating slight optimism
Testing 7.797 as support before moving toward the first target
Get ready to enter toward 8.0421 and ride the potential upward wave — have you secured your trade before the breakout, or will you just watch from the sidelines? 👇
$INJ (Reminder: Timeframe: 15m | Event: Bear Trap & Sniper Bounce)
This content is not investment advice. Do your own research (DYOR)
·
--
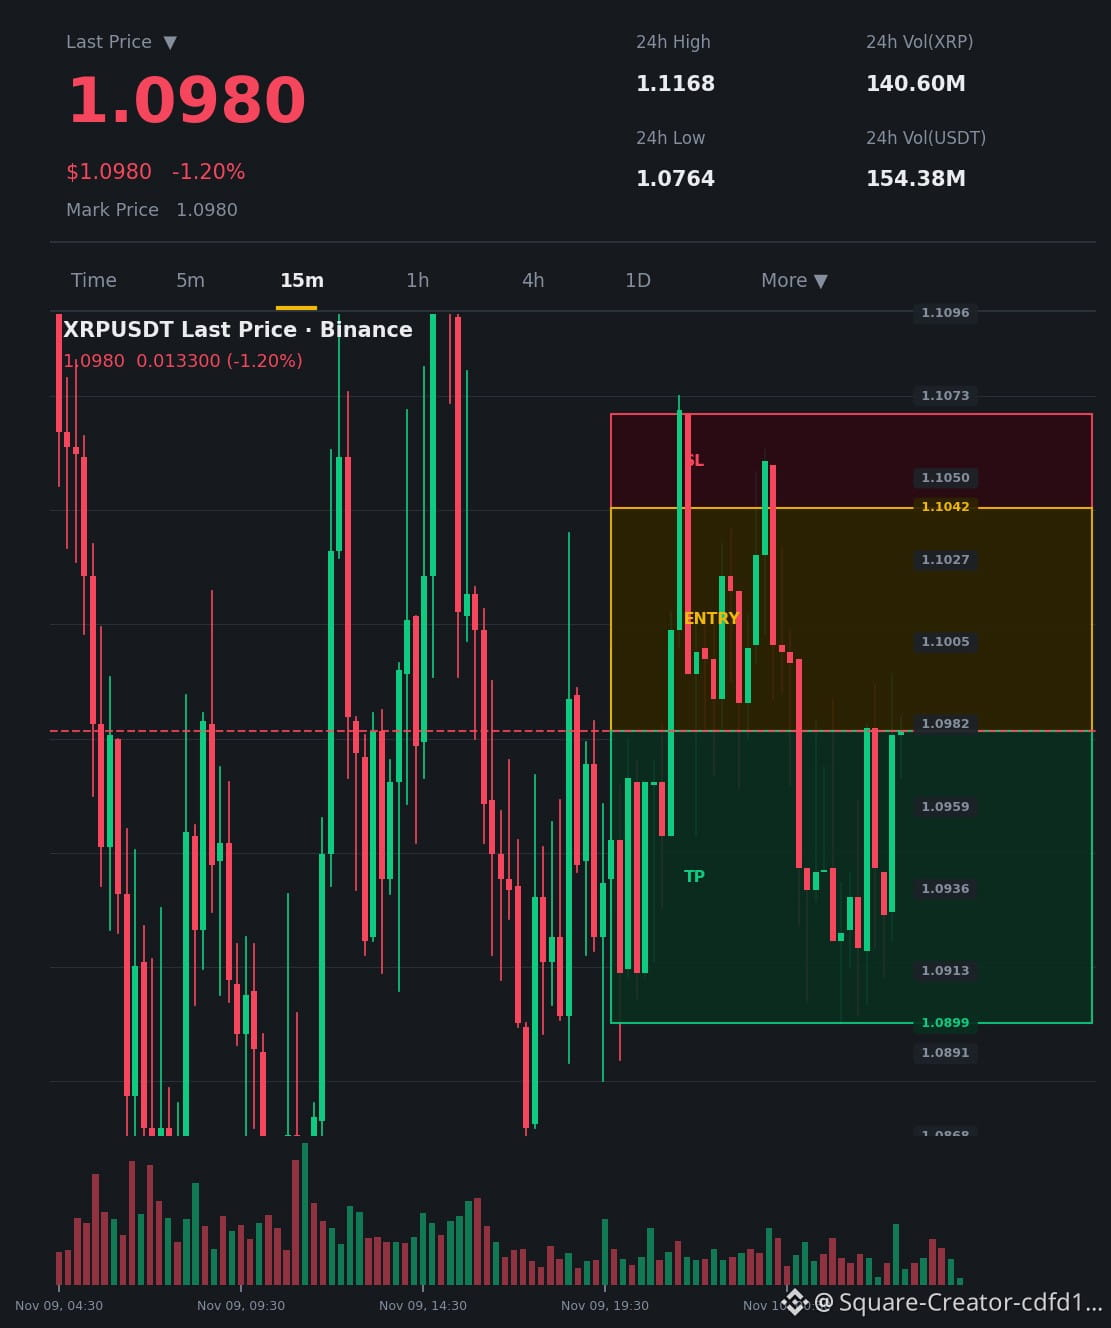
$XRP traps the bulls and prepares for a long-term trap 🔴
$XRP /USDT — Short 🔴
Trading plan:
Entry: 1.098 – 1.1042
Stop loss: 1.1068
Target 1: 1.093
Target 2: 1.0899
Target 3: 1.0764
Why this setup?
Severe contraction in the Bollinger Bandwidth (BBW 0.0144
This content is not investment advice. Do your own research (DYOR)
$XRP traps the bulls and prepares for a long-term trap 🔴
$XRP /USDT — Short 🔴
Trading plan:
Entry: 1.098 – 1.1042
Stop loss: 1.1068
Target 1: 1.093
Target 2: 1.0899
Target 3: 1.0764
Why this setup?
Severe contraction in the Bollinger Bandwidth (BBW 0.0144
This content is not investment advice. Do your own research (DYOR)
$XRP /USDT — Short 🔴
Trading plan:
Entry: 1.098 – 1.1042
Stop loss: 1.1068
Target 1: 1.093
Target 2: 1.0899
Target 3: 1.0764
Why this setup?
Severe contraction in the Bollinger Bandwidth (BBW 0.0144
This content is not investment advice. Do your own research (DYOR)
·
--
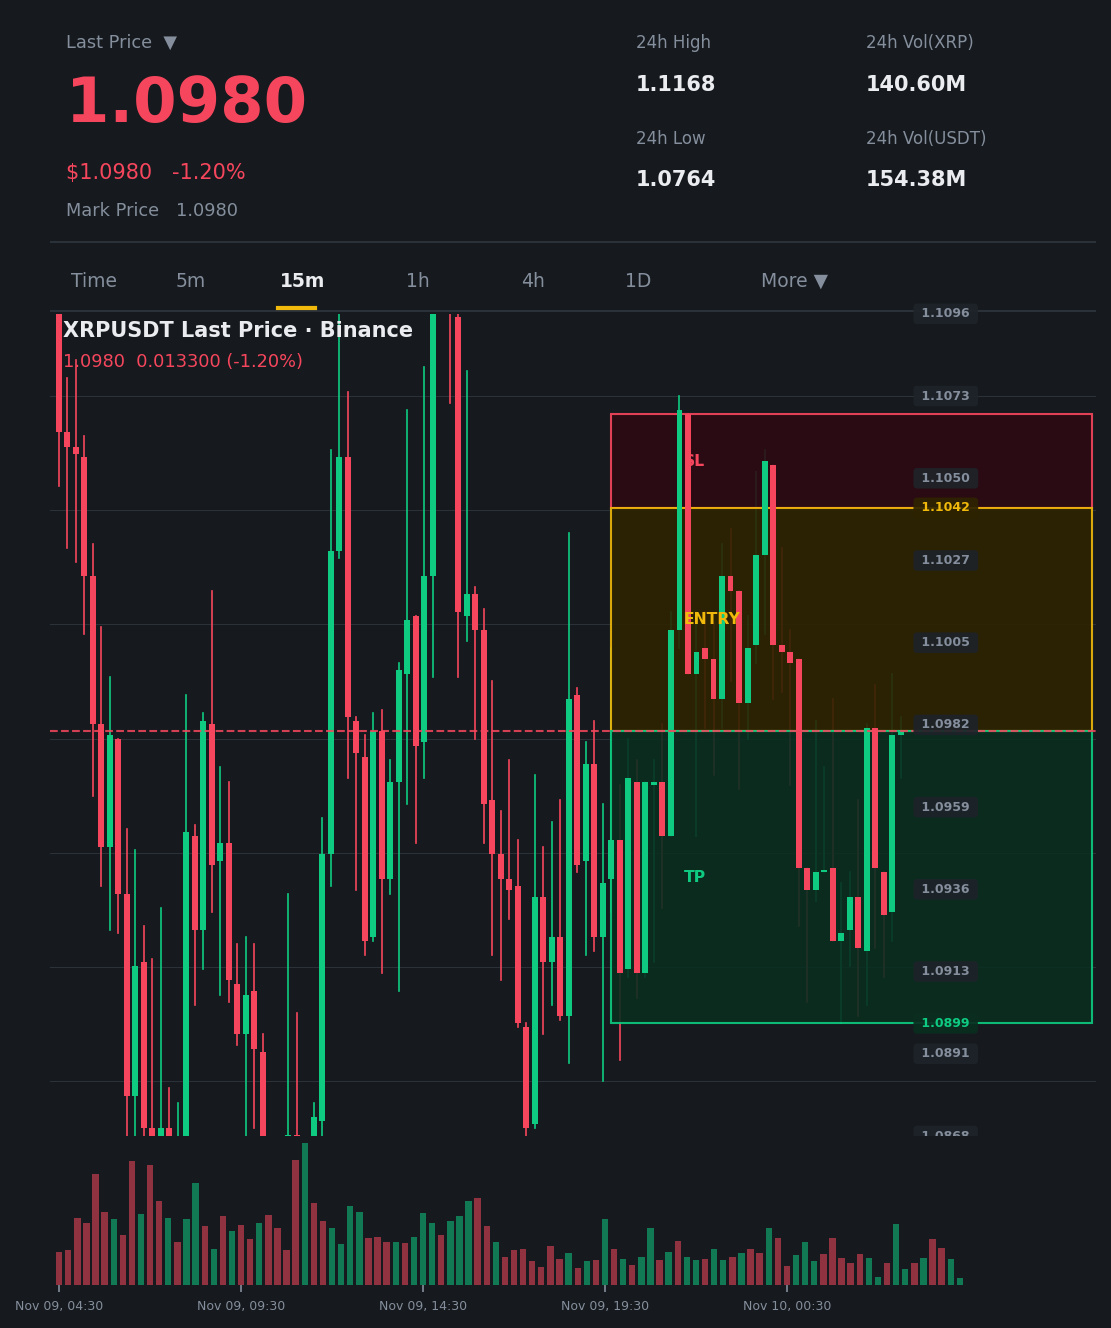
$XRP Traps the bulls and sets up a long-term trap 🔴
$XRP /USDT — Short 🔴
Trading plan:
Entry: 1.098–1.1042
Stop loss: 1.1068
Target 1: 1.093
Target 2: 1.0899
Target 3: 1.0764
Why this setup?
Severe Bollinger Band Width (BBW) contraction (0.0144
This content is not investment advice. Do your own research (DYOR)
$XRP Traps the bulls and sets up a long-term trap 🔴
$XRP /USDT — Short 🔴
Trading plan:
Entry: 1.098–1.1042
Stop loss: 1.1068
Target 1: 1.093
Target 2: 1.0899
Target 3: 1.0764
Why this setup?
Severe Bollinger Band Width (BBW) contraction (0.0144
This content is not investment advice. Do your own research (DYOR)
$XRP /USDT — Short 🔴
Trading plan:
Entry: 1.098–1.1042
Stop loss: 1.1068
Target 1: 1.093
Target 2: 1.0899
Target 3: 1.0764
Why this setup?
Severe Bollinger Band Width (BBW) contraction (0.0144
This content is not investment advice. Do your own research (DYOR)
·
--
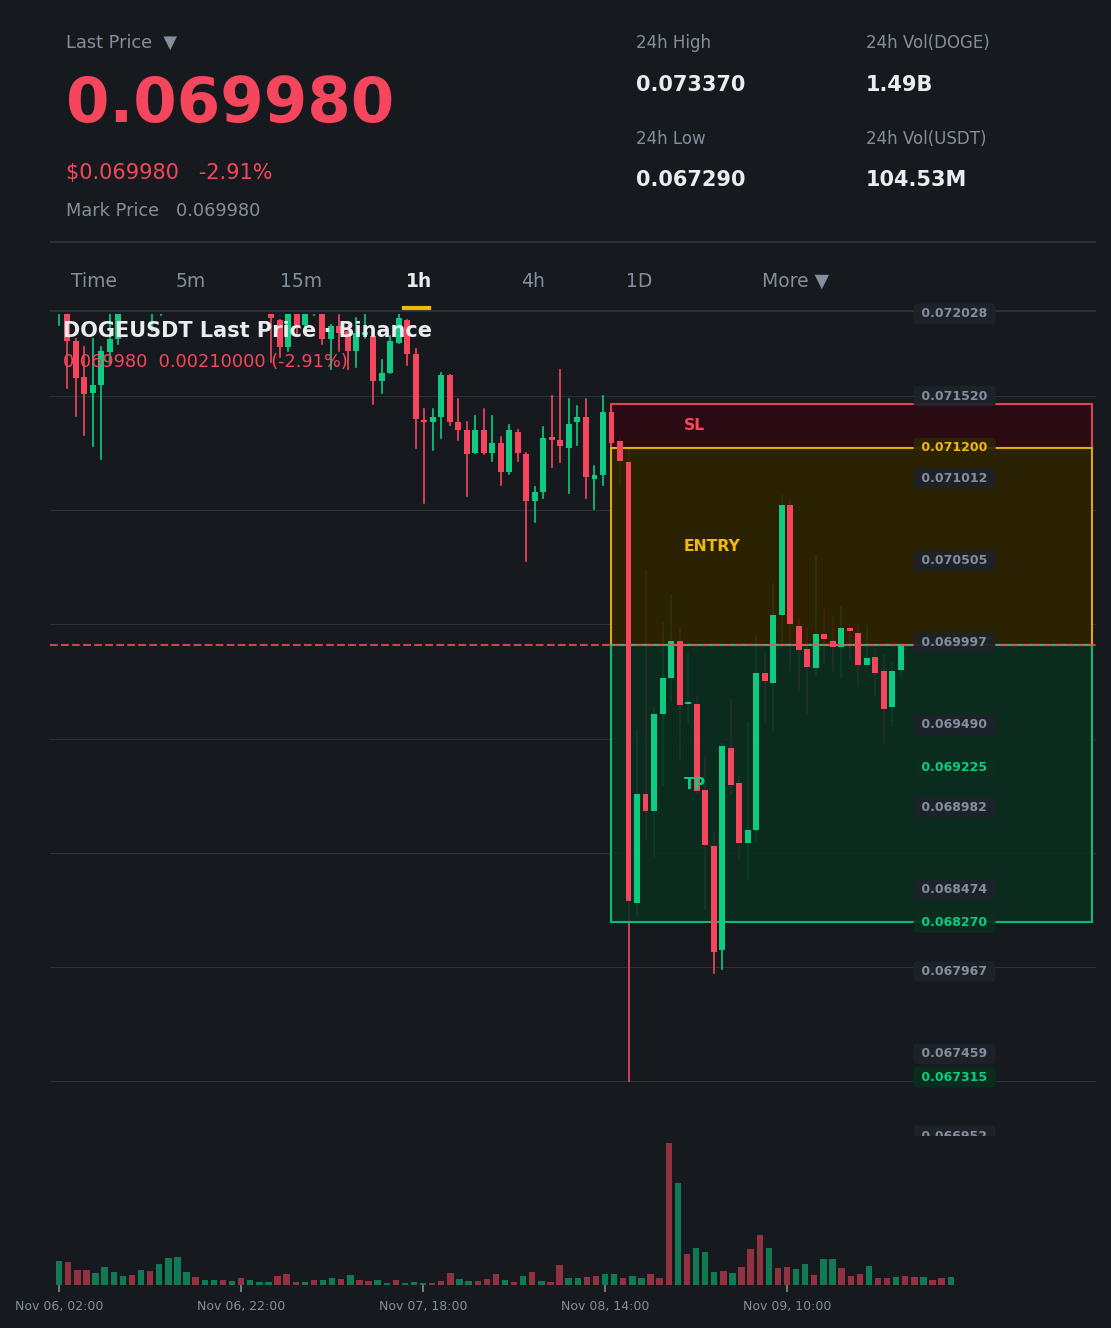
$DOGE A long-term trap is about to explode 🔴
$DOGE /USDT — Short 🔴
Trading plan:
Entry: 0.06998 – 0.0712
Stop loss: 0.071473
Target 1: 0.069225
Target 2: 0.06827
Target 3: 0.067315
Why this setup?
A Bollinger Band width of 0.0252 indicates extreme tightness before a move
OBV and rising cumulative trading volume confirm whale accumulation
A 71.96% long ratio means imminent selling pressure on the bulls
Have you activated the sell order to capture profits toward 0.069225, or will you wait?
This content is not investment advice. Do your own research (DYOR)
$DOGE A long-term trap is about to explode 🔴
$DOGE /USDT — Short 🔴
Trading plan:
Entry: 0.06998 – 0.0712
Stop loss: 0.071473
Target 1: 0.069225
Target 2: 0.06827
Target 3: 0.067315
Why this setup?
A Bollinger Band width of 0.0252 indicates extreme tightness before a move
OBV and rising cumulative trading volume confirm whale accumulation
A 71.96% long ratio means imminent selling pressure on the bulls
Have you activated the sell order to capture profits toward 0.069225, or will you wait?
This content is not investment advice. Do your own research (DYOR)
$DOGE /USDT — Short 🔴
Trading plan:
Entry: 0.06998 – 0.0712
Stop loss: 0.071473
Target 1: 0.069225
Target 2: 0.06827
Target 3: 0.067315
Why this setup?
A Bollinger Band width of 0.0252 indicates extreme tightness before a move
OBV and rising cumulative trading volume confirm whale accumulation
A 71.96% long ratio means imminent selling pressure on the bulls
Have you activated the sell order to capture profits toward 0.069225, or will you wait?
This content is not investment advice. Do your own research (DYOR)
7
·
--
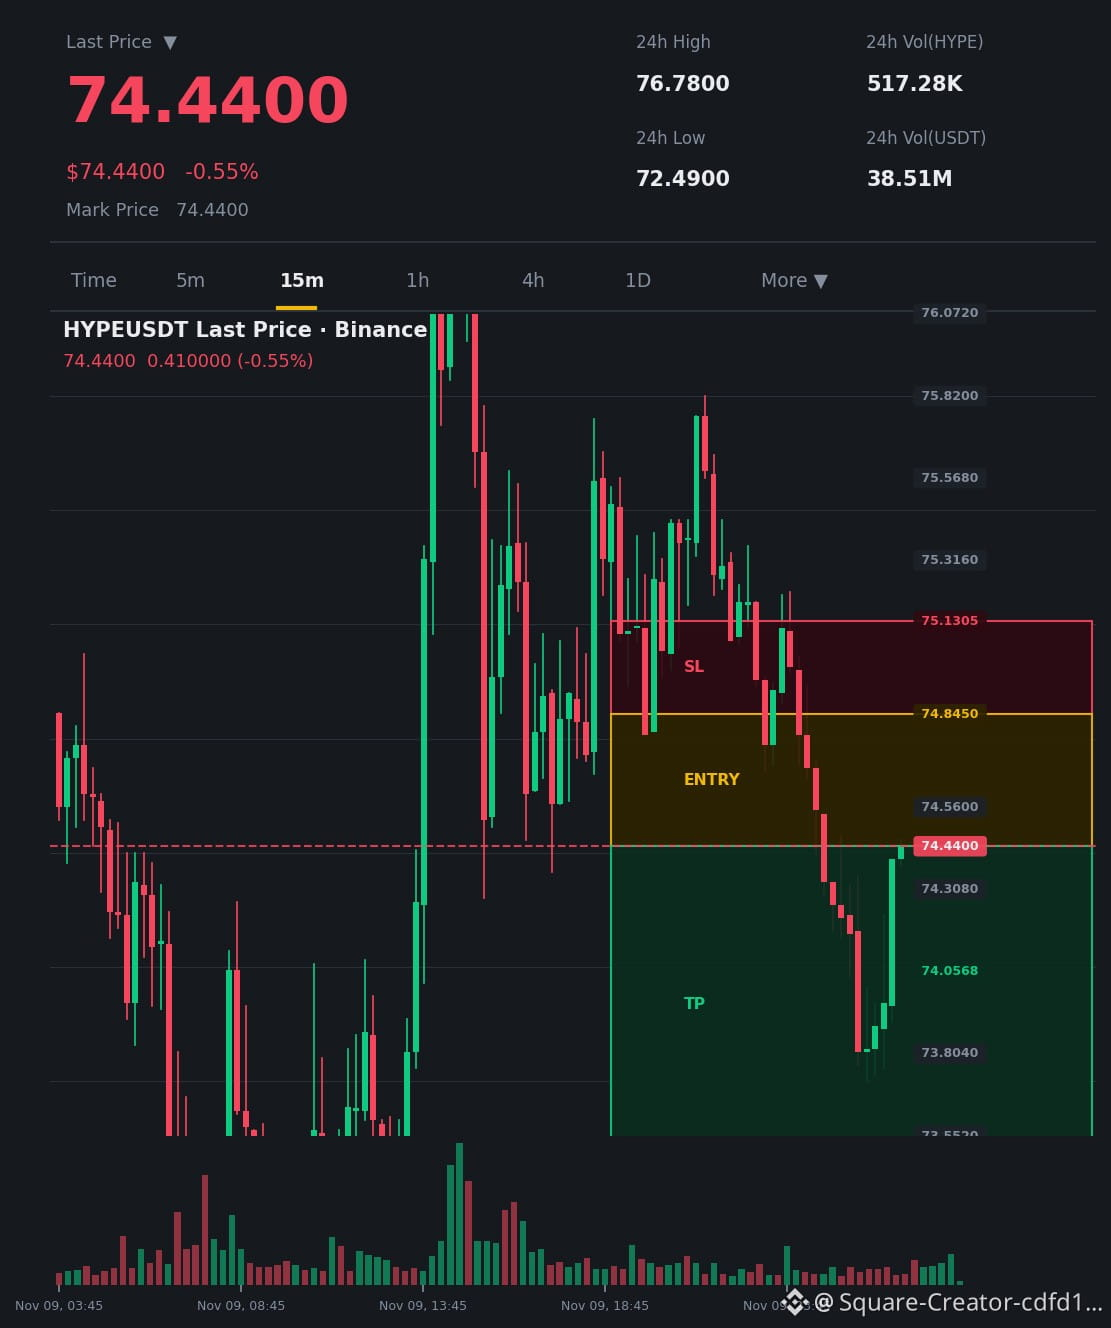
$HYPE Bears are piling in before a sharp reversal 🔴
$HYPE /USDT — Short 🔴
Trading plan:
Entry: 74.44 – 74.845
75.1305: 75.1305
74.0568: 74.0568
73.4712: 73.4712
72.6316: 72.6316
Why this setup?
The Bollinger Band Width is very tight (BBW 0.0246), indicating imminent pressure.
Rising OBV and a 61.73% dominance of long positions increase the likelihood of a buyer stop hunt.
A long-to-short ratio of 1.613 means the market is weighed down by longs
This content is not investment advice. Do your own research (DYOR)
$HYPE Bears are piling in before a sharp reversal 🔴
$HYPE /USDT — Short 🔴
Trading plan:
Entry: 74.44 – 74.845
75.1305: 75.1305
74.0568: 74.0568
73.4712: 73.4712
72.6316: 72.6316
Why this setup?
The Bollinger Band Width is very tight (BBW 0.0246), indicating imminent pressure.
Rising OBV and a 61.73% dominance of long positions increase the likelihood of a buyer stop hunt.
A long-to-short ratio of 1.613 means the market is weighed down by longs
This content is not investment advice. Do your own research (DYOR)
$HYPE /USDT — Short 🔴
Trading plan:
Entry: 74.44 – 74.845
75.1305: 75.1305
74.0568: 74.0568
73.4712: 73.4712
72.6316: 72.6316
Why this setup?
The Bollinger Band Width is very tight (BBW 0.0246), indicating imminent pressure.
Rising OBV and a 61.73% dominance of long positions increase the likelihood of a buyer stop hunt.
A long-to-short ratio of 1.613 means the market is weighed down by longs
This content is not investment advice. Do your own research (DYOR)
·
--
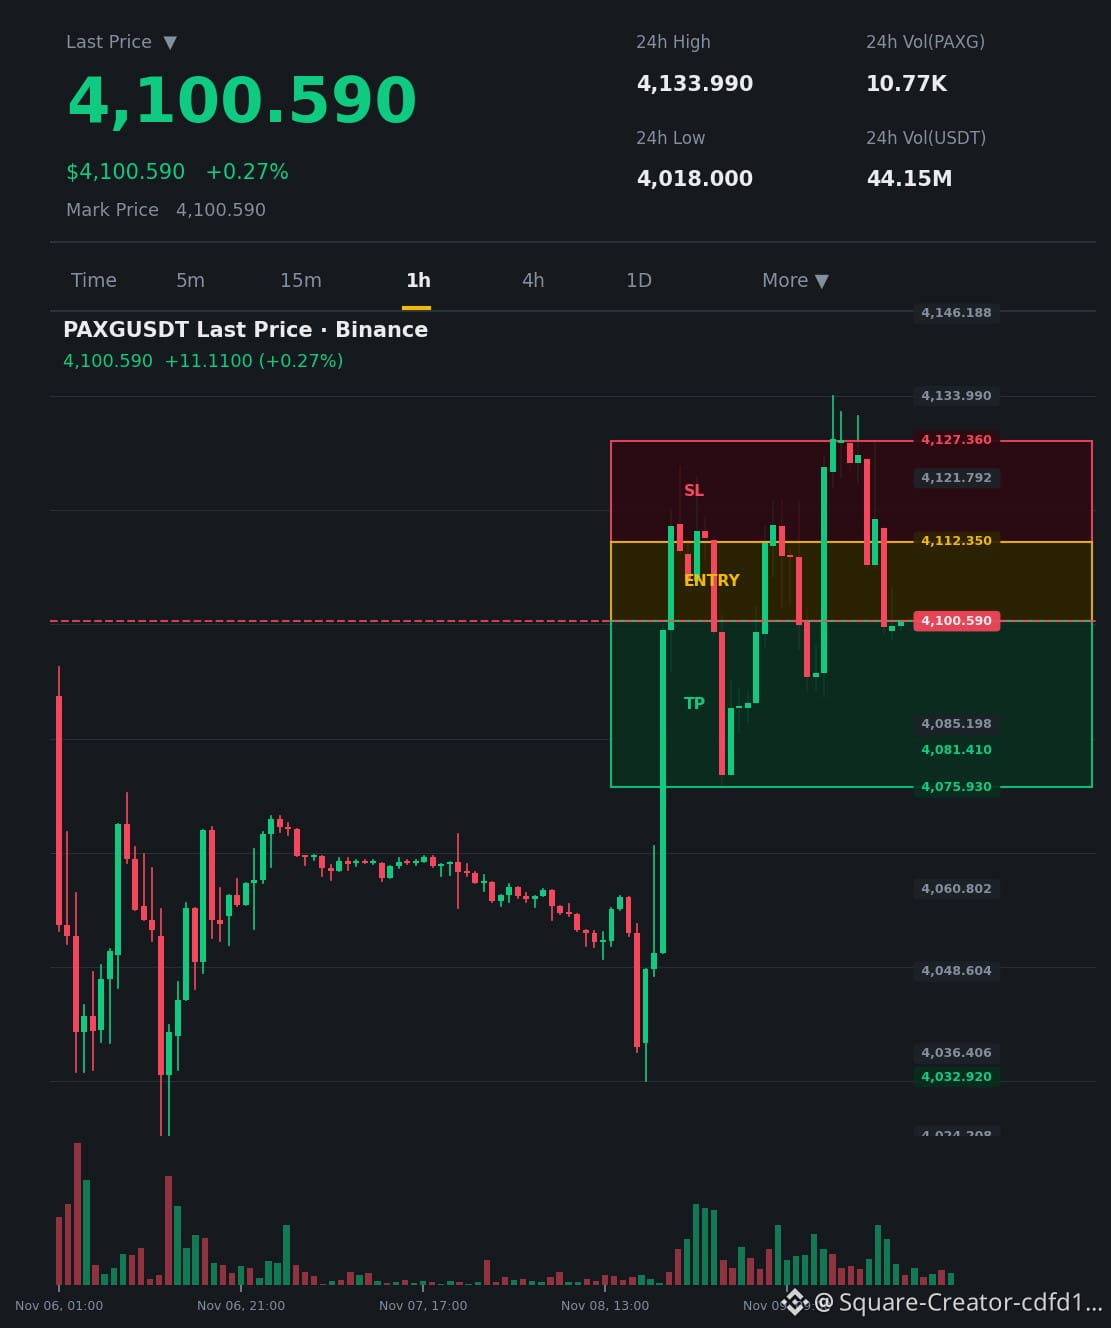
$PAXG The bull trap is about to explode!
$PAXG /USDT — Short 🔴
Trading plan:
Entry: 4100.59 – 4112.35
Stop loss: 4127.36
Target 1: 4081.41
Target 2: 4075.93
Target 3: 4032.92
Why this setup?
The Bollinger Band width is extremely tight at 0.0128, signaling imminent price compression
The OBV trend is upward, with smart money accumulating at these levels
The long position ratio of 72.77% indicates dangerous buying overcrowding, fueling a brutal sell-off
Activate the sell order now to seize profits toward the first target at 4081.41. Have you entered the trade, or will you watch it pass you by? 👇
$PAXG (Reminder: Timeframe: 1h | Event: Whale Accumulation Squeeze)
This content is not investment advice. Do your own research (DYOR)
$PAXG The bull trap is about to explode!
$PAXG /USDT — Short 🔴
Trading plan:
Entry: 4100.59 – 4112.35
Stop loss: 4127.36
Target 1: 4081.41
Target 2: 4075.93
Target 3: 4032.92
Why this setup?
The Bollinger Band width is extremely tight at 0.0128, signaling imminent price compression
The OBV trend is upward, with smart money accumulating at these levels
The long position ratio of 72.77% indicates dangerous buying overcrowding, fueling a brutal sell-off
Activate the sell order now to seize profits toward the first target at 4081.41. Have you entered the trade, or will you watch it pass you by? 👇
$PAXG (Reminder: Timeframe: 1h | Event: Whale Accumulation Squeeze)
This content is not investment advice. Do your own research (DYOR)
$PAXG /USDT — Short 🔴
Trading plan:
Entry: 4100.59 – 4112.35
Stop loss: 4127.36
Target 1: 4081.41
Target 2: 4075.93
Target 3: 4032.92
Why this setup?
The Bollinger Band width is extremely tight at 0.0128, signaling imminent price compression
The OBV trend is upward, with smart money accumulating at these levels
The long position ratio of 72.77% indicates dangerous buying overcrowding, fueling a brutal sell-off
Activate the sell order now to seize profits toward the first target at 4081.41. Have you entered the trade, or will you watch it pass you by? 👇
$PAXG (Reminder: Timeframe: 1h | Event: Whale Accumulation Squeeze)
This content is not investment advice. Do your own research (DYOR)
·
--
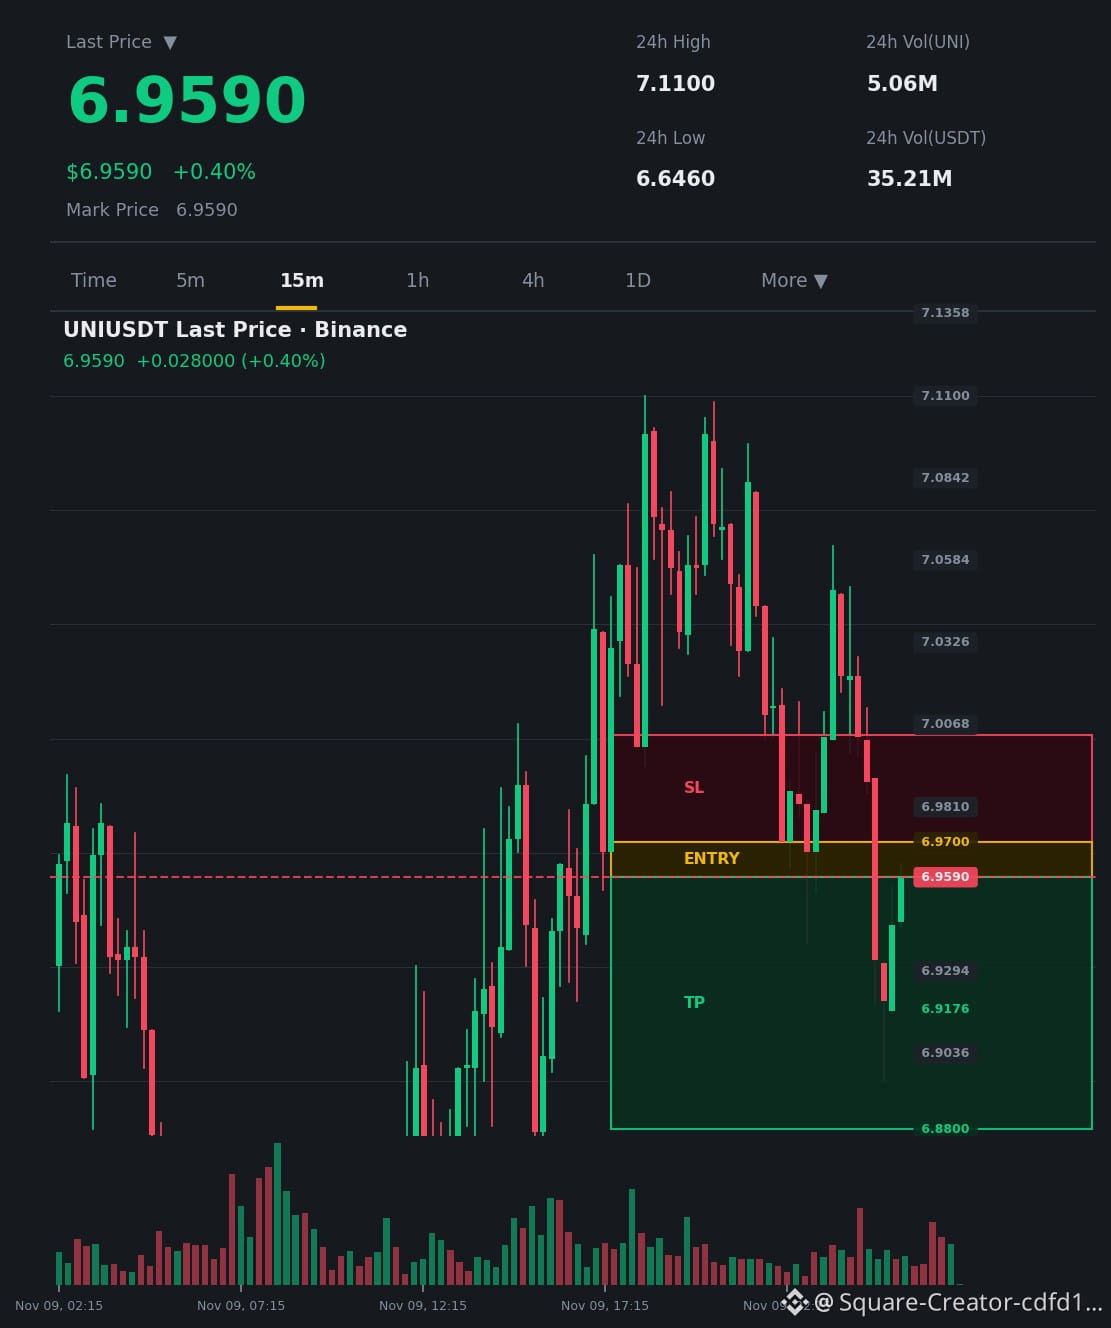
$UNI Trapping buyers with a fiery sell trade! 🔴
$UNI /USDT — Short 🔴
Trading plan:
Entry: 6.959 – 6.97
Stop loss: 7.0036
Target 1: 6.9176
Target 2: 6.88
Target 3: 6.712
Why this setup?
BBW at 0.0233 signals volatility contraction before a breakout.
Rising OBV with low trading volume supports whale pressure.
Longs at 61.25% risk a counter-squeeze and liquidity sweep.
Place your sell order now to capture the drop toward 6.9176. Are you in the trade, or will you wait until the opportunity passes you by? 👇
$UNI (Reminder: Timeframe: 15m | Event: Whale Accumulation Squeeze)
This content is not investment advice. Do your own research (DYOR)
$UNI Trapping buyers with a fiery sell trade! 🔴
$UNI /USDT — Short 🔴
Trading plan:
Entry: 6.959 – 6.97
Stop loss: 7.0036
Target 1: 6.9176
Target 2: 6.88
Target 3: 6.712
Why this setup?
BBW at 0.0233 signals volatility contraction before a breakout.
Rising OBV with low trading volume supports whale pressure.
Longs at 61.25% risk a counter-squeeze and liquidity sweep.
Place your sell order now to capture the drop toward 6.9176. Are you in the trade, or will you wait until the opportunity passes you by? 👇
$UNI (Reminder: Timeframe: 15m | Event: Whale Accumulation Squeeze)
This content is not investment advice. Do your own research (DYOR)
$UNI /USDT — Short 🔴
Trading plan:
Entry: 6.959 – 6.97
Stop loss: 7.0036
Target 1: 6.9176
Target 2: 6.88
Target 3: 6.712
Why this setup?
BBW at 0.0233 signals volatility contraction before a breakout.
Rising OBV with low trading volume supports whale pressure.
Longs at 61.25% risk a counter-squeeze and liquidity sweep.
Place your sell order now to capture the drop toward 6.9176. Are you in the trade, or will you wait until the opportunity passes you by? 👇
$UNI (Reminder: Timeframe: 15m | Event: Whale Accumulation Squeeze)
This content is not investment advice. Do your own research (DYOR)
1
·
--
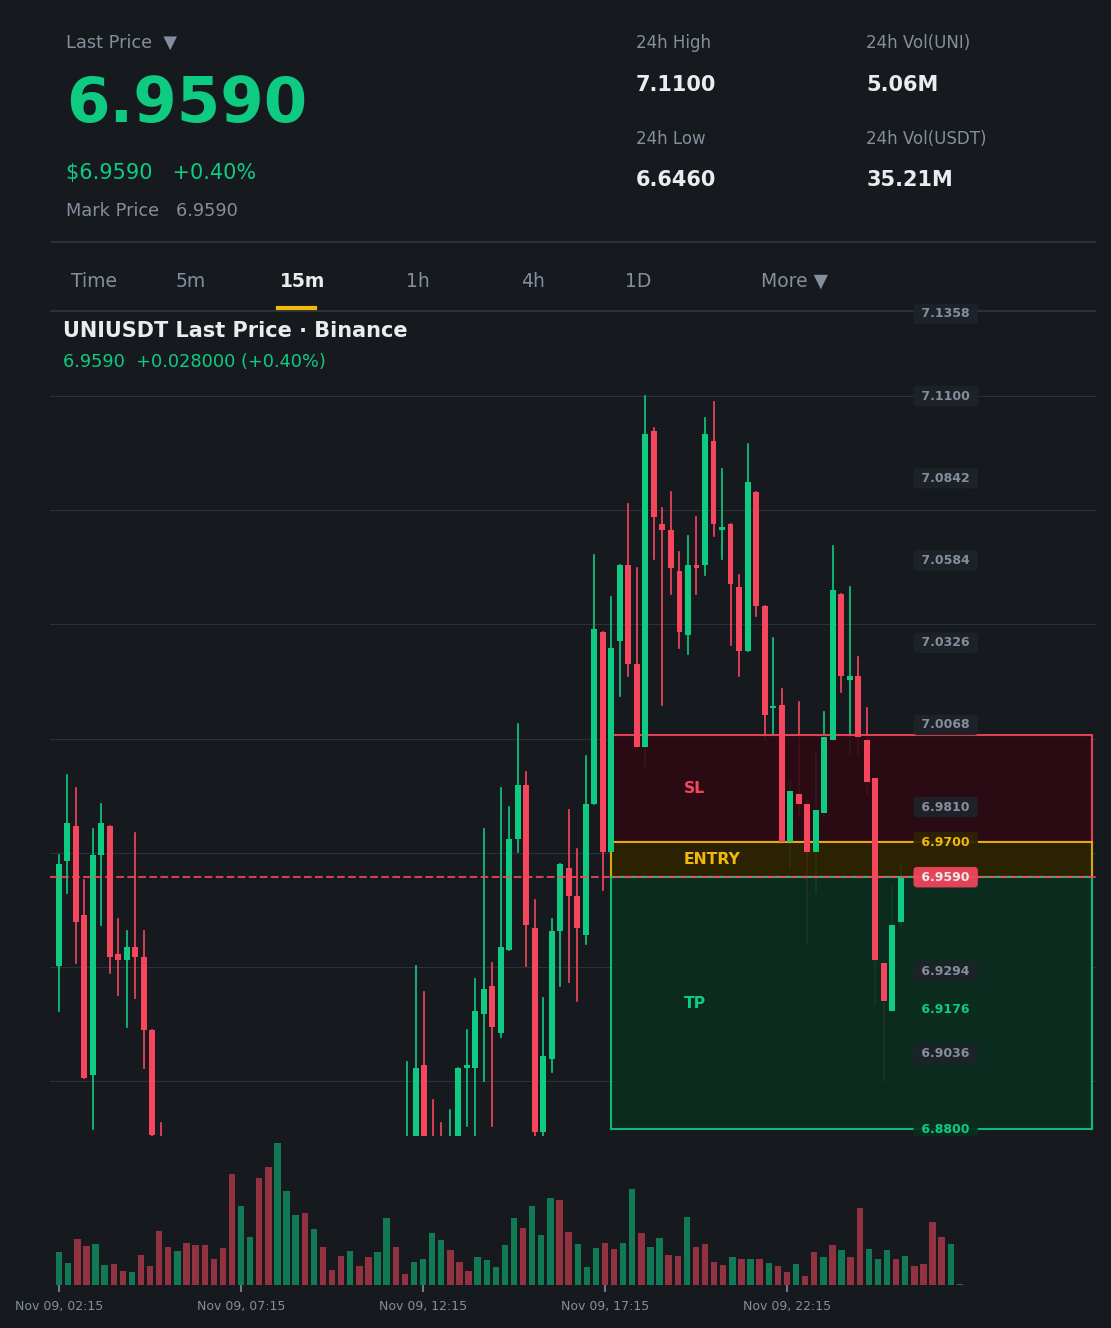
$UNI Trap buyers with a fiery sell trade! 🔴
$UNI /USDT — Short 🔴
Trading plan:
Entry: 6.959 – 6.97
Stop loss: 7.0036
Target 1: 6.9176
Target 2: 6.88
Target 3: 6.712
Why this setup?
BBW at 0.0233 indicates volatility contraction before a breakout.
Rising OBV with low trading volume supports whale pressure.
Longs at 61.25% threaten a reverse buying squeeze and liquidity sweep.
Place the sell order now to capture profits from the drop toward 6.9176. Have you entered the trade, or will you wait until you miss the opportunity? 👇
$UNI (Reminder: Timeframe: 15m | Event: Whale Accumulation Squeeze)
This content is not investment advice. Do your own research (DYOR)
$UNI Trap buyers with a fiery sell trade! 🔴
$UNI /USDT — Short 🔴
Trading plan:
Entry: 6.959 – 6.97
Stop loss: 7.0036
Target 1: 6.9176
Target 2: 6.88
Target 3: 6.712
Why this setup?
BBW at 0.0233 indicates volatility contraction before a breakout.
Rising OBV with low trading volume supports whale pressure.
Longs at 61.25% threaten a reverse buying squeeze and liquidity sweep.
Place the sell order now to capture profits from the drop toward 6.9176. Have you entered the trade, or will you wait until you miss the opportunity? 👇
$UNI (Reminder: Timeframe: 15m | Event: Whale Accumulation Squeeze)
This content is not investment advice. Do your own research (DYOR)
$UNI /USDT — Short 🔴
Trading plan:
Entry: 6.959 – 6.97
Stop loss: 7.0036
Target 1: 6.9176
Target 2: 6.88
Target 3: 6.712
Why this setup?
BBW at 0.0233 indicates volatility contraction before a breakout.
Rising OBV with low trading volume supports whale pressure.
Longs at 61.25% threaten a reverse buying squeeze and liquidity sweep.
Place the sell order now to capture profits from the drop toward 6.9176. Have you entered the trade, or will you wait until you miss the opportunity? 👇
$UNI (Reminder: Timeframe: 15m | Event: Whale Accumulation Squeeze)
This content is not investment advice. Do your own research (DYOR)
14
·
--
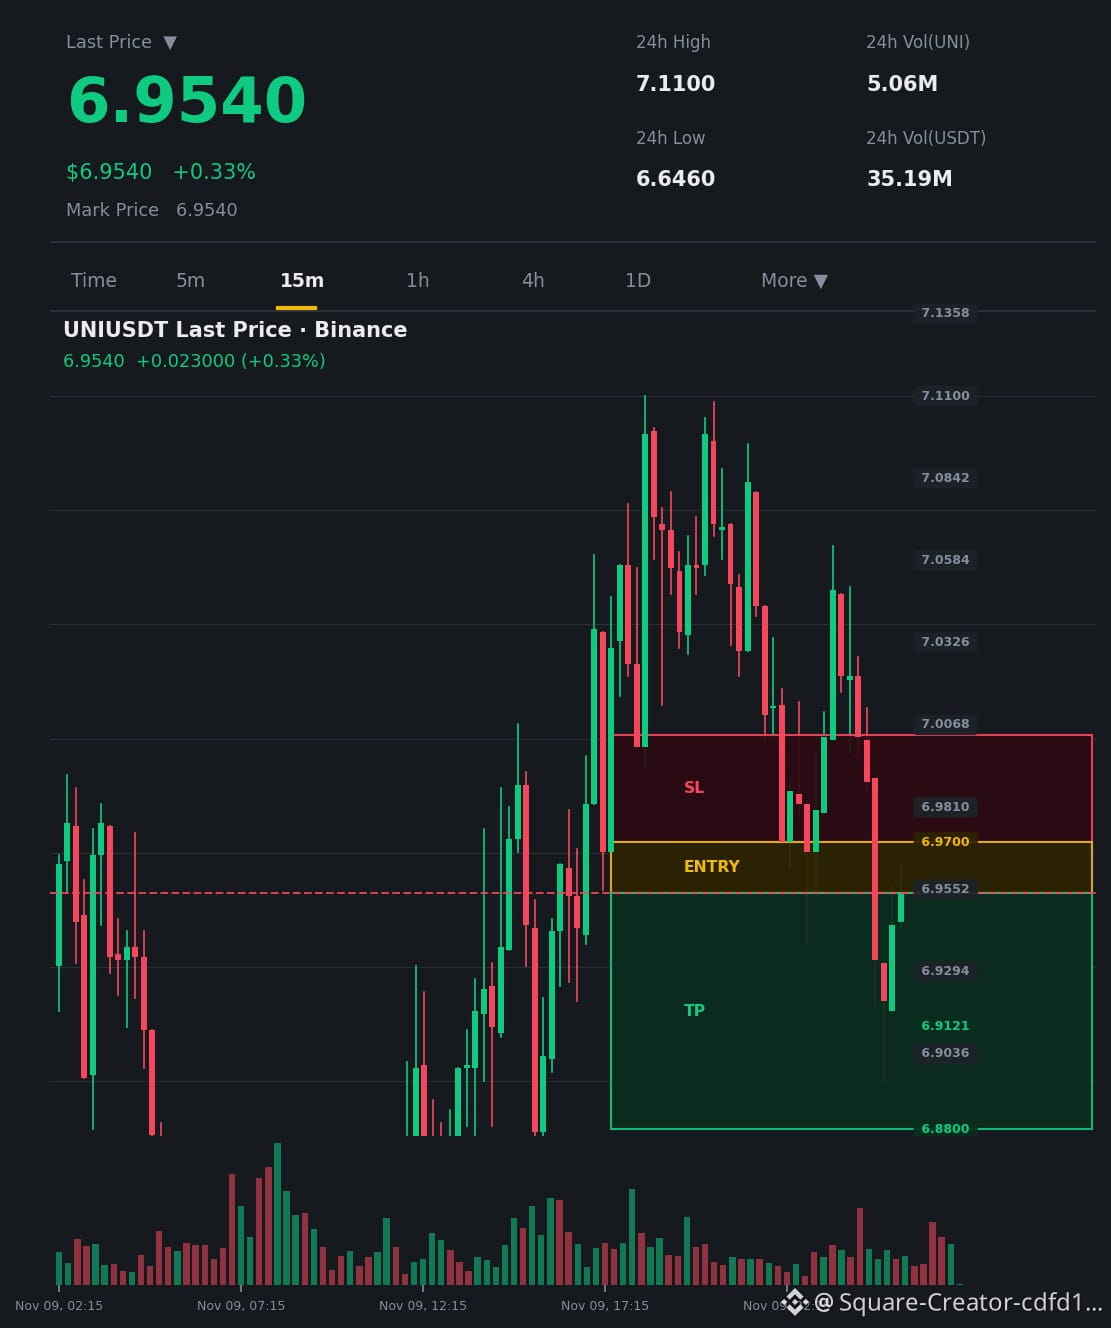
$UNI A bull trap is setting up on the 15-minute timeframe!
$UNI /USDT — Short 🔴
Trading plan:
Entry: 6.954 – 6.97
Stop loss: 7.0036
Target 1: 6.9121
Target 2: 6.88
Target 3: 6.7095
Why this setup?
Bollinger Band Width (BBW) contraction at 0.0235 signals a sharp move ahead.
The rising OBV trend, with buyers dominating at 61.25%, increases the likelihood of short-selling pressure.
Severely overbought conditions threaten a sudden drop toward 6.9121.
Enter a sell order now to capture the move down toward the first target at 6.9121. Will you seize the opportunity before it’s too late? 👇
$UNI Reminder: Timeframe: 15m | Event: Whale Accumulation Squeeze
This content is not investment advice. Do your own research (DYOR)
$UNI A bull trap is setting up on the 15-minute timeframe!
$UNI /USDT — Short 🔴
Trading plan:
Entry: 6.954 – 6.97
Stop loss: 7.0036
Target 1: 6.9121
Target 2: 6.88
Target 3: 6.7095
Why this setup?
Bollinger Band Width (BBW) contraction at 0.0235 signals a sharp move ahead.
The rising OBV trend, with buyers dominating at 61.25%, increases the likelihood of short-selling pressure.
Severely overbought conditions threaten a sudden drop toward 6.9121.
Enter a sell order now to capture the move down toward the first target at 6.9121. Will you seize the opportunity before it’s too late? 👇
$UNI Reminder: Timeframe: 15m | Event: Whale Accumulation Squeeze
This content is not investment advice. Do your own research (DYOR)
$UNI /USDT — Short 🔴
Trading plan:
Entry: 6.954 – 6.97
Stop loss: 7.0036
Target 1: 6.9121
Target 2: 6.88
Target 3: 6.7095
Why this setup?
Bollinger Band Width (BBW) contraction at 0.0235 signals a sharp move ahead.
The rising OBV trend, with buyers dominating at 61.25%, increases the likelihood of short-selling pressure.
Severely overbought conditions threaten a sudden drop toward 6.9121.
Enter a sell order now to capture the move down toward the first target at 6.9121. Will you seize the opportunity before it’s too late? 👇
$UNI Reminder: Timeframe: 15m | Event: Whale Accumulation Squeeze
This content is not investment advice. Do your own research (DYOR)
Log in to explore more content
Join global crypto users on Binance Square
⚡️ Get latest and useful information about crypto.
💬 Trusted by the world’s largest crypto exchange.
👍 Discover real insights from verified creators.
Email / Phone number
Trending Topics
HotCPIDecemberHikePriced
56,106 views
844 Discussing
CPI Market Watch | US CPI Rises 0.4% in October, Hotter Than 0.3% Forecast
Binance News
·23 Likes
·39k views
AnthropicRejectsIPODelayValuationinQuestion
189,873 views
1,654 Discussing
NvidiaInvestigatesAfterHuang’sAffairApology
467,683 views
3,097 Discussing