
Danking-
15 Posts

Danking-
Report
Block User
我是天禄狙击手danking 太阳神给我跪下
5 Following
1.9K+ Followers
140 Liked
Posts
·
--
Sentiment snapshot: $SOL The long/short ratio across all accounts is 3.48, with more accounts positioned long.
When the long/short ratio and funding rate both point in the same direction, positioning is more crowded and the risk of a contrarian shakeout is higher.
Sentiment snapshot: $SOL The long/short ratio across all accounts is 3.48, with more accounts positioned long.
When the long/short ratio and funding rate both point in the same direction, positioning is more crowded and the risk of a contrarian shakeout is higher.
When the long/short ratio and funding rate both point in the same direction, positioning is more crowded and the risk of a contrarian shakeout is higher.
1
144
·
--
The trend is turning upward.
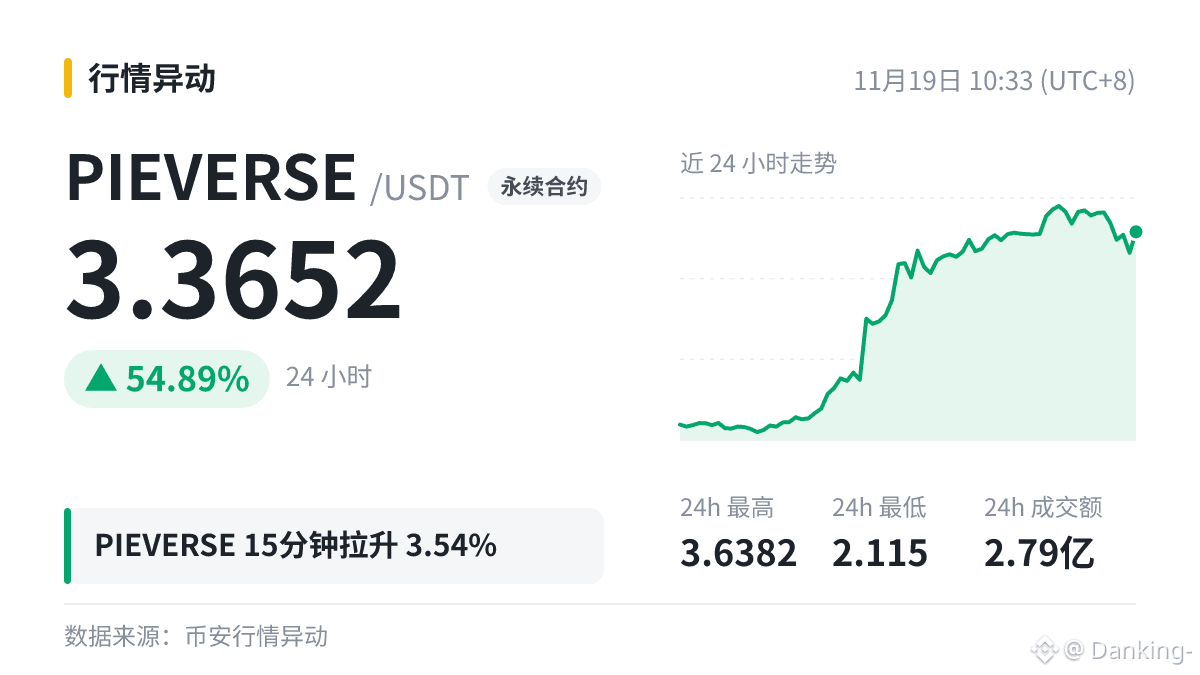
$PIEVERSE 15-minute surge +3.54%, current price 3.3652 (24h +54.89%).
Don't make decisions when emotions are at their peak.
The trend is turning upward.
$PIEVERSE 15-minute surge +3.54%, current price 3.3652 (24h +54.89%).
Don't make decisions when emotions are at their peak.
$PIEVERSE 15-minute surge +3.54%, current price 3.3652 (24h +54.89%).
Don't make decisions when emotions are at their peak.
129
·
--
$PUMP |Daily RSI(14) 24.9|Oversold
Before discussing funds, let’s first understand RSI.
The 14 in RSI refers to 14 candlesticks: on a 4-hour chart, it covers a little over two days (56 hours), while on a daily chart, it covers two weeks.
Extreme readings on longer timeframes generally matter more than those on shorter timeframes. Readings on the 4-hour timeframe occur more often, and there’s more noise as well.
Several indicators confirming one another is more reliable than looking at just one, but even more signals can’t provide a definitive conclusion.
#PUMP
$PUMP |Daily RSI(14) 24.9|Oversold
Before discussing funds, let’s first understand RSI.
The 14 in RSI refers to 14 candlesticks: on a 4-hour chart, it covers a little over two days (56 hours), while on a daily chart, it covers two weeks.
Extreme readings on longer timeframes generally matter more than those on shorter timeframes. Readings on the 4-hour timeframe occur more often, and there’s more noise as well.
Several indicators confirming one another is more reliable than looking at just one, but even more signals can’t provide a definitive conclusion.
#PUMP
Before discussing funds, let’s first understand RSI.
The 14 in RSI refers to 14 candlesticks: on a 4-hour chart, it covers a little over two days (56 hours), while on a daily chart, it covers two weeks.
Extreme readings on longer timeframes generally matter more than those on shorter timeframes. Readings on the 4-hour timeframe occur more often, and there’s more noise as well.
Several indicators confirming one another is more reliable than looking at just one, but even more signals can’t provide a definitive conclusion.
#PUMP
181
·
--
Unbelievable!
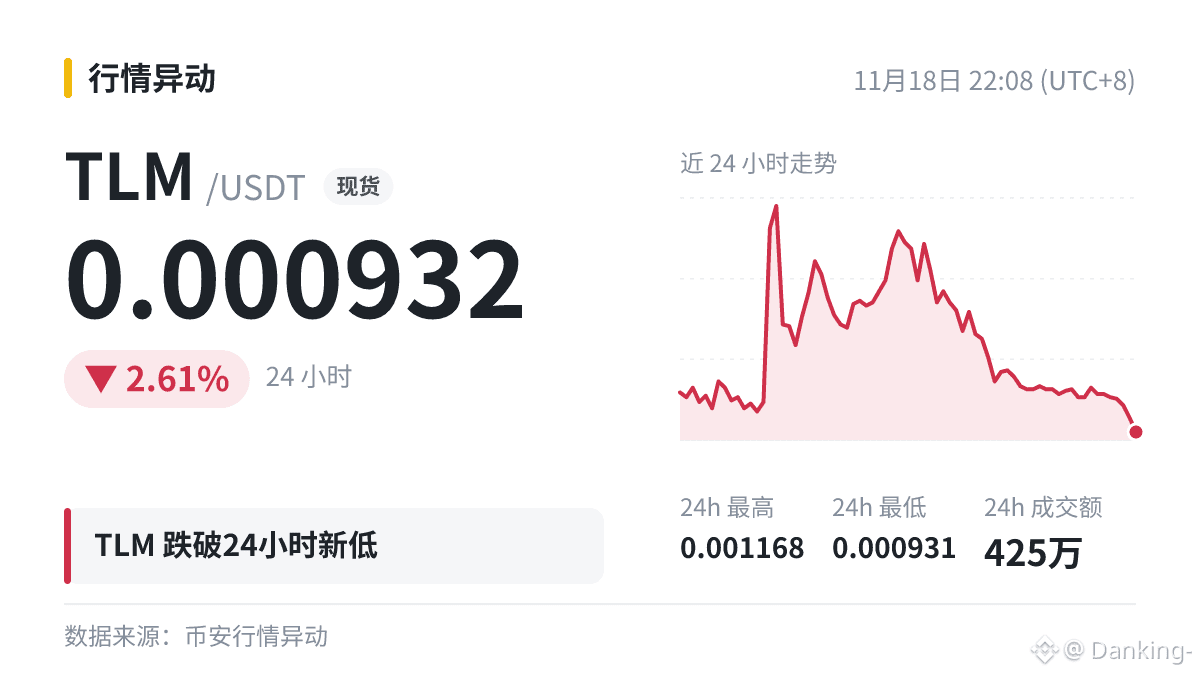
$TLM has broken below support—the 24-hour low has been breached!
Current price: 0.000932; the previous low of 0.000936 couldn't hold…
A big drop doesn't mean it's hit bottom. Wait patiently for a signal. Buy the dip or wait a little longer?
Unbelievable!
$TLM has broken below support—the 24-hour low has been breached!
Current price: 0.000932; the previous low of 0.000936 couldn't hold…
A big drop doesn't mean it's hit bottom. Wait patiently for a signal. Buy the dip or wait a little longer?
$TLM has broken below support—the 24-hour low has been breached!
Current price: 0.000932; the previous low of 0.000936 couldn't hold…
A big drop doesn't mean it's hit bottom. Wait patiently for a signal. Buy the dip or wait a little longer?
1
397
·
--
What are the big players doing?
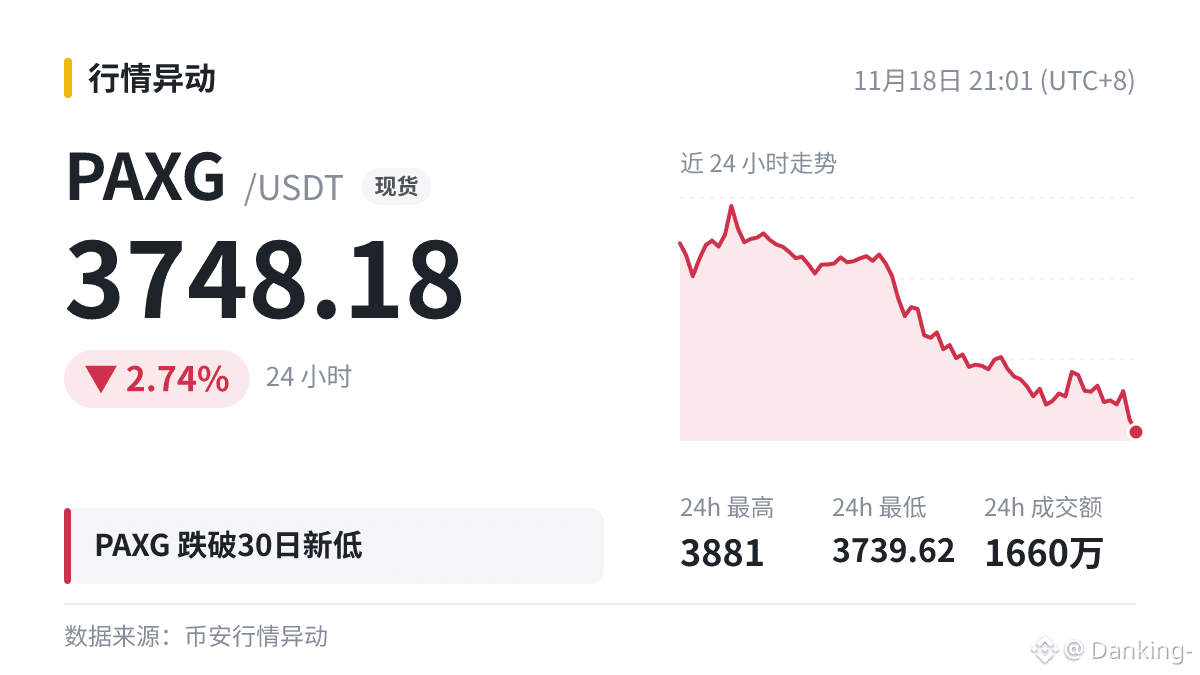
A new $PAXG 30-day low: current price 3748.18, previous low 3751.24, down 2.74% over 24h.
There’s still no meaningful buying support near the new low, and large orders are mostly being pulled. Don’t rush to buy the dip.
Where’s your line in the sand?
What are the big players doing?
A new $PAXG 30-day low: current price 3748.18, previous low 3751.24, down 2.74% over 24h.
There’s still no meaningful buying support near the new low, and large orders are mostly being pulled. Don’t rush to buy the dip.
Where’s your line in the sand?
A new $PAXG 30-day low: current price 3748.18, previous low 3751.24, down 2.74% over 24h.
There’s still no meaningful buying support near the new low, and large orders are mostly being pulled. Don’t rush to buy the dip.
Where’s your line in the sand?
307
·
--
$Lobster | Breaking through 0.015
Before looking at your position, first understand the key price levels.
A support level is a price range where the price has repeatedly found support as it falls. A resistance level is a range where the price has repeatedly stalled as it rises.
When the price returns to a level after several days, people who bought there before may break even and exit or add to their positions, so trading activity often picks up.
Understanding an indicator helps you avoid being spooked by a single number; it’s not for predicting whether prices will rise or fall.
$Lobster | Breaking through 0.015
Before looking at your position, first understand the key price levels.
A support level is a price range where the price has repeatedly found support as it falls. A resistance level is a range where the price has repeatedly stalled as it rises.
When the price returns to a level after several days, people who bought there before may break even and exit or add to their positions, so trading activity often picks up.
Understanding an indicator helps you avoid being spooked by a single number; it’s not for predicting whether prices will rise or fall.
Before looking at your position, first understand the key price levels.
A support level is a price range where the price has repeatedly found support as it falls. A resistance level is a range where the price has repeatedly stalled as it rises.
When the price returns to a level after several days, people who bought there before may break even and exit or add to their positions, so trading activity often picks up.
Understanding an indicator helps you avoid being spooked by a single number; it’s not for predicting whether prices will rise or fall.
1
438
·
--
The 24-hour contract losers are in, led by $Lobster (-15.52%):
$Lobster -15.52%
$EVAA -14.98%
$STABLE -10.35%
MAGMA -8.76%
JCT -8.37%
I checked my holdings: luckily, only one made the list... Is that good news?
Send this to the friend who always says, “It’s different this time.”
The 24-hour contract losers are in, led by $Lobster (-15.52%):
$Lobster -15.52%
$EVAA -14.98%
$STABLE -10.35%
MAGMA -8.76%
JCT -8.37%
I checked my holdings: luckily, only one made the list... Is that good news?
Send this to the friend who always says, “It’s different this time.”
$Lobster -15.52%
$EVAA -14.98%
$STABLE -10.35%
MAGMA -8.76%
JCT -8.37%
I checked my holdings: luckily, only one made the list... Is that good news?
Send this to the friend who always says, “It’s different this time.”
172
·
--
Contract 24-hour gainers
1) $PIPPIN +34.96%
2) $ICNT +26.12%
3) $PHAROS +17.12%
4) FHE +15.77%
5) ARIA +13.84%
Top gainer: $PIPPIN +34.96%. Like it first, then let's compare answers later.
Contract 24-hour gainers
1) $PIPPIN +34.96%
2) $ICNT +26.12%
3) $PHAROS +17.12%
4) FHE +15.77%
5) ARIA +13.84%
Top gainer: $PIPPIN +34.96%. Like it first, then let's compare answers later.
1) $PIPPIN +34.96%
2) $ICNT +26.12%
3) $PHAROS +17.12%
4) FHE +15.77%
5) ARIA +13.84%
Top gainer: $PIPPIN +34.96%. Like it first, then let's compare answers later.
771
·
--
$PREDICT recommends going long. The repeated delays clearly mean they’re up to something. Just follow the shady market maker’s lead and get rich.
{future}(PREDICTUSDT)
$PREDICT recommends going long. The repeated delays clearly mean they’re up to something. Just follow the shady market maker’s lead and get rich.
536
Log in to explore more content
Join global crypto users on Binance Square
⚡️ Get latest and useful information about crypto.
💬 Trusted by the world’s largest crypto exchange.
👍 Discover real insights from verified creators.
Email / Phone number
Trending Topics
BTCRemainsUnderPressureAfterHawkishFOMCMinutes
57,463 views
807 Discussing
FOMC Minutes | Fed Minutes Show Almost All Officials Expect More Rate Hikes, With Some Open to a Larger December Move
Binance News
·48 Likes
·58.3k views
AnthropicToDebutAfter$83IPOPricing
15,333 views
84 Discussing
NvidiaBoardReportedlySplitOverHuang’sReturn
19,065 views
368 Discussing