
Scan Market Signals
3.2k Posts

Scan Market Signals
Report
Block User
Scanner Pro | Real-Time Binance Signals & Data-Driven TA 📊 Zero FOMO, Pure Execution
6 Following
68 Followers
78 Liked
Posts
All
Quotes
Videos
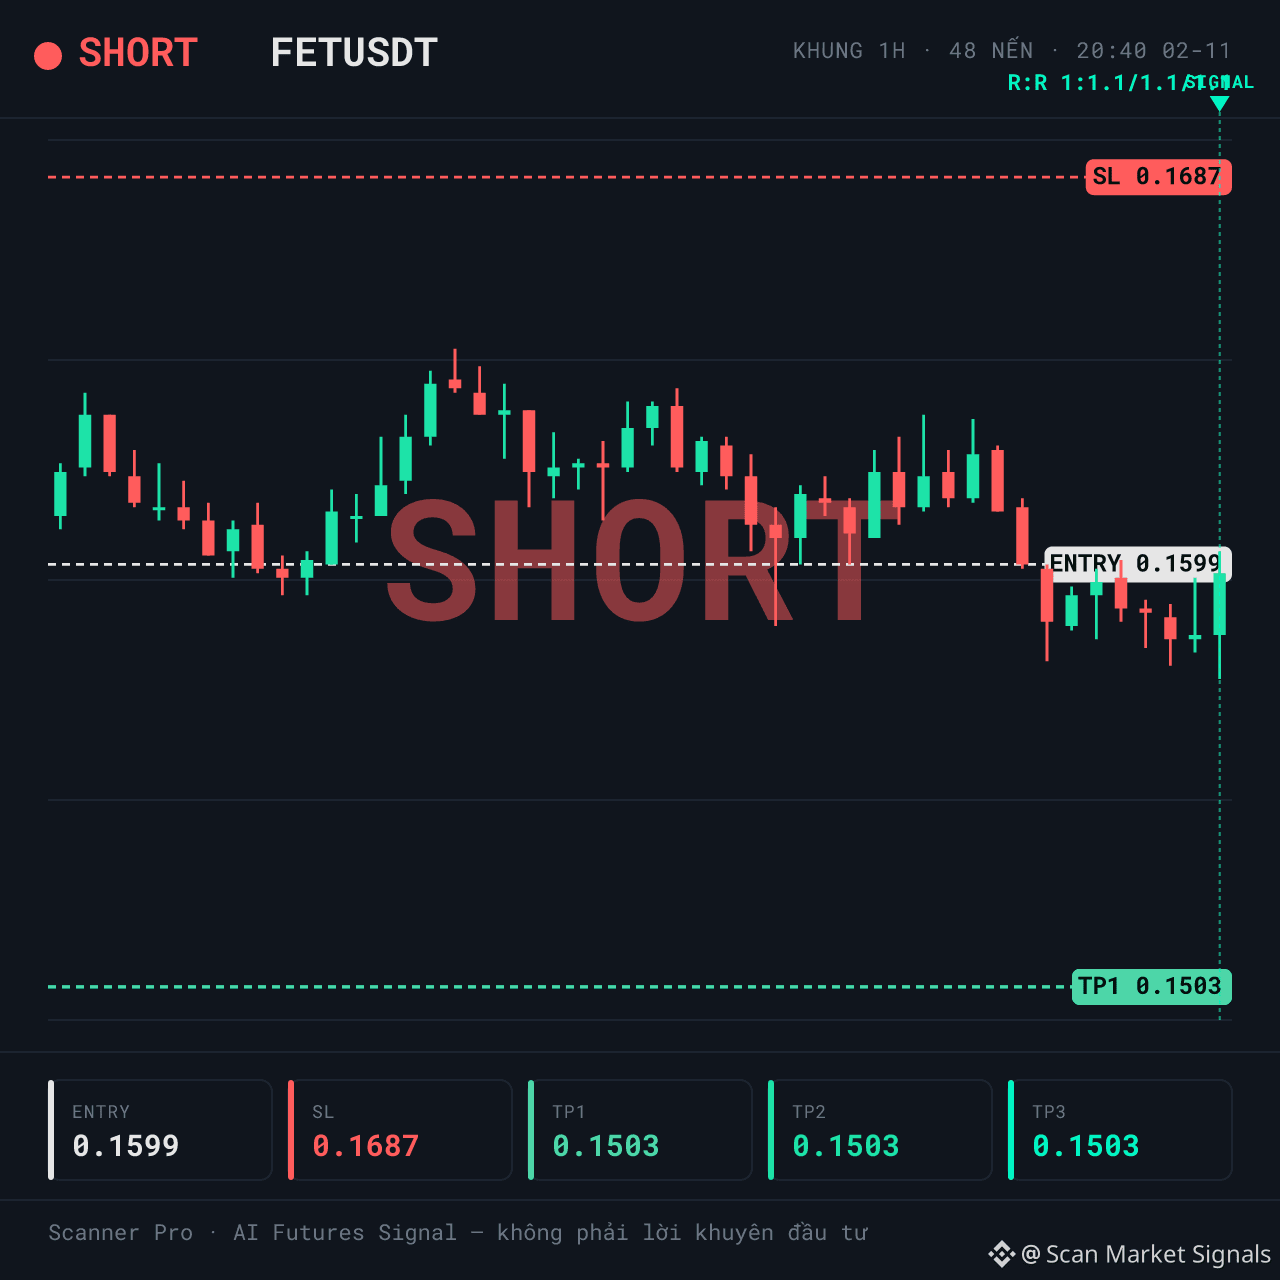
SHORT $FET | Sideways market, signal against the crowd
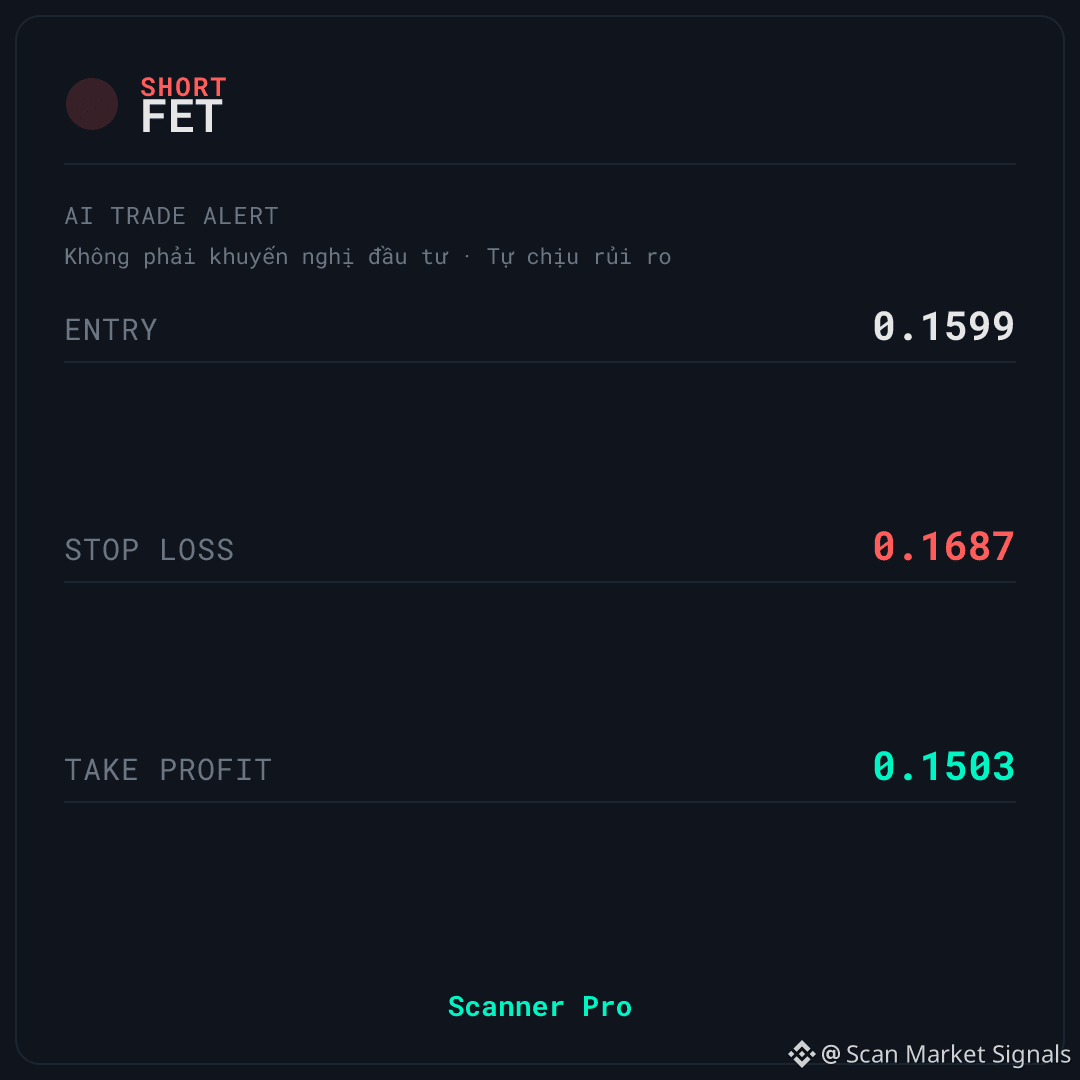
🚨 AI TRADE ALERT — $FET
🔴 SHORT
📌 Entry: 0.1597 – 0.1601
🛑 Stop Loss: 0.1687
🎯 Take Profit: 0.1503
⏰ Valid for: 6 hours (20:40 on 02/11 – 02:40 on 03/11, Vietnam time)
↔️ SIDEWAYS — sideways market, fade (mean-reversion) signal
$FET is being monitored by Scanner Pro for a SHORT scenario as price reacts below the short-term EMA zone. The market is classified as sideways, with a classification confidence of 55. Funding of 0.0082% indicates that LONG traders are paying SHORT traders.
📊 WHAT'S HAPPENING
The price is currently at 39% of its 24-hour range and below the EMA21 on both the 1h and 4h timeframes — the structure is tilted toward selling. The 4h ADX of 33.5 shows that the 4h trend still has strength, while the 1h ADX is only 22.9.
Funding of 0.0082%: LONG traders are paying SHORT traders, meaning the crowd is leaning against this signal. 24-hour volume is approximately 21,666,576 in the quote asset, with a 1.04x volume spike — no clear surge yet.
⚠️ RISKS TO KNOW — $FET
🚫 The market is classified as sideways with a classification confidence of 55 — not particularly high, so the regime classification may not accurately reflect current conditions. SHORT strategies in a sideways market can be vulnerable to noisy rebounds.
If the price closes above the stop-loss level shown on the signal card, the current SHORT scenario is no longer valid.
Do you think this is a continuation of the bearish structure, or just a retest before the price returns to the equilibrium zone?
This technical analysis is for educational purposes only and is not investment advice. Cryptocurrency trading carries high risk, and you could lose all your capital. Do your own research and take responsibility for your decisions.
#Binance #Crypto #Futures
SHORT $FET | Sideways market, signal against the crowd
🚨 AI TRADE ALERT — $FET
🔴 SHORT
📌 Entry: 0.1597 – 0.1601
🛑 Stop Loss: 0.1687
🎯 Take Profit: 0.1503
⏰ Valid for: 6 hours (20:40 on 02/11 – 02:40 on 03/11, Vietnam time)
↔️ SIDEWAYS — sideways market, fade (mean-reversion) signal
$FET is being monitored by Scanner Pro for a SHORT scenario as price reacts below the short-term EMA zone. The market is classified as sideways, with a classification confidence of 55. Funding of 0.0082% indicates that LONG traders are paying SHORT traders.
📊 WHAT'S HAPPENING
The price is currently at 39% of its 24-hour range and below the EMA21 on both the 1h and 4h timeframes — the structure is tilted toward selling. The 4h ADX of 33.5 shows that the 4h trend still has strength, while the 1h ADX is only 22.9.
Funding of 0.0082%: LONG traders are paying SHORT traders, meaning the crowd is leaning against this signal. 24-hour volume is approximately 21,666,576 in the quote asset, with a 1.04x volume spike — no clear surge yet.
⚠️ RISKS TO KNOW — $FET
🚫 The market is classified as sideways with a classification confidence of 55 — not particularly high, so the regime classification may not accurately reflect current conditions. SHORT strategies in a sideways market can be vulnerable to noisy rebounds.
If the price closes above the stop-loss level shown on the signal card, the current SHORT scenario is no longer valid.
Do you think this is a continuation of the bearish structure, or just a retest before the price returns to the equilibrium zone?
This technical analysis is for educational purposes only and is not investment advice. Cryptocurrency trading carries high risk, and you could lose all your capital. Do your own research and take responsibility for your decisions.
#Binance #Crypto #Futures
🚨 AI TRADE ALERT — $FET
🔴 SHORT
📌 Entry: 0.1597 – 0.1601
🛑 Stop Loss: 0.1687
🎯 Take Profit: 0.1503
⏰ Valid for: 6 hours (20:40 on 02/11 – 02:40 on 03/11, Vietnam time)
↔️ SIDEWAYS — sideways market, fade (mean-reversion) signal
$FET is being monitored by Scanner Pro for a SHORT scenario as price reacts below the short-term EMA zone. The market is classified as sideways, with a classification confidence of 55. Funding of 0.0082% indicates that LONG traders are paying SHORT traders.
📊 WHAT'S HAPPENING
The price is currently at 39% of its 24-hour range and below the EMA21 on both the 1h and 4h timeframes — the structure is tilted toward selling. The 4h ADX of 33.5 shows that the 4h trend still has strength, while the 1h ADX is only 22.9.
Funding of 0.0082%: LONG traders are paying SHORT traders, meaning the crowd is leaning against this signal. 24-hour volume is approximately 21,666,576 in the quote asset, with a 1.04x volume spike — no clear surge yet.
⚠️ RISKS TO KNOW — $FET
🚫 The market is classified as sideways with a classification confidence of 55 — not particularly high, so the regime classification may not accurately reflect current conditions. SHORT strategies in a sideways market can be vulnerable to noisy rebounds.
If the price closes above the stop-loss level shown on the signal card, the current SHORT scenario is no longer valid.
Do you think this is a continuation of the bearish structure, or just a retest before the price returns to the equilibrium zone?
This technical analysis is for educational purposes only and is not investment advice. Cryptocurrency trading carries high risk, and you could lose all your capital. Do your own research and take responsibility for your decisions.
#Binance #Crypto #Futures
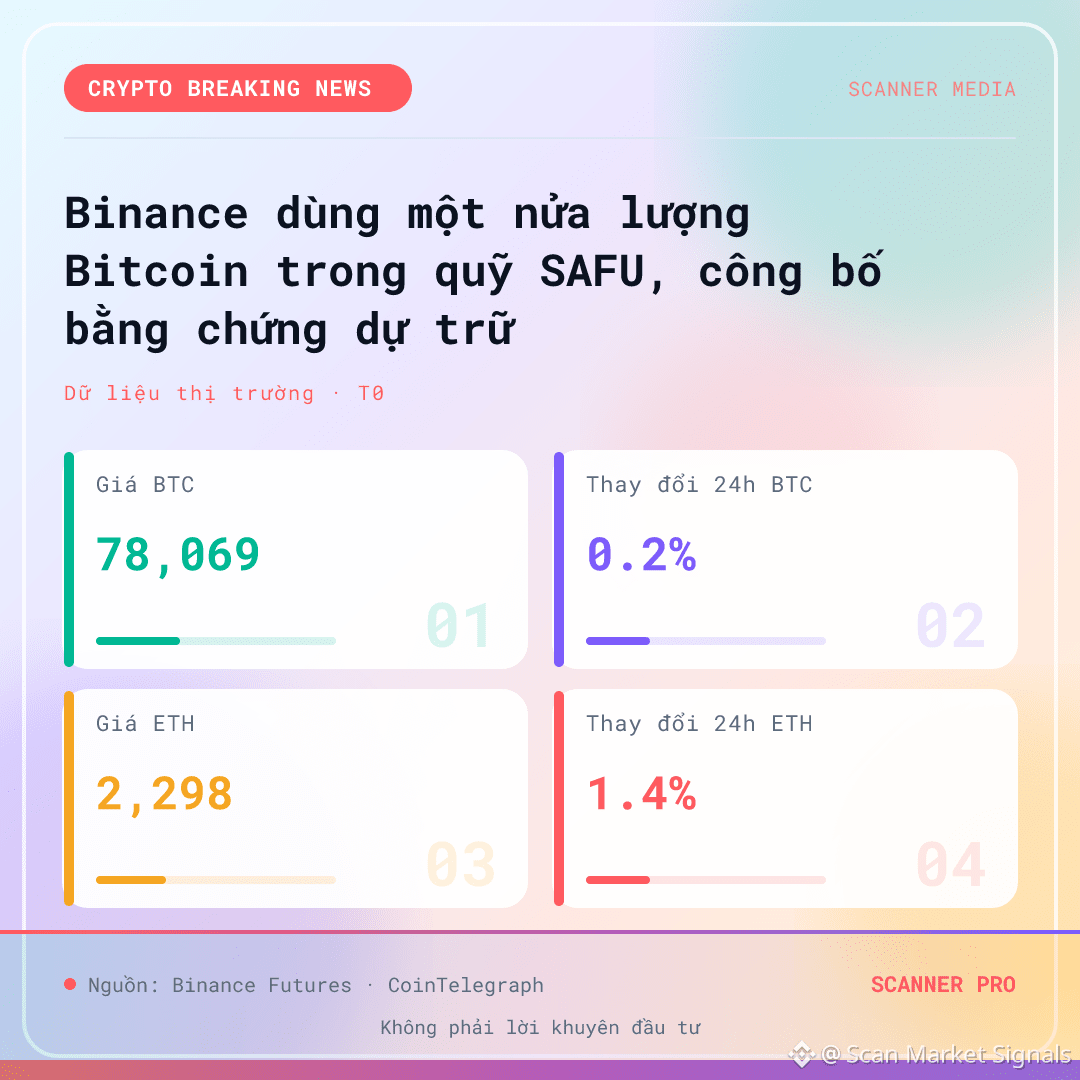
Binance uses half of its Bitcoin holdings in the SAFU fund, announces proof of reserves
CoinTelegraph reported on 02/11/2026 that Binance had used half of the Bitcoin held in its SAFU fund and announced proof of reserves. The move changes how the size of the user protection fund is viewed, while the BTC price response around the announcement remained fairly muted.
What changed
According to CoinTelegraph (published at 13:21 on 02/11/2026, UTC), Binance used half of the Bitcoin held in its SAFU fund and announced proof of reserves. The key change is the size of SAFU’s Bitcoin allocation: the amount cited in the source headline has been halved compared with before. The accompanying proof-of-reserves announcement shows that information about the balance was made public, but the source…
Who is affected
The parties directly affected are Binance users, since SAFU is the exchange’s user protection fund. The halving of the fund’s Bitcoin allocation changes how the protection buffer disclosed by the exchange is assessed. BTC traders are also interested because information related to a major exchange’s reserves is often interpreted as a signal about market structure. The price context at the time of the 13:40 data…
Contrary scenario: If the price reverses after the news has been priced in, the initial impact scenario no longer applies.
Sources: CoinTelegraph (20:21 02-11) · Binance Futures (20:40 02-11)
This is educational technical analysis, not investment advice. Cryptocurrency trading carries high risk, and you could lose all your capital. Do your own research and take responsibility for your decisions.
#Binance #Crypto #Futures
Binance uses half of its Bitcoin holdings in the SAFU fund, announces proof of reserves
CoinTelegraph reported on 02/11/2026 that Binance had used half of the Bitcoin held in its SAFU fund and announced proof of reserves. The move changes how the size of the user protection fund is viewed, while the BTC price response around the announcement remained fairly muted.
What changed
According to CoinTelegraph (published at 13:21 on 02/11/2026, UTC), Binance used half of the Bitcoin held in its SAFU fund and announced proof of reserves. The key change is the size of SAFU’s Bitcoin allocation: the amount cited in the source headline has been halved compared with before. The accompanying proof-of-reserves announcement shows that information about the balance was made public, but the source…
Who is affected
The parties directly affected are Binance users, since SAFU is the exchange’s user protection fund. The halving of the fund’s Bitcoin allocation changes how the protection buffer disclosed by the exchange is assessed. BTC traders are also interested because information related to a major exchange’s reserves is often interpreted as a signal about market structure. The price context at the time of the 13:40 data…
Contrary scenario: If the price reverses after the news has been priced in, the initial impact scenario no longer applies.
Sources: CoinTelegraph (20:21 02-11) · Binance Futures (20:40 02-11)
This is educational technical analysis, not investment advice. Cryptocurrency trading carries high risk, and you could lose all your capital. Do your own research and take responsibility for your decisions.
#Binance #Crypto #Futures
CoinTelegraph reported on 02/11/2026 that Binance had used half of the Bitcoin held in its SAFU fund and announced proof of reserves. The move changes how the size of the user protection fund is viewed, while the BTC price response around the announcement remained fairly muted.
What changed
According to CoinTelegraph (published at 13:21 on 02/11/2026, UTC), Binance used half of the Bitcoin held in its SAFU fund and announced proof of reserves. The key change is the size of SAFU’s Bitcoin allocation: the amount cited in the source headline has been halved compared with before. The accompanying proof-of-reserves announcement shows that information about the balance was made public, but the source…
Who is affected
The parties directly affected are Binance users, since SAFU is the exchange’s user protection fund. The halving of the fund’s Bitcoin allocation changes how the protection buffer disclosed by the exchange is assessed. BTC traders are also interested because information related to a major exchange’s reserves is often interpreted as a signal about market structure. The price context at the time of the 13:40 data…
Contrary scenario: If the price reverses after the news has been priced in, the initial impact scenario no longer applies.
Sources: CoinTelegraph (20:21 02-11) · Binance Futures (20:40 02-11)
This is educational technical analysis, not investment advice. Cryptocurrency trading carries high risk, and you could lose all your capital. Do your own research and take responsibility for your decisions.
#Binance #Crypto #Futures
16
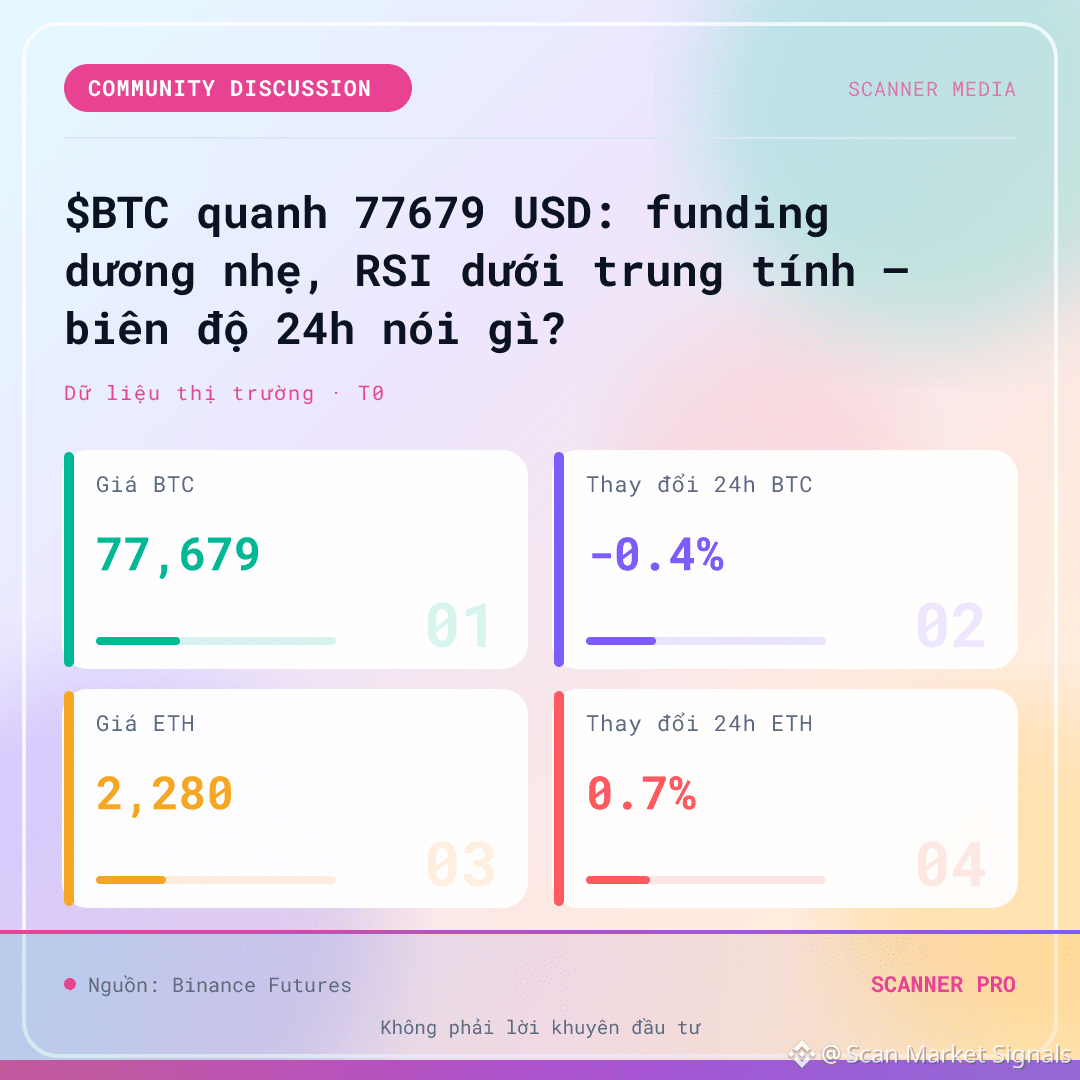
$BTC around 77679 USD: slightly positive funding, RSI below neutral — what does the 24-hour range say?
$BTC is trading around 77679 USD, down 0.4% over 24 hours, while funding is at 0.0099 and the 1h/4h RSI readings are 40 and 42, respectively. These data raise the question of what the narrow range and slightly positive funding are signaling.
Data snapshot
According to a Binance Futures snapshot at 13:30 on 02/11/2026, $BTC is trading around 77679 USD, down 0.4% over 24 hours. 24-hour volume reached 5.80 billion USDT. Notably, BTC funding is at 0.0099 — slightly positive — while the 1h RSI is 40 and the 4h RSI is 42, both below the neutral threshold of 50. Liquidity is far from thin, yet the price has moved almost sideways within a narrow range.
Relative context
Over the same period, $ETH is trading around 2280 USD, up 0.7% over 24 hours, with funding at 0.0060, a 1h RSI of 51, and a 4h RSI of 50 — closer to neutral than BTC. $SOL is weaker at 93.87 USD, down 1.2% over 24 hours, with funding at 0.0100, a 1h RSI of 40, and a 4h RSI of 37. Slightly positive funding across all three assets, while RSI leans below 50, suggests that buying pressure has not disappeared, but is also not strong enough to push prices out of their ranges.
Counter-scenario: If the 24-hour range changes significantly, this assessment should be revisited.
Source: Binance Futures (20:30 02-11)
This is educational technical analysis, not investment advice. Cryptocurrency trading carries significant risk, and you could lose all your capital. Do your own research and take responsibility for your decisions.
#Binance #Crypto #Futures
$BTC around 77679 USD: slightly positive funding, RSI below neutral — what does the 24-hour range say?
$BTC is trading around 77679 USD, down 0.4% over 24 hours, while funding is at 0.0099 and the 1h/4h RSI readings are 40 and 42, respectively. These data raise the question of what the narrow range and slightly positive funding are signaling.
Data snapshot
According to a Binance Futures snapshot at 13:30 on 02/11/2026, $BTC is trading around 77679 USD, down 0.4% over 24 hours. 24-hour volume reached 5.80 billion USDT. Notably, BTC funding is at 0.0099 — slightly positive — while the 1h RSI is 40 and the 4h RSI is 42, both below the neutral threshold of 50. Liquidity is far from thin, yet the price has moved almost sideways within a narrow range.
Relative context
Over the same period, $ETH is trading around 2280 USD, up 0.7% over 24 hours, with funding at 0.0060, a 1h RSI of 51, and a 4h RSI of 50 — closer to neutral than BTC. $SOL is weaker at 93.87 USD, down 1.2% over 24 hours, with funding at 0.0100, a 1h RSI of 40, and a 4h RSI of 37. Slightly positive funding across all three assets, while RSI leans below 50, suggests that buying pressure has not disappeared, but is also not strong enough to push prices out of their ranges.
Counter-scenario: If the 24-hour range changes significantly, this assessment should be revisited.
Source: Binance Futures (20:30 02-11)
This is educational technical analysis, not investment advice. Cryptocurrency trading carries significant risk, and you could lose all your capital. Do your own research and take responsibility for your decisions.
#Binance #Crypto #Futures
$BTC is trading around 77679 USD, down 0.4% over 24 hours, while funding is at 0.0099 and the 1h/4h RSI readings are 40 and 42, respectively. These data raise the question of what the narrow range and slightly positive funding are signaling.
Data snapshot
According to a Binance Futures snapshot at 13:30 on 02/11/2026, $BTC is trading around 77679 USD, down 0.4% over 24 hours. 24-hour volume reached 5.80 billion USDT. Notably, BTC funding is at 0.0099 — slightly positive — while the 1h RSI is 40 and the 4h RSI is 42, both below the neutral threshold of 50. Liquidity is far from thin, yet the price has moved almost sideways within a narrow range.
Relative context
Over the same period, $ETH is trading around 2280 USD, up 0.7% over 24 hours, with funding at 0.0060, a 1h RSI of 51, and a 4h RSI of 50 — closer to neutral than BTC. $SOL is weaker at 93.87 USD, down 1.2% over 24 hours, with funding at 0.0100, a 1h RSI of 40, and a 4h RSI of 37. Slightly positive funding across all three assets, while RSI leans below 50, suggests that buying pressure has not disappeared, but is also not strong enough to push prices out of their ranges.
Counter-scenario: If the 24-hour range changes significantly, this assessment should be revisited.
Source: Binance Futures (20:30 02-11)
This is educational technical analysis, not investment advice. Cryptocurrency trading carries significant risk, and you could lose all your capital. Do your own research and take responsibility for your decisions.
#Binance #Crypto #Futures
13
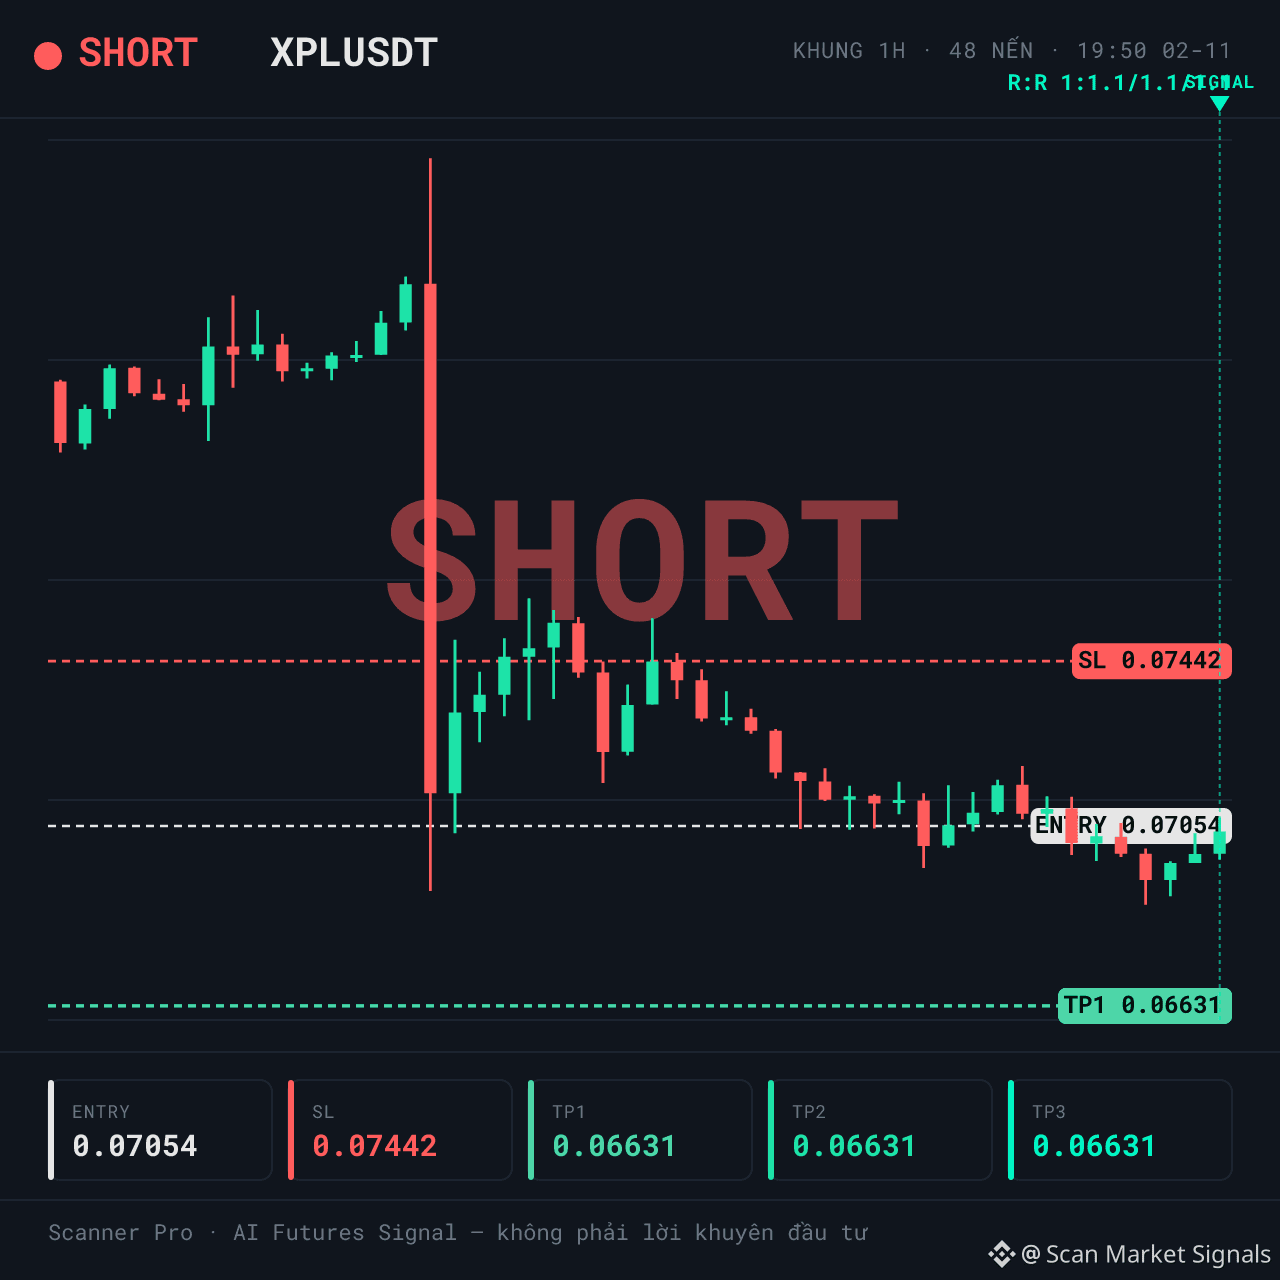
SHORT $XPL | Longs are paying the funding fee; the crowd is leaning one way
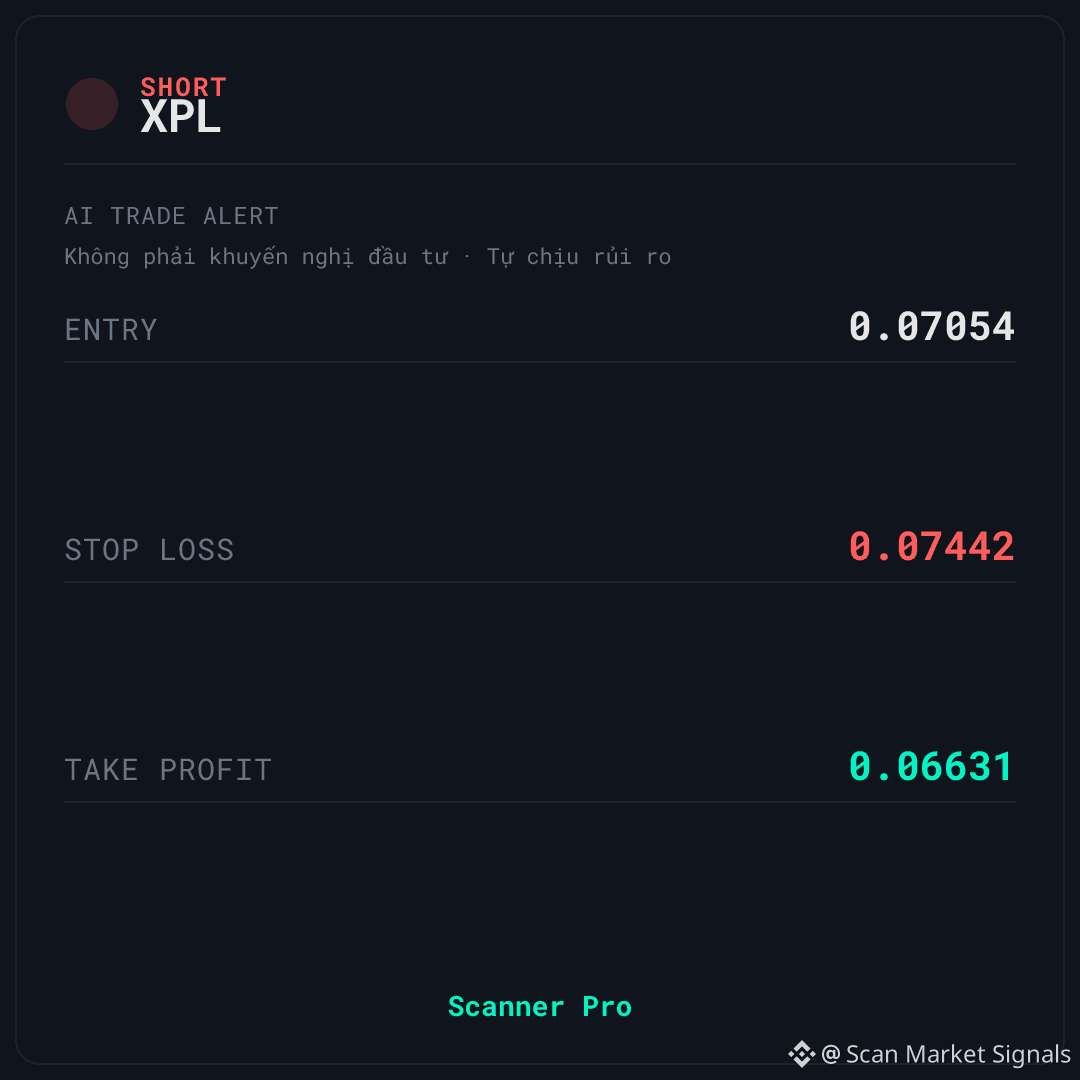
🚨 AI TRADE ALERT — $XPL
🔴 SHORT
📌 Entry: 0.07043 – 0.07065
🛑 Stop Loss: 0.07442
🎯 Take Profit: 0.06631
⏰ Valid for: 6 hours (19:50 on 02/11 – 01:50 on 03/11, VN time)
📉 DOWNTREND — SHORT in line with the downtrend
$XPL is in a downward move with clear selling pressure still present. Scanner Pro is monitoring the SHORT scenario as price action gradually weakens. The market context is classified as trend_down with 70% confidence, and the price is at 27% of the 24h range.
📊 WHAT THE DATA IS SHOWING
Funding is 0.0050% — LONGs are paying SHORTs, meaning the crowd is leaning against this signal. 24h volume is approximately 52.492.351 in quote asset, volume spike is 0.65x, and liquidity is rated high.
Price is at 27% of the 24h range, below EMA9 and EMA21 on both the 1h and 4h timeframes; the 1h ADX of 42.6 indicates a strong trend.
💡 SCENARIO & OPEN QUESTION — $XPL
⚠️ The biggest downside: 1h momentum at 41.4 is already in a weak zone, so this is not fresh support for the bearish scenario but rather a sign that the market had already weakened; on top of that, price is near the lower end of the 24h range, making a technical bounce more likely.
If the price closes above the stop-loss level on the signal card, the current SHORT scenario is no longer valid.
Do you think this is a continuation of the decline, or just a liquidity sweep before a bounce?
This technical analysis is for educational purposes only and is not investment advice. Cryptocurrency trading involves high risk, and you could lose all your capital. Do your own research and take responsibility for your decisions.
#Binance #Crypto #Futures
SHORT $XPL | Longs are paying the funding fee; the crowd is leaning one way
🚨 AI TRADE ALERT — $XPL
🔴 SHORT
📌 Entry: 0.07043 – 0.07065
🛑 Stop Loss: 0.07442
🎯 Take Profit: 0.06631
⏰ Valid for: 6 hours (19:50 on 02/11 – 01:50 on 03/11, VN time)
📉 DOWNTREND — SHORT in line with the downtrend
$XPL is in a downward move with clear selling pressure still present. Scanner Pro is monitoring the SHORT scenario as price action gradually weakens. The market context is classified as trend_down with 70% confidence, and the price is at 27% of the 24h range.
📊 WHAT THE DATA IS SHOWING
Funding is 0.0050% — LONGs are paying SHORTs, meaning the crowd is leaning against this signal. 24h volume is approximately 52.492.351 in quote asset, volume spike is 0.65x, and liquidity is rated high.
Price is at 27% of the 24h range, below EMA9 and EMA21 on both the 1h and 4h timeframes; the 1h ADX of 42.6 indicates a strong trend.
💡 SCENARIO & OPEN QUESTION — $XPL
⚠️ The biggest downside: 1h momentum at 41.4 is already in a weak zone, so this is not fresh support for the bearish scenario but rather a sign that the market had already weakened; on top of that, price is near the lower end of the 24h range, making a technical bounce more likely.
If the price closes above the stop-loss level on the signal card, the current SHORT scenario is no longer valid.
Do you think this is a continuation of the decline, or just a liquidity sweep before a bounce?
This technical analysis is for educational purposes only and is not investment advice. Cryptocurrency trading involves high risk, and you could lose all your capital. Do your own research and take responsibility for your decisions.
#Binance #Crypto #Futures
🚨 AI TRADE ALERT — $XPL
🔴 SHORT
📌 Entry: 0.07043 – 0.07065
🛑 Stop Loss: 0.07442
🎯 Take Profit: 0.06631
⏰ Valid for: 6 hours (19:50 on 02/11 – 01:50 on 03/11, VN time)
📉 DOWNTREND — SHORT in line with the downtrend
$XPL is in a downward move with clear selling pressure still present. Scanner Pro is monitoring the SHORT scenario as price action gradually weakens. The market context is classified as trend_down with 70% confidence, and the price is at 27% of the 24h range.
📊 WHAT THE DATA IS SHOWING
Funding is 0.0050% — LONGs are paying SHORTs, meaning the crowd is leaning against this signal. 24h volume is approximately 52.492.351 in quote asset, volume spike is 0.65x, and liquidity is rated high.
Price is at 27% of the 24h range, below EMA9 and EMA21 on both the 1h and 4h timeframes; the 1h ADX of 42.6 indicates a strong trend.
💡 SCENARIO & OPEN QUESTION — $XPL
⚠️ The biggest downside: 1h momentum at 41.4 is already in a weak zone, so this is not fresh support for the bearish scenario but rather a sign that the market had already weakened; on top of that, price is near the lower end of the 24h range, making a technical bounce more likely.
If the price closes above the stop-loss level on the signal card, the current SHORT scenario is no longer valid.
Do you think this is a continuation of the decline, or just a liquidity sweep before a bounce?
This technical analysis is for educational purposes only and is not investment advice. Cryptocurrency trading involves high risk, and you could lose all your capital. Do your own research and take responsibility for your decisions.
#Binance #Crypto #Futures
8
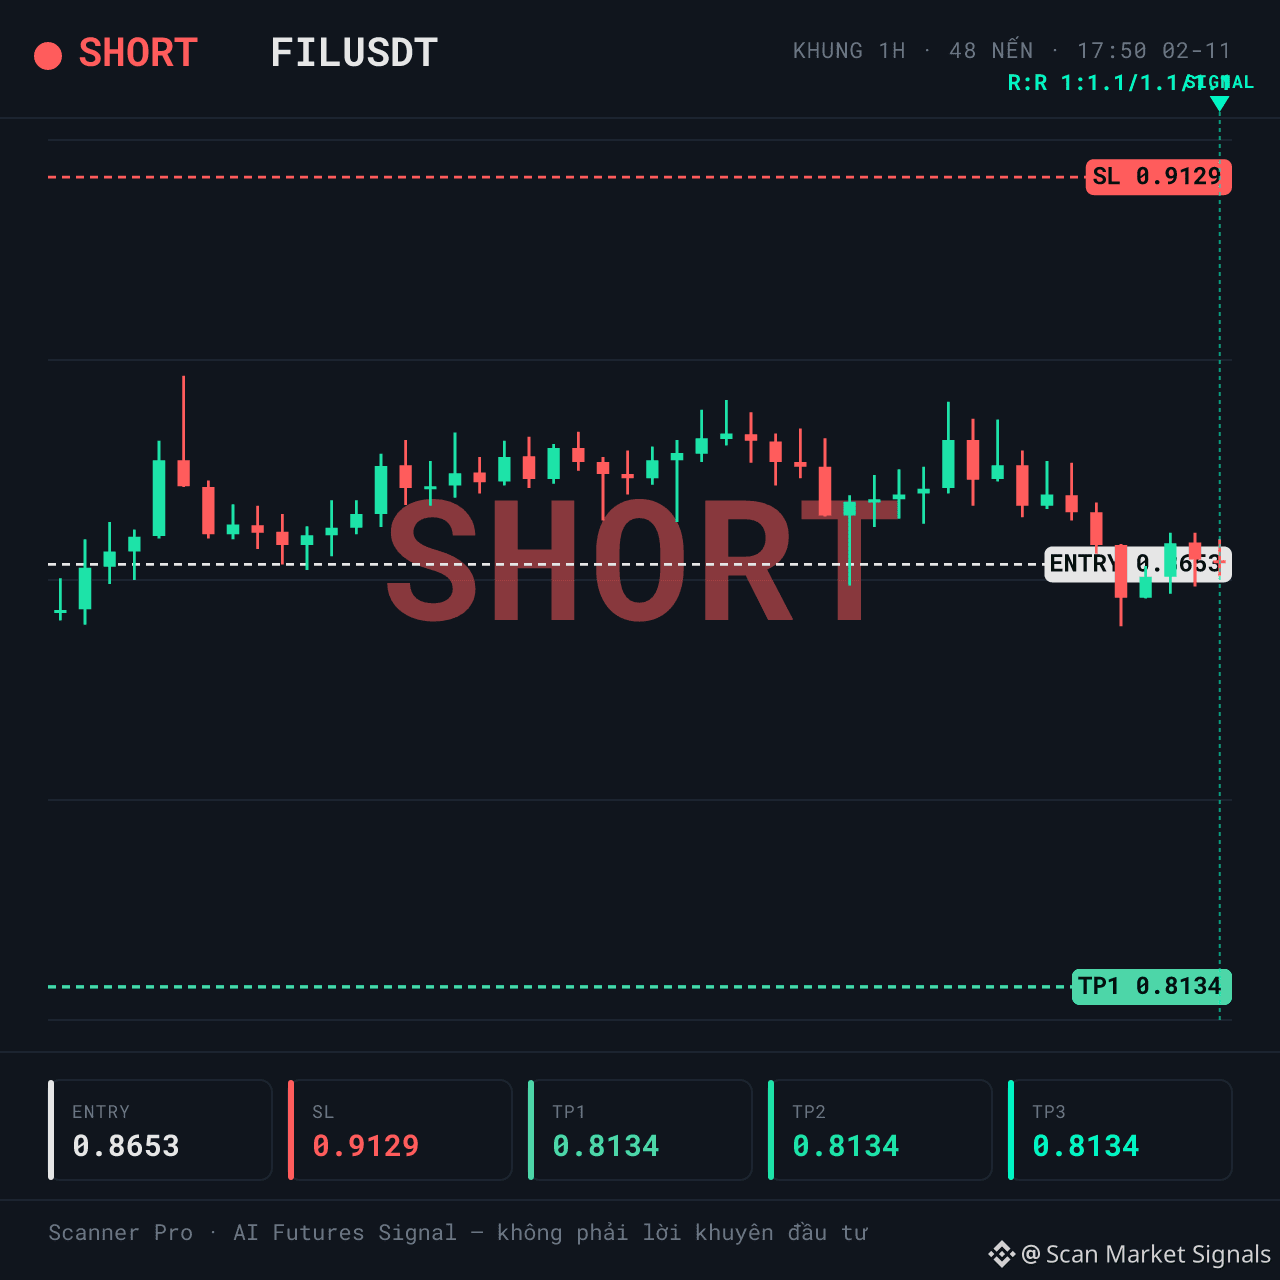
SHORT $FIL | Shorting in a sideways market: does it fit or go against the trend?
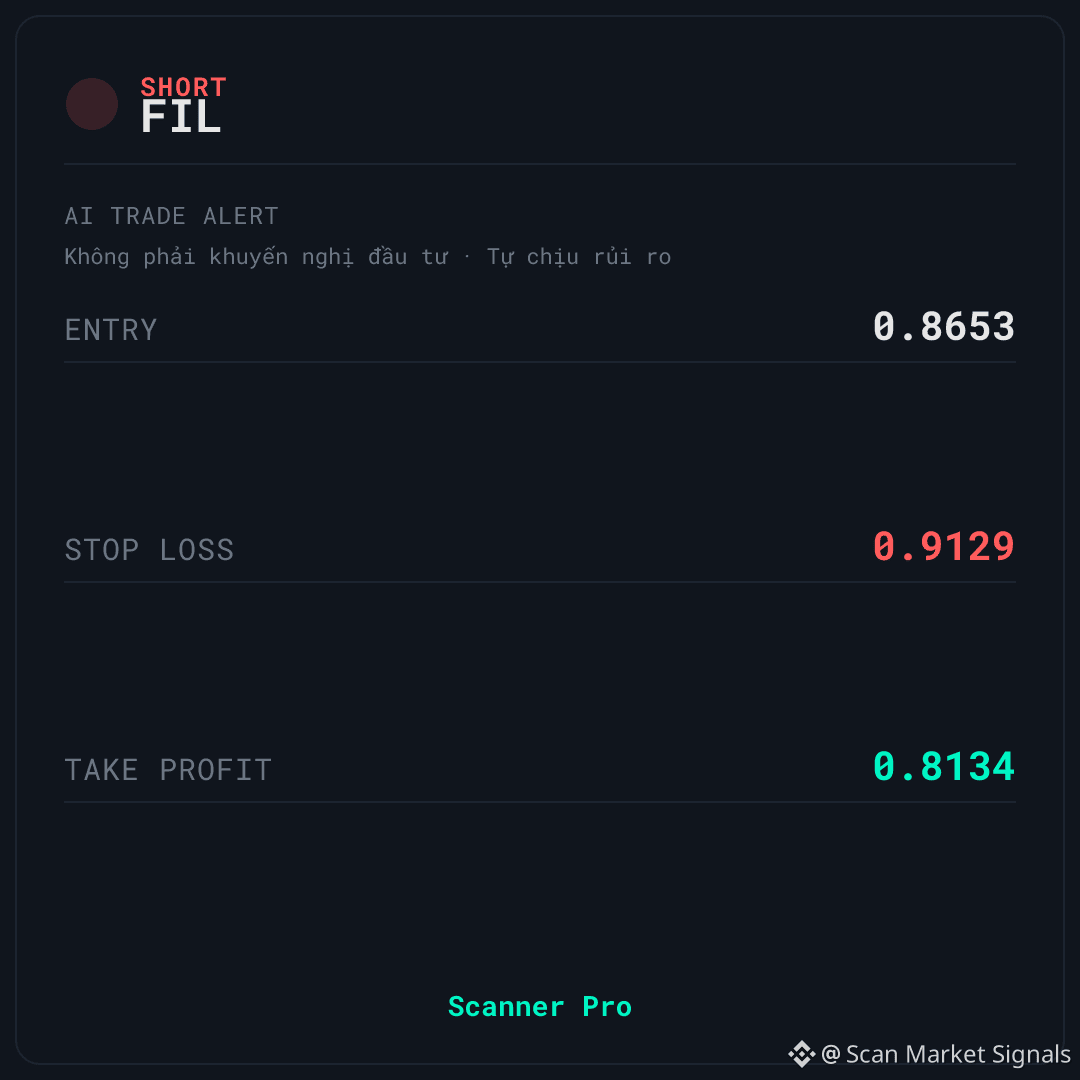
🚨 AI TRADE ALERT — $FIL
🔴 SHORT
📌 Entry: 0.864 – 0.8666
🛑 Stop Loss: 0.9129
🎯 Take Profit: 0.8134
⏰ Valid for: 6 hours (17:50 – 23:50 VN) - Date: 02/11
↔️ SIDEWAYS — the market is moving sideways; fade (mean-reversion) signal
$FIL is being monitored by Scanner Pro for a SHORT scenario as price reacts to a short-term resistance zone. The market is classified as sideways, with a classification confidence of 55; the volume spike is only 0.52x — meaning there has been no breakout to confirm the move.
📊 WHAT'S HAPPENING
Price is at 27% of the 24-hour range — a low area, but not yet the bottom. Funding is 0.0056%: LONG traders are paying SHORT traders, meaning the crowd is leaning long, against the signal — theoretically, this supports the SHORT position.
24-hour volume is approximately 36,222,685 in quote asset, with a volume spike of 0.52x — liquidity is high, but participation is thin. There are no signs of significant capital entering the market.
⚠️ RISKS TO KNOW BEFOREHAND — $FIL
🚫 The biggest concern: a sideways regime with a classification confidence of 55 (below 60) — the market context is unclear, and the standard-entry strategy can easily get stopped out on both sides in these conditions. The 1-hour momentum is already weak at 41.6, so it is not a solid basis for the short scenario.
If the price closes above the stop-loss level on the signal card, the current SHORT scenario is no longer valid.
Do you think this is a liquidity sweep or a genuine reversal signal?
This is educational technical analysis, not investment advice. Cryptocurrency trading carries high risk, and you could lose all your capital. Do your own research and take responsibility for your decisions.
#Binance #Crypto #Futures
SHORT $FIL | Shorting in a sideways market: does it fit or go against the trend?
🚨 AI TRADE ALERT — $FIL
🔴 SHORT
📌 Entry: 0.864 – 0.8666
🛑 Stop Loss: 0.9129
🎯 Take Profit: 0.8134
⏰ Valid for: 6 hours (17:50 – 23:50 VN) - Date: 02/11
↔️ SIDEWAYS — the market is moving sideways; fade (mean-reversion) signal
$FIL is being monitored by Scanner Pro for a SHORT scenario as price reacts to a short-term resistance zone. The market is classified as sideways, with a classification confidence of 55; the volume spike is only 0.52x — meaning there has been no breakout to confirm the move.
📊 WHAT'S HAPPENING
Price is at 27% of the 24-hour range — a low area, but not yet the bottom. Funding is 0.0056%: LONG traders are paying SHORT traders, meaning the crowd is leaning long, against the signal — theoretically, this supports the SHORT position.
24-hour volume is approximately 36,222,685 in quote asset, with a volume spike of 0.52x — liquidity is high, but participation is thin. There are no signs of significant capital entering the market.
⚠️ RISKS TO KNOW BEFOREHAND — $FIL
🚫 The biggest concern: a sideways regime with a classification confidence of 55 (below 60) — the market context is unclear, and the standard-entry strategy can easily get stopped out on both sides in these conditions. The 1-hour momentum is already weak at 41.6, so it is not a solid basis for the short scenario.
If the price closes above the stop-loss level on the signal card, the current SHORT scenario is no longer valid.
Do you think this is a liquidity sweep or a genuine reversal signal?
This is educational technical analysis, not investment advice. Cryptocurrency trading carries high risk, and you could lose all your capital. Do your own research and take responsibility for your decisions.
#Binance #Crypto #Futures
🚨 AI TRADE ALERT — $FIL
🔴 SHORT
📌 Entry: 0.864 – 0.8666
🛑 Stop Loss: 0.9129
🎯 Take Profit: 0.8134
⏰ Valid for: 6 hours (17:50 – 23:50 VN) - Date: 02/11
↔️ SIDEWAYS — the market is moving sideways; fade (mean-reversion) signal
$FIL is being monitored by Scanner Pro for a SHORT scenario as price reacts to a short-term resistance zone. The market is classified as sideways, with a classification confidence of 55; the volume spike is only 0.52x — meaning there has been no breakout to confirm the move.
📊 WHAT'S HAPPENING
Price is at 27% of the 24-hour range — a low area, but not yet the bottom. Funding is 0.0056%: LONG traders are paying SHORT traders, meaning the crowd is leaning long, against the signal — theoretically, this supports the SHORT position.
24-hour volume is approximately 36,222,685 in quote asset, with a volume spike of 0.52x — liquidity is high, but participation is thin. There are no signs of significant capital entering the market.
⚠️ RISKS TO KNOW BEFOREHAND — $FIL
🚫 The biggest concern: a sideways regime with a classification confidence of 55 (below 60) — the market context is unclear, and the standard-entry strategy can easily get stopped out on both sides in these conditions. The 1-hour momentum is already weak at 41.6, so it is not a solid basis for the short scenario.
If the price closes above the stop-loss level on the signal card, the current SHORT scenario is no longer valid.
Do you think this is a liquidity sweep or a genuine reversal signal?
This is educational technical analysis, not investment advice. Cryptocurrency trading carries high risk, and you could lose all your capital. Do your own research and take responsibility for your decisions.
#Binance #Crypto #Futures
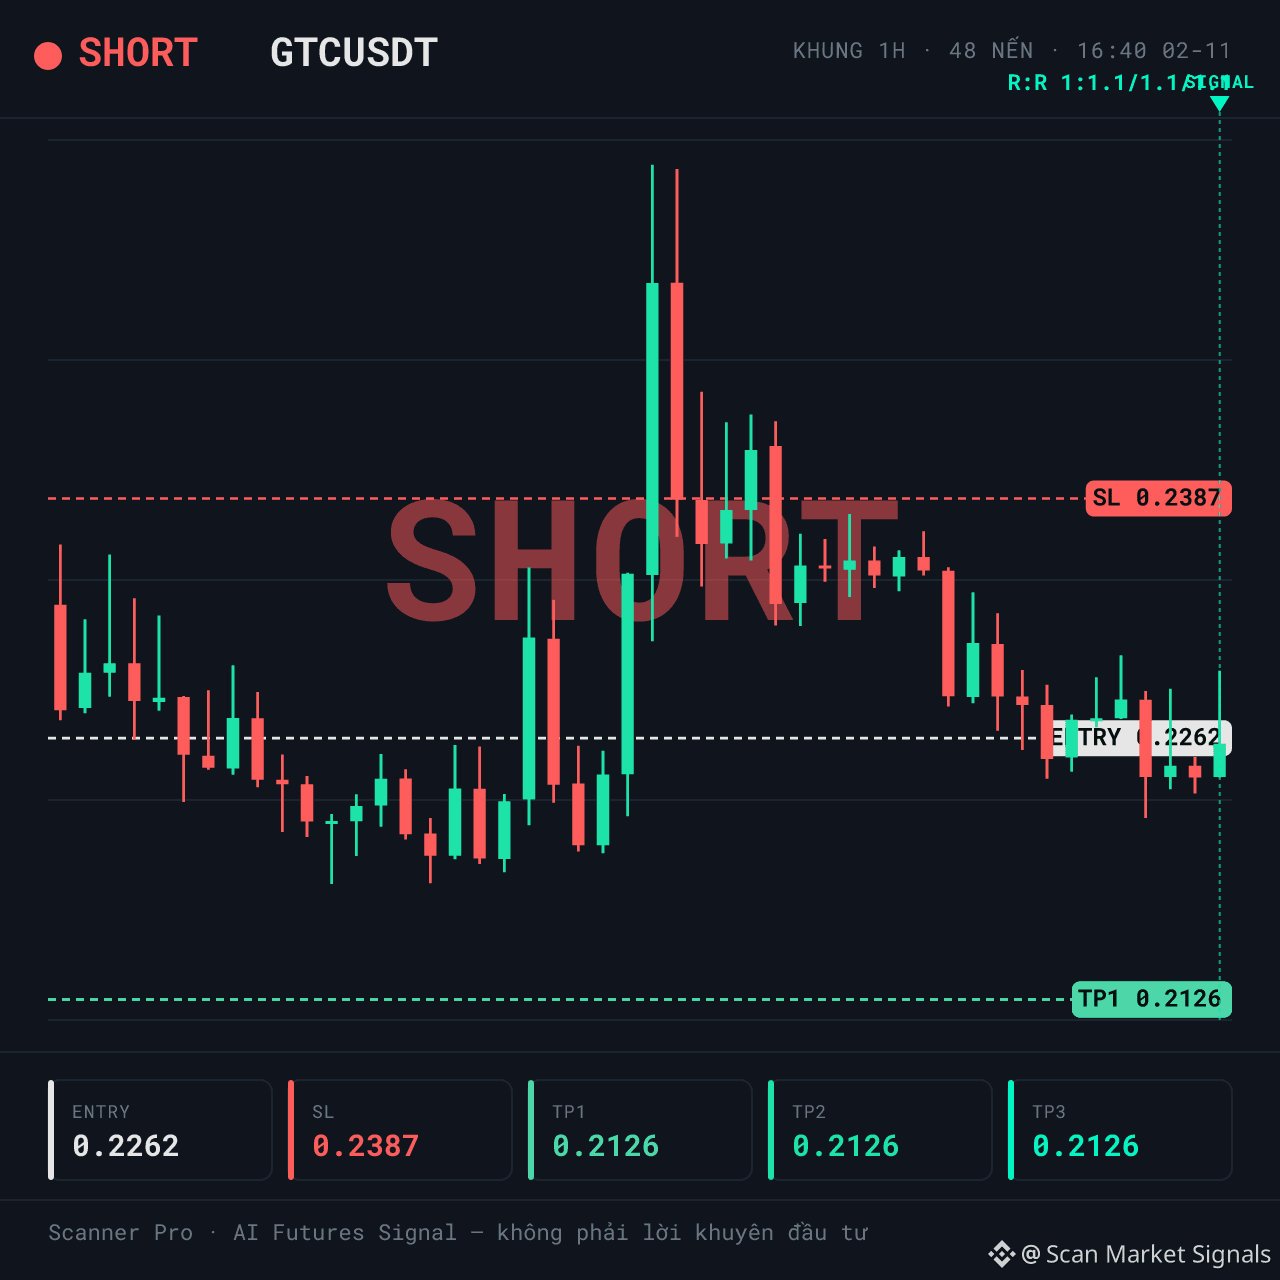
SHORT $GTC | Momentum is cooling, but the short side is paying fees
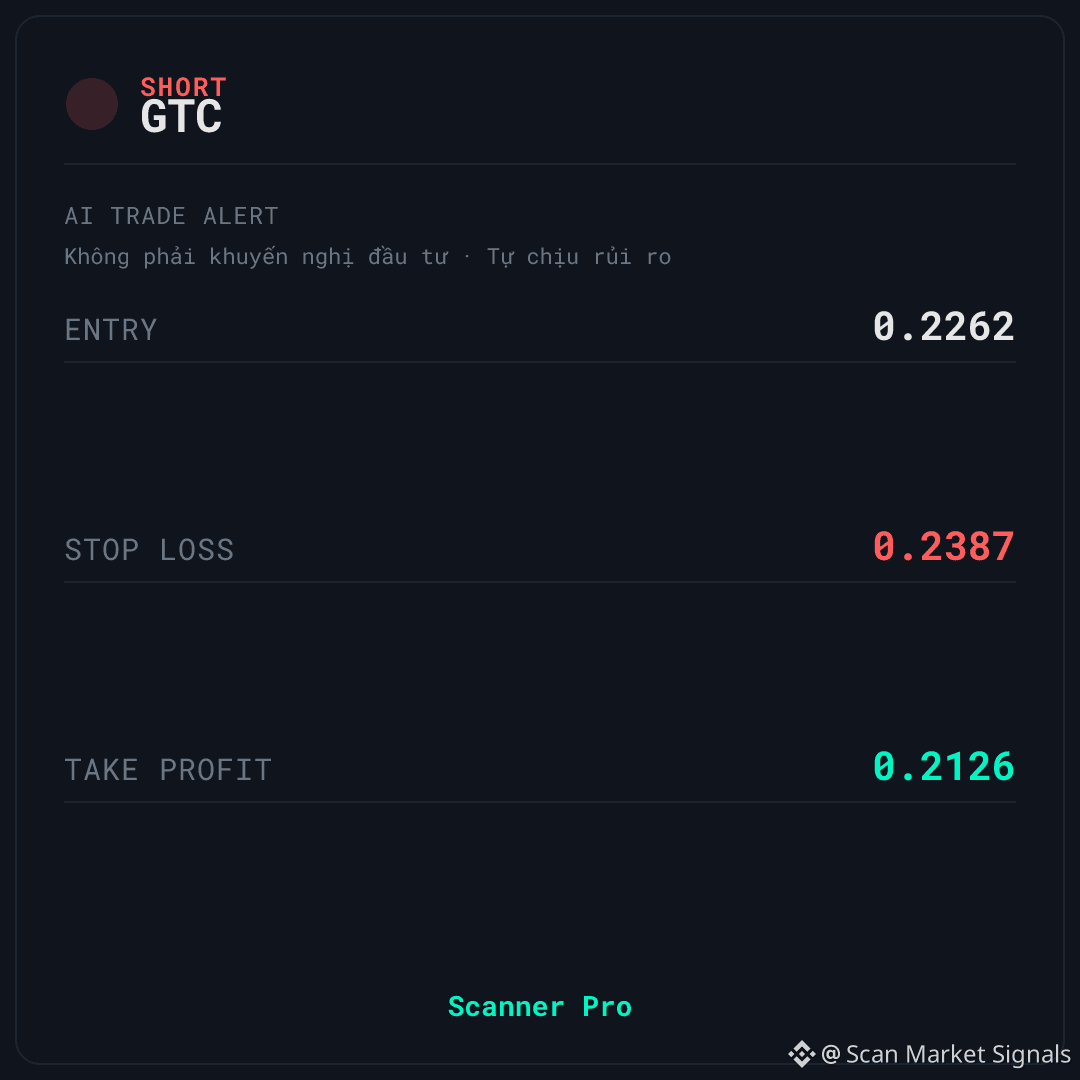
🚨 AI TRADE ALERT — $GTC
🔴 SHORT
📌 Entry: 0.2259 – 0.2266
🛑 Stop Loss: 0.2387
🎯 Take Profit: 0.2126
⏰ Valid for: 6 hours (16:40 – 22:40 VN) - Date: 02/11
↔️ SIDEWAYS — market moving sideways, fade (mean-reversion) signal
$GTC is being monitored by Scanner Pro for a SHORT scenario as the price retreats toward the lower end of the 24-hour range and 1-hour momentum falls below neutral. The market context is classified as sideways, with a classification confidence of 55. Negative funding indicates the SHORT side is paying fees to the LONG side.
📊 WHAT THE DATA IS SHOWING
The current price is at 12% of the 24-hour range — the lower end of the session, after a decline of more than 2% today. 1-hour momentum is at 46.5; it has not entered oversold territory yet, but is leaning toward weakness.
24-hour volume is approximately 21,364,562 in the quote asset, with a 1.00x volume spike — there are no signs of an unusual inflow of funds. The market context is classified as sideways, which favors selling at resistance rather than chasing the price.
💡 SCENARIO & OPEN QUESTION — $GTC
⚠️ The biggest disadvantage: negative funding means the SHORT side is paying fees to the LONG side — the crowd is leaning in the same direction as the signal, and that side is paying fees. This is a risk to monitor, not confirmation of the short scenario.
🚫 If the price closes above the stop-loss level on the signal card, the current SHORT scenario is no longer valid.
Do you think the short side having to pay fees means the crowd entered positions too early, or is it a genuine reversal signal?
This technical analysis is for educational purposes only and is not investment advice. Cryptocurrency trading carries high risk, and you could lose all your capital. Do your own research and take responsibility for your decisions.
#Binance #Crypto #Futures
SHORT $GTC | Momentum is cooling, but the short side is paying fees
🚨 AI TRADE ALERT — $GTC
🔴 SHORT
📌 Entry: 0.2259 – 0.2266
🛑 Stop Loss: 0.2387
🎯 Take Profit: 0.2126
⏰ Valid for: 6 hours (16:40 – 22:40 VN) - Date: 02/11
↔️ SIDEWAYS — market moving sideways, fade (mean-reversion) signal
$GTC is being monitored by Scanner Pro for a SHORT scenario as the price retreats toward the lower end of the 24-hour range and 1-hour momentum falls below neutral. The market context is classified as sideways, with a classification confidence of 55. Negative funding indicates the SHORT side is paying fees to the LONG side.
📊 WHAT THE DATA IS SHOWING
The current price is at 12% of the 24-hour range — the lower end of the session, after a decline of more than 2% today. 1-hour momentum is at 46.5; it has not entered oversold territory yet, but is leaning toward weakness.
24-hour volume is approximately 21,364,562 in the quote asset, with a 1.00x volume spike — there are no signs of an unusual inflow of funds. The market context is classified as sideways, which favors selling at resistance rather than chasing the price.
💡 SCENARIO & OPEN QUESTION — $GTC
⚠️ The biggest disadvantage: negative funding means the SHORT side is paying fees to the LONG side — the crowd is leaning in the same direction as the signal, and that side is paying fees. This is a risk to monitor, not confirmation of the short scenario.
🚫 If the price closes above the stop-loss level on the signal card, the current SHORT scenario is no longer valid.
Do you think the short side having to pay fees means the crowd entered positions too early, or is it a genuine reversal signal?
This technical analysis is for educational purposes only and is not investment advice. Cryptocurrency trading carries high risk, and you could lose all your capital. Do your own research and take responsibility for your decisions.
#Binance #Crypto #Futures
🚨 AI TRADE ALERT — $GTC
🔴 SHORT
📌 Entry: 0.2259 – 0.2266
🛑 Stop Loss: 0.2387
🎯 Take Profit: 0.2126
⏰ Valid for: 6 hours (16:40 – 22:40 VN) - Date: 02/11
↔️ SIDEWAYS — market moving sideways, fade (mean-reversion) signal
$GTC is being monitored by Scanner Pro for a SHORT scenario as the price retreats toward the lower end of the 24-hour range and 1-hour momentum falls below neutral. The market context is classified as sideways, with a classification confidence of 55. Negative funding indicates the SHORT side is paying fees to the LONG side.
📊 WHAT THE DATA IS SHOWING
The current price is at 12% of the 24-hour range — the lower end of the session, after a decline of more than 2% today. 1-hour momentum is at 46.5; it has not entered oversold territory yet, but is leaning toward weakness.
24-hour volume is approximately 21,364,562 in the quote asset, with a 1.00x volume spike — there are no signs of an unusual inflow of funds. The market context is classified as sideways, which favors selling at resistance rather than chasing the price.
💡 SCENARIO & OPEN QUESTION — $GTC
⚠️ The biggest disadvantage: negative funding means the SHORT side is paying fees to the LONG side — the crowd is leaning in the same direction as the signal, and that side is paying fees. This is a risk to monitor, not confirmation of the short scenario.
🚫 If the price closes above the stop-loss level on the signal card, the current SHORT scenario is no longer valid.
Do you think the short side having to pay fees means the crowd entered positions too early, or is it a genuine reversal signal?
This technical analysis is for educational purposes only and is not investment advice. Cryptocurrency trading carries high risk, and you could lose all your capital. Do your own research and take responsibility for your decisions.
#Binance #Crypto #Futures
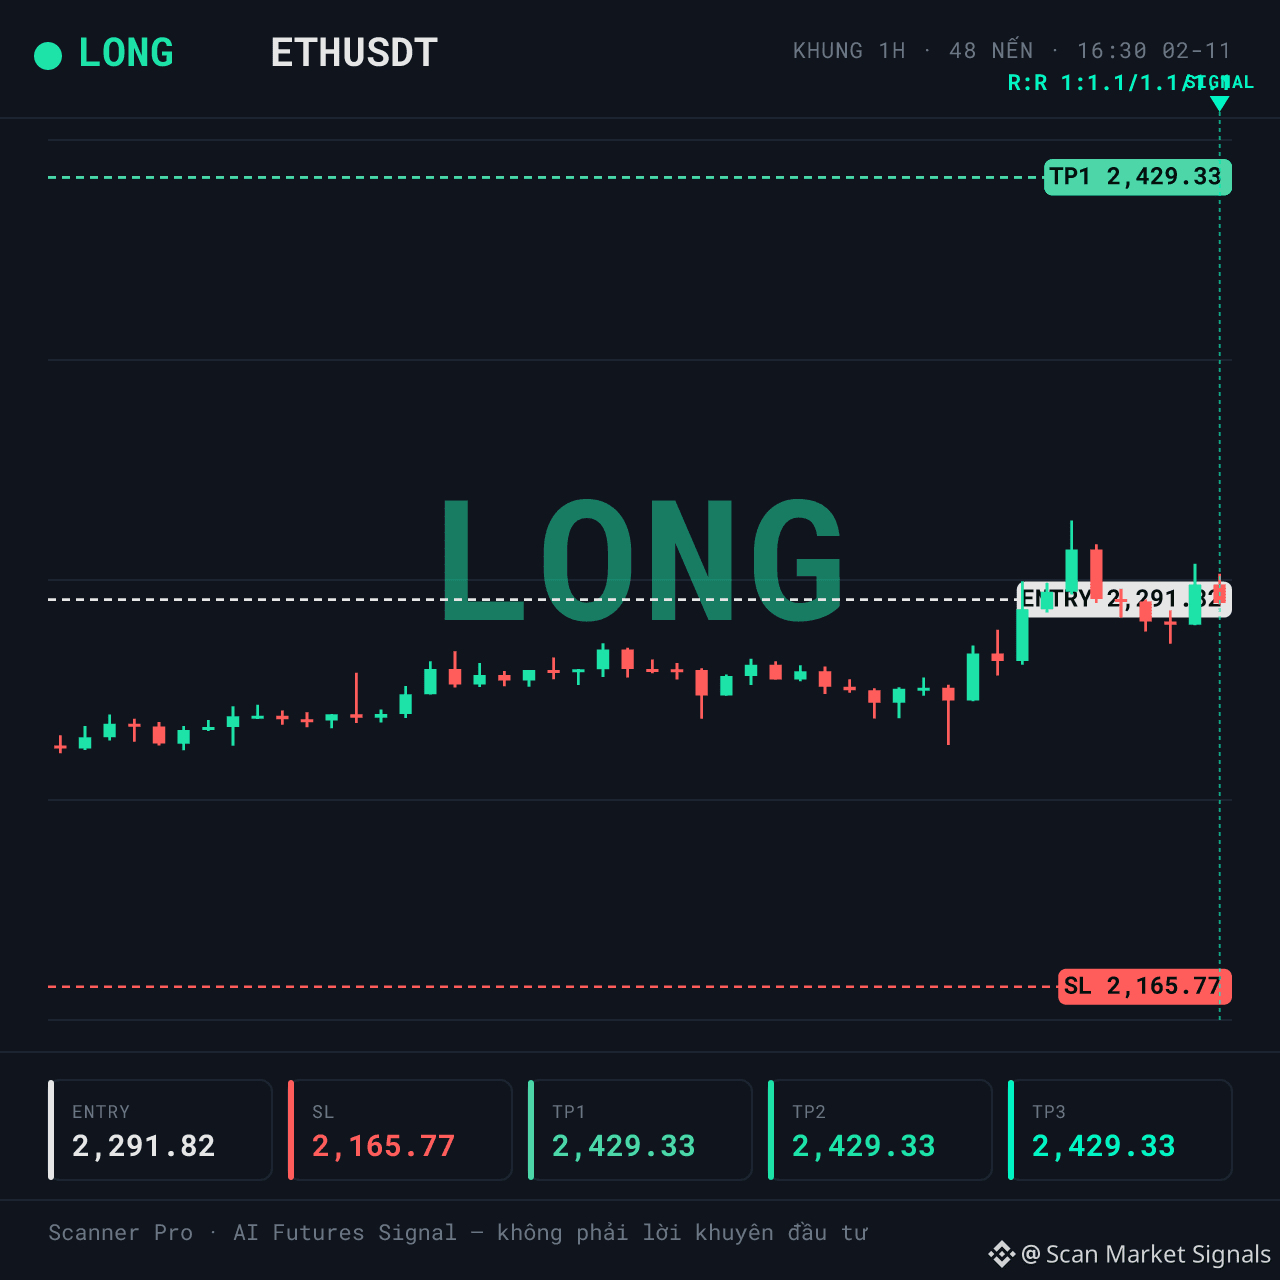
LONG $ETH | Sideways market, is this setup going against the trend?
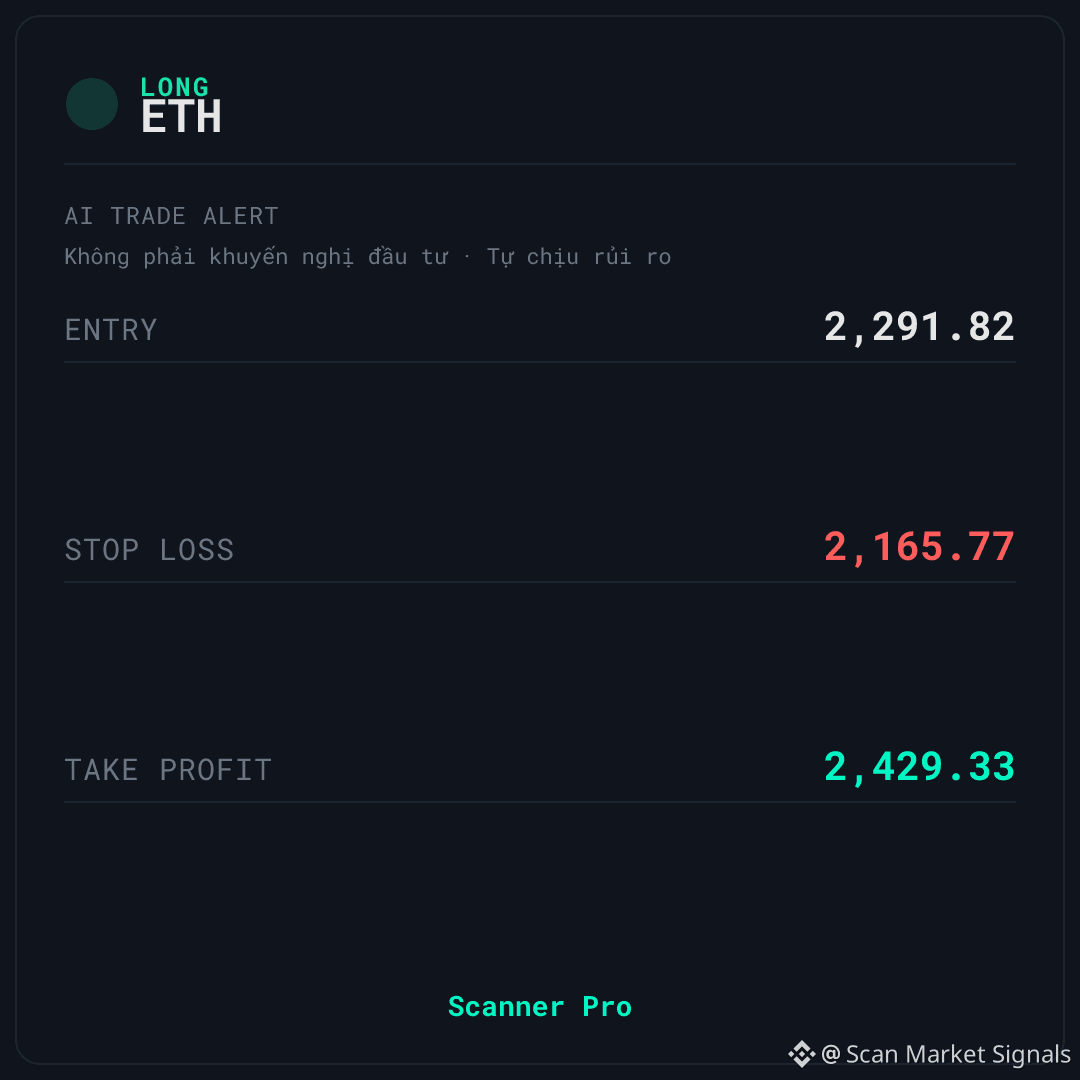
🚨 AI TRADE ALERT — $ETH
🟢 LONG
📌 Entry: 2,288.38 – 2,295.26
🛑 Stop Loss: 2,165.77
🎯 Take Profit: 2,429.33
⏰ Valid for: 6 hours (16:30 – 22:30 VN) - Date: 02/11
↔️ SIDEWAYS — sideways market, fade (mean-reversion) signal
$ETH is being monitored by Scanner Pro for a LONG scenario as price reacts positively around the short-term EMA zone. The market context is classified as sideways, with a classification confidence of 55 — not strong enough to confirm a trend.
📊 WHAT'S HAPPENING
Price is currently at 65% of the 24-hour range, which puts it in the upper half of the trading range — not near the bottom. 24-hour volume is around 4.59 billion, but the volume spike is only 0.76x, meaning liquidity is not really surging. Funding is 0.0009%: LONGs are paying SHORTs, meaning the crowd is leaning in the same direction as the signal. This is a disadvantage, not confirmation. The sideways context with a confidence of 55 indicates there is no clear trend yet — this kind of LONG setup can easily get whipsawed.
⚠️ RISKS TO KNOW FIRST — $ETH
🚫 The biggest risk: price is already in the upper half of the 24-hour range while the market context is only sideways, and LONGs are having to pay funding — these two factors do not support chasing the price. Additionally, confidence in the market context classification is only 55, meaning it is not certain that the market is truly moving sideways. If price closes below the stop-loss level on the signal card, the current LONG scenario is no longer valid. What do you think: is this a retest before moving higher, or just a bounce within a sideways range?
This technical analysis content is for educational purposes only and is not investment advice. Cryptocurrency trading carries high risk, and you could lose all your capital. Do your own research and take responsibility for your decisions.
#Binance #Crypto #Futures
LONG $ETH | Sideways market, is this setup going against the trend?
🚨 AI TRADE ALERT — $ETH
🟢 LONG
📌 Entry: 2,288.38 – 2,295.26
🛑 Stop Loss: 2,165.77
🎯 Take Profit: 2,429.33
⏰ Valid for: 6 hours (16:30 – 22:30 VN) - Date: 02/11
↔️ SIDEWAYS — sideways market, fade (mean-reversion) signal
$ETH is being monitored by Scanner Pro for a LONG scenario as price reacts positively around the short-term EMA zone. The market context is classified as sideways, with a classification confidence of 55 — not strong enough to confirm a trend.
📊 WHAT'S HAPPENING
Price is currently at 65% of the 24-hour range, which puts it in the upper half of the trading range — not near the bottom. 24-hour volume is around 4.59 billion, but the volume spike is only 0.76x, meaning liquidity is not really surging. Funding is 0.0009%: LONGs are paying SHORTs, meaning the crowd is leaning in the same direction as the signal. This is a disadvantage, not confirmation. The sideways context with a confidence of 55 indicates there is no clear trend yet — this kind of LONG setup can easily get whipsawed.
⚠️ RISKS TO KNOW FIRST — $ETH
🚫 The biggest risk: price is already in the upper half of the 24-hour range while the market context is only sideways, and LONGs are having to pay funding — these two factors do not support chasing the price. Additionally, confidence in the market context classification is only 55, meaning it is not certain that the market is truly moving sideways. If price closes below the stop-loss level on the signal card, the current LONG scenario is no longer valid. What do you think: is this a retest before moving higher, or just a bounce within a sideways range?
This technical analysis content is for educational purposes only and is not investment advice. Cryptocurrency trading carries high risk, and you could lose all your capital. Do your own research and take responsibility for your decisions.
#Binance #Crypto #Futures
🚨 AI TRADE ALERT — $ETH
🟢 LONG
📌 Entry: 2,288.38 – 2,295.26
🛑 Stop Loss: 2,165.77
🎯 Take Profit: 2,429.33
⏰ Valid for: 6 hours (16:30 – 22:30 VN) - Date: 02/11
↔️ SIDEWAYS — sideways market, fade (mean-reversion) signal
$ETH is being monitored by Scanner Pro for a LONG scenario as price reacts positively around the short-term EMA zone. The market context is classified as sideways, with a classification confidence of 55 — not strong enough to confirm a trend.
📊 WHAT'S HAPPENING
Price is currently at 65% of the 24-hour range, which puts it in the upper half of the trading range — not near the bottom. 24-hour volume is around 4.59 billion, but the volume spike is only 0.76x, meaning liquidity is not really surging. Funding is 0.0009%: LONGs are paying SHORTs, meaning the crowd is leaning in the same direction as the signal. This is a disadvantage, not confirmation. The sideways context with a confidence of 55 indicates there is no clear trend yet — this kind of LONG setup can easily get whipsawed.
⚠️ RISKS TO KNOW FIRST — $ETH
🚫 The biggest risk: price is already in the upper half of the 24-hour range while the market context is only sideways, and LONGs are having to pay funding — these two factors do not support chasing the price. Additionally, confidence in the market context classification is only 55, meaning it is not certain that the market is truly moving sideways. If price closes below the stop-loss level on the signal card, the current LONG scenario is no longer valid. What do you think: is this a retest before moving higher, or just a bounce within a sideways range?
This technical analysis content is for educational purposes only and is not investment advice. Cryptocurrency trading carries high risk, and you could lose all your capital. Do your own research and take responsibility for your decisions.
#Binance #Crypto #Futures
3
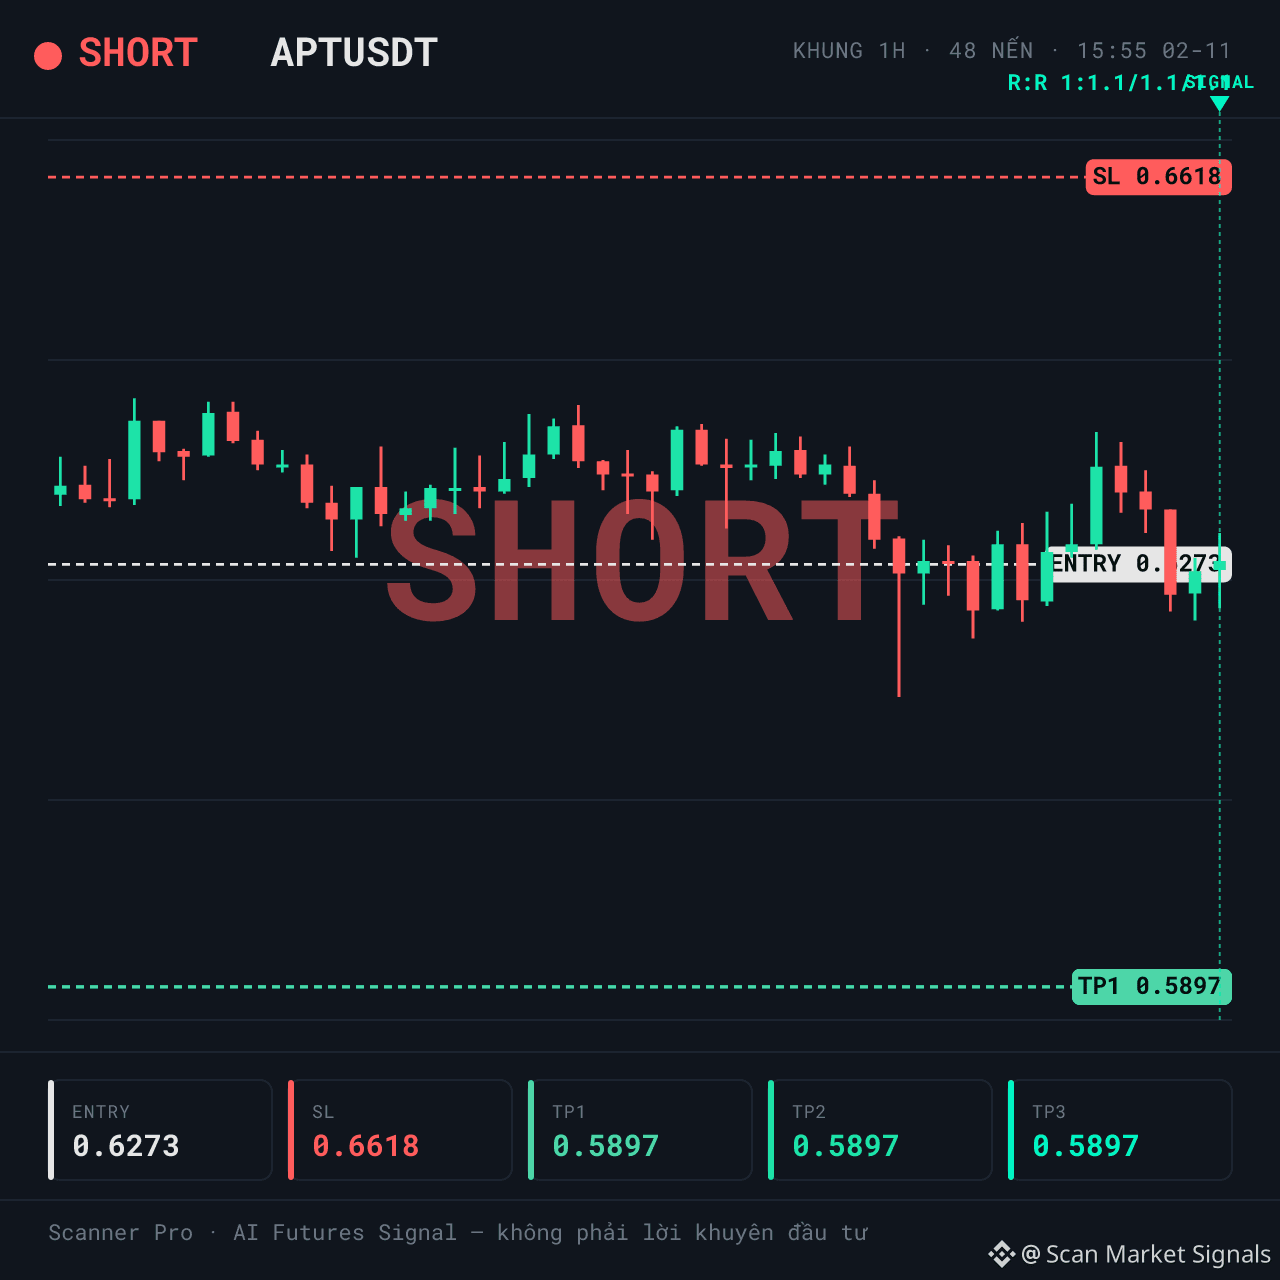
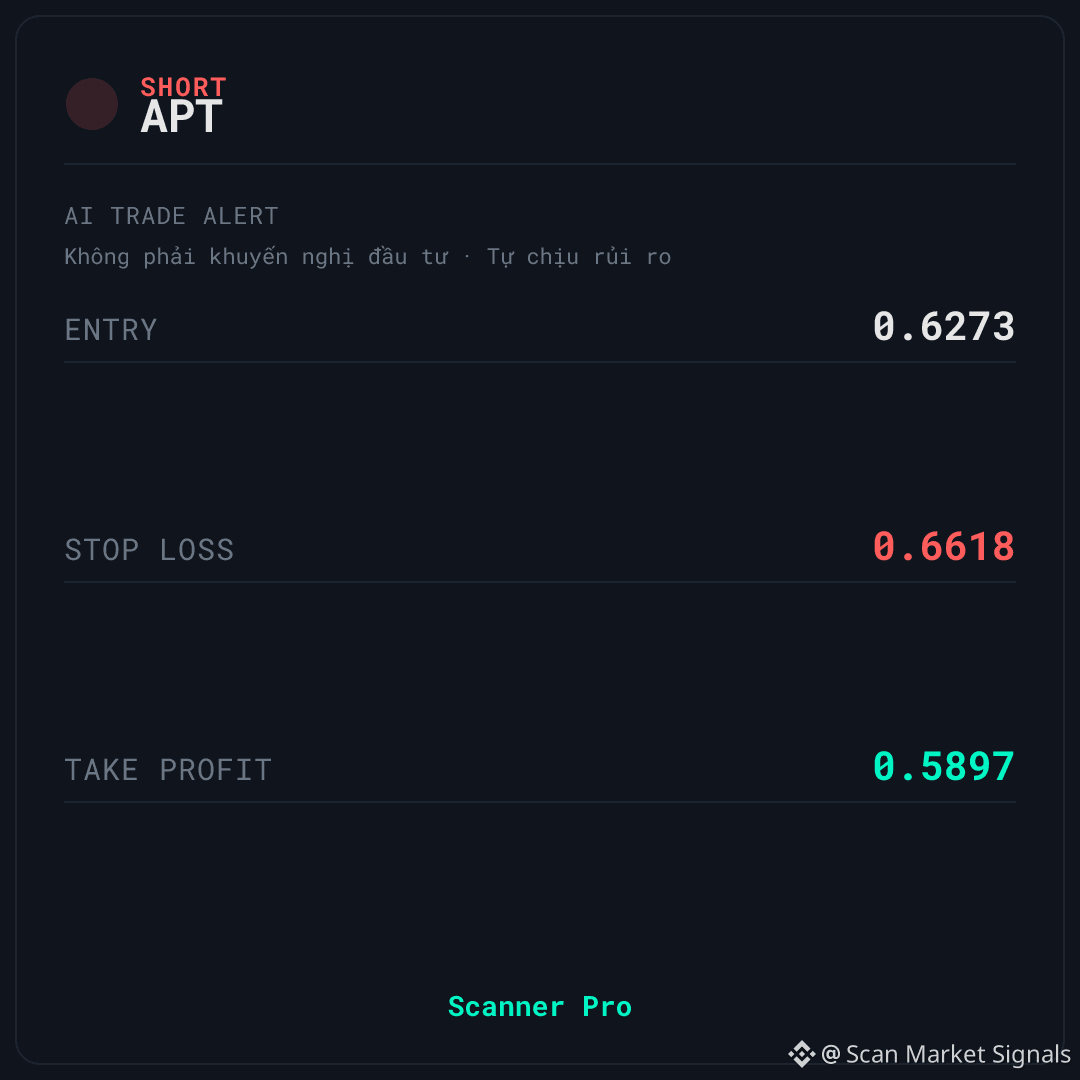
SHORT $APT | Thick liquidity, contrarian signal
🚨 AI TRADE ALERT — $APT
🔴 SHORT
📌 Entry: 0.6264 – 0.6282
🛑 Stop Loss: 0.6618
🎯 Take Profit: 0.5897
⏰ Valid for: 6 hours (15:55 – 21:55 VN) - Date: 02/11
↔️ SIDEWAYS — range-bound market, fade (mean-reversion) signal
$APT is being monitored by Scanner Pro for a SHORT scenario as price reacts to a short-term resistance zone. Sideways context, classification confidence 55, funding 0.0009%.
📊 WHY IT’S WORTH WATCHING
24h volume is approximately 21,170,021 in quote asset, volume spike 0.66x — liquidity is high, reducing slippage risk when entering a trade. Funding 0.0009%: LONG traders are paying SHORT traders; the crowd is leaning against this signal, which supports the SHORT direction. Price is at 49% of the 24h range, not yet in an extreme zone.
⚠️ SETUP & RISKS — $APT
🚫 1h momentum at 45.1 is not a strong supporting factor for SHORT, but it is not weak enough to confirm it either. The sideways context has a classification confidence of only 55 — not high, so the signal may be noisy. If price closes above the stop-loss level on the signal card, the current SHORT scenario is no longer valid. Do you think the current thick liquidity can help price hold this zone, or is it just a stepping stone before a deeper retest?
This is educational technical analysis content, not investment advice. Cryptocurrency trading carries high risk, and you could lose all your capital. Do your own research and take responsibility for your decisions.
#Binance #Crypto #Futures
SHORT $APT | Thick liquidity, contrarian signal
🚨 AI TRADE ALERT — $APT
🔴 SHORT
📌 Entry: 0.6264 – 0.6282
🛑 Stop Loss: 0.6618
🎯 Take Profit: 0.5897
⏰ Valid for: 6 hours (15:55 – 21:55 VN) - Date: 02/11
↔️ SIDEWAYS — range-bound market, fade (mean-reversion) signal
$APT is being monitored by Scanner Pro for a SHORT scenario as price reacts to a short-term resistance zone. Sideways context, classification confidence 55, funding 0.0009%.
📊 WHY IT’S WORTH WATCHING
24h volume is approximately 21,170,021 in quote asset, volume spike 0.66x — liquidity is high, reducing slippage risk when entering a trade. Funding 0.0009%: LONG traders are paying SHORT traders; the crowd is leaning against this signal, which supports the SHORT direction. Price is at 49% of the 24h range, not yet in an extreme zone.
⚠️ SETUP & RISKS — $APT
🚫 1h momentum at 45.1 is not a strong supporting factor for SHORT, but it is not weak enough to confirm it either. The sideways context has a classification confidence of only 55 — not high, so the signal may be noisy. If price closes above the stop-loss level on the signal card, the current SHORT scenario is no longer valid. Do you think the current thick liquidity can help price hold this zone, or is it just a stepping stone before a deeper retest?
This is educational technical analysis content, not investment advice. Cryptocurrency trading carries high risk, and you could lose all your capital. Do your own research and take responsibility for your decisions.
#Binance #Crypto #Futures
🚨 AI TRADE ALERT — $APT
🔴 SHORT
📌 Entry: 0.6264 – 0.6282
🛑 Stop Loss: 0.6618
🎯 Take Profit: 0.5897
⏰ Valid for: 6 hours (15:55 – 21:55 VN) - Date: 02/11
↔️ SIDEWAYS — range-bound market, fade (mean-reversion) signal
$APT is being monitored by Scanner Pro for a SHORT scenario as price reacts to a short-term resistance zone. Sideways context, classification confidence 55, funding 0.0009%.
📊 WHY IT’S WORTH WATCHING
24h volume is approximately 21,170,021 in quote asset, volume spike 0.66x — liquidity is high, reducing slippage risk when entering a trade. Funding 0.0009%: LONG traders are paying SHORT traders; the crowd is leaning against this signal, which supports the SHORT direction. Price is at 49% of the 24h range, not yet in an extreme zone.
⚠️ SETUP & RISKS — $APT
🚫 1h momentum at 45.1 is not a strong supporting factor for SHORT, but it is not weak enough to confirm it either. The sideways context has a classification confidence of only 55 — not high, so the signal may be noisy. If price closes above the stop-loss level on the signal card, the current SHORT scenario is no longer valid. Do you think the current thick liquidity can help price hold this zone, or is it just a stepping stone before a deeper retest?
This is educational technical analysis content, not investment advice. Cryptocurrency trading carries high risk, and you could lose all your capital. Do your own research and take responsibility for your decisions.
#Binance #Crypto #Futures
4
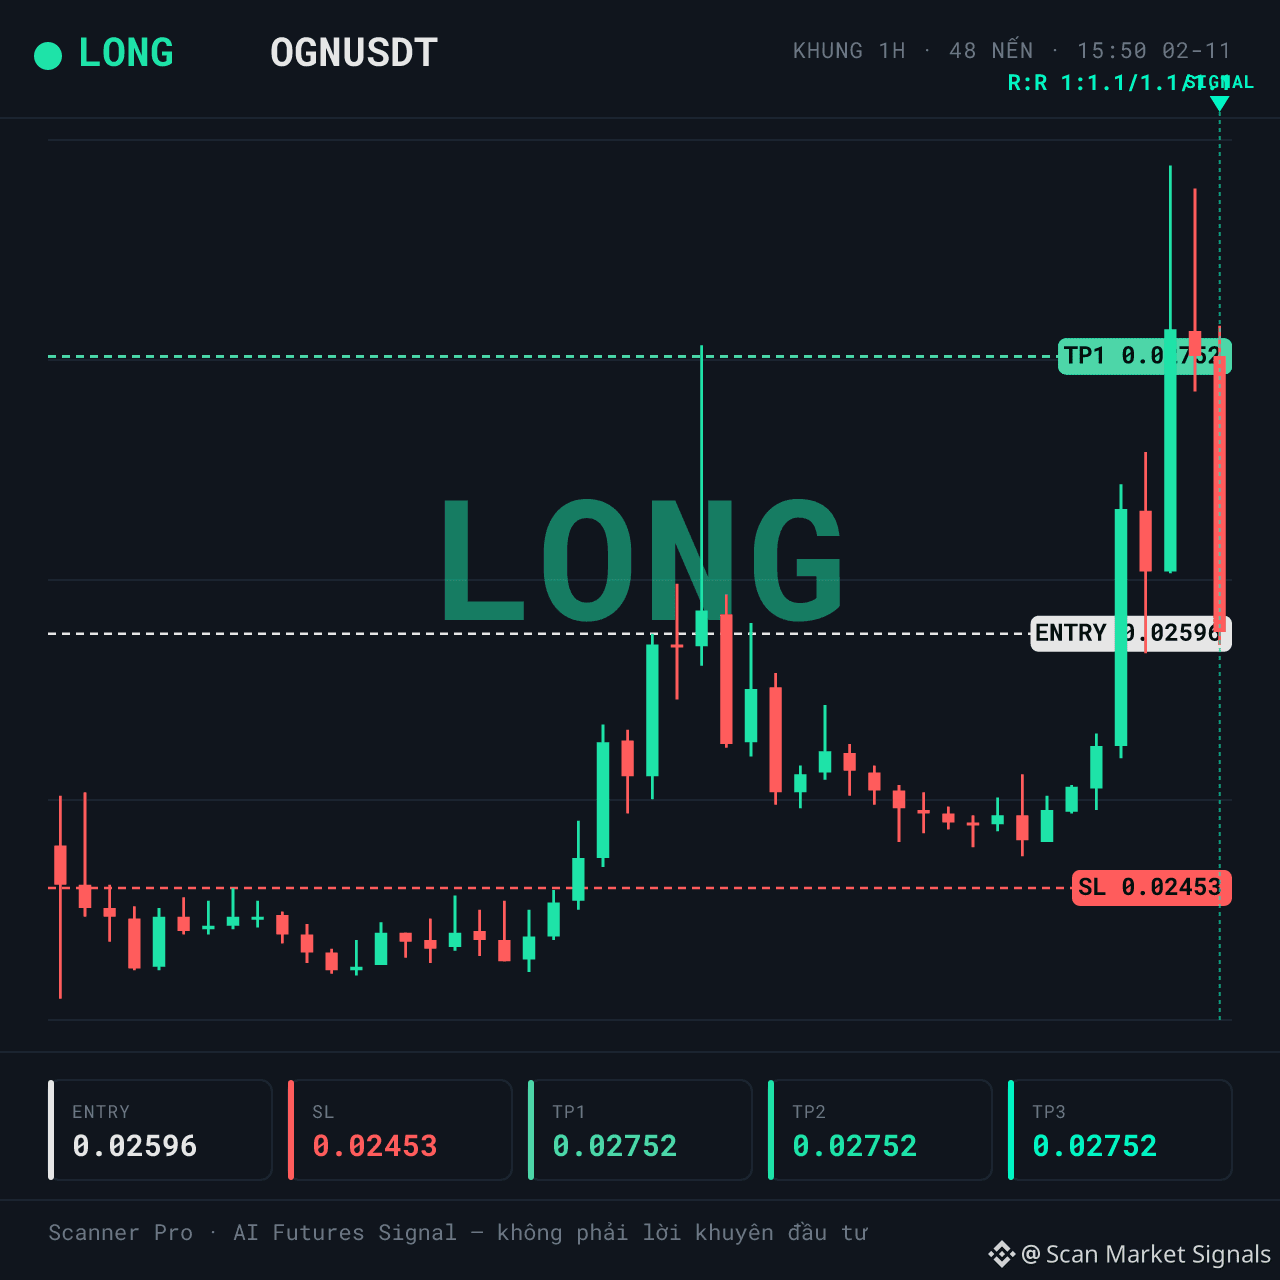
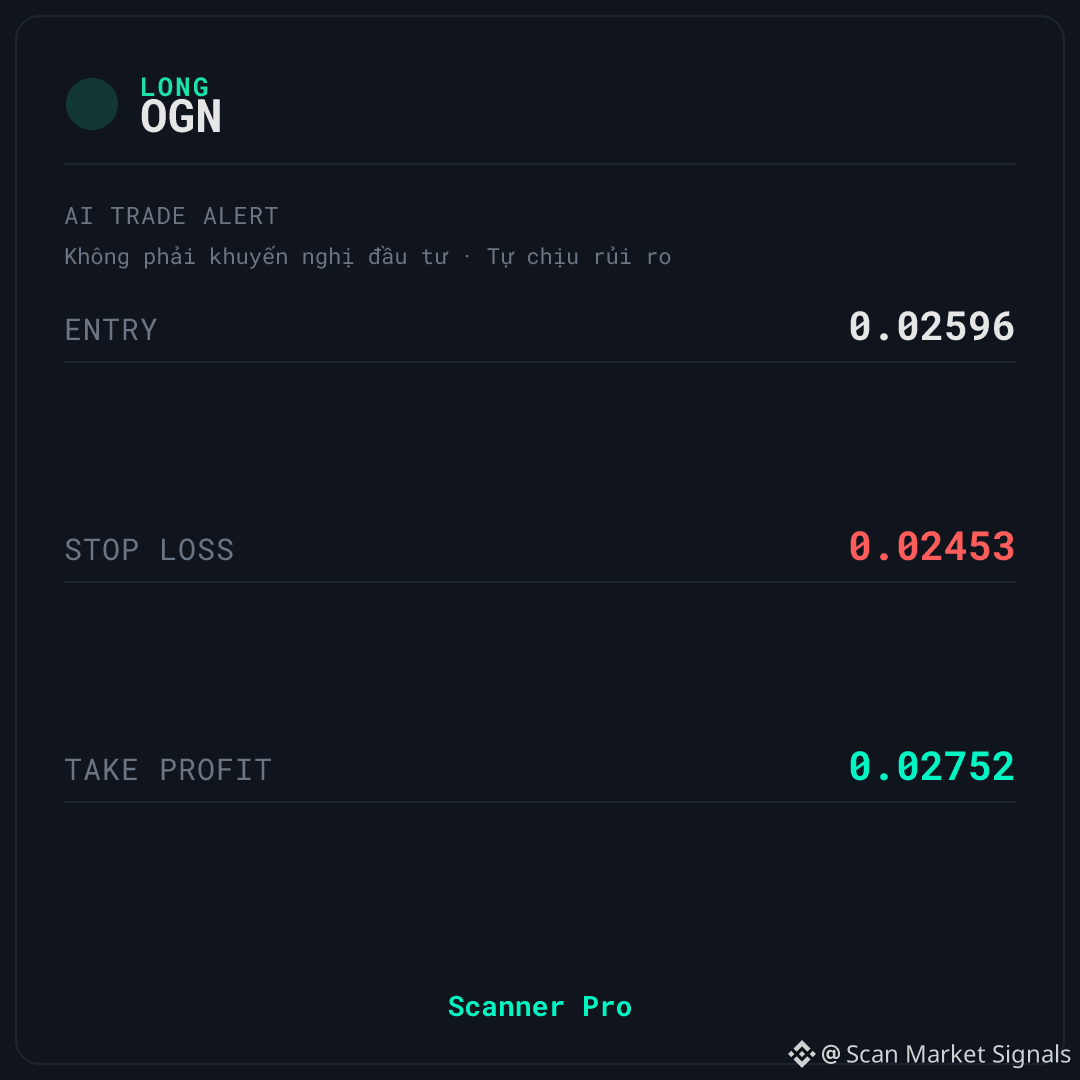
LONG $OGN | Is 1h momentum hot or cold — read carefully before following
🚨 AI TRADE ALERT — $OGN
🟢 LONG
📌 Entry: 0.02592 – 0.026
🛑 Stop Loss: 0.02453
🎯 Take Profit: 0.02752
⏰ Valid for: 6 hours (15:50 – 21:50 VN) - Date: 02/11
↔️ SIDEWAY — the market is moving sideways, with a fade (mean-reversion) signal
$OGN is being monitored by Scanner Pro for a LONG scenario as the price responds positively from a support zone. The market context is classified as sideways with 55 confidence, a 3.40x volume spike, and -0.0115% funding.
📊 WHAT THE DATA IS SHOWING
24h volume is approximately 26.192.344 in quote asset, alongside a 3.40x volume spike — a sign that money is flowing back in. Funding of -0.0115% shows that SHORT positions are paying LONG positions, meaning the crowd is leaning against the signal, which supports the LONG direction. However, the sideways regime has a confidence score of 55 (below 60) — the market context classification is not yet particularly robust, so this is not strong independent confirmation.
💡 SCENARIO & OPEN QUESTION — $OGN
⚠️ Biggest risk: the price is at 32% of the 24h range (the lower zone) while the scenario is LONG, but 1h momentum at 53.8 is not hot — there is no strong confirmation from the indicator yet. If the price closes below the stop-loss level on the signal card, the current LONG scenario is no longer valid. Do you think this is a liquidity sweep to accumulate, or just a weak bounce in a downtrend?
This is educational technical analysis, not investment advice. Cryptocurrency trading carries high risk, and you could lose all your capital. Do your own research and take responsibility for your decisions.
#Binance #Crypto #Futures
LONG $OGN | Is 1h momentum hot or cold — read carefully before following
🚨 AI TRADE ALERT — $OGN
🟢 LONG
📌 Entry: 0.02592 – 0.026
🛑 Stop Loss: 0.02453
🎯 Take Profit: 0.02752
⏰ Valid for: 6 hours (15:50 – 21:50 VN) - Date: 02/11
↔️ SIDEWAY — the market is moving sideways, with a fade (mean-reversion) signal
$OGN is being monitored by Scanner Pro for a LONG scenario as the price responds positively from a support zone. The market context is classified as sideways with 55 confidence, a 3.40x volume spike, and -0.0115% funding.
📊 WHAT THE DATA IS SHOWING
24h volume is approximately 26.192.344 in quote asset, alongside a 3.40x volume spike — a sign that money is flowing back in. Funding of -0.0115% shows that SHORT positions are paying LONG positions, meaning the crowd is leaning against the signal, which supports the LONG direction. However, the sideways regime has a confidence score of 55 (below 60) — the market context classification is not yet particularly robust, so this is not strong independent confirmation.
💡 SCENARIO & OPEN QUESTION — $OGN
⚠️ Biggest risk: the price is at 32% of the 24h range (the lower zone) while the scenario is LONG, but 1h momentum at 53.8 is not hot — there is no strong confirmation from the indicator yet. If the price closes below the stop-loss level on the signal card, the current LONG scenario is no longer valid. Do you think this is a liquidity sweep to accumulate, or just a weak bounce in a downtrend?
This is educational technical analysis, not investment advice. Cryptocurrency trading carries high risk, and you could lose all your capital. Do your own research and take responsibility for your decisions.
#Binance #Crypto #Futures
🚨 AI TRADE ALERT — $OGN
🟢 LONG
📌 Entry: 0.02592 – 0.026
🛑 Stop Loss: 0.02453
🎯 Take Profit: 0.02752
⏰ Valid for: 6 hours (15:50 – 21:50 VN) - Date: 02/11
↔️ SIDEWAY — the market is moving sideways, with a fade (mean-reversion) signal
$OGN is being monitored by Scanner Pro for a LONG scenario as the price responds positively from a support zone. The market context is classified as sideways with 55 confidence, a 3.40x volume spike, and -0.0115% funding.
📊 WHAT THE DATA IS SHOWING
24h volume is approximately 26.192.344 in quote asset, alongside a 3.40x volume spike — a sign that money is flowing back in. Funding of -0.0115% shows that SHORT positions are paying LONG positions, meaning the crowd is leaning against the signal, which supports the LONG direction. However, the sideways regime has a confidence score of 55 (below 60) — the market context classification is not yet particularly robust, so this is not strong independent confirmation.
💡 SCENARIO & OPEN QUESTION — $OGN
⚠️ Biggest risk: the price is at 32% of the 24h range (the lower zone) while the scenario is LONG, but 1h momentum at 53.8 is not hot — there is no strong confirmation from the indicator yet. If the price closes below the stop-loss level on the signal card, the current LONG scenario is no longer valid. Do you think this is a liquidity sweep to accumulate, or just a weak bounce in a downtrend?
This is educational technical analysis, not investment advice. Cryptocurrency trading carries high risk, and you could lose all your capital. Do your own research and take responsibility for your decisions.
#Binance #Crypto #Futures
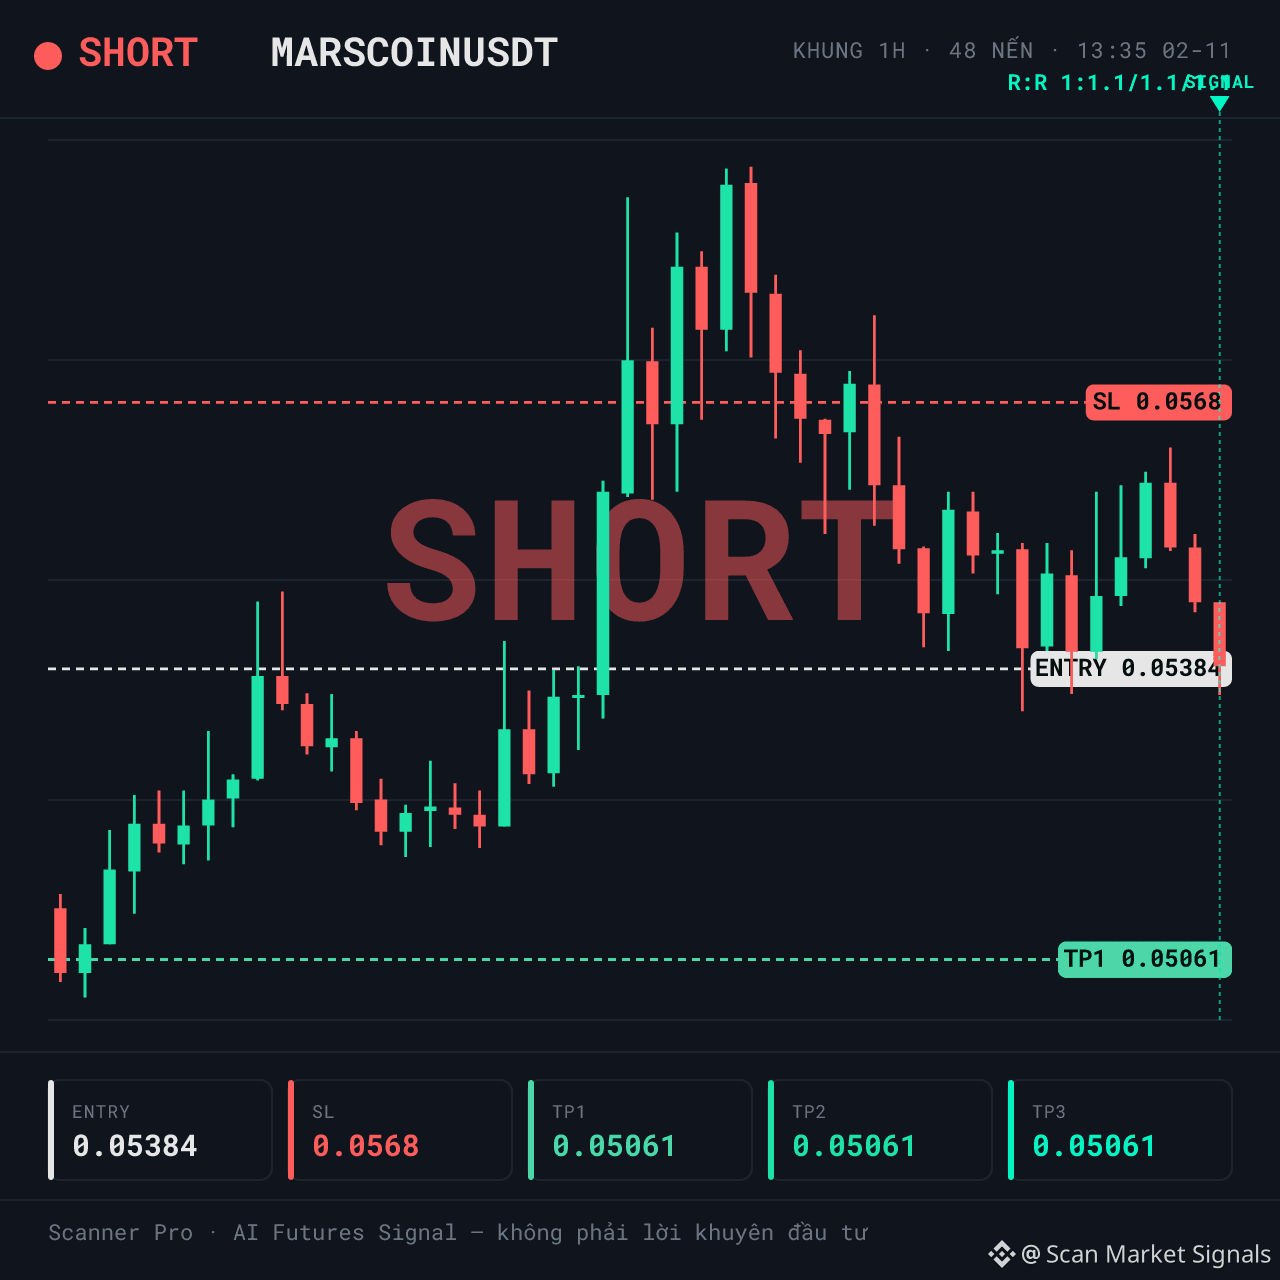
SHORT $MARSCOIN | 24h range is wide at 11.2% — is the market tense or quiet?
🚨 AI TRADE ALERT — $MARSCOIN
🔴 SHORT
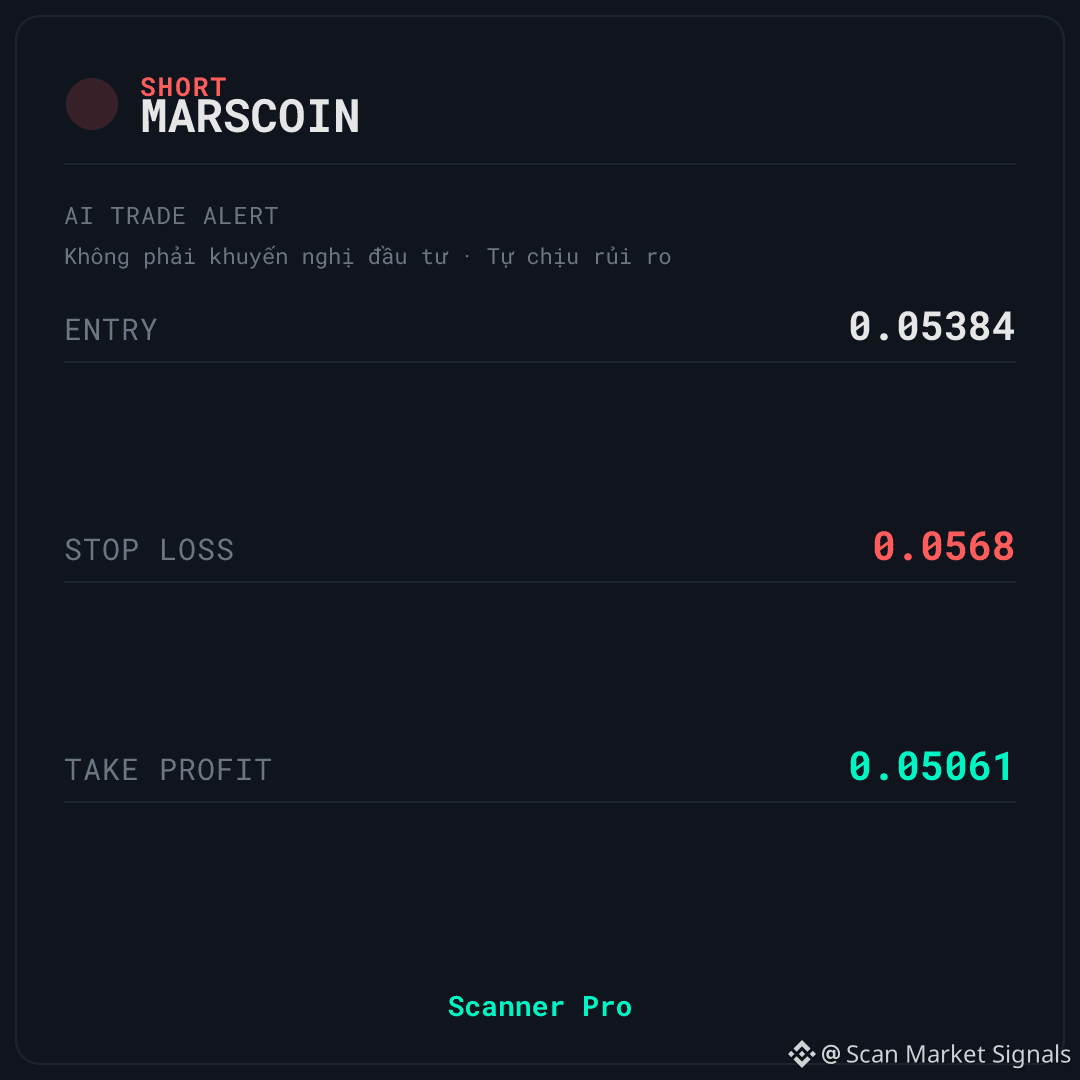
📌 Entry: 0.05376 – 0.05392
🛑 Stop Loss: 0.0568
🎯 Take Profit: 0.05061
⏰ Valid for: 6 hours (13:35 – 19:35 VN) - Date: 02/11
↔️ SIDEWAYS — the market is moving sideways, with a fade (mean-reversion) signal
$MARSCOIN is being monitored by Scanner Pro for a SHORT scenario as price reacts weakly within the sideways range. The sideways context, with a classification confidence of 55, and funding of 0.0050% indicate that LONG traders are paying fees to SHORT traders.
📊 CONTEXT & DATA
24h volume is approximately 28,497,248 in quote asset, with a 0.73x volume spike — meaning liquidity is high but there has been no sudden surge. Funding of 0.0050% means LONG traders are paying fees to SHORT traders, suggesting the crowd is leaning against this signal. The current price is 8% into the 24h range (which spans 11.2%), meaning it is near the day's low. Confidence in the sideways market classification is only 55, so this cannot yet be considered a solid basis.
🚫 INVALIDATION POINT & RISK MANAGEMENT — $MARSCOIN
⚠️ Biggest risk: price is near the low end of the 24h range (8%), so a technical rebound could happen at any time, which would be unfavorable for a SHORT position. Also, 1h momentum at 43.9 is no longer inherently weak — it is in neutral territory and does not further confirm the bearish scenario. If price closes above the stop-loss level on the signal card, the current SHORT scenario is no longer valid. Do you think this is a final liquidity sweep of the day or a genuine reversal signal?
This technical analysis is for educational purposes only and is not investment advice. Cryptocurrency trading involves high risk, and you could lose all your capital. Do your own research and take responsibility for your decisions.
#Binance #Crypto #Futures
SHORT $MARSCOIN | 24h range is wide at 11.2% — is the market tense or quiet?
🚨 AI TRADE ALERT — $MARSCOIN
🔴 SHORT
📌 Entry: 0.05376 – 0.05392
🛑 Stop Loss: 0.0568
🎯 Take Profit: 0.05061
⏰ Valid for: 6 hours (13:35 – 19:35 VN) - Date: 02/11
↔️ SIDEWAYS — the market is moving sideways, with a fade (mean-reversion) signal
$MARSCOIN is being monitored by Scanner Pro for a SHORT scenario as price reacts weakly within the sideways range. The sideways context, with a classification confidence of 55, and funding of 0.0050% indicate that LONG traders are paying fees to SHORT traders.
📊 CONTEXT & DATA
24h volume is approximately 28,497,248 in quote asset, with a 0.73x volume spike — meaning liquidity is high but there has been no sudden surge. Funding of 0.0050% means LONG traders are paying fees to SHORT traders, suggesting the crowd is leaning against this signal. The current price is 8% into the 24h range (which spans 11.2%), meaning it is near the day's low. Confidence in the sideways market classification is only 55, so this cannot yet be considered a solid basis.
🚫 INVALIDATION POINT & RISK MANAGEMENT — $MARSCOIN
⚠️ Biggest risk: price is near the low end of the 24h range (8%), so a technical rebound could happen at any time, which would be unfavorable for a SHORT position. Also, 1h momentum at 43.9 is no longer inherently weak — it is in neutral territory and does not further confirm the bearish scenario. If price closes above the stop-loss level on the signal card, the current SHORT scenario is no longer valid. Do you think this is a final liquidity sweep of the day or a genuine reversal signal?
This technical analysis is for educational purposes only and is not investment advice. Cryptocurrency trading involves high risk, and you could lose all your capital. Do your own research and take responsibility for your decisions.
#Binance #Crypto #Futures
🚨 AI TRADE ALERT — $MARSCOIN
🔴 SHORT
📌 Entry: 0.05376 – 0.05392
🛑 Stop Loss: 0.0568
🎯 Take Profit: 0.05061
⏰ Valid for: 6 hours (13:35 – 19:35 VN) - Date: 02/11
↔️ SIDEWAYS — the market is moving sideways, with a fade (mean-reversion) signal
$MARSCOIN is being monitored by Scanner Pro for a SHORT scenario as price reacts weakly within the sideways range. The sideways context, with a classification confidence of 55, and funding of 0.0050% indicate that LONG traders are paying fees to SHORT traders.
📊 CONTEXT & DATA
24h volume is approximately 28,497,248 in quote asset, with a 0.73x volume spike — meaning liquidity is high but there has been no sudden surge. Funding of 0.0050% means LONG traders are paying fees to SHORT traders, suggesting the crowd is leaning against this signal. The current price is 8% into the 24h range (which spans 11.2%), meaning it is near the day's low. Confidence in the sideways market classification is only 55, so this cannot yet be considered a solid basis.
🚫 INVALIDATION POINT & RISK MANAGEMENT — $MARSCOIN
⚠️ Biggest risk: price is near the low end of the 24h range (8%), so a technical rebound could happen at any time, which would be unfavorable for a SHORT position. Also, 1h momentum at 43.9 is no longer inherently weak — it is in neutral territory and does not further confirm the bearish scenario. If price closes above the stop-loss level on the signal card, the current SHORT scenario is no longer valid. Do you think this is a final liquidity sweep of the day or a genuine reversal signal?
This technical analysis is for educational purposes only and is not investment advice. Cryptocurrency trading involves high risk, and you could lose all your capital. Do your own research and take responsibility for your decisions.
#Binance #Crypto #Futures
2
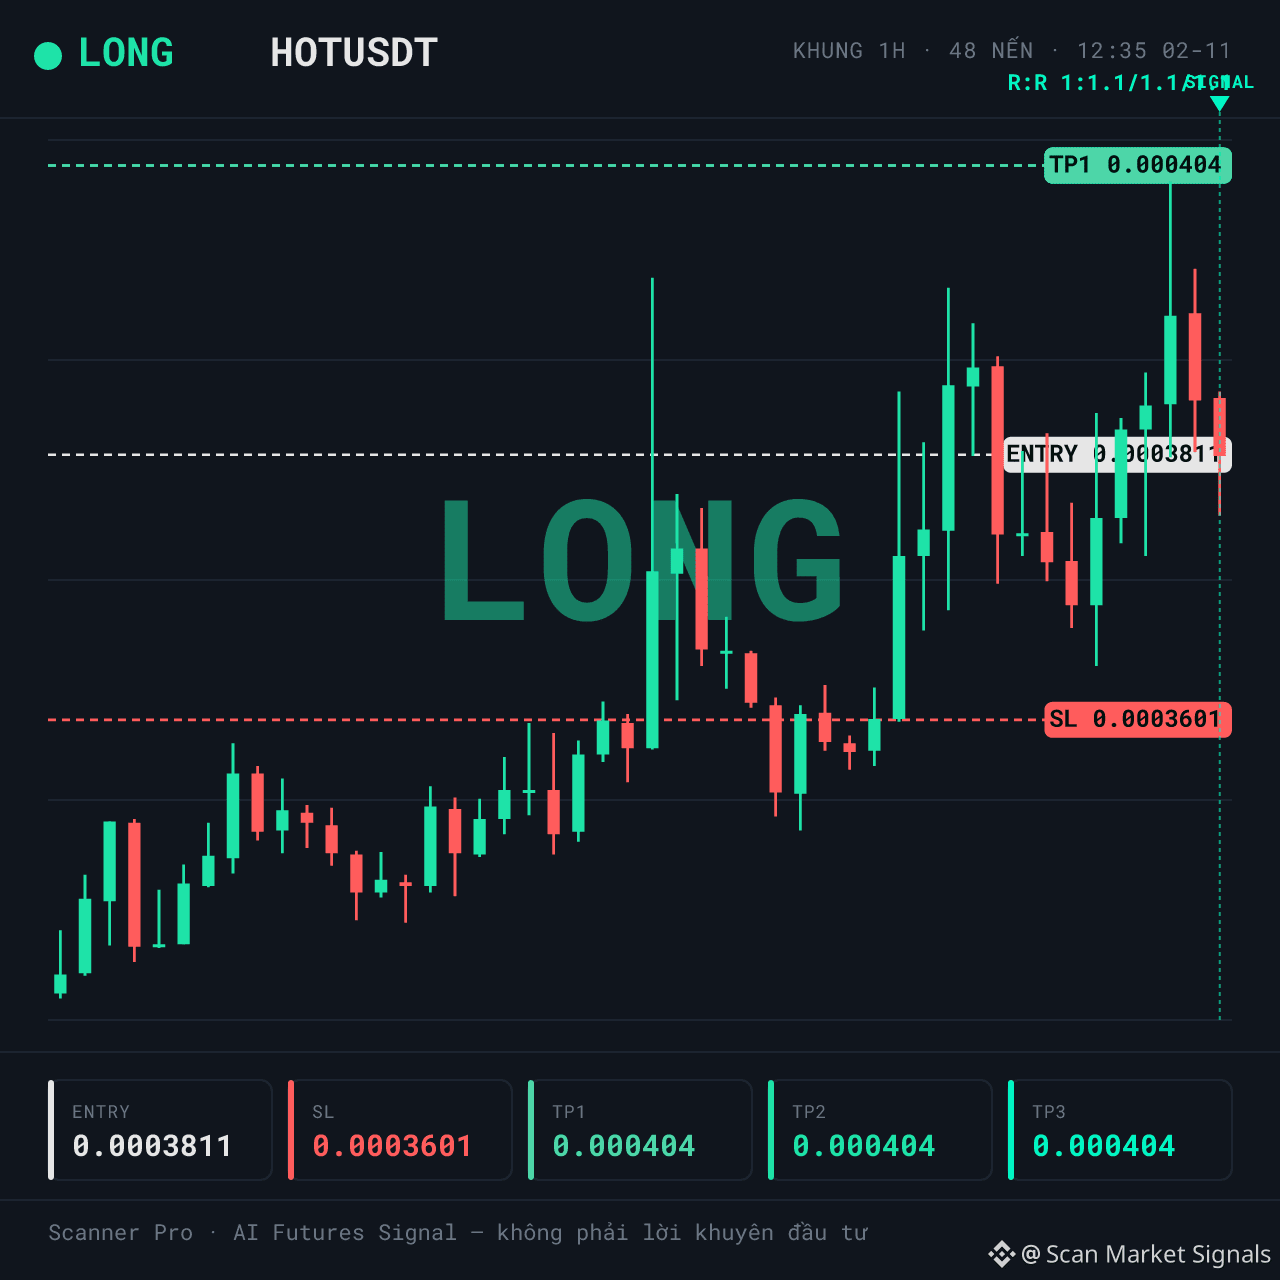
LONG $HOT | Volume contracts, funding turns negative: accumulation signal or a fakeout?
🚨 AI TRADE ALERT — $HOT
🟢 LONG
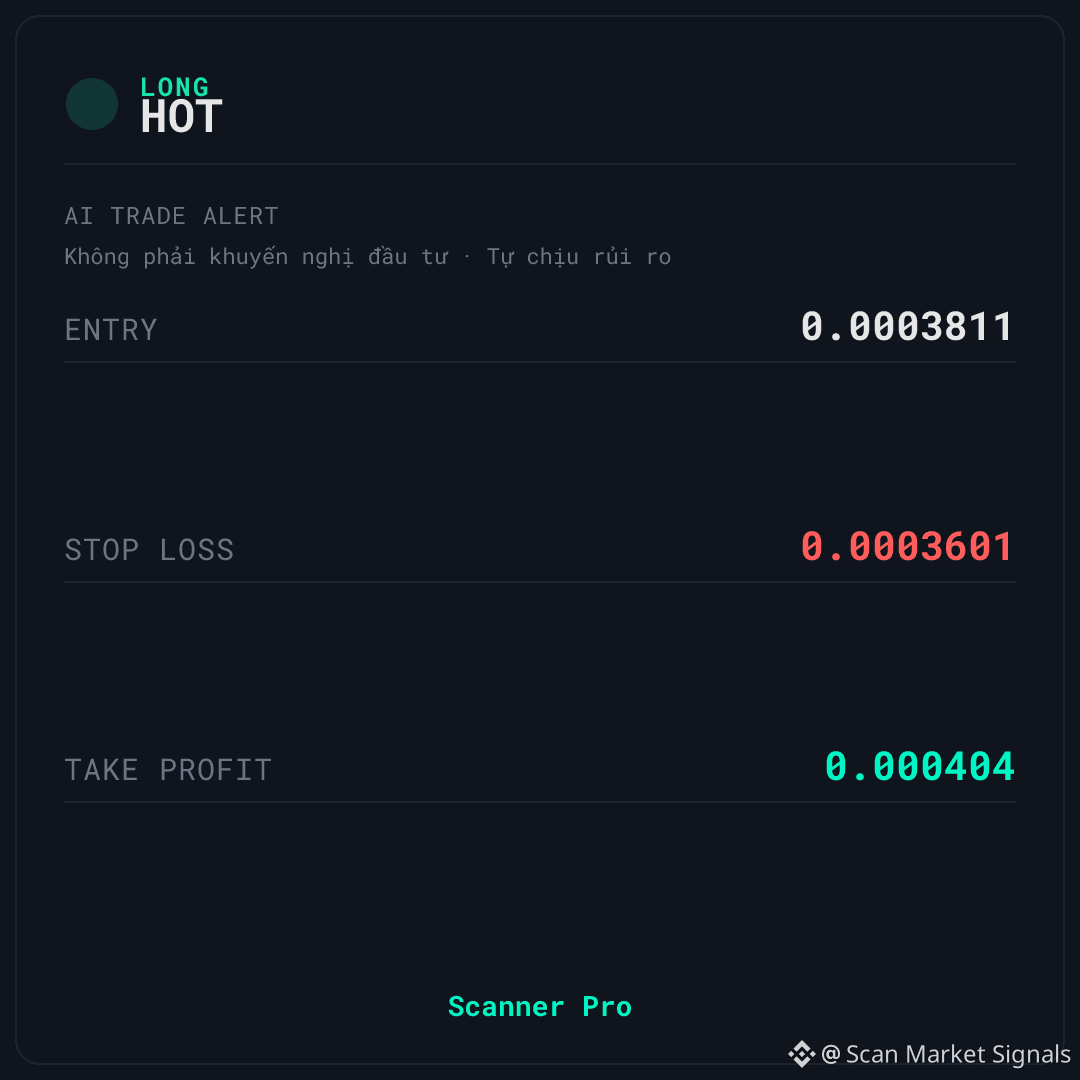
📌 Entry: 0.0003805 – 0.0003817
🛑 Stop Loss: 0.0003601
🎯 Take Profit: 0.000404
⏰ Valid for: 6 hours (12:35 – 18:35 VN) - Date: 02/11
↔️ SIDEWAYS — market moving sideways, fade (mean-reversion) signal
$HOT is being monitored by Scanner Pro for a LONG setup as long as the price holds above the short-term EMA zone. The sideways context has a classification confidence of 55, 24-hour volume of around 29,317,864, and negative funding, indicating that short positions are paying fees.
📊 CONTEXT & DATA
The price is currently at 58% of the 24-hour range — neither too high nor too low, consistent with sideways conditions. Funding at -1.0296% means SHORT positions are paying fees to LONG positions, so the crowd is leaning against this signal, which mildly supports the LONG setup. However, the volume spike is only 0.50x — volume is not unusually high compared with the average, suggesting that money has not yet really flowed in.
🚫 INVALIDATION POINT & RISK MANAGEMENT — $HOT
⚠️ The biggest drawback: confidence in the context classification is only 55, which is not strong enough to confirm a clear trend. Additionally, volume does not confirm the move — a breakout without volume often fails. If the price closes below the stop-loss level on the signal card, the current LONG setup is no longer valid. 💡 Do you think this is accumulation before a breakout or just a bounce within a downtrend?
This is educational technical analysis content, not investment advice. Cryptocurrency trading involves high risk, and you could lose all your capital. Do your own research and take responsibility for your decisions.
#Binance #Crypto #Futures
LONG $HOT | Volume contracts, funding turns negative: accumulation signal or a fakeout?
🚨 AI TRADE ALERT — $HOT
🟢 LONG
📌 Entry: 0.0003805 – 0.0003817
🛑 Stop Loss: 0.0003601
🎯 Take Profit: 0.000404
⏰ Valid for: 6 hours (12:35 – 18:35 VN) - Date: 02/11
↔️ SIDEWAYS — market moving sideways, fade (mean-reversion) signal
$HOT is being monitored by Scanner Pro for a LONG setup as long as the price holds above the short-term EMA zone. The sideways context has a classification confidence of 55, 24-hour volume of around 29,317,864, and negative funding, indicating that short positions are paying fees.
📊 CONTEXT & DATA
The price is currently at 58% of the 24-hour range — neither too high nor too low, consistent with sideways conditions. Funding at -1.0296% means SHORT positions are paying fees to LONG positions, so the crowd is leaning against this signal, which mildly supports the LONG setup. However, the volume spike is only 0.50x — volume is not unusually high compared with the average, suggesting that money has not yet really flowed in.
🚫 INVALIDATION POINT & RISK MANAGEMENT — $HOT
⚠️ The biggest drawback: confidence in the context classification is only 55, which is not strong enough to confirm a clear trend. Additionally, volume does not confirm the move — a breakout without volume often fails. If the price closes below the stop-loss level on the signal card, the current LONG setup is no longer valid. 💡 Do you think this is accumulation before a breakout or just a bounce within a downtrend?
This is educational technical analysis content, not investment advice. Cryptocurrency trading involves high risk, and you could lose all your capital. Do your own research and take responsibility for your decisions.
#Binance #Crypto #Futures
🚨 AI TRADE ALERT — $HOT
🟢 LONG
📌 Entry: 0.0003805 – 0.0003817
🛑 Stop Loss: 0.0003601
🎯 Take Profit: 0.000404
⏰ Valid for: 6 hours (12:35 – 18:35 VN) - Date: 02/11
↔️ SIDEWAYS — market moving sideways, fade (mean-reversion) signal
$HOT is being monitored by Scanner Pro for a LONG setup as long as the price holds above the short-term EMA zone. The sideways context has a classification confidence of 55, 24-hour volume of around 29,317,864, and negative funding, indicating that short positions are paying fees.
📊 CONTEXT & DATA
The price is currently at 58% of the 24-hour range — neither too high nor too low, consistent with sideways conditions. Funding at -1.0296% means SHORT positions are paying fees to LONG positions, so the crowd is leaning against this signal, which mildly supports the LONG setup. However, the volume spike is only 0.50x — volume is not unusually high compared with the average, suggesting that money has not yet really flowed in.
🚫 INVALIDATION POINT & RISK MANAGEMENT — $HOT
⚠️ The biggest drawback: confidence in the context classification is only 55, which is not strong enough to confirm a clear trend. Additionally, volume does not confirm the move — a breakout without volume often fails. If the price closes below the stop-loss level on the signal card, the current LONG setup is no longer valid. 💡 Do you think this is accumulation before a breakout or just a bounce within a downtrend?
This is educational technical analysis content, not investment advice. Cryptocurrency trading involves high risk, and you could lose all your capital. Do your own research and take responsibility for your decisions.
#Binance #Crypto #Futures
27
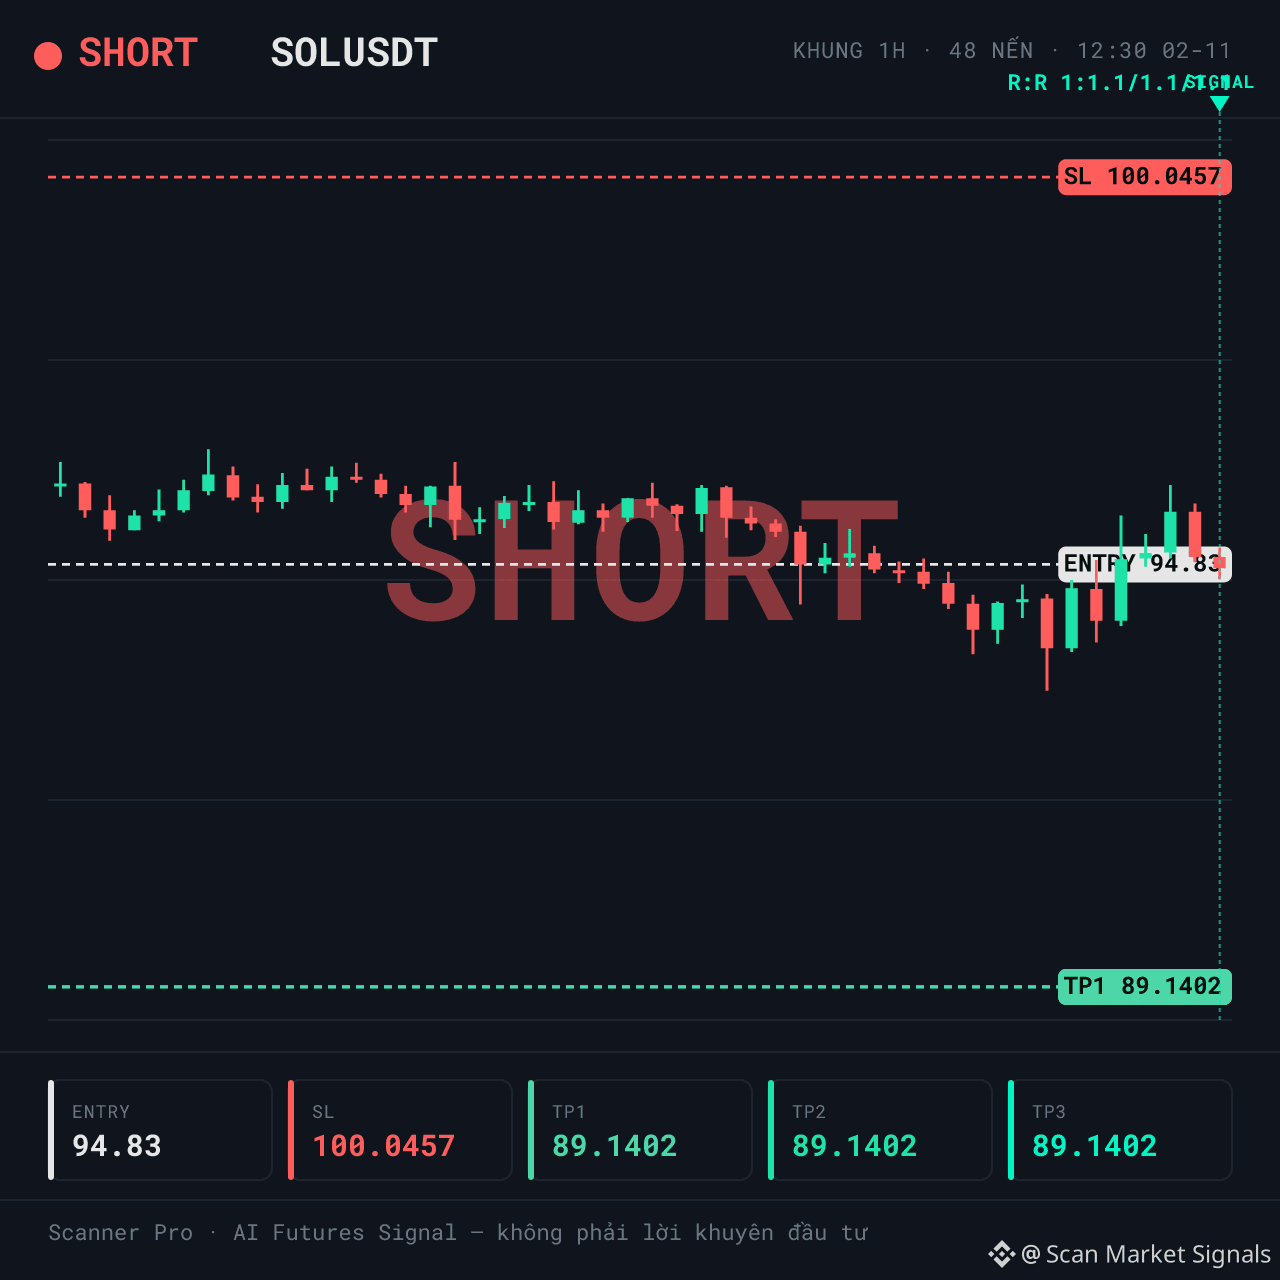
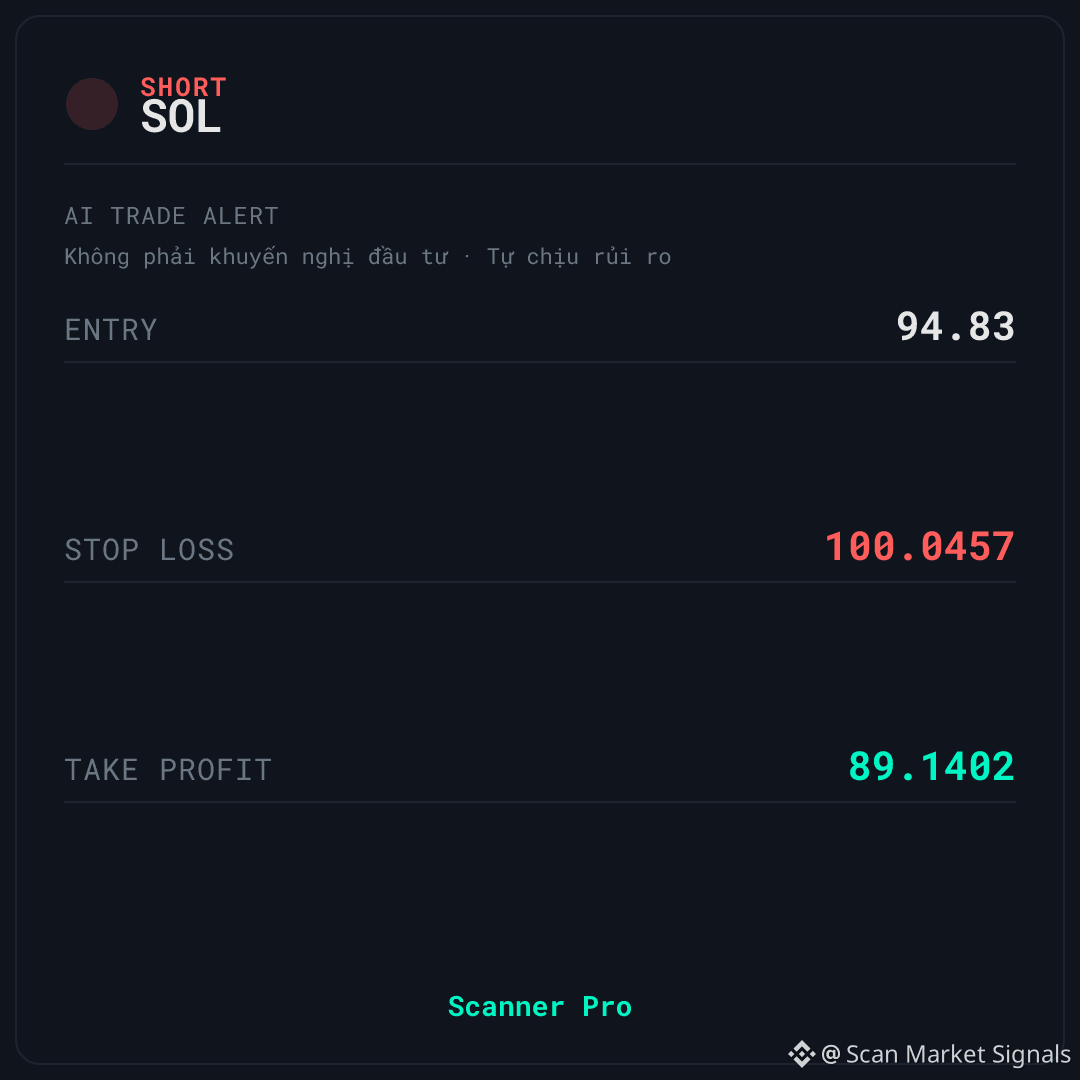
SHORT $SOL | Momentum is cooling — reversal signal or just a pause?
🚨 AI TRADE ALERT — $SOL
🔴 SHORT
📌 Entry: 94.6878 – 94.9722
🛑 Stop Loss: 100.0457
🎯 Take Profit: 89.1402
⏰ Valid for: 6 hours (12:30 – 18:30 VN) - Date: 02/11
↔️ SIDEWAY — the market is moving sideways, a fade (mean-reversion) signal
$SOL is being monitored by Scanner Pro for a SHORT scenario as the price reacts to the upper resistance zone. The market context is classified as sideways, with a classification confidence of 55 and 24-hour volume of approximately 1,007,894,708 quote units.
📊 WHAT THE DATA IS SHOWING
24-hour trading volume is high, but the volume spike is only 0.75x — meaning liquidity is abundant, but there has not been any unusual surge. Funding at 0.0100% indicates LONG traders are paying SHORT traders, meaning the crowd is leaning against the SHORT signal — this supports the bearish scenario from a sentiment perspective. The price is currently at 61% of the 24-hour range, neither too high nor too low, so there is still room in both directions. 1-hour momentum is at 48.9 — a neutral zone that does not yet show clear selling pressure.
💡 SCENARIO & OPEN QUESTION — $SOL
⚠️ The biggest risk is that the market is classified as sideways with a confidence of only 55 — not strong enough to confirm a trend, so the SHORT signal may be noisy if the price moves within a narrow range. In addition, 1-hour momentum at 48.9 remains in neutral territory and does not confirm strong downward momentum, so the scenario needs more time to be validated. If the price closes above the stop-loss level on the signal card, the current SHORT scenario is no longer valid. Do you think this is a liquidity sweep or a genuine reversal signal?
This technical analysis content is for educational purposes only and is not investment advice. Cryptocurrency trading carries high risk, and you could lose all your capital. Do your own research and take responsibility for your decisions.
#Binance #Crypto #Futures
SHORT $SOL | Momentum is cooling — reversal signal or just a pause?
🚨 AI TRADE ALERT — $SOL
🔴 SHORT
📌 Entry: 94.6878 – 94.9722
🛑 Stop Loss: 100.0457
🎯 Take Profit: 89.1402
⏰ Valid for: 6 hours (12:30 – 18:30 VN) - Date: 02/11
↔️ SIDEWAY — the market is moving sideways, a fade (mean-reversion) signal
$SOL is being monitored by Scanner Pro for a SHORT scenario as the price reacts to the upper resistance zone. The market context is classified as sideways, with a classification confidence of 55 and 24-hour volume of approximately 1,007,894,708 quote units.
📊 WHAT THE DATA IS SHOWING
24-hour trading volume is high, but the volume spike is only 0.75x — meaning liquidity is abundant, but there has not been any unusual surge. Funding at 0.0100% indicates LONG traders are paying SHORT traders, meaning the crowd is leaning against the SHORT signal — this supports the bearish scenario from a sentiment perspective. The price is currently at 61% of the 24-hour range, neither too high nor too low, so there is still room in both directions. 1-hour momentum is at 48.9 — a neutral zone that does not yet show clear selling pressure.
💡 SCENARIO & OPEN QUESTION — $SOL
⚠️ The biggest risk is that the market is classified as sideways with a confidence of only 55 — not strong enough to confirm a trend, so the SHORT signal may be noisy if the price moves within a narrow range. In addition, 1-hour momentum at 48.9 remains in neutral territory and does not confirm strong downward momentum, so the scenario needs more time to be validated. If the price closes above the stop-loss level on the signal card, the current SHORT scenario is no longer valid. Do you think this is a liquidity sweep or a genuine reversal signal?
This technical analysis content is for educational purposes only and is not investment advice. Cryptocurrency trading carries high risk, and you could lose all your capital. Do your own research and take responsibility for your decisions.
#Binance #Crypto #Futures
🚨 AI TRADE ALERT — $SOL
🔴 SHORT
📌 Entry: 94.6878 – 94.9722
🛑 Stop Loss: 100.0457
🎯 Take Profit: 89.1402
⏰ Valid for: 6 hours (12:30 – 18:30 VN) - Date: 02/11
↔️ SIDEWAY — the market is moving sideways, a fade (mean-reversion) signal
$SOL is being monitored by Scanner Pro for a SHORT scenario as the price reacts to the upper resistance zone. The market context is classified as sideways, with a classification confidence of 55 and 24-hour volume of approximately 1,007,894,708 quote units.
📊 WHAT THE DATA IS SHOWING
24-hour trading volume is high, but the volume spike is only 0.75x — meaning liquidity is abundant, but there has not been any unusual surge. Funding at 0.0100% indicates LONG traders are paying SHORT traders, meaning the crowd is leaning against the SHORT signal — this supports the bearish scenario from a sentiment perspective. The price is currently at 61% of the 24-hour range, neither too high nor too low, so there is still room in both directions. 1-hour momentum is at 48.9 — a neutral zone that does not yet show clear selling pressure.
💡 SCENARIO & OPEN QUESTION — $SOL
⚠️ The biggest risk is that the market is classified as sideways with a confidence of only 55 — not strong enough to confirm a trend, so the SHORT signal may be noisy if the price moves within a narrow range. In addition, 1-hour momentum at 48.9 remains in neutral territory and does not confirm strong downward momentum, so the scenario needs more time to be validated. If the price closes above the stop-loss level on the signal card, the current SHORT scenario is no longer valid. Do you think this is a liquidity sweep or a genuine reversal signal?
This technical analysis content is for educational purposes only and is not investment advice. Cryptocurrency trading carries high risk, and you could lose all your capital. Do your own research and take responsibility for your decisions.
#Binance #Crypto #Futures
29
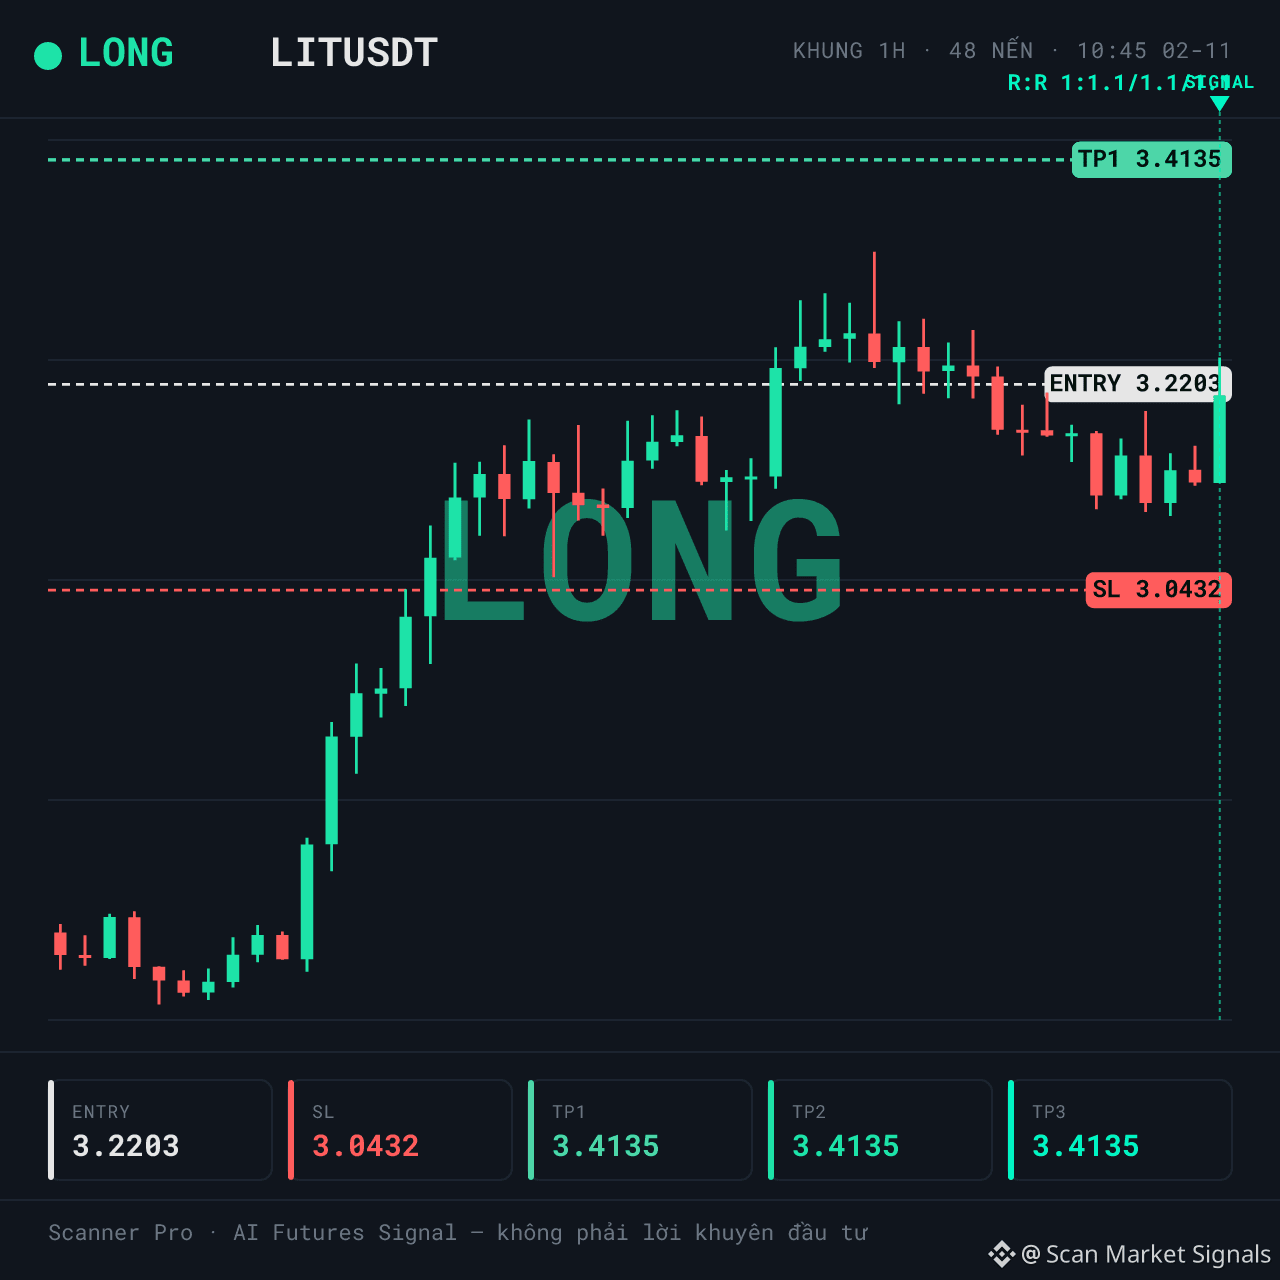
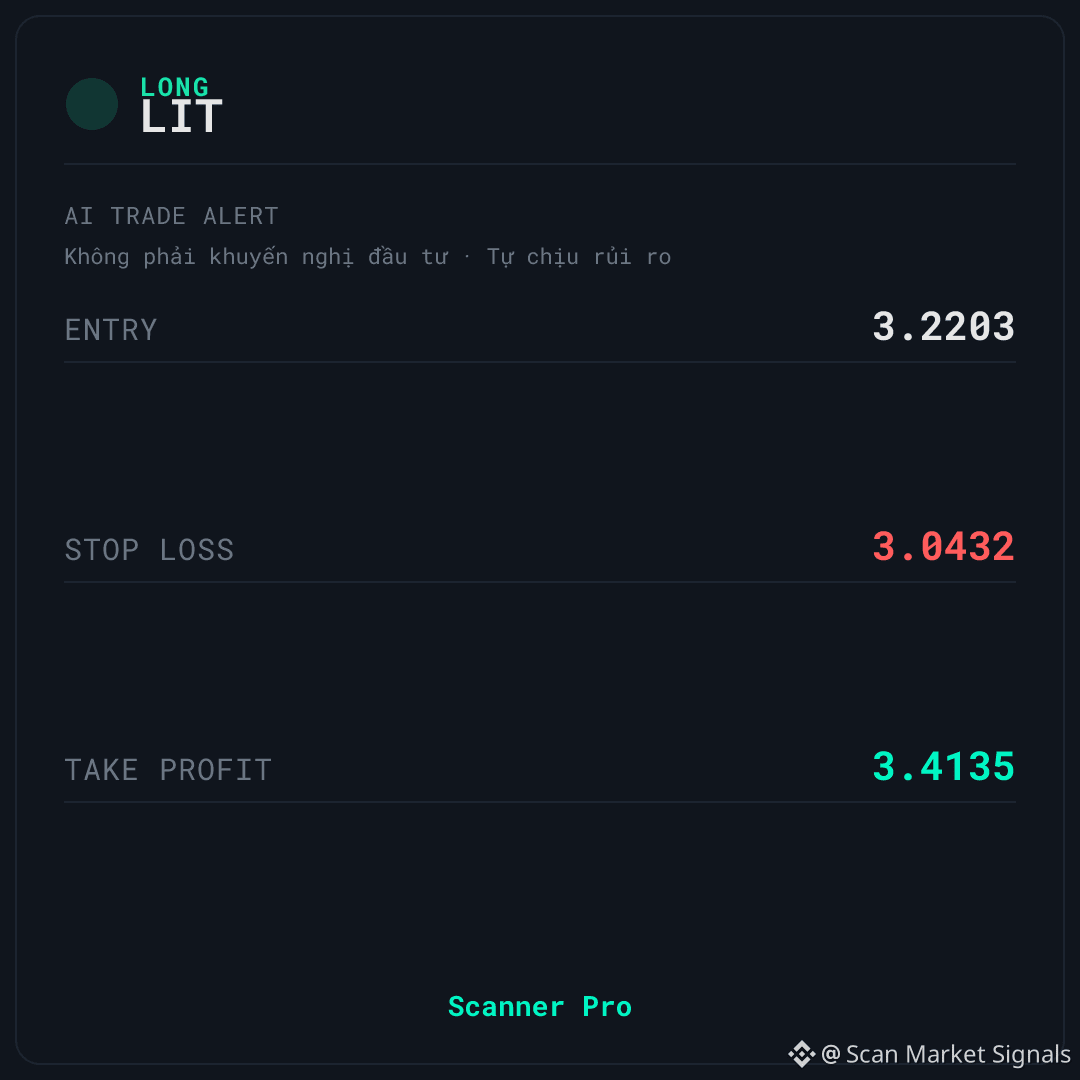
LONG $LIT | Price is mid-range within the 24h range; momentum has heated up
🚨 AI TRADE ALERT — $LIT
🟢 LONG
📌 Entry: 3.2155 – 3.2251
🛑 Stop Loss: 3.0432
🎯 Take Profit: 3.4135
⏰ Valid for: 6 hours (10:45 – 16:45 VN) - Date: 02/11
↔️ SIDEWAY — the market is moving sideways; fade (mean-reversion) signal
$LIT is being monitored by Scanner Pro for a LONG scenario while the price holds above the short-term moving averages. The context is classified as sideways with a classification confidence of 55, 24h volume of approximately 100,040,806 in the quote asset, and a volume spike of 0.80x.
📊 WHY IT’S WORTH WATCHING
The price is currently at 52% of the 24h range — mid-range, neither near the bottom nor the top. The EMA9-above-EMA21 structure on both the 1h and 4h charts remains intact, while an ADX of 27.3 on the 1h chart indicates that short-term trend strength is present. Funding is 0.0050%: LONG traders are paying SHORT traders, meaning the crowd is leaning in the same direction as the signal — a drawback that needs to be stated plainly. The context is classified as sideways, which suits a fade strategy better than chasing the price.
⚠️ SETUP & RISKS — $LIT
🚫 1h RSI is 60.05 — momentum has heated up, so it no longer supports the buy scenario. In addition, confidence in the context classification is only 55, which is not high; and LONG traders are more crowded and paying fees — a risk to monitor. If the price closes below the stop-loss level on the signal card, the current LONG scenario is no longer valid. Do you think this level will hold, or does the price need a deeper retest?
This is educational technical analysis content, not investment advice. Cryptocurrency trading involves high risk, and you could lose all your capital. Do your own research and take responsibility for your decisions.
#Binance #Crypto #Futures
LONG $LIT | Price is mid-range within the 24h range; momentum has heated up
🚨 AI TRADE ALERT — $LIT
🟢 LONG
📌 Entry: 3.2155 – 3.2251
🛑 Stop Loss: 3.0432
🎯 Take Profit: 3.4135
⏰ Valid for: 6 hours (10:45 – 16:45 VN) - Date: 02/11
↔️ SIDEWAY — the market is moving sideways; fade (mean-reversion) signal
$LIT is being monitored by Scanner Pro for a LONG scenario while the price holds above the short-term moving averages. The context is classified as sideways with a classification confidence of 55, 24h volume of approximately 100,040,806 in the quote asset, and a volume spike of 0.80x.
📊 WHY IT’S WORTH WATCHING
The price is currently at 52% of the 24h range — mid-range, neither near the bottom nor the top. The EMA9-above-EMA21 structure on both the 1h and 4h charts remains intact, while an ADX of 27.3 on the 1h chart indicates that short-term trend strength is present. Funding is 0.0050%: LONG traders are paying SHORT traders, meaning the crowd is leaning in the same direction as the signal — a drawback that needs to be stated plainly. The context is classified as sideways, which suits a fade strategy better than chasing the price.
⚠️ SETUP & RISKS — $LIT
🚫 1h RSI is 60.05 — momentum has heated up, so it no longer supports the buy scenario. In addition, confidence in the context classification is only 55, which is not high; and LONG traders are more crowded and paying fees — a risk to monitor. If the price closes below the stop-loss level on the signal card, the current LONG scenario is no longer valid. Do you think this level will hold, or does the price need a deeper retest?
This is educational technical analysis content, not investment advice. Cryptocurrency trading involves high risk, and you could lose all your capital. Do your own research and take responsibility for your decisions.
#Binance #Crypto #Futures
🚨 AI TRADE ALERT — $LIT
🟢 LONG
📌 Entry: 3.2155 – 3.2251
🛑 Stop Loss: 3.0432
🎯 Take Profit: 3.4135
⏰ Valid for: 6 hours (10:45 – 16:45 VN) - Date: 02/11
↔️ SIDEWAY — the market is moving sideways; fade (mean-reversion) signal
$LIT is being monitored by Scanner Pro for a LONG scenario while the price holds above the short-term moving averages. The context is classified as sideways with a classification confidence of 55, 24h volume of approximately 100,040,806 in the quote asset, and a volume spike of 0.80x.
📊 WHY IT’S WORTH WATCHING
The price is currently at 52% of the 24h range — mid-range, neither near the bottom nor the top. The EMA9-above-EMA21 structure on both the 1h and 4h charts remains intact, while an ADX of 27.3 on the 1h chart indicates that short-term trend strength is present. Funding is 0.0050%: LONG traders are paying SHORT traders, meaning the crowd is leaning in the same direction as the signal — a drawback that needs to be stated plainly. The context is classified as sideways, which suits a fade strategy better than chasing the price.
⚠️ SETUP & RISKS — $LIT
🚫 1h RSI is 60.05 — momentum has heated up, so it no longer supports the buy scenario. In addition, confidence in the context classification is only 55, which is not high; and LONG traders are more crowded and paying fees — a risk to monitor. If the price closes below the stop-loss level on the signal card, the current LONG scenario is no longer valid. Do you think this level will hold, or does the price need a deeper retest?
This is educational technical analysis content, not investment advice. Cryptocurrency trading involves high risk, and you could lose all your capital. Do your own research and take responsibility for your decisions.
#Binance #Crypto #Futures
44
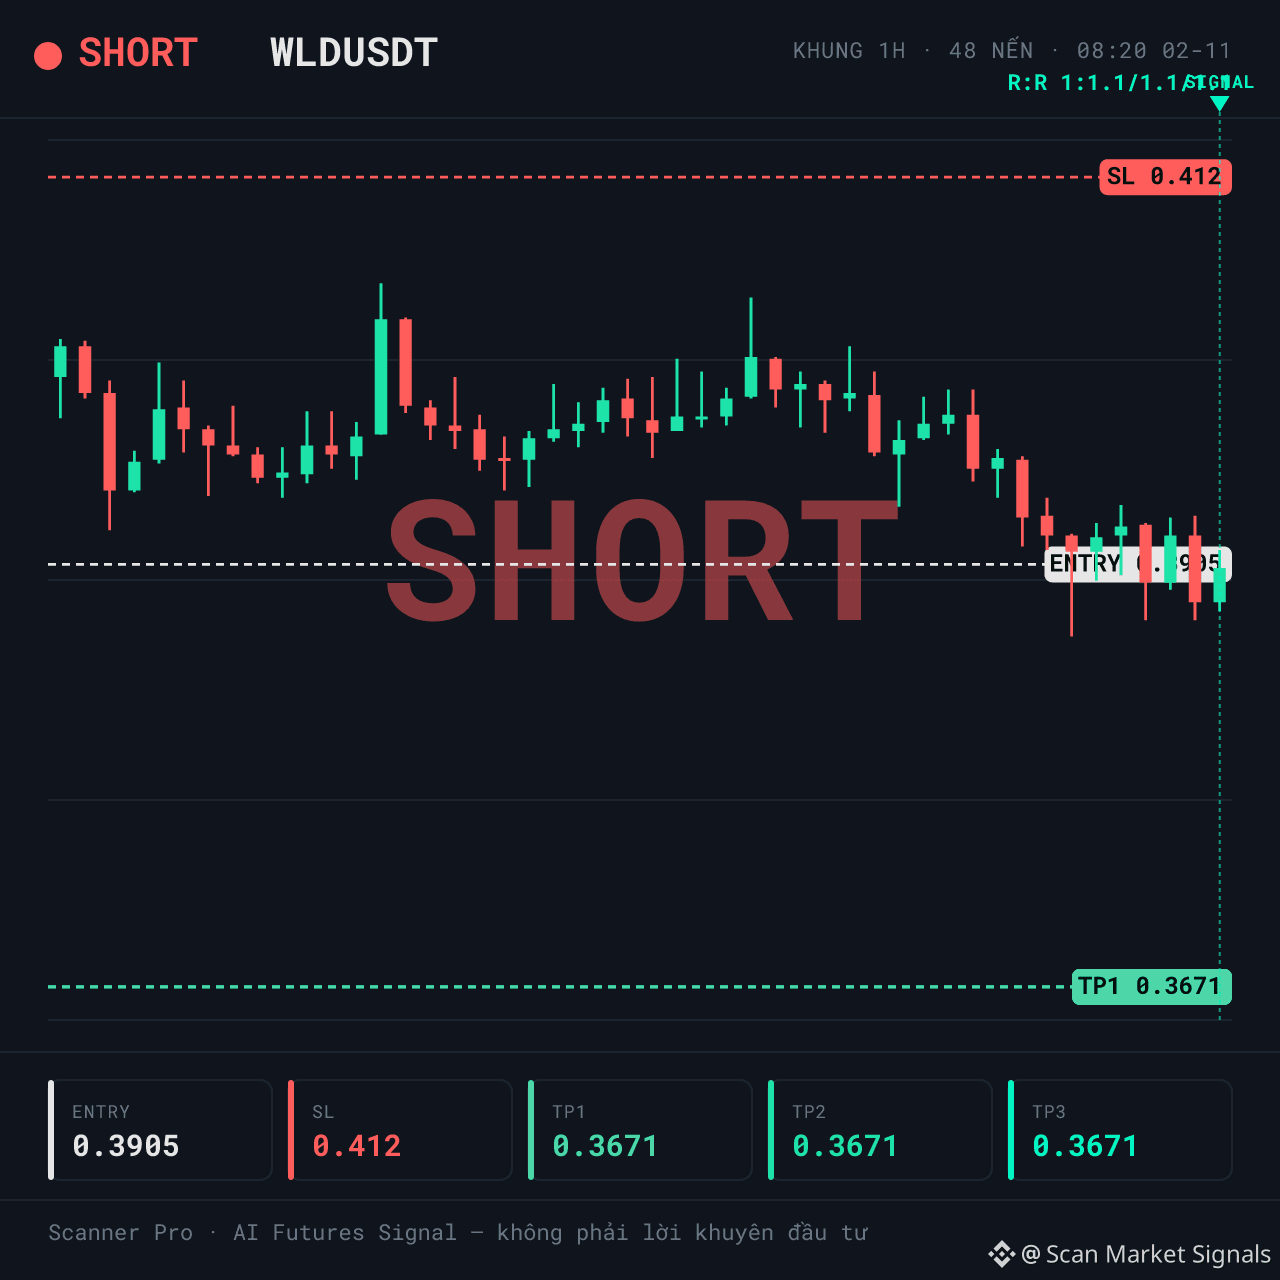
SHORT $WLD | Contracting volume — is selling pressure losing steam?
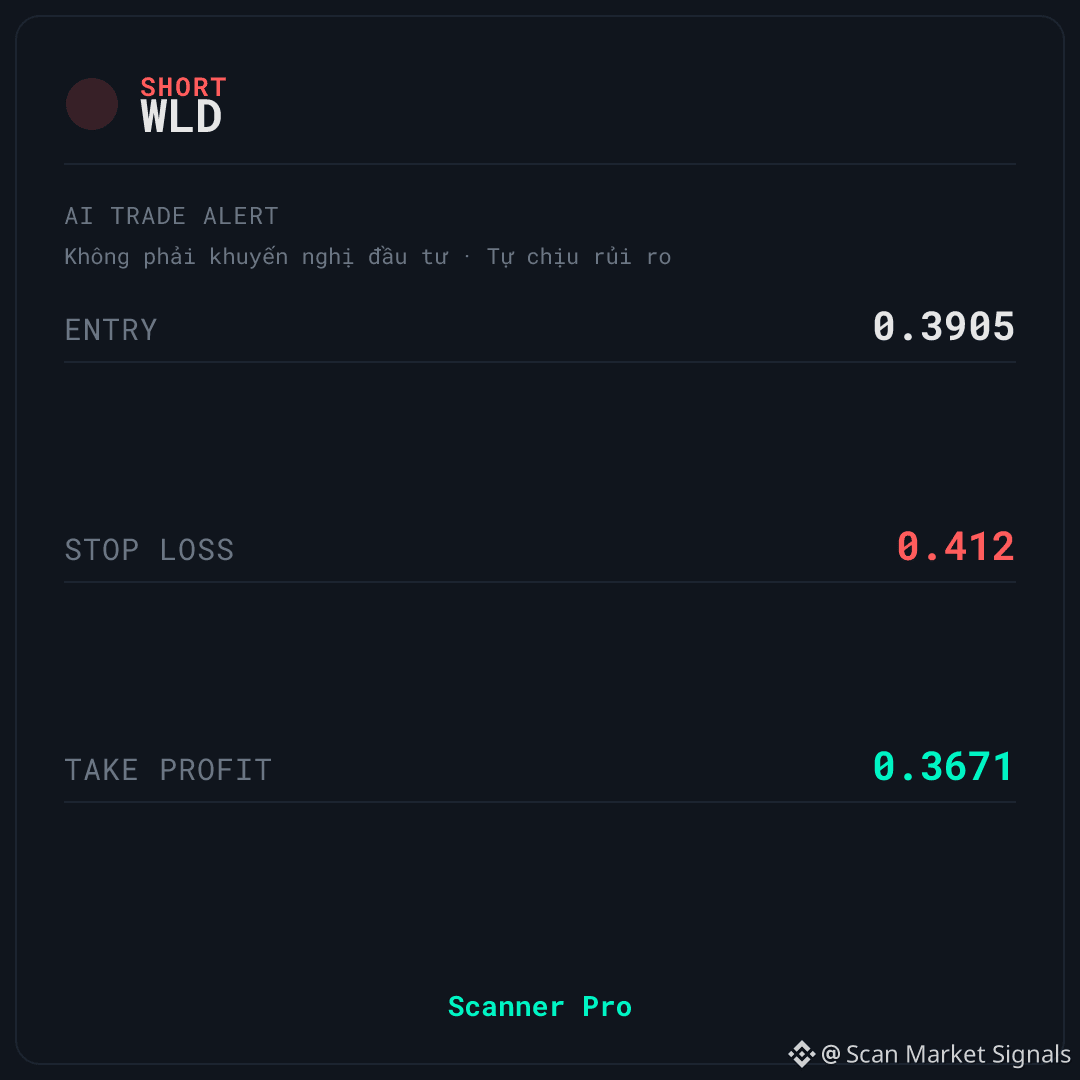
🚨 AI TRADE ALERT — $WLD
🔴 SHORT
📌 Entry: 0.3899 – 0.3911
🛑 Stop Loss: 0.412
🎯 Take Profit: 0.3671
⏰ Valid for: 6 hours (08:20 – 14:20 VN) - Date: 02/11
📉 DOWNTREND — SHORT in line with the downtrend
$WLD is being monitored by Scanner Pro for a SHORT setup as the price reacts to the overhead resistance zone. The market context is classified as trend_down with 70% confidence, but the volume spike is only 0.67x — money flow has yet to truly come in.
📊 CONTEXT & DATA
The first factor that could invalidate this setup: 24-hour volume is around 82.144.829 in quote asset, while the volume spike is only 0.67x — selling pressure is not confirmed by significant money flow, which could easily lead to a technical rebound. Momentum at 39.9 on the 1h timeframe and 37.2 on the 4h timeframe shows the market was already weak, so this is no longer a fresh supporting factor for the short position. The price is at 21% of the 24-hour range, near the low — raising the risk of a downward sweep followed by a bounce. Funding is 0.0100%: LONG traders are paying SHORT traders, meaning the crowd is leaning against the signal, which supports the SHORT direction.
🚫 INVALIDATION & RISK MANAGEMENT — $WLD
⚠️ The biggest conflict: the price is already near the low of the 24-hour range while volume is contracting — if selling pressure is not strong enough, a rebound from this area could trigger the stop loss before the downtrend resumes. If the price closes above the stop-loss level on the signal card, the current SHORT setup is no longer valid. Do you think this is the final liquidity sweep before a rally, or just a pause in the downtrend?
This technical analysis is for educational purposes only and is not investment advice. Cryptocurrency trading involves high risk, and you could lose all your capital. Do your own research and take responsibility for your decisions.
#Binance #Crypto #Futures
SHORT $WLD | Contracting volume — is selling pressure losing steam?
🚨 AI TRADE ALERT — $WLD
🔴 SHORT
📌 Entry: 0.3899 – 0.3911
🛑 Stop Loss: 0.412
🎯 Take Profit: 0.3671
⏰ Valid for: 6 hours (08:20 – 14:20 VN) - Date: 02/11
📉 DOWNTREND — SHORT in line with the downtrend
$WLD is being monitored by Scanner Pro for a SHORT setup as the price reacts to the overhead resistance zone. The market context is classified as trend_down with 70% confidence, but the volume spike is only 0.67x — money flow has yet to truly come in.
📊 CONTEXT & DATA
The first factor that could invalidate this setup: 24-hour volume is around 82.144.829 in quote asset, while the volume spike is only 0.67x — selling pressure is not confirmed by significant money flow, which could easily lead to a technical rebound. Momentum at 39.9 on the 1h timeframe and 37.2 on the 4h timeframe shows the market was already weak, so this is no longer a fresh supporting factor for the short position. The price is at 21% of the 24-hour range, near the low — raising the risk of a downward sweep followed by a bounce. Funding is 0.0100%: LONG traders are paying SHORT traders, meaning the crowd is leaning against the signal, which supports the SHORT direction.
🚫 INVALIDATION & RISK MANAGEMENT — $WLD
⚠️ The biggest conflict: the price is already near the low of the 24-hour range while volume is contracting — if selling pressure is not strong enough, a rebound from this area could trigger the stop loss before the downtrend resumes. If the price closes above the stop-loss level on the signal card, the current SHORT setup is no longer valid. Do you think this is the final liquidity sweep before a rally, or just a pause in the downtrend?
This technical analysis is for educational purposes only and is not investment advice. Cryptocurrency trading involves high risk, and you could lose all your capital. Do your own research and take responsibility for your decisions.
#Binance #Crypto #Futures
🚨 AI TRADE ALERT — $WLD
🔴 SHORT
📌 Entry: 0.3899 – 0.3911
🛑 Stop Loss: 0.412
🎯 Take Profit: 0.3671
⏰ Valid for: 6 hours (08:20 – 14:20 VN) - Date: 02/11
📉 DOWNTREND — SHORT in line with the downtrend
$WLD is being monitored by Scanner Pro for a SHORT setup as the price reacts to the overhead resistance zone. The market context is classified as trend_down with 70% confidence, but the volume spike is only 0.67x — money flow has yet to truly come in.
📊 CONTEXT & DATA
The first factor that could invalidate this setup: 24-hour volume is around 82.144.829 in quote asset, while the volume spike is only 0.67x — selling pressure is not confirmed by significant money flow, which could easily lead to a technical rebound. Momentum at 39.9 on the 1h timeframe and 37.2 on the 4h timeframe shows the market was already weak, so this is no longer a fresh supporting factor for the short position. The price is at 21% of the 24-hour range, near the low — raising the risk of a downward sweep followed by a bounce. Funding is 0.0100%: LONG traders are paying SHORT traders, meaning the crowd is leaning against the signal, which supports the SHORT direction.
🚫 INVALIDATION & RISK MANAGEMENT — $WLD
⚠️ The biggest conflict: the price is already near the low of the 24-hour range while volume is contracting — if selling pressure is not strong enough, a rebound from this area could trigger the stop loss before the downtrend resumes. If the price closes above the stop-loss level on the signal card, the current SHORT setup is no longer valid. Do you think this is the final liquidity sweep before a rally, or just a pause in the downtrend?
This technical analysis is for educational purposes only and is not investment advice. Cryptocurrency trading involves high risk, and you could lose all your capital. Do your own research and take responsibility for your decisions.
#Binance #Crypto #Futures
1
82
LONG $TRUMP | Uptrend, but long traders are paying fees
🚨 AI TRADE ALERT — $TRUMP
🟢 LONG
📌 Entry: 1.6905 – 1.6955
🛑 Stop Loss: 1.5999
🎯 Take Profit: 1.7946
⏰ Valid for: 6 hours (07:30 – 13:30 VN) - Date: 02/11
📈 UPTREND — LONG in line with the uptrend
$TRUMP is being monitored by Scanner Pro for a LONG setup amid a trend_up, with the price holding above the short-term EMA zone. 1h momentum is 63.8 and funding is positive at 0.0050% — long traders are paying fees to short traders.
📊 WHAT'S HAPPENING
The trend_up regime has 70% confidence, and the price is at 58% of its 24h range — neither too high nor too low. 24h volume is approximately 164,243,326 in quote asset, with a volume spike of 0.52x and high liquidity.
The price is holding above EMA9 and EMA21 on both the 1h and 4h timeframes, so the bullish structure remains intact. But 1h momentum at 63.8 has entered the overheated zone, and is no longer a solid support for new buyers.
⚠️ RISKS TO KNOW FIRST — $TRUMP
🚫 Positive funding of 0.0050%: long traders are paying fees to short traders, meaning the crowd is leaning in the same direction as the signal and paying for it — this is a disadvantage, not confirmation.
1h momentum has heated up, making it easy for late entrants to get trapped if the price fails to maintain its momentum. If the price closes below the stop-loss level shown on the signal card, the current LONG setup is no longer valid.
Do you think this is genuine upward momentum, or just a bounce for short traders to accumulate?
This is educational technical analysis content, not investment advice. Cryptocurrency trading carries high risk, and you could lose all your capital. Do your own research and take responsibility for your decisions.
#Binance #Crypto #Futures
LONG $TRUMP | Uptrend, but long traders are paying fees
🚨 AI TRADE ALERT — $TRUMP
🟢 LONG
📌 Entry: 1.6905 – 1.6955
🛑 Stop Loss: 1.5999
🎯 Take Profit: 1.7946
⏰ Valid for: 6 hours (07:30 – 13:30 VN) - Date: 02/11
📈 UPTREND — LONG in line with the uptrend
$TRUMP is being monitored by Scanner Pro for a LONG setup amid a trend_up, with the price holding above the short-term EMA zone. 1h momentum is 63.8 and funding is positive at 0.0050% — long traders are paying fees to short traders.
📊 WHAT'S HAPPENING
The trend_up regime has 70% confidence, and the price is at 58% of its 24h range — neither too high nor too low. 24h volume is approximately 164,243,326 in quote asset, with a volume spike of 0.52x and high liquidity.
The price is holding above EMA9 and EMA21 on both the 1h and 4h timeframes, so the bullish structure remains intact. But 1h momentum at 63.8 has entered the overheated zone, and is no longer a solid support for new buyers.
⚠️ RISKS TO KNOW FIRST — $TRUMP
🚫 Positive funding of 0.0050%: long traders are paying fees to short traders, meaning the crowd is leaning in the same direction as the signal and paying for it — this is a disadvantage, not confirmation.
1h momentum has heated up, making it easy for late entrants to get trapped if the price fails to maintain its momentum. If the price closes below the stop-loss level shown on the signal card, the current LONG setup is no longer valid.
Do you think this is genuine upward momentum, or just a bounce for short traders to accumulate?
This is educational technical analysis content, not investment advice. Cryptocurrency trading carries high risk, and you could lose all your capital. Do your own research and take responsibility for your decisions.
#Binance #Crypto #Futures
🚨 AI TRADE ALERT — $TRUMP
🟢 LONG
📌 Entry: 1.6905 – 1.6955
🛑 Stop Loss: 1.5999
🎯 Take Profit: 1.7946
⏰ Valid for: 6 hours (07:30 – 13:30 VN) - Date: 02/11
📈 UPTREND — LONG in line with the uptrend
$TRUMP is being monitored by Scanner Pro for a LONG setup amid a trend_up, with the price holding above the short-term EMA zone. 1h momentum is 63.8 and funding is positive at 0.0050% — long traders are paying fees to short traders.
📊 WHAT'S HAPPENING
The trend_up regime has 70% confidence, and the price is at 58% of its 24h range — neither too high nor too low. 24h volume is approximately 164,243,326 in quote asset, with a volume spike of 0.52x and high liquidity.
The price is holding above EMA9 and EMA21 on both the 1h and 4h timeframes, so the bullish structure remains intact. But 1h momentum at 63.8 has entered the overheated zone, and is no longer a solid support for new buyers.
⚠️ RISKS TO KNOW FIRST — $TRUMP
🚫 Positive funding of 0.0050%: long traders are paying fees to short traders, meaning the crowd is leaning in the same direction as the signal and paying for it — this is a disadvantage, not confirmation.
1h momentum has heated up, making it easy for late entrants to get trapped if the price fails to maintain its momentum. If the price closes below the stop-loss level shown on the signal card, the current LONG setup is no longer valid.
Do you think this is genuine upward momentum, or just a bounce for short traders to accumulate?
This is educational technical analysis content, not investment advice. Cryptocurrency trading carries high risk, and you could lose all your capital. Do your own research and take responsibility for your decisions.
#Binance #Crypto #Futures
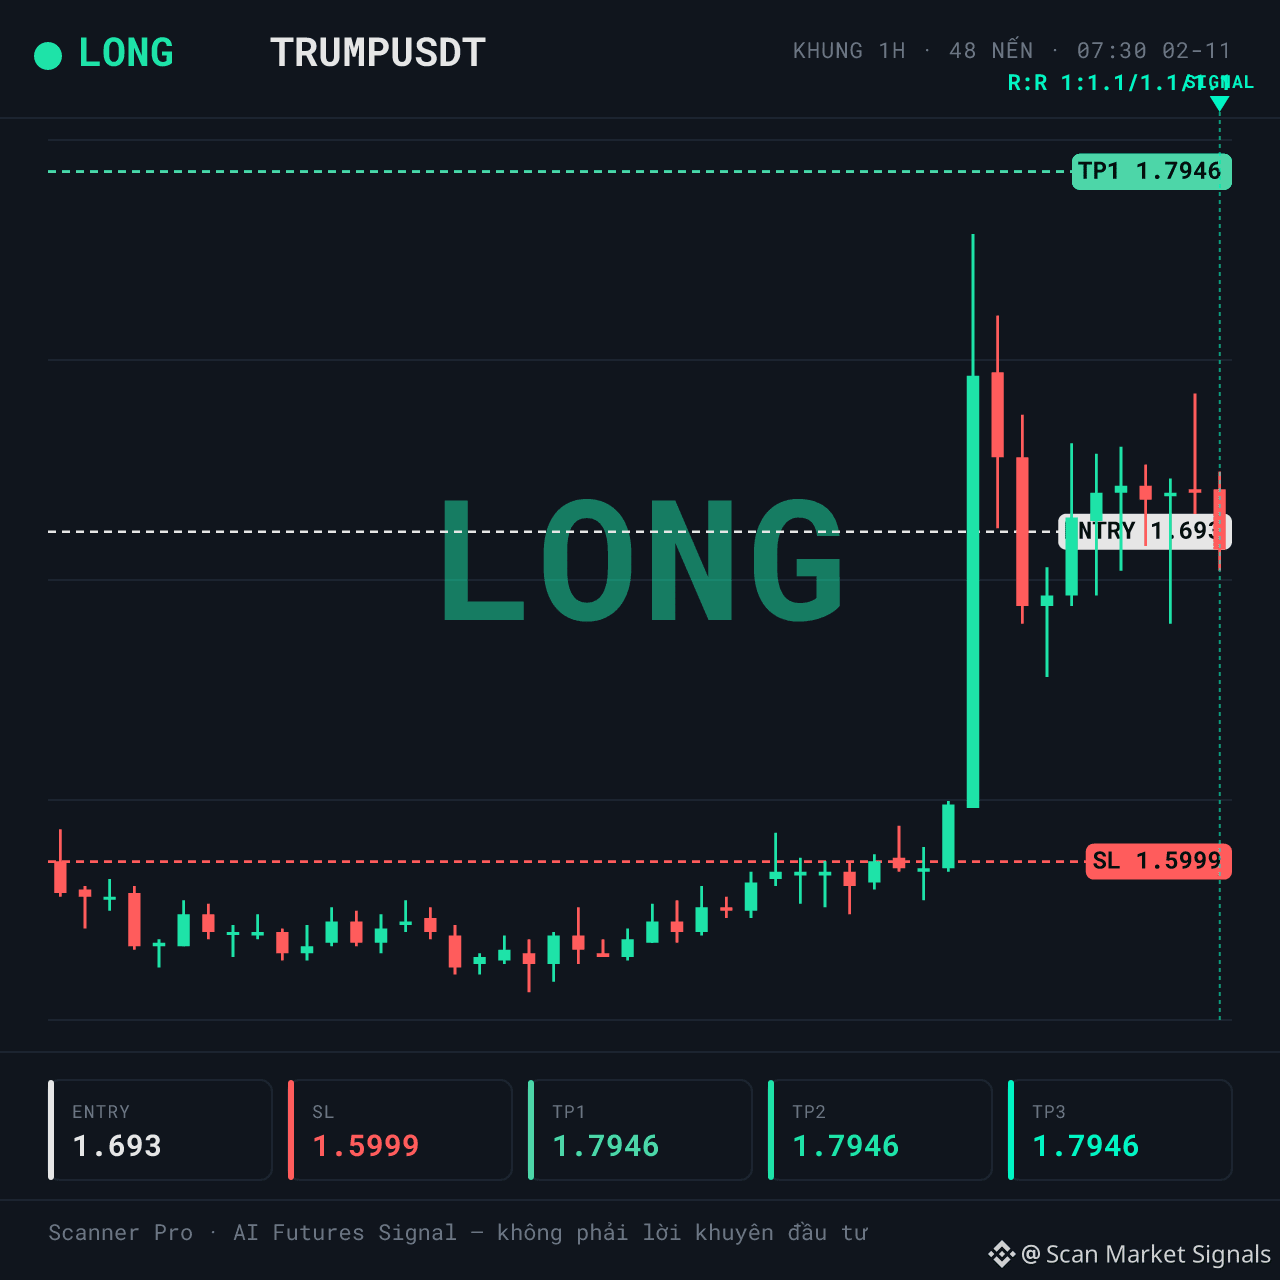
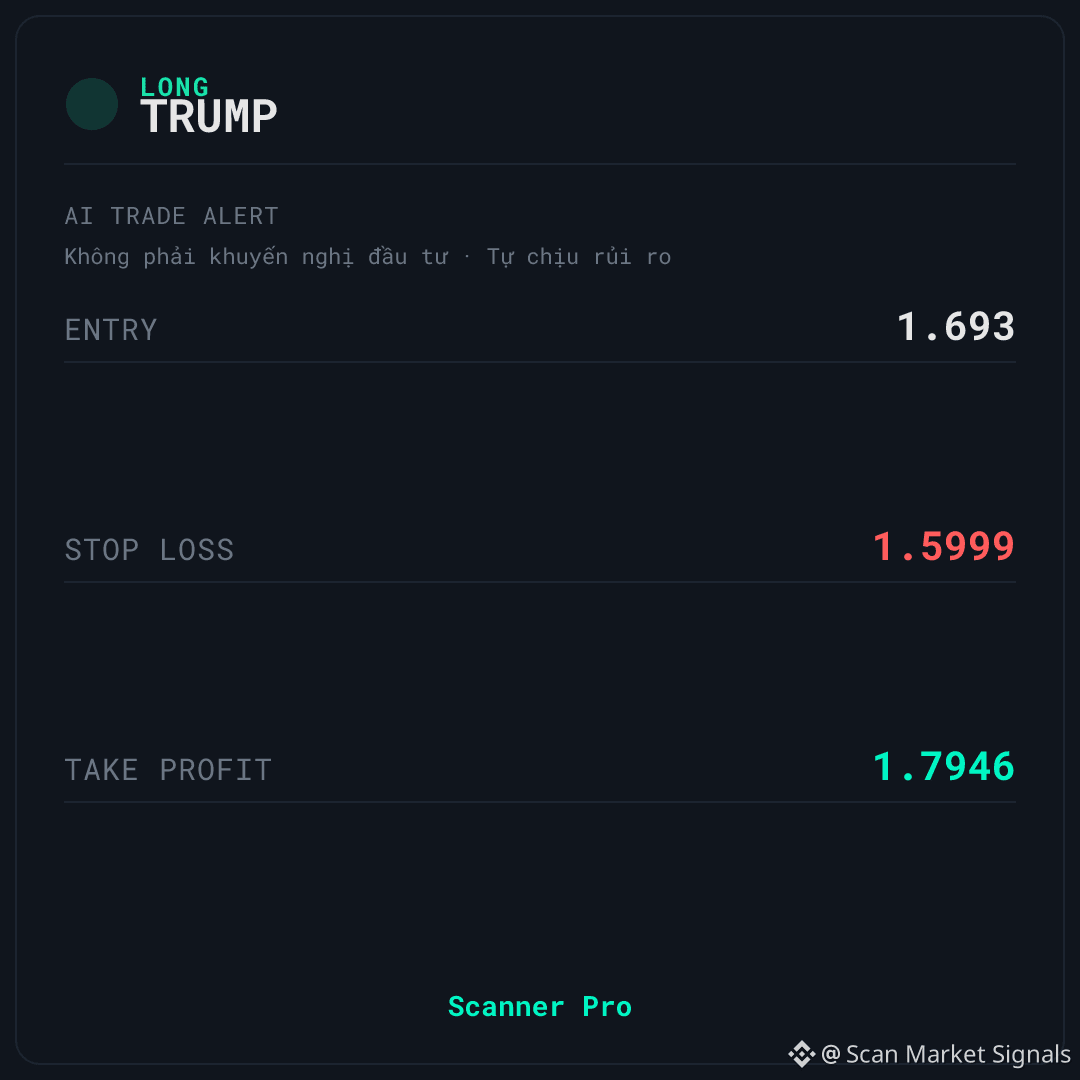
76
SHORT $LTC | Volume is drying up, momentum is sluggish — who’s setting the pace?
🚨 AI TRADE ALERT — $LTC
🔴 SHORT
📌 Entry: 55.4767 – 55.6433
🛑 Stop Loss: 58.6158
🎯 Take Profit: 52.2264
⏰ Valid for: 6 hours (06:35 – 12:35 VN) - Date: 02/11
↔️ SIDEWAYS — the market is moving sideways, with a fade (mean-reversion) signal
$LTC is being monitored by Scanner Pro for a SHORT scenario as price reacts weakly around the short-term EMA zone. The sideways market context has a classification confidence of 55, 24h volume of approximately 34.740.334 in quote asset, and a volume spike of just 0.54x.
📊 CONTEXT & DATA
The market is sluggish: LTC price is fluctuating around 43% of its 24h range, with neither side truly in control. The 1h momentum of 48.7 and 4h momentum of 45.7 are both below neutral, reflecting a lack of conviction.
One noteworthy point is the 0.0100% funding rate — LONG traders are paying SHORT traders, meaning the crowd is leaning against this SHORT signal. 24h volume is approximately 34.740.334 in quote asset, but the volume spike is only 0.54x, suggesting that money has yet to meaningfully enter the market.
🚫 INVALIDATION & RISK MANAGEMENT — $LTC
⚠️ The biggest risk: positive funding indicates that LONG traders are more numerous, and if buying pressure suddenly returns, the SHORT scenario could be undermined. Additionally, confidence in the sideways market classification is only 55 — not high enough to confirm a trend.
If the price closes above the stop-loss level on the signal card, the current SHORT scenario is no longer valid.
Do you think LONG traders paying the funding fee is a sign that the crowd is running out of steam, or just a pause before a breakout?
This is educational technical analysis content, not investment advice. Cryptocurrency trading carries high risk, and you could lose all your capital. Do your own research and take responsibility for your decisions.
#Binance #Crypto #Futures
SHORT $LTC | Volume is drying up, momentum is sluggish — who’s setting the pace?
🚨 AI TRADE ALERT — $LTC
🔴 SHORT
📌 Entry: 55.4767 – 55.6433
🛑 Stop Loss: 58.6158
🎯 Take Profit: 52.2264
⏰ Valid for: 6 hours (06:35 – 12:35 VN) - Date: 02/11
↔️ SIDEWAYS — the market is moving sideways, with a fade (mean-reversion) signal
$LTC is being monitored by Scanner Pro for a SHORT scenario as price reacts weakly around the short-term EMA zone. The sideways market context has a classification confidence of 55, 24h volume of approximately 34.740.334 in quote asset, and a volume spike of just 0.54x.
📊 CONTEXT & DATA
The market is sluggish: LTC price is fluctuating around 43% of its 24h range, with neither side truly in control. The 1h momentum of 48.7 and 4h momentum of 45.7 are both below neutral, reflecting a lack of conviction.
One noteworthy point is the 0.0100% funding rate — LONG traders are paying SHORT traders, meaning the crowd is leaning against this SHORT signal. 24h volume is approximately 34.740.334 in quote asset, but the volume spike is only 0.54x, suggesting that money has yet to meaningfully enter the market.
🚫 INVALIDATION & RISK MANAGEMENT — $LTC
⚠️ The biggest risk: positive funding indicates that LONG traders are more numerous, and if buying pressure suddenly returns, the SHORT scenario could be undermined. Additionally, confidence in the sideways market classification is only 55 — not high enough to confirm a trend.
If the price closes above the stop-loss level on the signal card, the current SHORT scenario is no longer valid.
Do you think LONG traders paying the funding fee is a sign that the crowd is running out of steam, or just a pause before a breakout?
This is educational technical analysis content, not investment advice. Cryptocurrency trading carries high risk, and you could lose all your capital. Do your own research and take responsibility for your decisions.
#Binance #Crypto #Futures
🚨 AI TRADE ALERT — $LTC
🔴 SHORT
📌 Entry: 55.4767 – 55.6433
🛑 Stop Loss: 58.6158
🎯 Take Profit: 52.2264
⏰ Valid for: 6 hours (06:35 – 12:35 VN) - Date: 02/11
↔️ SIDEWAYS — the market is moving sideways, with a fade (mean-reversion) signal
$LTC is being monitored by Scanner Pro for a SHORT scenario as price reacts weakly around the short-term EMA zone. The sideways market context has a classification confidence of 55, 24h volume of approximately 34.740.334 in quote asset, and a volume spike of just 0.54x.
📊 CONTEXT & DATA
The market is sluggish: LTC price is fluctuating around 43% of its 24h range, with neither side truly in control. The 1h momentum of 48.7 and 4h momentum of 45.7 are both below neutral, reflecting a lack of conviction.
One noteworthy point is the 0.0100% funding rate — LONG traders are paying SHORT traders, meaning the crowd is leaning against this SHORT signal. 24h volume is approximately 34.740.334 in quote asset, but the volume spike is only 0.54x, suggesting that money has yet to meaningfully enter the market.
🚫 INVALIDATION & RISK MANAGEMENT — $LTC
⚠️ The biggest risk: positive funding indicates that LONG traders are more numerous, and if buying pressure suddenly returns, the SHORT scenario could be undermined. Additionally, confidence in the sideways market classification is only 55 — not high enough to confirm a trend.
If the price closes above the stop-loss level on the signal card, the current SHORT scenario is no longer valid.
Do you think LONG traders paying the funding fee is a sign that the crowd is running out of steam, or just a pause before a breakout?
This is educational technical analysis content, not investment advice. Cryptocurrency trading carries high risk, and you could lose all your capital. Do your own research and take responsibility for your decisions.
#Binance #Crypto #Futures
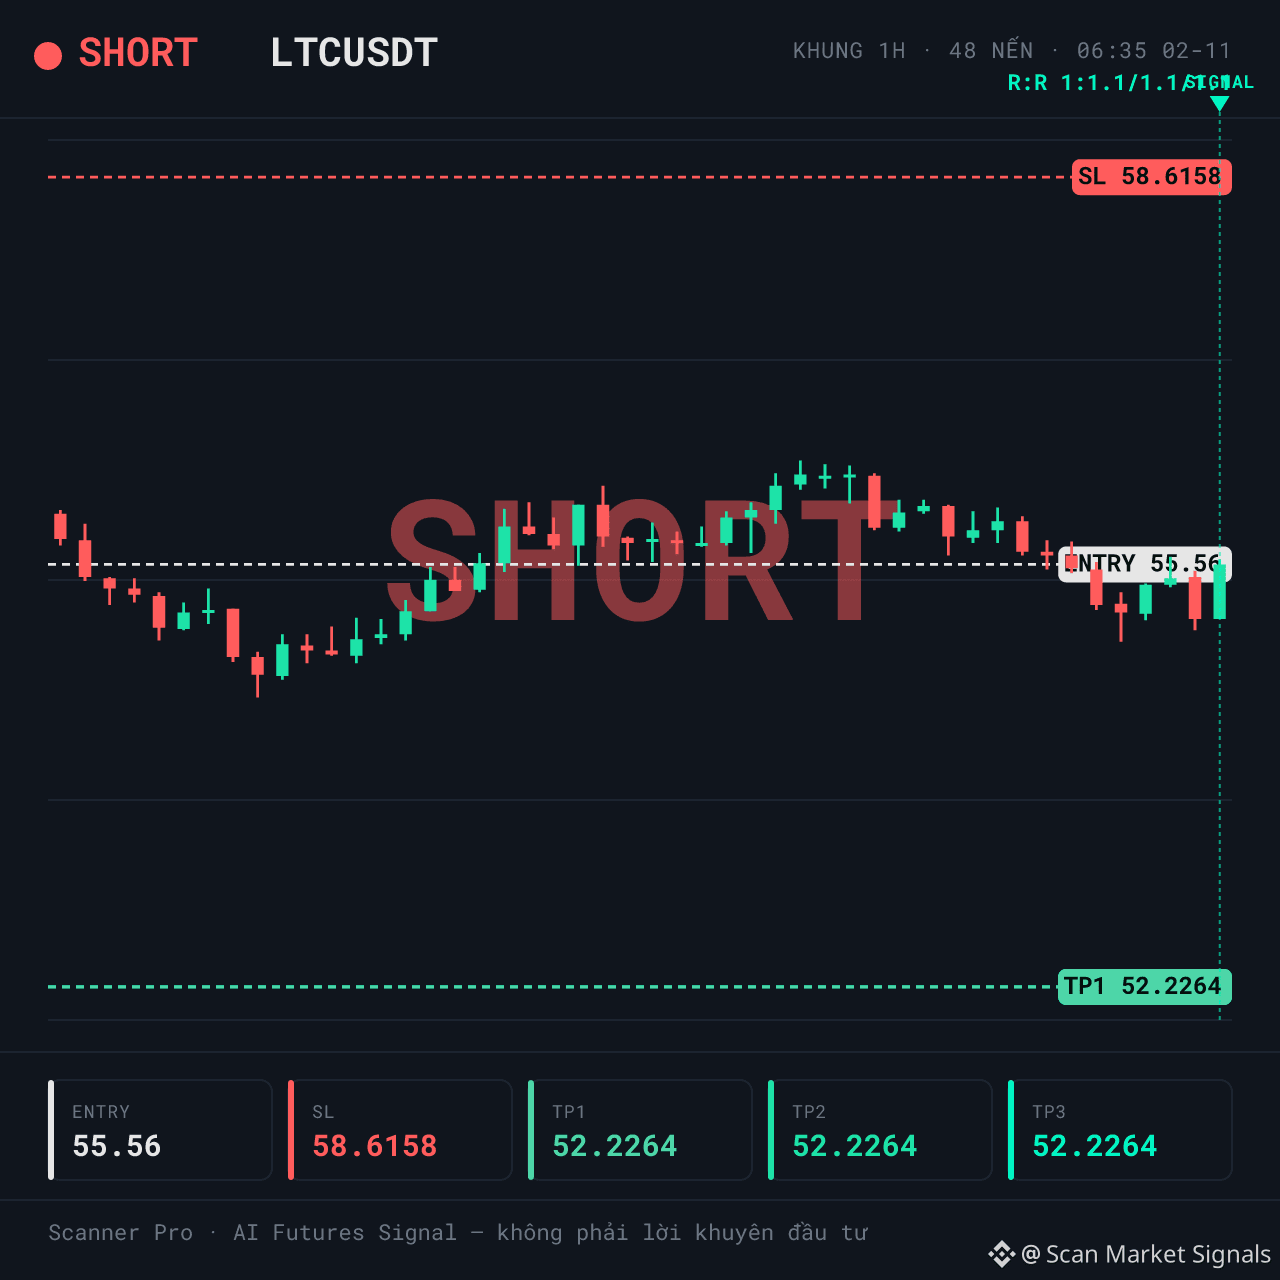
2
LONG $QNT | Positive funding: longs are paying fees, why is this worth paying attention to?
🚨 AI TRADE ALERT — $QNT
🟢 LONG
📌 Entry: 199.5802 – 200.1798
🛑 Stop Loss: 188.8866
🎯 Take Profit: 211.8728
⏰ Valid for: 6 hours (05:35 – 11:35 VN) - Date: 02/11
↔️ SIDEWAY — the market is moving sideways, a fade (mean-reversion) signal
$QNT is being monitored by Scanner Pro for a LONG scenario as the price reacts around the short-term EMA zone. The context is classified as sideways, with a confidence score of 55, 24h volume of approximately 39.362.164 in quote asset, and a volume spike of 0.82x.
📊 WHAT THE DATA IS SHOWING
The current funding rate is 0.0100% — simply put, LONGs are paying fees to SHORTs, meaning the market is tilted toward buyers. The price is at 56% of its 24h range, meaning it is around the middle of the range, neither too high nor too low. 1h momentum is at 52.8, neither hot nor cold. 24h volume is approximately 39.362.164 in quote asset, with a volume spike of 0.82x — below average, indicating that capital flows have not truly surged. A sideways context with a confidence score of 55 indicates that there is no clear trend yet, so reversal signals should be treated with caution.
💡 SCENARIO & OPEN QUESTION — $QNT
⚠️ The biggest drawback: positive funding indicates that LONGs outnumber SHORTs and are paying fees — this is a risk to monitor because the crowd is leaning in the same direction as the signal, which can easily lead to a correction. In addition, confidence in the context classification is only 55, below the threshold of 60, so it cannot yet be considered certain. 🚫 If the price closes below the stop-loss level on the signal card, the current LONG scenario is no longer valid. 💡 In your view, with positive funding and volume still low, is this a sign of accumulation or just a technical rebound before further declines?
This is educational technical analysis content, not investment advice. Cryptocurrency trading carries high risk, and you could lose all your capital. Do your own research and take responsibility for your decisions.
#Binance #Crypto #Futures
LONG $QNT | Positive funding: longs are paying fees, why is this worth paying attention to?
🚨 AI TRADE ALERT — $QNT
🟢 LONG
📌 Entry: 199.5802 – 200.1798
🛑 Stop Loss: 188.8866
🎯 Take Profit: 211.8728
⏰ Valid for: 6 hours (05:35 – 11:35 VN) - Date: 02/11
↔️ SIDEWAY — the market is moving sideways, a fade (mean-reversion) signal
$QNT is being monitored by Scanner Pro for a LONG scenario as the price reacts around the short-term EMA zone. The context is classified as sideways, with a confidence score of 55, 24h volume of approximately 39.362.164 in quote asset, and a volume spike of 0.82x.
📊 WHAT THE DATA IS SHOWING
The current funding rate is 0.0100% — simply put, LONGs are paying fees to SHORTs, meaning the market is tilted toward buyers. The price is at 56% of its 24h range, meaning it is around the middle of the range, neither too high nor too low. 1h momentum is at 52.8, neither hot nor cold. 24h volume is approximately 39.362.164 in quote asset, with a volume spike of 0.82x — below average, indicating that capital flows have not truly surged. A sideways context with a confidence score of 55 indicates that there is no clear trend yet, so reversal signals should be treated with caution.
💡 SCENARIO & OPEN QUESTION — $QNT
⚠️ The biggest drawback: positive funding indicates that LONGs outnumber SHORTs and are paying fees — this is a risk to monitor because the crowd is leaning in the same direction as the signal, which can easily lead to a correction. In addition, confidence in the context classification is only 55, below the threshold of 60, so it cannot yet be considered certain. 🚫 If the price closes below the stop-loss level on the signal card, the current LONG scenario is no longer valid. 💡 In your view, with positive funding and volume still low, is this a sign of accumulation or just a technical rebound before further declines?
This is educational technical analysis content, not investment advice. Cryptocurrency trading carries high risk, and you could lose all your capital. Do your own research and take responsibility for your decisions.
#Binance #Crypto #Futures
🚨 AI TRADE ALERT — $QNT
🟢 LONG
📌 Entry: 199.5802 – 200.1798
🛑 Stop Loss: 188.8866
🎯 Take Profit: 211.8728
⏰ Valid for: 6 hours (05:35 – 11:35 VN) - Date: 02/11
↔️ SIDEWAY — the market is moving sideways, a fade (mean-reversion) signal
$QNT is being monitored by Scanner Pro for a LONG scenario as the price reacts around the short-term EMA zone. The context is classified as sideways, with a confidence score of 55, 24h volume of approximately 39.362.164 in quote asset, and a volume spike of 0.82x.
📊 WHAT THE DATA IS SHOWING
The current funding rate is 0.0100% — simply put, LONGs are paying fees to SHORTs, meaning the market is tilted toward buyers. The price is at 56% of its 24h range, meaning it is around the middle of the range, neither too high nor too low. 1h momentum is at 52.8, neither hot nor cold. 24h volume is approximately 39.362.164 in quote asset, with a volume spike of 0.82x — below average, indicating that capital flows have not truly surged. A sideways context with a confidence score of 55 indicates that there is no clear trend yet, so reversal signals should be treated with caution.
💡 SCENARIO & OPEN QUESTION — $QNT
⚠️ The biggest drawback: positive funding indicates that LONGs outnumber SHORTs and are paying fees — this is a risk to monitor because the crowd is leaning in the same direction as the signal, which can easily lead to a correction. In addition, confidence in the context classification is only 55, below the threshold of 60, so it cannot yet be considered certain. 🚫 If the price closes below the stop-loss level on the signal card, the current LONG scenario is no longer valid. 💡 In your view, with positive funding and volume still low, is this a sign of accumulation or just a technical rebound before further declines?
This is educational technical analysis content, not investment advice. Cryptocurrency trading carries high risk, and you could lose all your capital. Do your own research and take responsibility for your decisions.
#Binance #Crypto #Futures
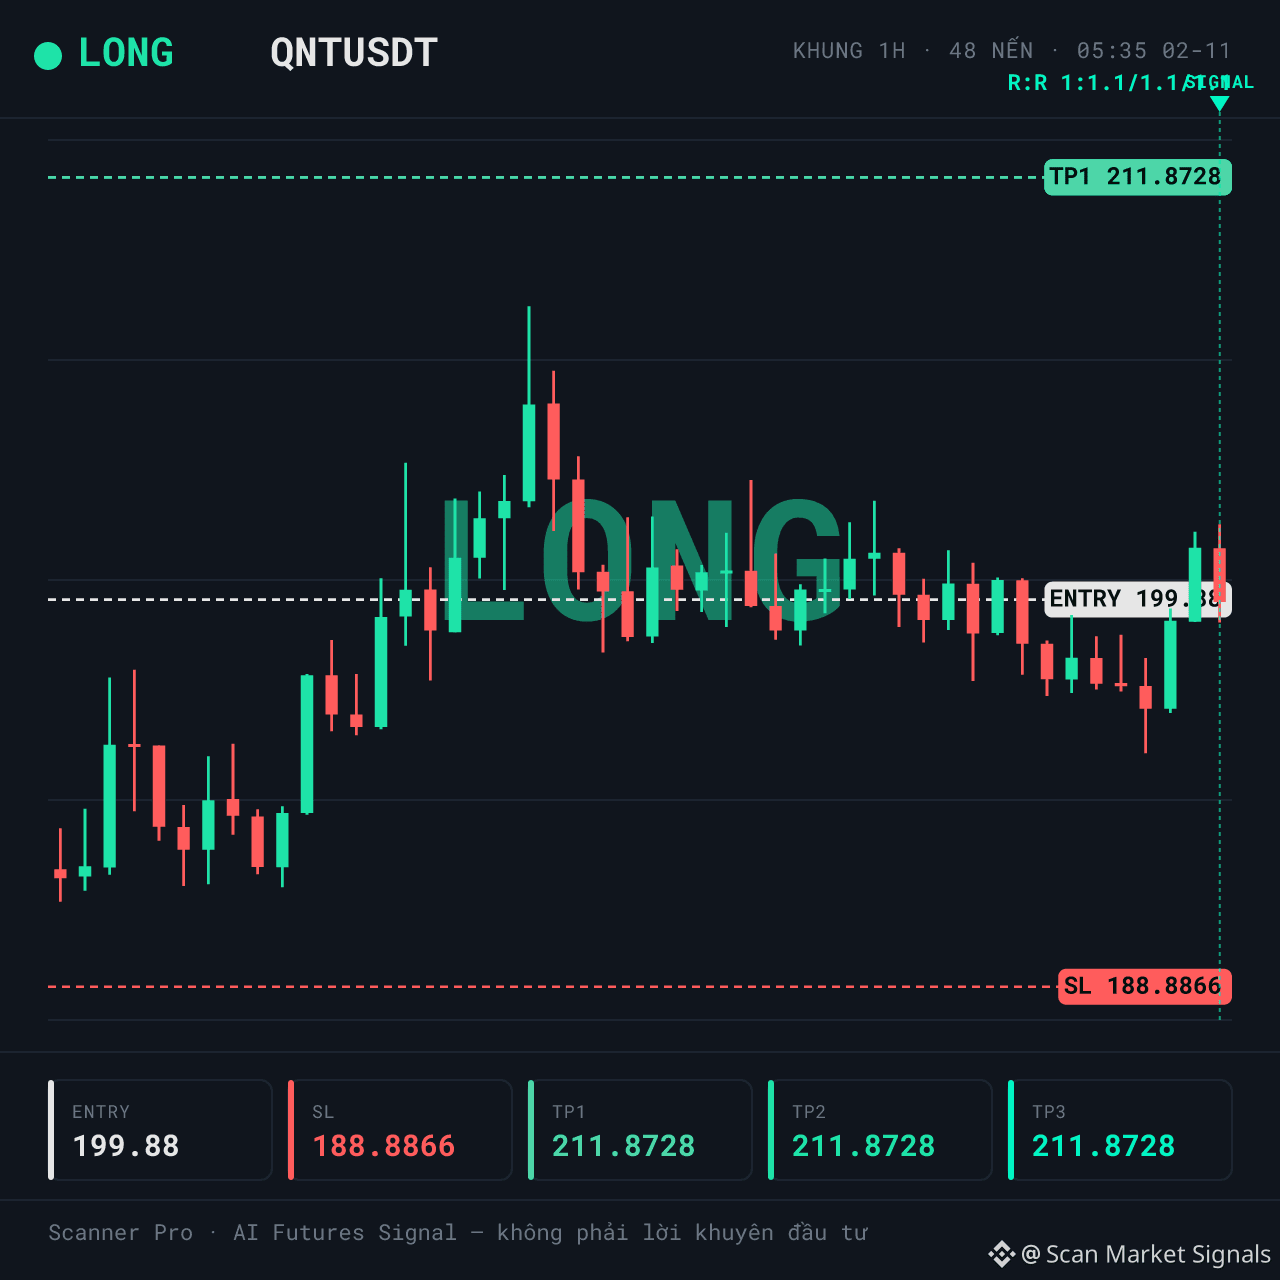
1
SHORT $SUI | Thin risk margin, longs are still paying fees
🚨 AI TRADE ALERT — $SUI
🔴 SHORT
📌 Entry: 0.8968 – 0.8994
🛑 Stop Loss: 0.9475
🎯 Take Profit: 0.8442
⏰ Valid for: 6 hours (04:50 – 10:50 VN) - Date: 02/11
↔️ SIDEWAYS — range-bound market, fade (mean-reversion) signal
$SUI is being monitored by Scanner Pro for a SHORT scenario as price shows a weak reaction in the current zone. 24h volume is approximately 76.073.681 in the quote asset, with a volume spike of just 0.55x — money has yet to really flow in.
📊 WHAT'S HAPPENING
Funding of 0.0100% shows that LONGs are paying SHORTs, meaning the crowd is leaning against the signal — this supports the SHORT direction. The market context is classified as sideways with a confidence score of 55, high liquidity, and a 24h range of 2.6%.
Price is at 53% of the 24h range—not particularly high or low. The distance from price to the invalidation zone is quite narrow relative to 1h volatility, so the risk of getting stopped out is real.
⚠️ RISKS TO KNOW FIRST — $SUI
🚫 Confidence in the market context classification is only 55, not high enough to confirm a sustained downtrend. In addition, there are no signs of a volume surge (volume spike 0.55x) — there isn't enough momentum behind the SHORT scenario.
If price closes above the stop-loss level on the signal card, the current SHORT scenario is no longer valid.
Do you see this as a pullback within an uptrend, or a genuine reversal signal?
This technical analysis is for educational purposes only and is not investment advice. Cryptocurrency trading carries high risk, and you could lose all your capital. Do your own research and take responsibility for your decisions.
#Binance #Crypto #Futures
SHORT $SUI | Thin risk margin, longs are still paying fees
🚨 AI TRADE ALERT — $SUI
🔴 SHORT
📌 Entry: 0.8968 – 0.8994
🛑 Stop Loss: 0.9475
🎯 Take Profit: 0.8442
⏰ Valid for: 6 hours (04:50 – 10:50 VN) - Date: 02/11
↔️ SIDEWAYS — range-bound market, fade (mean-reversion) signal
$SUI is being monitored by Scanner Pro for a SHORT scenario as price shows a weak reaction in the current zone. 24h volume is approximately 76.073.681 in the quote asset, with a volume spike of just 0.55x — money has yet to really flow in.
📊 WHAT'S HAPPENING
Funding of 0.0100% shows that LONGs are paying SHORTs, meaning the crowd is leaning against the signal — this supports the SHORT direction. The market context is classified as sideways with a confidence score of 55, high liquidity, and a 24h range of 2.6%.
Price is at 53% of the 24h range—not particularly high or low. The distance from price to the invalidation zone is quite narrow relative to 1h volatility, so the risk of getting stopped out is real.
⚠️ RISKS TO KNOW FIRST — $SUI
🚫 Confidence in the market context classification is only 55, not high enough to confirm a sustained downtrend. In addition, there are no signs of a volume surge (volume spike 0.55x) — there isn't enough momentum behind the SHORT scenario.
If price closes above the stop-loss level on the signal card, the current SHORT scenario is no longer valid.
Do you see this as a pullback within an uptrend, or a genuine reversal signal?
This technical analysis is for educational purposes only and is not investment advice. Cryptocurrency trading carries high risk, and you could lose all your capital. Do your own research and take responsibility for your decisions.
#Binance #Crypto #Futures
🚨 AI TRADE ALERT — $SUI
🔴 SHORT
📌 Entry: 0.8968 – 0.8994
🛑 Stop Loss: 0.9475
🎯 Take Profit: 0.8442
⏰ Valid for: 6 hours (04:50 – 10:50 VN) - Date: 02/11
↔️ SIDEWAYS — range-bound market, fade (mean-reversion) signal
$SUI is being monitored by Scanner Pro for a SHORT scenario as price shows a weak reaction in the current zone. 24h volume is approximately 76.073.681 in the quote asset, with a volume spike of just 0.55x — money has yet to really flow in.
📊 WHAT'S HAPPENING
Funding of 0.0100% shows that LONGs are paying SHORTs, meaning the crowd is leaning against the signal — this supports the SHORT direction. The market context is classified as sideways with a confidence score of 55, high liquidity, and a 24h range of 2.6%.
Price is at 53% of the 24h range—not particularly high or low. The distance from price to the invalidation zone is quite narrow relative to 1h volatility, so the risk of getting stopped out is real.
⚠️ RISKS TO KNOW FIRST — $SUI
🚫 Confidence in the market context classification is only 55, not high enough to confirm a sustained downtrend. In addition, there are no signs of a volume surge (volume spike 0.55x) — there isn't enough momentum behind the SHORT scenario.
If price closes above the stop-loss level on the signal card, the current SHORT scenario is no longer valid.
Do you see this as a pullback within an uptrend, or a genuine reversal signal?
This technical analysis is for educational purposes only and is not investment advice. Cryptocurrency trading carries high risk, and you could lose all your capital. Do your own research and take responsibility for your decisions.
#Binance #Crypto #Futures
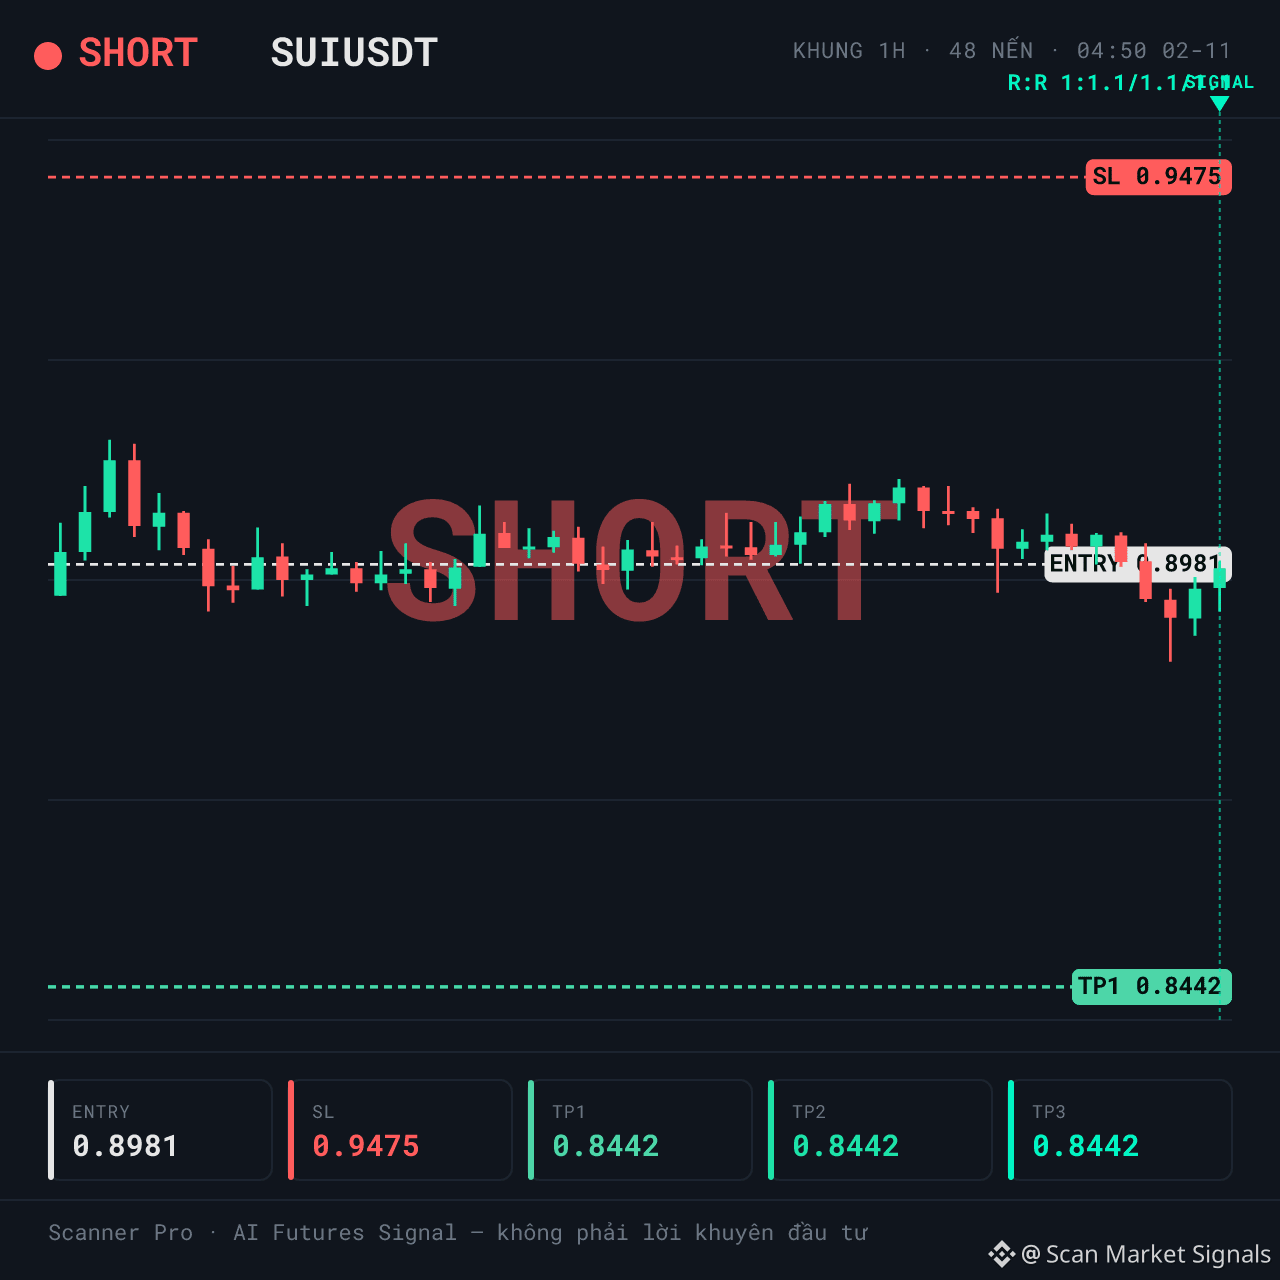
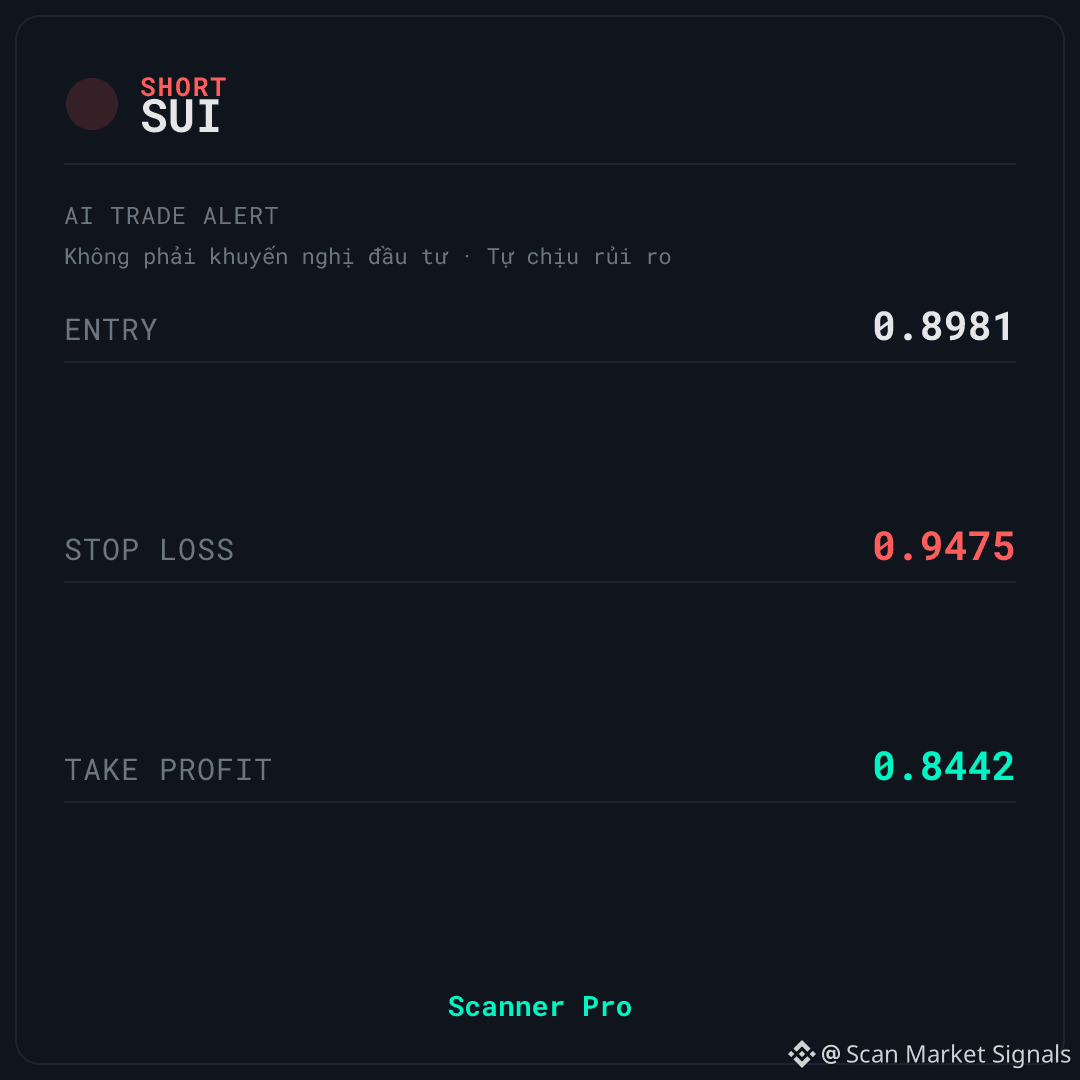
6
SHORT $TAO | The invalidation zone is quite far from the price, but momentum is already weak
🚨 AI TRADE ALERT — $TAO
🔴 SHORT
📌 Entry: 233.3495 – 234.0506
🛑 Stop Loss: 246.5535
🎯 Take Profit: 219.678
⏰ Valid for: 6 hours (04:35 – 10:35 VN) - Date: 02/11
↔️ SIDEWAYS — the market is moving sideways; a fade (mean-reversion) signal
$TAO is being monitored by Scanner Pro for a SHORT scenario as the price reacts below the short-term moving averages. 24-hour volume is around 36.001.411 in quote asset, with a volume spike of 0.60x — liquidity is high.
📊 WHAT'S HAPPENING
Funding of 0.0050% indicates that LONG traders are paying fees to SHORT traders, meaning the crowd is leaning in the opposite direction from this signal — a point in favor of the SHORT direction. The context is classified as sideways, with a confidence score of 55 (not high).
The price is at 32% of the 24-hour range, liquidity is high, and 24-hour volume is around 36.001.411 in quote asset. The distance from the entry price to the invalidation zone (stop loss) is quite wide, so the risk per trade should be carefully calculated.
⚠️ RISKS TO KNOW — $TAO
🚫 1-hour momentum is at 41.1 — the market is already weak, so this is not a new supporting factor for the SHORT scenario. In addition, confidence in the context classification is only 55, so keep in mind that this could be choppy sideways action.
If the price closes above the stop-loss level shown on the signal card, the current SHORT scenario is no longer valid.
Do you think this is a pullback within a downtrend, or just noise in a sideways range?
This technical analysis is for educational purposes only and is not investment advice. Cryptocurrency trading carries high risk; you could lose all your capital. Do your own research and take responsibility for your decisions.
#Binance #Crypto #Futures
SHORT $TAO | The invalidation zone is quite far from the price, but momentum is already weak
🚨 AI TRADE ALERT — $TAO
🔴 SHORT
📌 Entry: 233.3495 – 234.0506
🛑 Stop Loss: 246.5535
🎯 Take Profit: 219.678
⏰ Valid for: 6 hours (04:35 – 10:35 VN) - Date: 02/11
↔️ SIDEWAYS — the market is moving sideways; a fade (mean-reversion) signal
$TAO is being monitored by Scanner Pro for a SHORT scenario as the price reacts below the short-term moving averages. 24-hour volume is around 36.001.411 in quote asset, with a volume spike of 0.60x — liquidity is high.
📊 WHAT'S HAPPENING
Funding of 0.0050% indicates that LONG traders are paying fees to SHORT traders, meaning the crowd is leaning in the opposite direction from this signal — a point in favor of the SHORT direction. The context is classified as sideways, with a confidence score of 55 (not high).
The price is at 32% of the 24-hour range, liquidity is high, and 24-hour volume is around 36.001.411 in quote asset. The distance from the entry price to the invalidation zone (stop loss) is quite wide, so the risk per trade should be carefully calculated.
⚠️ RISKS TO KNOW — $TAO
🚫 1-hour momentum is at 41.1 — the market is already weak, so this is not a new supporting factor for the SHORT scenario. In addition, confidence in the context classification is only 55, so keep in mind that this could be choppy sideways action.
If the price closes above the stop-loss level shown on the signal card, the current SHORT scenario is no longer valid.
Do you think this is a pullback within a downtrend, or just noise in a sideways range?
This technical analysis is for educational purposes only and is not investment advice. Cryptocurrency trading carries high risk; you could lose all your capital. Do your own research and take responsibility for your decisions.
#Binance #Crypto #Futures
🚨 AI TRADE ALERT — $TAO
🔴 SHORT
📌 Entry: 233.3495 – 234.0506
🛑 Stop Loss: 246.5535
🎯 Take Profit: 219.678
⏰ Valid for: 6 hours (04:35 – 10:35 VN) - Date: 02/11
↔️ SIDEWAYS — the market is moving sideways; a fade (mean-reversion) signal
$TAO is being monitored by Scanner Pro for a SHORT scenario as the price reacts below the short-term moving averages. 24-hour volume is around 36.001.411 in quote asset, with a volume spike of 0.60x — liquidity is high.
📊 WHAT'S HAPPENING
Funding of 0.0050% indicates that LONG traders are paying fees to SHORT traders, meaning the crowd is leaning in the opposite direction from this signal — a point in favor of the SHORT direction. The context is classified as sideways, with a confidence score of 55 (not high).
The price is at 32% of the 24-hour range, liquidity is high, and 24-hour volume is around 36.001.411 in quote asset. The distance from the entry price to the invalidation zone (stop loss) is quite wide, so the risk per trade should be carefully calculated.
⚠️ RISKS TO KNOW — $TAO
🚫 1-hour momentum is at 41.1 — the market is already weak, so this is not a new supporting factor for the SHORT scenario. In addition, confidence in the context classification is only 55, so keep in mind that this could be choppy sideways action.
If the price closes above the stop-loss level shown on the signal card, the current SHORT scenario is no longer valid.
Do you think this is a pullback within a downtrend, or just noise in a sideways range?
This technical analysis is for educational purposes only and is not investment advice. Cryptocurrency trading carries high risk; you could lose all your capital. Do your own research and take responsibility for your decisions.
#Binance #Crypto #Futures
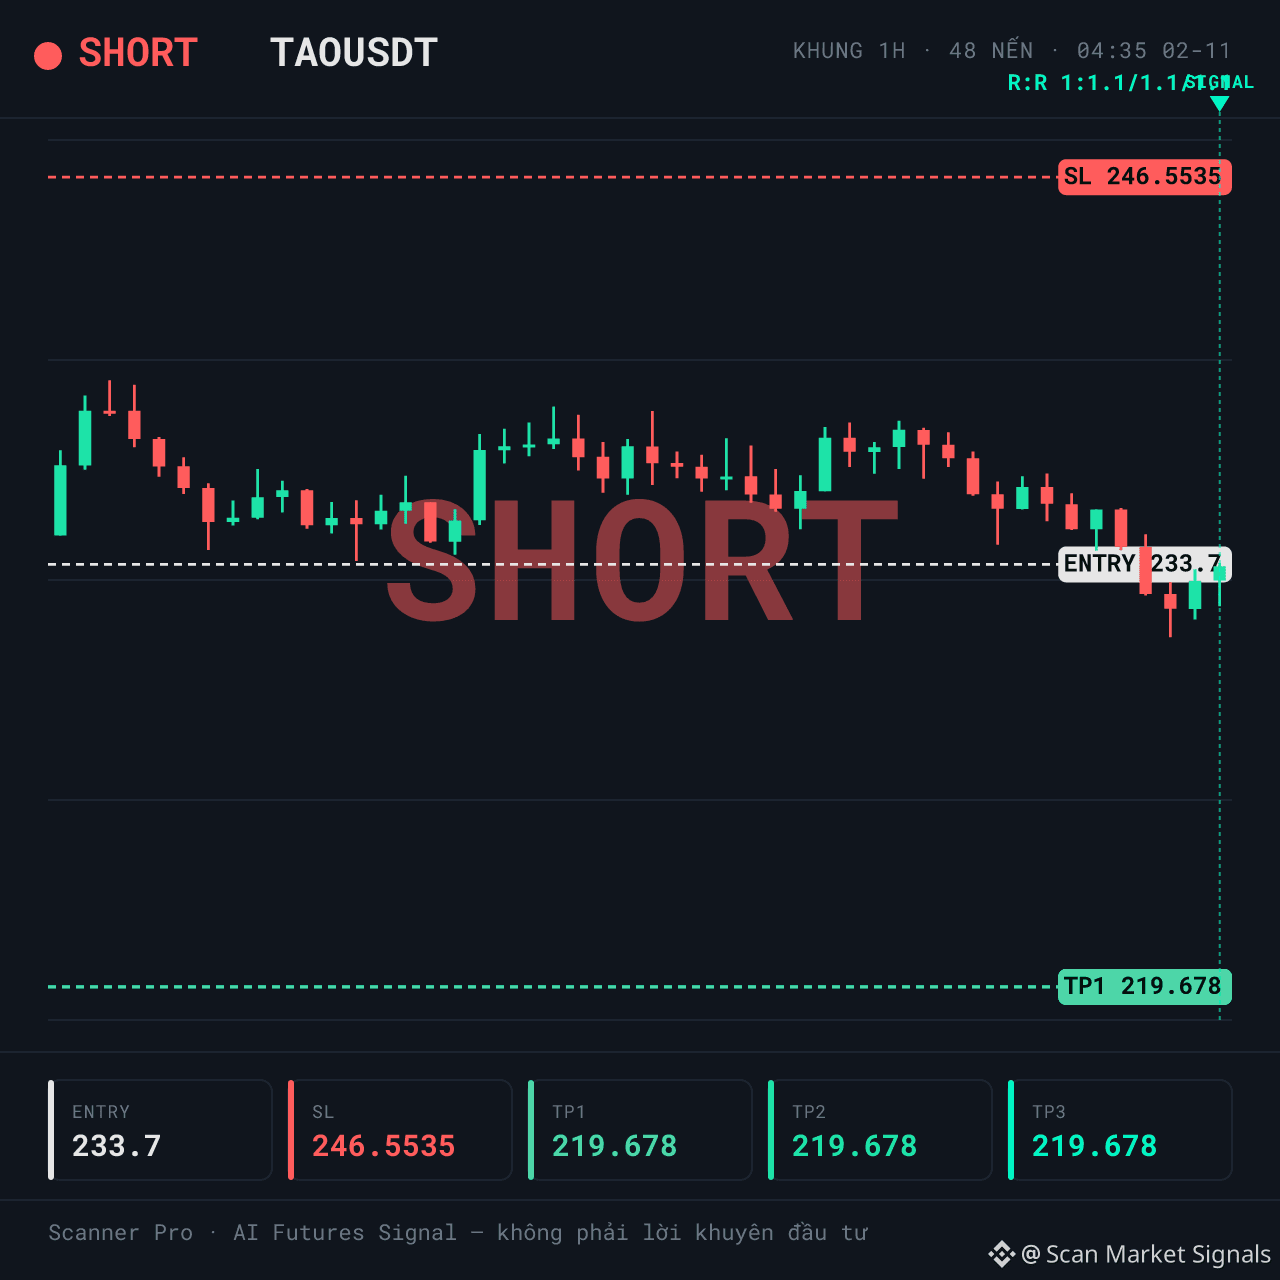
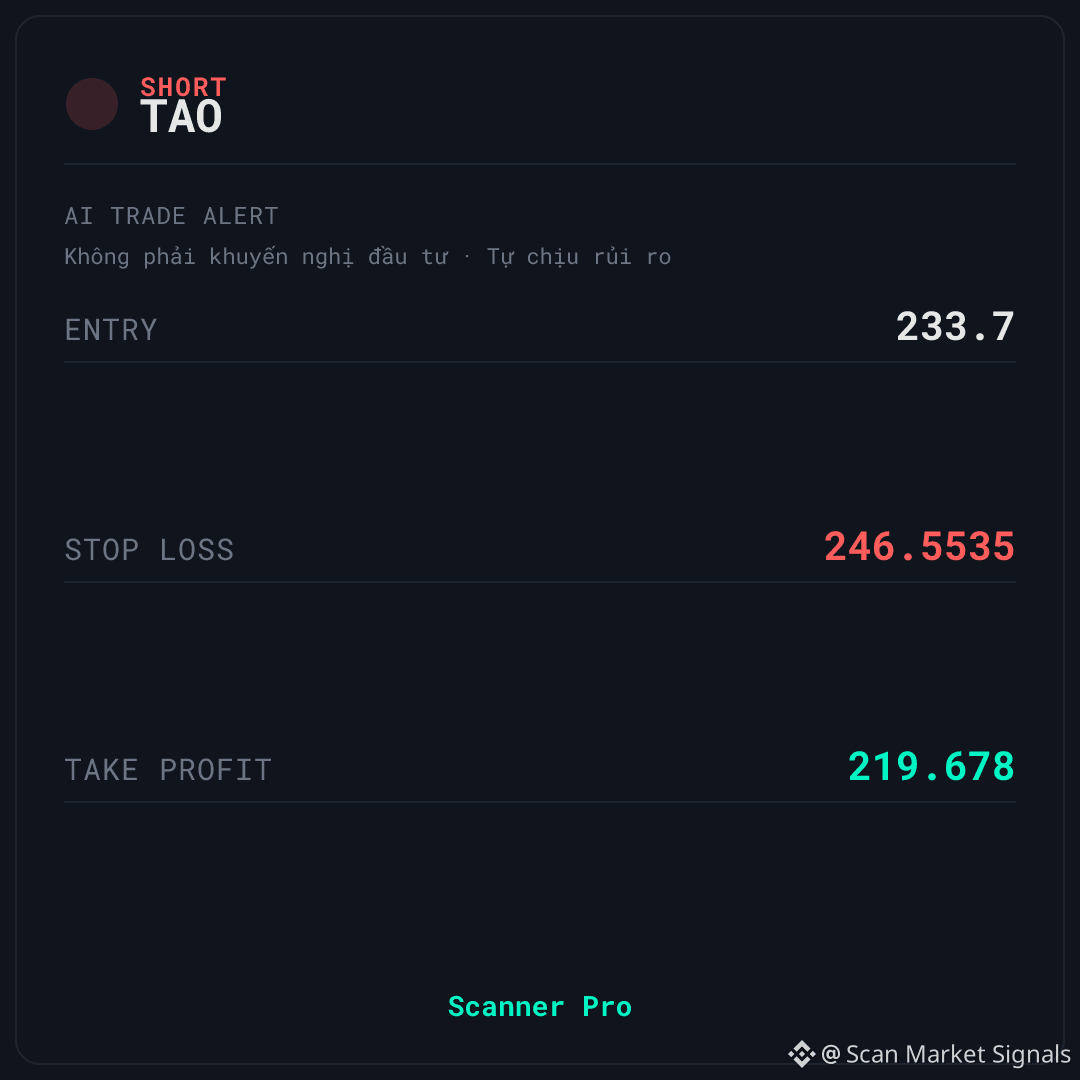
3
LONG $UNI | Volume 'spike' is only 0.64x — has real money actually entered the market?
🚨 AI TRADE ALERT — $UNI
🟢 LONG
📌 Entry: 7.1962 – 7.2178
🛑 Stop Loss: 6.8106
🎯 Take Profit: 7.6394
⏰ Valid for: 6 hours (23:30 on 01/11 – 05:30 on 02/11, Vietnam time)
↔️ SIDEWAY — the market is moving sideways, with a fade (mean-reversion) signal
$UNI is being monitored by Scanner Pro for a LONG scenario while the price holds above the short-term EMA zone. The context is classified as sideway, with a classification confidence of 55; 24h volume is approximately 154,948,135 in the quote asset, but the volume spike is only 0.64x.
📊 CONTEXT & DATA
The first reason to question this scenario: the volume spike ratio is only 0.64x, meaning volume has not truly surged to confirm an upward move. Funding is 0.0134%, indicating that LONG traders are paying SHORT traders—the crowd is leaning in the same direction as the signal, and that side is paying a fee.
Structurally, the price is around the 50% mark of the 24h range, with 1h momentum at 53.2 and 4h momentum at 55.3—a neutral zone with no clear trend yet. The regime is sideway with a classification confidence of 55, meaning the context classification is not particularly certain.
🚫 INVALIDATION & RISK MANAGEMENT — $UNI
⚠️ Biggest disadvantage: LONG traders are crowded and paying funding, while volume offers no confirmation—this is a risk to monitor rather than a positive factor.
If the price closes below the stop-loss level shown on the signal card, the current LONG scenario is no longer valid.
Do you think this is a sign of genuine accumulation, or just a bounce in a sideways market with no clear direction?
This technical analysis content is for educational purposes only and is not investment advice. Cryptocurrency trading involves high risk, and you could lose all your capital. Do your own research and take responsibility for your decisions.
#Binance #Crypto #Futures
LONG $UNI | Volume 'spike' is only 0.64x — has real money actually entered the market?
🚨 AI TRADE ALERT — $UNI
🟢 LONG
📌 Entry: 7.1962 – 7.2178
🛑 Stop Loss: 6.8106
🎯 Take Profit: 7.6394
⏰ Valid for: 6 hours (23:30 on 01/11 – 05:30 on 02/11, Vietnam time)
↔️ SIDEWAY — the market is moving sideways, with a fade (mean-reversion) signal
$UNI is being monitored by Scanner Pro for a LONG scenario while the price holds above the short-term EMA zone. The context is classified as sideway, with a classification confidence of 55; 24h volume is approximately 154,948,135 in the quote asset, but the volume spike is only 0.64x.
📊 CONTEXT & DATA
The first reason to question this scenario: the volume spike ratio is only 0.64x, meaning volume has not truly surged to confirm an upward move. Funding is 0.0134%, indicating that LONG traders are paying SHORT traders—the crowd is leaning in the same direction as the signal, and that side is paying a fee.
Structurally, the price is around the 50% mark of the 24h range, with 1h momentum at 53.2 and 4h momentum at 55.3—a neutral zone with no clear trend yet. The regime is sideway with a classification confidence of 55, meaning the context classification is not particularly certain.
🚫 INVALIDATION & RISK MANAGEMENT — $UNI
⚠️ Biggest disadvantage: LONG traders are crowded and paying funding, while volume offers no confirmation—this is a risk to monitor rather than a positive factor.
If the price closes below the stop-loss level shown on the signal card, the current LONG scenario is no longer valid.
Do you think this is a sign of genuine accumulation, or just a bounce in a sideways market with no clear direction?
This technical analysis content is for educational purposes only and is not investment advice. Cryptocurrency trading involves high risk, and you could lose all your capital. Do your own research and take responsibility for your decisions.
#Binance #Crypto #Futures
🚨 AI TRADE ALERT — $UNI
🟢 LONG
📌 Entry: 7.1962 – 7.2178
🛑 Stop Loss: 6.8106
🎯 Take Profit: 7.6394
⏰ Valid for: 6 hours (23:30 on 01/11 – 05:30 on 02/11, Vietnam time)
↔️ SIDEWAY — the market is moving sideways, with a fade (mean-reversion) signal
$UNI is being monitored by Scanner Pro for a LONG scenario while the price holds above the short-term EMA zone. The context is classified as sideway, with a classification confidence of 55; 24h volume is approximately 154,948,135 in the quote asset, but the volume spike is only 0.64x.
📊 CONTEXT & DATA
The first reason to question this scenario: the volume spike ratio is only 0.64x, meaning volume has not truly surged to confirm an upward move. Funding is 0.0134%, indicating that LONG traders are paying SHORT traders—the crowd is leaning in the same direction as the signal, and that side is paying a fee.
Structurally, the price is around the 50% mark of the 24h range, with 1h momentum at 53.2 and 4h momentum at 55.3—a neutral zone with no clear trend yet. The regime is sideway with a classification confidence of 55, meaning the context classification is not particularly certain.
🚫 INVALIDATION & RISK MANAGEMENT — $UNI
⚠️ Biggest disadvantage: LONG traders are crowded and paying funding, while volume offers no confirmation—this is a risk to monitor rather than a positive factor.
If the price closes below the stop-loss level shown on the signal card, the current LONG scenario is no longer valid.
Do you think this is a sign of genuine accumulation, or just a bounce in a sideways market with no clear direction?
This technical analysis content is for educational purposes only and is not investment advice. Cryptocurrency trading involves high risk, and you could lose all your capital. Do your own research and take responsibility for your decisions.
#Binance #Crypto #Futures
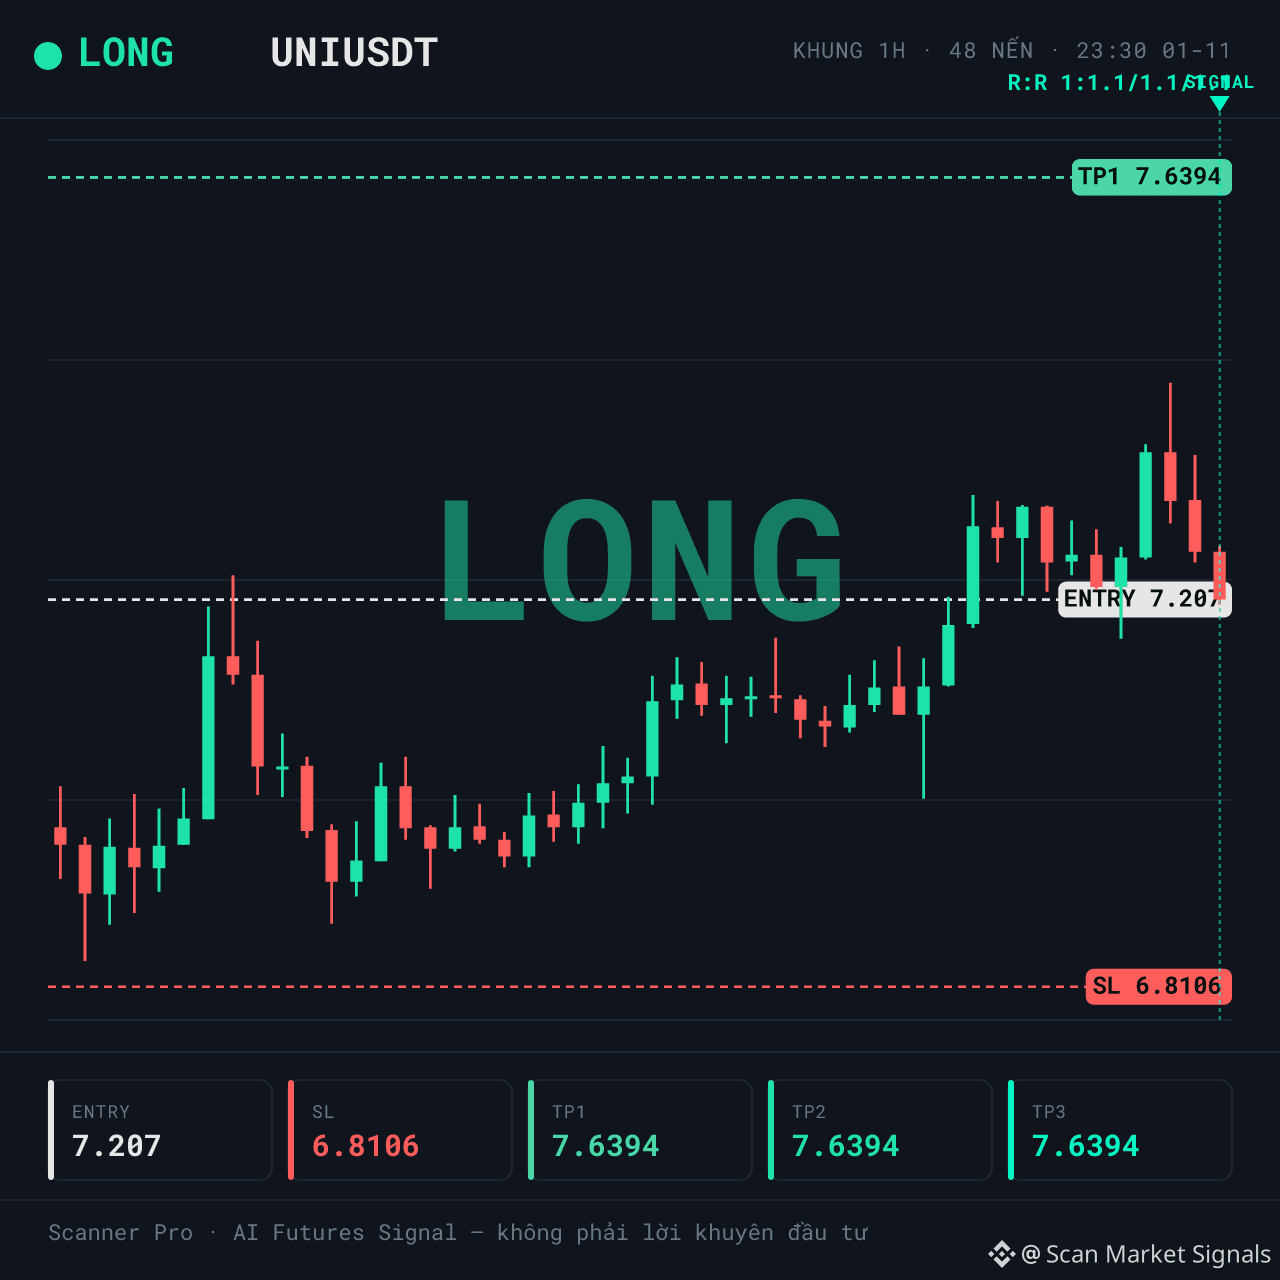
Log in to explore more content
Join global crypto users on Binance Square
⚡️ Get latest and useful information about crypto.
💬 Trusted by the world’s largest crypto exchange.
👍 Discover real insights from verified creators.
Email / Phone number
Trending Topics
USOctoberNFP-AreRateCutsStillPossible
1,386 views
63 Discussing
#USOctoberNFP-AreRateCutsStillPossible 🚨 FED RATE CUTS UNLIKELY? HIGHER FOR LONGER COULD PRESSURE CRYPTO MARKETS
The Federal Reserve's latest policy decision signals a cautious approach to monetary easing, with inflation concerns and labor-market resilience keeping interest-rate expectations firmly in focus.
📊 FED POLICY UPDATE
Federal Funds Rate: 3.75%–4.00%
FOMC Vote: 10–2 split
October NFP Forecast: 65,000 new jobs
Potential Upside: 100,000 jobs
Unemployment Forecast: 4.2%
Average Hourly Earnings: +0.3% MoM
🇺🇸 NOVEMBER 6: THE NEXT BIG TEST
The October Nonfarm Payrolls (NFP) report could significantly influence the Fed's next policy decisions.
Three possible scenarios:
🟥 Hot NFP: Strong employment and wage growth could strengthen the US dollar, push Treasury yields higher and pressure Bitcoin, Ethereum and other risk assets.
🟡 In-Line NFP: Markets may remain cautious as investors wait for additional inflation and employment data.
🟢 Weak NFP: A weaker labor market could revive expectations of future rate cuts, potentially supporting precious metals and cryptocurrencies.
📉 WHAT THIS MEANS FOR CRYPTO
A higher-for-longer interest-rate environment generally creates challenging conditions for risk assets.
Investors should closely monitor:
US Dollar Index (DXY)
US 10-Year Treasury Yield
Gold (XAU)
Bitcoin (BTC)
Ethereum (ETH)
Federal Reserve policy signals
BOTTOM LINE
November 6 could be an important turning point for market expectations. A stronger NFP report may reinforce the Fed's cautious stance, while weaker employment data could reopen discussions about monetary easing.
⚠️ These are potential scenarios, not confirmed market outcomes. A single jobs report does not guarantee future rate hikes or eliminate the possibility of rate cuts.
Not financial advice. For educational purposes only. Cryptocurrency and financial markets involve significant risk.
#FederalReserve #NFP #InterestRates #HigherForLonger #CryptoMarket #Bitcoin #Ethereum #Gold #USD #Macroeconomics
CHASEPA SULUXù
·0 Likes
·199 views
AppleEarningsAhead-CanStockHitNewHigh
470 views
25 Discussing
Verify1to1BinanceReserves
2,635 views
103 Discussing