

ScalpingX
14.3k Posts

ScalpingX
Report
Block User
A short-term trader who embraces high-risk, high-reward strategies with an unconventional mindset.
44 Following
1.7K+ Followers
10.3K+ Liked
Posts
All
Quotes
·
--
Bullish
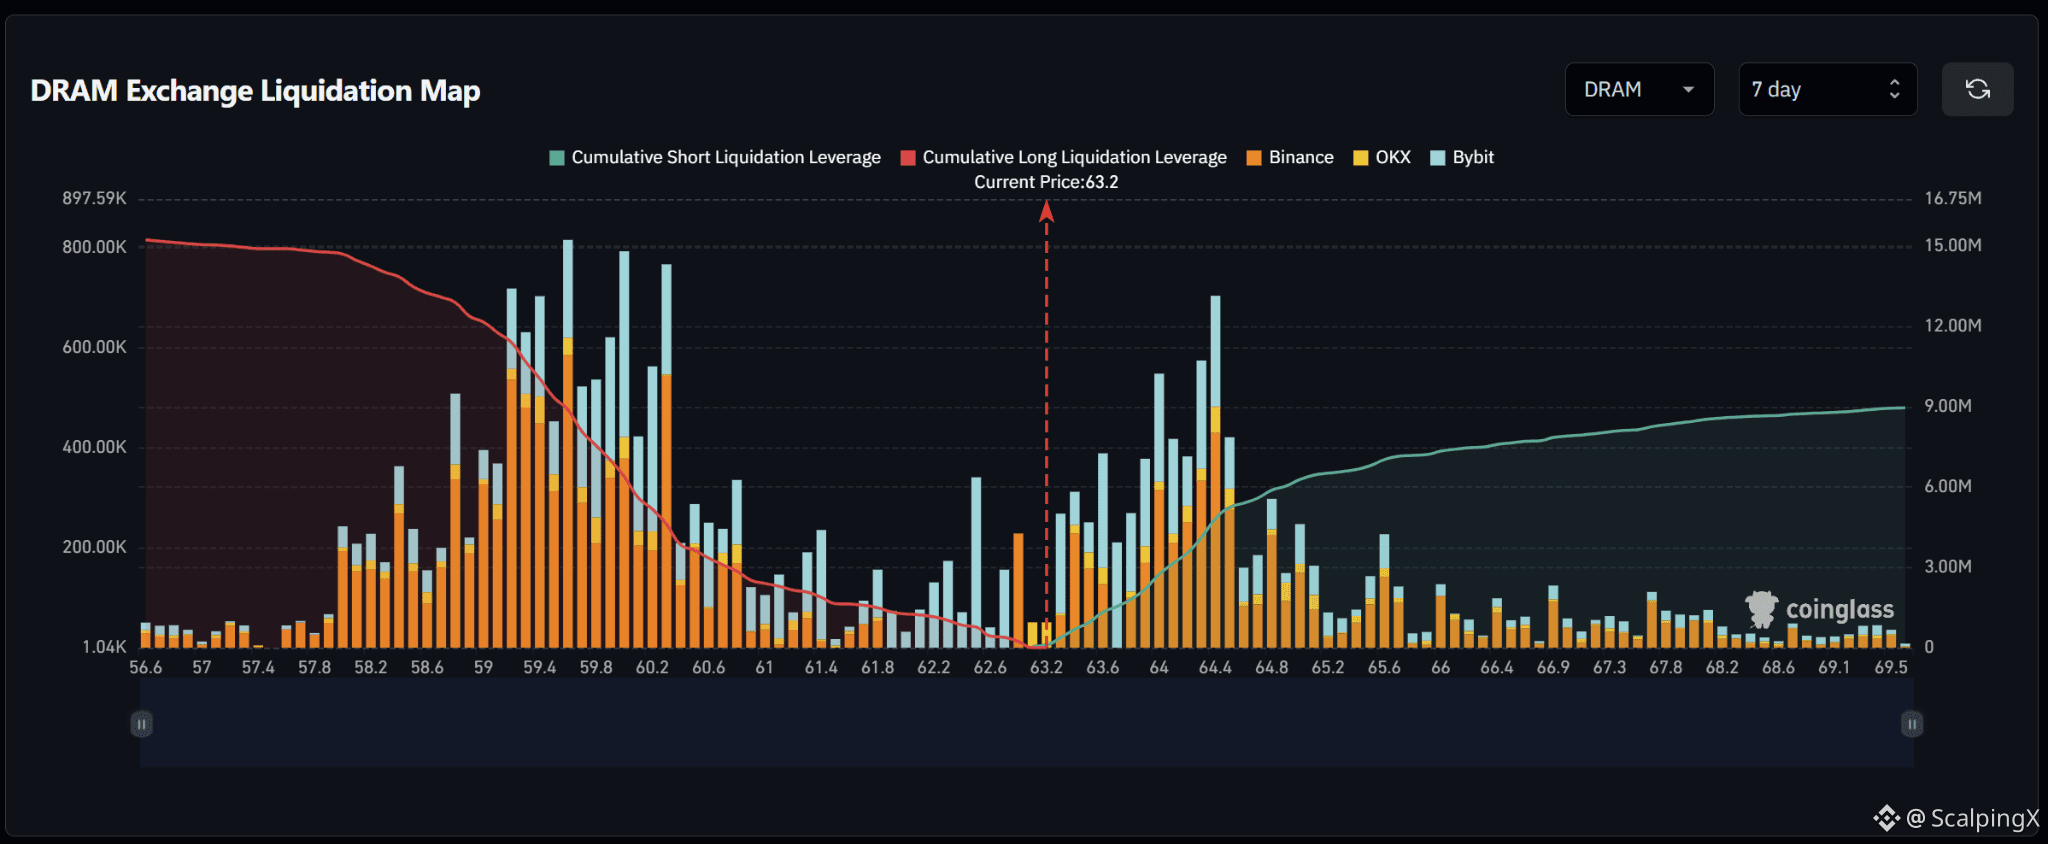
$DRAM – Liquidation Map (7 Days) – Current Price 63.2
🔎 The 7-day liquidation map shows roughly 15 million USD in long liquidations below the current price, exceeding approximately 9 million USD in short liquidations above. The liquidity structure therefore favors the downside, with around 1.7 times more cumulative liquidity below the market.
📉 Below the market, long-liquidation liquidity is concentrated heavily across 59.0–60.3. The strongest clusters sit around 59.4–59.7 and 59.9–60.2, with several bars near 0.6–0.8 million USD, while 58.8–59.2 also carries dense liquidity. Losing 62.6 would shift attention toward 61.8–61.0 and then 60.2–59.4.
📈 Above the market, short-liquidation liquidity is concentrated mainly across 63.6–64.6. The strongest cluster sits around 64.2–64.4 with a bar near 0.7 million USD, while 63.9–64.1 contains several bars around 0.4–0.55 million USD. Above 65.2, liquidity density declines noticeably.
🧭 The broader setup favors the downside because long-liquidation exposure below is meaningfully larger. Losing 62.6 would increase the probability of a sweep toward 61.8–61.0, followed by 60.2–59.4. Breaking above 63.6 would instead expose 64.0–64.4 before attention shifts toward 64.8–65.2.
$DRAM – Liquidation Map (7 Days) – Current Price 63.2
🔎 The 7-day liquidation map shows roughly 15 million USD in long liquidations below the current price, exceeding approximately 9 million USD in short liquidations above. The liquidity structure therefore favors the downside, with around 1.7 times more cumulative liquidity below the market.
📉 Below the market, long-liquidation liquidity is concentrated heavily across 59.0–60.3. The strongest clusters sit around 59.4–59.7 and 59.9–60.2, with several bars near 0.6–0.8 million USD, while 58.8–59.2 also carries dense liquidity. Losing 62.6 would shift attention toward 61.8–61.0 and then 60.2–59.4.
📈 Above the market, short-liquidation liquidity is concentrated mainly across 63.6–64.6. The strongest cluster sits around 64.2–64.4 with a bar near 0.7 million USD, while 63.9–64.1 contains several bars around 0.4–0.55 million USD. Above 65.2, liquidity density declines noticeably.
🧭 The broader setup favors the downside because long-liquidation exposure below is meaningfully larger. Losing 62.6 would increase the probability of a sweep toward 61.8–61.0, followed by 60.2–59.4. Breaking above 63.6 would instead expose 64.0–64.4 before attention shifts toward 64.8–65.2.
🔎 The 7-day liquidation map shows roughly 15 million USD in long liquidations below the current price, exceeding approximately 9 million USD in short liquidations above. The liquidity structure therefore favors the downside, with around 1.7 times more cumulative liquidity below the market.
📉 Below the market, long-liquidation liquidity is concentrated heavily across 59.0–60.3. The strongest clusters sit around 59.4–59.7 and 59.9–60.2, with several bars near 0.6–0.8 million USD, while 58.8–59.2 also carries dense liquidity. Losing 62.6 would shift attention toward 61.8–61.0 and then 60.2–59.4.
📈 Above the market, short-liquidation liquidity is concentrated mainly across 63.6–64.6. The strongest cluster sits around 64.2–64.4 with a bar near 0.7 million USD, while 63.9–64.1 contains several bars around 0.4–0.55 million USD. Above 65.2, liquidity density declines noticeably.
🧭 The broader setup favors the downside because long-liquidation exposure below is meaningfully larger. Losing 62.6 would increase the probability of a sweep toward 61.8–61.0, followed by 60.2–59.4. Breaking above 63.6 would instead expose 64.0–64.4 before attention shifts toward 64.8–65.2.
20
·
--
Bullish
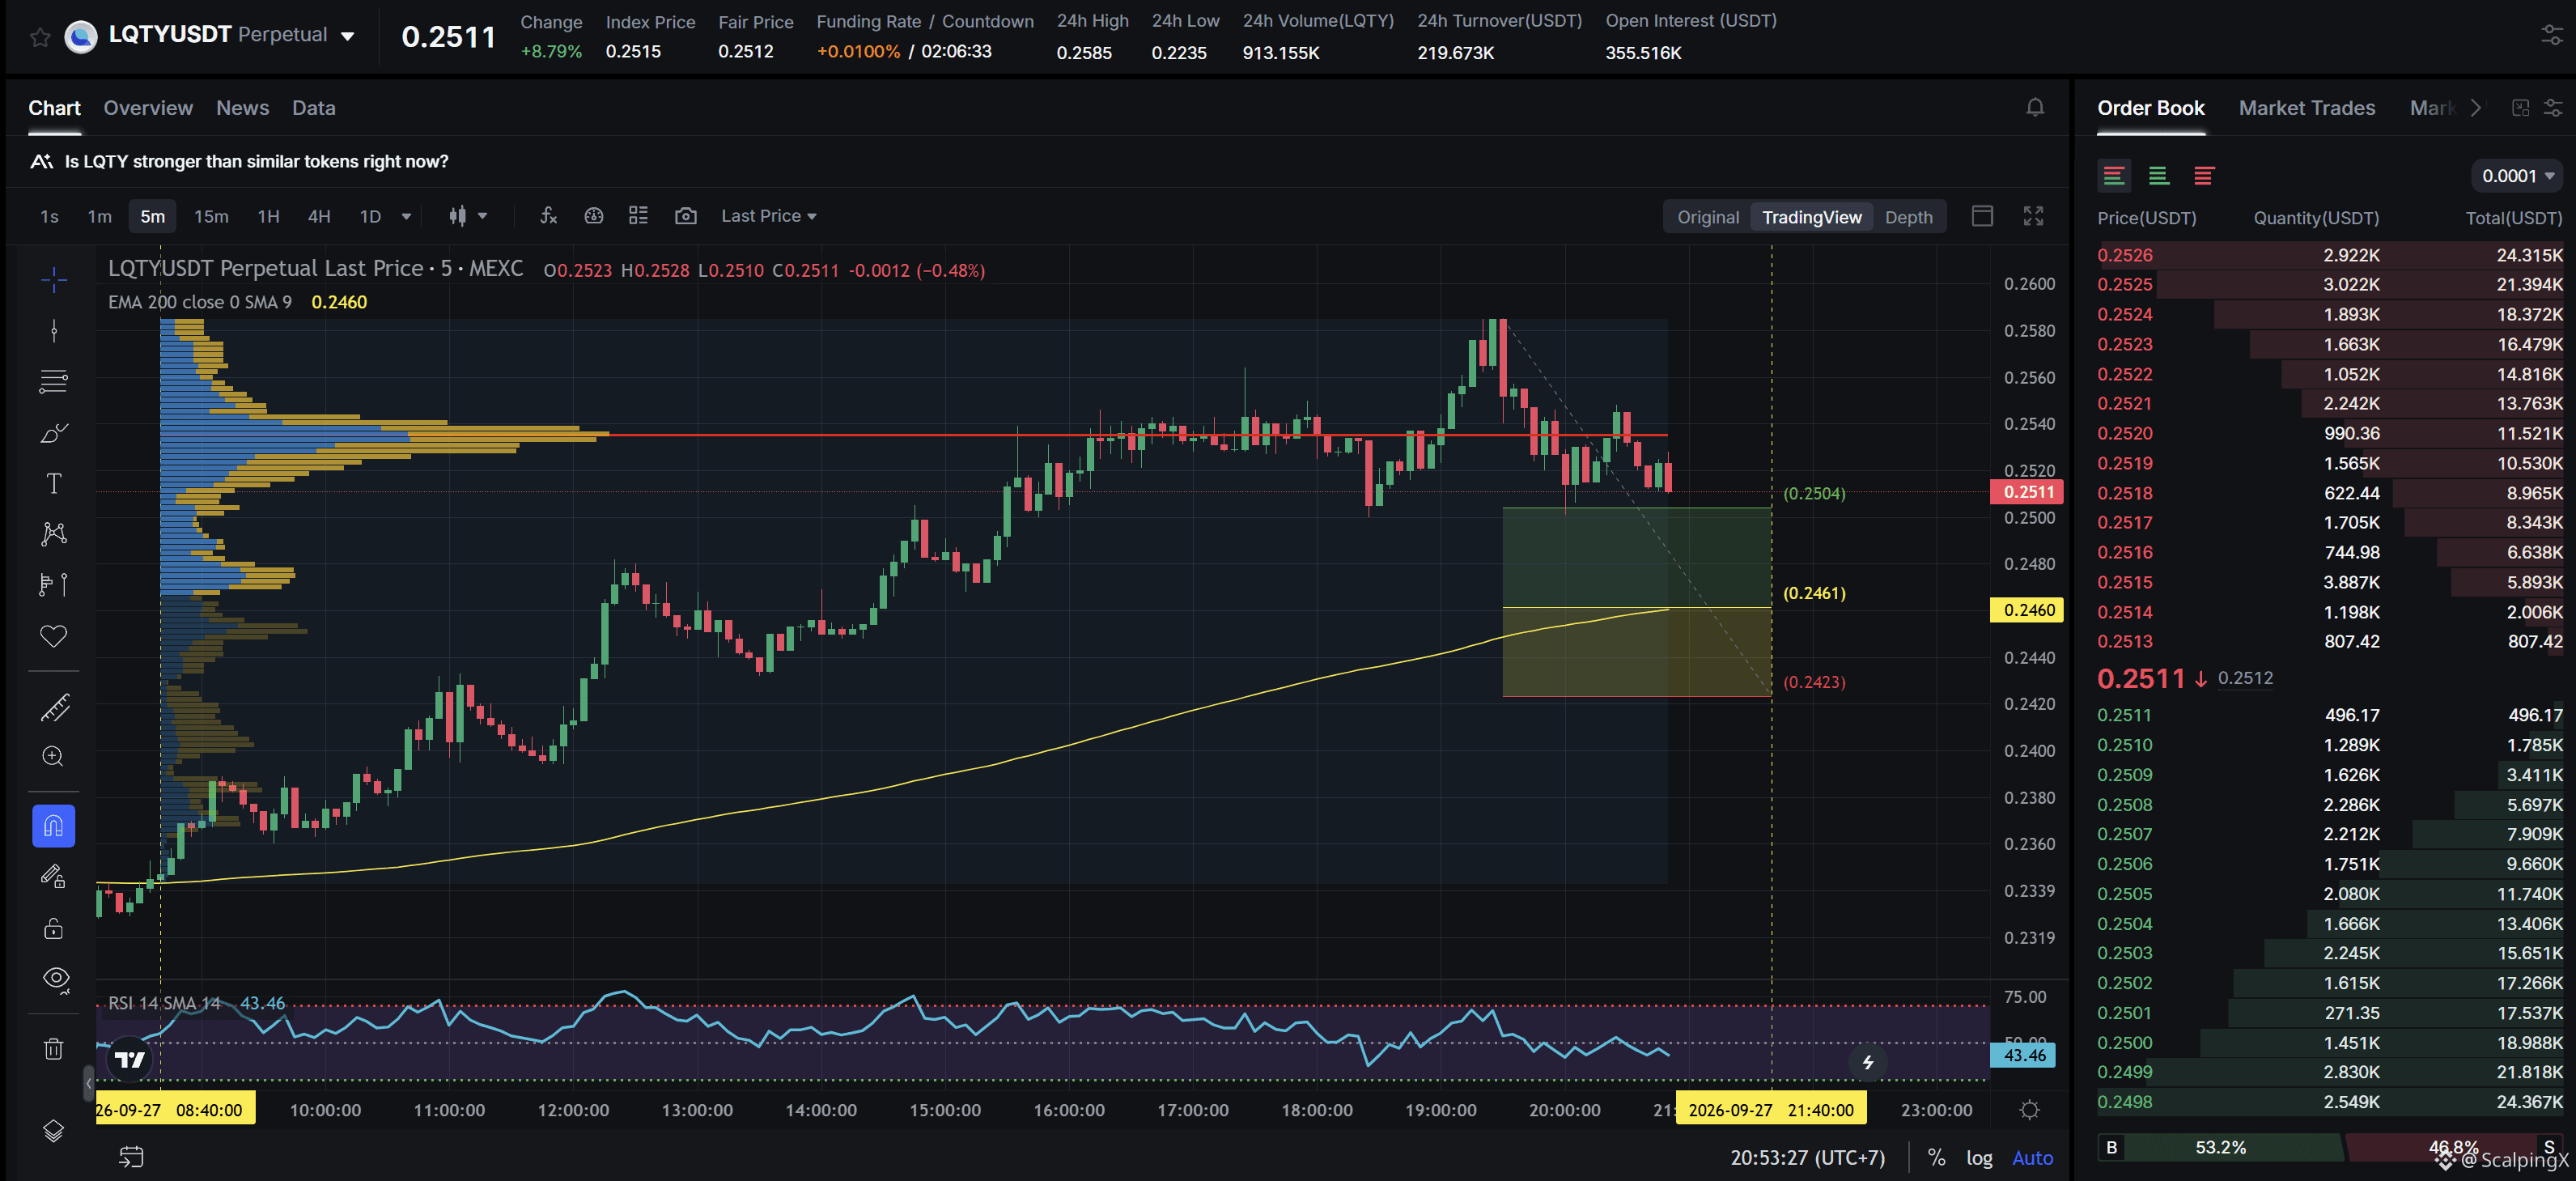
$LQTY - Mcap 24.28M$ - 24h Sentiment Neutral
SC02 M5 - pending Long order. Entry lies within LVN + not affected by any weak zone, the current support zone is approximately 1.58% wide. The uptrend has lasted 12 hours 10 minutes, with a maximum recorded price increase of 10.30%. If price loses this support zone, the trend is highly likely to reverse downward.
$LQTY - Mcap 24.28M$ - 24h Sentiment Neutral
SC02 M5 - pending Long order. Entry lies within LVN + not affected by any weak zone, the current support zone is approximately 1.58% wide. The uptrend has lasted 12 hours 10 minutes, with a maximum recorded price increase of 10.30%. If price loses this support zone, the trend is highly likely to reverse downward.
SC02 M5 - pending Long order. Entry lies within LVN + not affected by any weak zone, the current support zone is approximately 1.58% wide. The uptrend has lasted 12 hours 10 minutes, with a maximum recorded price increase of 10.30%. If price loses this support zone, the trend is highly likely to reverse downward.
10
·
--
Bullish
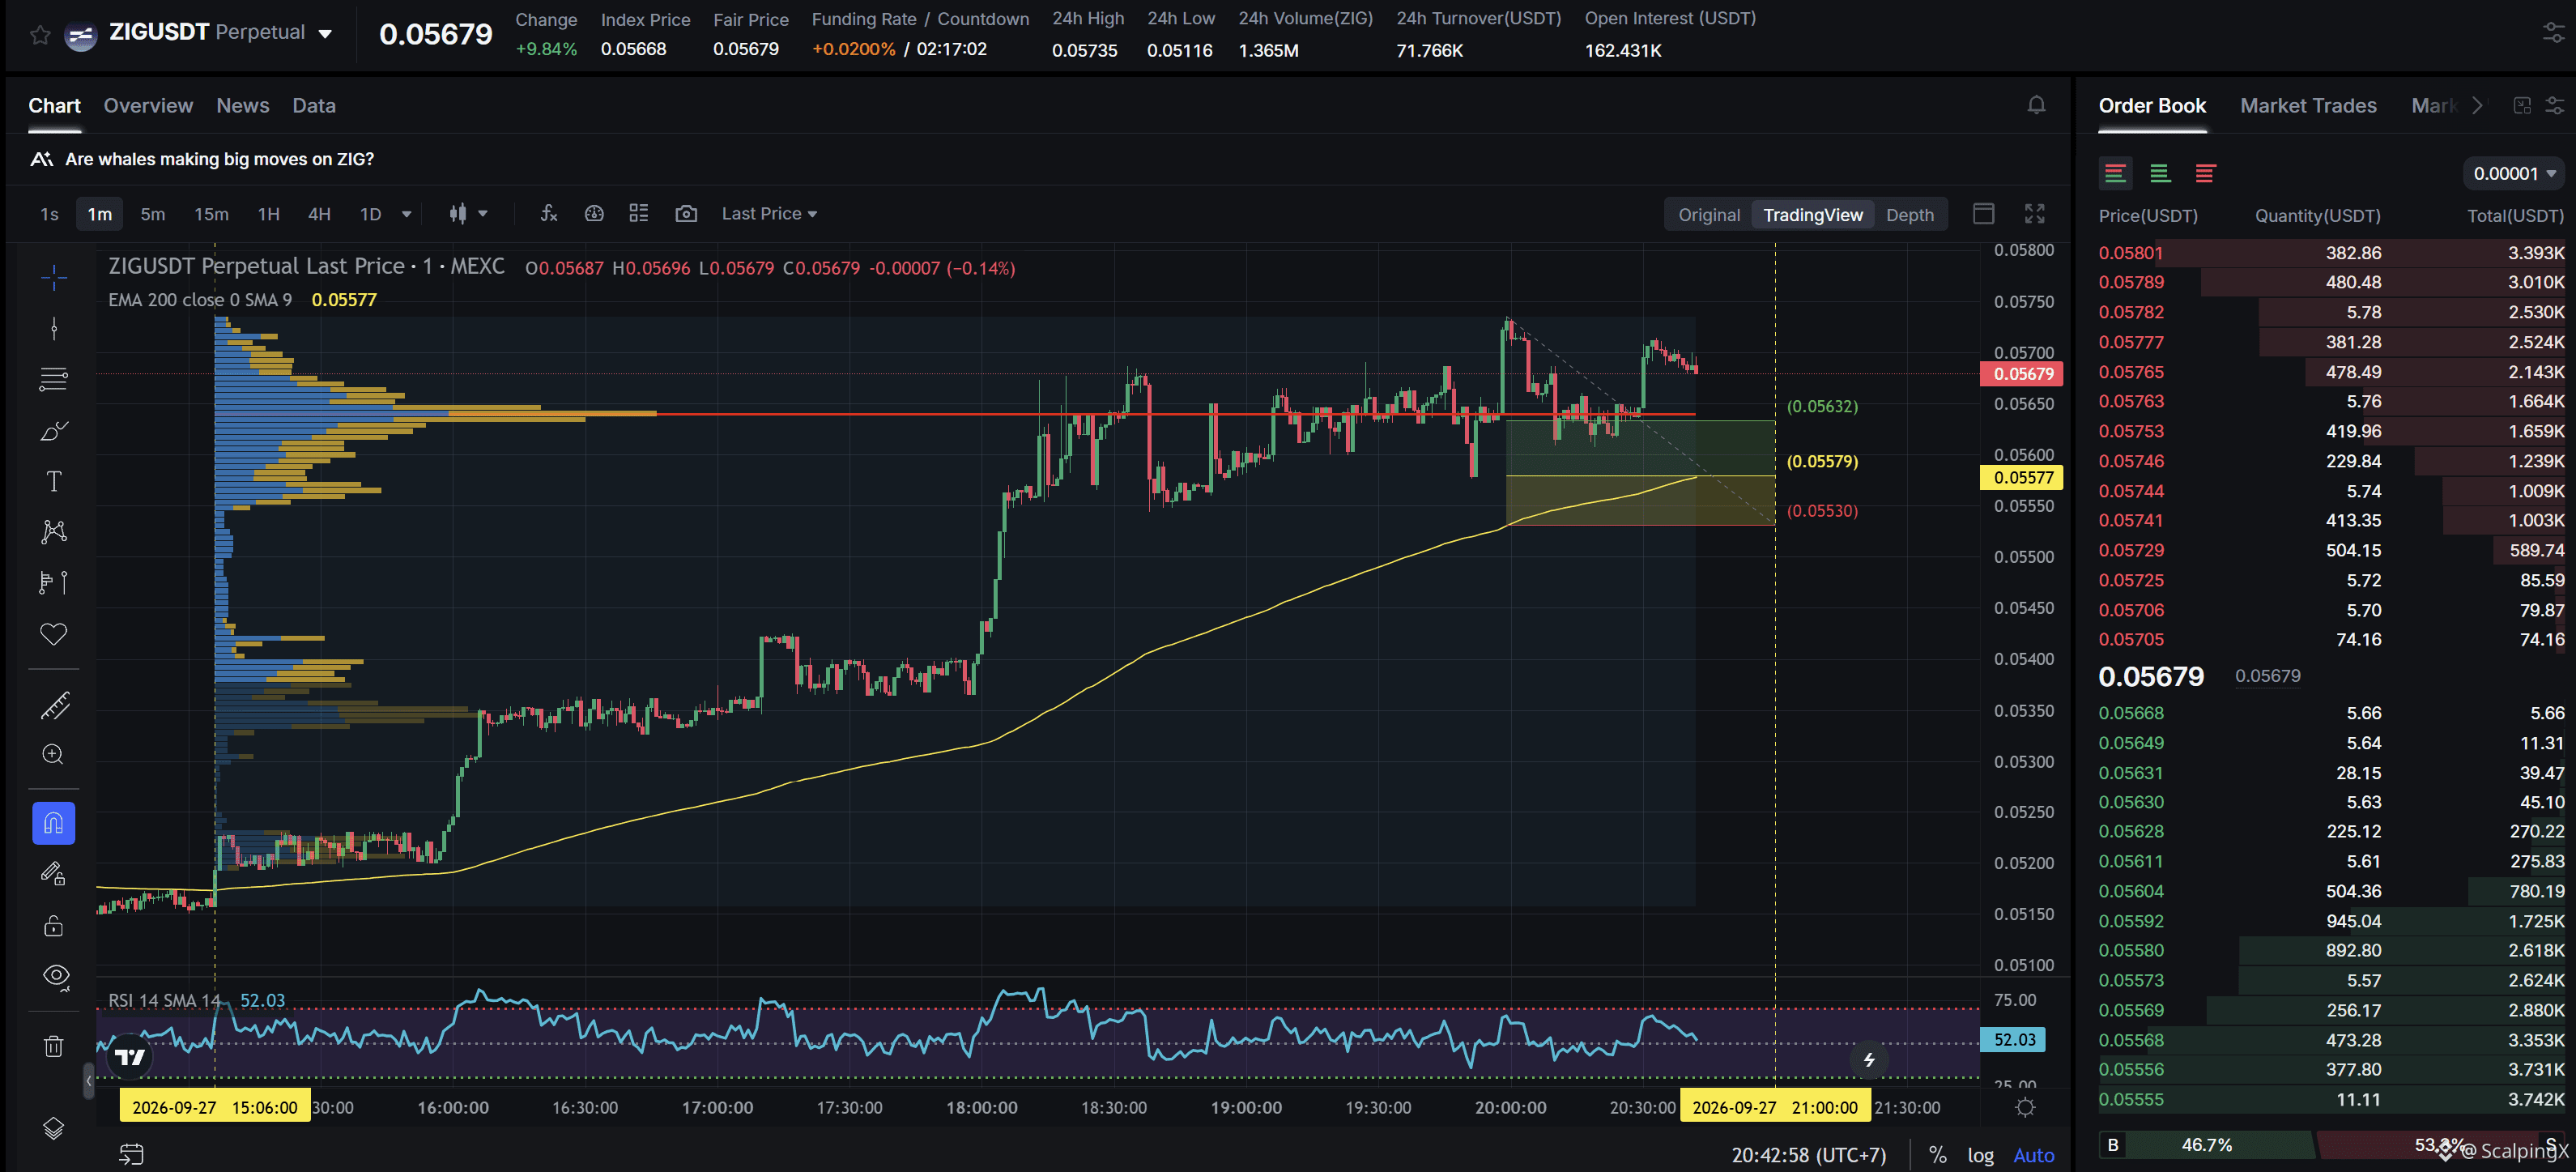
$ZIG - Mcap 79.98M$ - 24h Sentiment +5.44 Bullish
SC02 M1 - pending Long order. Entry lies within HVN + not affected by any weak zone, the current support zone is approximately 0.87% wide. The uptrend has lasted 5 hours 38 minutes, with a maximum recorded price increase of 10.81%. If price loses this support zone, the trend is highly likely to reverse downward.
$ZIG - Mcap 79.98M$ - 24h Sentiment +5.44 Bullish
SC02 M1 - pending Long order. Entry lies within HVN + not affected by any weak zone, the current support zone is approximately 0.87% wide. The uptrend has lasted 5 hours 38 minutes, with a maximum recorded price increase of 10.81%. If price loses this support zone, the trend is highly likely to reverse downward.
SC02 M1 - pending Long order. Entry lies within HVN + not affected by any weak zone, the current support zone is approximately 0.87% wide. The uptrend has lasted 5 hours 38 minutes, with a maximum recorded price increase of 10.81%. If price loses this support zone, the trend is highly likely to reverse downward.
12
·
--
Bullish
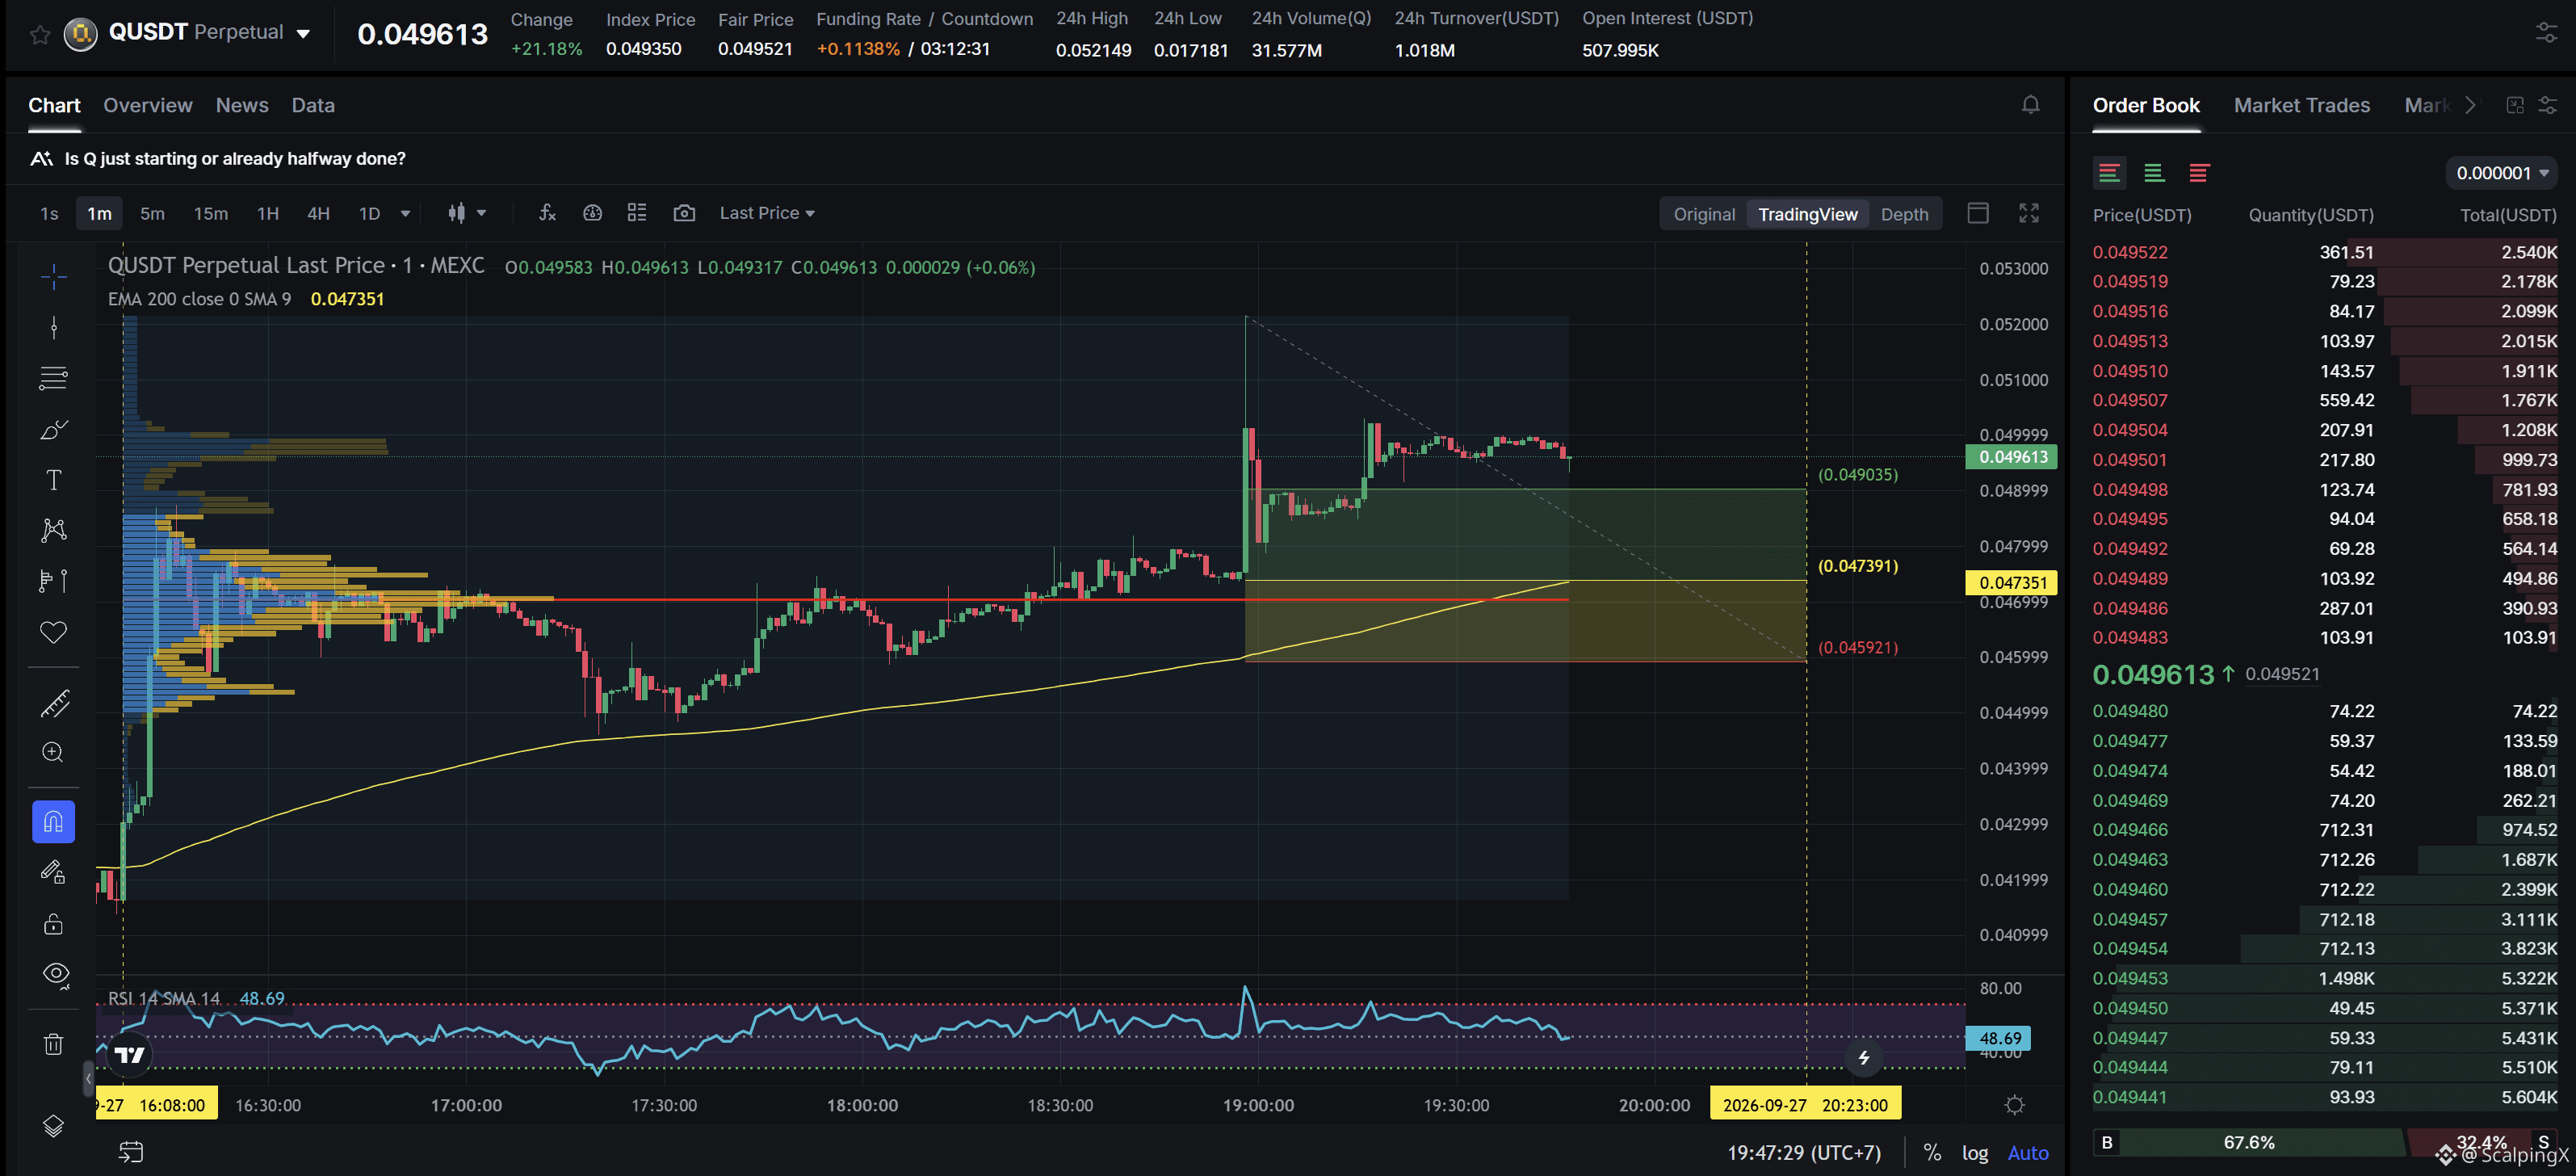
$Q - Mcap 222.79M$ - 24h Sentiment +1.67 Bullish
SC02 M1 - pending Long order. Entry contains POC + not affected by any weak zone, the current support zone is approximately 3.11% wide. The uptrend has lasted 3 hours 41 minutes, with a maximum recorded price increase of 23.50%. If price loses this support zone, the trend is highly likely to reverse downward.
$Q - Mcap 222.79M$ - 24h Sentiment +1.67 Bullish
SC02 M1 - pending Long order. Entry contains POC + not affected by any weak zone, the current support zone is approximately 3.11% wide. The uptrend has lasted 3 hours 41 minutes, with a maximum recorded price increase of 23.50%. If price loses this support zone, the trend is highly likely to reverse downward.
SC02 M1 - pending Long order. Entry contains POC + not affected by any weak zone, the current support zone is approximately 3.11% wide. The uptrend has lasted 3 hours 41 minutes, with a maximum recorded price increase of 23.50%. If price loses this support zone, the trend is highly likely to reverse downward.
32
·
--
Bullish
Bitcoin Holds Above $84K as Greed Cools, With No Sign of Extreme FOMO Yet
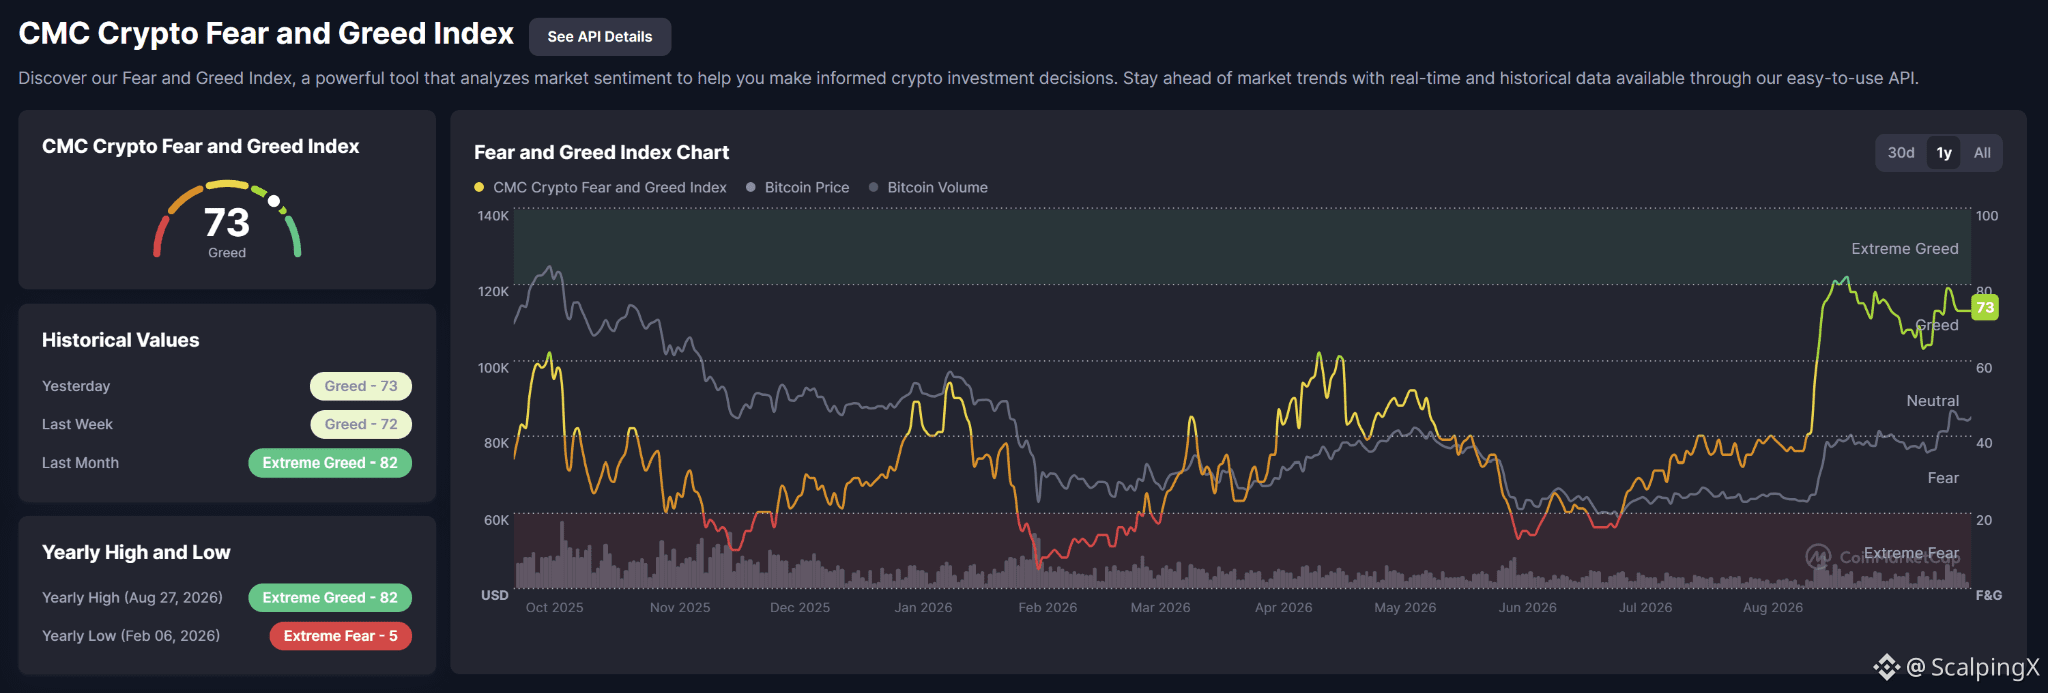
🟡 The CMC Crypto Fear and Greed Index currently stands at 73 – Greed, virtually unchanged from yesterday and last week, but notably below the 82 – Extreme Greed reading seen in late August. BTC remains around $84,400–$84,800, suggesting sentiment has cooled without a comparable deterioration in price.
📊 On-chain data also shows limited signs of overheating. MVRV remains around 1.5–1.6, NUPL is still in the Hope zone, while SOPR sits near 1, indicating the market is broadly profitable without aggressive profit-taking.
⚙️ Derivatives funding remains close to neutral, while BTC dominance near 58.5% suggests capital rotation is still selective rather than spreading broadly across altcoins.
🌐 Macro conditions remain a constraint as US yields stay elevated, while total stablecoin supply has been nearly flat over the past 90 days. This suggests the current recovery has yet to be supported by a major new wave of crypto liquidity.
#CryptoMarket $BNB $XRP $TRX
Bitcoin Holds Above $84K as Greed Cools, With No Sign of Extreme FOMO Yet
🟡 The CMC Crypto Fear and Greed Index currently stands at 73 – Greed, virtually unchanged from yesterday and last week, but notably below the 82 – Extreme Greed reading seen in late August. BTC remains around $84,400–$84,800, suggesting sentiment has cooled without a comparable deterioration in price.
📊 On-chain data also shows limited signs of overheating. MVRV remains around 1.5–1.6, NUPL is still in the Hope zone, while SOPR sits near 1, indicating the market is broadly profitable without aggressive profit-taking.
⚙️ Derivatives funding remains close to neutral, while BTC dominance near 58.5% suggests capital rotation is still selective rather than spreading broadly across altcoins.
🌐 Macro conditions remain a constraint as US yields stay elevated, while total stablecoin supply has been nearly flat over the past 90 days. This suggests the current recovery has yet to be supported by a major new wave of crypto liquidity.
#CryptoMarket $BNB $XRP $TRX
🟡 The CMC Crypto Fear and Greed Index currently stands at 73 – Greed, virtually unchanged from yesterday and last week, but notably below the 82 – Extreme Greed reading seen in late August. BTC remains around $84,400–$84,800, suggesting sentiment has cooled without a comparable deterioration in price.
📊 On-chain data also shows limited signs of overheating. MVRV remains around 1.5–1.6, NUPL is still in the Hope zone, while SOPR sits near 1, indicating the market is broadly profitable without aggressive profit-taking.
⚙️ Derivatives funding remains close to neutral, while BTC dominance near 58.5% suggests capital rotation is still selective rather than spreading broadly across altcoins.
🌐 Macro conditions remain a constraint as US yields stay elevated, while total stablecoin supply has been nearly flat over the past 90 days. This suggests the current recovery has yet to be supported by a major new wave of crypto liquidity.
#CryptoMarket $BNB $XRP $TRX
65
·
--
Bullish
$VVV – Liquidation Map (7 Days) – Current Price 31.11
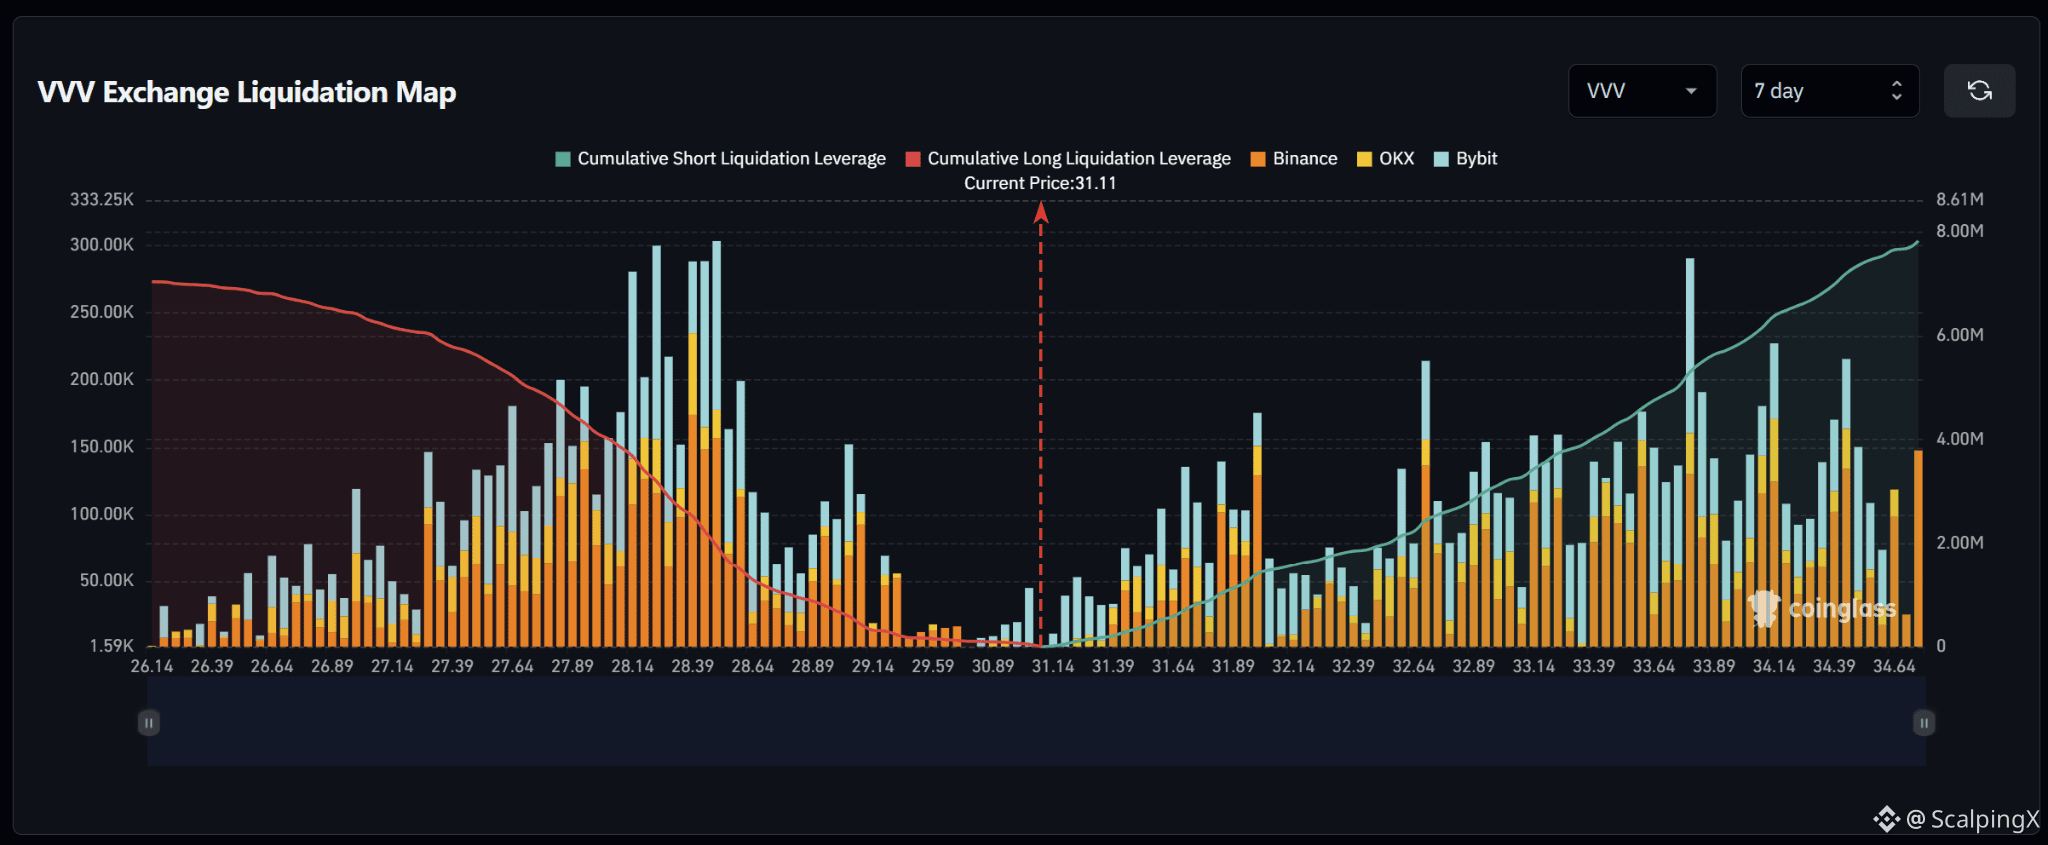
🔎 The 7-day liquidation map shows roughly 8 million USD in short liquidations above the current price, slightly exceeding approximately 6.8–7 million USD in long liquidations below. The liquidity structure is therefore fairly balanced, with a mild upside tilt of around 1.2 times.
📉 Below the market, long-liquidation liquidity is concentrated most heavily across 27.6–29.1. The strongest cluster sits around 28.1–28.5 with several bars near 0.28–0.30 million USD, while 27.6–27.9 also carries meaningful liquidity. Losing 30.9 would shift attention toward 29.1–28.9 and then 28.5–28.1.
📈 Above the market, short-liquidation liquidity is distributed broadly across 31.5–34.6. The strongest cluster sits around 33.7–33.9 with a bar close to 0.29 million USD, while 32.6–32.7, 34.1–34.2 and 34.4–34.5 also contain several bars around 0.20–0.24 million USD.
🧭 The broader setup has a mild upside tilt because short-liquidation exposure above is larger. Breaking above 31.6–31.9 would expose 32.6–32.9, followed by 33.7–34.2. Losing 30.9 would instead increase the probability of a sweep toward 29.1–28.9 and then 28.5–28.1.
$VVV – Liquidation Map (7 Days) – Current Price 31.11
🔎 The 7-day liquidation map shows roughly 8 million USD in short liquidations above the current price, slightly exceeding approximately 6.8–7 million USD in long liquidations below. The liquidity structure is therefore fairly balanced, with a mild upside tilt of around 1.2 times.
📉 Below the market, long-liquidation liquidity is concentrated most heavily across 27.6–29.1. The strongest cluster sits around 28.1–28.5 with several bars near 0.28–0.30 million USD, while 27.6–27.9 also carries meaningful liquidity. Losing 30.9 would shift attention toward 29.1–28.9 and then 28.5–28.1.
📈 Above the market, short-liquidation liquidity is distributed broadly across 31.5–34.6. The strongest cluster sits around 33.7–33.9 with a bar close to 0.29 million USD, while 32.6–32.7, 34.1–34.2 and 34.4–34.5 also contain several bars around 0.20–0.24 million USD.
🧭 The broader setup has a mild upside tilt because short-liquidation exposure above is larger. Breaking above 31.6–31.9 would expose 32.6–32.9, followed by 33.7–34.2. Losing 30.9 would instead increase the probability of a sweep toward 29.1–28.9 and then 28.5–28.1.
🔎 The 7-day liquidation map shows roughly 8 million USD in short liquidations above the current price, slightly exceeding approximately 6.8–7 million USD in long liquidations below. The liquidity structure is therefore fairly balanced, with a mild upside tilt of around 1.2 times.
📉 Below the market, long-liquidation liquidity is concentrated most heavily across 27.6–29.1. The strongest cluster sits around 28.1–28.5 with several bars near 0.28–0.30 million USD, while 27.6–27.9 also carries meaningful liquidity. Losing 30.9 would shift attention toward 29.1–28.9 and then 28.5–28.1.
📈 Above the market, short-liquidation liquidity is distributed broadly across 31.5–34.6. The strongest cluster sits around 33.7–33.9 with a bar close to 0.29 million USD, while 32.6–32.7, 34.1–34.2 and 34.4–34.5 also contain several bars around 0.20–0.24 million USD.
🧭 The broader setup has a mild upside tilt because short-liquidation exposure above is larger. Breaking above 31.6–31.9 would expose 32.6–32.9, followed by 33.7–34.2. Losing 30.9 would instead increase the probability of a sweep toward 29.1–28.9 and then 28.5–28.1.
20
·
--
Bullish
$BIGTIME - Mcap 28.12M$ - 24h Sentiment Neutral
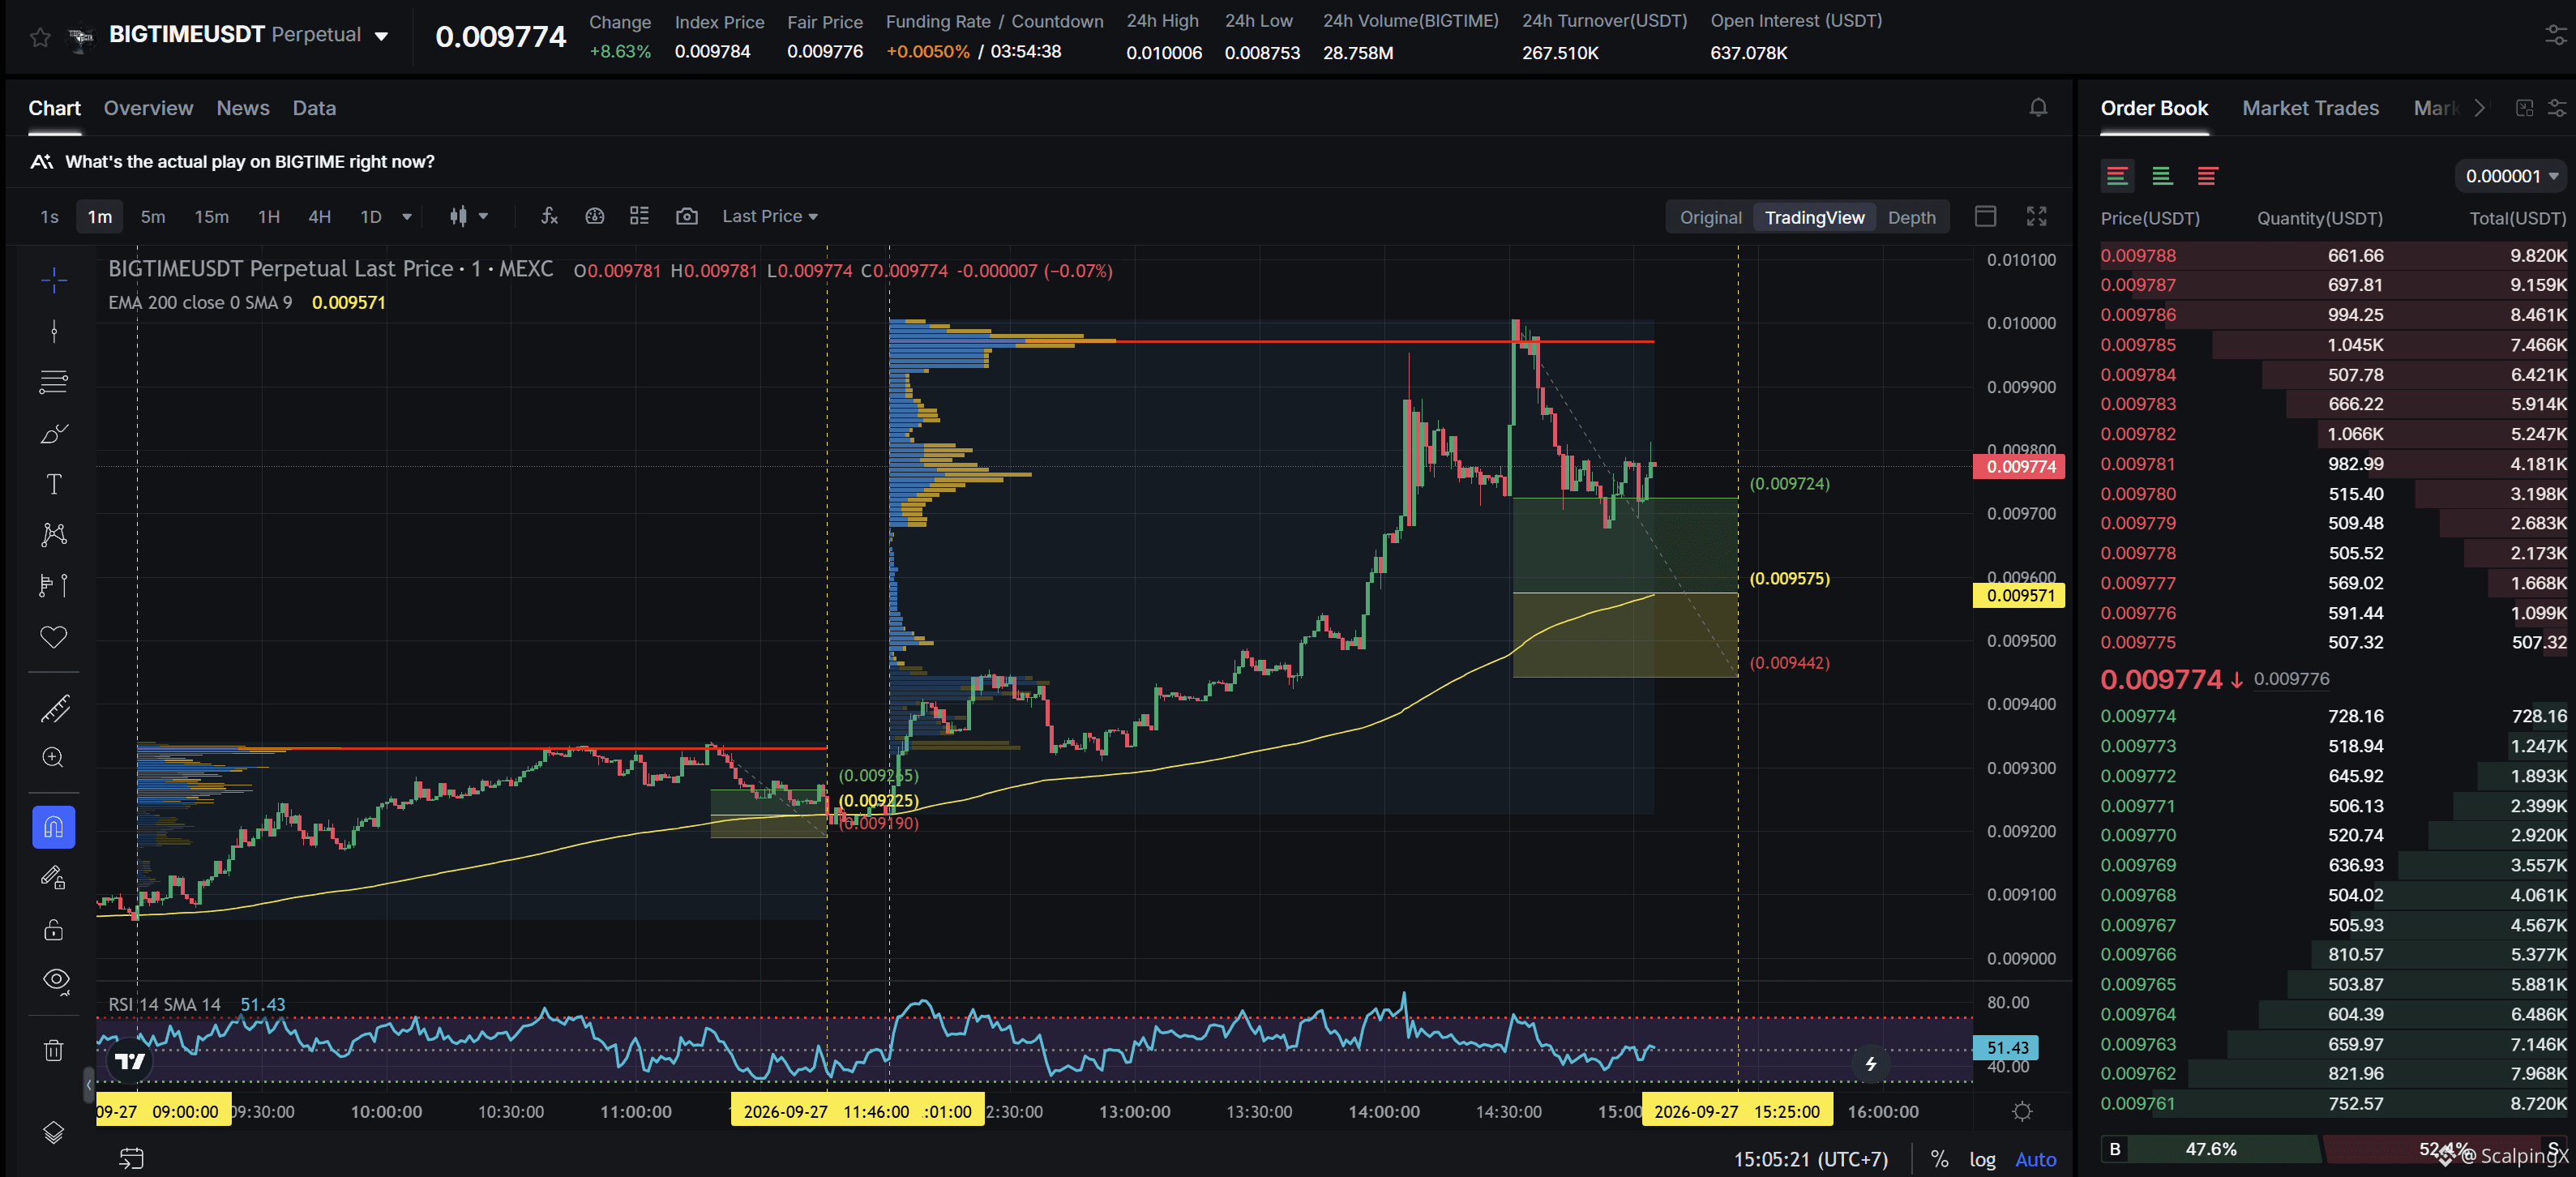
SC02 M1 - pending Long order. Entry lies within HVN + meets positive simplification with a previously highly profitable Long order, the current support zone is approximately 1.35% wide. The uptrend has lasted 3 hours 8 minutes, with a maximum recorded price increase of 8.42%. If price loses this support zone, the trend is highly likely to reverse downward.
$BIGTIME - Mcap 28.12M$ - 24h Sentiment Neutral
SC02 M1 - pending Long order. Entry lies within HVN + meets positive simplification with a previously highly profitable Long order, the current support zone is approximately 1.35% wide. The uptrend has lasted 3 hours 8 minutes, with a maximum recorded price increase of 8.42%. If price loses this support zone, the trend is highly likely to reverse downward.
SC02 M1 - pending Long order. Entry lies within HVN + meets positive simplification with a previously highly profitable Long order, the current support zone is approximately 1.35% wide. The uptrend has lasted 3 hours 8 minutes, with a maximum recorded price increase of 8.42%. If price loses this support zone, the trend is highly likely to reverse downward.
20
·
--
Bullish
$W - Mcap 98.17M$ - 24h Sentiment +5.77 Bullish
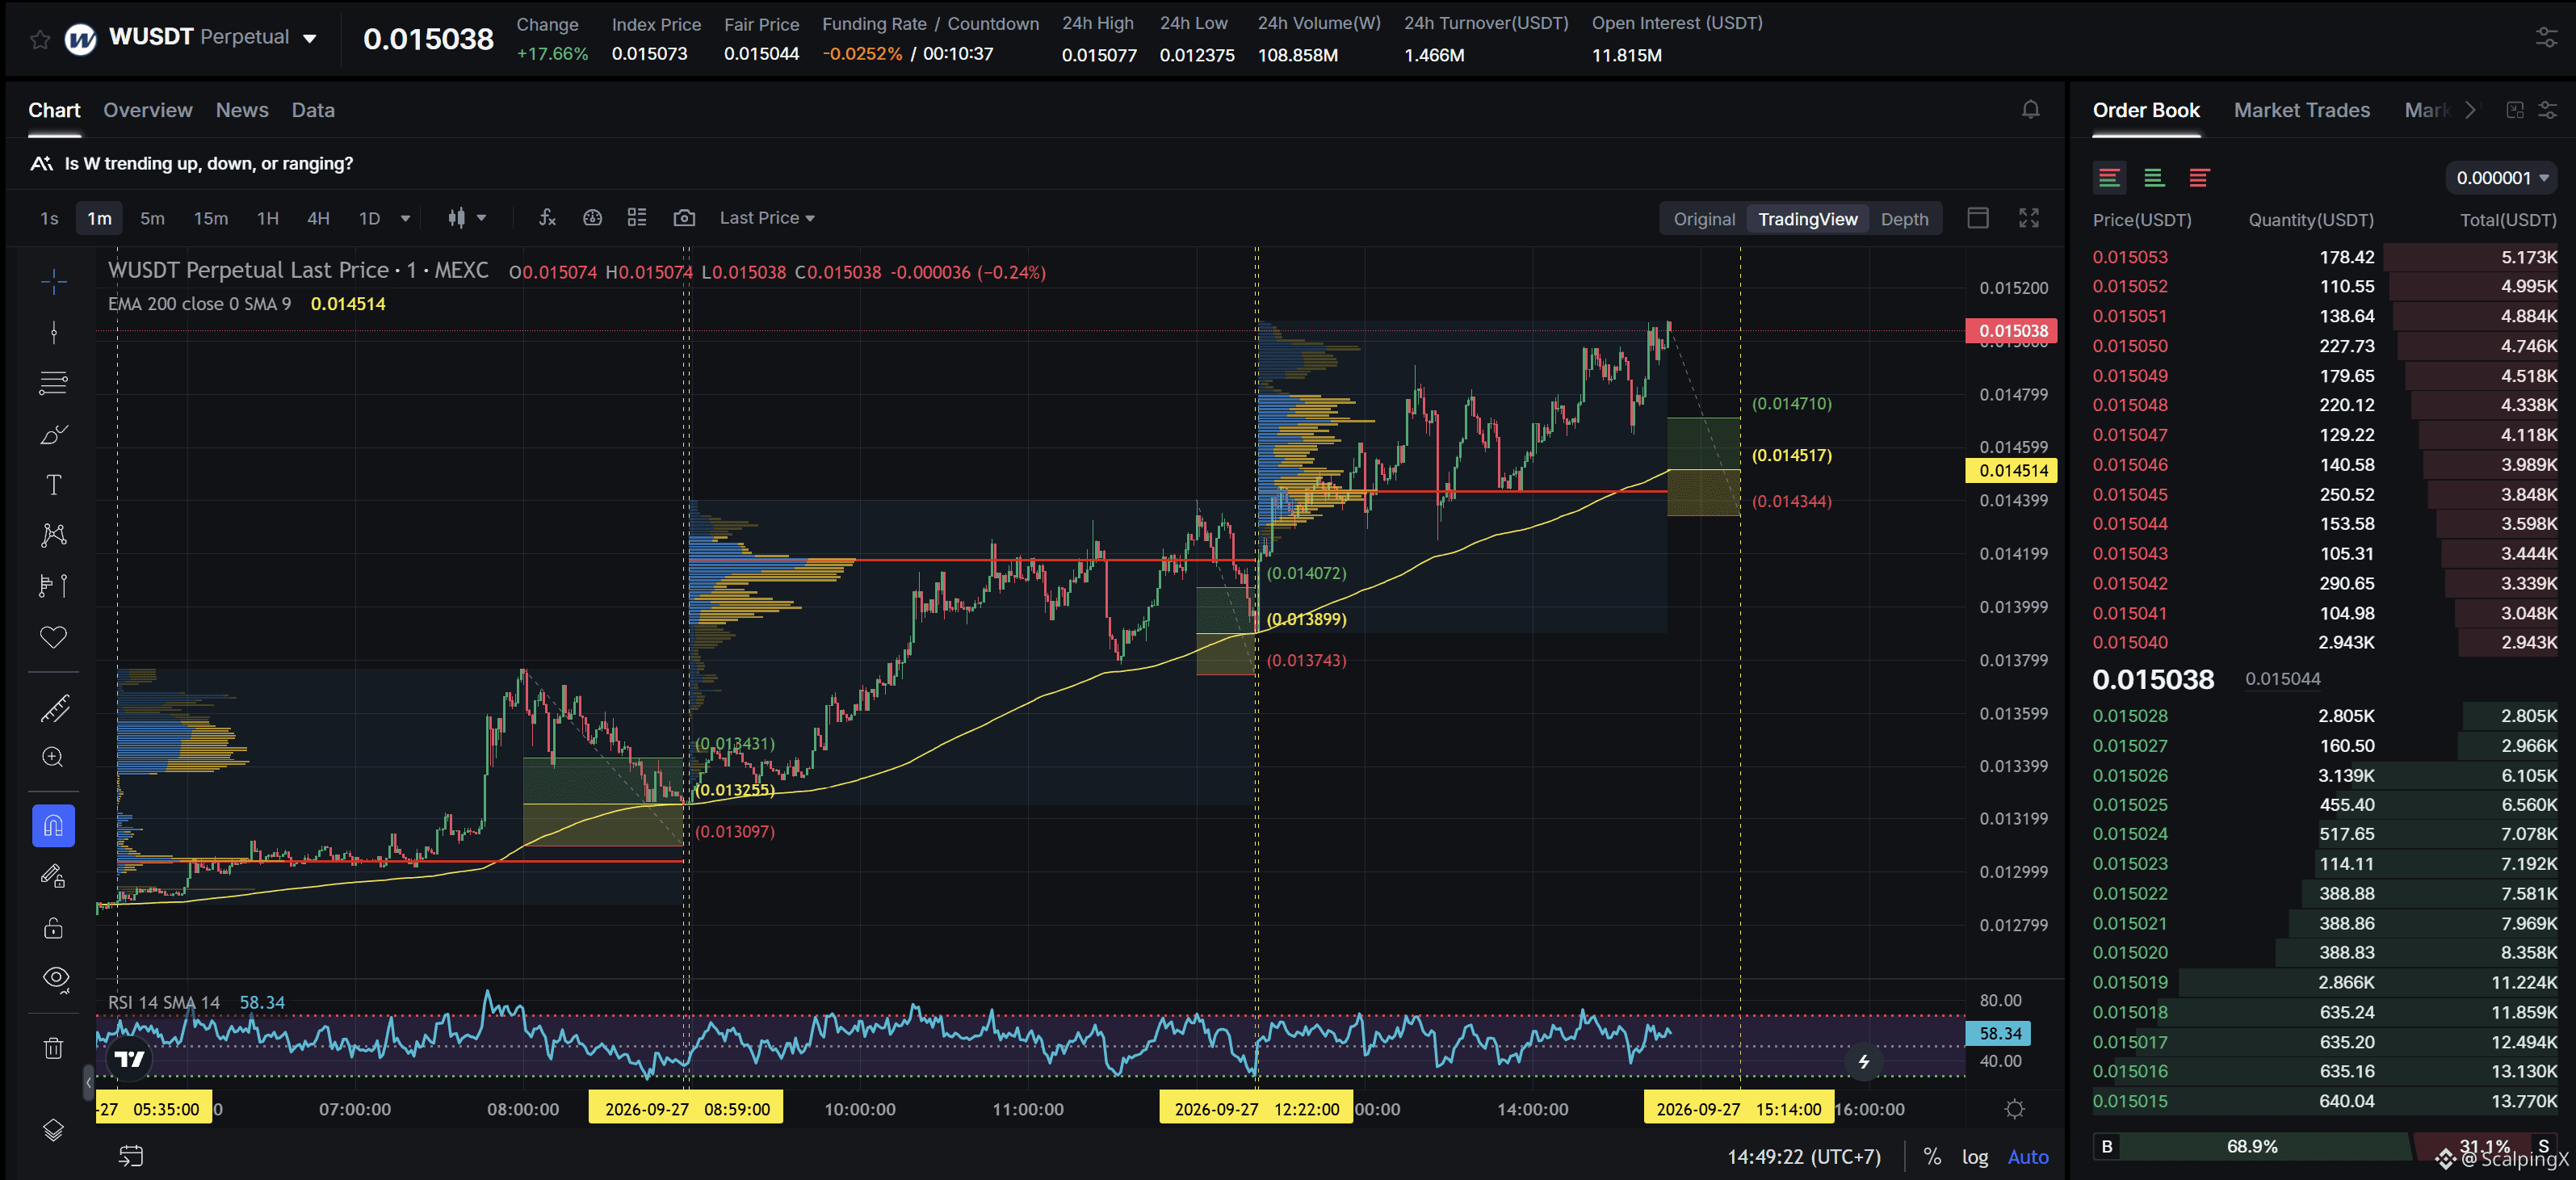
SC02 M1 - pending Long order. Entry contains POC + meets positive simplification with two consecutive previously highly profitable Long orders, the current support zone is approximately 1.20% wide. The uptrend has lasted 2 hours 31 minutes, with a maximum recorded price increase of 8.50%. If price loses this support zone, the trend is highly likely to reverse downward.
$W - Mcap 98.17M$ - 24h Sentiment +5.77 Bullish
SC02 M1 - pending Long order. Entry contains POC + meets positive simplification with two consecutive previously highly profitable Long orders, the current support zone is approximately 1.20% wide. The uptrend has lasted 2 hours 31 minutes, with a maximum recorded price increase of 8.50%. If price loses this support zone, the trend is highly likely to reverse downward.
SC02 M1 - pending Long order. Entry contains POC + meets positive simplification with two consecutive previously highly profitable Long orders, the current support zone is approximately 1.20% wide. The uptrend has lasted 2 hours 31 minutes, with a maximum recorded price increase of 8.50%. If price loses this support zone, the trend is highly likely to reverse downward.
22
·
--
Bullish
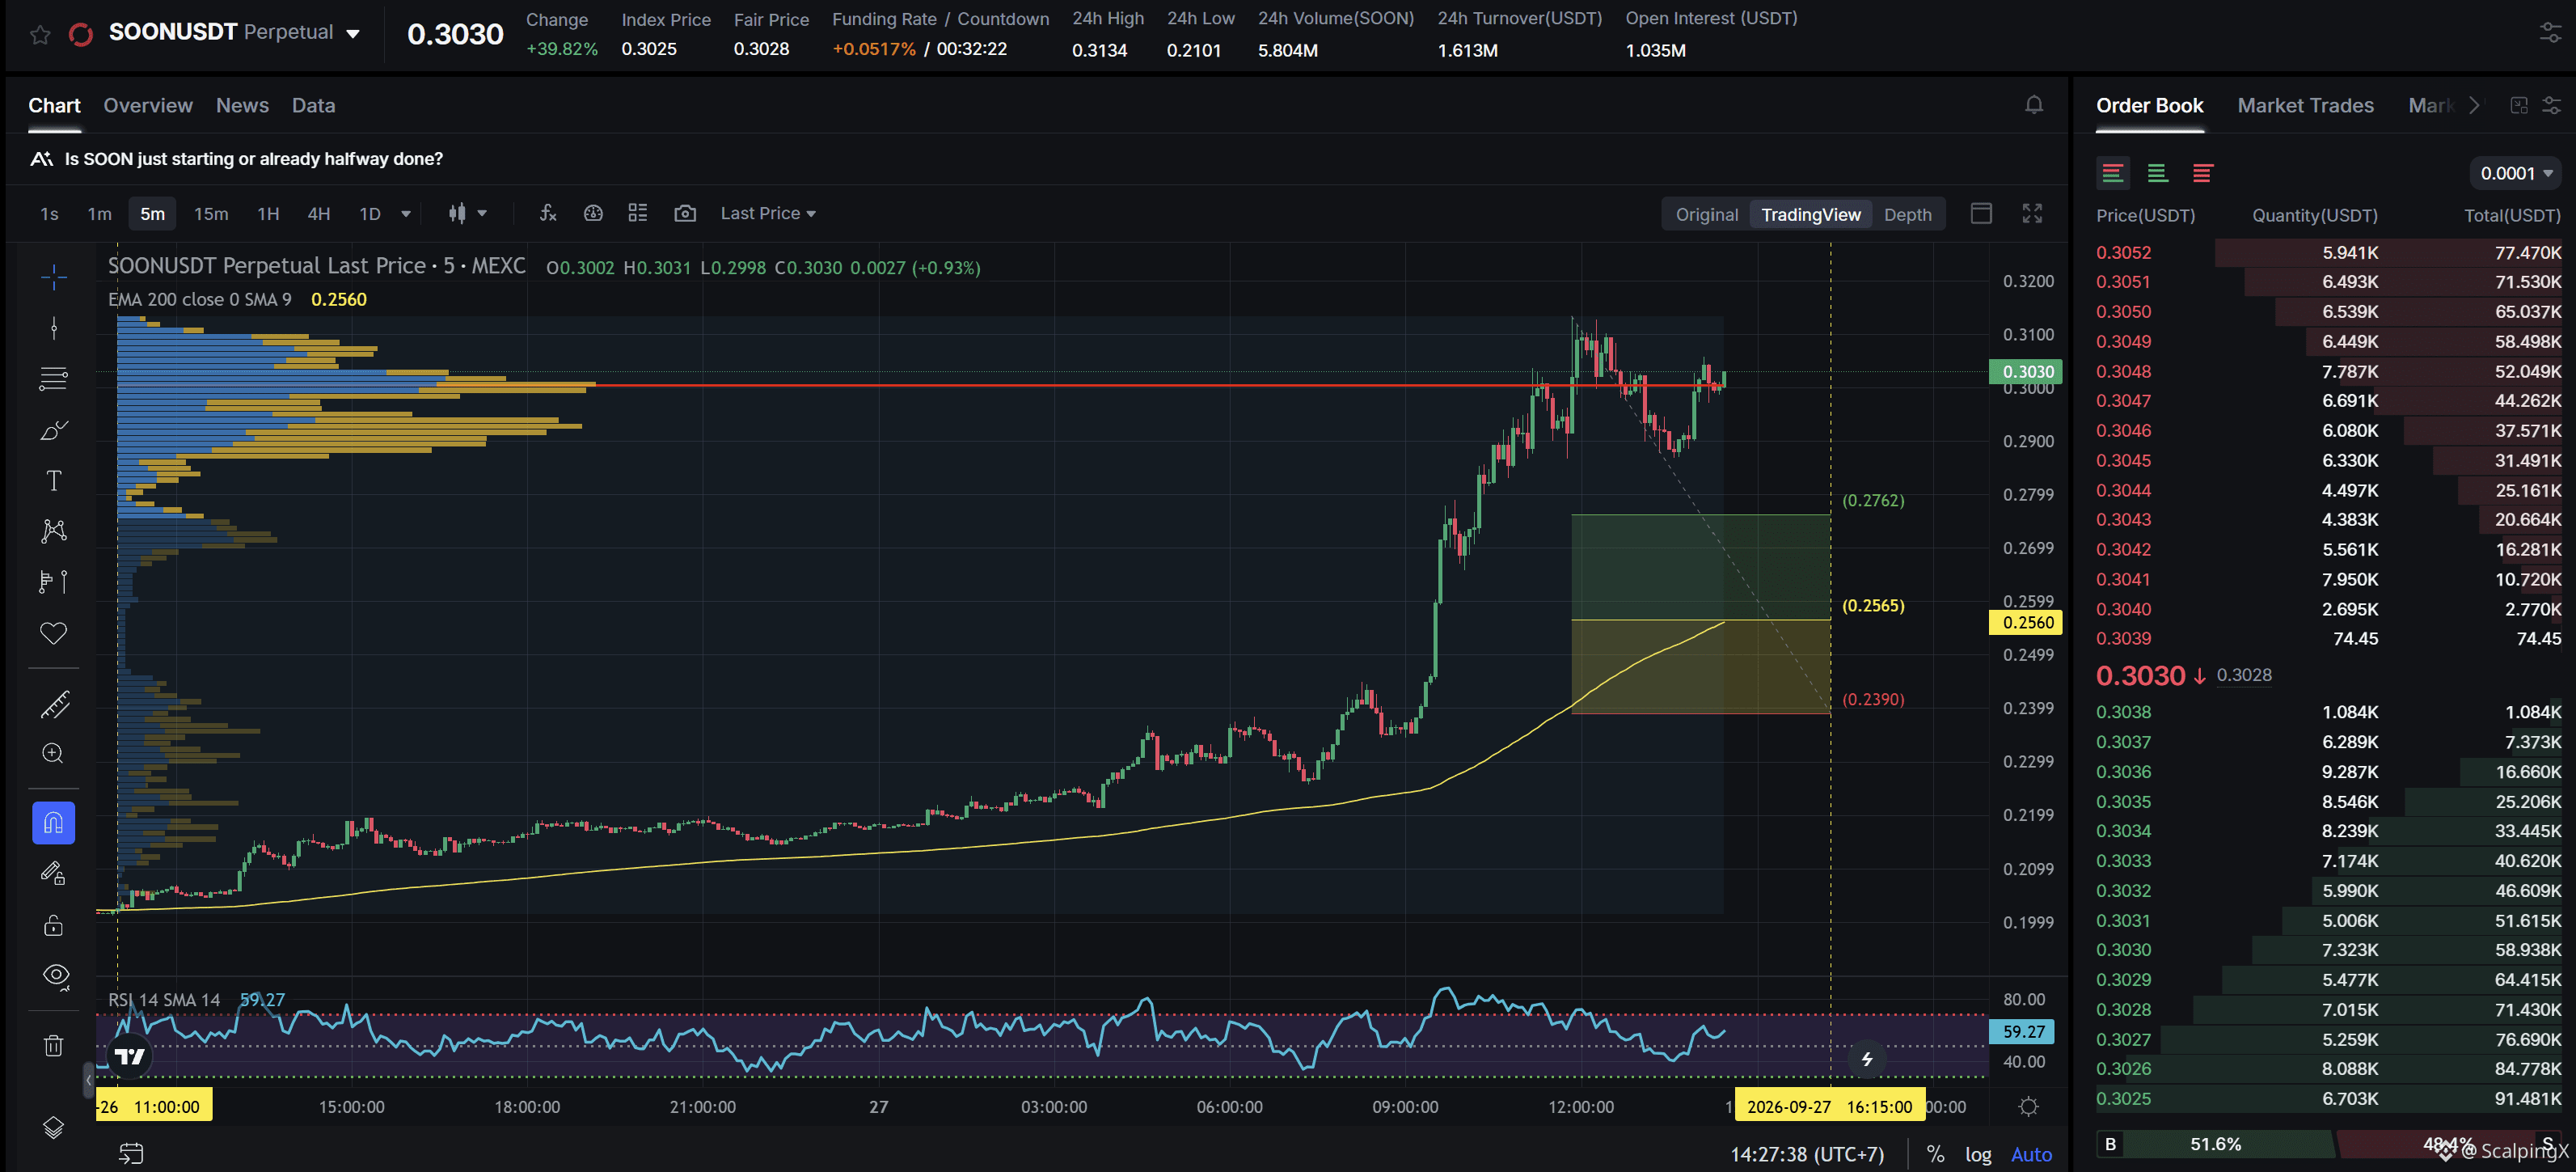
$SOON - Mcap 181.02M$ - 24h Sentiment +5.49 Bullish
SC02 M5 - pending Long order. Entry lies within LVN + not affected by any weak zone, the current support zone is approximately 6.72% wide. The uptrend has lasted 1 day 3 hours 25 minutes, with a maximum recorded price increase of 54.59%. If price loses this support zone, the trend is highly likely to reverse downward.
$SOON - Mcap 181.02M$ - 24h Sentiment +5.49 Bullish
SC02 M5 - pending Long order. Entry lies within LVN + not affected by any weak zone, the current support zone is approximately 6.72% wide. The uptrend has lasted 1 day 3 hours 25 minutes, with a maximum recorded price increase of 54.59%. If price loses this support zone, the trend is highly likely to reverse downward.
SC02 M5 - pending Long order. Entry lies within LVN + not affected by any weak zone, the current support zone is approximately 6.72% wide. The uptrend has lasted 1 day 3 hours 25 minutes, with a maximum recorded price increase of 54.59%. If price loses this support zone, the trend is highly likely to reverse downward.
12
·
--
Bullish
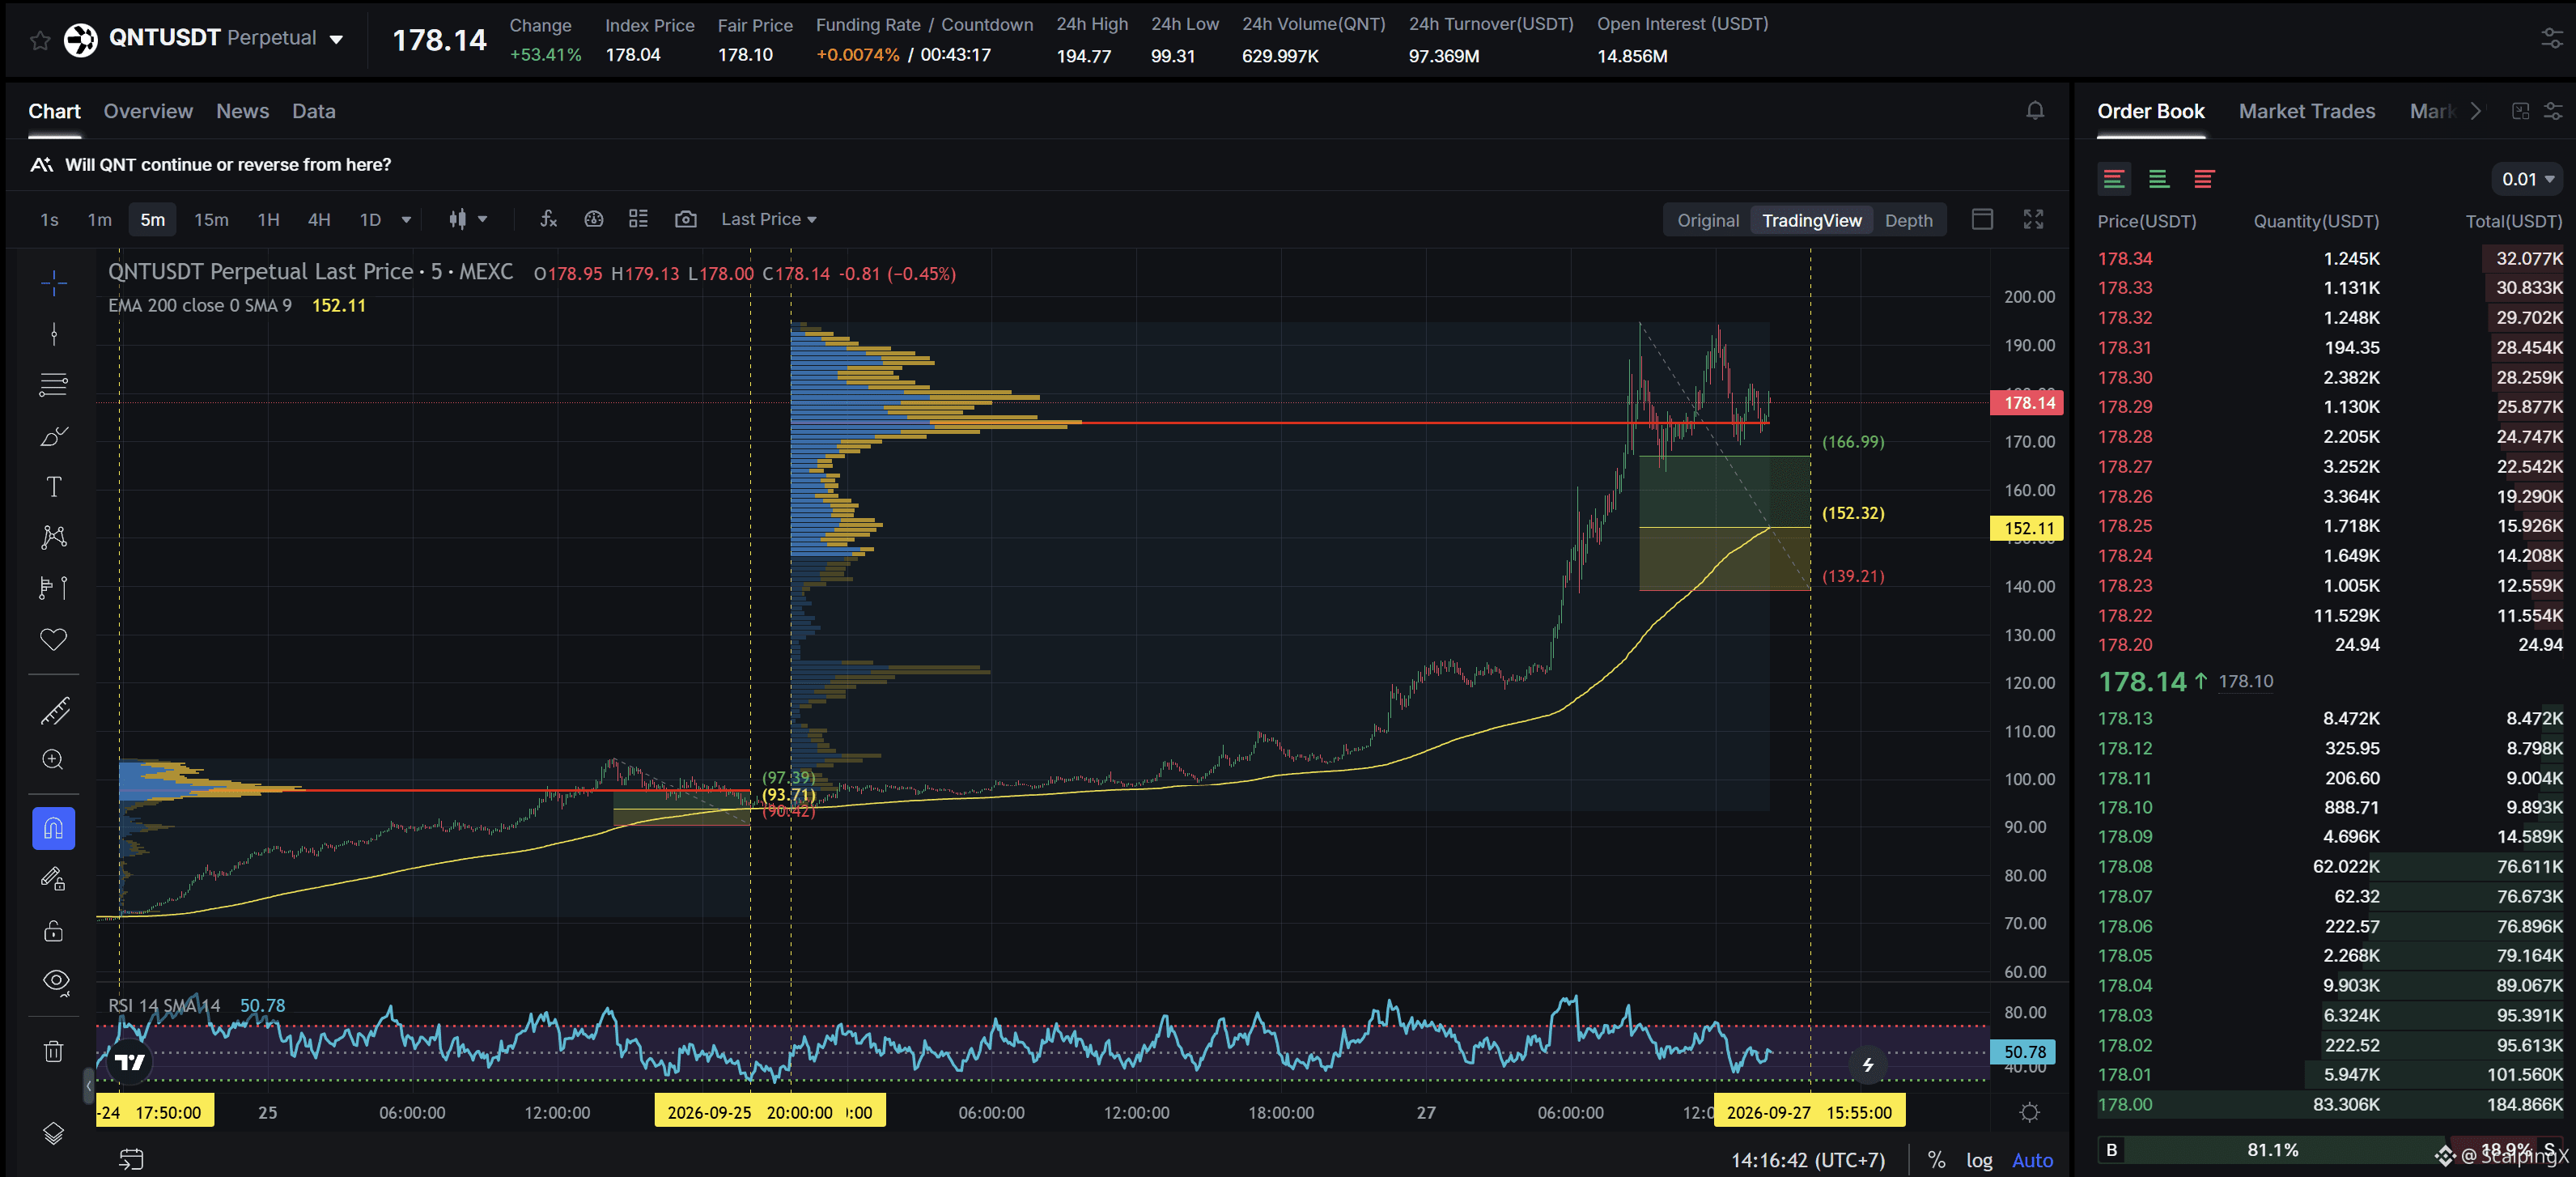
$QNT - Mcap 2.1B$ - 24h Sentiment +5.57 Bullish
SC02 M5 - pending Long order. Entry lies within HVN + meets positive simplification with a previously highly profitable Long order, the current support zone is approximately 8.46% wide. The uptrend has lasted 1 day 16 hours 40 minutes, with a maximum recorded price increase of 107.14%. If price loses this support zone, the trend is highly likely to reverse downward.
$QNT - Mcap 2.1B$ - 24h Sentiment +5.57 Bullish
SC02 M5 - pending Long order. Entry lies within HVN + meets positive simplification with a previously highly profitable Long order, the current support zone is approximately 8.46% wide. The uptrend has lasted 1 day 16 hours 40 minutes, with a maximum recorded price increase of 107.14%. If price loses this support zone, the trend is highly likely to reverse downward.
SC02 M5 - pending Long order. Entry lies within HVN + meets positive simplification with a previously highly profitable Long order, the current support zone is approximately 8.46% wide. The uptrend has lasted 1 day 16 hours 40 minutes, with a maximum recorded price increase of 107.14%. If price loses this support zone, the trend is highly likely to reverse downward.
26
·
--
Bullish
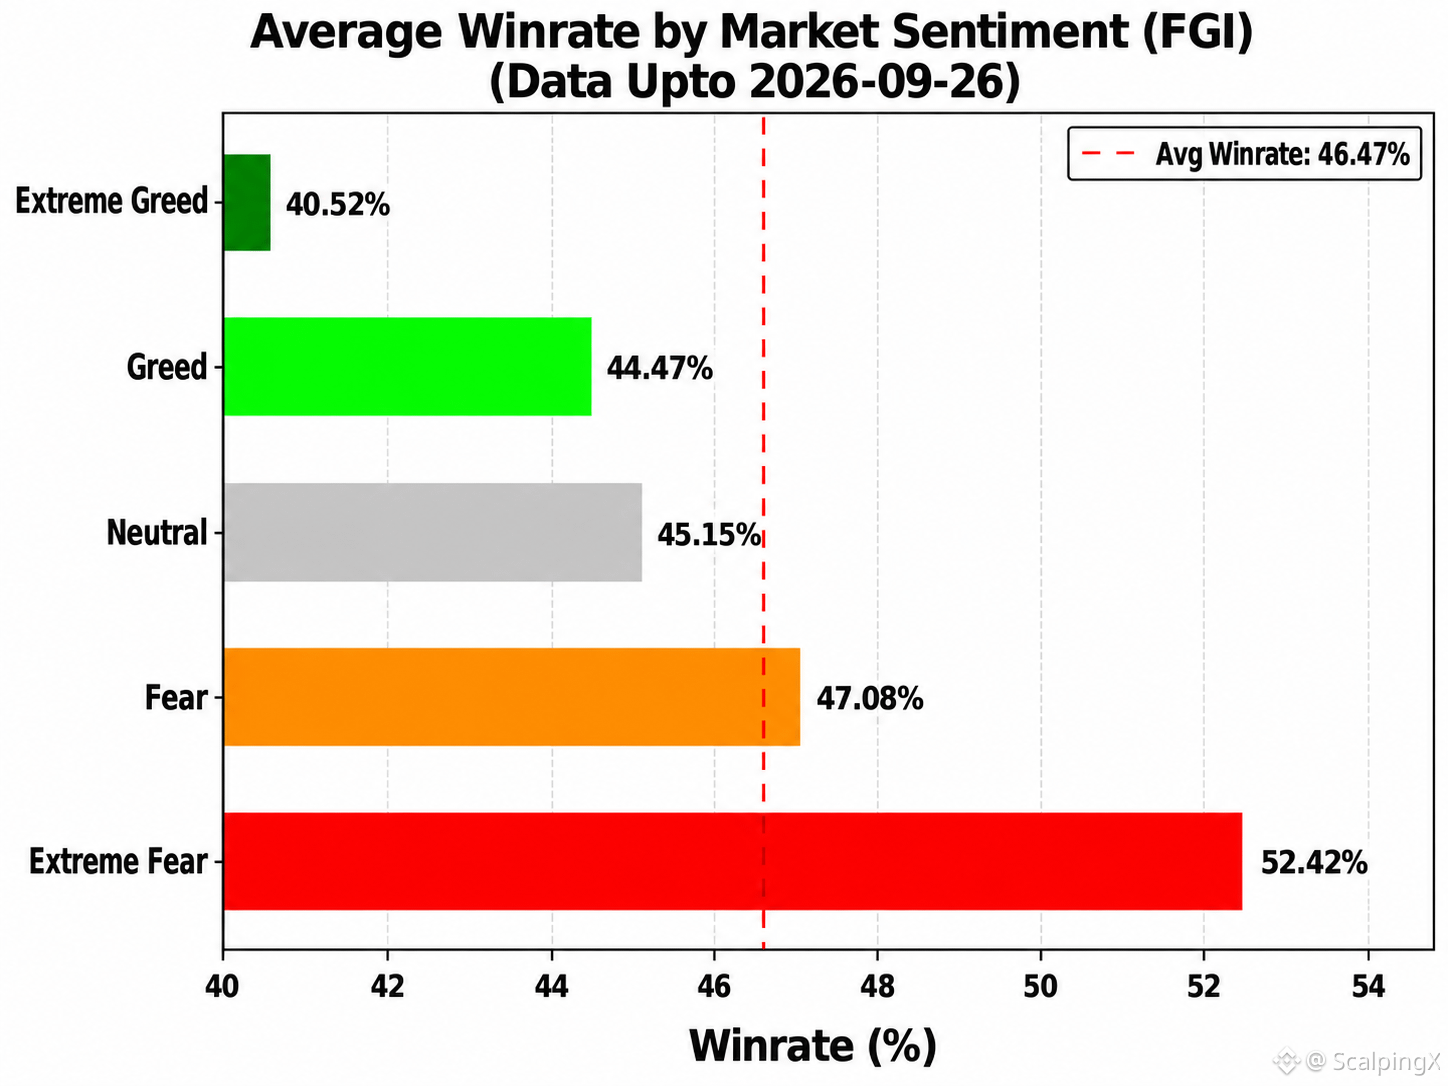
📊 TRADING PERFORMANCE & MARKET SENTIMENT INDEX (FGI) REPORT – UPDATED 26/09/2026
The latest statistics show that the correlation between FGI and Win Rate remains weak and negative, with r ≈ -0.304. This suggests that FGI is not suitable as a standalone tool for determining trade entries, but it can still be useful for quantifying risk. Trading performance generally tends to weaken as market sentiment moves toward extreme optimism, making FGI more useful as an early risk-warning indicator than as a signal to expand profit expectations.
Below is a summary of Win Rate (WR), minimum break-even R:R, and the number of recorded days (n) across each sentiment zone:
🤑 Extreme Greed (≥80): WR 40.5% • R:R=1:1.47 • n=25
😌 Greed (60–80): WR 44.5% • R:R=1:1.25 • n=248
😐 Neutral (40–60): WR 45.2% • R:R=1:1.21 • n=157
😰 Fear (20–40): WR 47.1% • R:R=1:1.12 • n=271
😱 Extreme Fear (<20): WR 52.4% • R:R=1:0.91 • n=115
Percentage of days outperforming the overall average Win Rate of 46.47% in each zone:
🤑 Extreme Greed: 8.0%
😌 Greed: 34.7%
😐 Neutral: 38.2%
😰 Fear: 55.7%
😱 Extreme Fear: 67.8%
➤ Short-term traders can use FGI as a reference for adjusting expected profit targets when entering trades:
📈 When FGI is high, higher profit targets may be needed to maintain a sufficiently favorable R:R and compensate for the lower observed Win Rate.
📉 When FGI is low, profit targets may be reduced to accelerate capital turnover and make profit realization easier.
#TradingInsights $BTC $ETH $SOL
📊 TRADING PERFORMANCE & MARKET SENTIMENT INDEX (FGI) REPORT – UPDATED 26/09/2026
The latest statistics show that the correlation between FGI and Win Rate remains weak and negative, with r ≈ -0.304. This suggests that FGI is not suitable as a standalone tool for determining trade entries, but it can still be useful for quantifying risk. Trading performance generally tends to weaken as market sentiment moves toward extreme optimism, making FGI more useful as an early risk-warning indicator than as a signal to expand profit expectations.
Below is a summary of Win Rate (WR), minimum break-even R:R, and the number of recorded days (n) across each sentiment zone:
🤑 Extreme Greed (≥80): WR 40.5% • R:R=1:1.47 • n=25
😌 Greed (60–80): WR 44.5% • R:R=1:1.25 • n=248
😐 Neutral (40–60): WR 45.2% • R:R=1:1.21 • n=157
😰 Fear (20–40): WR 47.1% • R:R=1:1.12 • n=271
😱 Extreme Fear (<20): WR 52.4% • R:R=1:0.91 • n=115
Percentage of days outperforming the overall average Win Rate of 46.47% in each zone:
🤑 Extreme Greed: 8.0%
😌 Greed: 34.7%
😐 Neutral: 38.2%
😰 Fear: 55.7%
😱 Extreme Fear: 67.8%
➤ Short-term traders can use FGI as a reference for adjusting expected profit targets when entering trades:
📈 When FGI is high, higher profit targets may be needed to maintain a sufficiently favorable R:R and compensate for the lower observed Win Rate.
📉 When FGI is low, profit targets may be reduced to accelerate capital turnover and make profit realization easier.
#TradingInsights $BTC $ETH $SOL
The latest statistics show that the correlation between FGI and Win Rate remains weak and negative, with r ≈ -0.304. This suggests that FGI is not suitable as a standalone tool for determining trade entries, but it can still be useful for quantifying risk. Trading performance generally tends to weaken as market sentiment moves toward extreme optimism, making FGI more useful as an early risk-warning indicator than as a signal to expand profit expectations.
Below is a summary of Win Rate (WR), minimum break-even R:R, and the number of recorded days (n) across each sentiment zone:
🤑 Extreme Greed (≥80): WR 40.5% • R:R=1:1.47 • n=25
😌 Greed (60–80): WR 44.5% • R:R=1:1.25 • n=248
😐 Neutral (40–60): WR 45.2% • R:R=1:1.21 • n=157
😰 Fear (20–40): WR 47.1% • R:R=1:1.12 • n=271
😱 Extreme Fear (<20): WR 52.4% • R:R=1:0.91 • n=115
Percentage of days outperforming the overall average Win Rate of 46.47% in each zone:
🤑 Extreme Greed: 8.0%
😌 Greed: 34.7%
😐 Neutral: 38.2%
😰 Fear: 55.7%
😱 Extreme Fear: 67.8%
➤ Short-term traders can use FGI as a reference for adjusting expected profit targets when entering trades:
📈 When FGI is high, higher profit targets may be needed to maintain a sufficiently favorable R:R and compensate for the lower observed Win Rate.
📉 When FGI is low, profit targets may be reduced to accelerate capital turnover and make profit realization easier.
#TradingInsights $BTC $ETH $SOL
96
·
--
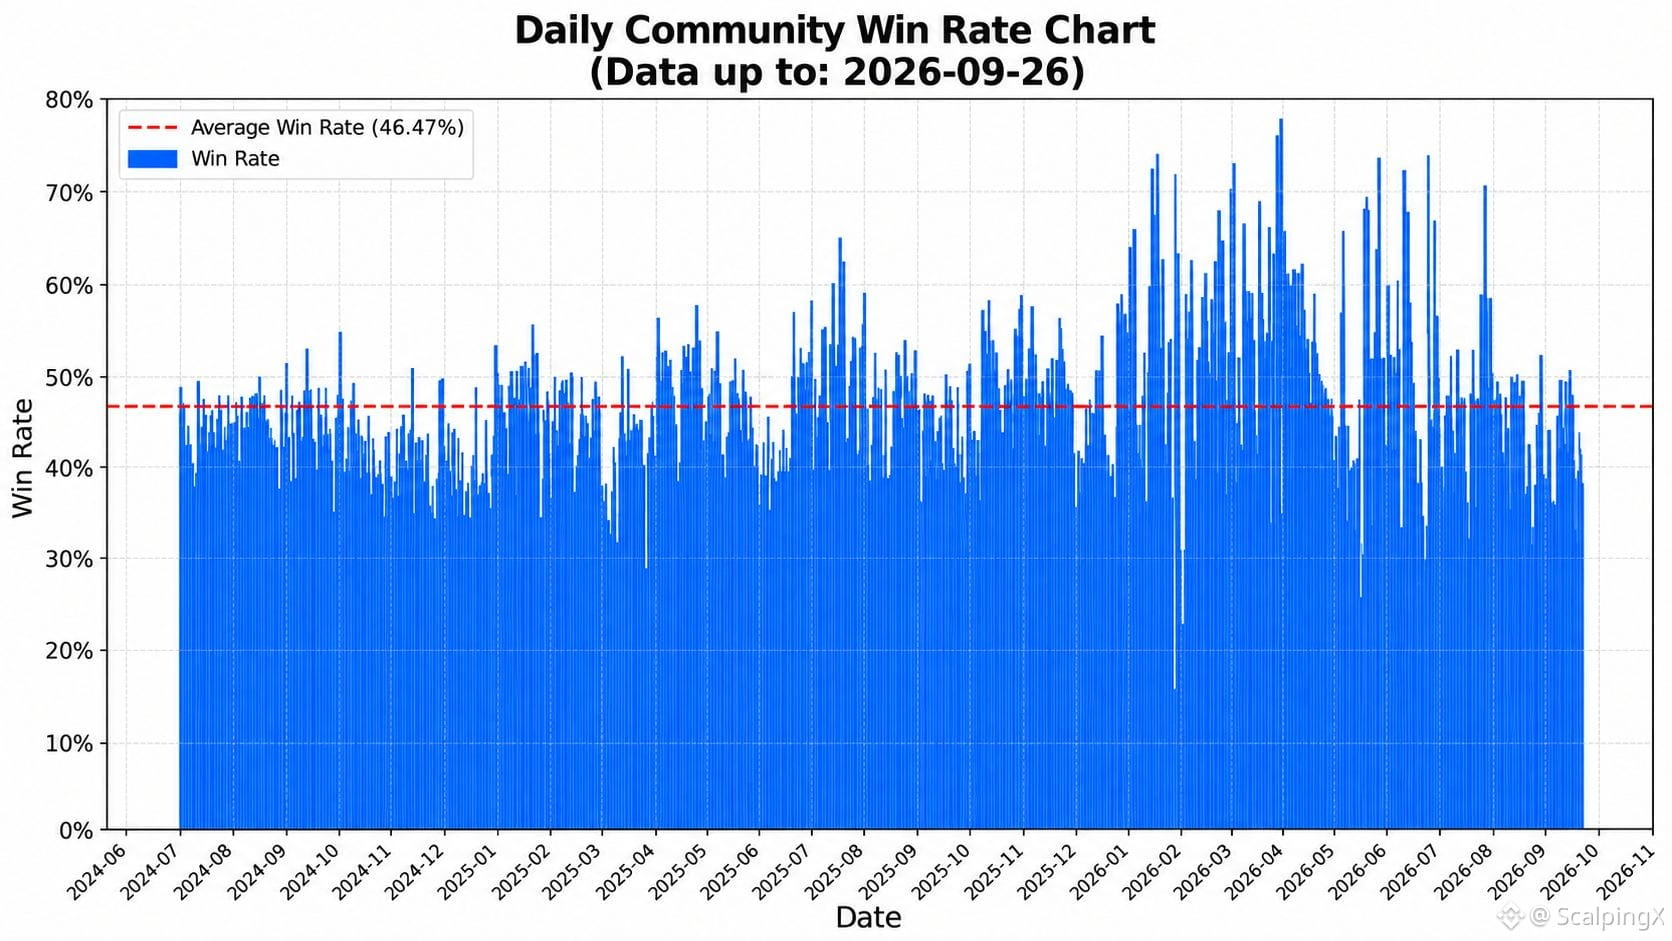
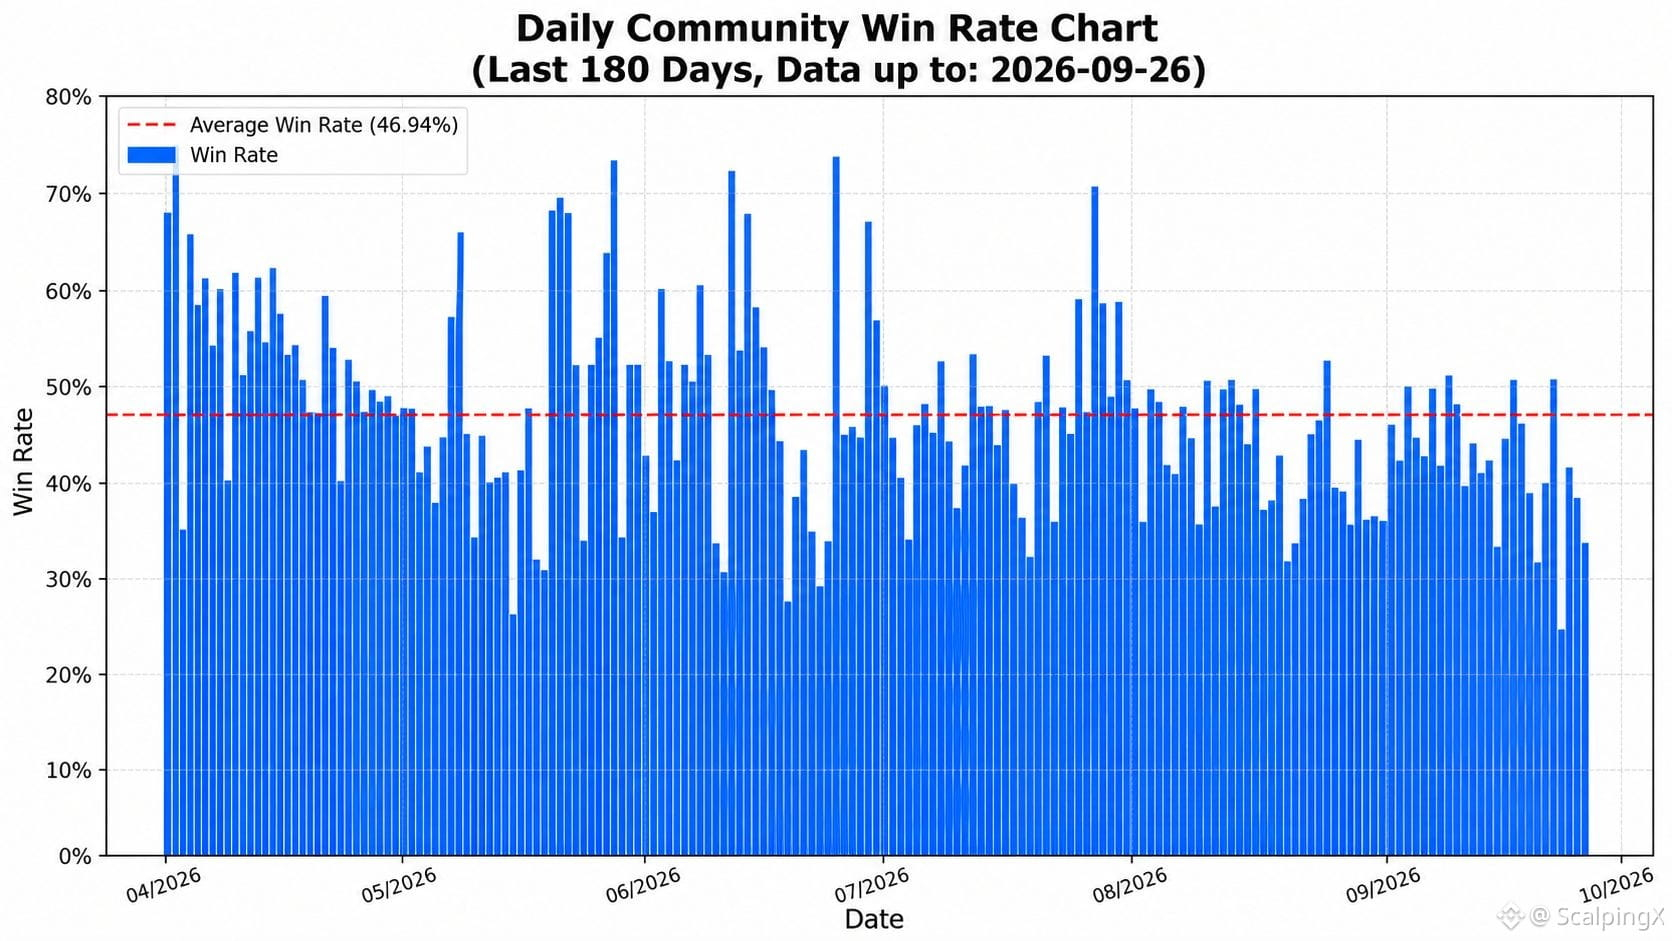
Updated 2026-09-26, community-wide trading
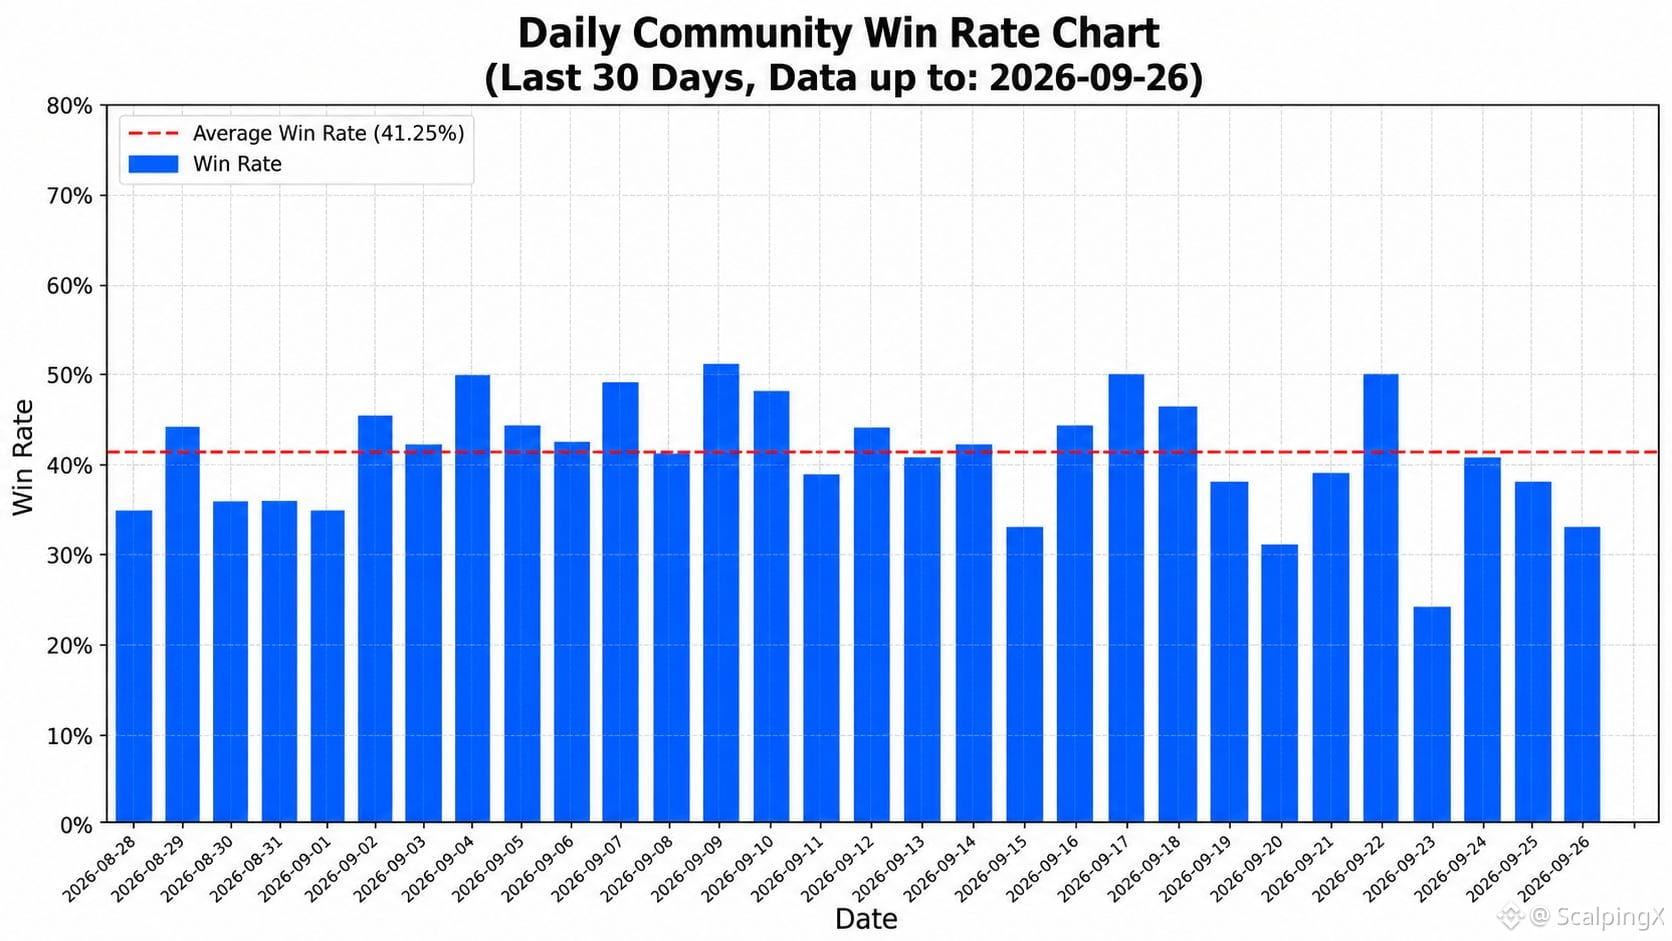
📊 The average win rate is 46.47%
🏆 The highest daily win rate was 78.08% on 2026-04-01. The lowest was 15.69% on 2026-01-25
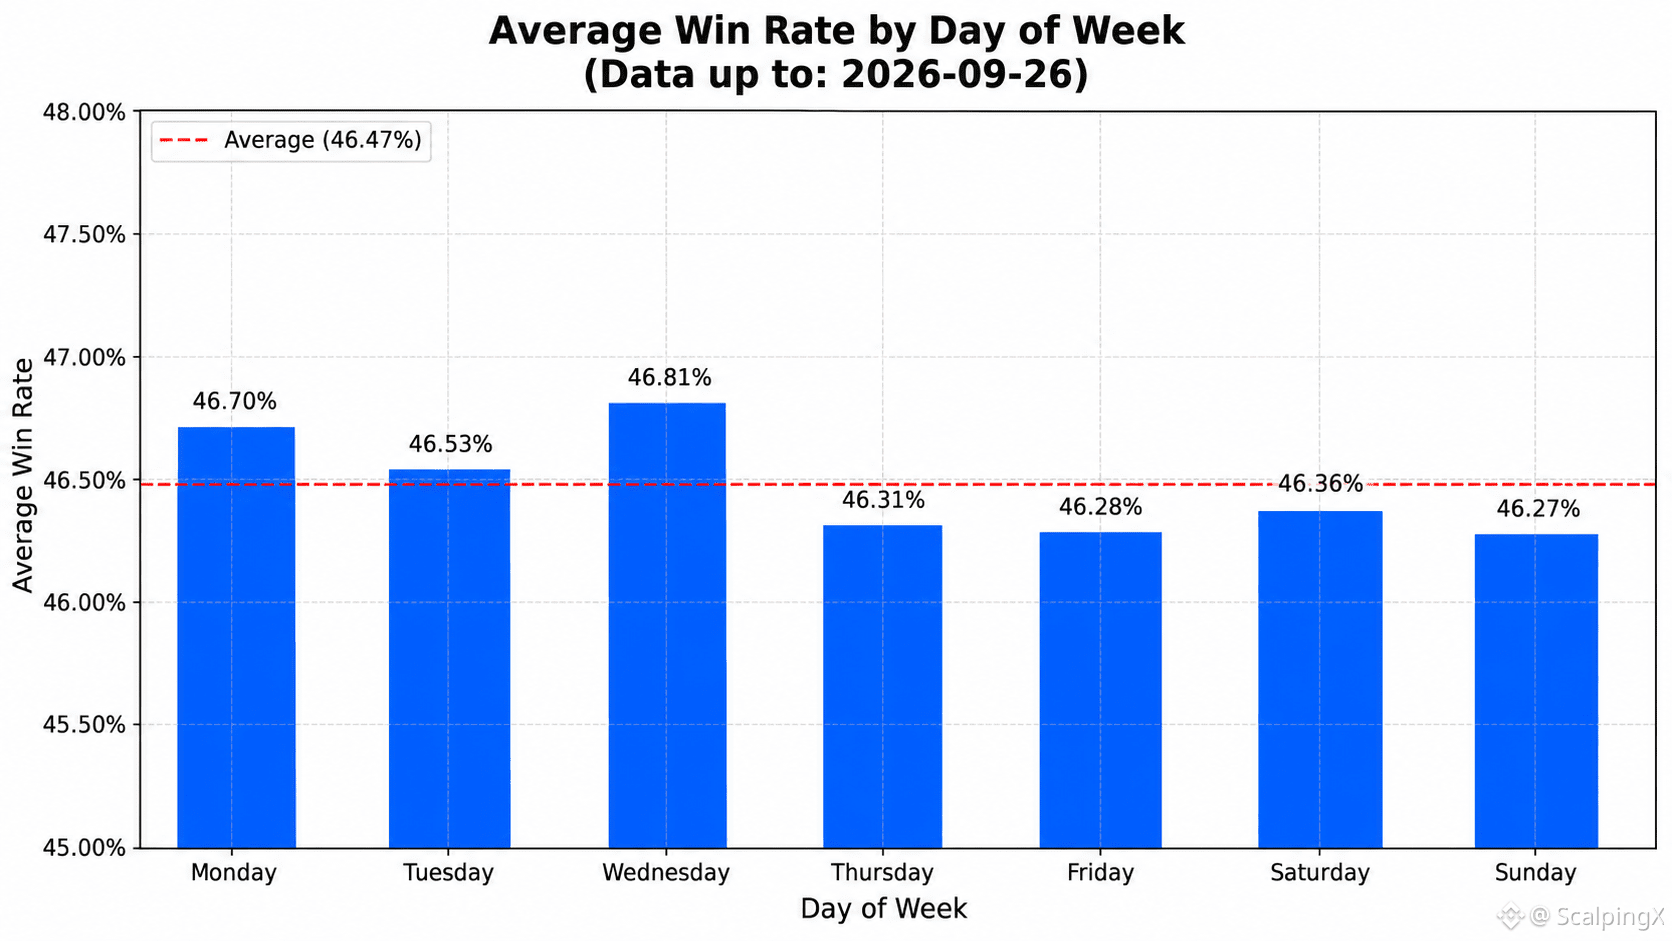
📅 Wednesday has the highest average win rate at 46.81%. Sunday has the lowest average win rate at 46.27%
⏱️ The highest 7-day average win rate was 63.27% for the period ending 2026-04-05. The lowest was 35.60% for the period ending 2026-06-24
⚖️ There were 377 days with a win rate above the overall average and 439 days with a win rate at or below the average
📈 There were 224 days with a win rate above 50%, 436 days between 40% and 50%, and 156 days below 40%
#TradingStats $GRAM
Updated 2026-09-26, community-wide trading
📊 The average win rate is 46.47%
🏆 The highest daily win rate was 78.08% on 2026-04-01. The lowest was 15.69% on 2026-01-25
📅 Wednesday has the highest average win rate at 46.81%. Sunday has the lowest average win rate at 46.27%
⏱️ The highest 7-day average win rate was 63.27% for the period ending 2026-04-05. The lowest was 35.60% for the period ending 2026-06-24
⚖️ There were 377 days with a win rate above the overall average and 439 days with a win rate at or below the average
📈 There were 224 days with a win rate above 50%, 436 days between 40% and 50%, and 156 days below 40%
#TradingStats $GRAM
📊 The average win rate is 46.47%
🏆 The highest daily win rate was 78.08% on 2026-04-01. The lowest was 15.69% on 2026-01-25
📅 Wednesday has the highest average win rate at 46.81%. Sunday has the lowest average win rate at 46.27%
⏱️ The highest 7-day average win rate was 63.27% for the period ending 2026-04-05. The lowest was 35.60% for the period ending 2026-06-24
⚖️ There were 377 days with a win rate above the overall average and 439 days with a win rate at or below the average
📈 There were 224 days with a win rate above 50%, 436 days between 40% and 50%, and 156 days below 40%
#TradingStats $GRAM
123
·
--
Bullish
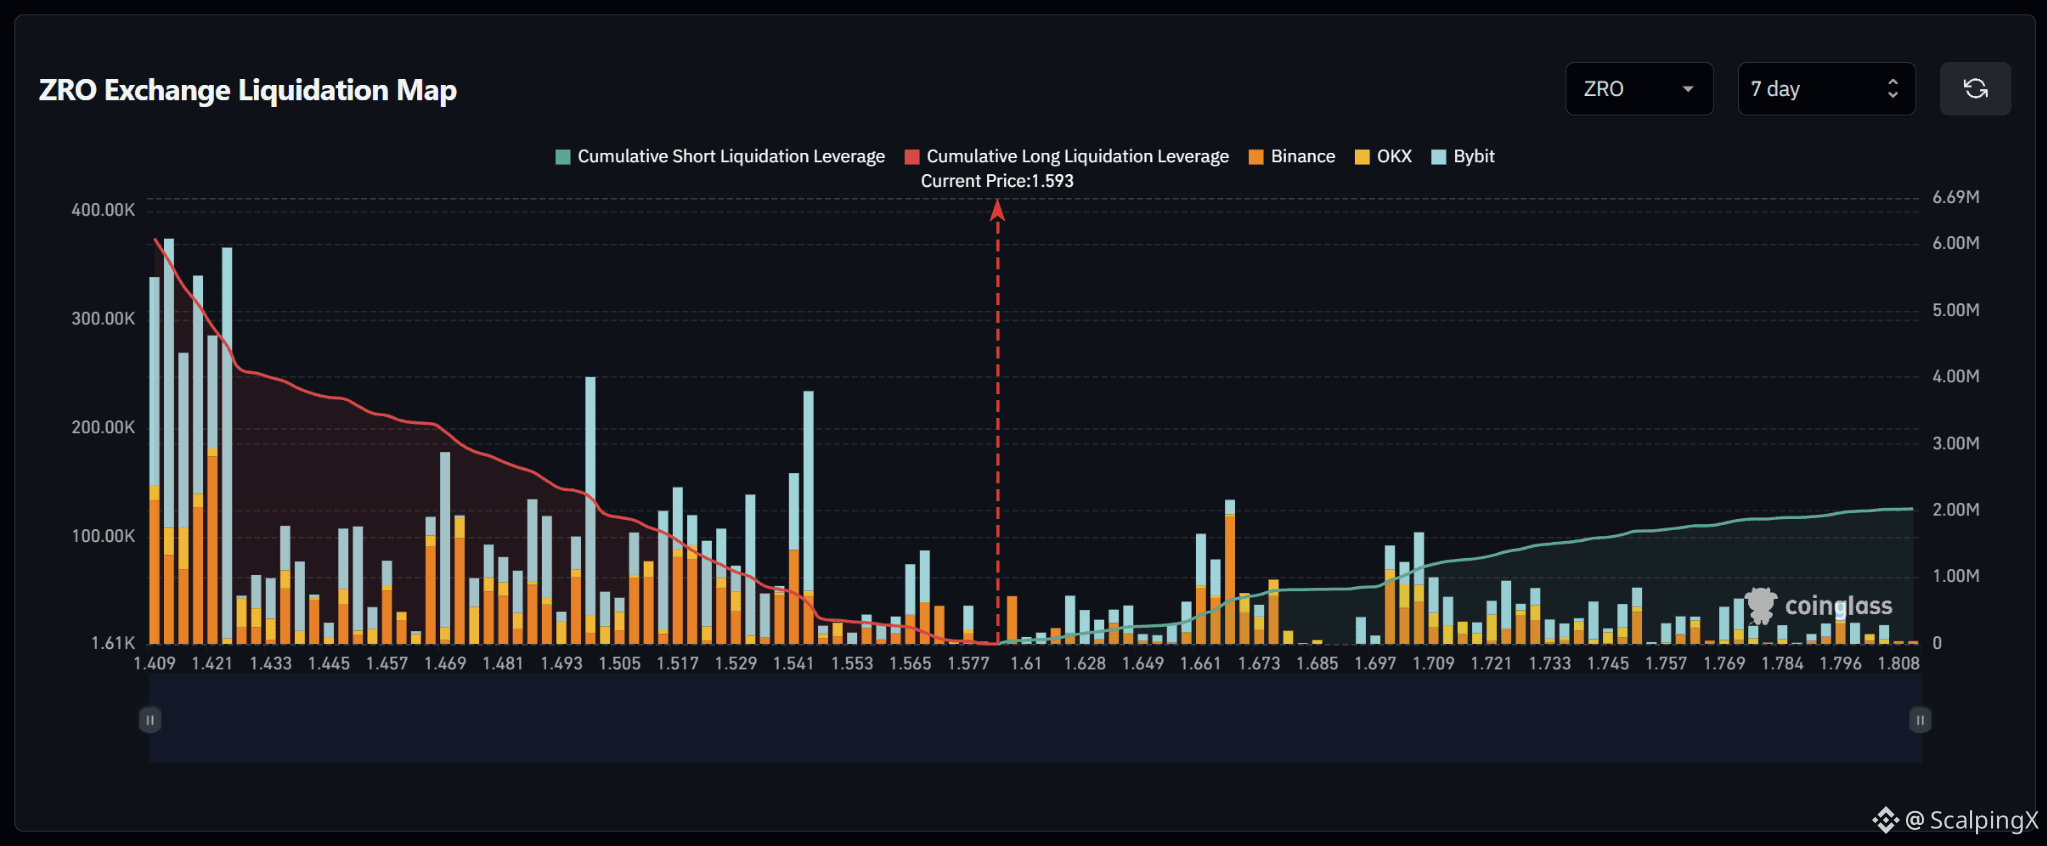
$ZRO – Liquidation Map (7 Days) – Current Price 1.593
🔎 The 7-day liquidation map shows roughly 6 million USD in long liquidations below the current price, significantly exceeding approximately 2 million USD in short liquidations above. The liquidity structure therefore clearly tilts to the downside, with around three times more cumulative liquidity below the market.
📉 Below the market, long-liquidation liquidity is broadly distributed across 1.41–1.55. The strongest cluster sits around 1.409–1.423 with several bars near 0.27–0.38 million USD, while 1.493–1.505 and 1.535–1.543 also contain notable bars around 0.23–0.25 million USD. Losing 1.577 would shift attention toward 1.565–1.541 and then 1.517–1.493.
📈 Above the market, short-liquidation liquidity is generally thinner. The nearest notable cluster sits around 1.658–1.667 with a bar near 0.13 million USD, while 1.697–1.709 contains several bars around 0.09–0.10 million USD. Beyond 1.72, liquidity becomes increasingly dispersed.
🧭 The broader setup favors the downside because long-liquidation exposure below clearly dominates. Losing 1.577 would increase the probability of a sweep toward 1.565–1.541, followed by 1.517–1.493. Breaking above 1.61 would instead expose 1.658–1.667 and then 1.697–1.709.
$ZRO – Liquidation Map (7 Days) – Current Price 1.593
🔎 The 7-day liquidation map shows roughly 6 million USD in long liquidations below the current price, significantly exceeding approximately 2 million USD in short liquidations above. The liquidity structure therefore clearly tilts to the downside, with around three times more cumulative liquidity below the market.
📉 Below the market, long-liquidation liquidity is broadly distributed across 1.41–1.55. The strongest cluster sits around 1.409–1.423 with several bars near 0.27–0.38 million USD, while 1.493–1.505 and 1.535–1.543 also contain notable bars around 0.23–0.25 million USD. Losing 1.577 would shift attention toward 1.565–1.541 and then 1.517–1.493.
📈 Above the market, short-liquidation liquidity is generally thinner. The nearest notable cluster sits around 1.658–1.667 with a bar near 0.13 million USD, while 1.697–1.709 contains several bars around 0.09–0.10 million USD. Beyond 1.72, liquidity becomes increasingly dispersed.
🧭 The broader setup favors the downside because long-liquidation exposure below clearly dominates. Losing 1.577 would increase the probability of a sweep toward 1.565–1.541, followed by 1.517–1.493. Breaking above 1.61 would instead expose 1.658–1.667 and then 1.697–1.709.
🔎 The 7-day liquidation map shows roughly 6 million USD in long liquidations below the current price, significantly exceeding approximately 2 million USD in short liquidations above. The liquidity structure therefore clearly tilts to the downside, with around three times more cumulative liquidity below the market.
📉 Below the market, long-liquidation liquidity is broadly distributed across 1.41–1.55. The strongest cluster sits around 1.409–1.423 with several bars near 0.27–0.38 million USD, while 1.493–1.505 and 1.535–1.543 also contain notable bars around 0.23–0.25 million USD. Losing 1.577 would shift attention toward 1.565–1.541 and then 1.517–1.493.
📈 Above the market, short-liquidation liquidity is generally thinner. The nearest notable cluster sits around 1.658–1.667 with a bar near 0.13 million USD, while 1.697–1.709 contains several bars around 0.09–0.10 million USD. Beyond 1.72, liquidity becomes increasingly dispersed.
🧭 The broader setup favors the downside because long-liquidation exposure below clearly dominates. Losing 1.577 would increase the probability of a sweep toward 1.565–1.541, followed by 1.517–1.493. Breaking above 1.61 would instead expose 1.658–1.667 and then 1.697–1.709.
61
·
--
Bullish
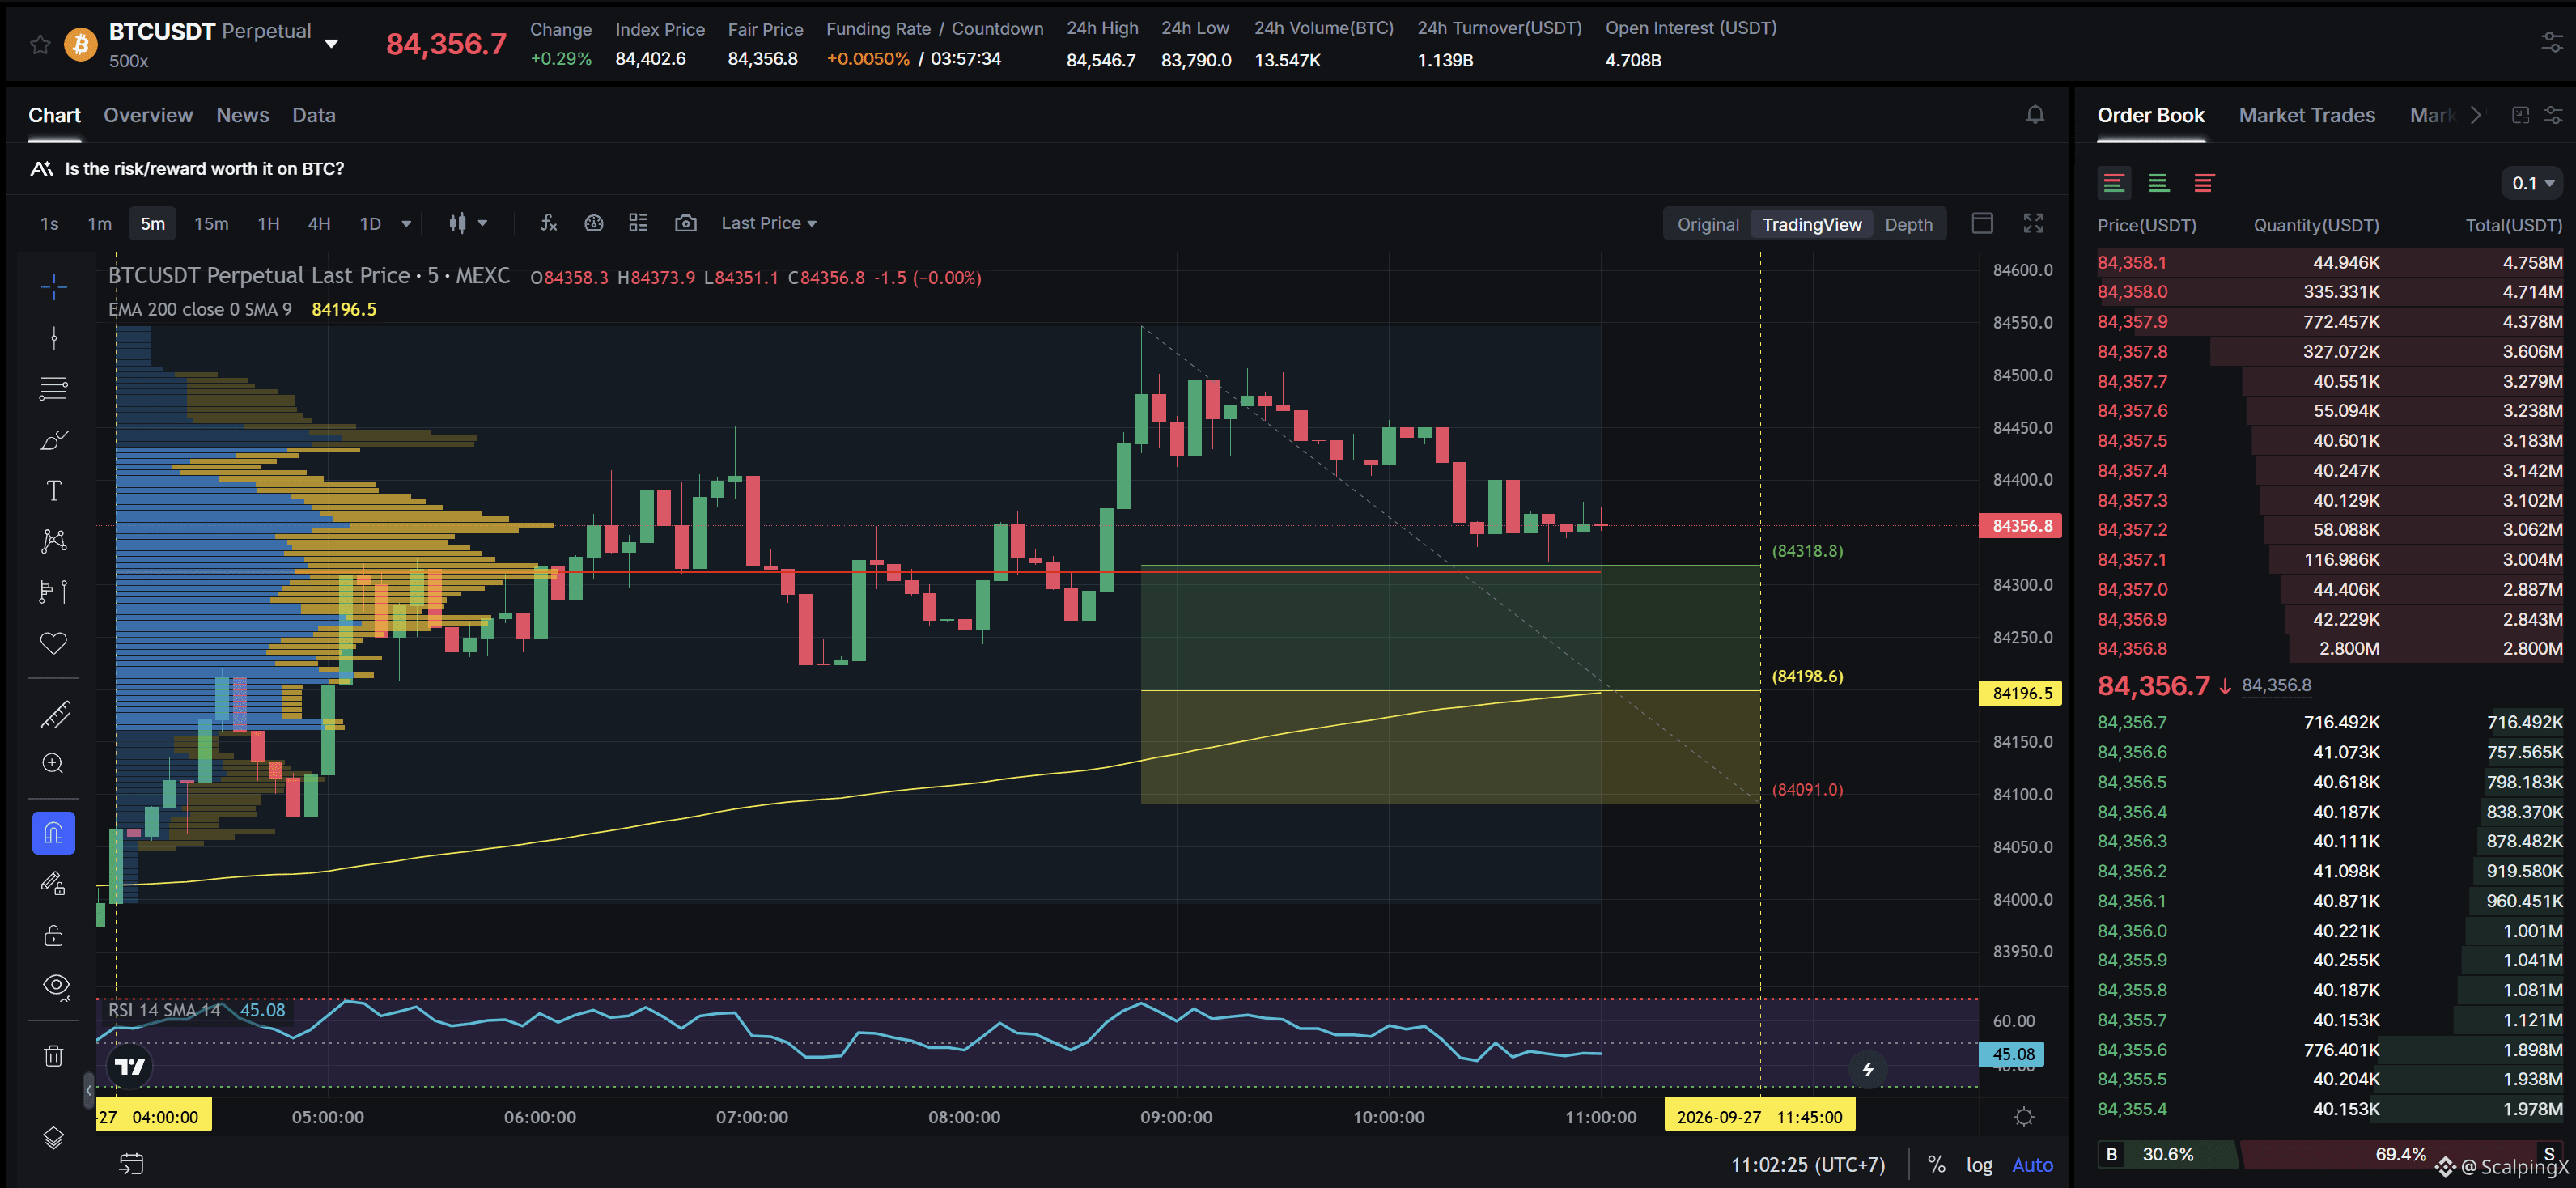
$BTC - Mcap 1.69T$ - 24h Sentiment +2.97 Bullish
SC02 M5 - pending Long order. Entry lies within LVN + not affected by any weak zone, the current support zone is approximately 0.13% wide. The uptrend has lasted 7 hours, with a maximum recorded price increase of 0.64%. If price loses this support zone, the trend is highly likely to reverse downward.
$BTC - Mcap 1.69T$ - 24h Sentiment +2.97 Bullish
SC02 M5 - pending Long order. Entry lies within LVN + not affected by any weak zone, the current support zone is approximately 0.13% wide. The uptrend has lasted 7 hours, with a maximum recorded price increase of 0.64%. If price loses this support zone, the trend is highly likely to reverse downward.
SC02 M5 - pending Long order. Entry lies within LVN + not affected by any weak zone, the current support zone is approximately 0.13% wide. The uptrend has lasted 7 hours, with a maximum recorded price increase of 0.64%. If price loses this support zone, the trend is highly likely to reverse downward.
56
·
--
Bullish
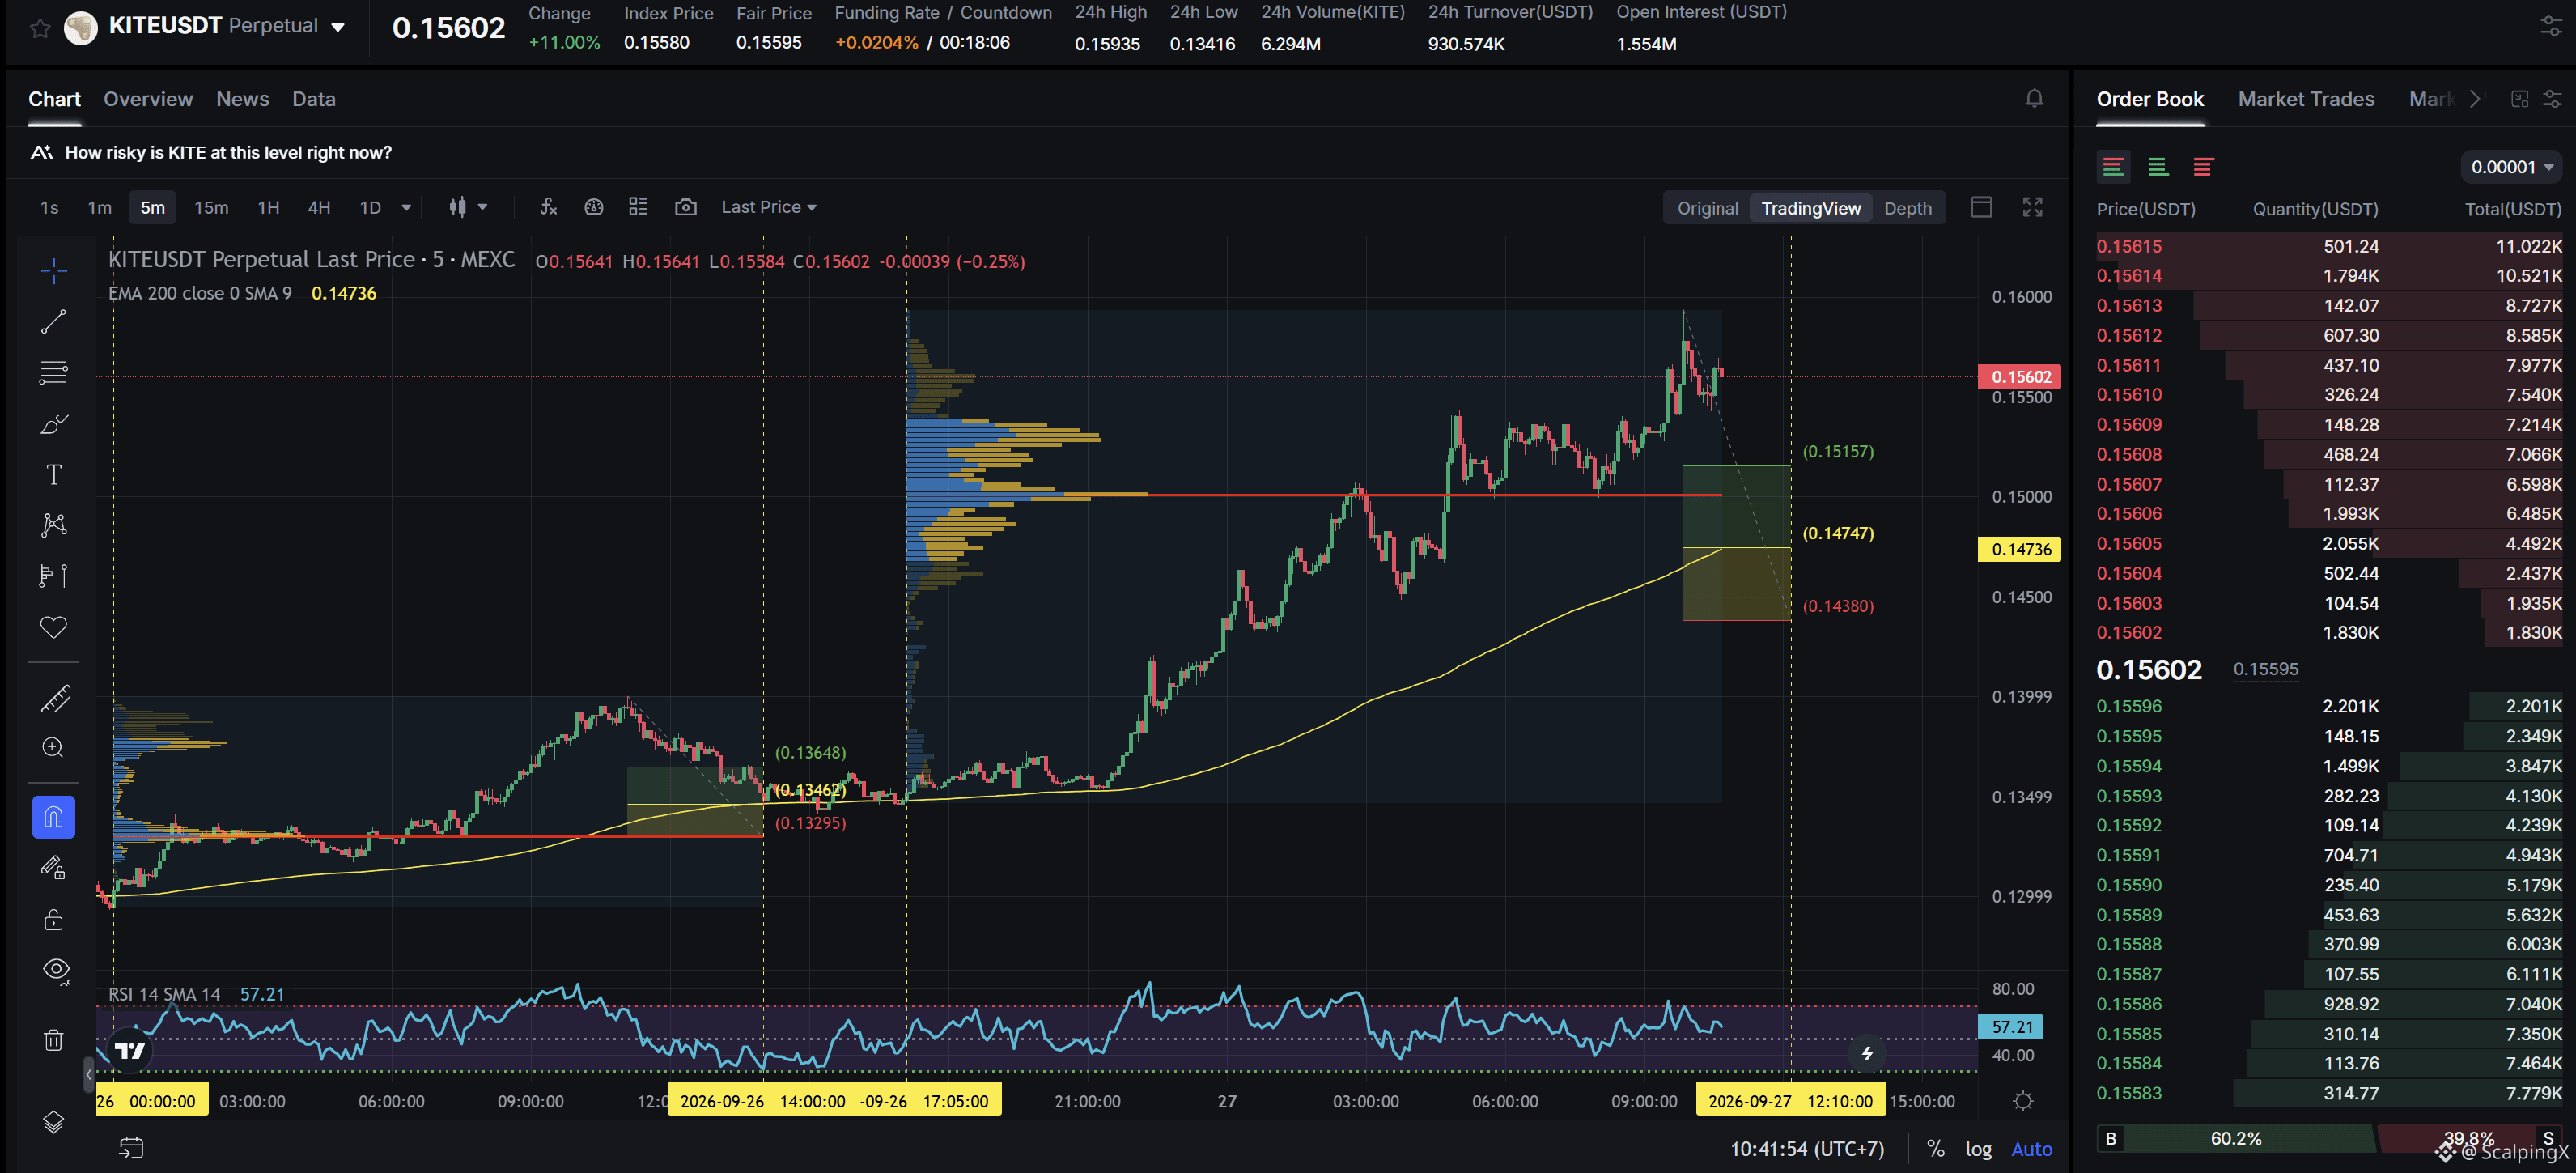
$KITE - Mcap 391.58M$ - 24h Sentiment +5.55 Bullish
SC02 M5 - pending Long order. Entry lies within LVN + meets positive simplification with a previously highly profitable Long order, the current support zone is approximately 2.50% wide. The uptrend has lasted 17 hours 35 minutes, with a maximum recorded price increase of 18.09%. If price loses this support zone, the trend is highly likely to reverse downward.
$KITE - Mcap 391.58M$ - 24h Sentiment +5.55 Bullish
SC02 M5 - pending Long order. Entry lies within LVN + meets positive simplification with a previously highly profitable Long order, the current support zone is approximately 2.50% wide. The uptrend has lasted 17 hours 35 minutes, with a maximum recorded price increase of 18.09%. If price loses this support zone, the trend is highly likely to reverse downward.
SC02 M5 - pending Long order. Entry lies within LVN + meets positive simplification with a previously highly profitable Long order, the current support zone is approximately 2.50% wide. The uptrend has lasted 17 hours 35 minutes, with a maximum recorded price increase of 18.09%. If price loses this support zone, the trend is highly likely to reverse downward.
78
·
--
Bearish
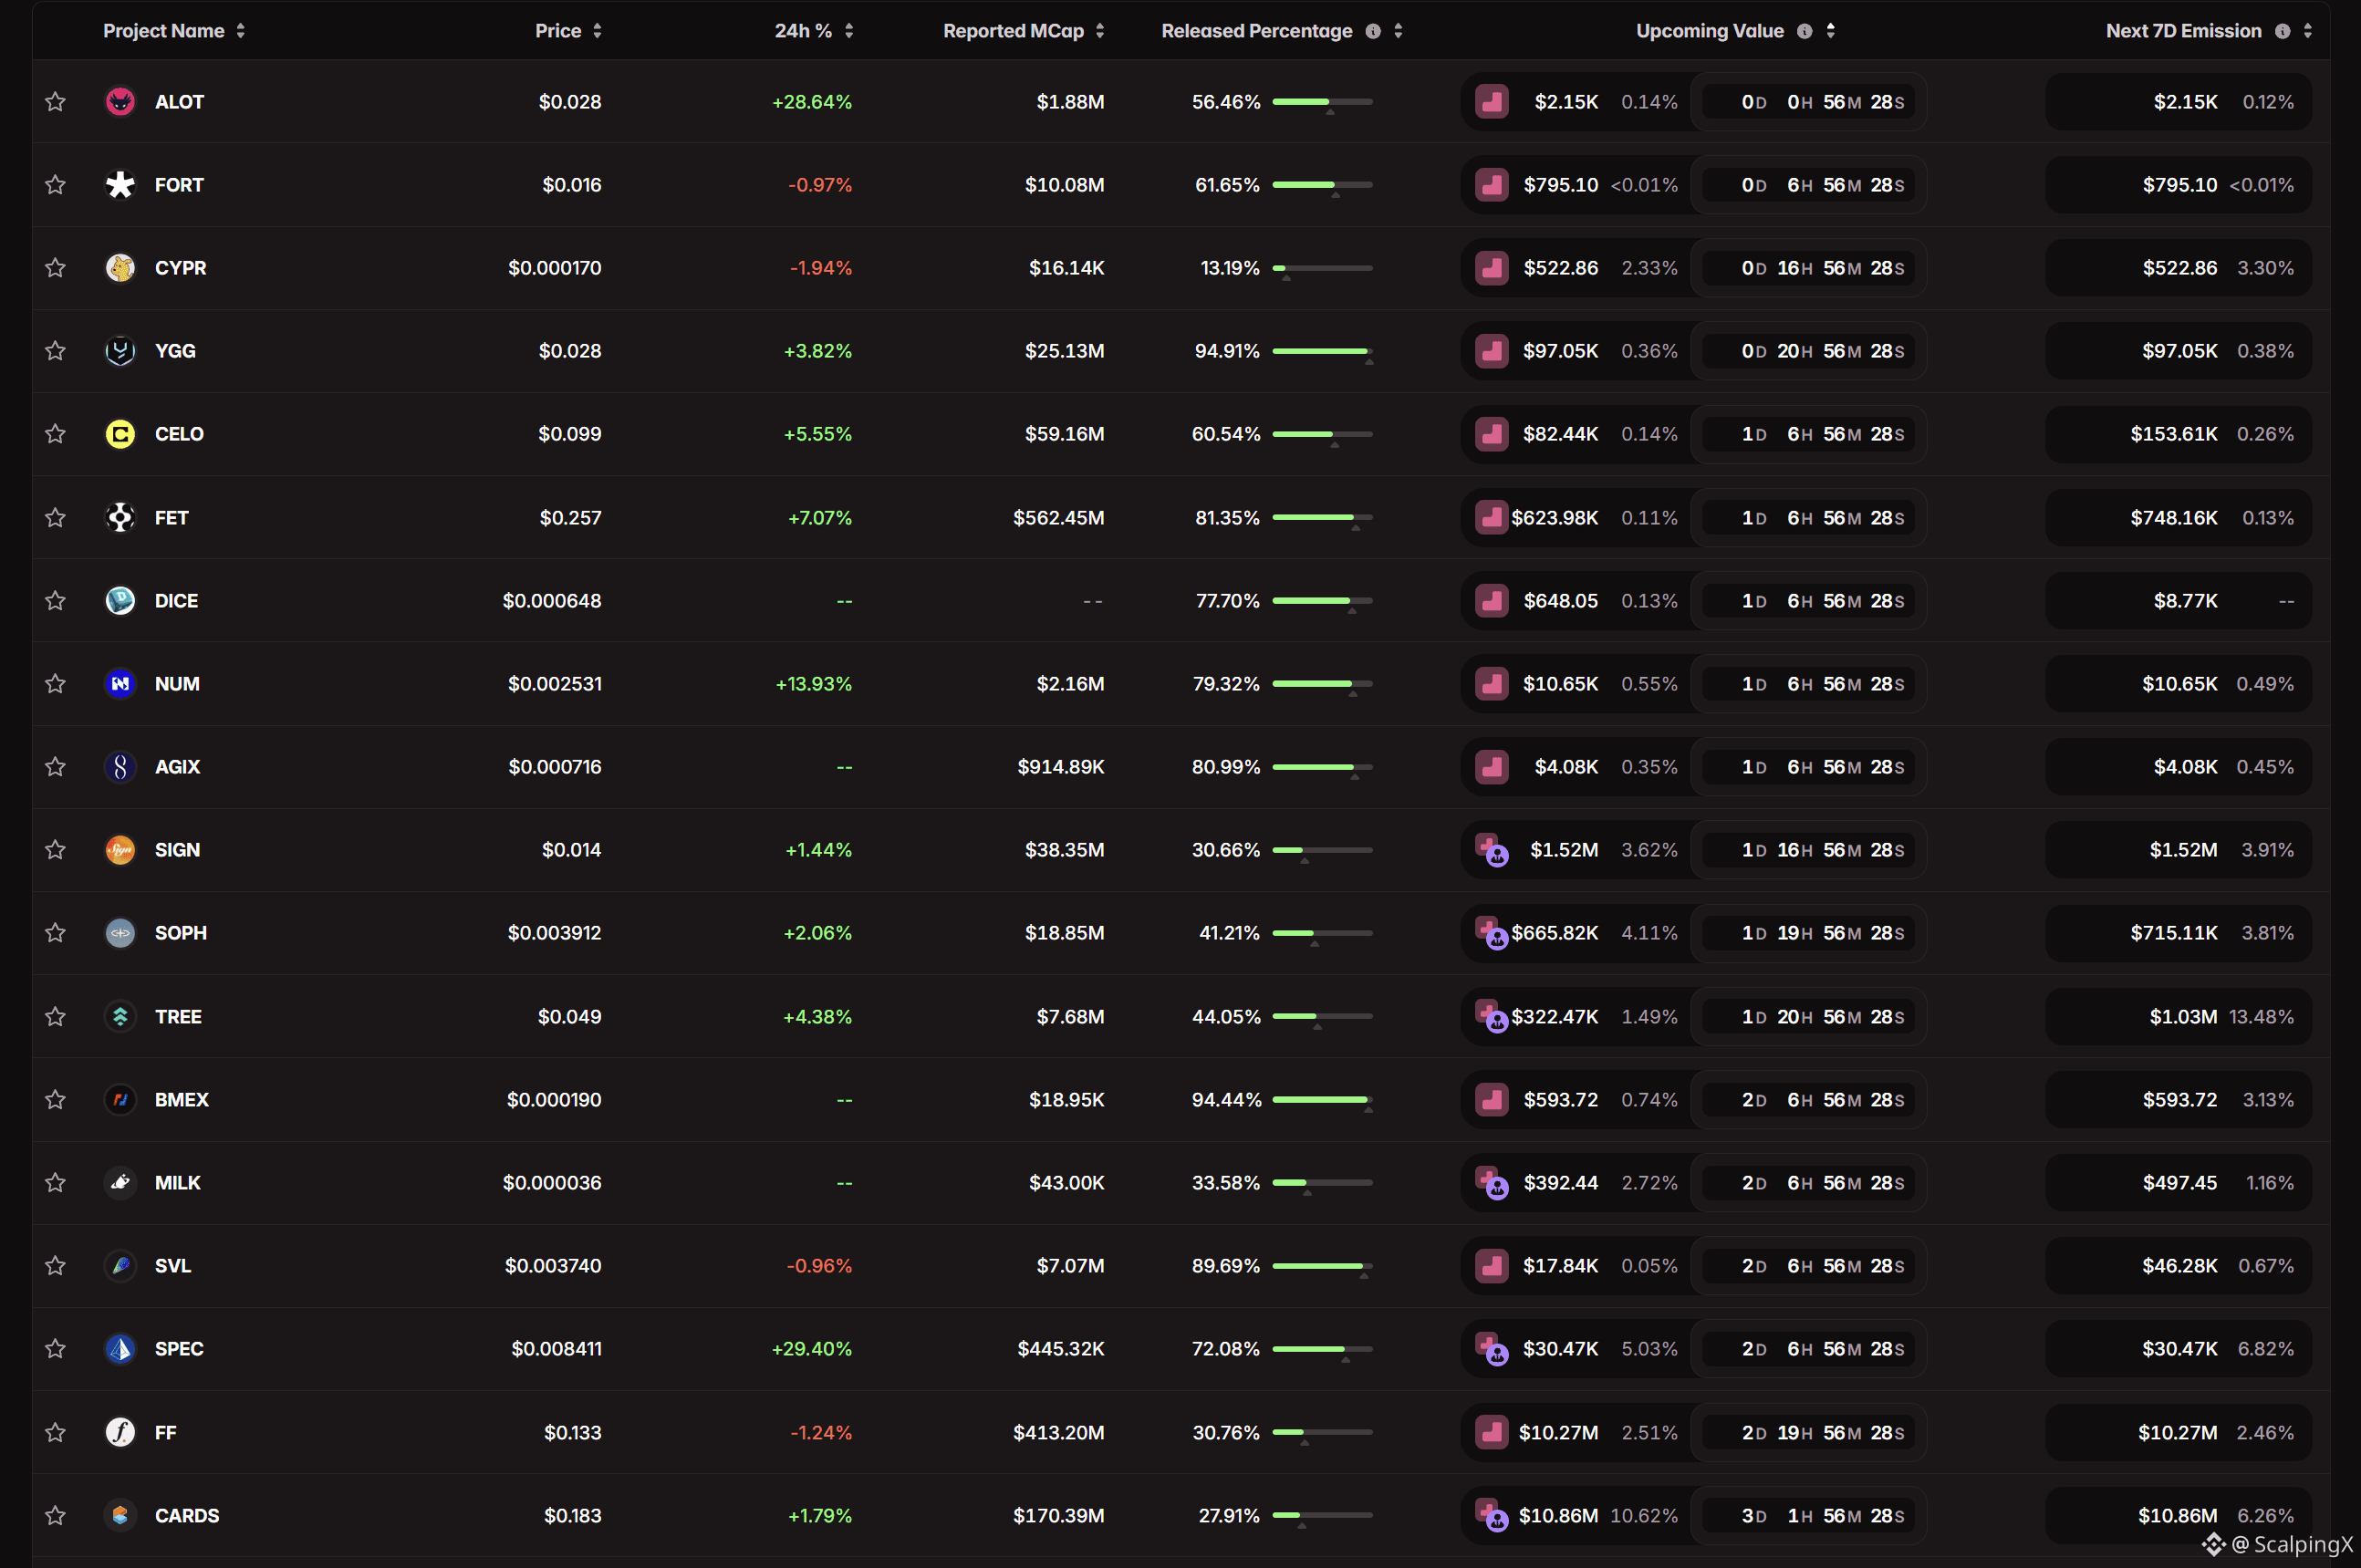
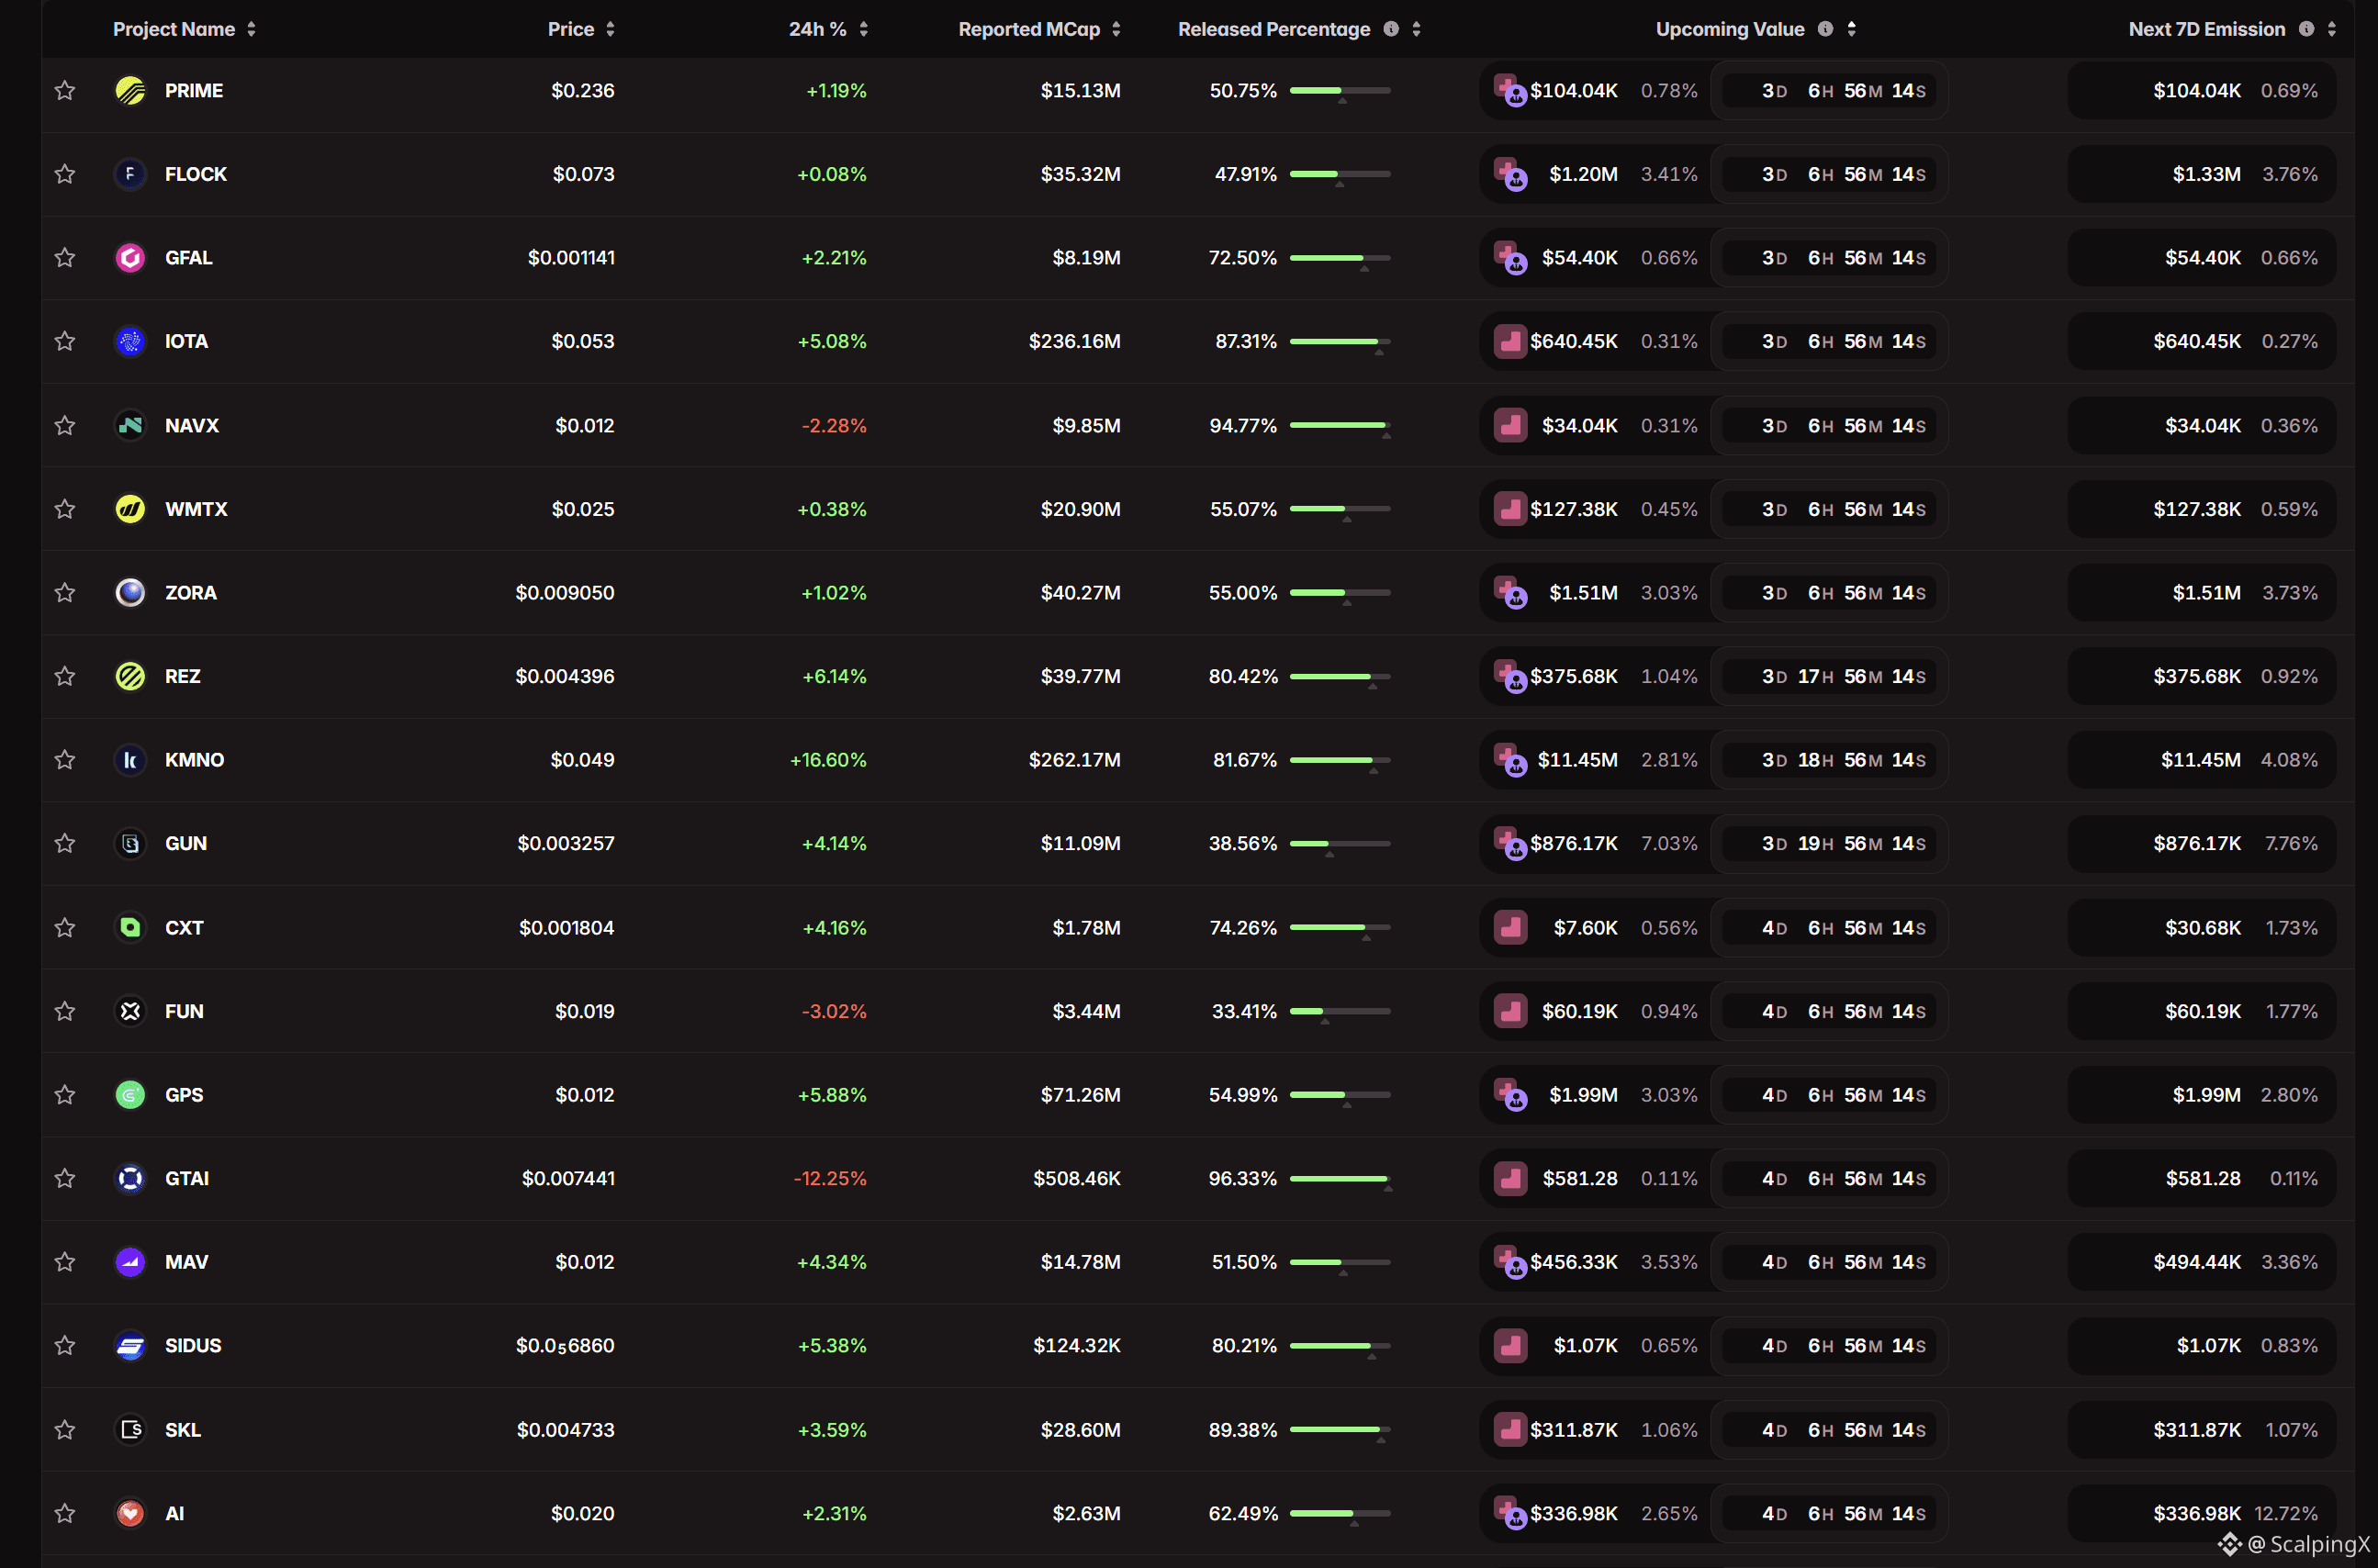
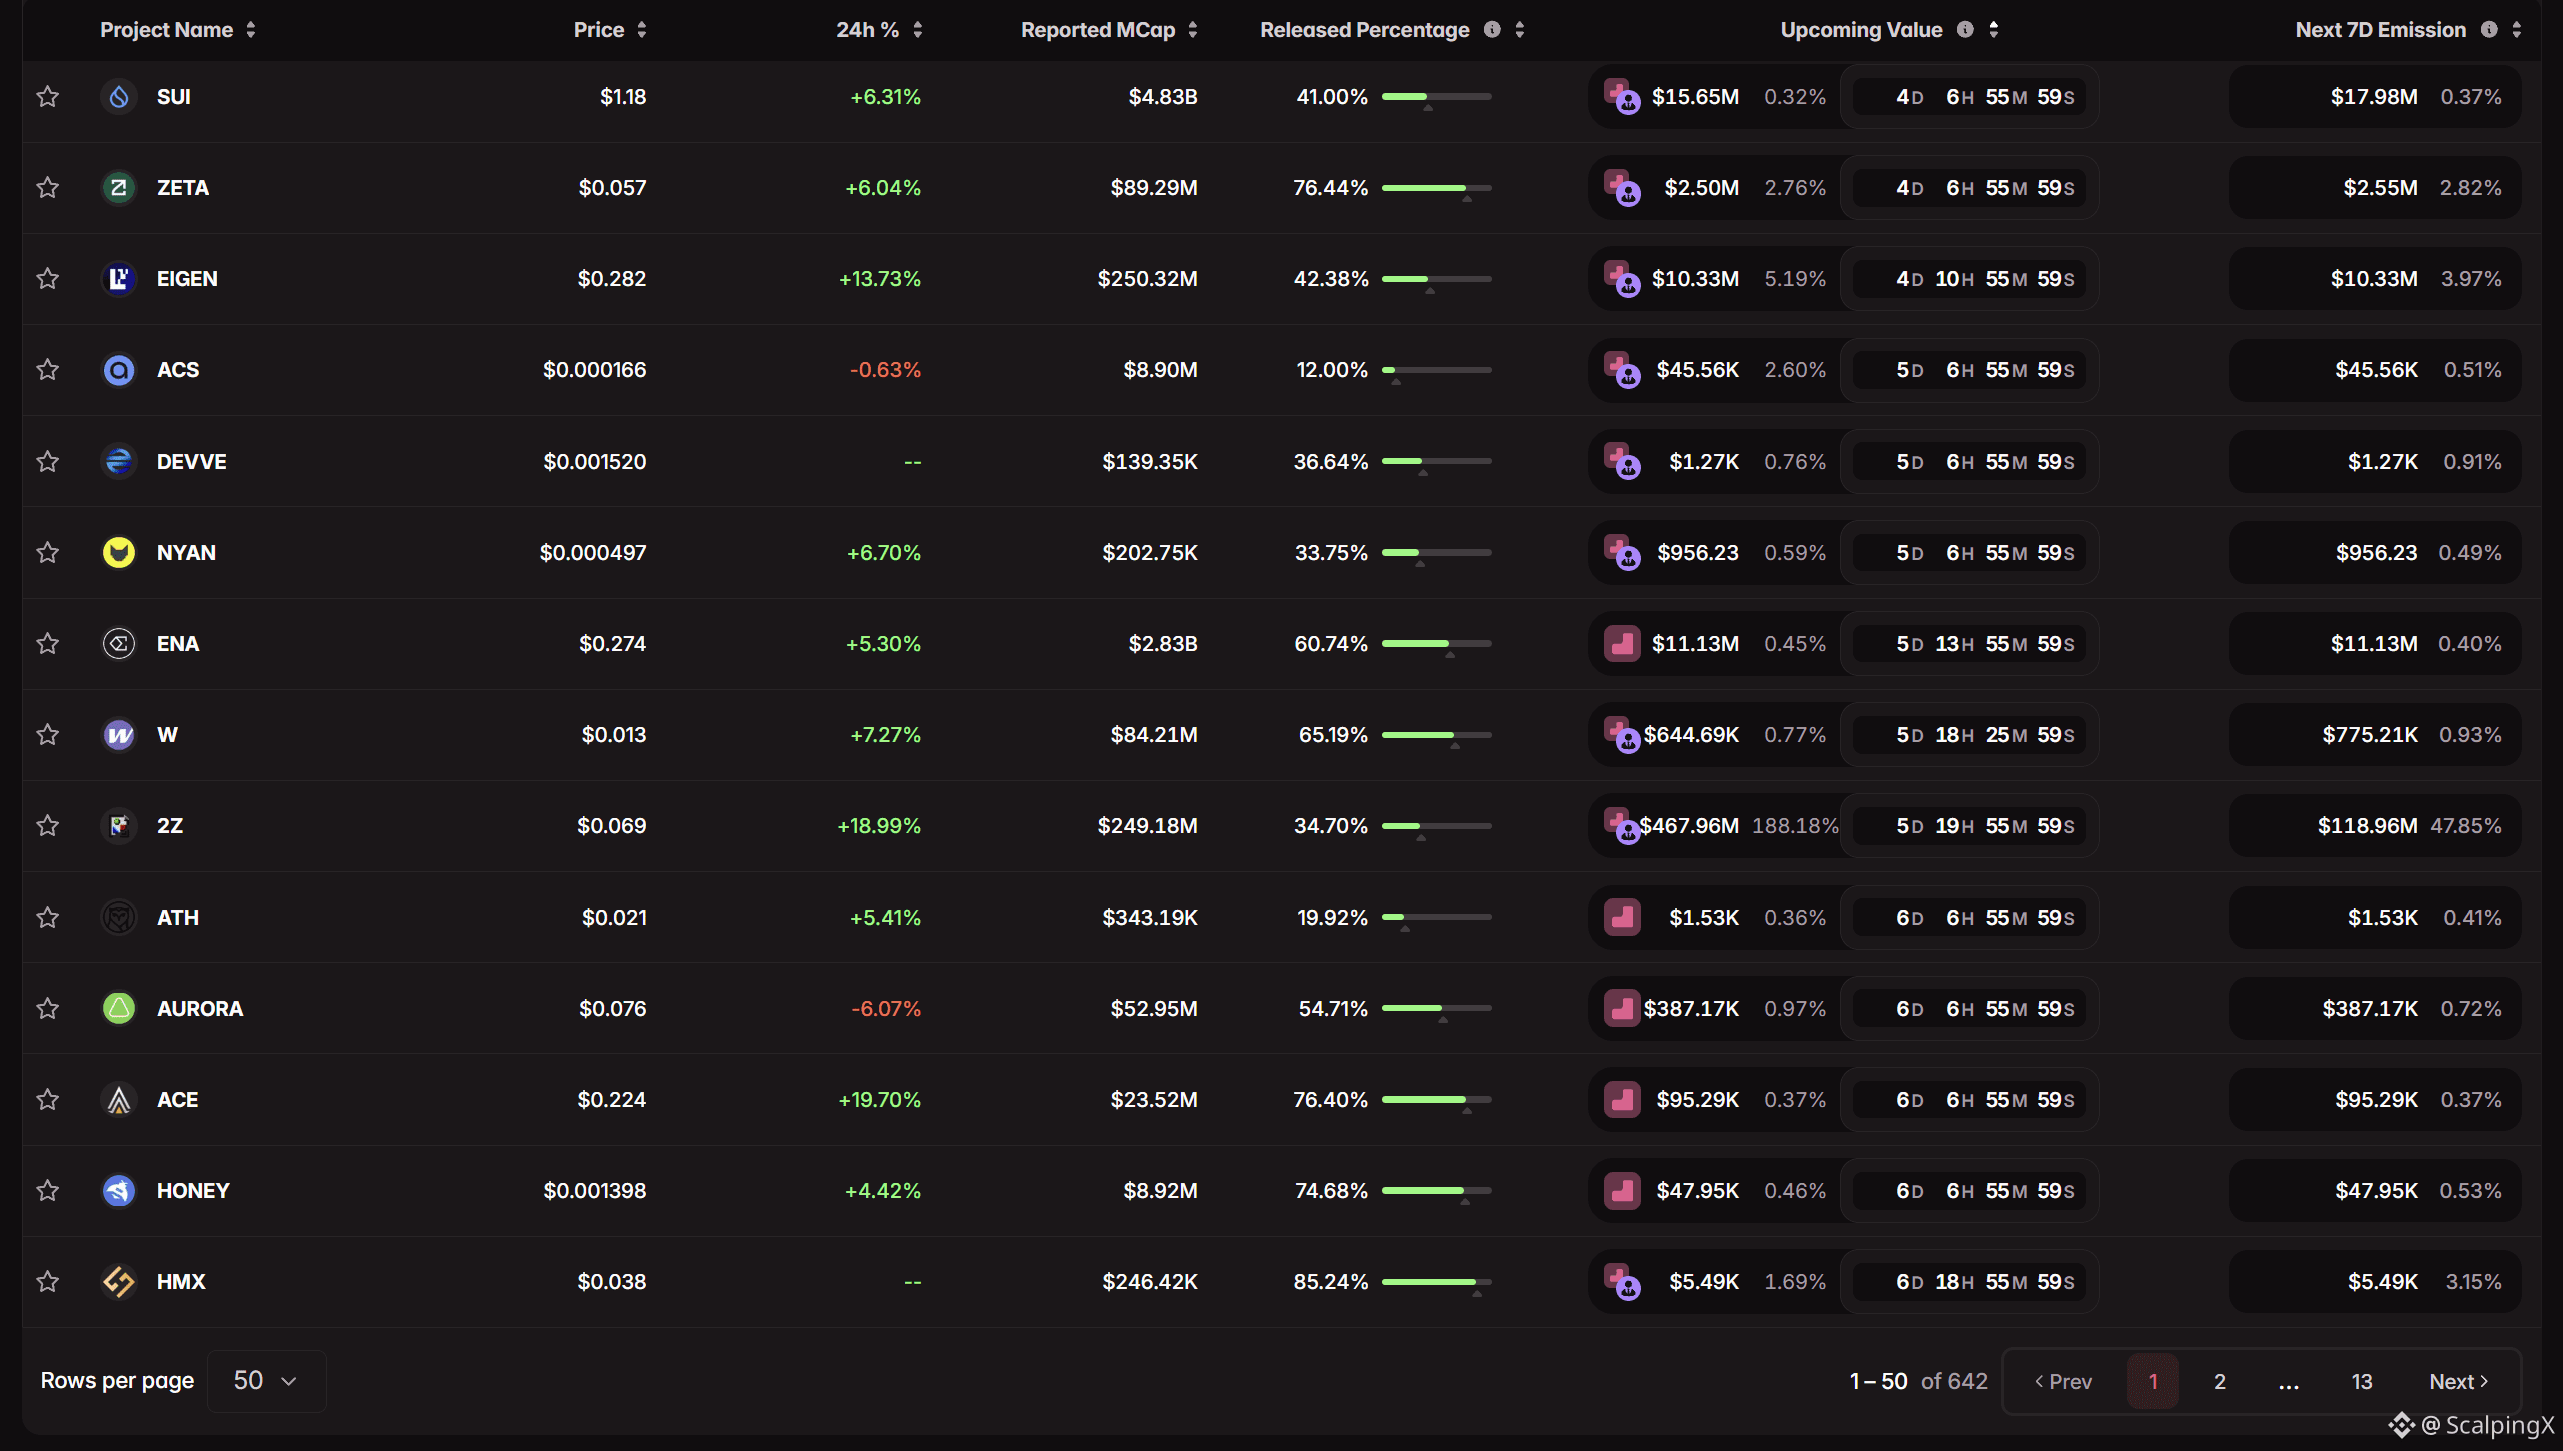
Upcoming unlock schedule for 50 tokens. Personally, I only consider Futures trading opportunities when the event is a Cliff Unlock and the unlock volume exceeds 50% of daily trading volume. If you are focused on long-term investing, however, these events are worth monitoring to optimize entry points after each unlock.
Currently, there are 2 unlock events worth watching due to their high unlock volume relative to daily trading volume:
$FF - 158.00%
$2Z - 476.54%
#TokenUnlock
Upcoming unlock schedule for 50 tokens. Personally, I only consider Futures trading opportunities when the event is a Cliff Unlock and the unlock volume exceeds 50% of daily trading volume. If you are focused on long-term investing, however, these events are worth monitoring to optimize entry points after each unlock.
Currently, there are 2 unlock events worth watching due to their high unlock volume relative to daily trading volume:
$FF - 158.00%
$2Z - 476.54%
#TokenUnlock
Currently, there are 2 unlock events worth watching due to their high unlock volume relative to daily trading volume:
$FF - 158.00%
$2Z - 476.54%
#TokenUnlock
47
·
--
Bullish
Crypto week of Sep 21–25: ETFs pushed prices higher, short squeeze amplified the move, but BTC failed to hold the $87,400 area
📈 Bitcoin opened the week around $80,000–81,000, surged to roughly $87,300–87,400, then eased back toward $84,000 by the end of the week. The rally coincided with strong ETF inflows and heavy short liquidations, while several altcoins outperformed BTC.
💰 U.S. spot Bitcoin ETFs attracted about $2.4 billion across five sessions, including nearly 1 billion on Sep 21 alone. Importantly, flows remained positive in the final two sessions even as BTC moved away from its peak, suggesting the pullback was not accompanied by a clear reversal in ETF demand.
⚡ Around $635 million in short positions were liquidated within 24 hours on Sep 21, amplifying the upside move. Afterward, BTC open interest on Binance fell nearly 13% while price declined only modestly, indicating much of the squeeze-driven positioning had been cleared rather than immediately replaced by a new layer of leveraged longs.
🏦 On-chain data also showed roughly 29,800 BTC leaving exchanges over seven days. BTC falling from $87,400 toward $84,000 while exchange flows remained net negative suggests readily available sell-side supply on CEXs did not rise in proportion to the price decline.
🔄 Ethereum ETFs also recorded around $690 million in inflows over five sessions. ETH price performance lagged some altcoins, but improving ETF demand showed that institutional buying was not limited to Bitcoin.
📊 After the squeeze, funding on several exchanges moved back toward low or negative levels, while total stablecoin supply remained around $305–312 billion. The structure suggests underlying liquidity remains in the market, but a sustained break above $87,400 may require renewed spot demand rather than another short squeeze alone.
#CryptoInsights $BTC
Crypto week of Sep 21–25: ETFs pushed prices higher, short squeeze amplified the move, but BTC failed to hold the $87,400 area
📈 Bitcoin opened the week around $80,000–81,000, surged to roughly $87,300–87,400, then eased back toward $84,000 by the end of the week. The rally coincided with strong ETF inflows and heavy short liquidations, while several altcoins outperformed BTC.
💰 U.S. spot Bitcoin ETFs attracted about $2.4 billion across five sessions, including nearly 1 billion on Sep 21 alone. Importantly, flows remained positive in the final two sessions even as BTC moved away from its peak, suggesting the pullback was not accompanied by a clear reversal in ETF demand.
⚡ Around $635 million in short positions were liquidated within 24 hours on Sep 21, amplifying the upside move. Afterward, BTC open interest on Binance fell nearly 13% while price declined only modestly, indicating much of the squeeze-driven positioning had been cleared rather than immediately replaced by a new layer of leveraged longs.
🏦 On-chain data also showed roughly 29,800 BTC leaving exchanges over seven days. BTC falling from $87,400 toward $84,000 while exchange flows remained net negative suggests readily available sell-side supply on CEXs did not rise in proportion to the price decline.
🔄 Ethereum ETFs also recorded around $690 million in inflows over five sessions. ETH price performance lagged some altcoins, but improving ETF demand showed that institutional buying was not limited to Bitcoin.
📊 After the squeeze, funding on several exchanges moved back toward low or negative levels, while total stablecoin supply remained around $305–312 billion. The structure suggests underlying liquidity remains in the market, but a sustained break above $87,400 may require renewed spot demand rather than another short squeeze alone.
#CryptoInsights $BTC
📈 Bitcoin opened the week around $80,000–81,000, surged to roughly $87,300–87,400, then eased back toward $84,000 by the end of the week. The rally coincided with strong ETF inflows and heavy short liquidations, while several altcoins outperformed BTC.
💰 U.S. spot Bitcoin ETFs attracted about $2.4 billion across five sessions, including nearly 1 billion on Sep 21 alone. Importantly, flows remained positive in the final two sessions even as BTC moved away from its peak, suggesting the pullback was not accompanied by a clear reversal in ETF demand.
⚡ Around $635 million in short positions were liquidated within 24 hours on Sep 21, amplifying the upside move. Afterward, BTC open interest on Binance fell nearly 13% while price declined only modestly, indicating much of the squeeze-driven positioning had been cleared rather than immediately replaced by a new layer of leveraged longs.
🏦 On-chain data also showed roughly 29,800 BTC leaving exchanges over seven days. BTC falling from $87,400 toward $84,000 while exchange flows remained net negative suggests readily available sell-side supply on CEXs did not rise in proportion to the price decline.
🔄 Ethereum ETFs also recorded around $690 million in inflows over five sessions. ETH price performance lagged some altcoins, but improving ETF demand showed that institutional buying was not limited to Bitcoin.
📊 After the squeeze, funding on several exchanges moved back toward low or negative levels, while total stablecoin supply remained around $305–312 billion. The structure suggests underlying liquidity remains in the market, but a sustained break above $87,400 may require renewed spot demand rather than another short squeeze alone.
#CryptoInsights $BTC

1
35
·
--
Chemicals Sep 21–25: feedstock costs rise faster than finished-product prices
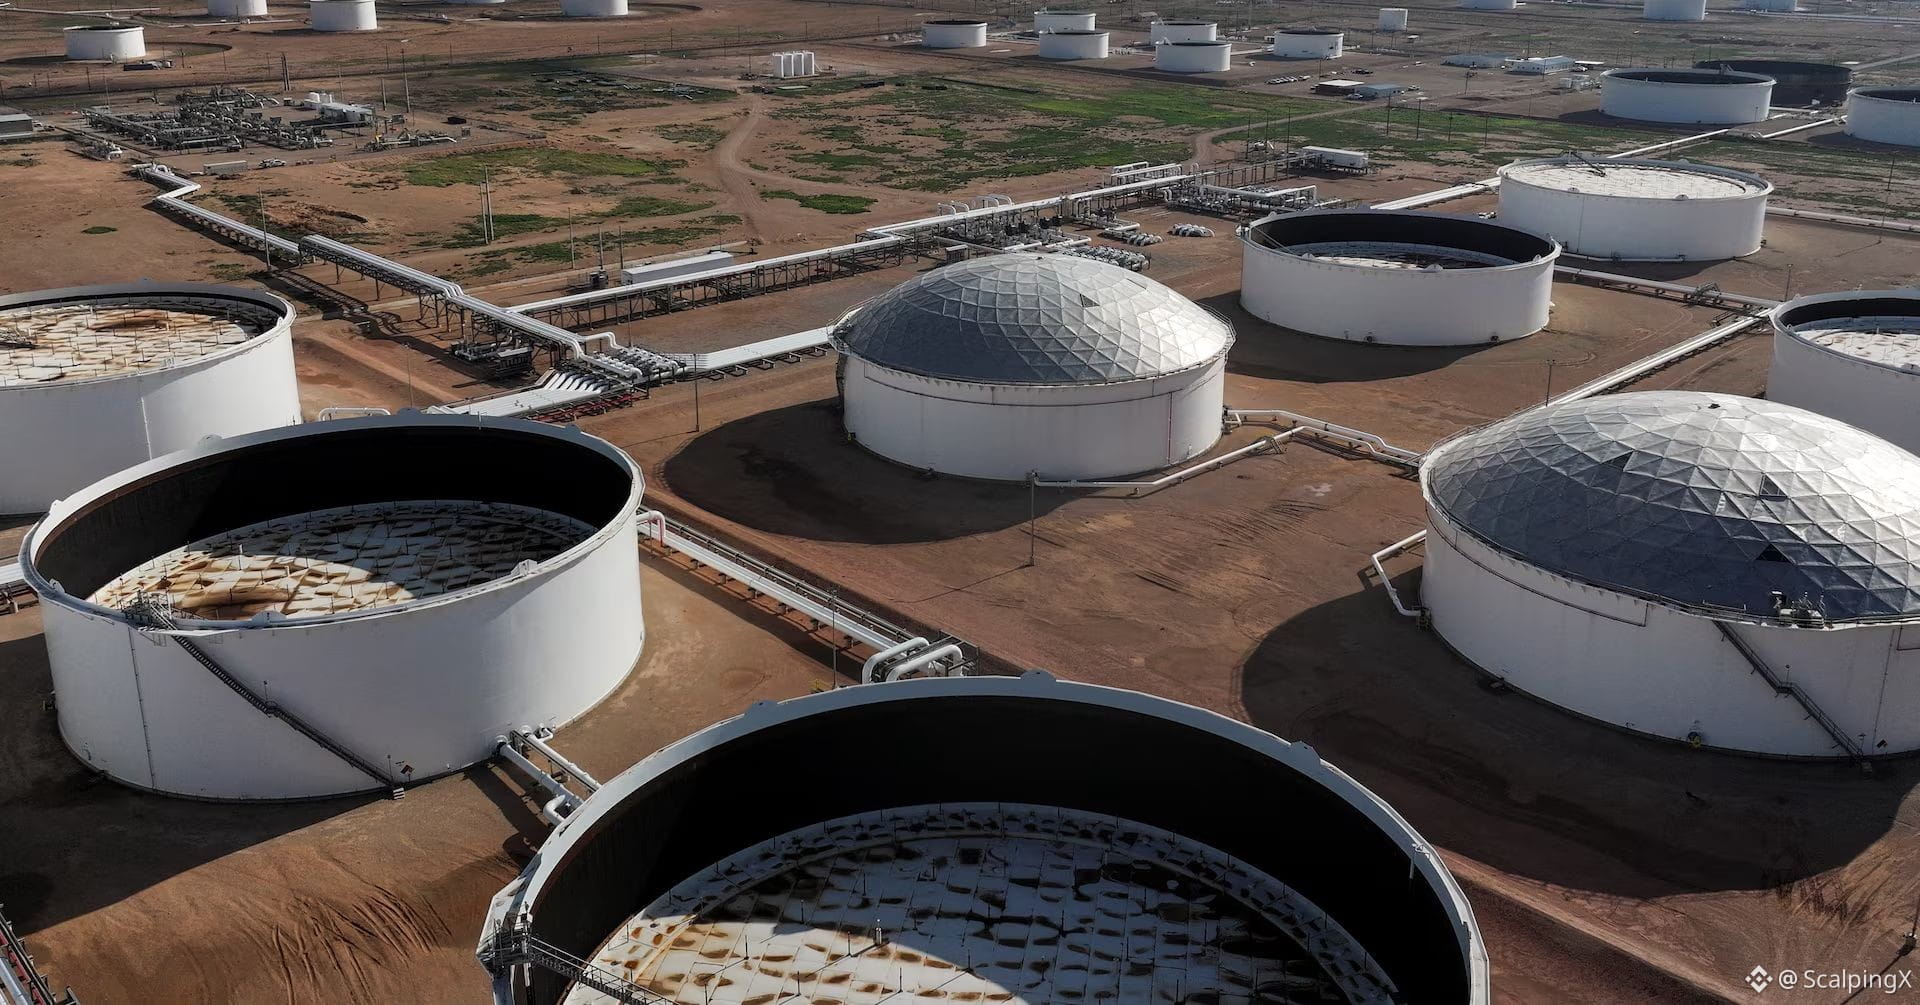
🛢 Oil holding above USD 100/bbl and elevated Hormuz freight costs continued to lift naphtha, methanol, benzene and ethylene costs. In China, mid-month methanol rose 9.4%, benzene 6.5% and acetic acid 17.4%, clearly outpacing many polymer products.
📉 In contrast, PP and LLDPE futures on Dalian fell on Sep 21 as downstream demand remained too weak to absorb higher input costs. Oil-based PE margins were estimated near −335 yuan/t, while coal-based PE still generated around +1,501 yuan/t, highlighting the widening gap between feedstock routes.
🏭 Asian ethylene supply remained relatively tight due to maintenance and reduced Middle Eastern cargoes, but propylene and PP weakened as demand lagged. MTO/MTP economics also deteriorated as methanol rose faster than olefin output prices, prompting some producers to cut operating rates or shut units.
🌾 Chinese urea showed a similar pattern. Coal-based production costs rose about 10% while urea prices increased only around 1%, pushing theoretical margins down to roughly 24 yuan/t. This indicates that higher input costs are still not being fully passed through.
🇪🇺 In Europe, Ineos’ temporary shutdown of three Hull plants, alongside EU chemical operating rates near 75%, continues to reflect structural pressure from expensive gas, electricity and feedstocks. Low Rhine water levels and the EU’s anti-dumping investigation into PVC add further logistics and trade risks.
🔎 Looking ahead, China’s Golden Week, oil prices and Hormuz freight will be key variables. If energy costs remain elevated, PP/PE and urea margins may stay compressed even as basic chemical feedstocks remain firm.
#Chemicals $NVDAB
Chemicals Sep 21–25: feedstock costs rise faster than finished-product prices
🛢 Oil holding above USD 100/bbl and elevated Hormuz freight costs continued to lift naphtha, methanol, benzene and ethylene costs. In China, mid-month methanol rose 9.4%, benzene 6.5% and acetic acid 17.4%, clearly outpacing many polymer products.
📉 In contrast, PP and LLDPE futures on Dalian fell on Sep 21 as downstream demand remained too weak to absorb higher input costs. Oil-based PE margins were estimated near −335 yuan/t, while coal-based PE still generated around +1,501 yuan/t, highlighting the widening gap between feedstock routes.
🏭 Asian ethylene supply remained relatively tight due to maintenance and reduced Middle Eastern cargoes, but propylene and PP weakened as demand lagged. MTO/MTP economics also deteriorated as methanol rose faster than olefin output prices, prompting some producers to cut operating rates or shut units.
🌾 Chinese urea showed a similar pattern. Coal-based production costs rose about 10% while urea prices increased only around 1%, pushing theoretical margins down to roughly 24 yuan/t. This indicates that higher input costs are still not being fully passed through.
🇪🇺 In Europe, Ineos’ temporary shutdown of three Hull plants, alongside EU chemical operating rates near 75%, continues to reflect structural pressure from expensive gas, electricity and feedstocks. Low Rhine water levels and the EU’s anti-dumping investigation into PVC add further logistics and trade risks.
🔎 Looking ahead, China’s Golden Week, oil prices and Hormuz freight will be key variables. If energy costs remain elevated, PP/PE and urea margins may stay compressed even as basic chemical feedstocks remain firm.
#Chemicals $NVDAB
🛢 Oil holding above USD 100/bbl and elevated Hormuz freight costs continued to lift naphtha, methanol, benzene and ethylene costs. In China, mid-month methanol rose 9.4%, benzene 6.5% and acetic acid 17.4%, clearly outpacing many polymer products.
📉 In contrast, PP and LLDPE futures on Dalian fell on Sep 21 as downstream demand remained too weak to absorb higher input costs. Oil-based PE margins were estimated near −335 yuan/t, while coal-based PE still generated around +1,501 yuan/t, highlighting the widening gap between feedstock routes.
🏭 Asian ethylene supply remained relatively tight due to maintenance and reduced Middle Eastern cargoes, but propylene and PP weakened as demand lagged. MTO/MTP economics also deteriorated as methanol rose faster than olefin output prices, prompting some producers to cut operating rates or shut units.
🌾 Chinese urea showed a similar pattern. Coal-based production costs rose about 10% while urea prices increased only around 1%, pushing theoretical margins down to roughly 24 yuan/t. This indicates that higher input costs are still not being fully passed through.
🇪🇺 In Europe, Ineos’ temporary shutdown of three Hull plants, alongside EU chemical operating rates near 75%, continues to reflect structural pressure from expensive gas, electricity and feedstocks. Low Rhine water levels and the EU’s anti-dumping investigation into PVC add further logistics and trade risks.
🔎 Looking ahead, China’s Golden Week, oil prices and Hormuz freight will be key variables. If energy costs remain elevated, PP/PE and urea margins may stay compressed even as basic chemical feedstocks remain firm.
#Chemicals $NVDAB
25
·
--
Paper oil cools, but diesel and logistics keep the physical market tight
🛢 Brent ended the week near $104.32/bbl while WTI fell to $92.41, widening the Brent–WTI spread to almost $12/bbl, its widest since May. The divergence shows US crude is facing its own pressure from inventories and diesel export risks, while international barrels still command a higher physical premium.
🤝 US–Iran talks in New York helped remove part of the Hormuz risk premium, but physical flows have not materially improved. Kpler estimated oil movements through the strait at around 33.7 million barrels for the week beginning Sep. 20, broadly unchanged from the previous week.
📉 At the same time, the IEA estimates observed global oil inventories have fallen by roughly 507 million barrels since the conflict began. In the US, distillate stocks stand at just 107.4 million barrels, around 12% below the five-year average, even as commercial crude inventories rose by 3 million barrels.
⛽ The strongest pressure remains in refined products. Southern European diesel cracks moved above $100/bbl, while reports that Washington is considering a 90-day diesel export ban sharply weakened US diesel cracks. If implemented, the policy could ease domestic US supply while tightening Europe further.
🚢 Logistics also remain constrained. Gulf-to-Asia VLCC rates briefly reached around $1.27 million per day, while ship-to-ship transfer capacity off Oman has been heavily utilized. That suggests even a smoother Hormuz transit would not immediately remove the physical bottleneck.
📌 The week therefore cannot be read simply as oil falling on diplomacy. WTI is reflecting US crude availability and domestic diesel risks, while Brent remains supported by falling global inventories, tight refined-product supply and elevated logistics costs.
#EnergyMarkets $CL $NATGAS
Paper oil cools, but diesel and logistics keep the physical market tight
🛢 Brent ended the week near $104.32/bbl while WTI fell to $92.41, widening the Brent–WTI spread to almost $12/bbl, its widest since May. The divergence shows US crude is facing its own pressure from inventories and diesel export risks, while international barrels still command a higher physical premium.
🤝 US–Iran talks in New York helped remove part of the Hormuz risk premium, but physical flows have not materially improved. Kpler estimated oil movements through the strait at around 33.7 million barrels for the week beginning Sep. 20, broadly unchanged from the previous week.
📉 At the same time, the IEA estimates observed global oil inventories have fallen by roughly 507 million barrels since the conflict began. In the US, distillate stocks stand at just 107.4 million barrels, around 12% below the five-year average, even as commercial crude inventories rose by 3 million barrels.
⛽ The strongest pressure remains in refined products. Southern European diesel cracks moved above $100/bbl, while reports that Washington is considering a 90-day diesel export ban sharply weakened US diesel cracks. If implemented, the policy could ease domestic US supply while tightening Europe further.
🚢 Logistics also remain constrained. Gulf-to-Asia VLCC rates briefly reached around $1.27 million per day, while ship-to-ship transfer capacity off Oman has been heavily utilized. That suggests even a smoother Hormuz transit would not immediately remove the physical bottleneck.
📌 The week therefore cannot be read simply as oil falling on diplomacy. WTI is reflecting US crude availability and domestic diesel risks, while Brent remains supported by falling global inventories, tight refined-product supply and elevated logistics costs.
#EnergyMarkets $CL $NATGAS
🛢 Brent ended the week near $104.32/bbl while WTI fell to $92.41, widening the Brent–WTI spread to almost $12/bbl, its widest since May. The divergence shows US crude is facing its own pressure from inventories and diesel export risks, while international barrels still command a higher physical premium.
🤝 US–Iran talks in New York helped remove part of the Hormuz risk premium, but physical flows have not materially improved. Kpler estimated oil movements through the strait at around 33.7 million barrels for the week beginning Sep. 20, broadly unchanged from the previous week.
📉 At the same time, the IEA estimates observed global oil inventories have fallen by roughly 507 million barrels since the conflict began. In the US, distillate stocks stand at just 107.4 million barrels, around 12% below the five-year average, even as commercial crude inventories rose by 3 million barrels.
⛽ The strongest pressure remains in refined products. Southern European diesel cracks moved above $100/bbl, while reports that Washington is considering a 90-day diesel export ban sharply weakened US diesel cracks. If implemented, the policy could ease domestic US supply while tightening Europe further.
🚢 Logistics also remain constrained. Gulf-to-Asia VLCC rates briefly reached around $1.27 million per day, while ship-to-ship transfer capacity off Oman has been heavily utilized. That suggests even a smoother Hormuz transit would not immediately remove the physical bottleneck.
📌 The week therefore cannot be read simply as oil falling on diplomacy. WTI is reflecting US crude availability and domestic diesel risks, while Brent remains supported by falling global inventories, tight refined-product supply and elevated logistics costs.
#EnergyMarkets $CL $NATGAS

137
·
--
Agricultural commodities diverge as soybeans gain on China expectations while wheat faces supply pressure
🌱 U.S. soybeans were a key outperformer during September 21–25, with November futures closing near 13.19 USD/bu, up 15.5 cents for the week. Support came mainly from expectations of stronger Chinese purchases following fresh trade signals, although the roughly 17 billion USD agricultural commitment still lacks a detailed product breakdown or shipment schedule.
📊 Positioning shows that speculators have already leaned heavily into this theme. Managed money holds a net long of around 281,000 soybean contracts, the highest level in 52 weeks, increasing the potential for a sharp reaction if upcoming purchase details differ from expectations.
🌾 Wheat moved in the opposite direction. SRW fell about 11 cents for the week, HRW lost more than 21 cents, and spring wheat declined nearly 28 cents. Russian and Ukrainian exports remain well below year-ago levels, but Russian grain is still reaching the market through Baltic routes, limiting the premium for a severe supply disruption.
🌽 Corn finished nearly flat as supportive and bearish factors offset each other. USDA has reduced its U.S. production outlook on weaker yields, while harvest progress remains ahead of average and Argentine supply continues moving into export channels.
☕ In soft commodities, Arabica remained under pressure as Brazil’s weather outlook improved and ICE inventories recovered from multi-year lows. Cocoa gained around 5.5% for the week, although the 2025/26 supply outlook still points toward a surplus, making the move look more like a recovery than a renewed shortage cycle.
🔎 Next week, attention turns to details on Chinese agricultural purchases and the USDA Grain Stocks report, which could determine whether the current soybean premium has enough fundamental support to persist.
#Commodities $SUSHI
Agricultural commodities diverge as soybeans gain on China expectations while wheat faces supply pressure
🌱 U.S. soybeans were a key outperformer during September 21–25, with November futures closing near 13.19 USD/bu, up 15.5 cents for the week. Support came mainly from expectations of stronger Chinese purchases following fresh trade signals, although the roughly 17 billion USD agricultural commitment still lacks a detailed product breakdown or shipment schedule.
📊 Positioning shows that speculators have already leaned heavily into this theme. Managed money holds a net long of around 281,000 soybean contracts, the highest level in 52 weeks, increasing the potential for a sharp reaction if upcoming purchase details differ from expectations.
🌾 Wheat moved in the opposite direction. SRW fell about 11 cents for the week, HRW lost more than 21 cents, and spring wheat declined nearly 28 cents. Russian and Ukrainian exports remain well below year-ago levels, but Russian grain is still reaching the market through Baltic routes, limiting the premium for a severe supply disruption.
🌽 Corn finished nearly flat as supportive and bearish factors offset each other. USDA has reduced its U.S. production outlook on weaker yields, while harvest progress remains ahead of average and Argentine supply continues moving into export channels.
☕ In soft commodities, Arabica remained under pressure as Brazil’s weather outlook improved and ICE inventories recovered from multi-year lows. Cocoa gained around 5.5% for the week, although the 2025/26 supply outlook still points toward a surplus, making the move look more like a recovery than a renewed shortage cycle.
🔎 Next week, attention turns to details on Chinese agricultural purchases and the USDA Grain Stocks report, which could determine whether the current soybean premium has enough fundamental support to persist.
#Commodities $SUSHI
🌱 U.S. soybeans were a key outperformer during September 21–25, with November futures closing near 13.19 USD/bu, up 15.5 cents for the week. Support came mainly from expectations of stronger Chinese purchases following fresh trade signals, although the roughly 17 billion USD agricultural commitment still lacks a detailed product breakdown or shipment schedule.
📊 Positioning shows that speculators have already leaned heavily into this theme. Managed money holds a net long of around 281,000 soybean contracts, the highest level in 52 weeks, increasing the potential for a sharp reaction if upcoming purchase details differ from expectations.
🌾 Wheat moved in the opposite direction. SRW fell about 11 cents for the week, HRW lost more than 21 cents, and spring wheat declined nearly 28 cents. Russian and Ukrainian exports remain well below year-ago levels, but Russian grain is still reaching the market through Baltic routes, limiting the premium for a severe supply disruption.
🌽 Corn finished nearly flat as supportive and bearish factors offset each other. USDA has reduced its U.S. production outlook on weaker yields, while harvest progress remains ahead of average and Argentine supply continues moving into export channels.
☕ In soft commodities, Arabica remained under pressure as Brazil’s weather outlook improved and ICE inventories recovered from multi-year lows. Cocoa gained around 5.5% for the week, although the 2025/26 supply outlook still points toward a surplus, making the move look more like a recovery than a renewed shortage cycle.
🔎 Next week, attention turns to details on Chinese agricultural purchases and the USDA Grain Stocks report, which could determine whether the current soybean premium has enough fundamental support to persist.
#Commodities $SUSHI

195
Log in to explore more content
Join global crypto users on Binance Square
⚡️ Get latest and useful information about crypto.
💬 Trusted by the world’s largest crypto exchange.
👍 Discover real insights from verified creators.
Email / Phone number
Trending Topics
BitwiseFilesFinalNEARSpotETFProspectus
15,146 views
492 Discussing
#bitwisefilesfinalnearspotetfprospectus 🚀
Can the NEAR token reach $562?$NEAR
Bitwise is preparing a spot NEAR ETF, listed under the ticker NRR on NYSE Arca. The manager was already discussing targets of $155, or even $562 by 2030.$RESOLV $DASH
Rajo C
·4 Likes
·3k views
BitgetHackerMoves$83MStolenXRP
15,485 views
95 Discussing
SOLSpotETFWeeklyInflow$188M
6,799 views
71 Discussing