
数据工坊
4 Posts
数据工坊
行情、量化数据采集与自动化工具。做过完整量化系统,采集、清洗、回测、风控、监控都会。懂金融数据怎么用。分享数据量化干货。有数据或自动化需求,欢迎评论区或私信交流。
0 Following
0 Followers
0 Liked
Posts
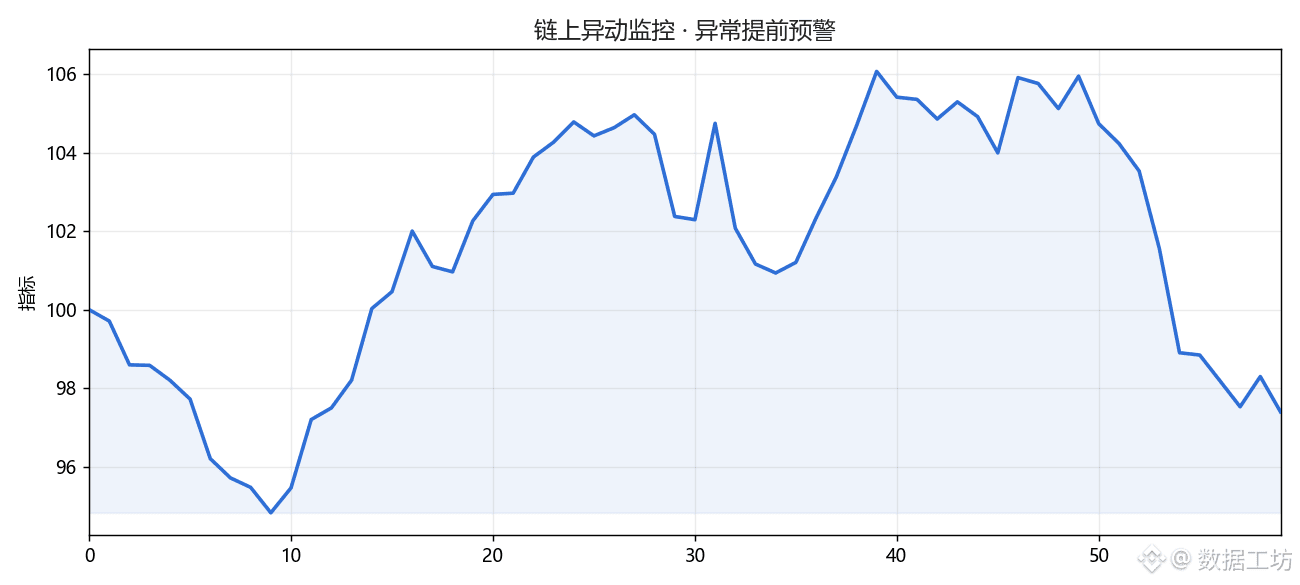
Liquid was attacked for $320 million—but on-chain anomalies often show early warning
In crypto, monitoring on-chain data exposes risk earlier than intuition—abnormal transactions and large on-chain movements often show signs before things go wrong.
I personally built monitoring and alerting into a system (automatic alerts/thresholds pushed to WeChat) so I don’t only find out after an incident.
(Featured image: data chart)
Do you usually watch for on-chain anomalies? Let’s chat in the comments.
#Liquid #链上数据 #监控 #量化 #data_control
In crypto, monitoring on-chain data exposes risk earlier than intuition—abnormal transactions and large on-chain movements often show signs before things go wrong.
I personally built monitoring and alerting into a system (automatic alerts/thresholds pushed to WeChat) so I don’t only find out after an incident.
(Featured image: data chart)
Do you usually watch for on-chain anomalies? Let’s chat in the comments.
#Liquid #链上数据 #监控 #量化 #data_control
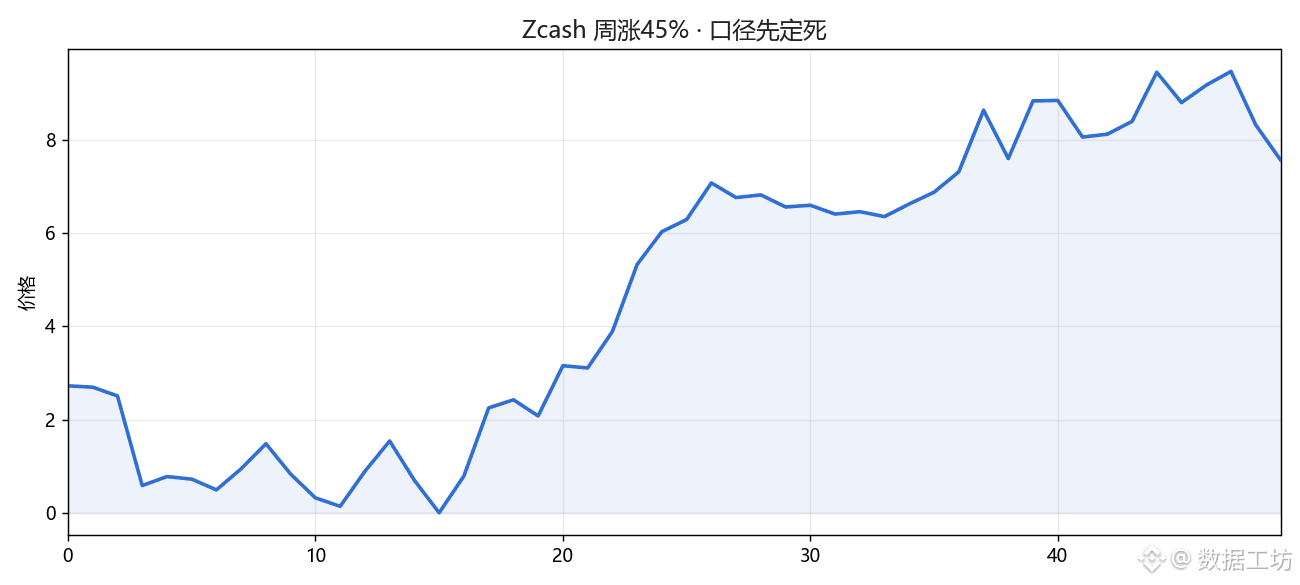
Zcash up 45% in one week—before you chase it, make sure the data you’re looking at is correct
For the same coin, when you see a 45% rally, is it based on the latest trade price, the volume-weighted average price, or the mid price in the order book? These can differ greatly during a sudden surge or crash.
The data methodology isn’t set in stone—even a beautifully drawn candlestick chart can just be self-delusion. I learned this the hard way when I was doing quantitative trading. Later, I fixed the methodology, time window, and de-duplication rules; only then did I dare to use the signals.
(With accompanying image: data chart)
For those chasing the rally, first make sure the numbers you’re seeing are right. If you have any needs for market/data collection, feel free to chat in the comments.
For the same coin, when you see a 45% rally, is it based on the latest trade price, the volume-weighted average price, or the mid price in the order book? These can differ greatly during a sudden surge or crash.
The data methodology isn’t set in stone—even a beautifully drawn candlestick chart can just be self-delusion. I learned this the hard way when I was doing quantitative trading. Later, I fixed the methodology, time window, and de-duplication rules; only then did I dare to use the signals.
(With accompanying image: data chart)
For those chasing the rally, first make sure the numbers you’re seeing are right. If you have any needs for market/data collection, feel free to chat in the comments.
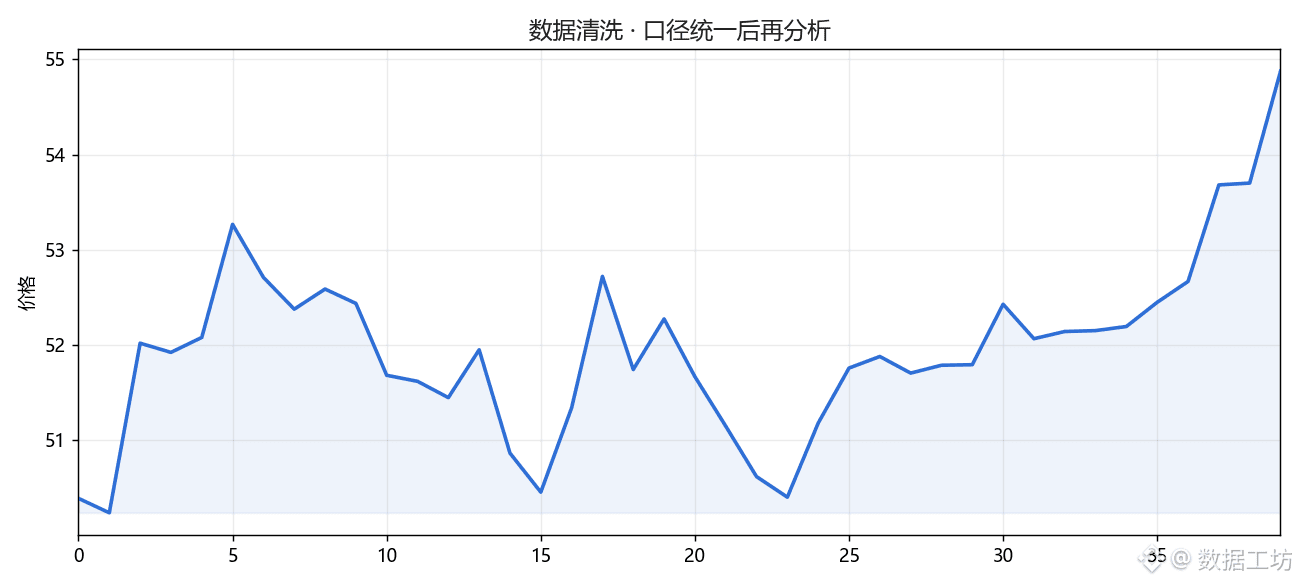
When doing data analysis, the most time-consuming part isn’t actually collecting the data—it’s cleaning it.
With the same dataset, if you pull it from different sources, the formats can be all over the place: inconsistent date formats, missing values, duplicates, and mixed units… The time you spend cleaning is often several times more than the time spent collecting.
I learned this the hard way: before pulling the data, first lock down the definitions (fields, units, time range, deduplication rules). Even if it takes an extra half hour to write the cleaning rules, you can save one or two hours every day afterward.
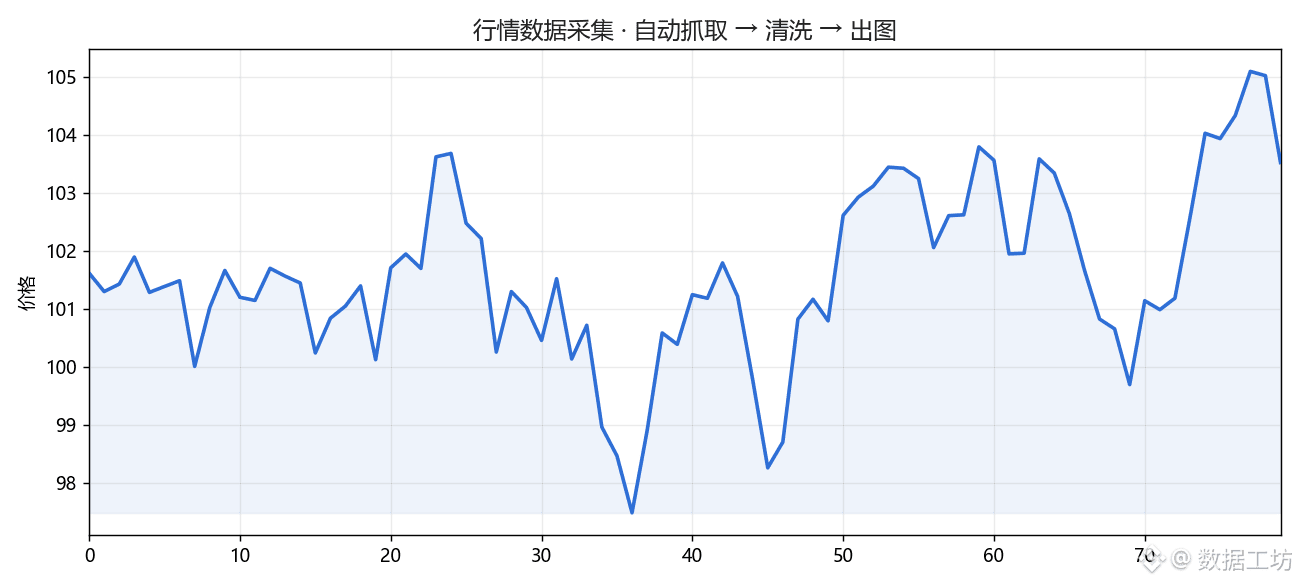
(Images: clean data after cleaning)
If every day you’re also spending a lot of time organizing data, let’s talk about how to automate this step. No charge—just message me first.
With the same dataset, if you pull it from different sources, the formats can be all over the place: inconsistent date formats, missing values, duplicates, and mixed units… The time you spend cleaning is often several times more than the time spent collecting.
I learned this the hard way: before pulling the data, first lock down the definitions (fields, units, time range, deduplication rules). Even if it takes an extra half hour to write the cleaning rules, you can save one or two hours every day afterward.
(Images: clean data after cleaning)
If every day you’re also spending a lot of time organizing data, let’s talk about how to automate this step. No charge—just message me first.
For quants, the most common pitfall isn’t the strategy—it’s the "data".
For the same coin, on interface A you get the "latest trade price", on interface B you get the "VWAP (volume-weighted average price)", and on interface C you get the "mid price from the order book".
——All three are correct, but the backtest results can differ drastically. I ran into this once: the strategy backtested beautifully, but when I ran it live, it completely fell apart.
Later I found out the data definitions didn’t match the live trading.
So before doing quant trading, decide clearly in advance: which price you want, what exact time you’re using, and what kind of signal/gesture (event) you’re referring to. Otherwise, even a fancy backtest is just self-entertainment.
Nowadays, when I track the market, I use a pipeline with a fixed set of data rules—automated and scheduled collection, cleaning, reporting, and even alerts.
That’s to make sure the "data pitfall" doesn’t ruin the strategy.
If you’re into quant trading and you’re also wrestling with "data definitions", feel free to chat—I’ll talk first, no charge.
For the same coin, on interface A you get the "latest trade price", on interface B you get the "VWAP (volume-weighted average price)", and on interface C you get the "mid price from the order book".
——All three are correct, but the backtest results can differ drastically. I ran into this once: the strategy backtested beautifully, but when I ran it live, it completely fell apart.
Later I found out the data definitions didn’t match the live trading.
So before doing quant trading, decide clearly in advance: which price you want, what exact time you’re using, and what kind of signal/gesture (event) you’re referring to. Otherwise, even a fancy backtest is just self-entertainment.
Nowadays, when I track the market, I use a pipeline with a fixed set of data rules—automated and scheduled collection, cleaning, reporting, and even alerts.
That’s to make sure the "data pitfall" doesn’t ruin the strategy.
If you’re into quant trading and you’re also wrestling with "data definitions", feel free to chat—I’ll talk first, no charge.
Log in to explore more content