

逆转投资
1.8k Posts

逆转投资
Report
Block User
指标不会骗人,在币圈消息舆论鱼龙混杂的环境下,只有k线和指标不会骗人,相信指标、驾驭指标才是财务自由的根本保障

Top 30D Traders by Volume
43 Following
506 Followers
566 Liked
1 Badges
Posts
·
--

Article
The EU wants to clear non-compliant stablecoins out of custody as well, but the exit rules haven’t been written yetTo put it plainly, what changes here is this: in the EU, non-compliant stablecoins may not even be allowed to sit “in custody.” In an opinion submitted to the European Commission on September 30, ESMA asked that the restrictions be expanded from trading to all stablecoin services that require a license—custody and transfers are included as well. This is different from what it said in January 2025, when it indicated that simple custody and transfers could be left in place. The problem now is that the proposal doesn’t specify an effective date, nor does it spell out how existing holders can get their coins out. Trading has been delisted, but the coins are still in custody accounts—what happens to these people? They’ll have to wait for later legislation to fill in the gaps. So I don’t think this means global stablecoin demand will be turned upside down; it’s more like the EU is tightening the service “gateways” within its own jurisdiction. Just a couple of days ago, Circle was still complaining to the European Commission that MiCA’s bank deposit requirements are too strict. Seen together, these two issues suggest that Europe’s rule set is pushing issuers and service providers alike toward the wall. Next, I’ll be watching how the European Commission responds to this opinion—especially whether exit provisions will be added.
The EU wants to clear non-compliant stablecoins out of custody as well, but the exit rules haven’t been written yet
To put it plainly, what changes here is this: in the EU, non-compliant stablecoins may not even be allowed to sit “in custody.” In an opinion submitted to the European Commission on September 30, ESMA asked that the restrictions be expanded from trading to all stablecoin services that require a license—custody and transfers are included as well. This is different from what it said in January 2025, when it indicated that simple custody and transfers could be left in place. The problem now is that the proposal doesn’t specify an effective date, nor does it spell out how existing holders can get their coins out. Trading has been delisted, but the coins are still in custody accounts—what happens to these people? They’ll have to wait for later legislation to fill in the gaps. So I don’t think this means global stablecoin demand will be turned upside down; it’s more like the EU is tightening the service “gateways” within its own jurisdiction. Just a couple of days ago, Circle was still complaining to the European Commission that MiCA’s bank deposit requirements are too strict. Seen together, these two issues suggest that Europe’s rule set is pushing issuers and service providers alike toward the wall. Next, I’ll be watching how the European Commission responds to this opinion—especially whether exit provisions will be added.
40
·
--

Article
Arbitrum pauses newly activated Stylus—what’s truly frozen is the upgrade path, not fundsArbitrum pauses the newly activated Stylus: it’s not the users’ funds that are frozen, but the availability of the new program. What I care about most is the governance trade-off exposed by this move: the Security Committee chose to tighten an executable path before the attack occurred, at the cost of preventing developers from getting the new version of the code to truly run. The official line is that the known Stylus flaw mainly threatens the activity of certain attack chains—such as denial of service—and that no attack has been found that would steal users’ funds. The trigger was a hand-written WebAssembly program constructed with AI assistance that bypassed the standard compiler toolchain. The activated program can still be called before it expires; keepalive renewal is unaffected. The deployment and execution of ordinary Solidity contracts proceed as usual, so this is not a full shutdown. Another easy-to-overlook detail is the accompanying proof conflict protection: once a conflicting proof is accepted, Ethereum settlement on Arbitrum One may be paused. Unconfirmed withdrawals would be delayed, while the chain itself continues to produce blocks. In other words, the risk shifts from fund safety to the time cost of exiting and upgrading. Meanwhile, ETH was down about -0.63% over the same 24 hours and trading volume clearly contracted, but this volatility is not enough to show causality with the event, so I won’t draw that conclusion. What to watch next is how long the pause lasts, and whether existing programs that need to be reactivated are forced to be interrupted.
Arbitrum pauses newly activated Stylus—what’s truly frozen is the upgrade path, not funds
Arbitrum pauses the newly activated Stylus: it’s not the users’ funds that are frozen, but the availability of the new program. What I care about most is the governance trade-off exposed by this move: the Security Committee chose to tighten an executable path before the attack occurred, at the cost of preventing developers from getting the new version of the code to truly run. The official line is that the known Stylus flaw mainly threatens the activity of certain attack chains—such as denial of service—and that no attack has been found that would steal users’ funds. The trigger was a hand-written WebAssembly program constructed with AI assistance that bypassed the standard compiler toolchain. The activated program can still be called before it expires; keepalive renewal is unaffected. The deployment and execution of ordinary Solidity contracts proceed as usual, so this is not a full shutdown. Another easy-to-overlook detail is the accompanying proof conflict protection: once a conflicting proof is accepted, Ethereum settlement on Arbitrum One may be paused. Unconfirmed withdrawals would be delayed, while the chain itself continues to produce blocks. In other words, the risk shifts from fund safety to the time cost of exiting and upgrading. Meanwhile, ETH was down about -0.63% over the same 24 hours and trading volume clearly contracted, but this volatility is not enough to show causality with the event, so I won’t draw that conclusion. What to watch next is how long the pause lasts, and whether existing programs that need to be reactivated are forced to be interrupted.
1
242
·
--

Article
BTC Retraces to the $84,000 Fibonacci Level: Short-Term Momentum Weakens, but Structure Remains IntactAfter Bitcoin surged to $87,220, it failed to hold its ground and then fell back to around $84,000. A Binance spot snapshot shows the price at about $84,601, down 1.97% over the past 24 hours, with an intraday range of nearly 4%. This pullback has brought the price close to the key 61.8% Fibonacci retracement level at $84,012—within the larger range from $126,294 to $57,877—so this level itself has become the focal point of a tug-of-war between bulls and bears.
On the momentum front, things are indeed cooling off. The daily RSI is 60.69—still above 50—but it has fallen below the 64.92 moving average, indicating that upward strength is weakening rather than turning into a reversal. Aroon Up is 21.43% and Aroon Down is 0%; both readings are relatively low, which corresponds to price oscillating between recent highs and prior lows instead of forming a one-direction trend.
BTC Retraces to the $84,000 Fibonacci Level: Short-Term Momentum Weakens, but Structure Remains Intact
After Bitcoin surged to $87,220, it failed to hold its ground and then fell back to around $84,000. A Binance spot snapshot shows the price at about $84,601, down 1.97% over the past 24 hours, with an intraday range of nearly 4%. This pullback has brought the price close to the key 61.8% Fibonacci retracement level at $84,012—within the larger range from $126,294 to $57,877—so this level itself has become the focal point of a tug-of-war between bulls and bears.
On the momentum front, things are indeed cooling off. The daily RSI is 60.69—still above 50—but it has fallen below the 64.92 moving average, indicating that upward strength is weakening rather than turning into a reversal. Aroon Up is 21.43% and Aroon Down is 0%; both readings are relatively low, which corresponds to price oscillating between recent highs and prior lows instead of forming a one-direction trend.
On the momentum front, things are indeed cooling off. The daily RSI is 60.69—still above 50—but it has fallen below the 64.92 moving average, indicating that upward strength is weakening rather than turning into a reversal. Aroon Up is 21.43% and Aroon Down is 0%; both readings are relatively low, which corresponds to price oscillating between recent highs and prior lows instead of forming a one-direction trend.
43
·
--

Article
Bitcoin retraces to $84k; ETF buying returns, but $86.5k is the key testAfter Bitcoin touched $87,220 on October 2 and then fell back to around $84,000, Binance’s spot latest quote is $84,648, down 1.56% over the past 24 hours. The intraday range is close to 4%. This pullback comes amid renewed ETF fund inflows. Bitfinex analyst sees $86.5k as the level that needs continuous spot buying to hold, and noted that as of September 30, 1.39 million BTC were concentrated in the $84.0k–$86.5k buy zone. In other words, this range is both where earlier positions are densely clustered and the watershed for short-term battles between bulls and bears.
On the funding front, U.S. spot Bitcoin ETFs saw net inflows of $170.2 million on October 1, after net outflows of about $149 million on the previous trading day. The day-to-day reversal suggests institutional demand has not disappeared, though its durability still needs to be monitored. Bitfinex also cautioned that if the price remains below $81.3k and ETFs continue to see net outflows, the market structure could weaken. This assessment is not far from current levels, implying a relatively high risk of amplified short-term volatility.
Bitcoin retraces to $84k; ETF buying returns, but $86.5k is the key test
After Bitcoin touched $87,220 on October 2 and then fell back to around $84,000, Binance’s spot latest quote is $84,648, down 1.56% over the past 24 hours. The intraday range is close to 4%. This pullback comes amid renewed ETF fund inflows. Bitfinex analyst sees $86.5k as the level that needs continuous spot buying to hold, and noted that as of September 30, 1.39 million BTC were concentrated in the $84.0k–$86.5k buy zone. In other words, this range is both where earlier positions are densely clustered and the watershed for short-term battles between bulls and bears.
On the funding front, U.S. spot Bitcoin ETFs saw net inflows of $170.2 million on October 1, after net outflows of about $149 million on the previous trading day. The day-to-day reversal suggests institutional demand has not disappeared, though its durability still needs to be monitored. Bitfinex also cautioned that if the price remains below $81.3k and ETFs continue to see net outflows, the market structure could weaken. This assessment is not far from current levels, implying a relatively high risk of amplified short-term volatility.
On the funding front, U.S. spot Bitcoin ETFs saw net inflows of $170.2 million on October 1, after net outflows of about $149 million on the previous trading day. The day-to-day reversal suggests institutional demand has not disappeared, though its durability still needs to be monitored. Bitfinex also cautioned that if the price remains below $81.3k and ETFs continue to see net outflows, the market structure could weaken. This assessment is not far from current levels, implying a relatively high risk of amplified short-term volatility.
132
·
--

Article
Federal Reserve Bank of San Francisco: Stablecoin Issuers Increased Their Holdings of U.S. Treasuries by About $200 Billion in Five Years, More Than 40% of China’s Scale of ReductionsA study by the Federal Reserve Bank of San Francisco has found a slightly different role for stablecoins: they are not only a dollar conduit for the crypto market, but are also becoming buyers of U.S. Treasury securities. By the terms of this study, Tether and Circle increased their combined holdings of U.S. Treasuries and repurchase agreements by about $200 billion over the past five years. This incremental amount is more than 40% of the scale of China’s reduction of its holdings of U.S. Treasuries over the same period.
If you look over a longer time horizon, the holder structure for U.S. Treasuries has indeed been changing. Foreign investors held more than half of outstanding U.S. Treasuries around 2008, but by early 2026 that share has fallen to about 30%. The decline is even more pronounced among foreign official institutions: from nearly 100% in the 1970s to just slightly above 40% by early 2026. China’s holdings peaked at the end of 2013 and had more than halved by mid-2026. Meanwhile, stablecoin issuers’ holdings are approaching $200 billion.
Federal Reserve Bank of San Francisco: Stablecoin Issuers Increased Their Holdings of U.S. Treasuries by About $200 Billion in Five Years, More Than 40% of China’s Scale of Reductions
A study by the Federal Reserve Bank of San Francisco has found a slightly different role for stablecoins: they are not only a dollar conduit for the crypto market, but are also becoming buyers of U.S. Treasury securities. By the terms of this study, Tether and Circle increased their combined holdings of U.S. Treasuries and repurchase agreements by about $200 billion over the past five years. This incremental amount is more than 40% of the scale of China’s reduction of its holdings of U.S. Treasuries over the same period.
If you look over a longer time horizon, the holder structure for U.S. Treasuries has indeed been changing. Foreign investors held more than half of outstanding U.S. Treasuries around 2008, but by early 2026 that share has fallen to about 30%. The decline is even more pronounced among foreign official institutions: from nearly 100% in the 1970s to just slightly above 40% by early 2026. China’s holdings peaked at the end of 2013 and had more than halved by mid-2026. Meanwhile, stablecoin issuers’ holdings are approaching $200 billion.
If you look over a longer time horizon, the holder structure for U.S. Treasuries has indeed been changing. Foreign investors held more than half of outstanding U.S. Treasuries around 2008, but by early 2026 that share has fallen to about 30%. The decline is even more pronounced among foreign official institutions: from nearly 100% in the 1970s to just slightly above 40% by early 2026. China’s holdings peaked at the end of 2013 and had more than halved by mid-2026. Meanwhile, stablecoin issuers’ holdings are approaching $200 billion.
USDC+0.00%
TLTETF-0.26%
76
·
--

Article
BTC Falls Back to $84,500 After Breaking Through the $85,000 Sell Wall, Options Bets on $90,000 to $100,000On October 2, BTC briefly surged to $87,000 during the session, eating through the sell-wall near $85,000 that had repeatedly blocked prior advances. Glassnode said some orders were filled and the rest were canceled, so the sell-side limit order stack above was therefore thinned, but fresh resistance has since appeared again around $87,000. By the snapshot, the price had returned to $84,505. Over the past 24 hours it was down 0.29%, and over the past 4 hours it was up 0.29%. The 24-hour trading range was close to 4%. Trading volume value was up more than 50% from the previous day, suggesting this upswing came with clear turnover rather than a low-volume test.
CryptoQuant’s cumulative trend chart indicator has begun to narrow. This pattern appeared twice in 2025, and both times it was followed by a period of gains—once from April 17 to 20 for BTC around $84,000, after which it moved toward $109,000. With only two samples, it can’t serve as a reliable predictive tool, but together with improvements in market structure, it at least suggests current holdings are being absorbed rather than distributed.
BTC Falls Back to $84,500 After Breaking Through the $85,000 Sell Wall, Options Bets on $90,000 to $100,000
On October 2, BTC briefly surged to $87,000 during the session, eating through the sell-wall near $85,000 that had repeatedly blocked prior advances. Glassnode said some orders were filled and the rest were canceled, so the sell-side limit order stack above was therefore thinned, but fresh resistance has since appeared again around $87,000. By the snapshot, the price had returned to $84,505. Over the past 24 hours it was down 0.29%, and over the past 4 hours it was up 0.29%. The 24-hour trading range was close to 4%. Trading volume value was up more than 50% from the previous day, suggesting this upswing came with clear turnover rather than a low-volume test.
CryptoQuant’s cumulative trend chart indicator has begun to narrow. This pattern appeared twice in 2025, and both times it was followed by a period of gains—once from April 17 to 20 for BTC around $84,000, after which it moved toward $109,000. With only two samples, it can’t serve as a reliable predictive tool, but together with improvements in market structure, it at least suggests current holdings are being absorbed rather than distributed.
CryptoQuant’s cumulative trend chart indicator has begun to narrow. This pattern appeared twice in 2025, and both times it was followed by a period of gains—once from April 17 to 20 for BTC around $84,000, after which it moved toward $109,000. With only two samples, it can’t serve as a reliable predictive tool, but together with improvements in market structure, it at least suggests current holdings are being absorbed rather than distributed.
160
·
--
Partly True

Article
After employment data weakened, BTC spiked and then pulled back; macro transmission is still underwayThe U.S. September nonfarm payroll report was clearly weaker than expected. Market expectations for a rate hike in October were largely wiped out—this was the direct trigger for the shift in risk-asset sentiment in this round. After the news, BTC briefly surged and temporarily broke above $87,000, but then gave back the gains. Binance spot snapshots show the price returned to around $84,199. In the past 24 hours it fell slightly by 0.71%, and over the most recent 4 hours it dropped 1.74%. The 24-hour trading range was about 3.9%. This pattern of a spike followed by a pullback suggests that the macro positives were priced in quickly, but they did not translate into sustained buy-side support.
It is also worth noting that, over the same period, the yield on 10-year U.S. Treasuries actually edged slightly higher after weak employment data—this is not fully consistent with the typical transmission path of “weak data weighing down yields, which benefits risk assets.” With yields not moving lower in tandem, it means market disagreement over inflation and the policy path remains. As a result, the macro tailwind for BTC was discounted.
After employment data weakened, BTC spiked and then pulled back; macro transmission is still underway
The U.S. September nonfarm payroll report was clearly weaker than expected. Market expectations for a rate hike in October were largely wiped out—this was the direct trigger for the shift in risk-asset sentiment in this round. After the news, BTC briefly surged and temporarily broke above $87,000, but then gave back the gains. Binance spot snapshots show the price returned to around $84,199. In the past 24 hours it fell slightly by 0.71%, and over the most recent 4 hours it dropped 1.74%. The 24-hour trading range was about 3.9%. This pattern of a spike followed by a pullback suggests that the macro positives were priced in quickly, but they did not translate into sustained buy-side support.
It is also worth noting that, over the same period, the yield on 10-year U.S. Treasuries actually edged slightly higher after weak employment data—this is not fully consistent with the typical transmission path of “weak data weighing down yields, which benefits risk assets.” With yields not moving lower in tandem, it means market disagreement over inflation and the policy path remains. As a result, the macro tailwind for BTC was discounted.
It is also worth noting that, over the same period, the yield on 10-year U.S. Treasuries actually edged slightly higher after weak employment data—this is not fully consistent with the typical transmission path of “weak data weighing down yields, which benefits risk assets.” With yields not moving lower in tandem, it means market disagreement over inflation and the policy path remains. As a result, the macro tailwind for BTC was discounted.
507
·
--

Article
Bitcoin back to $86,000: driven by weak nonfarm data and short-squeeze pressureBitcoin today staged a clear rebound. The gain over the past 24 hours is about 2.3%. During the session it briefly broke above $87,000, before consolidating around $86,000. The direct trigger for this upswing came from U.S. employment data: September nonfarm payrolls added only 29,000 jobs, far below market expectations of 90,000. The unemployment rate rose from 4.1% to 4.2%, and August’s figure was also revised downward. After the data were released, market expectations for the Federal Reserve to hold rates steady at its October meeting further intensified. A week earlier, the odds of a rate hike were around 70%, but by October 1 they had fallen to around 23%. As a result, crypto assets that are sensitive to interest rates were given some breathing room.
Bitcoin back to $86,000: driven by weak nonfarm data and short-squeeze pressure
Bitcoin today staged a clear rebound. The gain over the past 24 hours is about 2.3%. During the session it briefly broke above $87,000, before consolidating around $86,000. The direct trigger for this upswing came from U.S. employment data: September nonfarm payrolls added only 29,000 jobs, far below market expectations of 90,000. The unemployment rate rose from 4.1% to 4.2%, and August’s figure was also revised downward. After the data were released, market expectations for the Federal Reserve to hold rates steady at its October meeting further intensified. A week earlier, the odds of a rate hike were around 70%, but by October 1 they had fallen to around 23%. As a result, crypto assets that are sensitive to interest rates were given some breathing room.
24
·
--

Article
BTC Hits $87,000: Shorts Liquidated $120 Million as Liquidity Thins AboveBTC squeezed out of the sell-wall near $85,000 this time, reaching a high of $86,857—its highest point since September 23—before pulling back to below $86,000. A Binance spot snapshot shows BTC at $86,390, up 2.89% over the past 24 hours. The 24-hour trading range is 4.21%, and the trading volume has expanded by about 4.3% versus the previous day, indicating that this breakout was not a low-volume attempt.
The main driver came from the derivatives side. In the past 24 hours, BTC liquidated short positions of about $122 million, and liquidations across the whole market totaled about $210 million. CoinGlass’s heatmap shows another batch of potential liquidation levels forming again above $87,300, meaning the fuel for forced short-covering has been pushed into a higher price band. Glassnode noted that after sell orders near $85,000 were absorbed, the limit orders above became thinner and upward resistance declined. This aligns with concurrent news related to rising perpetual futures funding rates and open interest, reflecting a rebound in leveraged long demand rather than a one-sided spot buying drive.
BTC Hits $87,000: Shorts Liquidated $120 Million as Liquidity Thins Above
BTC squeezed out of the sell-wall near $85,000 this time, reaching a high of $86,857—its highest point since September 23—before pulling back to below $86,000. A Binance spot snapshot shows BTC at $86,390, up 2.89% over the past 24 hours. The 24-hour trading range is 4.21%, and the trading volume has expanded by about 4.3% versus the previous day, indicating that this breakout was not a low-volume attempt.
The main driver came from the derivatives side. In the past 24 hours, BTC liquidated short positions of about $122 million, and liquidations across the whole market totaled about $210 million. CoinGlass’s heatmap shows another batch of potential liquidation levels forming again above $87,300, meaning the fuel for forced short-covering has been pushed into a higher price band. Glassnode noted that after sell orders near $85,000 were absorbed, the limit orders above became thinner and upward resistance declined. This aligns with concurrent news related to rising perpetual futures funding rates and open interest, reflecting a rebound in leveraged long demand rather than a one-sided spot buying drive.
The main driver came from the derivatives side. In the past 24 hours, BTC liquidated short positions of about $122 million, and liquidations across the whole market totaled about $210 million. CoinGlass’s heatmap shows another batch of potential liquidation levels forming again above $87,300, meaning the fuel for forced short-covering has been pushed into a higher price band. Glassnode noted that after sell orders near $85,000 were absorbed, the limit orders above became thinner and upward resistance declined. This aligns with concurrent news related to rising perpetual futures funding rates and open interest, reflecting a rebound in leveraged long demand rather than a one-sided spot buying drive.
209
·
--

Article
Fiserv digital asset platform goes live, with Solana handling the first bank stablecoin settlementFiserv announced on October 1 that its digital asset platform is officially live. The first use case is Roughrider Coin, issued by the Bank of North Dakota. More than 90 banks and credit unions in the state can connect to the platform through the Commercial Center system they already use. The platform currently covers the issuance, reserve management, custody, and settlement processes. The project was first made public in October 2025; at the time, it was planned to launch in 2026. Now, it’s considered to have entered the production environment on schedule.
In terms of responsibilities, VersaBank USA serves as the issuer and directly handles minting, burning, custody, and USD reserve services; Fireblocks provides institutional wallets and tokenization infrastructure; and Solana is responsible for processing on-chain transactions. It’s worth noting that the Bank of North Dakota has clearly stated that Roughrider Coin is not intended for the general public or individual investors. It is positioned as an interbank settlement tool, not a stablecoin for retail users.
Fiserv digital asset platform goes live, with Solana handling the first bank stablecoin settlement
Fiserv announced on October 1 that its digital asset platform is officially live. The first use case is Roughrider Coin, issued by the Bank of North Dakota. More than 90 banks and credit unions in the state can connect to the platform through the Commercial Center system they already use. The platform currently covers the issuance, reserve management, custody, and settlement processes. The project was first made public in October 2025; at the time, it was planned to launch in 2026. Now, it’s considered to have entered the production environment on schedule.
In terms of responsibilities, VersaBank USA serves as the issuer and directly handles minting, burning, custody, and USD reserve services; Fireblocks provides institutional wallets and tokenization infrastructure; and Solana is responsible for processing on-chain transactions. It’s worth noting that the Bank of North Dakota has clearly stated that Roughrider Coin is not intended for the general public or individual investors. It is positioned as an interbank settlement tool, not a stablecoin for retail users.
In terms of responsibilities, VersaBank USA serves as the issuer and directly handles minting, burning, custody, and USD reserve services; Fireblocks provides institutional wallets and tokenization infrastructure; and Solana is responsible for processing on-chain transactions. It’s worth noting that the Bank of North Dakota has clearly stated that Roughrider Coin is not intended for the general public or individual investors. It is positioned as an interbank settlement tool, not a stablecoin for retail users.
64
·
--
Article
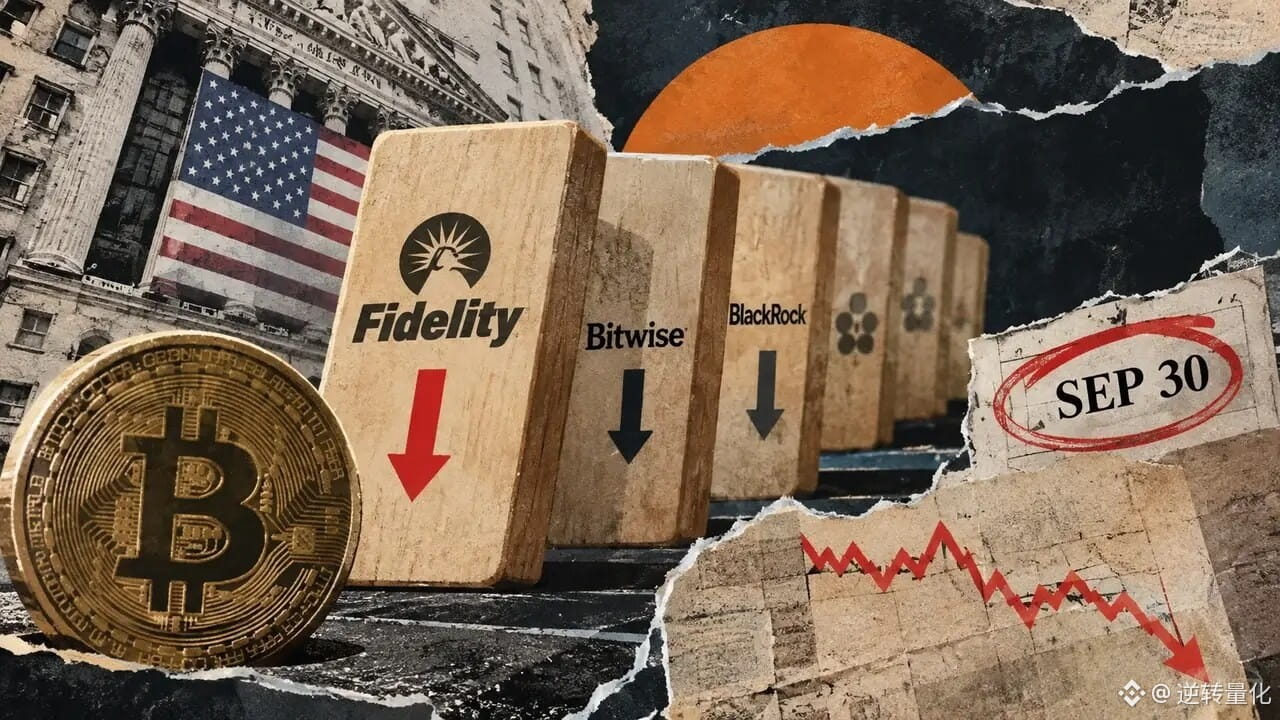
Bitcoin ETFs had a single-day net outflow of $148.7 million; cumulative inflows are still about $5 billion short of the historical peakOn September 30, the U.S. spot Bitcoin ETF recorded a net outflow of $148.7 million, ending the prior streak of nine consecutive trading days of net inflows. This round of inflows totaled about $3.08 billion and at one point pulled the year-to-date net inflows back into positive territory. Therefore, this reversal looks more like the first pause in a recovery process rather than a full trend reversal.
Structurally, the redemptions were concentrated in a small number of products. Fidelity’s FBTC saw an outflow of $125.6 million, Bitwise’s BITB outflow was $13.6 million, and BlackRock’s IBIT outflow was $9.5 million; the net flows of the other nine funds were zero. This distribution suggests that the selling pressure is not a synchronized pullback across the entire industry, but instead concentrated rebalancing through specific channels.
Bitcoin ETFs had a single-day net outflow of $148.7 million; cumulative inflows are still about $5 billion short of the historical peak
On September 30, the U.S. spot Bitcoin ETF recorded a net outflow of $148.7 million, ending the prior streak of nine consecutive trading days of net inflows. This round of inflows totaled about $3.08 billion and at one point pulled the year-to-date net inflows back into positive territory. Therefore, this reversal looks more like the first pause in a recovery process rather than a full trend reversal.
Structurally, the redemptions were concentrated in a small number of products. Fidelity’s FBTC saw an outflow of $125.6 million, Bitwise’s BITB outflow was $13.6 million, and BlackRock’s IBIT outflow was $9.5 million; the net flows of the other nine funds were zero. This distribution suggests that the selling pressure is not a synchronized pullback across the entire industry, but instead concentrated rebalancing through specific channels.
Structurally, the redemptions were concentrated in a small number of products. Fidelity’s FBTC saw an outflow of $125.6 million, Bitwise’s BITB outflow was $13.6 million, and BlackRock’s IBIT outflow was $9.5 million; the net flows of the other nine funds were zero. This distribution suggests that the selling pressure is not a synchronized pullback across the entire industry, but instead concentrated rebalancing through specific channels.
68
·
--

Article
$6.3 billion in net inflows into Bitcoin ETFs in Q3; BTC up about 43% in the same periodIn Q3, total net inflows into U.S. spot Bitcoin ETFs were approximately $6.34 billion. This is the strongest single-quarter performance for this type of product in 2026 and has essentially offset the estimated $5 billion net outflows from Q2. In the same period, Bitcoin rose 42.71%, marking the strongest quarterly increase since Q4 2024 and the best Q3 performance since 2017.
The flow of funds is not consistent. In July, inflows were only about $172 million; in August they expanded to $3.52 billion; and in September they fell back to $2.65 billion, a quarter-over-quarter decline of about 25%. On the last day of September, there was also an approximately $149 million net outflow, ending the previous streak of continuous net inflows totaling about $3.1 billion over the prior nine days. This suggests that the momentum of capital at quarter-end had weakened significantly compared with August.
$6.3 billion in net inflows into Bitcoin ETFs in Q3; BTC up about 43% in the same period
In Q3, total net inflows into U.S. spot Bitcoin ETFs were approximately $6.34 billion. This is the strongest single-quarter performance for this type of product in 2026 and has essentially offset the estimated $5 billion net outflows from Q2. In the same period, Bitcoin rose 42.71%, marking the strongest quarterly increase since Q4 2024 and the best Q3 performance since 2017.
The flow of funds is not consistent. In July, inflows were only about $172 million; in August they expanded to $3.52 billion; and in September they fell back to $2.65 billion, a quarter-over-quarter decline of about 25%. On the last day of September, there was also an approximately $149 million net outflow, ending the previous streak of continuous net inflows totaling about $3.1 billion over the prior nine days. This suggests that the momentum of capital at quarter-end had weakened significantly compared with August.
The flow of funds is not consistent. In July, inflows were only about $172 million; in August they expanded to $3.52 billion; and in September they fell back to $2.65 billion, a quarter-over-quarter decline of about 25%. On the last day of September, there was also an approximately $149 million net outflow, ending the previous streak of continuous net inflows totaling about $3.1 billion over the prior nine days. This suggests that the momentum of capital at quarter-end had weakened significantly compared with August.
58
·
--

Article
Bitcoin ETF sees 9 consecutive days of net inflows, matching August’s record; BTC trades sideways near $83.5万Bitcoin spot ETF recorded a net inflow of $66 million on Tuesday, extending the streak of consecutive net inflow days to 9—matching the record from August—and surpassing August’s performance in terms of cumulative amount. This is a verifiable signal of the continuity of this round’s capital flows, indicating that allocation-based funds have not noticeably withdrawn amid recent price oscillations.
Looking at the market action during the same period, BTC was at $83,520 at the snapshot time. Over the past 24 hours it rose only slightly by 0.09%, was nearly flat over the past hour, fell modestly by 0.28% over the past 4 hours, had a 24-hour trading range of 3.25%, and saw trading volume of about $1.556 billion—up more than 40% versus the previous day. In other words, continuous net inflows into the ETF coincided with price moving sideways; the inflows did not translate into clear price elasticity in the same period. Therefore, the two can only be viewed as parallel facts and cannot be directly attributed to one another.
Bitcoin ETF sees 9 consecutive days of net inflows, matching August’s record; BTC trades sideways near $83.5万
Bitcoin spot ETF recorded a net inflow of $66 million on Tuesday, extending the streak of consecutive net inflow days to 9—matching the record from August—and surpassing August’s performance in terms of cumulative amount. This is a verifiable signal of the continuity of this round’s capital flows, indicating that allocation-based funds have not noticeably withdrawn amid recent price oscillations.
Looking at the market action during the same period, BTC was at $83,520 at the snapshot time. Over the past 24 hours it rose only slightly by 0.09%, was nearly flat over the past hour, fell modestly by 0.28% over the past 4 hours, had a 24-hour trading range of 3.25%, and saw trading volume of about $1.556 billion—up more than 40% versus the previous day. In other words, continuous net inflows into the ETF coincided with price moving sideways; the inflows did not translate into clear price elasticity in the same period. Therefore, the two can only be viewed as parallel facts and cannot be directly attributed to one another.
Looking at the market action during the same period, BTC was at $83,520 at the snapshot time. Over the past 24 hours it rose only slightly by 0.09%, was nearly flat over the past hour, fell modestly by 0.28% over the past 4 hours, had a 24-hour trading range of 3.25%, and saw trading volume of about $1.556 billion—up more than 40% versus the previous day. In other words, continuous net inflows into the ETF coincided with price moving sideways; the inflows did not translate into clear price elasticity in the same period. Therefore, the two can only be viewed as parallel facts and cannot be directly attributed to one another.
63
·
--

Article
Bitcoin ETFs record a nine-day inflow streak totaling $3.1 billion, while Ethereum funds turn to net outflowsU.S. spot Bitcoin ETFs extended net inflows to nine consecutive trading days. Meanwhile, Ethereum and Zcash funds turned to net outflows, and there was clear divergence of flows within crypto ETFs.
According to SoSoValue data, on Tuesday Bitcoin ETFs attracted $66.2 million, bringing this streak of consecutive inflows to about $3.1 billion. Net inflows for the year rose to roughly $1.0 billion. After seven straight days of attracting capital, Ethereum spot ETFs recorded about a $3.0 million net outflow on Tuesday. In the prior seven days, cumulative inflows exceeded $851 million, bringing cumulative net inflows to about $14.0 billion. The Zcash ETF ended a six-day inflow streak with a net outflow of $8.0 million on Monday.
Bitcoin ETFs record a nine-day inflow streak totaling $3.1 billion, while Ethereum funds turn to net outflows
U.S. spot Bitcoin ETFs extended net inflows to nine consecutive trading days. Meanwhile, Ethereum and Zcash funds turned to net outflows, and there was clear divergence of flows within crypto ETFs.
According to SoSoValue data, on Tuesday Bitcoin ETFs attracted $66.2 million, bringing this streak of consecutive inflows to about $3.1 billion. Net inflows for the year rose to roughly $1.0 billion. After seven straight days of attracting capital, Ethereum spot ETFs recorded about a $3.0 million net outflow on Tuesday. In the prior seven days, cumulative inflows exceeded $851 million, bringing cumulative net inflows to about $14.0 billion. The Zcash ETF ended a six-day inflow streak with a net outflow of $8.0 million on Monday.
According to SoSoValue data, on Tuesday Bitcoin ETFs attracted $66.2 million, bringing this streak of consecutive inflows to about $3.1 billion. Net inflows for the year rose to roughly $1.0 billion. After seven straight days of attracting capital, Ethereum spot ETFs recorded about a $3.0 million net outflow on Tuesday. In the prior seven days, cumulative inflows exceeded $851 million, bringing cumulative net inflows to about $14.0 billion. The Zcash ETF ended a six-day inflow streak with a net outflow of $8.0 million on Monday.
59
·
--

Article
Bitcoin holds the $82.5K support as the 30-year US Treasury yield hits a 24-year highBitcoin held onto key support amid a surge in long-term US Treasury yields. During Tuesday’s session, BTC/USD traded in a tight range below $84.3K without breaking below $82.5K; this level, according to trader Rekt Capital, is seen as crucial for protecting the upside trend. In the same period, the yield on US 30-year Treasuries topped 5.58%, the highest since June 2002, before easing back to 5.55%. The 10-year yield reached 5.26%, the highest since June 2007.
This round of rising yields came against the backdrop of the US-Iran conflict and uncertainty around global oil supply, weighing on risk assets overall on Monday. QCP Capital cited geopolitical developments and this week’s US macro data as the main drivers of near-term volatility, including Wednesday’s August PCE and Friday’s September nonfarm payrolls.
Bitcoin holds the $82.5K support as the 30-year US Treasury yield hits a 24-year high
Bitcoin held onto key support amid a surge in long-term US Treasury yields. During Tuesday’s session, BTC/USD traded in a tight range below $84.3K without breaking below $82.5K; this level, according to trader Rekt Capital, is seen as crucial for protecting the upside trend. In the same period, the yield on US 30-year Treasuries topped 5.58%, the highest since June 2002, before easing back to 5.55%. The 10-year yield reached 5.26%, the highest since June 2007.
This round of rising yields came against the backdrop of the US-Iran conflict and uncertainty around global oil supply, weighing on risk assets overall on Monday. QCP Capital cited geopolitical developments and this week’s US macro data as the main drivers of near-term volatility, including Wednesday’s August PCE and Friday’s September nonfarm payrolls.
This round of rising yields came against the backdrop of the US-Iran conflict and uncertainty around global oil supply, weighing on risk assets overall on Monday. QCP Capital cited geopolitical developments and this week’s US macro data as the main drivers of near-term volatility, including Wednesday’s August PCE and Friday’s September nonfarm payrolls.
BTC+0.34%
TLTETF-0.26%
68
·
--

Article
Bitcoin gives back gains: long-term holder selling pressure keeps the $85,000 level from being breachedAccording to a report by Cointelegraph on September 29, 2026, Bitcoin failed to break through $85,000 again. Sellers have continued to place sell orders above the current price to keep it suppressed, while rising U.S. Treasury yields dragged down both the stock market and precious metals.
For crypto readers, the key point of this news is not the price itself, but that “long-term holder supply” has been identified as one of the reasons why the $85,000 level is difficult to break. This implies there is ongoing sell pressure from older coins above, rather than simply a lack of buying demand; however, the exact size and distribution of this supply data still needs to be confirmed. The original text also mentions the linkage between Treasury yields and the stock market and precious metals, which is a cross-market backdrop and cannot be directly inferred as an independent negative factor for Bitcoin.
Bitcoin gives back gains: long-term holder selling pressure keeps the $85,000 level from being breached
According to a report by Cointelegraph on September 29, 2026, Bitcoin failed to break through $85,000 again. Sellers have continued to place sell orders above the current price to keep it suppressed, while rising U.S. Treasury yields dragged down both the stock market and precious metals.
For crypto readers, the key point of this news is not the price itself, but that “long-term holder supply” has been identified as one of the reasons why the $85,000 level is difficult to break. This implies there is ongoing sell pressure from older coins above, rather than simply a lack of buying demand; however, the exact size and distribution of this supply data still needs to be confirmed. The original text also mentions the linkage between Treasury yields and the stock market and precious metals, which is a cross-market backdrop and cannot be directly inferred as an independent negative factor for Bitcoin.
For crypto readers, the key point of this news is not the price itself, but that “long-term holder supply” has been identified as one of the reasons why the $85,000 level is difficult to break. This implies there is ongoing sell pressure from older coins above, rather than simply a lack of buying demand; however, the exact size and distribution of this supply data still needs to be confirmed. The original text also mentions the linkage between Treasury yields and the stock market and precious metals, which is a cross-market backdrop and cannot be directly inferred as an independent negative factor for Bitcoin.
119
·
--

Article
Bitcoin ETFs See Eight Straight Days of Net Inflows, Pulling in $295 Million Over 30 DaysAccording to a report by decrypt.co on September 29, 2026, Bitcoin ETFs extended net capital inflows to eight consecutive days on Monday, increasing by $2.95 billion over the past 30 days, rebounding clearly from the selloff triggered by the Clarity Act.
For crypto readers, the key point in this set of data is whether ETF fund flows have recovered from the shock of policy news. Eight consecutive days of net inflows indicate that allocation-driven capital is still moving in, but the report does not disclose the distribution of inflows by day, each fund’s specific contribution, or the outflow size during the Clarity Act selloff—so the rebound’s strength and durability still need to be confirmed.
Bitcoin ETFs See Eight Straight Days of Net Inflows, Pulling in $295 Million Over 30 Days
According to a report by decrypt.co on September 29, 2026, Bitcoin ETFs extended net capital inflows to eight consecutive days on Monday, increasing by $2.95 billion over the past 30 days, rebounding clearly from the selloff triggered by the Clarity Act.
For crypto readers, the key point in this set of data is whether ETF fund flows have recovered from the shock of policy news. Eight consecutive days of net inflows indicate that allocation-driven capital is still moving in, but the report does not disclose the distribution of inflows by day, each fund’s specific contribution, or the outflow size during the Clarity Act selloff—so the rebound’s strength and durability still need to be confirmed.
For crypto readers, the key point in this set of data is whether ETF fund flows have recovered from the shock of policy news. Eight consecutive days of net inflows indicate that allocation-driven capital is still moving in, but the report does not disclose the distribution of inflows by day, each fund’s specific contribution, or the outflow size during the Clarity Act selloff—so the rebound’s strength and durability still need to be confirmed.
4
·
--
Coinbase Ventures and CMCC Global Strategically Invest in Prediction-Market Market Maker RavenAccording to CNBC’s report on September 29, 2026, Coinbase Ventures and CMCC Global have completed a strategic investment in Raven, though the amount was not disclosed. Raven is an institutional market maker for prediction markets, providing liquidity to contracts by continuously placing buy and sell orders.
For crypto readers, what is worth paying attention to is that prediction markets are attracting institutional-grade market-making infrastructure players, and Coinbase Ventures’ involvement signals that leading exchange ecosystems are focusing on this space. However, the valuation, terms, and the current contract scale covered by Raven from this round of financing have not been disclosed, and whether it can truly improve the depth and bid-ask spreads of prediction markets remains to be confirmed.
Coinbase Ventures and CMCC Global Strategically Invest in Prediction-Market Market Maker Raven
According to CNBC’s report on September 29, 2026, Coinbase Ventures and CMCC Global have completed a strategic investment in Raven, though the amount was not disclosed. Raven is an institutional market maker for prediction markets, providing liquidity to contracts by continuously placing buy and sell orders.
For crypto readers, what is worth paying attention to is that prediction markets are attracting institutional-grade market-making infrastructure players, and Coinbase Ventures’ involvement signals that leading exchange ecosystems are focusing on this space. However, the valuation, terms, and the current contract scale covered by Raven from this round of financing have not been disclosed, and whether it can truly improve the depth and bid-ask spreads of prediction markets remains to be confirmed.
For crypto readers, what is worth paying attention to is that prediction markets are attracting institutional-grade market-making infrastructure players, and Coinbase Ventures’ involvement signals that leading exchange ecosystems are focusing on this space. However, the valuation, terms, and the current contract scale covered by Raven from this round of financing have not been disclosed, and whether it can truly improve the depth and bid-ask spreads of prediction markets remains to be confirmed.
6
·
--
Federal Reserve Chair Waller’s speech at Jackson Hole delivered a clear hawkish signal, and market expectations for a September rate hike accordingly intensified. This stance may imply that the Fed will adopt a more tightening monetary policy than previously, to address inflationary pressures.
This hawkish position directly affected the FX market: after the news was released, the euro fell 0.53% against the U.S. dollar to 1.1594, reflecting heightened expectations for a stronger dollar. If the Fed raises rates, the appeal of dollar-denominated assets would increase, and capital could move from the euro area to the United States, further weighing on the euro.
However, Waller’s hawkish stance could also create friction between the Fed and the Treasury. The Treasury may be more focused on economic growth and debt costs, while the Fed prioritizes controlling inflation. This policy divergence could increase market volatility, and investors should watch for signals of subsequent policy coordination.
Next, it is advisable to pay attention to economic data ahead of the September FOMC meeting—especially inflation and employment figures—as well as any further remarks by Fed officials. If inflation data comes in above expectations, the probability of a rate hike may rise further; if the data is weak, hawkish expectations could cool. In addition, investors should monitor interactions between the Treasury and the Fed, as any signs of policy coordination could shift market expectations.
Federal Reserve Chair Waller’s speech at Jackson Hole delivered a clear hawkish signal, and market expectations for a September rate hike accordingly intensified. This stance may imply that the Fed will adopt a more tightening monetary policy than previously, to address inflationary pressures.
This hawkish position directly affected the FX market: after the news was released, the euro fell 0.53% against the U.S. dollar to 1.1594, reflecting heightened expectations for a stronger dollar. If the Fed raises rates, the appeal of dollar-denominated assets would increase, and capital could move from the euro area to the United States, further weighing on the euro.
However, Waller’s hawkish stance could also create friction between the Fed and the Treasury. The Treasury may be more focused on economic growth and debt costs, while the Fed prioritizes controlling inflation. This policy divergence could increase market volatility, and investors should watch for signals of subsequent policy coordination.
Next, it is advisable to pay attention to economic data ahead of the September FOMC meeting—especially inflation and employment figures—as well as any further remarks by Fed officials. If inflation data comes in above expectations, the probability of a rate hike may rise further; if the data is weak, hawkish expectations could cool. In addition, investors should monitor interactions between the Treasury and the Fed, as any signs of policy coordination could shift market expectations.
This hawkish position directly affected the FX market: after the news was released, the euro fell 0.53% against the U.S. dollar to 1.1594, reflecting heightened expectations for a stronger dollar. If the Fed raises rates, the appeal of dollar-denominated assets would increase, and capital could move from the euro area to the United States, further weighing on the euro.
However, Waller’s hawkish stance could also create friction between the Fed and the Treasury. The Treasury may be more focused on economic growth and debt costs, while the Fed prioritizes controlling inflation. This policy divergence could increase market volatility, and investors should watch for signals of subsequent policy coordination.
Next, it is advisable to pay attention to economic data ahead of the September FOMC meeting—especially inflation and employment figures—as well as any further remarks by Fed officials. If inflation data comes in above expectations, the probability of a rate hike may rise further; if the data is weak, hawkish expectations could cool. In addition, investors should monitor interactions between the Treasury and the Fed, as any signs of policy coordination could shift market expectations.
8
·
--
Trump Threatens to Strike Iran’s Halek Island: New Variables for Oil Prices and Safe-Haven AssetsTrump once again threatened to strike Iran’s Halek Island oil hub, marking the latest escalation in tensions between the U.S. and Iran. Previously, the U.S. carried out a large-scale strike against Iran at the end of July, but this latest threat directly targets a key node in Iran’s oil exports, which could have a more immediate impact on global energy supplies.
Halek Island handles the majority of Iran’s crude oil exports. If it is attacked, the risk of a short-term supply disruption would rise sharply. The market may first react in oil prices—Brent crude could jump—while safe-haven assets such as gold and the U.S. dollar could strengthen. However, market data is still to be confirmed at present, though historical experience shows that such geopolitical events often increase volatility.
Trump Threatens to Strike Iran’s Halek Island: New Variables for Oil Prices and Safe-Haven Assets
Trump once again threatened to strike Iran’s Halek Island oil hub, marking the latest escalation in tensions between the U.S. and Iran. Previously, the U.S. carried out a large-scale strike against Iran at the end of July, but this latest threat directly targets a key node in Iran’s oil exports, which could have a more immediate impact on global energy supplies.
Halek Island handles the majority of Iran’s crude oil exports. If it is attacked, the risk of a short-term supply disruption would rise sharply. The market may first react in oil prices—Brent crude could jump—while safe-haven assets such as gold and the U.S. dollar could strengthen. However, market data is still to be confirmed at present, though historical experience shows that such geopolitical events often increase volatility.
Halek Island handles the majority of Iran’s crude oil exports. If it is attacked, the risk of a short-term supply disruption would rise sharply. The market may first react in oil prices—Brent crude could jump—while safe-haven assets such as gold and the U.S. dollar could strengthen. However, market data is still to be confirmed at present, though historical experience shows that such geopolitical events often increase volatility.
329
Log in to explore more content
Join global crypto users on Binance Square
⚡️ Get latest and useful information about crypto.
💬 Trusted by the world’s largest crypto exchange.
👍 Discover real insights from verified creators.
Email / Phone number
Trending Topics
ZcashETFPostsFirstWeeklyOutflow$93.6M
38,110 views
129 Discussing
#ZcashETFPostsFirstWeeklyOutflow$93.6M
🚨🚨🚨🚨🚨🚨🚨🚨🚨🚨🚨🚨🚨🚨✅ 🚨 ZCASH ETF FLOWS TURN NEGATIVE FOR THE FIRST TIME! 📉
$ZEC is facing a notable shift in institutional fund flows, with Zcash investment products recording their first weekly net outflow since launching in August.
According to fund-flow data, around $93.6M was withdrawn from Zcash products during the latest week, while ZEC price action also cooled significantly.
📊 WHAT HAPPENED?
• Weekly Zcash ETF outflow: $93.6M
• September 30 daily outflow: $30.25M
• ZCSH previously attracted around $98.2M in one week
• ZEC is trading near $1,300
• Recent high: around $1,690
• Weekly decline: roughly 17%+
🔍 LEVELS TO WATCH
🟢 Support: $1,280–$1,300
🔴 Resistance: $1,450–$1,500
The key question now is whether the $1,300 area can hold and attract fresh buyers.
Institutional flows will also be important. A return of consistent positive inflows could signal renewed confidence, while continued outflows may keep pressure on $ZEC .
👀 Is this simply profit-taking after ZEC’s huge rally, or could we see another deeper pullback before buyers return?
Share your view below. 👇
#Zcash #ZEC #ZcashETF #Crypto
#analysis
owhggwiohsjowve
·0 Likes
·173 views
GreekPoliceBustCryptoScamRingArrest17
88,602 views
743 Discussing
BitcoinRejectedAt$87K
127,564 views
184 Discussing