
Mr Crypto_ 加密先生
9.7k Posts

Mr Crypto_ 加密先生
Report
Block User
Crypto journey in progress 📈 Binance Square Creator | IT Professional • Trading, Learning, Building the Future

SOL Holder
Occasional Trader
2.8 Years
131 Following
29.5K+ Followers
13.8K+ Liked
Posts
All
Quotes
Videos
Live
**SOL: Institutional names are arriving. Real demand still has to prove it.**
BlackRock’s reserve vehicle and State Street’s SWEEP fund now sit on Solana. That should matter. Transactions need SOL for fees and validators need it staked. Network activity is large: 3.18B non-vote transactions in September, $146B in Q3 perps volume, and $14.1B in stablecoins. Activity alone is not value capture.
Public treasuries hold an estimated 18–19M SOL. Forward Industries alone has more than 7.5M. They buy and stake, but those tokens remain economically circulating. Staking still adds roughly 62K SOL a day while daily fees are closer to $353K with only a portion burned. The gap is real.
Q3 network revenue recovered to $75.7M. Application revenue hit $299M. At a $42.5B market cap that still prices in a lot of future growth. Alpenglow cut finality to ~150ms and bank pilots are starting, yet Western Union’s USDPT was only $8.8M in August and Zelle still lacks a firm date.
Price sits near $72.30 after a 35% drop from mid-October. First level to watch is $70. A close above $73.30 is the first green flag; $78–80 is the real recovery zone. A daily close under $67.41 weakens the structure toward the mid-$60s.
I am not chasing the bounce on institutional headlines. I want either a close above $78 with better ETF flows or a clear defence of $67. Infrastructure is improving. Economic demand still has to catch up.
$SOL
{future}(SOLUSDT)
**SOL: Institutional names are arriving. Real demand still has to prove it.**
BlackRock’s reserve vehicle and State Street’s SWEEP fund now sit on Solana. That should matter. Transactions need SOL for fees and validators need it staked. Network activity is large: 3.18B non-vote transactions in September, $146B in Q3 perps volume, and $14.1B in stablecoins. Activity alone is not value capture.
Public treasuries hold an estimated 18–19M SOL. Forward Industries alone has more than 7.5M. They buy and stake, but those tokens remain economically circulating. Staking still adds roughly 62K SOL a day while daily fees are closer to $353K with only a portion burned. The gap is real.
Q3 network revenue recovered to $75.7M. Application revenue hit $299M. At a $42.5B market cap that still prices in a lot of future growth. Alpenglow cut finality to ~150ms and bank pilots are starting, yet Western Union’s USDPT was only $8.8M in August and Zelle still lacks a firm date.
Price sits near $72.30 after a 35% drop from mid-October. First level to watch is $70. A close above $73.30 is the first green flag; $78–80 is the real recovery zone. A daily close under $67.41 weakens the structure toward the mid-$60s.
I am not chasing the bounce on institutional headlines. I want either a close above $78 with better ETF flows or a clear defence of $67. Infrastructure is improving. Economic demand still has to catch up.
$SOL
BlackRock’s reserve vehicle and State Street’s SWEEP fund now sit on Solana. That should matter. Transactions need SOL for fees and validators need it staked. Network activity is large: 3.18B non-vote transactions in September, $146B in Q3 perps volume, and $14.1B in stablecoins. Activity alone is not value capture.
Public treasuries hold an estimated 18–19M SOL. Forward Industries alone has more than 7.5M. They buy and stake, but those tokens remain economically circulating. Staking still adds roughly 62K SOL a day while daily fees are closer to $353K with only a portion burned. The gap is real.
Q3 network revenue recovered to $75.7M. Application revenue hit $299M. At a $42.5B market cap that still prices in a lot of future growth. Alpenglow cut finality to ~150ms and bank pilots are starting, yet Western Union’s USDPT was only $8.8M in August and Zelle still lacks a firm date.
Price sits near $72.30 after a 35% drop from mid-October. First level to watch is $70. A close above $73.30 is the first green flag; $78–80 is the real recovery zone. A daily close under $67.41 weakens the structure toward the mid-$60s.
I am not chasing the bounce on institutional headlines. I want either a close above $78 with better ETF flows or a clear defence of $67. Infrastructure is improving. Economic demand still has to catch up.
$SOL
193
**BTC is still working off leverage, not finding buyers.**
The bounce off $62K was mostly a flush. Around $2B got liquidated in 24 hours, roughly $750M of it in Bitcoin and nearly 90% longs. Open interest dropped into the $43-45B range and funding is barely positive. The crowd got cleaned out, but nobody is crowded short yet either. That means the next move won’t be forced the same way Friday’s was.
Price sits near $64,626, down about 13.5% from last Sunday and on track for a sixth straight lower weekly close. The rebound came on thin volume. First support is $62,000, then $60,000. Resistance starts at $65,600, then the $68-70K band.
Supply is almost fully issued — 20.11M of 21M coins are out. Fresh miner selling still hits a weak bid. Large wallets added coins over the past month, yet 30-day demand remains deeply negative and ETF outflows keep stacking. IBIT alone has carried most of the bleeding. Access exists. Real demand does not.
Extreme fear is here, same zone that appeared in spring and June. Those prints did not mark the floor on day one. Fear shows how people feel. Only actual buyers turn a bounce into a bottom.
Bullish trigger for me is a daily close above $66,500 with ETF flows flipping. Until then every bounce is a test. Bears still have the edge.
$BTC
{future}(BTCUSDT)
**BTC is still working off leverage, not finding buyers.**
The bounce off $62K was mostly a flush. Around $2B got liquidated in 24 hours, roughly $750M of it in Bitcoin and nearly 90% longs. Open interest dropped into the $43-45B range and funding is barely positive. The crowd got cleaned out, but nobody is crowded short yet either. That means the next move won’t be forced the same way Friday’s was.
Price sits near $64,626, down about 13.5% from last Sunday and on track for a sixth straight lower weekly close. The rebound came on thin volume. First support is $62,000, then $60,000. Resistance starts at $65,600, then the $68-70K band.
Supply is almost fully issued — 20.11M of 21M coins are out. Fresh miner selling still hits a weak bid. Large wallets added coins over the past month, yet 30-day demand remains deeply negative and ETF outflows keep stacking. IBIT alone has carried most of the bleeding. Access exists. Real demand does not.
Extreme fear is here, same zone that appeared in spring and June. Those prints did not mark the floor on day one. Fear shows how people feel. Only actual buyers turn a bounce into a bottom.
Bullish trigger for me is a daily close above $66,500 with ETF flows flipping. Until then every bounce is a test. Bears still have the edge.
$BTC
The bounce off $62K was mostly a flush. Around $2B got liquidated in 24 hours, roughly $750M of it in Bitcoin and nearly 90% longs. Open interest dropped into the $43-45B range and funding is barely positive. The crowd got cleaned out, but nobody is crowded short yet either. That means the next move won’t be forced the same way Friday’s was.
Price sits near $64,626, down about 13.5% from last Sunday and on track for a sixth straight lower weekly close. The rebound came on thin volume. First support is $62,000, then $60,000. Resistance starts at $65,600, then the $68-70K band.
Supply is almost fully issued — 20.11M of 21M coins are out. Fresh miner selling still hits a weak bid. Large wallets added coins over the past month, yet 30-day demand remains deeply negative and ETF outflows keep stacking. IBIT alone has carried most of the bleeding. Access exists. Real demand does not.
Extreme fear is here, same zone that appeared in spring and June. Those prints did not mark the floor on day one. Fear shows how people feel. Only actual buyers turn a bounce into a bottom.
Bullish trigger for me is a daily close above $66,500 with ETF flows flipping. Until then every bounce is a test. Bears still have the edge.
$BTC
273
**XAUT: Digital Gold with Physical Backing**
XAUT is not just another crypto token. Each unit represents one fine troy ounce of physical gold held in Swiss vaults as London Good Delivery bars. Reported reserves stand at roughly $3.44 billion (about 827,418 ounces), while circulating supply is around 749,420 tokens.
New tokens can only be issued against actual gold deposits, and redemptions work in reverse. This creates a direct link between token supply and physical reserves. Unlike most cryptocurrencies, its value rests on existing gold rather than future promises.
Important distinctions matter: rising reserve value can come from higher gold prices or new purchases—it does not automatically mean higher profits. Gold in custody generates no income for holders and is not a burn mechanism. Trading volume and open interest (currently high on futures) also do not equal earnings.
The core risks remain custody, issuer trust, and redemption reliability. Blockchain speed helps settlement, but the asset is only as strong as the gold and processes behind it.
As of mid-November 2026, XAUT trades near $3,870 with a market cap of about $2.89 billion. The key metrics to watch are actual gold additions, new issuance, circulating supply changes, and real redemption activity—not just partnerships or price moves.
$XAUT
{future}(XAUTUSDT)
**XAUT: Digital Gold with Physical Backing**
XAUT is not just another crypto token. Each unit represents one fine troy ounce of physical gold held in Swiss vaults as London Good Delivery bars. Reported reserves stand at roughly $3.44 billion (about 827,418 ounces), while circulating supply is around 749,420 tokens.
New tokens can only be issued against actual gold deposits, and redemptions work in reverse. This creates a direct link between token supply and physical reserves. Unlike most cryptocurrencies, its value rests on existing gold rather than future promises.
Important distinctions matter: rising reserve value can come from higher gold prices or new purchases—it does not automatically mean higher profits. Gold in custody generates no income for holders and is not a burn mechanism. Trading volume and open interest (currently high on futures) also do not equal earnings.
The core risks remain custody, issuer trust, and redemption reliability. Blockchain speed helps settlement, but the asset is only as strong as the gold and processes behind it.
As of mid-November 2026, XAUT trades near $3,870 with a market cap of about $2.89 billion. The key metrics to watch are actual gold additions, new issuance, circulating supply changes, and real redemption activity—not just partnerships or price moves.
$XAUT
XAUT is not just another crypto token. Each unit represents one fine troy ounce of physical gold held in Swiss vaults as London Good Delivery bars. Reported reserves stand at roughly $3.44 billion (about 827,418 ounces), while circulating supply is around 749,420 tokens.
New tokens can only be issued against actual gold deposits, and redemptions work in reverse. This creates a direct link between token supply and physical reserves. Unlike most cryptocurrencies, its value rests on existing gold rather than future promises.
Important distinctions matter: rising reserve value can come from higher gold prices or new purchases—it does not automatically mean higher profits. Gold in custody generates no income for holders and is not a burn mechanism. Trading volume and open interest (currently high on futures) also do not equal earnings.
The core risks remain custody, issuer trust, and redemption reliability. Blockchain speed helps settlement, but the asset is only as strong as the gold and processes behind it.
As of mid-November 2026, XAUT trades near $3,870 with a market cap of about $2.89 billion. The key metrics to watch are actual gold additions, new issuance, circulating supply changes, and real redemption activity—not just partnerships or price moves.
$XAUT
250
Market went LONG, trader went WRONG 😂”
Market went LONG, trader went WRONG 😂”

Gaza47
·
--
BullishGo To Long And Long
$AKE
#NextMestic
#DoubleMind
#FulAndFinal
$AKE
#NextMestic
#DoubleMind
#FulAndFinal
126
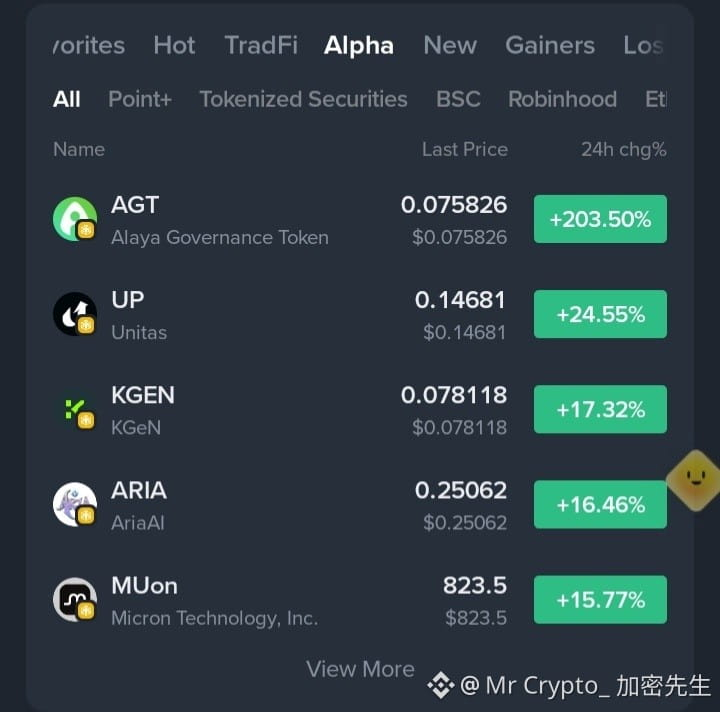
🔥 Binance Alpha: $AGT Explodes 203% as Altcoins Heat Up!
$UP $ARIA
🔥 Binance Alpha: $AGT Explodes 203% as Altcoins Heat Up!
$UP $ARIA
$UP $ARIA
959
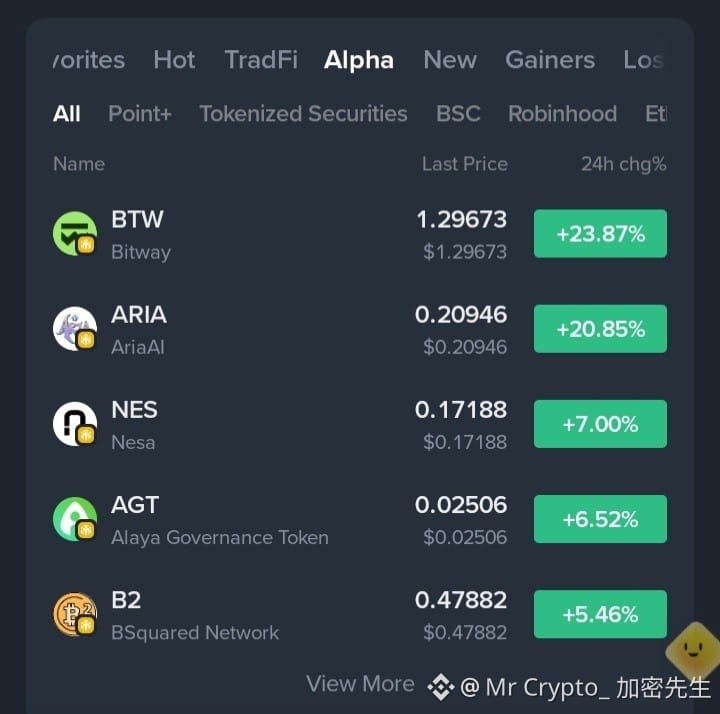
BTW, ARIA, NES & AGT Are Moving. Opportunity or Trap?
$BTW $ARIA $NES
BTW, ARIA, NES & AGT Are Moving. Opportunity or Trap?
$BTW $ARIA $NES
$BTW $ARIA $NES
842
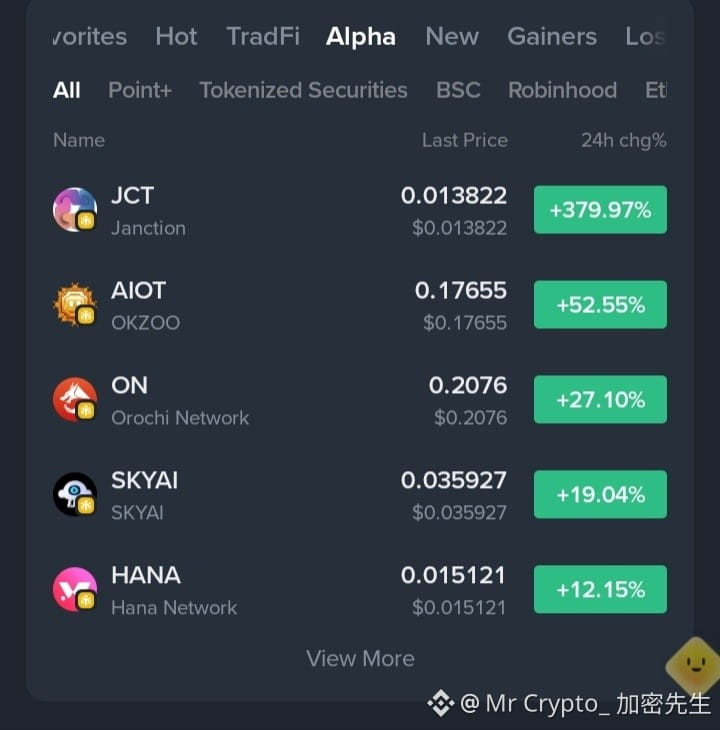
BINANCE ALPHA GAINERS....
$JCT $ON $SKYAI
BINANCE ALPHA GAINERS....
$JCT $ON $SKYAI
$JCT $ON $SKYAI
161
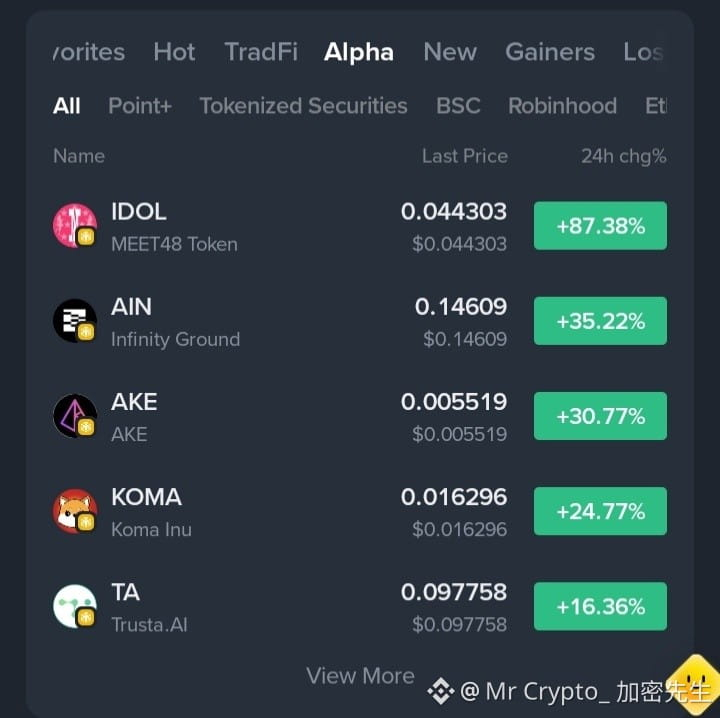
ALPHA RADAR — WHAT OTHERS MISS
$IDOL $AIN $AKE
ALPHA RADAR — WHAT OTHERS MISS
$IDOL $AIN $AKE
$IDOL $AIN $AKE
821
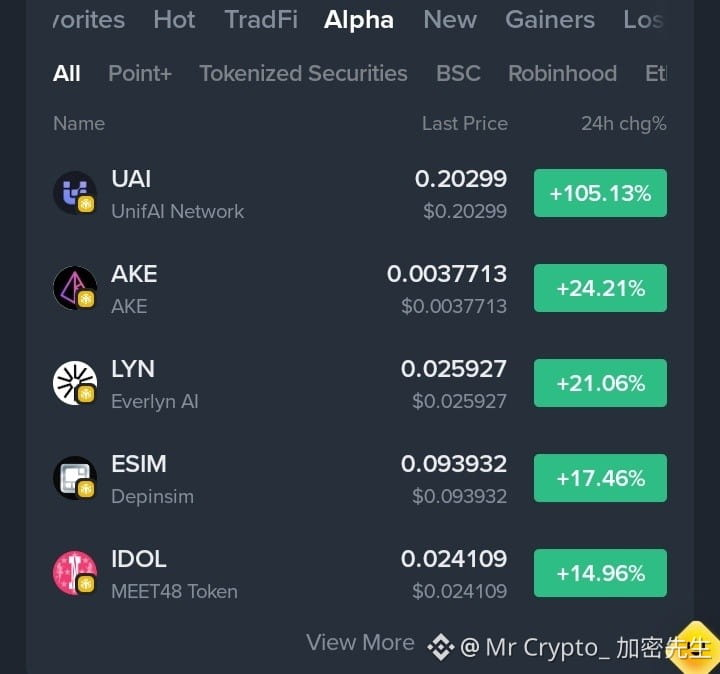
TOP ALPHA— UNDER THE MICROSCOPE
$UAI $AKE $LYN
TOP ALPHA— UNDER THE MICROSCOPE
$UAI $AKE $LYN
$UAI $AKE $LYN
1.3k
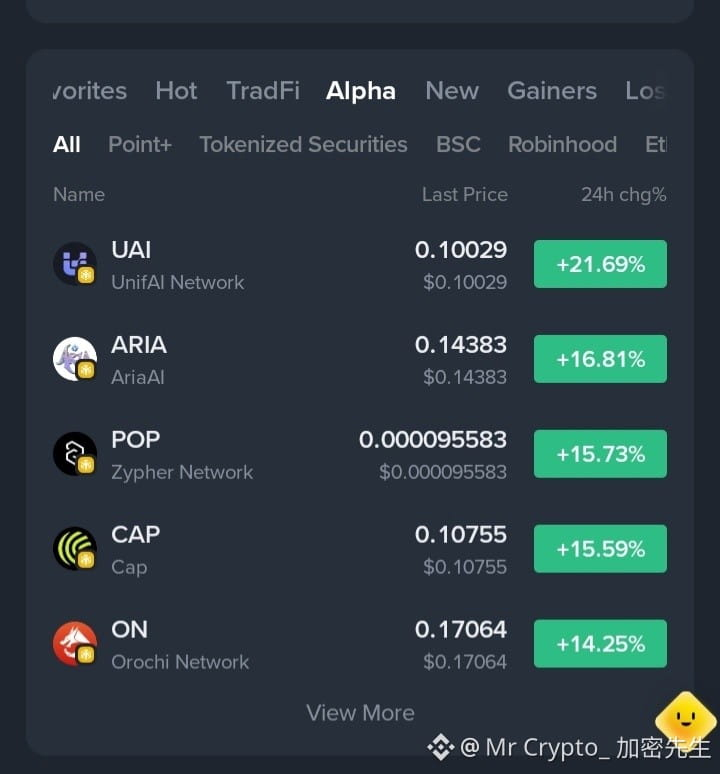
Binance Alpha Top Gainers Today 🚀
$UAI $ARIA $POP
Binance Alpha Top Gainers Today 🚀
$UAI $ARIA $POP
$UAI $ARIA $POP
2
1.6k
$NES
Dropped from almost 0.20 all the way to 0.10, now back at 0.132 with an 8% bounce.
Markets really know how to test patience before giving anything back.
Still chewing on whether this bounce is the start of something or just a short break.
$NES
{alpha}(560x097acf27503753e77bca940277806156c5925b81)
$NES
Dropped from almost 0.20 all the way to 0.10, now back at 0.132 with an 8% bounce.
Markets really know how to test patience before giving anything back.
Still chewing on whether this bounce is the start of something or just a short break.
$NES
Dropped from almost 0.20 all the way to 0.10, now back at 0.132 with an 8% bounce.
Markets really know how to test patience before giving anything back.
Still chewing on whether this bounce is the start of something or just a short break.
$NES
296
$BMT
It fell hard from 0.032 down to 0.020, then bounced almost 14% in a day.
Just shows how markets love testing patience before giving anything back.
Still chewing on whether this is the real turn or just another pause.
$BMT
{future}(BMTUSDT)
$BMT
It fell hard from 0.032 down to 0.020, then bounced almost 14% in a day.
Just shows how markets love testing patience before giving anything back.
Still chewing on whether this is the real turn or just another pause.
$BMT
It fell hard from 0.032 down to 0.020, then bounced almost 14% in a day.
Just shows how markets love testing patience before giving anything back.
Still chewing on whether this is the real turn or just another pause.
$BMT
367
$AIOT
Jumped about 20% to 0.085. Lines climbed and volume woke up.
Feels strong now, but every rise still carries its own weight.....
$AIOT
Jumped about 20% to 0.085. Lines climbed and volume woke up.
Feels strong now, but every rise still carries its own weight.....
Jumped about 20% to 0.085. Lines climbed and volume woke up.
Feels strong now, but every rise still carries its own weight.....
390
BTC at $76,550: Is Bitcoin Preparing for a Recovery or Another Leg Down?
Bitcoin is approaching a critical decision zone.
At $76,550, BTC is trading near an important support area. The recent selling pressure has weakened short-term market structure, but this level could determine whether buyers are ready to defend the market.
Key Figures
Reference Price: $76,550
Immediate Support: $76,400–$76,600
Next Support: $75,800
First Resistance: $78,500
Higher Resistance: $79,250
Bullish Confirmation
If Bitcoin holds above $76,400 and reclaims $78,500 with strong buying volume, a recovery toward $79,250 could develop.
A sustained move above this resistance would improve the short-term outlook and bring stronger buyers back into focus.
Bearish Confirmation
If BTC loses $76,400 on a confirmed close, downside pressure could increase toward $75,800. A failure to defend that area would put the broader support structure under further stress.
My View
I am watching the $76,400–$78,500 range closely. This is not the time to assume that every dip is a buying opportunity or that every bounce signals a reversal.
The next confirmed move matters more than short-term noise.
Will BTC defend $76,500 and recover, or are we heading toward another support test?
DYOR.....
Trade with a plan. Manage risk carefully.
$BTC
{future}(BTCUSDT)
BTC at $76,550: Is Bitcoin Preparing for a Recovery or Another Leg Down?
Bitcoin is approaching a critical decision zone.
At $76,550, BTC is trading near an important support area. The recent selling pressure has weakened short-term market structure, but this level could determine whether buyers are ready to defend the market.
Key Figures
Reference Price: $76,550
Immediate Support: $76,400–$76,600
Next Support: $75,800
First Resistance: $78,500
Higher Resistance: $79,250
Bullish Confirmation
If Bitcoin holds above $76,400 and reclaims $78,500 with strong buying volume, a recovery toward $79,250 could develop.
A sustained move above this resistance would improve the short-term outlook and bring stronger buyers back into focus.
Bearish Confirmation
If BTC loses $76,400 on a confirmed close, downside pressure could increase toward $75,800. A failure to defend that area would put the broader support structure under further stress.
My View
I am watching the $76,400–$78,500 range closely. This is not the time to assume that every dip is a buying opportunity or that every bounce signals a reversal.
The next confirmed move matters more than short-term noise.
Will BTC defend $76,500 and recover, or are we heading toward another support test?
DYOR.....
Trade with a plan. Manage risk carefully.
$BTC
Bitcoin is approaching a critical decision zone.
At $76,550, BTC is trading near an important support area. The recent selling pressure has weakened short-term market structure, but this level could determine whether buyers are ready to defend the market.
Key Figures
Reference Price: $76,550
Immediate Support: $76,400–$76,600
Next Support: $75,800
First Resistance: $78,500
Higher Resistance: $79,250
Bullish Confirmation
If Bitcoin holds above $76,400 and reclaims $78,500 with strong buying volume, a recovery toward $79,250 could develop.
A sustained move above this resistance would improve the short-term outlook and bring stronger buyers back into focus.
Bearish Confirmation
If BTC loses $76,400 on a confirmed close, downside pressure could increase toward $75,800. A failure to defend that area would put the broader support structure under further stress.
My View
I am watching the $76,400–$78,500 range closely. This is not the time to assume that every dip is a buying opportunity or that every bounce signals a reversal.
The next confirmed move matters more than short-term noise.
Will BTC defend $76,500 and recover, or are we heading toward another support test?
DYOR.....
Trade with a plan. Manage risk carefully.
$BTC
496
WARD: A SUDDEN SURGE, BUT HAS THE MARKET FOUND ITS TRUE VALUE?
WARD is up nearly 30%, trading around $0.00350. At first glance, the move looks exciting. But sometimes, the most important story isn’t how fast a token rises — it’s what happens after the excitement fades.
The chart shows a sharp spike toward $0.00944, followed by a strong pullback. That tells us early momentum has met selling pressure, and the market is still searching for balance.
The $0.00270 area marks the recent low, while $0.00385 is a nearby level worth watching. A sustained recovery would be more convincing than a brief green candle.
WARD’s displayed market cap is under $1 million, with roughly $174,000 in on-chain liquidity. In a market this small, price swings can be dramatic, and entering or exiting a position may be harder than it appears.
Remember: a rising price attracts attention, but only time reveals whether that attention becomes lasting demand.
Are you watching WARD for a genuine recovery, or waiting for the dust to settle?
$WARD
{alpha}(560xf5cb7cc90040aa717a16887c8b7d7c10a7c60984)
WARD: A SUDDEN SURGE, BUT HAS THE MARKET FOUND ITS TRUE VALUE?
WARD is up nearly 30%, trading around $0.00350. At first glance, the move looks exciting. But sometimes, the most important story isn’t how fast a token rises — it’s what happens after the excitement fades.
The chart shows a sharp spike toward $0.00944, followed by a strong pullback. That tells us early momentum has met selling pressure, and the market is still searching for balance.
The $0.00270 area marks the recent low, while $0.00385 is a nearby level worth watching. A sustained recovery would be more convincing than a brief green candle.
WARD’s displayed market cap is under $1 million, with roughly $174,000 in on-chain liquidity. In a market this small, price swings can be dramatic, and entering or exiting a position may be harder than it appears.
Remember: a rising price attracts attention, but only time reveals whether that attention becomes lasting demand.
Are you watching WARD for a genuine recovery, or waiting for the dust to settle?
$WARD
WARD is up nearly 30%, trading around $0.00350. At first glance, the move looks exciting. But sometimes, the most important story isn’t how fast a token rises — it’s what happens after the excitement fades.
The chart shows a sharp spike toward $0.00944, followed by a strong pullback. That tells us early momentum has met selling pressure, and the market is still searching for balance.
The $0.00270 area marks the recent low, while $0.00385 is a nearby level worth watching. A sustained recovery would be more convincing than a brief green candle.
WARD’s displayed market cap is under $1 million, with roughly $174,000 in on-chain liquidity. In a market this small, price swings can be dramatic, and entering or exiting a position may be harder than it appears.
Remember: a rising price attracts attention, but only time reveals whether that attention becomes lasting demand.
Are you watching WARD for a genuine recovery, or waiting for the dust to settle?
$WARD
702
$EVAA Trade smart, manage risk.
$MPLX Watch volume, avoid FOMO.
$XAN Stay patient, protect capital.
$EVAA Trade smart, manage risk.
$MPLX Watch volume, avoid FOMO.
$XAN Stay patient, protect capital.
$MPLX Watch volume, avoid FOMO.
$XAN Stay patient, protect capital.
512
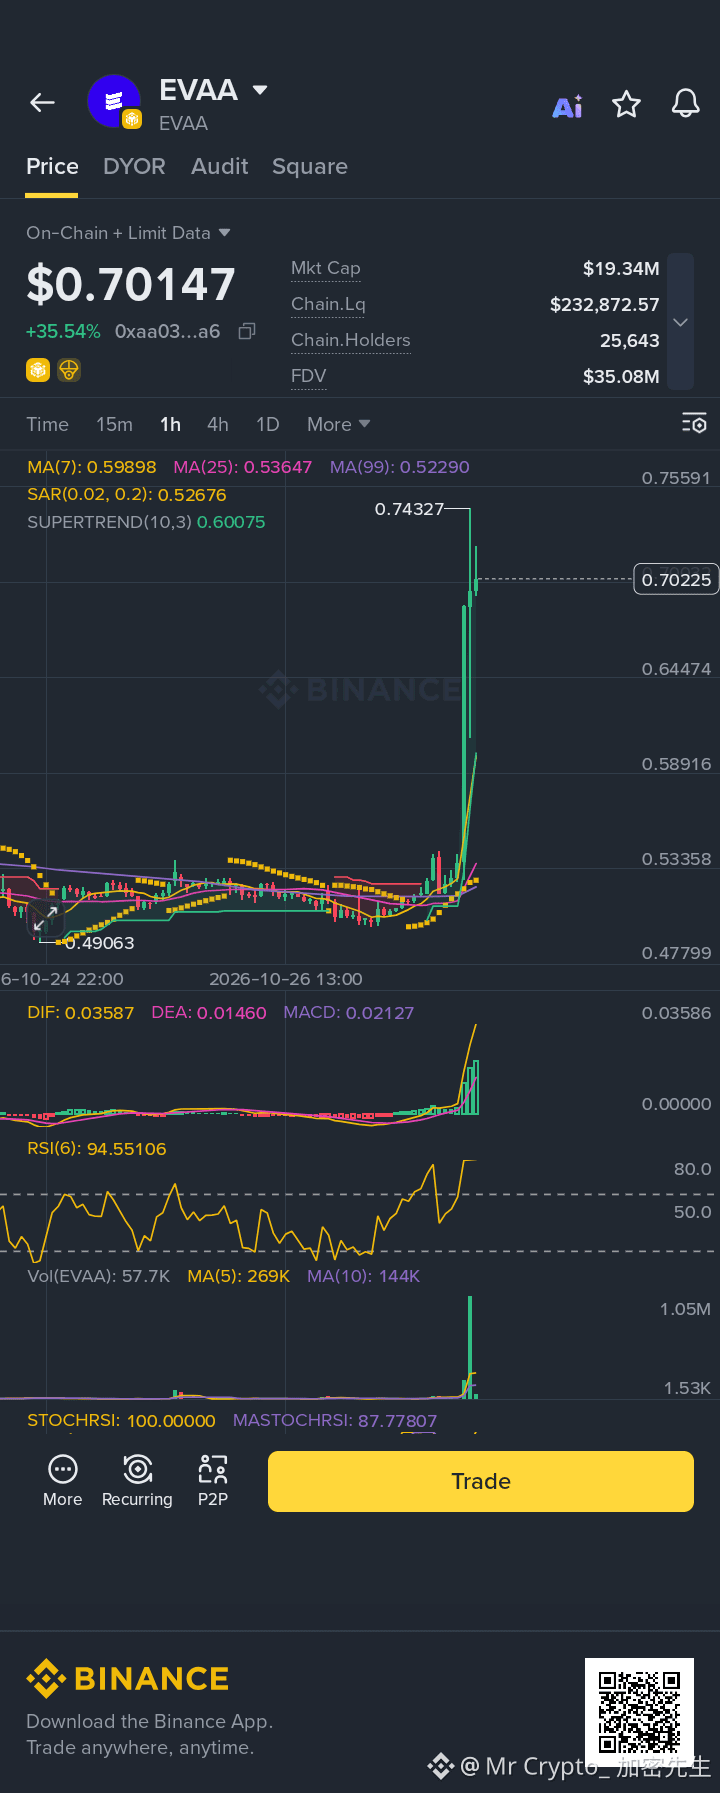
🔴 $EVAA — A PARABOLIC PUMP IS NOT A SAFE ENTRY
EVAA just jumped 35.54% to $0.701 in your screenshot, but I wouldn’t confuse a strong candle with a confirmed trend.
The one-hour chart shows a near-vertical breakout from the $0.52 area toward $0.743. Momentum is stretched, and the first rejection has already appeared. After a move this sharp, late buyers can quickly become exit liquidity if profit-taking accelerates.
My short-side watch:
Entry zone: $0.700–$0.720, only after clear rejection
Stop-loss: $0.745
Target 1: $0.660
Target 2: $0.620
Target 3: $0.590
The idea is simple: let price confirm weakness before entering. If EVAA holds above $0.72 and breaks its recent high, the short setup loses strength—don’t fight the momentum.
One more thing: the latest market data I found shows EVAA trading materially below your screenshot price, so verify the live quote before placing any order.
A sharp rally creates opportunity, but patience decides whether it becomes a trade or a trap. ⚠️
$EVAA
{future}(EVAAUSDT)
🔴 $EVAA — A PARABOLIC PUMP IS NOT A SAFE ENTRY
EVAA just jumped 35.54% to $0.701 in your screenshot, but I wouldn’t confuse a strong candle with a confirmed trend.
The one-hour chart shows a near-vertical breakout from the $0.52 area toward $0.743. Momentum is stretched, and the first rejection has already appeared. After a move this sharp, late buyers can quickly become exit liquidity if profit-taking accelerates.
My short-side watch:
Entry zone: $0.700–$0.720, only after clear rejection
Stop-loss: $0.745
Target 1: $0.660
Target 2: $0.620
Target 3: $0.590
The idea is simple: let price confirm weakness before entering. If EVAA holds above $0.72 and breaks its recent high, the short setup loses strength—don’t fight the momentum.
One more thing: the latest market data I found shows EVAA trading materially below your screenshot price, so verify the live quote before placing any order.
A sharp rally creates opportunity, but patience decides whether it becomes a trade or a trap. ⚠️
$EVAA
EVAA just jumped 35.54% to $0.701 in your screenshot, but I wouldn’t confuse a strong candle with a confirmed trend.
The one-hour chart shows a near-vertical breakout from the $0.52 area toward $0.743. Momentum is stretched, and the first rejection has already appeared. After a move this sharp, late buyers can quickly become exit liquidity if profit-taking accelerates.
My short-side watch:
Entry zone: $0.700–$0.720, only after clear rejection
Stop-loss: $0.745
Target 1: $0.660
Target 2: $0.620
Target 3: $0.590
The idea is simple: let price confirm weakness before entering. If EVAA holds above $0.72 and breaks its recent high, the short setup loses strength—don’t fight the momentum.
One more thing: the latest market data I found shows EVAA trading materially below your screenshot price, so verify the live quote before placing any order.
A sharp rally creates opportunity, but patience decides whether it becomes a trade or a trap. ⚠️
$EVAA
301
🎙️ 🎉 The 2026 bull run is raging—the rallying cry has sounded, and all the action is on BSC!! On November 1, Elon Musk will celebrate the birthday of Marvin, the Mars dog. Don’t miss this on-chain rally!
End
02 h 00 m 21 s
2.3k
9
26
🎙️ Welcome to Tangbao’s livestream—come cast your precious vote!

End
03 h 35 m 04 s
7.5k
66
77
Log in to explore more content
Join global crypto users on Binance Square
⚡️ Get latest and useful information about crypto.
💬 Trusted by the world’s largest crypto exchange.
👍 Discover real insights from verified creators.
Email / Phone number
Trending Topics
NvidiaBeatsEstimatesWith$130BQ4Outlook
2,543 views
52 Discussing
Nvidia Beats With $115.8 Billion in Revenue, Guides to $130 Billion and Adds $150 Billion Buyback
Binance News
·25 Likes
·31k views
AnthropicIPOPriceCouldExceed$80
6,269 views
54 Discussing
CanNvidia’sDataCenterGrowthContinue?
13,670 views
238 Discussing