

fear_greed
1.1k Posts

fear_greed
Report
Block User
https://x.com/feargreed_of
2 Following
355 Followers
887 Liked
Posts
All
Quotes
Videos
PINNED
·
--
Today's News‼️
🔴 Bitcoin has posted its largest quarterly gain since Trump's election victory;
🔴 Bitfinex: Approximately 867,000 BTC were purchased at a price of ~$84,000—the exact level where the price is currently trading. Above this level, about 75% of the supply is in profit. Below, the $77,000–$81,500 zone comes back into focus;
🔴 According to Polymarket, the probability of Bitcoin exceeding $90,000 this month currently stands at 59%;
🔴 Open interest in futures and options has subsided. Demand for spot ETFs has cooled but remains high. On-chain activity is high. The sell-side pressure seen in futures last week has significantly decreased;
🔴 Chainalysis, citing its own data, reported a sharp rise in the number of wallets participating in P2P stablecoin trading in China, despite ongoing cryptocurrency restrictions;
🔴 Decrypt reports on DvP—an open-source program designed to enable banks to settle transactions on the Solana network with the level of certainty expected in traditional financial markets;
🔴 The yield on 30-year US Treasury bonds has reached 5.7% for the first time since 2002; Many at the Bank of Japan are wary of an interest rate hike in October—monitoring.
Today's News‼️
🔴 Bitcoin has posted its largest quarterly gain since Trump's election victory;
🔴 Bitfinex: Approximately 867,000 BTC were purchased at a price of ~$84,000—the exact level where the price is currently trading. Above this level, about 75% of the supply is in profit. Below, the $77,000–$81,500 zone comes back into focus;
🔴 According to Polymarket, the probability of Bitcoin exceeding $90,000 this month currently stands at 59%;
🔴 Open interest in futures and options has subsided. Demand for spot ETFs has cooled but remains high. On-chain activity is high. The sell-side pressure seen in futures last week has significantly decreased;
🔴 Chainalysis, citing its own data, reported a sharp rise in the number of wallets participating in P2P stablecoin trading in China, despite ongoing cryptocurrency restrictions;
🔴 Decrypt reports on DvP—an open-source program designed to enable banks to settle transactions on the Solana network with the level of certainty expected in traditional financial markets;
🔴 The yield on 30-year US Treasury bonds has reached 5.7% for the first time since 2002; Many at the Bank of Japan are wary of an interest rate hike in October—monitoring.
🔴 Bitcoin has posted its largest quarterly gain since Trump's election victory;
🔴 Bitfinex: Approximately 867,000 BTC were purchased at a price of ~$84,000—the exact level where the price is currently trading. Above this level, about 75% of the supply is in profit. Below, the $77,000–$81,500 zone comes back into focus;
🔴 According to Polymarket, the probability of Bitcoin exceeding $90,000 this month currently stands at 59%;
🔴 Open interest in futures and options has subsided. Demand for spot ETFs has cooled but remains high. On-chain activity is high. The sell-side pressure seen in futures last week has significantly decreased;
🔴 Chainalysis, citing its own data, reported a sharp rise in the number of wallets participating in P2P stablecoin trading in China, despite ongoing cryptocurrency restrictions;
🔴 Decrypt reports on DvP—an open-source program designed to enable banks to settle transactions on the Solana network with the level of certainty expected in traditional financial markets;
🔴 The yield on 30-year US Treasury bonds has reached 5.7% for the first time since 2002; Many at the Bank of Japan are wary of an interest rate hike in October—monitoring.

1
329
·
--
#DataUpdate‼️
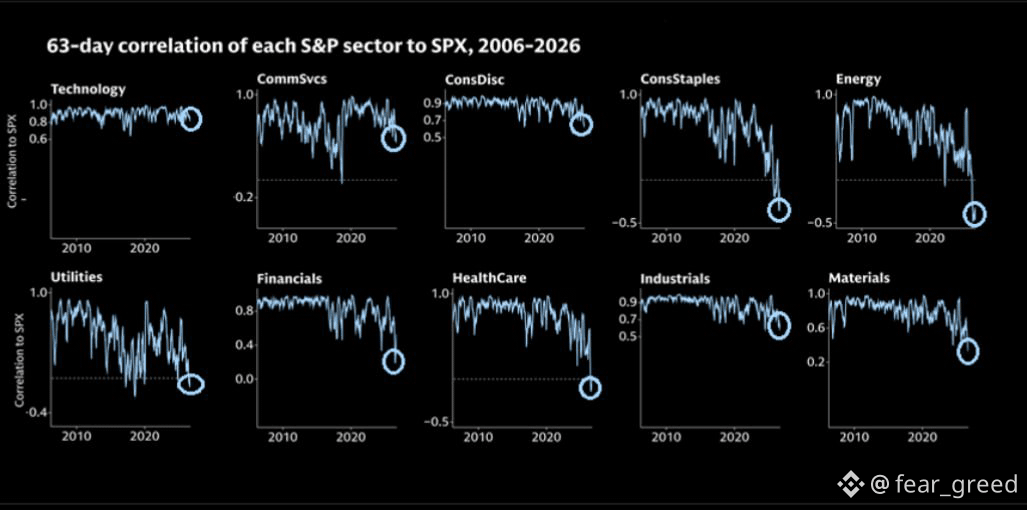
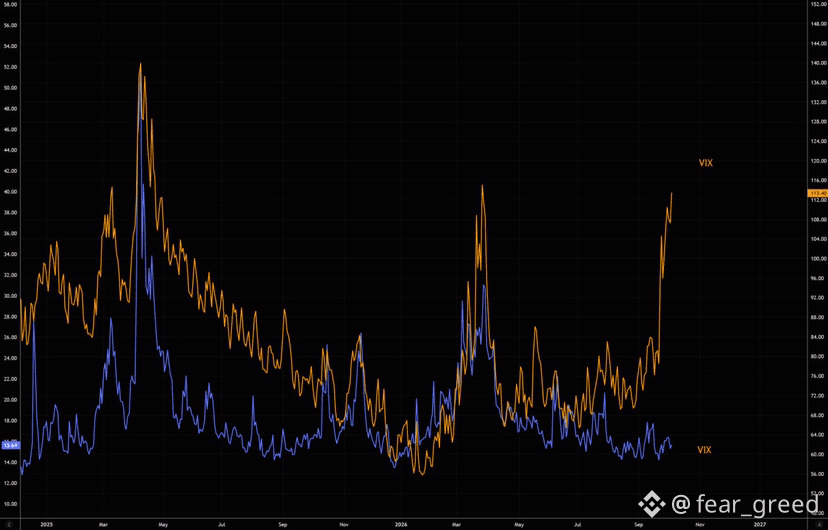
Some experts are highlighting the current disconnect between a calm US stock market—where the S&P 500 index is hovering near record highs—and mounting stress in other segments of the financial system.
The macroeconomic landscape reveals a sharp rise in bond market volatility and credit stress, even as traditional indicators of stock market panic remain extremely low. Institutional traders are actively shifting risk into fixed-income instruments and ETF options, disregarding the stock index as a gauge of actual economic conditions.
Central banks are grappling with persistent inflation that exceeds targets, depriving them of the ability to pursue the accommodative monetary policies used to counter financial shocks over the past decade.
The cryptocurrency sector is also showing mixed dynamics: Bitcoin maintains a positive outlook following historical mid-term election cycles, while Ethereum is experiencing localized spikes in network fees amidst cautious activity by large investors.
Wishing everyone profit💰💪
#DataUpdate‼️
Some experts are highlighting the current disconnect between a calm US stock market—where the S&P 500 index is hovering near record highs—and mounting stress in other segments of the financial system.
The macroeconomic landscape reveals a sharp rise in bond market volatility and credit stress, even as traditional indicators of stock market panic remain extremely low. Institutional traders are actively shifting risk into fixed-income instruments and ETF options, disregarding the stock index as a gauge of actual economic conditions.
Central banks are grappling with persistent inflation that exceeds targets, depriving them of the ability to pursue the accommodative monetary policies used to counter financial shocks over the past decade.
The cryptocurrency sector is also showing mixed dynamics: Bitcoin maintains a positive outlook following historical mid-term election cycles, while Ethereum is experiencing localized spikes in network fees amidst cautious activity by large investors.
Wishing everyone profit💰💪
Some experts are highlighting the current disconnect between a calm US stock market—where the S&P 500 index is hovering near record highs—and mounting stress in other segments of the financial system.
The macroeconomic landscape reveals a sharp rise in bond market volatility and credit stress, even as traditional indicators of stock market panic remain extremely low. Institutional traders are actively shifting risk into fixed-income instruments and ETF options, disregarding the stock index as a gauge of actual economic conditions.
Central banks are grappling with persistent inflation that exceeds targets, depriving them of the ability to pursue the accommodative monetary policies used to counter financial shocks over the past decade.
The cryptocurrency sector is also showing mixed dynamics: Bitcoin maintains a positive outlook following historical mid-term election cycles, while Ethereum is experiencing localized spikes in network fees amidst cautious activity by large investors.
Wishing everyone profit💰💪
1
105
·
--
$BTC today‼️
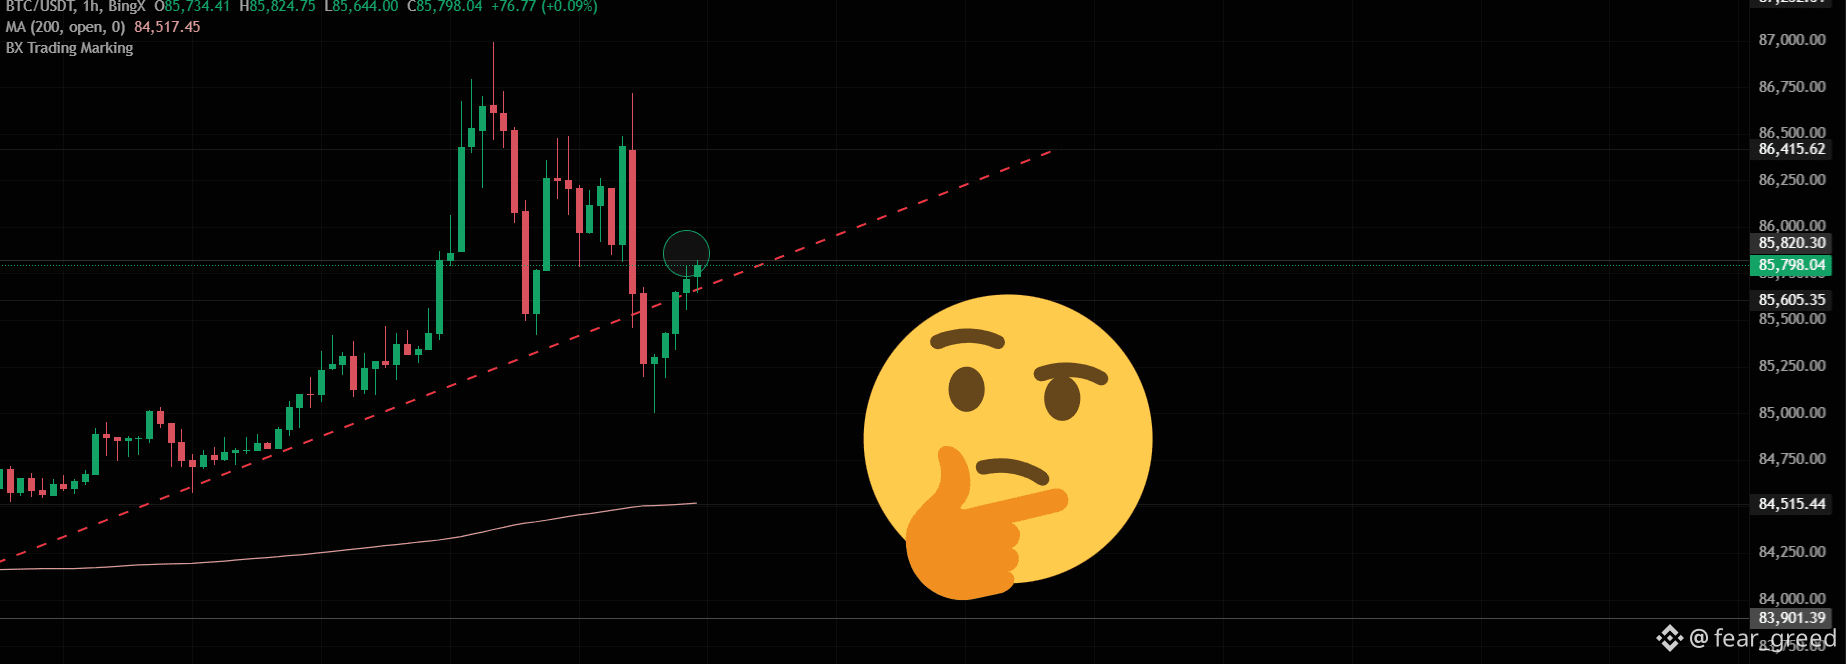
I’m trading a bounce off the trend line around the $85,620 level, with a stop-loss in place. I’m already slightly in profit. The target is 10–15%. As usual.
Despite the unstable geopolitical backdrop, the bulls are finding support through buying activity from certain institutional funds. I assume you’ve seen the news today.
It’s also worth noting the rise in the Coinbase BTC Premium Index; over the last hour, it has moved into positive territory.
If the bulls manage to hold the price near the support line, I’ll keep holding my long position.
Polygon posted an encouraging update on X today. I’m continuing to accumulate the token around the $0.10 level. Not financial advice.
Wishing everyone profitable trades💰💪
$BTC today‼️
I’m trading a bounce off the trend line around the $85,620 level, with a stop-loss in place. I’m already slightly in profit. The target is 10–15%. As usual.
Despite the unstable geopolitical backdrop, the bulls are finding support through buying activity from certain institutional funds. I assume you’ve seen the news today.
It’s also worth noting the rise in the Coinbase BTC Premium Index; over the last hour, it has moved into positive territory.
If the bulls manage to hold the price near the support line, I’ll keep holding my long position.
Polygon posted an encouraging update on X today. I’m continuing to accumulate the token around the $0.10 level. Not financial advice.
Wishing everyone profitable trades💰💪
I’m trading a bounce off the trend line around the $85,620 level, with a stop-loss in place. I’m already slightly in profit. The target is 10–15%. As usual.
Despite the unstable geopolitical backdrop, the bulls are finding support through buying activity from certain institutional funds. I assume you’ve seen the news today.
It’s also worth noting the rise in the Coinbase BTC Premium Index; over the last hour, it has moved into positive territory.
If the bulls manage to hold the price near the support line, I’ll keep holding my long position.
Polygon posted an encouraging update on X today. I’m continuing to accumulate the token around the $0.10 level. Not financial advice.
Wishing everyone profitable trades💰💪
fear_greed
·
--
$BTC today‼️
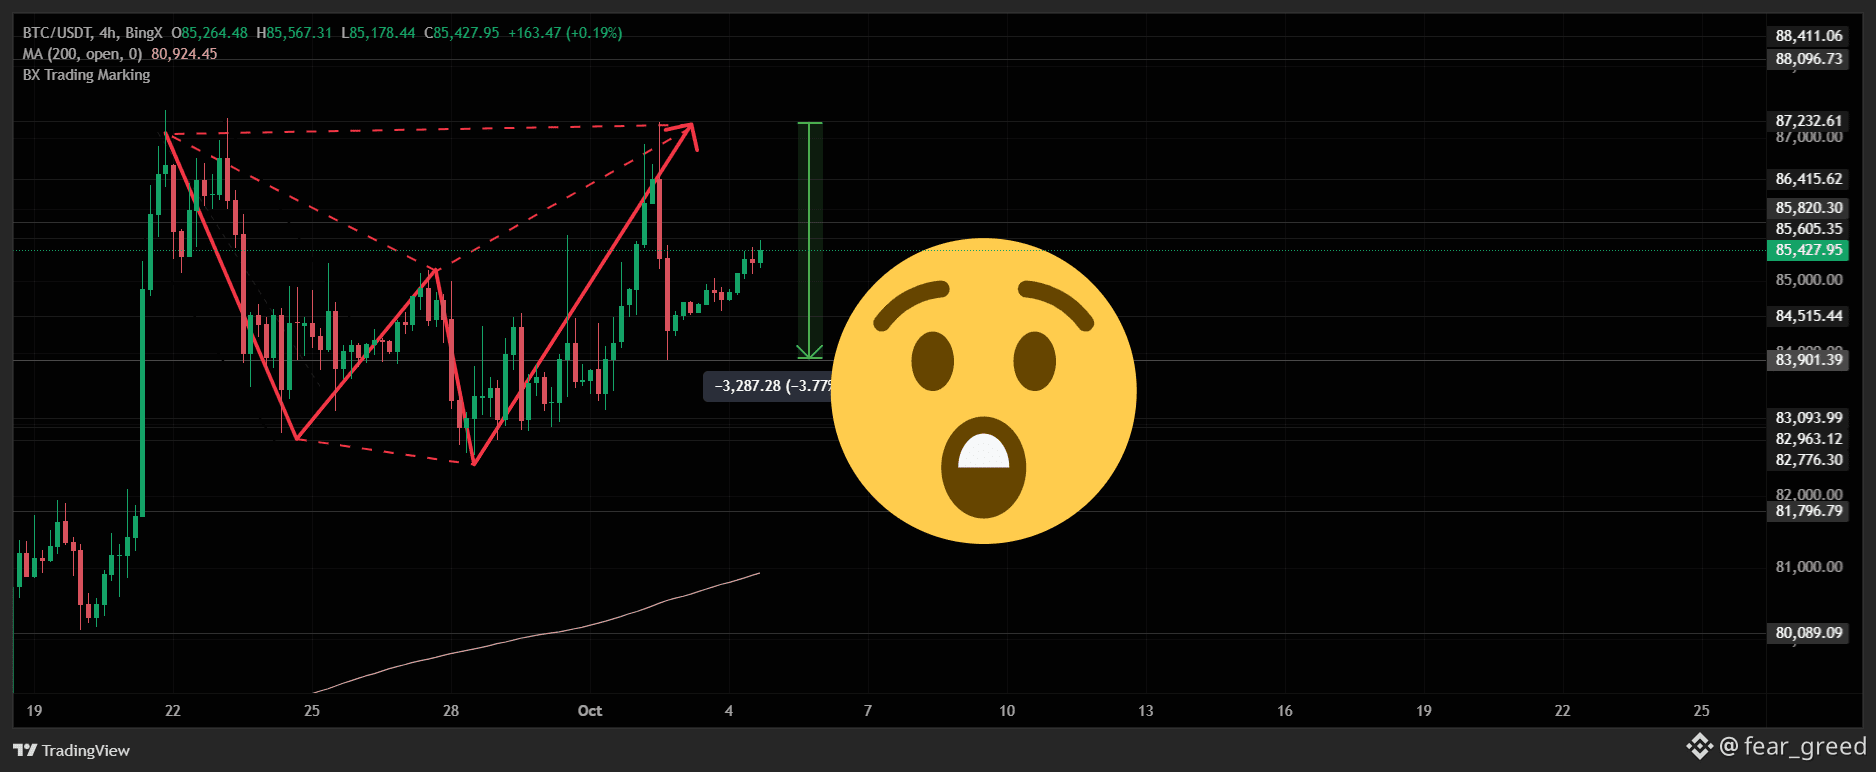
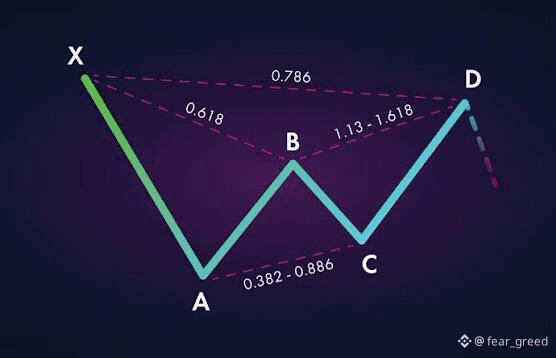
A forecast predicting the likely formation of a bearish "Gartley Butterfly" pattern has yielded a profit of at least 30%. Bitcoin continues to recover, yet the momentum signal (Jao Wedson indicator) sits at a level of only around +0.06. In other words, the price is rising, but momentum across multiple timeframes is not yet confirming this move with equal strength. Based on the current structure, BTC likely needs to climb to the $91,000 mark or higher to give the indicator sufficient strength and reduce the probability of a drop back into negative territory.
Many experts agree that BTC prices have historically shown strength in October, with three notable exceptions:
1. October 2014 — the price fell by 12.95%.
2. October 2018 — the price dropped by 3.95%.
3. October 2025 — the price fell by 17.49%.
At the same time, geopolitical shocks remain a major source of unpredictability, capable of disrupting historical patterns and seasonal trends at any moment.
The price is currently testing a resistance level at $85,620; I have opened a short position at this liquidity zone.
If I see buyers stepping in, I will flip to a bullish position.
Wishing everyone profitable trades💰💪
A forecast predicting the likely formation of a bearish "Gartley Butterfly" pattern has yielded a profit of at least 30%. Bitcoin continues to recover, yet the momentum signal (Jao Wedson indicator) sits at a level of only around +0.06. In other words, the price is rising, but momentum across multiple timeframes is not yet confirming this move with equal strength. Based on the current structure, BTC likely needs to climb to the $91,000 mark or higher to give the indicator sufficient strength and reduce the probability of a drop back into negative territory.
Many experts agree that BTC prices have historically shown strength in October, with three notable exceptions:
1. October 2014 — the price fell by 12.95%.
2. October 2018 — the price dropped by 3.95%.
3. October 2025 — the price fell by 17.49%.
At the same time, geopolitical shocks remain a major source of unpredictability, capable of disrupting historical patterns and seasonal trends at any moment.
The price is currently testing a resistance level at $85,620; I have opened a short position at this liquidity zone.
If I see buyers stepping in, I will flip to a bullish position.
Wishing everyone profitable trades💰💪
1
81
·
--
🔴 Glassnode: The largest liquidation cluster for BTC above the current price is located near the $90,000 mark;
🔴 Binance spot trading volume in September exceeded $50 billion, up from $42 billion in July. Trading volume on Bybit reached $19 billion (vs. $14 billion in July), while Kraken saw $8 billion (vs. $4 billion);
🔴 Bitcoin's price growth has been driven primarily by dynamics in Europe. Cumulative returns since the start of September:
Europe: +4%
USA: -3%
Asia-Pacific: -0.5%. Notably, demand for Bitcoin ETFs in the US surged recently but lost momentum by the end of the week;
🔴 Total assets under management (AUM) for RWA (Real World Asset) companies have grown by more than $15 billion in just nine months;
🔴 Trading volume for tokenized stocks on Solana reached $12.4 billion on decentralized exchanges (DEXs) this year. Raydium leads with $6.1 billion in volume, followed by Meteora ($2.3 billion) and Orca ($1.2 billion);
🔴 The proportion of S&P 500 stocks trading above their 200-day moving average has fallen from 75% to just 43%. This means that more than half of the stocks in the index are now trading below their long-term trend.
🔴 Glassnode: The largest liquidation cluster for BTC above the current price is located near the $90,000 mark;
🔴 Binance spot trading volume in September exceeded $50 billion, up from $42 billion in July. Trading volume on Bybit reached $19 billion (vs. $14 billion in July), while Kraken saw $8 billion (vs. $4 billion);
🔴 Bitcoin's price growth has been driven primarily by dynamics in Europe. Cumulative returns since the start of September:
Europe: +4%
USA: -3%
Asia-Pacific: -0.5%. Notably, demand for Bitcoin ETFs in the US surged recently but lost momentum by the end of the week;
🔴 Total assets under management (AUM) for RWA (Real World Asset) companies have grown by more than $15 billion in just nine months;
🔴 Trading volume for tokenized stocks on Solana reached $12.4 billion on decentralized exchanges (DEXs) this year. Raydium leads with $6.1 billion in volume, followed by Meteora ($2.3 billion) and Orca ($1.2 billion);
🔴 The proportion of S&P 500 stocks trading above their 200-day moving average has fallen from 75% to just 43%. This means that more than half of the stocks in the index are now trading below their long-term trend.
🔴 Binance spot trading volume in September exceeded $50 billion, up from $42 billion in July. Trading volume on Bybit reached $19 billion (vs. $14 billion in July), while Kraken saw $8 billion (vs. $4 billion);
🔴 Bitcoin's price growth has been driven primarily by dynamics in Europe. Cumulative returns since the start of September:
Europe: +4%
USA: -3%
Asia-Pacific: -0.5%. Notably, demand for Bitcoin ETFs in the US surged recently but lost momentum by the end of the week;
🔴 Total assets under management (AUM) for RWA (Real World Asset) companies have grown by more than $15 billion in just nine months;
🔴 Trading volume for tokenized stocks on Solana reached $12.4 billion on decentralized exchanges (DEXs) this year. Raydium leads with $6.1 billion in volume, followed by Meteora ($2.3 billion) and Orca ($1.2 billion);
🔴 The proportion of S&P 500 stocks trading above their 200-day moving average has fallen from 75% to just 43%. This means that more than half of the stocks in the index are now trading below their long-term trend.

136
·
--
$BTC today‼️
A forecast predicting the likely formation of a bearish "Gartley Butterfly" pattern has yielded a profit of at least 30%. Bitcoin continues to recover, yet the momentum signal (Jao Wedson indicator) sits at a level of only around +0.06. In other words, the price is rising, but momentum across multiple timeframes is not yet confirming this move with equal strength. Based on the current structure, BTC likely needs to climb to the $91,000 mark or higher to give the indicator sufficient strength and reduce the probability of a drop back into negative territory.
Many experts agree that BTC prices have historically shown strength in October, with three notable exceptions:
1. October 2014 — the price fell by 12.95%.
2. October 2018 — the price dropped by 3.95%.
3. October 2025 — the price fell by 17.49%.
At the same time, geopolitical shocks remain a major source of unpredictability, capable of disrupting historical patterns and seasonal trends at any moment.
The price is currently testing a resistance level at $85,620; I have opened a short position at this liquidity zone.
If I see buyers stepping in, I will flip to a bullish position.
Wishing everyone profitable trades💰💪
$BTC today‼️
A forecast predicting the likely formation of a bearish "Gartley Butterfly" pattern has yielded a profit of at least 30%. Bitcoin continues to recover, yet the momentum signal (Jao Wedson indicator) sits at a level of only around +0.06. In other words, the price is rising, but momentum across multiple timeframes is not yet confirming this move with equal strength. Based on the current structure, BTC likely needs to climb to the $91,000 mark or higher to give the indicator sufficient strength and reduce the probability of a drop back into negative territory.
Many experts agree that BTC prices have historically shown strength in October, with three notable exceptions:
1. October 2014 — the price fell by 12.95%.
2. October 2018 — the price dropped by 3.95%.
3. October 2025 — the price fell by 17.49%.
At the same time, geopolitical shocks remain a major source of unpredictability, capable of disrupting historical patterns and seasonal trends at any moment.
The price is currently testing a resistance level at $85,620; I have opened a short position at this liquidity zone.
If I see buyers stepping in, I will flip to a bullish position.
Wishing everyone profitable trades💰💪
A forecast predicting the likely formation of a bearish "Gartley Butterfly" pattern has yielded a profit of at least 30%. Bitcoin continues to recover, yet the momentum signal (Jao Wedson indicator) sits at a level of only around +0.06. In other words, the price is rising, but momentum across multiple timeframes is not yet confirming this move with equal strength. Based on the current structure, BTC likely needs to climb to the $91,000 mark or higher to give the indicator sufficient strength and reduce the probability of a drop back into negative territory.
Many experts agree that BTC prices have historically shown strength in October, with three notable exceptions:
1. October 2014 — the price fell by 12.95%.
2. October 2018 — the price dropped by 3.95%.
3. October 2025 — the price fell by 17.49%.
At the same time, geopolitical shocks remain a major source of unpredictability, capable of disrupting historical patterns and seasonal trends at any moment.
The price is currently testing a resistance level at $85,620; I have opened a short position at this liquidity zone.
If I see buyers stepping in, I will flip to a bullish position.
Wishing everyone profitable trades💰💪
1
153
·
--
Today's News‼️
⭕️ Total BTC ETF flow: -$148.7M;
⭕️ Total ETH ETF flow: -$59.6M;
⭕️ Total SOL ETF flow: -$12.5M;
⭕️ Total HYPE ETF flow: -$5M;
🔴 Bitcoin is outperforming stocks and gold heading into the fourth quarter;
🔴 Alphractal: On the very day Tesla announced its $1.5 billion Bitcoin purchase, the number of addresses holding between 1,000 and 10,000 BTC dropped and never returned to previous levels;
🔴 Bitcoin's inflation rate has fallen below 1%, while the US M2 money supply has grown by approximately 78% over the past decade—rising from $13.1 trillion to $23.342 trillion—according to an analysis by the Bitcoin data platform Bitview;
🔴 Stablecoin market capitalization stands at $263 billion, just 3.9% below its all-time high; this represents a massive volume of capital currently waiting on the sidelines;
🔴 Bitcoin trader profit/loss margins have reached 30.7%—the highest level since December 2024;
🔴 Crypto projects raised $3.7 billion across 158 funding rounds in Q3 2026 — Cryptorank;
🔴 EU officials question whether Binance is using a legitimate regulatory exemption to continue serving customers in the region, despite orders to wind down operations within the bloc;
🔴 Bloomberg has launched a stablecoin dashboard on its Terminal, giving financial professionals access to on-chain data tracking stablecoin supply, issuance, and transactions;
🔴 The probability of an interest rate hike in October has dropped sharply to just 37%;
🔴 The yield on 10-year US Treasury bonds closed at its highest level since 2001.
Today's News‼️
⭕️ Total BTC ETF flow: -$148.7M;
⭕️ Total ETH ETF flow: -$59.6M;
⭕️ Total SOL ETF flow: -$12.5M;
⭕️ Total HYPE ETF flow: -$5M;
🔴 Bitcoin is outperforming stocks and gold heading into the fourth quarter;
🔴 Alphractal: On the very day Tesla announced its $1.5 billion Bitcoin purchase, the number of addresses holding between 1,000 and 10,000 BTC dropped and never returned to previous levels;
🔴 Bitcoin's inflation rate has fallen below 1%, while the US M2 money supply has grown by approximately 78% over the past decade—rising from $13.1 trillion to $23.342 trillion—according to an analysis by the Bitcoin data platform Bitview;
🔴 Stablecoin market capitalization stands at $263 billion, just 3.9% below its all-time high; this represents a massive volume of capital currently waiting on the sidelines;
🔴 Bitcoin trader profit/loss margins have reached 30.7%—the highest level since December 2024;
🔴 Crypto projects raised $3.7 billion across 158 funding rounds in Q3 2026 — Cryptorank;
🔴 EU officials question whether Binance is using a legitimate regulatory exemption to continue serving customers in the region, despite orders to wind down operations within the bloc;
🔴 Bloomberg has launched a stablecoin dashboard on its Terminal, giving financial professionals access to on-chain data tracking stablecoin supply, issuance, and transactions;
🔴 The probability of an interest rate hike in October has dropped sharply to just 37%;
🔴 The yield on 10-year US Treasury bonds closed at its highest level since 2001.
⭕️ Total BTC ETF flow: -$148.7M;
⭕️ Total ETH ETF flow: -$59.6M;
⭕️ Total SOL ETF flow: -$12.5M;
⭕️ Total HYPE ETF flow: -$5M;
🔴 Bitcoin is outperforming stocks and gold heading into the fourth quarter;
🔴 Alphractal: On the very day Tesla announced its $1.5 billion Bitcoin purchase, the number of addresses holding between 1,000 and 10,000 BTC dropped and never returned to previous levels;
🔴 Bitcoin's inflation rate has fallen below 1%, while the US M2 money supply has grown by approximately 78% over the past decade—rising from $13.1 trillion to $23.342 trillion—according to an analysis by the Bitcoin data platform Bitview;
🔴 Stablecoin market capitalization stands at $263 billion, just 3.9% below its all-time high; this represents a massive volume of capital currently waiting on the sidelines;
🔴 Bitcoin trader profit/loss margins have reached 30.7%—the highest level since December 2024;
🔴 Crypto projects raised $3.7 billion across 158 funding rounds in Q3 2026 — Cryptorank;
🔴 EU officials question whether Binance is using a legitimate regulatory exemption to continue serving customers in the region, despite orders to wind down operations within the bloc;
🔴 Bloomberg has launched a stablecoin dashboard on its Terminal, giving financial professionals access to on-chain data tracking stablecoin supply, issuance, and transactions;
🔴 The probability of an interest rate hike in October has dropped sharply to just 37%;
🔴 The yield on 10-year US Treasury bonds closed at its highest level since 2001.

135
·
--
$BTC today‼️
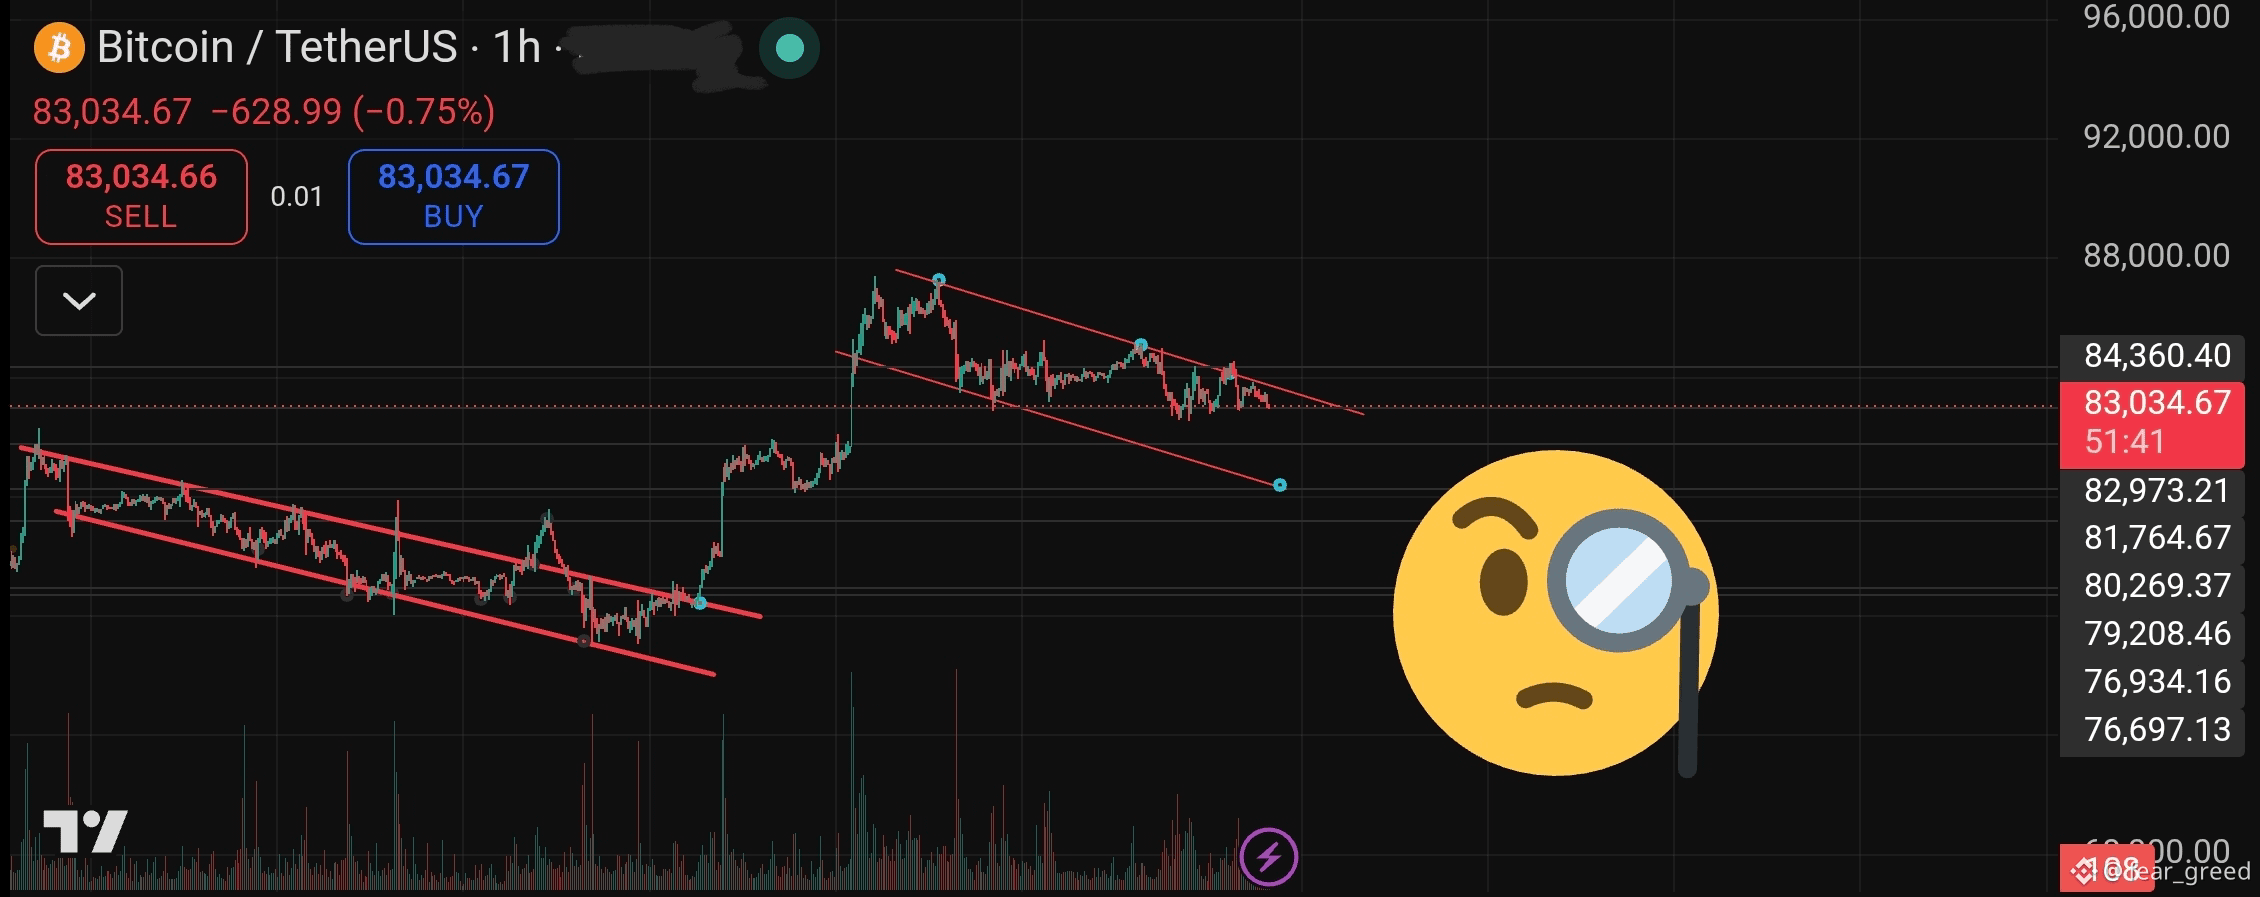
A fierce battle by the bulls for a 10% profit has been playing out around the $82,800 level. For the first time in a long while, I took an 8% profit instead of waiting for my standard 10% exit. Caution and keeping greed in check often save one's trading capital from sharp drawdowns.
Bullish fear is keeping the Bitcoin price within the bounds of a rough downtrend channel. Note the previous similar trading channel: consolidation within the pattern lasted 15 days, followed by a price breakout to new local highs.
I plan to attempt a long trade from the $82,800 level; this same support line also serves as a promising entry point for a short trade should PCE data come in poor.
ETF inflows are acting as positive triggers for the price.
While inflows into BTC ETFs continue, the retail investor demand that accompanied BTC's rise from the $65,000 mark has vanished. Over the past 30 days, its share has dropped from over 17% to -3.5%.
At the same time, DXY figures are a concern for me. The dollar continues to strengthen against major currencies, with the index hitting a 1.5-year high amid expectations of a Fed rate hike.
Let's keep this data in focus and trade both directions. Not financial advice.
Wishing everyone profits💰💪
$BTC today‼️
A fierce battle by the bulls for a 10% profit has been playing out around the $82,800 level. For the first time in a long while, I took an 8% profit instead of waiting for my standard 10% exit. Caution and keeping greed in check often save one's trading capital from sharp drawdowns.
Bullish fear is keeping the Bitcoin price within the bounds of a rough downtrend channel. Note the previous similar trading channel: consolidation within the pattern lasted 15 days, followed by a price breakout to new local highs.
I plan to attempt a long trade from the $82,800 level; this same support line also serves as a promising entry point for a short trade should PCE data come in poor.
ETF inflows are acting as positive triggers for the price.
While inflows into BTC ETFs continue, the retail investor demand that accompanied BTC's rise from the $65,000 mark has vanished. Over the past 30 days, its share has dropped from over 17% to -3.5%.
At the same time, DXY figures are a concern for me. The dollar continues to strengthen against major currencies, with the index hitting a 1.5-year high amid expectations of a Fed rate hike.
Let's keep this data in focus and trade both directions. Not financial advice.
Wishing everyone profits💰💪
A fierce battle by the bulls for a 10% profit has been playing out around the $82,800 level. For the first time in a long while, I took an 8% profit instead of waiting for my standard 10% exit. Caution and keeping greed in check often save one's trading capital from sharp drawdowns.
Bullish fear is keeping the Bitcoin price within the bounds of a rough downtrend channel. Note the previous similar trading channel: consolidation within the pattern lasted 15 days, followed by a price breakout to new local highs.
I plan to attempt a long trade from the $82,800 level; this same support line also serves as a promising entry point for a short trade should PCE data come in poor.
ETF inflows are acting as positive triggers for the price.
While inflows into BTC ETFs continue, the retail investor demand that accompanied BTC's rise from the $65,000 mark has vanished. Over the past 30 days, its share has dropped from over 17% to -3.5%.
At the same time, DXY figures are a concern for me. The dollar continues to strengthen against major currencies, with the index hitting a 1.5-year high amid expectations of a Fed rate hike.
Let's keep this data in focus and trade both directions. Not financial advice.
Wishing everyone profits💰💪
fear_greed
·
--
$BTC today‼️
The forecast yielded a profit of at least 20% if you used the $84,400 level as a pivot point for trading long and short positions.
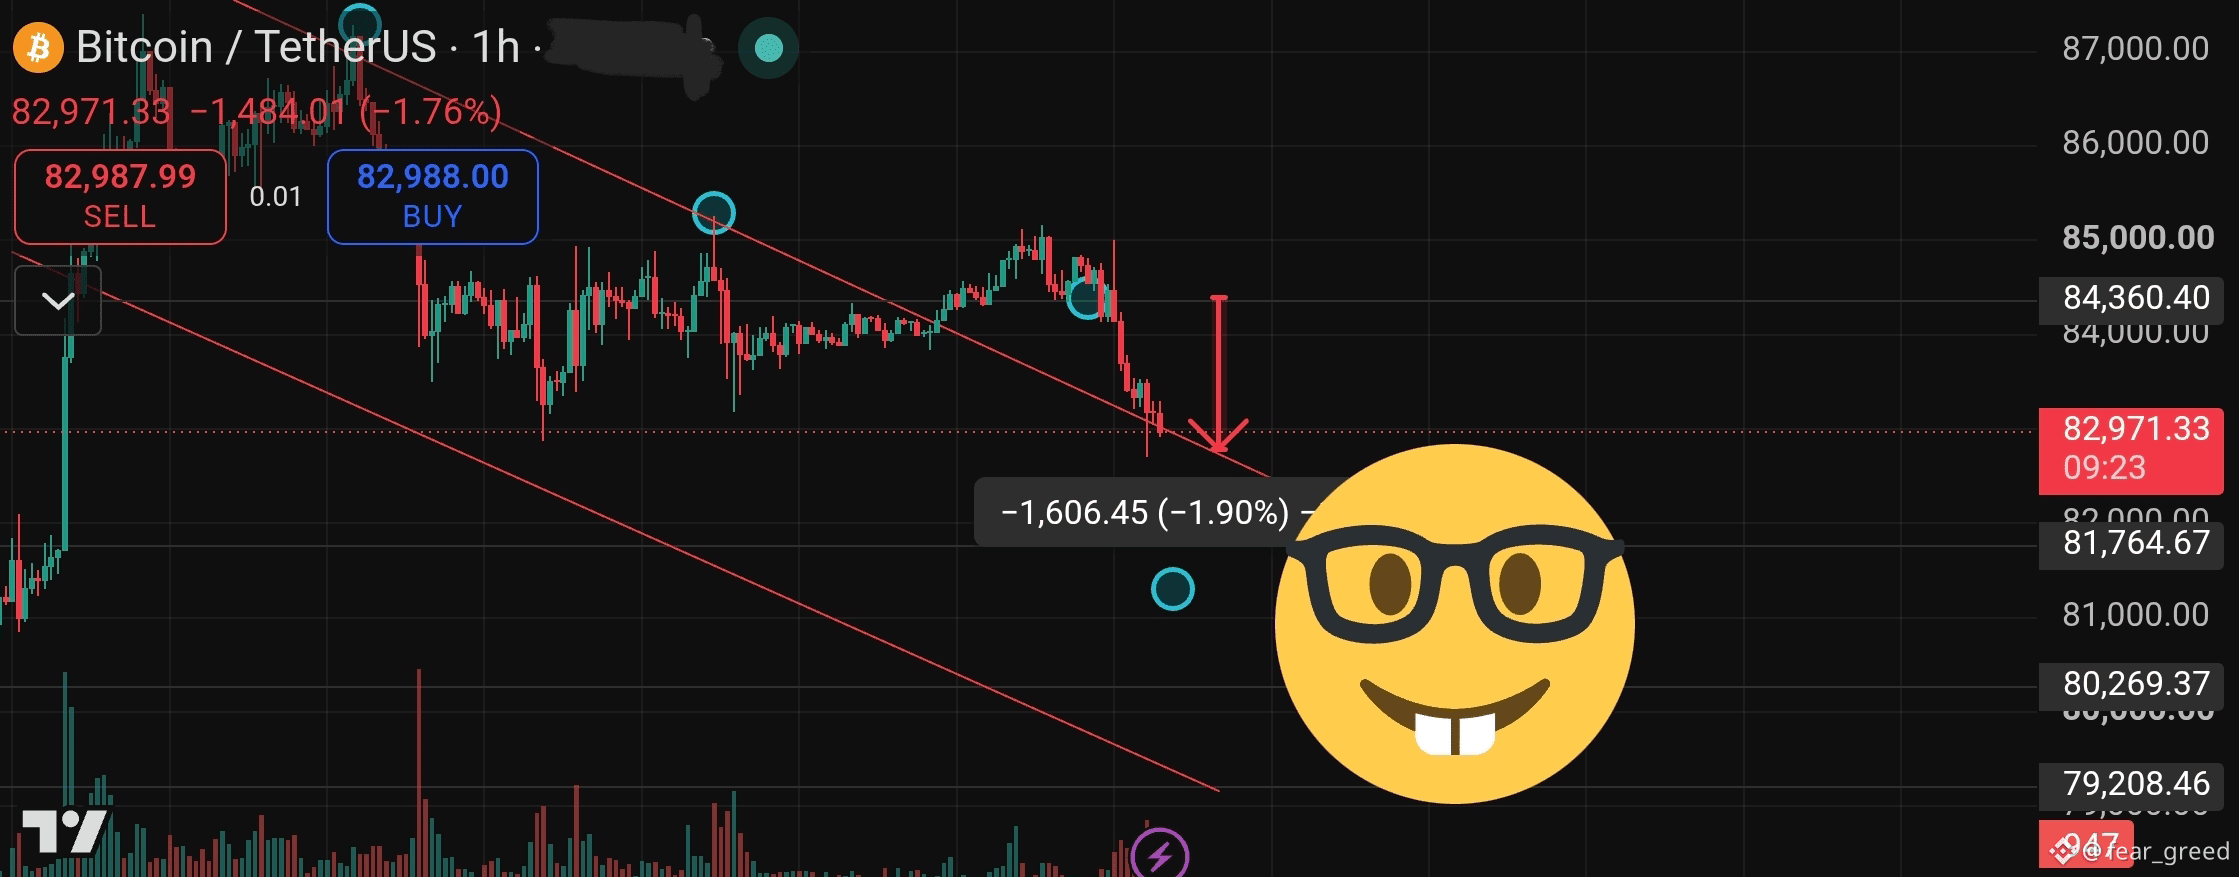
It was crucial for the bulls to close the weekly candle above $84,400 to maintain a sustained uptrend; the current decline signals weakness ahead of macroeconomic data releases. Bearish pressure is currently pushing the price to test the upper boundary of the implied descending trading channel. I am currently holding a short position, but I will close it as soon as I see signs of a short-term price recovery.
Just as I predicted, the price was first pushed outside the trading pattern, then market participants were lured into a bull trap, and now the majority of long positions are being liquidated. Geopolitical factors are weighing on the markets—signals we have analyzed together many times. I anticipate that today’s data will show either outflows from ETFs or only negligible inflows. The Coinbase Bitcoin Premium Index has dropped to lower levels, further indicating weak buying power. My plan for today is to secure a profit of at least 10%. I intend to trade near the upper boundary of the channel shown on the Bitcoin price chart.
Wishing everyone profitable trades💰💪
The forecast yielded a profit of at least 20% if you used the $84,400 level as a pivot point for trading long and short positions.
It was crucial for the bulls to close the weekly candle above $84,400 to maintain a sustained uptrend; the current decline signals weakness ahead of macroeconomic data releases. Bearish pressure is currently pushing the price to test the upper boundary of the implied descending trading channel. I am currently holding a short position, but I will close it as soon as I see signs of a short-term price recovery.
Just as I predicted, the price was first pushed outside the trading pattern, then market participants were lured into a bull trap, and now the majority of long positions are being liquidated. Geopolitical factors are weighing on the markets—signals we have analyzed together many times. I anticipate that today’s data will show either outflows from ETFs or only negligible inflows. The Coinbase Bitcoin Premium Index has dropped to lower levels, further indicating weak buying power. My plan for today is to secure a profit of at least 10%. I intend to trade near the upper boundary of the channel shown on the Bitcoin price chart.
Wishing everyone profitable trades💰💪
1
84
·
--
Today's News‼️
⭕️ Total BTC ETF flow: +$66.2M (BlackRock, Ark Invest);
⭕️ Total ETH ETF flow: -$2.8M (Fidelity, BlackRock);
⭕️ Total SOL ETF flow: +$5.4M (Bitwise);
⭕️ Total HYPE ETF flow: $0M;
🔴 82% of Bitcoin addresses are currently in profit;
🔴 Bitcoin Magazine: Bitcoin's Relative Strength Index (RSI) has bounced off a low, a signal that typically marks the start of a bull market;
🔴 Bitcoin in 2026 vs. the end of the 2022 bear market: 97% daily correlation;
🔴 Bitcoin shifts to a futures-dominated regime amid weak spot market demand;
🔴 In 2026, 64% of the top 100 altcoins are outperforming BTC;
🔴 El Salvador shifts to stablecoins as Bitcoin payments fail to gain traction;
🔴 Grayscale reports that Zcash's market cap has grown from approximately 0.1% to 1.5% of Bitcoin's market cap over the past year, and expects demand for privacy-focused cryptocurrencies to drive further growth;
🔴 Trading volume on Robinhood Chain hit a record weekly high of approximately $4.5 billion last week;
🔴 ARK Invest CEO Cathie Wood stated on X that the firm has re-added the private prediction market platform Kalshi to its ETF strategy;
🔴 Spark is significantly outperforming other players in the lending market. The volume of outstanding loans has surged by approximately 190% over the past 180 days to $2.9 billion, making Spark the fastest-growing protocol among the top 10 by outstanding loan volume;
🔴The number of card payment transactions using stablecoins more than doubled, showing 115% growth since January;
🔴PCE index data is due for release today;
🔴Today saw a sharp shift in interest rate hike forecasts: following "dovish" comments from John Williams—stating there is no "urgent need" to take action—the probability of a rate hike plummeted from 68% to 44%, while the likelihood of no hike nearly doubled, reaching 56%.
Today's News‼️
⭕️ Total BTC ETF flow: +$66.2M (BlackRock, Ark Invest);
⭕️ Total ETH ETF flow: -$2.8M (Fidelity, BlackRock);
⭕️ Total SOL ETF flow: +$5.4M (Bitwise);
⭕️ Total HYPE ETF flow: $0M;
🔴 82% of Bitcoin addresses are currently in profit;
🔴 Bitcoin Magazine: Bitcoin's Relative Strength Index (RSI) has bounced off a low, a signal that typically marks the start of a bull market;
🔴 Bitcoin in 2026 vs. the end of the 2022 bear market: 97% daily correlation;
🔴 Bitcoin shifts to a futures-dominated regime amid weak spot market demand;
🔴 In 2026, 64% of the top 100 altcoins are outperforming BTC;
🔴 El Salvador shifts to stablecoins as Bitcoin payments fail to gain traction;
🔴 Grayscale reports that Zcash's market cap has grown from approximately 0.1% to 1.5% of Bitcoin's market cap over the past year, and expects demand for privacy-focused cryptocurrencies to drive further growth;
🔴 Trading volume on Robinhood Chain hit a record weekly high of approximately $4.5 billion last week;
🔴 ARK Invest CEO Cathie Wood stated on X that the firm has re-added the private prediction market platform Kalshi to its ETF strategy;
🔴 Spark is significantly outperforming other players in the lending market. The volume of outstanding loans has surged by approximately 190% over the past 180 days to $2.9 billion, making Spark the fastest-growing protocol among the top 10 by outstanding loan volume;
🔴The number of card payment transactions using stablecoins more than doubled, showing 115% growth since January;
🔴PCE index data is due for release today;
🔴Today saw a sharp shift in interest rate hike forecasts: following "dovish" comments from John Williams—stating there is no "urgent need" to take action—the probability of a rate hike plummeted from 68% to 44%, while the likelihood of no hike nearly doubled, reaching 56%.
⭕️ Total BTC ETF flow: +$66.2M (BlackRock, Ark Invest);
⭕️ Total ETH ETF flow: -$2.8M (Fidelity, BlackRock);
⭕️ Total SOL ETF flow: +$5.4M (Bitwise);
⭕️ Total HYPE ETF flow: $0M;
🔴 82% of Bitcoin addresses are currently in profit;
🔴 Bitcoin Magazine: Bitcoin's Relative Strength Index (RSI) has bounced off a low, a signal that typically marks the start of a bull market;
🔴 Bitcoin in 2026 vs. the end of the 2022 bear market: 97% daily correlation;
🔴 Bitcoin shifts to a futures-dominated regime amid weak spot market demand;
🔴 In 2026, 64% of the top 100 altcoins are outperforming BTC;
🔴 El Salvador shifts to stablecoins as Bitcoin payments fail to gain traction;
🔴 Grayscale reports that Zcash's market cap has grown from approximately 0.1% to 1.5% of Bitcoin's market cap over the past year, and expects demand for privacy-focused cryptocurrencies to drive further growth;
🔴 Trading volume on Robinhood Chain hit a record weekly high of approximately $4.5 billion last week;
🔴 ARK Invest CEO Cathie Wood stated on X that the firm has re-added the private prediction market platform Kalshi to its ETF strategy;
🔴 Spark is significantly outperforming other players in the lending market. The volume of outstanding loans has surged by approximately 190% over the past 180 days to $2.9 billion, making Spark the fastest-growing protocol among the top 10 by outstanding loan volume;
🔴The number of card payment transactions using stablecoins more than doubled, showing 115% growth since January;
🔴PCE index data is due for release today;
🔴Today saw a sharp shift in interest rate hike forecasts: following "dovish" comments from John Williams—stating there is no "urgent need" to take action—the probability of a rate hike plummeted from 68% to 44%, while the likelihood of no hike nearly doubled, reaching 56%.

1
114
·
--
Today's News‼️
⭕️ Total BTC ETF flow: +$31.0M (BlackRock);
⭕️ Total ETH ETF flow: +$17.1M (BlackRock, 21Shares);
⭕️ Total SOL ETF flow: +$7.7M (Bitwise);
⭕️ Total HYPE ETF flow: $0M;
🔴 Spark, a Bitcoin Layer-2 payment protocol, has allocated a total of $210 million for institutional lending backed by BTC collateral, in partnership with Anchorage Digital;
🔴 Short-term holders (STHs) panic at the slightest price drop. Bitcoin fell by just $3,000, yet that was enough for STHs to send nearly 23,000 BTC to exchanges at a loss. Selling at a loss dominated the flows over the past 24 hours. Nevertheless, 14,300 BTC were sent to exchanges at a profit.
🔴 On-Chain Mind: The Mayer Multiple—one of the most popular Bitcoin valuation metrics—sits at the 59th percentile historically. It is almost perfectly in the middle of the range: neither cheap nor overheated;
🔴 Some experts, comparing Bitcoin's price action to 2015 data and applying the Sharpe ratio, suggest a potential 22% price correction;
🔴 A Cointelegraph Research backtest using data from 2015–2025 showed that a traditional 60/40 portfolio (stocks and bonds) yielded an annual return of 8.96%, whereas a portfolio with a 5% BTC allocation returned 16.39% annually; 🔴 Blockchain(com) plans to raise $500 million in an IPO at a valuation of $4–6 billion (Bloomberg);
🔴 Coinbase has received CFTC approval to register Coinbase Clearing LLC as a derivatives clearing organization;
🔴 Polymarket is launching "15-minute BTC markets" in its app for US users;
🔴 JPMorgan traders have turned bullish on US stocks ahead of the jobs report release;
🔴 A sharp contrast is evident between low stock volatility and rising tension in the debt market, where spreads on riskier bonds have begun to widen rapidly;
🔴 56% of S&P 500 stocks are currently trading below their 200-day moving average—the worst market breadth reading since March;
🔴 Oil prices continue to rise as uncertainty regarding Iran outweighs the resumption of supplies from Saudi Arabia.
Today's News‼️
⭕️ Total BTC ETF flow: +$31.0M (BlackRock);
⭕️ Total ETH ETF flow: +$17.1M (BlackRock, 21Shares);
⭕️ Total SOL ETF flow: +$7.7M (Bitwise);
⭕️ Total HYPE ETF flow: $0M;
🔴 Spark, a Bitcoin Layer-2 payment protocol, has allocated a total of $210 million for institutional lending backed by BTC collateral, in partnership with Anchorage Digital;
🔴 Short-term holders (STHs) panic at the slightest price drop. Bitcoin fell by just $3,000, yet that was enough for STHs to send nearly 23,000 BTC to exchanges at a loss. Selling at a loss dominated the flows over the past 24 hours. Nevertheless, 14,300 BTC were sent to exchanges at a profit.
🔴 On-Chain Mind: The Mayer Multiple—one of the most popular Bitcoin valuation metrics—sits at the 59th percentile historically. It is almost perfectly in the middle of the range: neither cheap nor overheated;
🔴 Some experts, comparing Bitcoin's price action to 2015 data and applying the Sharpe ratio, suggest a potential 22% price correction;
🔴 A Cointelegraph Research backtest using data from 2015–2025 showed that a traditional 60/40 portfolio (stocks and bonds) yielded an annual return of 8.96%, whereas a portfolio with a 5% BTC allocation returned 16.39% annually; 🔴 Blockchain(com) plans to raise $500 million in an IPO at a valuation of $4–6 billion (Bloomberg);
🔴 Coinbase has received CFTC approval to register Coinbase Clearing LLC as a derivatives clearing organization;
🔴 Polymarket is launching "15-minute BTC markets" in its app for US users;
🔴 JPMorgan traders have turned bullish on US stocks ahead of the jobs report release;
🔴 A sharp contrast is evident between low stock volatility and rising tension in the debt market, where spreads on riskier bonds have begun to widen rapidly;
🔴 56% of S&P 500 stocks are currently trading below their 200-day moving average—the worst market breadth reading since March;
🔴 Oil prices continue to rise as uncertainty regarding Iran outweighs the resumption of supplies from Saudi Arabia.
⭕️ Total BTC ETF flow: +$31.0M (BlackRock);
⭕️ Total ETH ETF flow: +$17.1M (BlackRock, 21Shares);
⭕️ Total SOL ETF flow: +$7.7M (Bitwise);
⭕️ Total HYPE ETF flow: $0M;
🔴 Spark, a Bitcoin Layer-2 payment protocol, has allocated a total of $210 million for institutional lending backed by BTC collateral, in partnership with Anchorage Digital;
🔴 Short-term holders (STHs) panic at the slightest price drop. Bitcoin fell by just $3,000, yet that was enough for STHs to send nearly 23,000 BTC to exchanges at a loss. Selling at a loss dominated the flows over the past 24 hours. Nevertheless, 14,300 BTC were sent to exchanges at a profit.
🔴 On-Chain Mind: The Mayer Multiple—one of the most popular Bitcoin valuation metrics—sits at the 59th percentile historically. It is almost perfectly in the middle of the range: neither cheap nor overheated;
🔴 Some experts, comparing Bitcoin's price action to 2015 data and applying the Sharpe ratio, suggest a potential 22% price correction;
🔴 A Cointelegraph Research backtest using data from 2015–2025 showed that a traditional 60/40 portfolio (stocks and bonds) yielded an annual return of 8.96%, whereas a portfolio with a 5% BTC allocation returned 16.39% annually; 🔴 Blockchain(com) plans to raise $500 million in an IPO at a valuation of $4–6 billion (Bloomberg);
🔴 Coinbase has received CFTC approval to register Coinbase Clearing LLC as a derivatives clearing organization;
🔴 Polymarket is launching "15-minute BTC markets" in its app for US users;
🔴 JPMorgan traders have turned bullish on US stocks ahead of the jobs report release;
🔴 A sharp contrast is evident between low stock volatility and rising tension in the debt market, where spreads on riskier bonds have begun to widen rapidly;
🔴 56% of S&P 500 stocks are currently trading below their 200-day moving average—the worst market breadth reading since March;
🔴 Oil prices continue to rise as uncertainty regarding Iran outweighs the resumption of supplies from Saudi Arabia.

1
114
·
--
$BTC today‼️
The forecast yielded a profit of at least 20% if you used the $84,400 level as a pivot point for trading long and short positions.
It was crucial for the bulls to close the weekly candle above $84,400 to maintain a sustained uptrend; the current decline signals weakness ahead of macroeconomic data releases. Bearish pressure is currently pushing the price to test the upper boundary of the implied descending trading channel. I am currently holding a short position, but I will close it as soon as I see signs of a short-term price recovery.
Just as I predicted, the price was first pushed outside the trading pattern, then market participants were lured into a bull trap, and now the majority of long positions are being liquidated. Geopolitical factors are weighing on the markets—signals we have analyzed together many times. I anticipate that today’s data will show either outflows from ETFs or only negligible inflows. The Coinbase Bitcoin Premium Index has dropped to lower levels, further indicating weak buying power. My plan for today is to secure a profit of at least 10%. I intend to trade near the upper boundary of the channel shown on the Bitcoin price chart.
Wishing everyone profitable trades💰💪
$BTC today‼️
The forecast yielded a profit of at least 20% if you used the $84,400 level as a pivot point for trading long and short positions.
It was crucial for the bulls to close the weekly candle above $84,400 to maintain a sustained uptrend; the current decline signals weakness ahead of macroeconomic data releases. Bearish pressure is currently pushing the price to test the upper boundary of the implied descending trading channel. I am currently holding a short position, but I will close it as soon as I see signs of a short-term price recovery.
Just as I predicted, the price was first pushed outside the trading pattern, then market participants were lured into a bull trap, and now the majority of long positions are being liquidated. Geopolitical factors are weighing on the markets—signals we have analyzed together many times. I anticipate that today’s data will show either outflows from ETFs or only negligible inflows. The Coinbase Bitcoin Premium Index has dropped to lower levels, further indicating weak buying power. My plan for today is to secure a profit of at least 10%. I intend to trade near the upper boundary of the channel shown on the Bitcoin price chart.
Wishing everyone profitable trades💰💪
The forecast yielded a profit of at least 20% if you used the $84,400 level as a pivot point for trading long and short positions.
It was crucial for the bulls to close the weekly candle above $84,400 to maintain a sustained uptrend; the current decline signals weakness ahead of macroeconomic data releases. Bearish pressure is currently pushing the price to test the upper boundary of the implied descending trading channel. I am currently holding a short position, but I will close it as soon as I see signs of a short-term price recovery.
Just as I predicted, the price was first pushed outside the trading pattern, then market participants were lured into a bull trap, and now the majority of long positions are being liquidated. Geopolitical factors are weighing on the markets—signals we have analyzed together many times. I anticipate that today’s data will show either outflows from ETFs or only negligible inflows. The Coinbase Bitcoin Premium Index has dropped to lower levels, further indicating weak buying power. My plan for today is to secure a profit of at least 10%. I intend to trade near the upper boundary of the channel shown on the Bitcoin price chart.
Wishing everyone profitable trades💰💪
fear_greed
·
--
$BTC today‼️
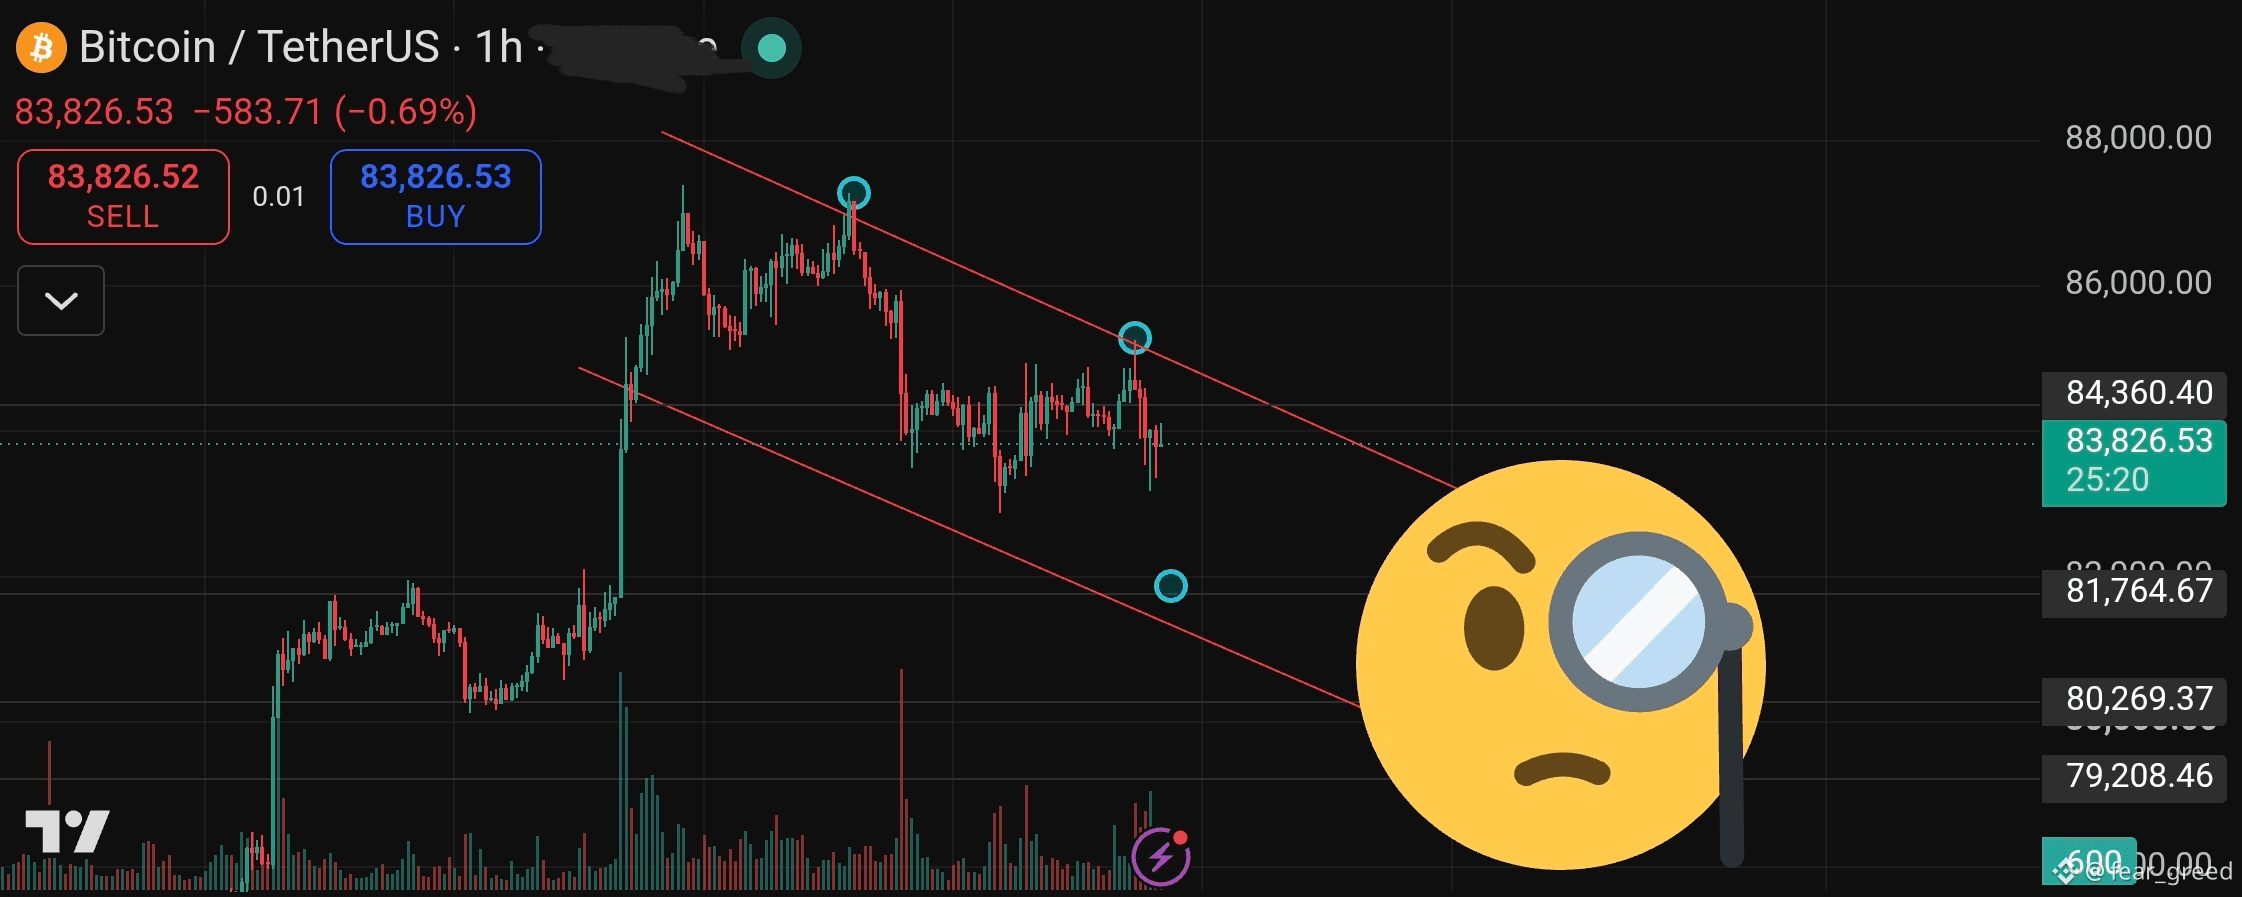
The bulls made a solid attempt to break the resistance level at $85,200—a move that yielded at least a 10% profit if you followed my trading forecasts. That 10% return marks this as one of the most successful strategies in my arsenal. (Not financial advice.) The trading channel is proving effective. The price bounced precisely off the upper boundary. By the way, I’m also seeing profits on spot holdings of $POL (bought below $0.10) and $SOL (which hit $122).
A price correction toward the channel's median line actually signals bullish weakness:
ETF inflows have dropped significantly;
the Coinbase Bitcoin Premium Index is showing negative values;
attacks on centralized exchanges are slowing capital inflows.
I also wouldn't rule out "spoofing" by major players.
However, these conditions favor short trades, which are worth considering during the trading day.
For sustained growth, I’d like to see the price hit $82,200 (the bearish target), where I would open a large long position.
Alternatively, I’d look for the price to stabilize above $84,400. Given current market indecision, the price would likely move sideways before breaking out of the current pattern.
Wishing everyone profitable trades💰💪
The bulls made a solid attempt to break the resistance level at $85,200—a move that yielded at least a 10% profit if you followed my trading forecasts. That 10% return marks this as one of the most successful strategies in my arsenal. (Not financial advice.) The trading channel is proving effective. The price bounced precisely off the upper boundary. By the way, I’m also seeing profits on spot holdings of $POL (bought below $0.10) and $SOL (which hit $122).
A price correction toward the channel's median line actually signals bullish weakness:
ETF inflows have dropped significantly;
the Coinbase Bitcoin Premium Index is showing negative values;
attacks on centralized exchanges are slowing capital inflows.
I also wouldn't rule out "spoofing" by major players.
However, these conditions favor short trades, which are worth considering during the trading day.
For sustained growth, I’d like to see the price hit $82,200 (the bearish target), where I would open a large long position.
Alternatively, I’d look for the price to stabilize above $84,400. Given current market indecision, the price would likely move sideways before breaking out of the current pattern.
Wishing everyone profitable trades💰💪
1
1
91
·
--
Today's News‼️
⭕️ Total BTC ETF flow: +$134.5M (BlackRock, Fidelity);
⭕️ Total ETH ETF flow: +$87.0M (Fidelity, BlackRock);
⭕️ Total SOL ETF flow: +$86.7M (Bitwise, Fidelity, VanEck, Morgan Stanley, Grayscale);
⭕️ Total HYPE ETF flow: +$3.2M (Grayscale);
🔴 Capitulation by major buyers continues. The rally toward the $84,000 mark has prompted investors in the most unfavorable positions to seize the opportunity to exit the market and limit their losses;
🔴 81% of the total $BTC supply has not moved for 6 months;
🔴 Fidelity: Bitcoin looks particularly interesting right now as it tests the key resistance level of $80,000. A breakout would confirm a "double bottom" pattern with a target price of $100,000;
🔴 The market capitalization of euro-denominated stablecoins is approaching $1 billion, compared to $300.7 billion for dollar-denominated stablecoins;
🔴 It has been 354 days since Bitcoin reached a high of $126,080. The current price is $84,597, down 32.9%. In 2017, the ultimate low (a drop of 83.3%) was reached on day 363. There are 9 days left until that mark. In 2021, a low of 76.7% was reached on day 378. In both instances, the depth of the decline at that stage was more than double the current figure;
🔴 Coinbase ranks fourth among issuers of tokenized stocks by trading volume on spot decentralized exchanges (DEXs) over the past 30 days. Trading volume for Coinbase-issued tokenized stocks totaled $1.2 billion, trailing Robinhood ($10.4 billion), Binance bStocks ($5.6 billion), and xStocks ($1.8 billion);
🔴 CoinMarketCap, owned by Binance, is acquiring the crypto derivatives data platform CoinGlass;
🔴 The market has capitulated: market breadth is no longer expanding—for the ninth consecutive day, the number of 52-week lows has exceeded the number of highs;
🔴 On the monthly chart, the yield on 10-year Treasury bonds is on the verge of breaking through a 25-year resistance level.
Today's News‼️
⭕️ Total BTC ETF flow: +$134.5M (BlackRock, Fidelity);
⭕️ Total ETH ETF flow: +$87.0M (Fidelity, BlackRock);
⭕️ Total SOL ETF flow: +$86.7M (Bitwise, Fidelity, VanEck, Morgan Stanley, Grayscale);
⭕️ Total HYPE ETF flow: +$3.2M (Grayscale);
🔴 Capitulation by major buyers continues. The rally toward the $84,000 mark has prompted investors in the most unfavorable positions to seize the opportunity to exit the market and limit their losses;
🔴 81% of the total $BTC supply has not moved for 6 months;
🔴 Fidelity: Bitcoin looks particularly interesting right now as it tests the key resistance level of $80,000. A breakout would confirm a "double bottom" pattern with a target price of $100,000;
🔴 The market capitalization of euro-denominated stablecoins is approaching $1 billion, compared to $300.7 billion for dollar-denominated stablecoins;
🔴 It has been 354 days since Bitcoin reached a high of $126,080. The current price is $84,597, down 32.9%. In 2017, the ultimate low (a drop of 83.3%) was reached on day 363. There are 9 days left until that mark. In 2021, a low of 76.7% was reached on day 378. In both instances, the depth of the decline at that stage was more than double the current figure;
🔴 Coinbase ranks fourth among issuers of tokenized stocks by trading volume on spot decentralized exchanges (DEXs) over the past 30 days. Trading volume for Coinbase-issued tokenized stocks totaled $1.2 billion, trailing Robinhood ($10.4 billion), Binance bStocks ($5.6 billion), and xStocks ($1.8 billion);
🔴 CoinMarketCap, owned by Binance, is acquiring the crypto derivatives data platform CoinGlass;
🔴 The market has capitulated: market breadth is no longer expanding—for the ninth consecutive day, the number of 52-week lows has exceeded the number of highs;
🔴 On the monthly chart, the yield on 10-year Treasury bonds is on the verge of breaking through a 25-year resistance level.
⭕️ Total BTC ETF flow: +$134.5M (BlackRock, Fidelity);
⭕️ Total ETH ETF flow: +$87.0M (Fidelity, BlackRock);
⭕️ Total SOL ETF flow: +$86.7M (Bitwise, Fidelity, VanEck, Morgan Stanley, Grayscale);
⭕️ Total HYPE ETF flow: +$3.2M (Grayscale);
🔴 Capitulation by major buyers continues. The rally toward the $84,000 mark has prompted investors in the most unfavorable positions to seize the opportunity to exit the market and limit their losses;
🔴 81% of the total $BTC supply has not moved for 6 months;
🔴 Fidelity: Bitcoin looks particularly interesting right now as it tests the key resistance level of $80,000. A breakout would confirm a "double bottom" pattern with a target price of $100,000;
🔴 The market capitalization of euro-denominated stablecoins is approaching $1 billion, compared to $300.7 billion for dollar-denominated stablecoins;
🔴 It has been 354 days since Bitcoin reached a high of $126,080. The current price is $84,597, down 32.9%. In 2017, the ultimate low (a drop of 83.3%) was reached on day 363. There are 9 days left until that mark. In 2021, a low of 76.7% was reached on day 378. In both instances, the depth of the decline at that stage was more than double the current figure;
🔴 Coinbase ranks fourth among issuers of tokenized stocks by trading volume on spot decentralized exchanges (DEXs) over the past 30 days. Trading volume for Coinbase-issued tokenized stocks totaled $1.2 billion, trailing Robinhood ($10.4 billion), Binance bStocks ($5.6 billion), and xStocks ($1.8 billion);
🔴 CoinMarketCap, owned by Binance, is acquiring the crypto derivatives data platform CoinGlass;
🔴 The market has capitulated: market breadth is no longer expanding—for the ninth consecutive day, the number of 52-week lows has exceeded the number of highs;
🔴 On the monthly chart, the yield on 10-year Treasury bonds is on the verge of breaking through a 25-year resistance level.

149
·
--
$BTC today‼️
The bulls made a solid attempt to break the resistance level at $85,200—a move that yielded at least a 10% profit if you followed my trading forecasts. That 10% return marks this as one of the most successful strategies in my arsenal. (Not financial advice.) The trading channel is proving effective. The price bounced precisely off the upper boundary. By the way, I’m also seeing profits on spot holdings of $POL (bought below $0.10) and $SOL (which hit $122).
A price correction toward the channel's median line actually signals bullish weakness:
ETF inflows have dropped significantly;
the Coinbase Bitcoin Premium Index is showing negative values;
attacks on centralized exchanges are slowing capital inflows.
I also wouldn't rule out "spoofing" by major players.
However, these conditions favor short trades, which are worth considering during the trading day.
For sustained growth, I’d like to see the price hit $82,200 (the bearish target), where I would open a large long position.
Alternatively, I’d look for the price to stabilize above $84,400. Given current market indecision, the price would likely move sideways before breaking out of the current pattern.
Wishing everyone profitable trades💰💪
$BTC today‼️
The bulls made a solid attempt to break the resistance level at $85,200—a move that yielded at least a 10% profit if you followed my trading forecasts. That 10% return marks this as one of the most successful strategies in my arsenal. (Not financial advice.) The trading channel is proving effective. The price bounced precisely off the upper boundary. By the way, I’m also seeing profits on spot holdings of $POL (bought below $0.10) and $SOL (which hit $122).
A price correction toward the channel's median line actually signals bullish weakness:
ETF inflows have dropped significantly;
the Coinbase Bitcoin Premium Index is showing negative values;
attacks on centralized exchanges are slowing capital inflows.
I also wouldn't rule out "spoofing" by major players.
However, these conditions favor short trades, which are worth considering during the trading day.
For sustained growth, I’d like to see the price hit $82,200 (the bearish target), where I would open a large long position.
Alternatively, I’d look for the price to stabilize above $84,400. Given current market indecision, the price would likely move sideways before breaking out of the current pattern.
Wishing everyone profitable trades💰💪
The bulls made a solid attempt to break the resistance level at $85,200—a move that yielded at least a 10% profit if you followed my trading forecasts. That 10% return marks this as one of the most successful strategies in my arsenal. (Not financial advice.) The trading channel is proving effective. The price bounced precisely off the upper boundary. By the way, I’m also seeing profits on spot holdings of $POL (bought below $0.10) and $SOL (which hit $122).
A price correction toward the channel's median line actually signals bullish weakness:
ETF inflows have dropped significantly;
the Coinbase Bitcoin Premium Index is showing negative values;
attacks on centralized exchanges are slowing capital inflows.
I also wouldn't rule out "spoofing" by major players.
However, these conditions favor short trades, which are worth considering during the trading day.
For sustained growth, I’d like to see the price hit $82,200 (the bearish target), where I would open a large long position.
Alternatively, I’d look for the price to stabilize above $84,400. Given current market indecision, the price would likely move sideways before breaking out of the current pattern.
Wishing everyone profitable trades💰💪
fear_greed
·
--
$BTC today‼️
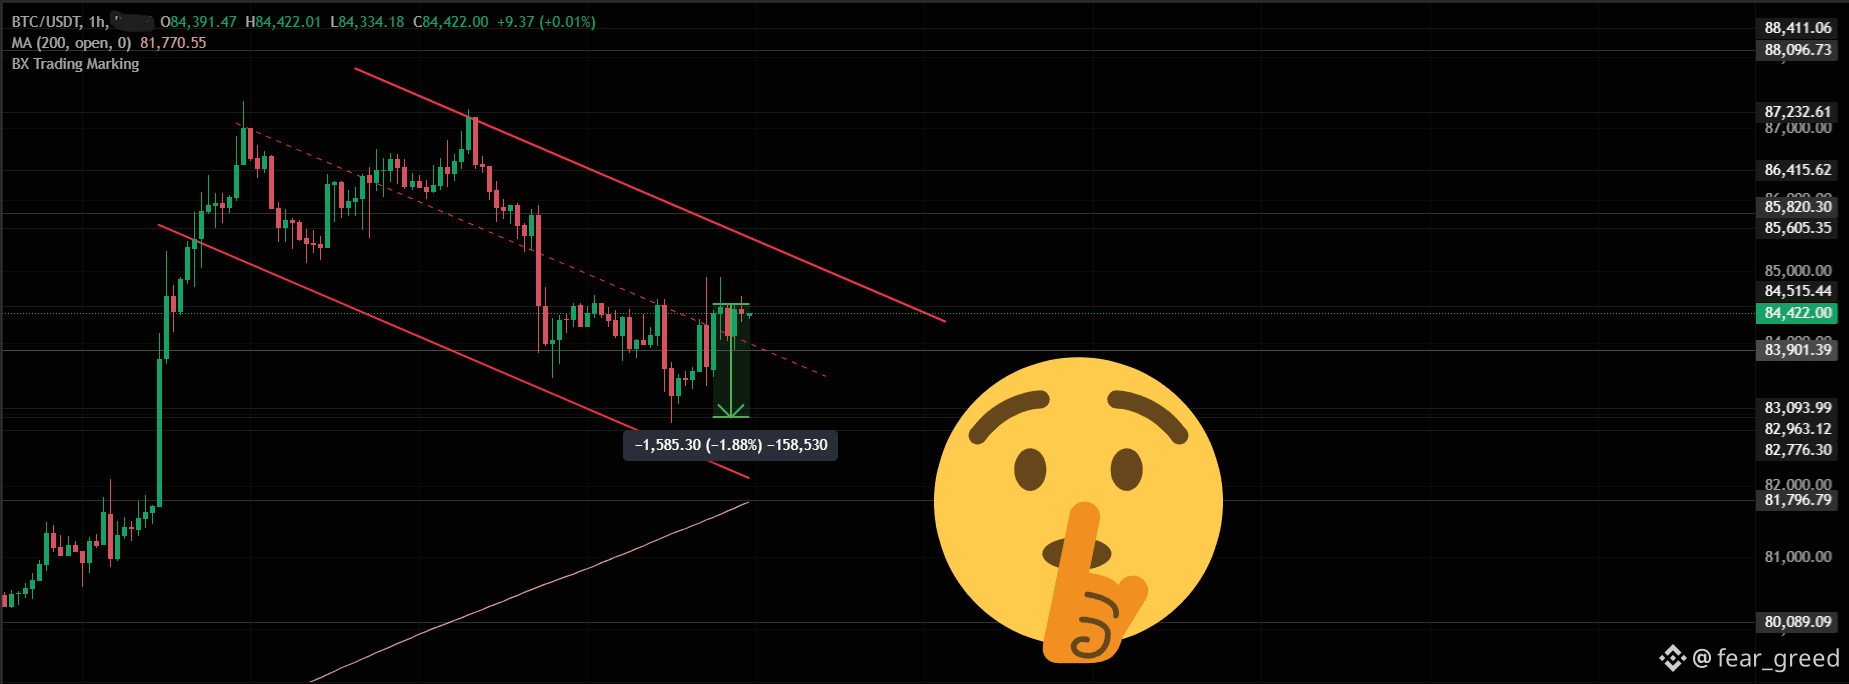
How are you doing today, traders? If you briefly donned a "bearish" outfit like I did, you would have secured at least a 15% profit by opening a short position from the $84,400 level. Trading continues within the hypothetical channel I plotted on the chart yesterday. Bitcoin's current pause and price consolidation near the hourly channel's median (indicated by the dashed lines inside the channel) are a direct result of shifting supply-demand dynamics among market participants over the last 24 hours, driven by specific triggers:
1. A spike in US bond yields;
2. Some profit-taking by buyers;
3. Uncertainty in the oil market.
It is crucial right now to gauge the bulls' strength and follow the trend; I am closely monitoring price action and shifts in market sentiment under the influence of the aforementioned triggers.
If the price fails to hold above the hypothetical median line within the next few hours, I will look to short; conversely, if the price establishes itself above $84,400, I will look for long opportunities. Not financial advice. Do your own research.
Wishing everyone profitable trades💰💪
How are you doing today, traders? If you briefly donned a "bearish" outfit like I did, you would have secured at least a 15% profit by opening a short position from the $84,400 level. Trading continues within the hypothetical channel I plotted on the chart yesterday. Bitcoin's current pause and price consolidation near the hourly channel's median (indicated by the dashed lines inside the channel) are a direct result of shifting supply-demand dynamics among market participants over the last 24 hours, driven by specific triggers:
1. A spike in US bond yields;
2. Some profit-taking by buyers;
3. Uncertainty in the oil market.
It is crucial right now to gauge the bulls' strength and follow the trend; I am closely monitoring price action and shifts in market sentiment under the influence of the aforementioned triggers.
If the price fails to hold above the hypothetical median line within the next few hours, I will look to short; conversely, if the price establishes itself above $84,400, I will look for long opportunities. Not financial advice. Do your own research.
Wishing everyone profitable trades💰💪
1
1
229
·
--
$BTC today‼️
How are you doing today, traders? If you briefly donned a "bearish" outfit like I did, you would have secured at least a 15% profit by opening a short position from the $84,400 level. Trading continues within the hypothetical channel I plotted on the chart yesterday. Bitcoin's current pause and price consolidation near the hourly channel's median (indicated by the dashed lines inside the channel) are a direct result of shifting supply-demand dynamics among market participants over the last 24 hours, driven by specific triggers:
1. A spike in US bond yields;
2. Some profit-taking by buyers;
3. Uncertainty in the oil market.
It is crucial right now to gauge the bulls' strength and follow the trend; I am closely monitoring price action and shifts in market sentiment under the influence of the aforementioned triggers.
If the price fails to hold above the hypothetical median line within the next few hours, I will look to short; conversely, if the price establishes itself above $84,400, I will look for long opportunities. Not financial advice. Do your own research.
Wishing everyone profitable trades💰💪
$BTC today‼️
How are you doing today, traders? If you briefly donned a "bearish" outfit like I did, you would have secured at least a 15% profit by opening a short position from the $84,400 level. Trading continues within the hypothetical channel I plotted on the chart yesterday. Bitcoin's current pause and price consolidation near the hourly channel's median (indicated by the dashed lines inside the channel) are a direct result of shifting supply-demand dynamics among market participants over the last 24 hours, driven by specific triggers:
1. A spike in US bond yields;
2. Some profit-taking by buyers;
3. Uncertainty in the oil market.
It is crucial right now to gauge the bulls' strength and follow the trend; I am closely monitoring price action and shifts in market sentiment under the influence of the aforementioned triggers.
If the price fails to hold above the hypothetical median line within the next few hours, I will look to short; conversely, if the price establishes itself above $84,400, I will look for long opportunities. Not financial advice. Do your own research.
Wishing everyone profitable trades💰💪
How are you doing today, traders? If you briefly donned a "bearish" outfit like I did, you would have secured at least a 15% profit by opening a short position from the $84,400 level. Trading continues within the hypothetical channel I plotted on the chart yesterday. Bitcoin's current pause and price consolidation near the hourly channel's median (indicated by the dashed lines inside the channel) are a direct result of shifting supply-demand dynamics among market participants over the last 24 hours, driven by specific triggers:
1. A spike in US bond yields;
2. Some profit-taking by buyers;
3. Uncertainty in the oil market.
It is crucial right now to gauge the bulls' strength and follow the trend; I am closely monitoring price action and shifts in market sentiment under the influence of the aforementioned triggers.
If the price fails to hold above the hypothetical median line within the next few hours, I will look to short; conversely, if the price establishes itself above $84,400, I will look for long opportunities. Not financial advice. Do your own research.
Wishing everyone profitable trades💰💪
fear_greed
·
--
$BTC today‼️
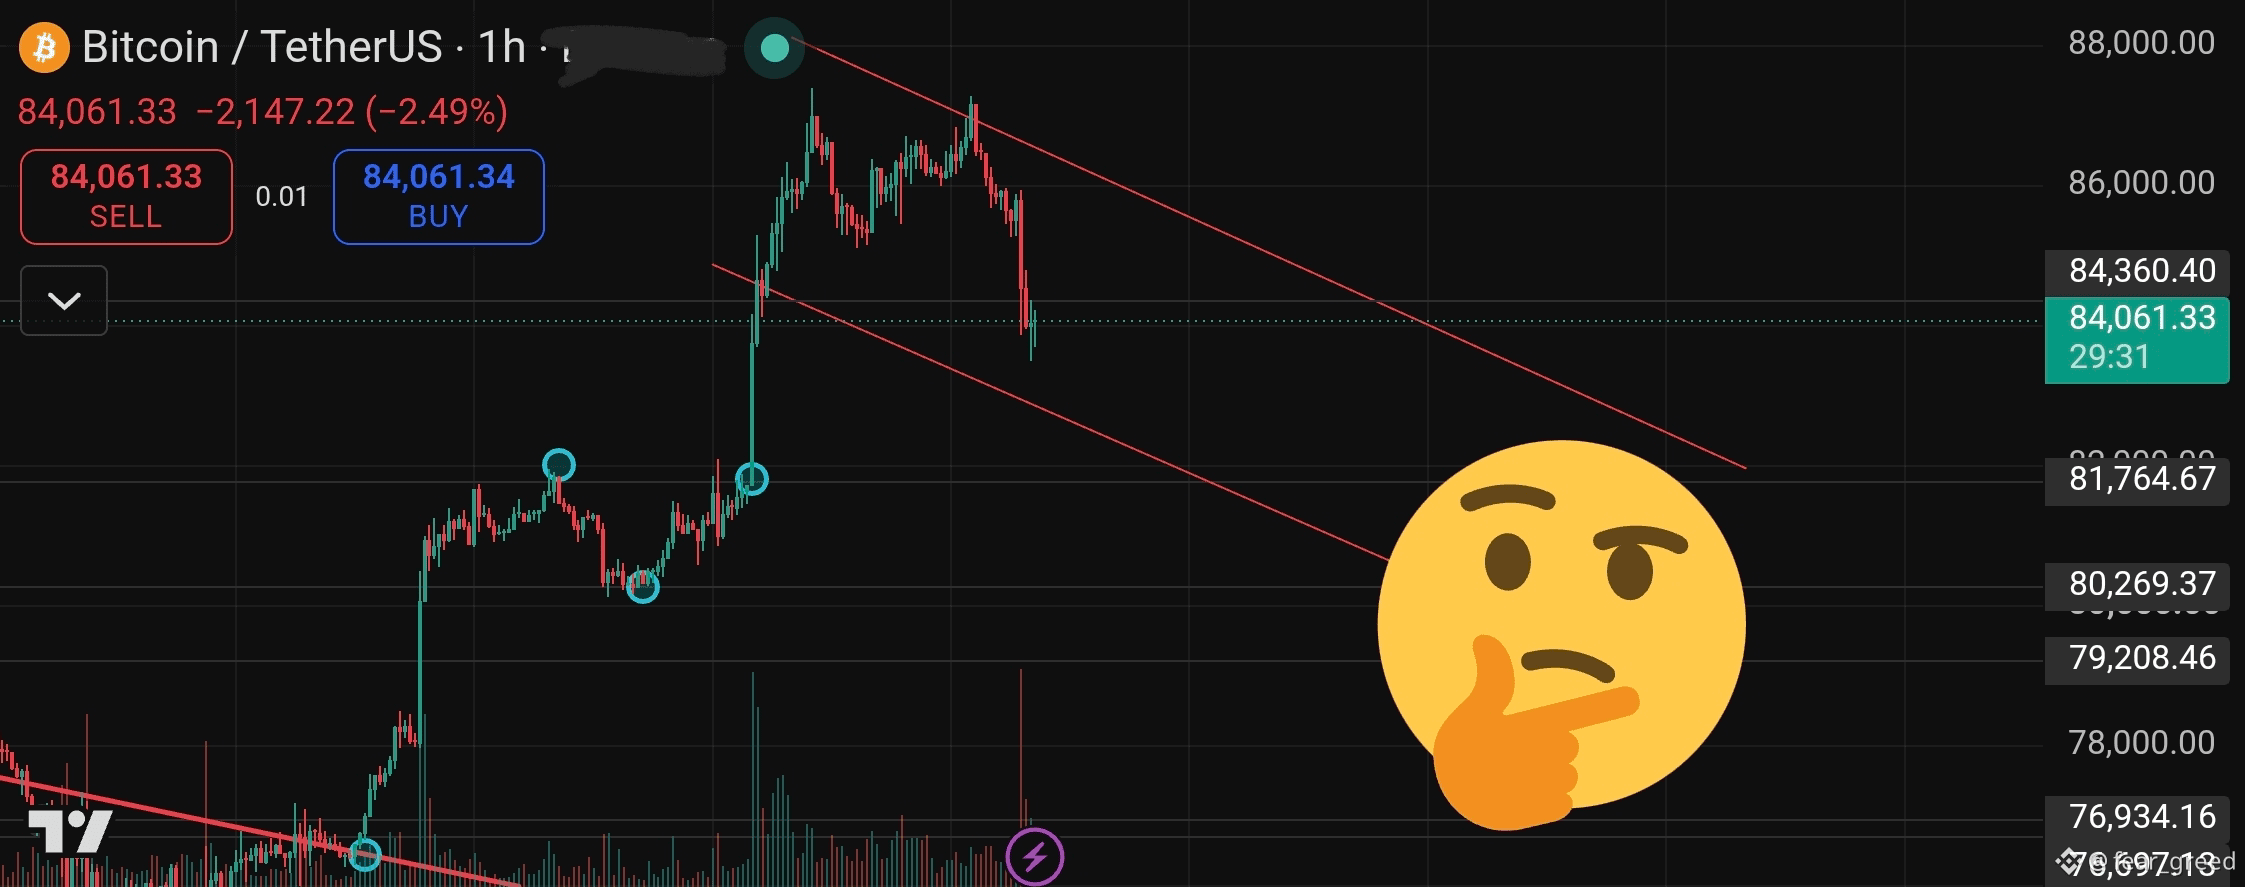
The chart shows the boundaries of a trading channel I mapped out today. I am currently trading within it. Long-time followers know that I overlay general market sentiment onto technical analysis, utilizing dozens of indicators, broad market metrics, and key resistance levels.
Price action often forms these types of channels under pressure from large wallet clusters—it has become a recurring pattern.
I hope you took note of my posts regarding cyclical price pressure, the patterns observed during spikes in large ETF inflows during bear markets, and the rising profit-taking ratio. If so, you—like me—are profiting from short positions today.
Remember how I used to frequently post data on petroleum products? The pressure is mounting; no matter how hard some politicians try to mask this fact with a thick layer of "manipulative makeup," they simply cannot hide it.
Right now, I am focusing on the $84,400 level—a key liquidity pocket. I have closed out my short positions, including those on prediction markets.
If the bulls fail to hold that price level, I believe short positions will be the priority.
Wishing everyone profitable trades💰💪
The chart shows the boundaries of a trading channel I mapped out today. I am currently trading within it. Long-time followers know that I overlay general market sentiment onto technical analysis, utilizing dozens of indicators, broad market metrics, and key resistance levels.
Price action often forms these types of channels under pressure from large wallet clusters—it has become a recurring pattern.
I hope you took note of my posts regarding cyclical price pressure, the patterns observed during spikes in large ETF inflows during bear markets, and the rising profit-taking ratio. If so, you—like me—are profiting from short positions today.
Remember how I used to frequently post data on petroleum products? The pressure is mounting; no matter how hard some politicians try to mask this fact with a thick layer of "manipulative makeup," they simply cannot hide it.
Right now, I am focusing on the $84,400 level—a key liquidity pocket. I have closed out my short positions, including those on prediction markets.
If the bulls fail to hold that price level, I believe short positions will be the priority.
Wishing everyone profitable trades💰💪
1
1
122
·
--
Today's News‼️
⭕️ Total BTC ETF flow: +$346.98M;
🔴 Sentiment: Wallets holding between 100 and 1,000 BTC are rapidly increasing their holdings. Since July 15, their combined assets have grown by 113,950 BTC (a 2.22% increase), reaching approximately 5.24 million BTC;
🔴 Indicators show Bitcoin's price deviating from the traditional 4-year cycle;
🔴 The 99th price percentile of Bitcoin's 200-day moving average (based on standard price, not the power law model) has just risen for the first time in over 120 days. In 9 out of 10 cases, this signals continued growth;
🔴 Bitcoin is currently in a high-leverage zone;
🔴 Glassnode: Holders are realizing profits on BTC. However, volumes remain relatively low: net profit over the last 7 days totaled $5.1 billion;
🔴 An institutional whale cashed out 80% of its ETH holdings just one day after adding 15,000 ETH;
🔴 21Shares has just launched a physically backed ZEC ETP in Europe, giving investors the opportunity to invest directly in Zcash via a traditional exchange-traded product;
🔴 The 365-day MVRV metric shows a significant gap between leading cryptocurrencies. BTC, ETH, and LINK are hovering just above 0%, meaning the average trader active over the past year is sitting on a small profit. Meanwhile, XRP stands at around -11.75%, and DOGE at around -19.26%;
🔴 Phantom will discontinue support for the Sui network; The US Dollar Index (DXY) is rising rapidly. The dollar is strengthening against major currencies amid expectations of Federal Reserve rate hikes driven by a surge in bond yields;
🔴 Despite gains in the S&P 500 and Nasdaq, the Dow and Russell 2000 continue to decline;
🔴 Traders have begun pricing in three 0.25-percentage-point Fed rate hikes over the coming year, as well as the possibility of a fourth. Consequently, the benchmark rate could reach the 4.75–5% range, increasing borrowing costs and putting pressure on mortgages, corporate loans, and other financial markets.
Today's News‼️
⭕️ Total BTC ETF flow: +$346.98M;
🔴 Sentiment: Wallets holding between 100 and 1,000 BTC are rapidly increasing their holdings. Since July 15, their combined assets have grown by 113,950 BTC (a 2.22% increase), reaching approximately 5.24 million BTC;
🔴 Indicators show Bitcoin's price deviating from the traditional 4-year cycle;
🔴 The 99th price percentile of Bitcoin's 200-day moving average (based on standard price, not the power law model) has just risen for the first time in over 120 days. In 9 out of 10 cases, this signals continued growth;
🔴 Bitcoin is currently in a high-leverage zone;
🔴 Glassnode: Holders are realizing profits on BTC. However, volumes remain relatively low: net profit over the last 7 days totaled $5.1 billion;
🔴 An institutional whale cashed out 80% of its ETH holdings just one day after adding 15,000 ETH;
🔴 21Shares has just launched a physically backed ZEC ETP in Europe, giving investors the opportunity to invest directly in Zcash via a traditional exchange-traded product;
🔴 The 365-day MVRV metric shows a significant gap between leading cryptocurrencies. BTC, ETH, and LINK are hovering just above 0%, meaning the average trader active over the past year is sitting on a small profit. Meanwhile, XRP stands at around -11.75%, and DOGE at around -19.26%;
🔴 Phantom will discontinue support for the Sui network; The US Dollar Index (DXY) is rising rapidly. The dollar is strengthening against major currencies amid expectations of Federal Reserve rate hikes driven by a surge in bond yields;
🔴 Despite gains in the S&P 500 and Nasdaq, the Dow and Russell 2000 continue to decline;
🔴 Traders have begun pricing in three 0.25-percentage-point Fed rate hikes over the coming year, as well as the possibility of a fourth. Consequently, the benchmark rate could reach the 4.75–5% range, increasing borrowing costs and putting pressure on mortgages, corporate loans, and other financial markets.
⭕️ Total BTC ETF flow: +$346.98M;
🔴 Sentiment: Wallets holding between 100 and 1,000 BTC are rapidly increasing their holdings. Since July 15, their combined assets have grown by 113,950 BTC (a 2.22% increase), reaching approximately 5.24 million BTC;
🔴 Indicators show Bitcoin's price deviating from the traditional 4-year cycle;
🔴 The 99th price percentile of Bitcoin's 200-day moving average (based on standard price, not the power law model) has just risen for the first time in over 120 days. In 9 out of 10 cases, this signals continued growth;
🔴 Bitcoin is currently in a high-leverage zone;
🔴 Glassnode: Holders are realizing profits on BTC. However, volumes remain relatively low: net profit over the last 7 days totaled $5.1 billion;
🔴 An institutional whale cashed out 80% of its ETH holdings just one day after adding 15,000 ETH;
🔴 21Shares has just launched a physically backed ZEC ETP in Europe, giving investors the opportunity to invest directly in Zcash via a traditional exchange-traded product;
🔴 The 365-day MVRV metric shows a significant gap between leading cryptocurrencies. BTC, ETH, and LINK are hovering just above 0%, meaning the average trader active over the past year is sitting on a small profit. Meanwhile, XRP stands at around -11.75%, and DOGE at around -19.26%;
🔴 Phantom will discontinue support for the Sui network; The US Dollar Index (DXY) is rising rapidly. The dollar is strengthening against major currencies amid expectations of Federal Reserve rate hikes driven by a surge in bond yields;
🔴 Despite gains in the S&P 500 and Nasdaq, the Dow and Russell 2000 continue to decline;
🔴 Traders have begun pricing in three 0.25-percentage-point Fed rate hikes over the coming year, as well as the possibility of a fourth. Consequently, the benchmark rate could reach the 4.75–5% range, increasing borrowing costs and putting pressure on mortgages, corporate loans, and other financial markets.

1
221
·
--
$BTC today‼️
The chart shows the boundaries of a trading channel I mapped out today. I am currently trading within it. Long-time followers know that I overlay general market sentiment onto technical analysis, utilizing dozens of indicators, broad market metrics, and key resistance levels.
Price action often forms these types of channels under pressure from large wallet clusters—it has become a recurring pattern.
I hope you took note of my posts regarding cyclical price pressure, the patterns observed during spikes in large ETF inflows during bear markets, and the rising profit-taking ratio. If so, you—like me—are profiting from short positions today.
Remember how I used to frequently post data on petroleum products? The pressure is mounting; no matter how hard some politicians try to mask this fact with a thick layer of "manipulative makeup," they simply cannot hide it.
Right now, I am focusing on the $84,400 level—a key liquidity pocket. I have closed out my short positions, including those on prediction markets.
If the bulls fail to hold that price level, I believe short positions will be the priority.
Wishing everyone profitable trades💰💪
$BTC today‼️
The chart shows the boundaries of a trading channel I mapped out today. I am currently trading within it. Long-time followers know that I overlay general market sentiment onto technical analysis, utilizing dozens of indicators, broad market metrics, and key resistance levels.
Price action often forms these types of channels under pressure from large wallet clusters—it has become a recurring pattern.
I hope you took note of my posts regarding cyclical price pressure, the patterns observed during spikes in large ETF inflows during bear markets, and the rising profit-taking ratio. If so, you—like me—are profiting from short positions today.
Remember how I used to frequently post data on petroleum products? The pressure is mounting; no matter how hard some politicians try to mask this fact with a thick layer of "manipulative makeup," they simply cannot hide it.
Right now, I am focusing on the $84,400 level—a key liquidity pocket. I have closed out my short positions, including those on prediction markets.
If the bulls fail to hold that price level, I believe short positions will be the priority.
Wishing everyone profitable trades💰💪
The chart shows the boundaries of a trading channel I mapped out today. I am currently trading within it. Long-time followers know that I overlay general market sentiment onto technical analysis, utilizing dozens of indicators, broad market metrics, and key resistance levels.
Price action often forms these types of channels under pressure from large wallet clusters—it has become a recurring pattern.
I hope you took note of my posts regarding cyclical price pressure, the patterns observed during spikes in large ETF inflows during bear markets, and the rising profit-taking ratio. If so, you—like me—are profiting from short positions today.
Remember how I used to frequently post data on petroleum products? The pressure is mounting; no matter how hard some politicians try to mask this fact with a thick layer of "manipulative makeup," they simply cannot hide it.
Right now, I am focusing on the $84,400 level—a key liquidity pocket. I have closed out my short positions, including those on prediction markets.
If the bulls fail to hold that price level, I believe short positions will be the priority.
Wishing everyone profitable trades💰💪
1
1
134
·
--
Today's News‼️
⭕️ Total BTC ETF flow: +$714.7M;
⭕️ Total ETH ETF flow: +$162.2M;
🔴 Inflows into Bitcoin ETFs are once again signaling a state of euphoria, according to Santiment;
🔴 $BTC has risen nearly 50% from its June low, yet the Coinbase premium remains negative; US demand hasn't even truly kicked in yet;
🔴 Coinbase has begun developing a quantum-resistant Bitcoin custody system;
🔴 BTC could touch $87.5K before correcting below $79K, says the founder of BTC.top;
🔴 The $86K price point is low in the long term, but the realized profit ratio for short-term holders signals significant profit-taking;
🔴 On September 18, Bitwise filed an updated application with the SEC for an XRP ETF, while XRP is already featured in a number of exchange-traded products;
🔴 XRP whale activity hit a one-month high as the token surged 50% in a week (Santiment data);
🔴 USDG market capitalization has grown by approximately $1.9 billion over the last six months across the X Layer and Robinhood Chain networks: X Layer: +$1.2 billion; Robinhood Chain: +$719.9 million;
🔴 Glassnode: The majority of altcoin holders are still sitting on losses;
🔴 The correlation between stocks and Treasury yields is currently at its lowest level of the century.
Today's News‼️
⭕️ Total BTC ETF flow: +$714.7M;
⭕️ Total ETH ETF flow: +$162.2M;
🔴 Inflows into Bitcoin ETFs are once again signaling a state of euphoria, according to Santiment;
🔴 $BTC has risen nearly 50% from its June low, yet the Coinbase premium remains negative; US demand hasn't even truly kicked in yet;
🔴 Coinbase has begun developing a quantum-resistant Bitcoin custody system;
🔴 BTC could touch $87.5K before correcting below $79K, says the founder of BTC.top;
🔴 The $86K price point is low in the long term, but the realized profit ratio for short-term holders signals significant profit-taking;
🔴 On September 18, Bitwise filed an updated application with the SEC for an XRP ETF, while XRP is already featured in a number of exchange-traded products;
🔴 XRP whale activity hit a one-month high as the token surged 50% in a week (Santiment data);
🔴 USDG market capitalization has grown by approximately $1.9 billion over the last six months across the X Layer and Robinhood Chain networks: X Layer: +$1.2 billion; Robinhood Chain: +$719.9 million;
🔴 Glassnode: The majority of altcoin holders are still sitting on losses;
🔴 The correlation between stocks and Treasury yields is currently at its lowest level of the century.
⭕️ Total BTC ETF flow: +$714.7M;
⭕️ Total ETH ETF flow: +$162.2M;
🔴 Inflows into Bitcoin ETFs are once again signaling a state of euphoria, according to Santiment;
🔴 $BTC has risen nearly 50% from its June low, yet the Coinbase premium remains negative; US demand hasn't even truly kicked in yet;
🔴 Coinbase has begun developing a quantum-resistant Bitcoin custody system;
🔴 BTC could touch $87.5K before correcting below $79K, says the founder of BTC.top;
🔴 The $86K price point is low in the long term, but the realized profit ratio for short-term holders signals significant profit-taking;
🔴 On September 18, Bitwise filed an updated application with the SEC for an XRP ETF, while XRP is already featured in a number of exchange-traded products;
🔴 XRP whale activity hit a one-month high as the token surged 50% in a week (Santiment data);
🔴 USDG market capitalization has grown by approximately $1.9 billion over the last six months across the X Layer and Robinhood Chain networks: X Layer: +$1.2 billion; Robinhood Chain: +$719.9 million;
🔴 Glassnode: The majority of altcoin holders are still sitting on losses;
🔴 The correlation between stocks and Treasury yields is currently at its lowest level of the century.

169
·
--
Bitcoin's cyclical trap at the 61% mark?
When analyzing the price today, I stumbled upon a mathematical pattern of Bitcoin that repeats from cycle to cycle. We are talking about the point of 61% progress between halvings.
Every time Bitcoin crosses exactly 61% of the time path from one reduction in miner rewards to the next, which is approximately 500 to 550 days after the halving, the uptrend faces a powerful wall of resistance.
For example, in 2013 to 2014 at this mark, the market reversed and plunged into a prolonged bearish trend. In 2017 to 2018 the 61% point coincided with the historic peak near $20,000, after which the crypto winter began. In 2021 to 2022 crossing this border marked the final hype of late 2021 around $69,000 and triggered a long downward cycle.
What to expect now? Right now, the industry has once again approached this dangerous historical zone. However, this cycle has a fundamental difference which is a massive influx of institutional capital through spot ETFs. Unlike previous years when the market was ruled strictly by retail panic, today large funds create a strong foundation of support. This is exactly why the current selling pressure is likely to lead not to a catastrophic 80% collapse, but to a softer consolidation and a moderate correction.
What do you think?
Bitcoin's cyclical trap at the 61% mark?
When analyzing the price today, I stumbled upon a mathematical pattern of Bitcoin that repeats from cycle to cycle. We are talking about the point of 61% progress between halvings.
Every time Bitcoin crosses exactly 61% of the time path from one reduction in miner rewards to the next, which is approximately 500 to 550 days after the halving, the uptrend faces a powerful wall of resistance.
For example, in 2013 to 2014 at this mark, the market reversed and plunged into a prolonged bearish trend. In 2017 to 2018 the 61% point coincided with the historic peak near $20,000, after which the crypto winter began. In 2021 to 2022 crossing this border marked the final hype of late 2021 around $69,000 and triggered a long downward cycle.
What to expect now? Right now, the industry has once again approached this dangerous historical zone. However, this cycle has a fundamental difference which is a massive influx of institutional capital through spot ETFs. Unlike previous years when the market was ruled strictly by retail panic, today large funds create a strong foundation of support. This is exactly why the current selling pressure is likely to lead not to a catastrophic 80% collapse, but to a softer consolidation and a moderate correction.
What do you think?
When analyzing the price today, I stumbled upon a mathematical pattern of Bitcoin that repeats from cycle to cycle. We are talking about the point of 61% progress between halvings.
Every time Bitcoin crosses exactly 61% of the time path from one reduction in miner rewards to the next, which is approximately 500 to 550 days after the halving, the uptrend faces a powerful wall of resistance.
For example, in 2013 to 2014 at this mark, the market reversed and plunged into a prolonged bearish trend. In 2017 to 2018 the 61% point coincided with the historic peak near $20,000, after which the crypto winter began. In 2021 to 2022 crossing this border marked the final hype of late 2021 around $69,000 and triggered a long downward cycle.
What to expect now? Right now, the industry has once again approached this dangerous historical zone. However, this cycle has a fundamental difference which is a massive influx of institutional capital through spot ETFs. Unlike previous years when the market was ruled strictly by retail panic, today large funds create a strong foundation of support. This is exactly why the current selling pressure is likely to lead not to a catastrophic 80% collapse, but to a softer consolidation and a moderate correction.
What do you think?
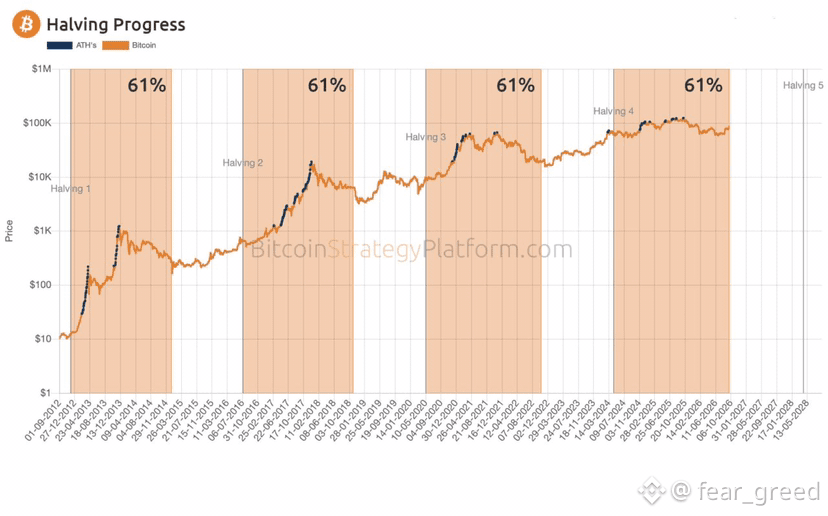
2
611
·
--
Today's News‼️
⭕️ Total BTC ETF flow: +$999.0M;
⭕️ Total ETH ETF flow: +$270.0M;
⭕️ Total SOL ETF flow: +$26M;
⭕️ Total HYPE ETF flow: +$2.9M;
🔴 Arthur Hayes: Slower AI growth in the US would be bullish for BTC;
🔴 According to Alex Thorn of Galaxy, "white hat" hackers from COLDCARD transferred 52.37 BTC—recovered after a vulnerability was addressed—to the Crypto Recovery Trust address established to return funds to victims;
🔴 Net BTC buying volume on Binance surged to +$618 million in a single hour. The buying pressure behind this price spike was comparable in magnitude to the breakout on August 19;
🔴 Willy Woo: It looks like this trend still has upside potential over the next 2–4 weeks before reaching overbought territory and requiring a correction;
🔴 Since 2010, Bitcoin has spent 46% of days at a level at least 50% below its previous all-time high. The most common range—covering 40% of all days—is between 50% and 80% below the high. Only 16% of days saw the price within 10% of the high—less than a third of the total days;
🔴 Bitmine has become the largest corporate holder of Ethereum. The company surpasses Sharplink and The Ether Machine in ETH holdings. In addition to Ethereum, Bitmine holds 212 BTC, stakes in Eightco Holdings and Beast Industries, as well as cash and marketable securities. The total value of the company's assets is estimated at $17.1 billion;
🔴 US Department of Justice investigating Binance for potential Iran sanctions violations — BBG;
🔴 Payward, Kraken’s parent company, plans to provide US traders with access to Hyperliquid HIP-3 perpetual futures markets;
🔴 The altcoin cycle signal has shifted from "Bitcoin season" to "altcoin season," as today's rally extends across the broader altcoin market, according to Glassnode;
🔴 "Altseason" has made headlines on Bloomberg;
🔴Cowen expects demand for tokenized stocks to remain limited even after the US SEC granted conditional approval for on-chain trading of stock tokens, according to CoinDesk.
Today's News‼️
⭕️ Total BTC ETF flow: +$999.0M;
⭕️ Total ETH ETF flow: +$270.0M;
⭕️ Total SOL ETF flow: +$26M;
⭕️ Total HYPE ETF flow: +$2.9M;
🔴 Arthur Hayes: Slower AI growth in the US would be bullish for BTC;
🔴 According to Alex Thorn of Galaxy, "white hat" hackers from COLDCARD transferred 52.37 BTC—recovered after a vulnerability was addressed—to the Crypto Recovery Trust address established to return funds to victims;
🔴 Net BTC buying volume on Binance surged to +$618 million in a single hour. The buying pressure behind this price spike was comparable in magnitude to the breakout on August 19;
🔴 Willy Woo: It looks like this trend still has upside potential over the next 2–4 weeks before reaching overbought territory and requiring a correction;
🔴 Since 2010, Bitcoin has spent 46% of days at a level at least 50% below its previous all-time high. The most common range—covering 40% of all days—is between 50% and 80% below the high. Only 16% of days saw the price within 10% of the high—less than a third of the total days;
🔴 Bitmine has become the largest corporate holder of Ethereum. The company surpasses Sharplink and The Ether Machine in ETH holdings. In addition to Ethereum, Bitmine holds 212 BTC, stakes in Eightco Holdings and Beast Industries, as well as cash and marketable securities. The total value of the company's assets is estimated at $17.1 billion;
🔴 US Department of Justice investigating Binance for potential Iran sanctions violations — BBG;
🔴 Payward, Kraken’s parent company, plans to provide US traders with access to Hyperliquid HIP-3 perpetual futures markets;
🔴 The altcoin cycle signal has shifted from "Bitcoin season" to "altcoin season," as today's rally extends across the broader altcoin market, according to Glassnode;
🔴 "Altseason" has made headlines on Bloomberg;
🔴Cowen expects demand for tokenized stocks to remain limited even after the US SEC granted conditional approval for on-chain trading of stock tokens, according to CoinDesk.
⭕️ Total BTC ETF flow: +$999.0M;
⭕️ Total ETH ETF flow: +$270.0M;
⭕️ Total SOL ETF flow: +$26M;
⭕️ Total HYPE ETF flow: +$2.9M;
🔴 Arthur Hayes: Slower AI growth in the US would be bullish for BTC;
🔴 According to Alex Thorn of Galaxy, "white hat" hackers from COLDCARD transferred 52.37 BTC—recovered after a vulnerability was addressed—to the Crypto Recovery Trust address established to return funds to victims;
🔴 Net BTC buying volume on Binance surged to +$618 million in a single hour. The buying pressure behind this price spike was comparable in magnitude to the breakout on August 19;
🔴 Willy Woo: It looks like this trend still has upside potential over the next 2–4 weeks before reaching overbought territory and requiring a correction;
🔴 Since 2010, Bitcoin has spent 46% of days at a level at least 50% below its previous all-time high. The most common range—covering 40% of all days—is between 50% and 80% below the high. Only 16% of days saw the price within 10% of the high—less than a third of the total days;
🔴 Bitmine has become the largest corporate holder of Ethereum. The company surpasses Sharplink and The Ether Machine in ETH holdings. In addition to Ethereum, Bitmine holds 212 BTC, stakes in Eightco Holdings and Beast Industries, as well as cash and marketable securities. The total value of the company's assets is estimated at $17.1 billion;
🔴 US Department of Justice investigating Binance for potential Iran sanctions violations — BBG;
🔴 Payward, Kraken’s parent company, plans to provide US traders with access to Hyperliquid HIP-3 perpetual futures markets;
🔴 The altcoin cycle signal has shifted from "Bitcoin season" to "altcoin season," as today's rally extends across the broader altcoin market, according to Glassnode;
🔴 "Altseason" has made headlines on Bloomberg;
🔴Cowen expects demand for tokenized stocks to remain limited even after the US SEC granted conditional approval for on-chain trading of stock tokens, according to CoinDesk.

2
164
·
--
$POL today‼️
In my opinion, this is currently one of the most undervalued assets in the cryptocurrency market. The POL CEO agrees with me, having recently posted about this very topic.
Polygon's total revenue from the start of the year through the end of summer 2026 reached $24.5 million. The network significantly outperformed its main competitors: Arbitrum’s revenue for the same period was $8.41 million, while NEAR’s was $5.6 million.
A community-driven mechanism to burn 100 million POL (approximately 1% of the circulating supply) every quarter kicks off in September. I believe this could act as a catalyst for price growth. Not financial advice.
This is one of the few tokens in my portfolio that I’ve been buying since the local low of $0.065. Proof is in the channel feed. Long-time followers know I’ve been accumulating this asset consistently—and I’m continuing to do so.
As always, I’ve marked the relevant resistance and support lines on my chart.
I believe Bitcoin is entering a period of short-term consolidation, creating a prime opportunity for altcoins. That’s why I’m aiming for at least a 20% profit on a spot trade.
If Bitcoin corrects, the price of $POL will likely correct as well.
In my opinion, accumulating the token below $0.10 is a fantastic investment.
Wishing everyone profitable trades💰💪
$POL today‼️
In my opinion, this is currently one of the most undervalued assets in the cryptocurrency market. The POL CEO agrees with me, having recently posted about this very topic.
Polygon's total revenue from the start of the year through the end of summer 2026 reached $24.5 million. The network significantly outperformed its main competitors: Arbitrum’s revenue for the same period was $8.41 million, while NEAR’s was $5.6 million.
A community-driven mechanism to burn 100 million POL (approximately 1% of the circulating supply) every quarter kicks off in September. I believe this could act as a catalyst for price growth. Not financial advice.
This is one of the few tokens in my portfolio that I’ve been buying since the local low of $0.065. Proof is in the channel feed. Long-time followers know I’ve been accumulating this asset consistently—and I’m continuing to do so.
As always, I’ve marked the relevant resistance and support lines on my chart.
I believe Bitcoin is entering a period of short-term consolidation, creating a prime opportunity for altcoins. That’s why I’m aiming for at least a 20% profit on a spot trade.
If Bitcoin corrects, the price of $POL will likely correct as well.
In my opinion, accumulating the token below $0.10 is a fantastic investment.
Wishing everyone profitable trades💰💪
In my opinion, this is currently one of the most undervalued assets in the cryptocurrency market. The POL CEO agrees with me, having recently posted about this very topic.
Polygon's total revenue from the start of the year through the end of summer 2026 reached $24.5 million. The network significantly outperformed its main competitors: Arbitrum’s revenue for the same period was $8.41 million, while NEAR’s was $5.6 million.
A community-driven mechanism to burn 100 million POL (approximately 1% of the circulating supply) every quarter kicks off in September. I believe this could act as a catalyst for price growth. Not financial advice.
This is one of the few tokens in my portfolio that I’ve been buying since the local low of $0.065. Proof is in the channel feed. Long-time followers know I’ve been accumulating this asset consistently—and I’m continuing to do so.
As always, I’ve marked the relevant resistance and support lines on my chart.
I believe Bitcoin is entering a period of short-term consolidation, creating a prime opportunity for altcoins. That’s why I’m aiming for at least a 20% profit on a spot trade.
If Bitcoin corrects, the price of $POL will likely correct as well.
In my opinion, accumulating the token below $0.10 is a fantastic investment.
Wishing everyone profitable trades💰💪
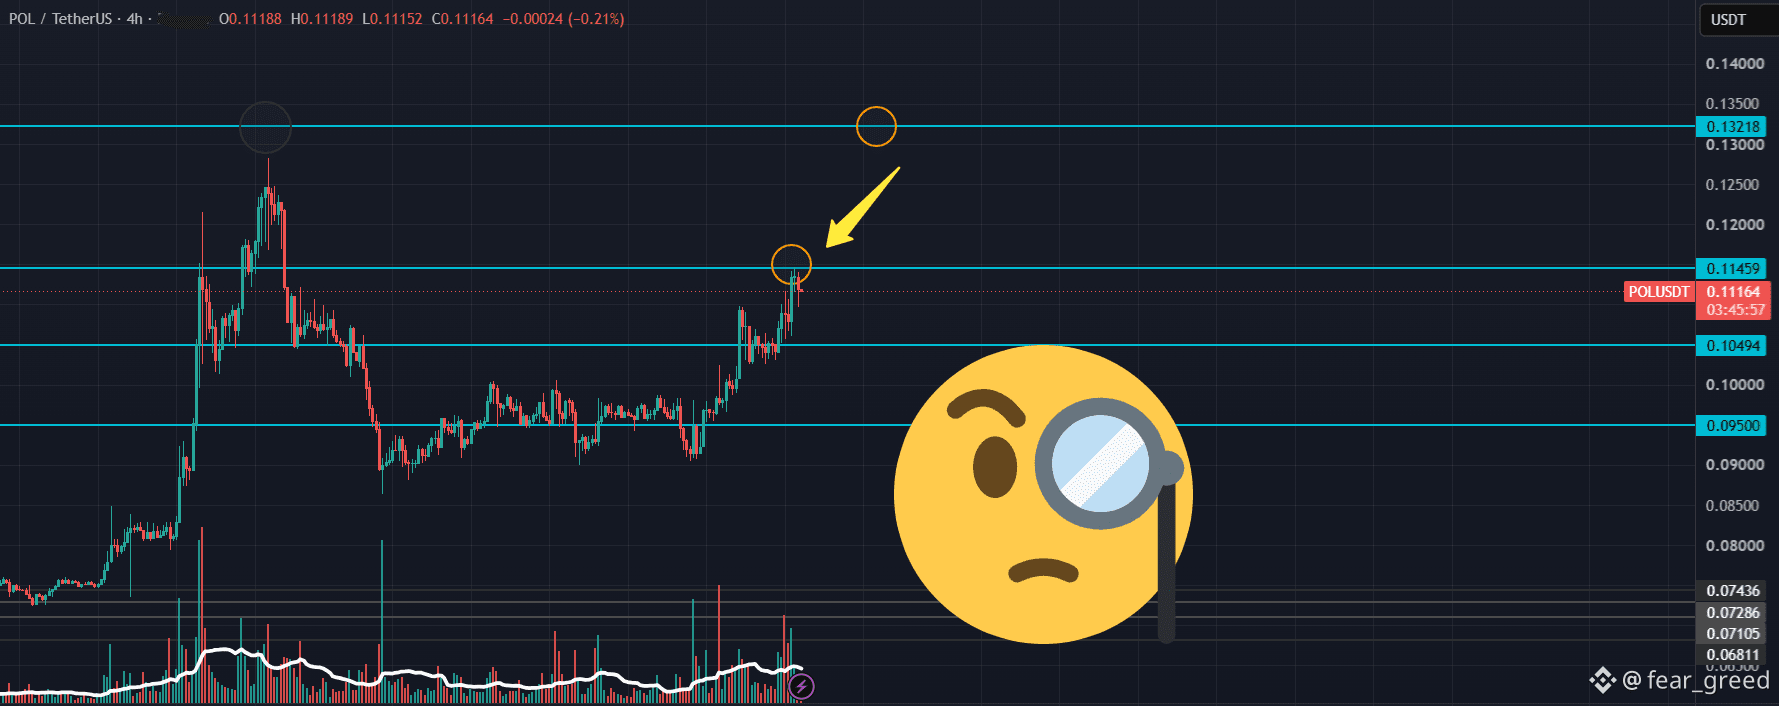
1
408
Log in to explore more content
Join global crypto users on Binance Square
⚡️ Get latest and useful information about crypto.
💬 Trusted by the world’s largest crypto exchange.
👍 Discover real insights from verified creators.
Email / Phone number