
Leo524
729 Posts

Leo524
Report
Block User
👉Leo524 👈
Trade With Confidence ✔

DOT Holder
High-Frequency Trader
3.5 Years
1 Following
1.4K+ Followers
4.4K+ Liked
Posts
All
Quotes
Videos
PINNED
·
--
One week. One big milestone 📈💚
Proud of the progress we’ve made with LEO524. Seeing the account grow by 111%+ over the past week is a great feeling.
Every move comes with lessons, and every result reminds me why patience, discipline, and consistency matter.
Grateful for the journey. More work ahead, and we keep moving forward. 🚀
#CryptoTrading. g #tradingjourney #Leo524 #BinanceSquare #EarningsSeason
One week. One big milestone 📈💚
Proud of the progress we’ve made with LEO524. Seeing the account grow by 111%+ over the past week is a great feeling.
Every move comes with lessons, and every result reminds me why patience, discipline, and consistency matter.
Grateful for the journey. More work ahead, and we keep moving forward. 🚀
#CryptoTrading. g #tradingjourney #Leo524 #BinanceSquare #EarningsSeason
Proud of the progress we’ve made with LEO524. Seeing the account grow by 111%+ over the past week is a great feeling.
Every move comes with lessons, and every result reminds me why patience, discipline, and consistency matter.
Grateful for the journey. More work ahead, and we keep moving forward. 🚀
#CryptoTrading. g #tradingjourney #Leo524 #BinanceSquare #EarningsSeason
16
18
3.8k
·
--
Bullish
$ONDO USDT LONG ✅
ENTRY : 3095 - 2995 ✅
3106
3119
3128
3147
3164
3195
3215
3239
3256
3288
3327
3342
3375
3422
STOP : 2900 ✅
RISKY TRADE USE LOW FUNDS !
$ONDO
{future}(ONDOUSDT)
$ONDO USDT LONG ✅
ENTRY : 3095 - 2995 ✅
3106
3119
3128
3147
3164
3195
3215
3239
3256
3288
3327
3342
3375
3422
STOP : 2900 ✅
RISKY TRADE USE LOW FUNDS !
$ONDO
ENTRY : 3095 - 2995 ✅
3106
3119
3128
3147
3164
3195
3215
3239
3256
3288
3327
3342
3375
3422
STOP : 2900 ✅
RISKY TRADE USE LOW FUNDS !
$ONDO
1
391
·
--
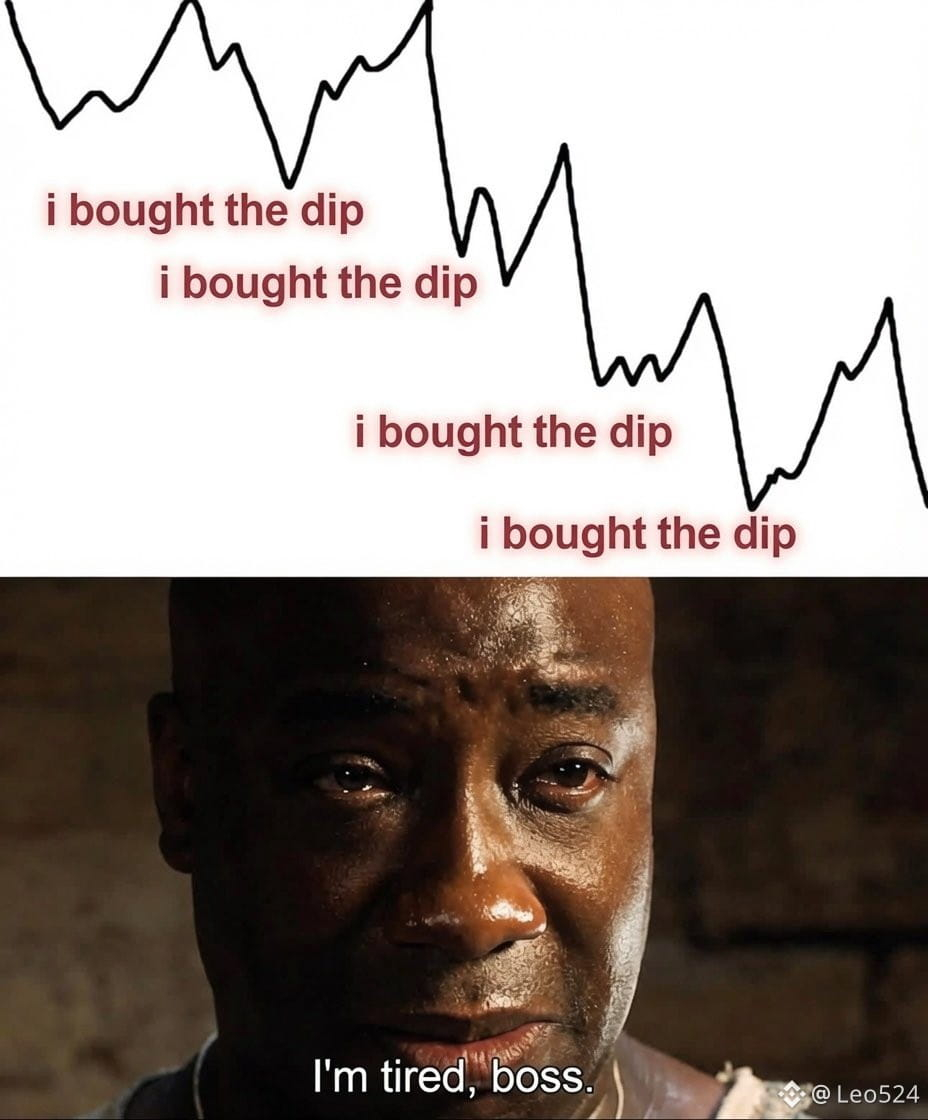
Stop opening long trades on every dip. Wait for a bullish reversal accompanied by a solid liquidity sweep before entering long positions. Alternatively, simply respect the trend.
Stop opening long trades on every dip. Wait for a bullish reversal accompanied by a solid liquidity sweep before entering long positions. Alternatively, simply respect the trend.
2
418
·
--
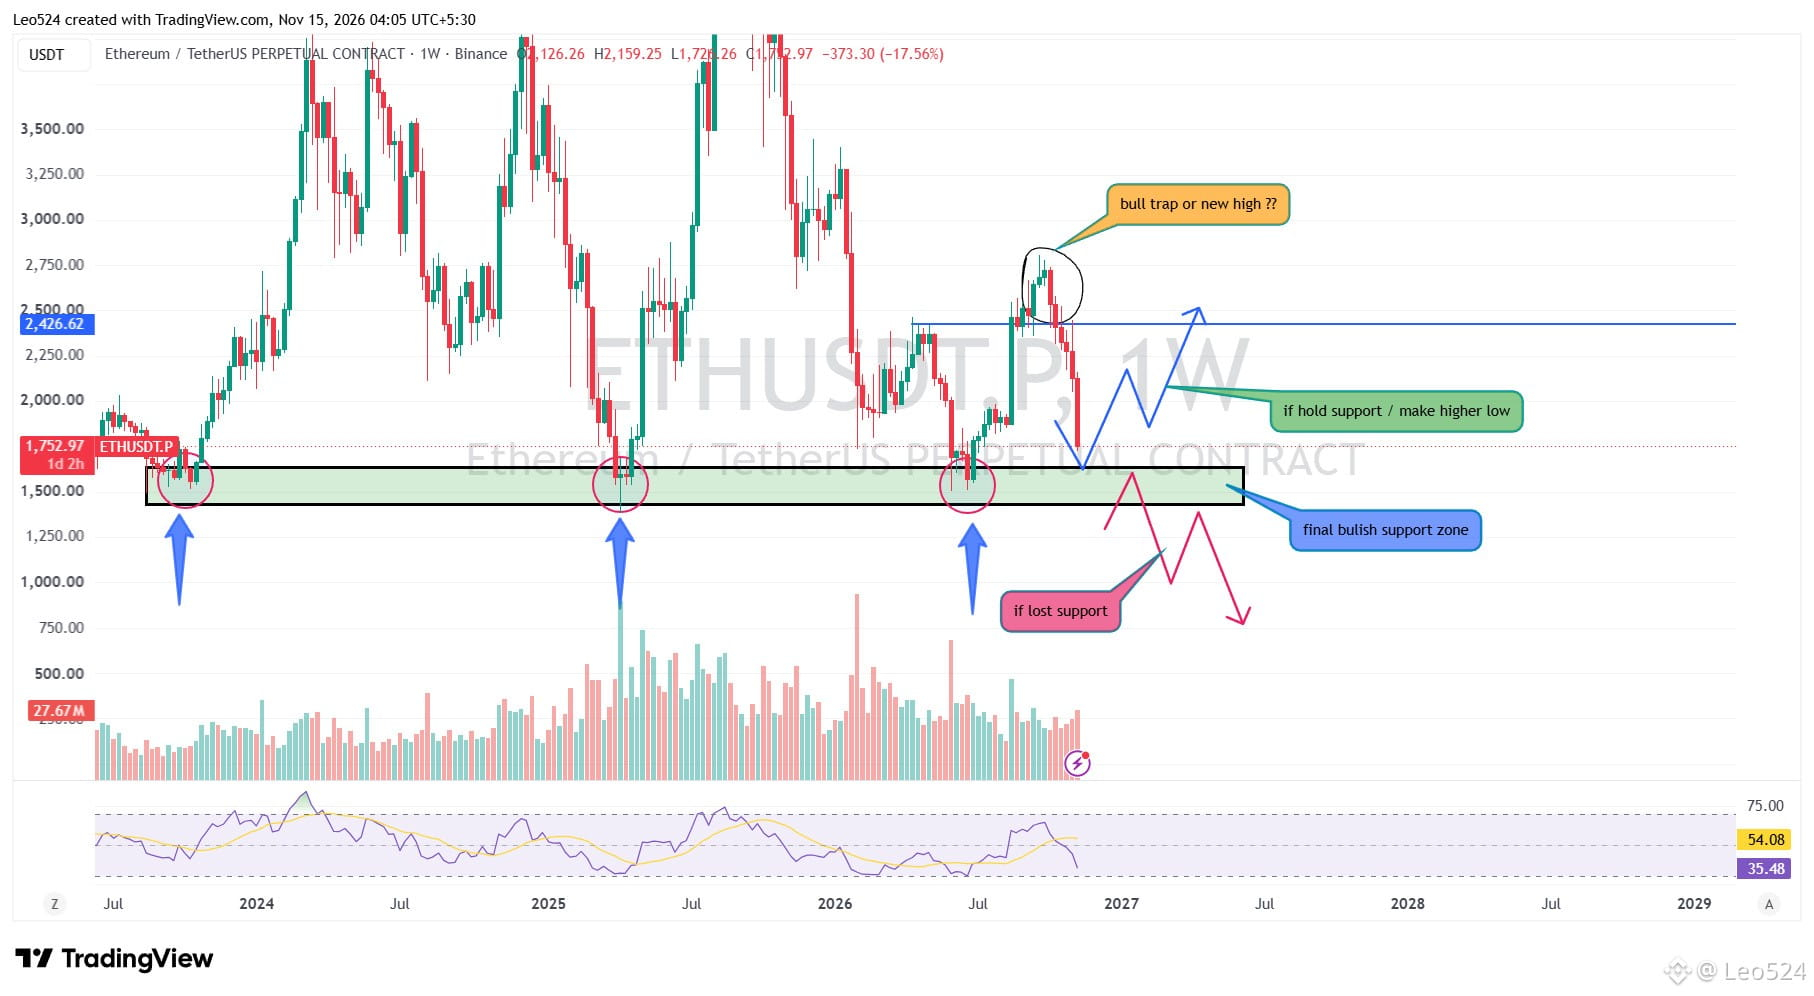
$ETH WEEKLY: BULL TRAP OR THE START OF A NEW HIGHER LOW? 👀
Ethereum is approaching a critical weekly support zone around $1,430–$1,630, a level that has repeatedly attracted buyers in the past. The recent bounce toward $2,700 failed to hold, and ETH is now back near $1,750. This makes the current reaction extremely important for the bigger picture.
If buyers manage to defend this support and ETH starts building a higher low, we could see another recovery attempt toward $2,400 resistance. A breakout above that level would strengthen the bullish structure and open the door for a larger reversal. However, the recent bounce could still be a bull trap if buyers fail to reclaim key resistance.
**This is a major decision zone for ETH.** Holding support could create the foundation for a new bullish structure, while a clean weekly breakdown would weaken the entire recovery scenario. The next move around this zone could define Ethereum's direction for the coming weeks.
Analysis by LEO524
$ETH WEEKLY: BULL TRAP OR THE START OF A NEW HIGHER LOW? 👀
Ethereum is approaching a critical weekly support zone around $1,430–$1,630, a level that has repeatedly attracted buyers in the past. The recent bounce toward $2,700 failed to hold, and ETH is now back near $1,750. This makes the current reaction extremely important for the bigger picture.
If buyers manage to defend this support and ETH starts building a higher low, we could see another recovery attempt toward $2,400 resistance. A breakout above that level would strengthen the bullish structure and open the door for a larger reversal. However, the recent bounce could still be a bull trap if buyers fail to reclaim key resistance.
**This is a major decision zone for ETH.** Holding support could create the foundation for a new bullish structure, while a clean weekly breakdown would weaken the entire recovery scenario. The next move around this zone could define Ethereum's direction for the coming weeks.
Analysis by LEO524
Ethereum is approaching a critical weekly support zone around $1,430–$1,630, a level that has repeatedly attracted buyers in the past. The recent bounce toward $2,700 failed to hold, and ETH is now back near $1,750. This makes the current reaction extremely important for the bigger picture.
If buyers manage to defend this support and ETH starts building a higher low, we could see another recovery attempt toward $2,400 resistance. A breakout above that level would strengthen the bullish structure and open the door for a larger reversal. However, the recent bounce could still be a bull trap if buyers fail to reclaim key resistance.
**This is a major decision zone for ETH.** Holding support could create the foundation for a new bullish structure, while a clean weekly breakdown would weaken the entire recovery scenario. The next move around this zone could define Ethereum's direction for the coming weeks.
Analysis by LEO524
1
309
·
--
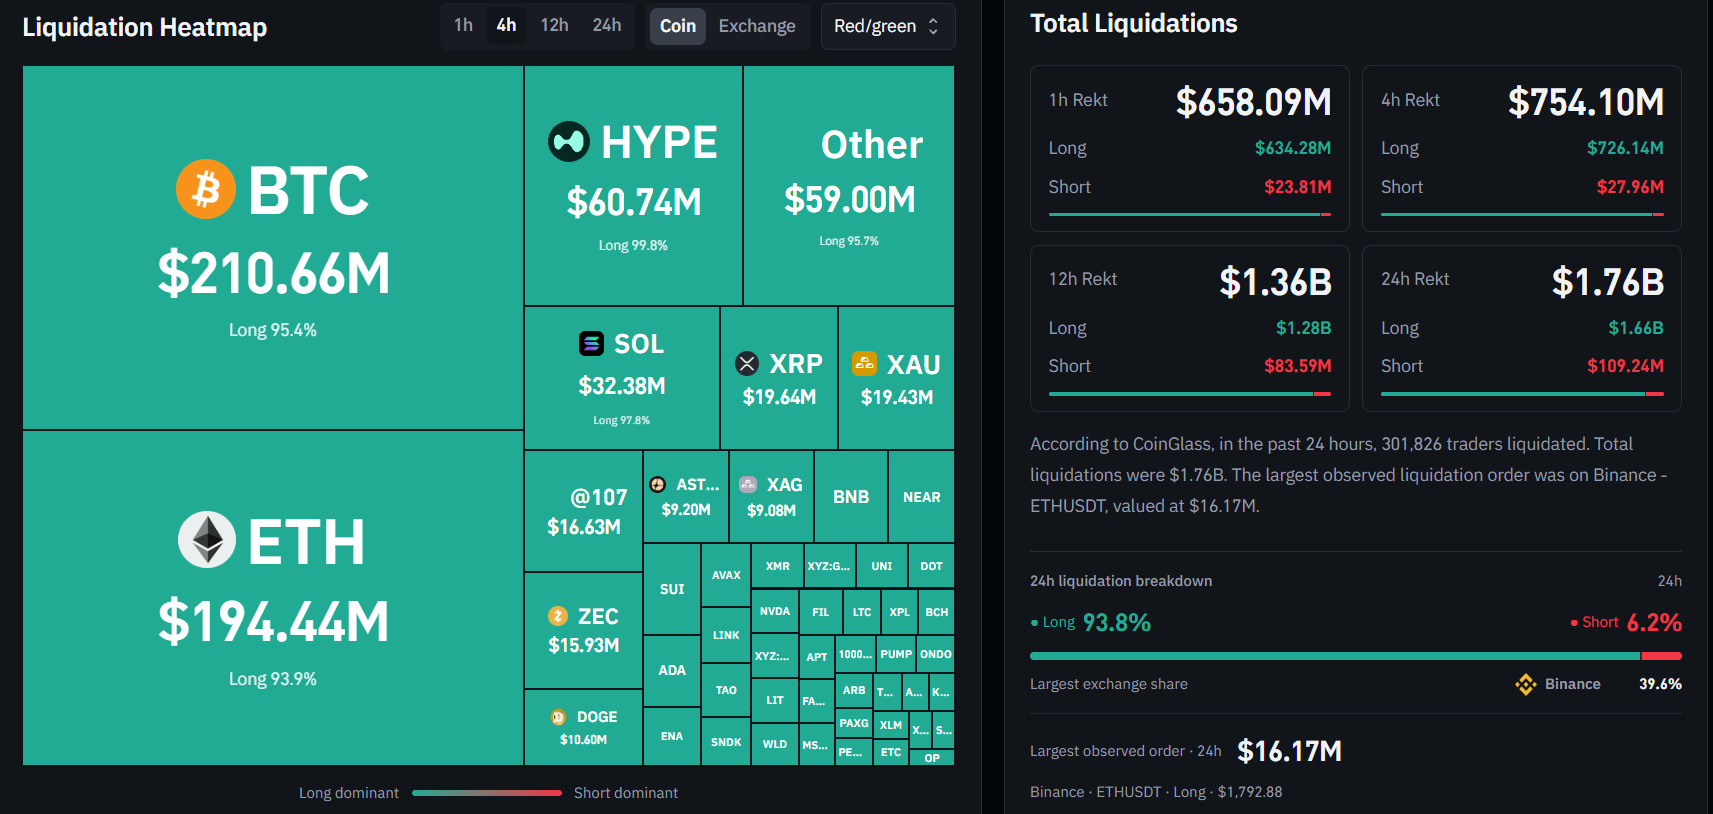
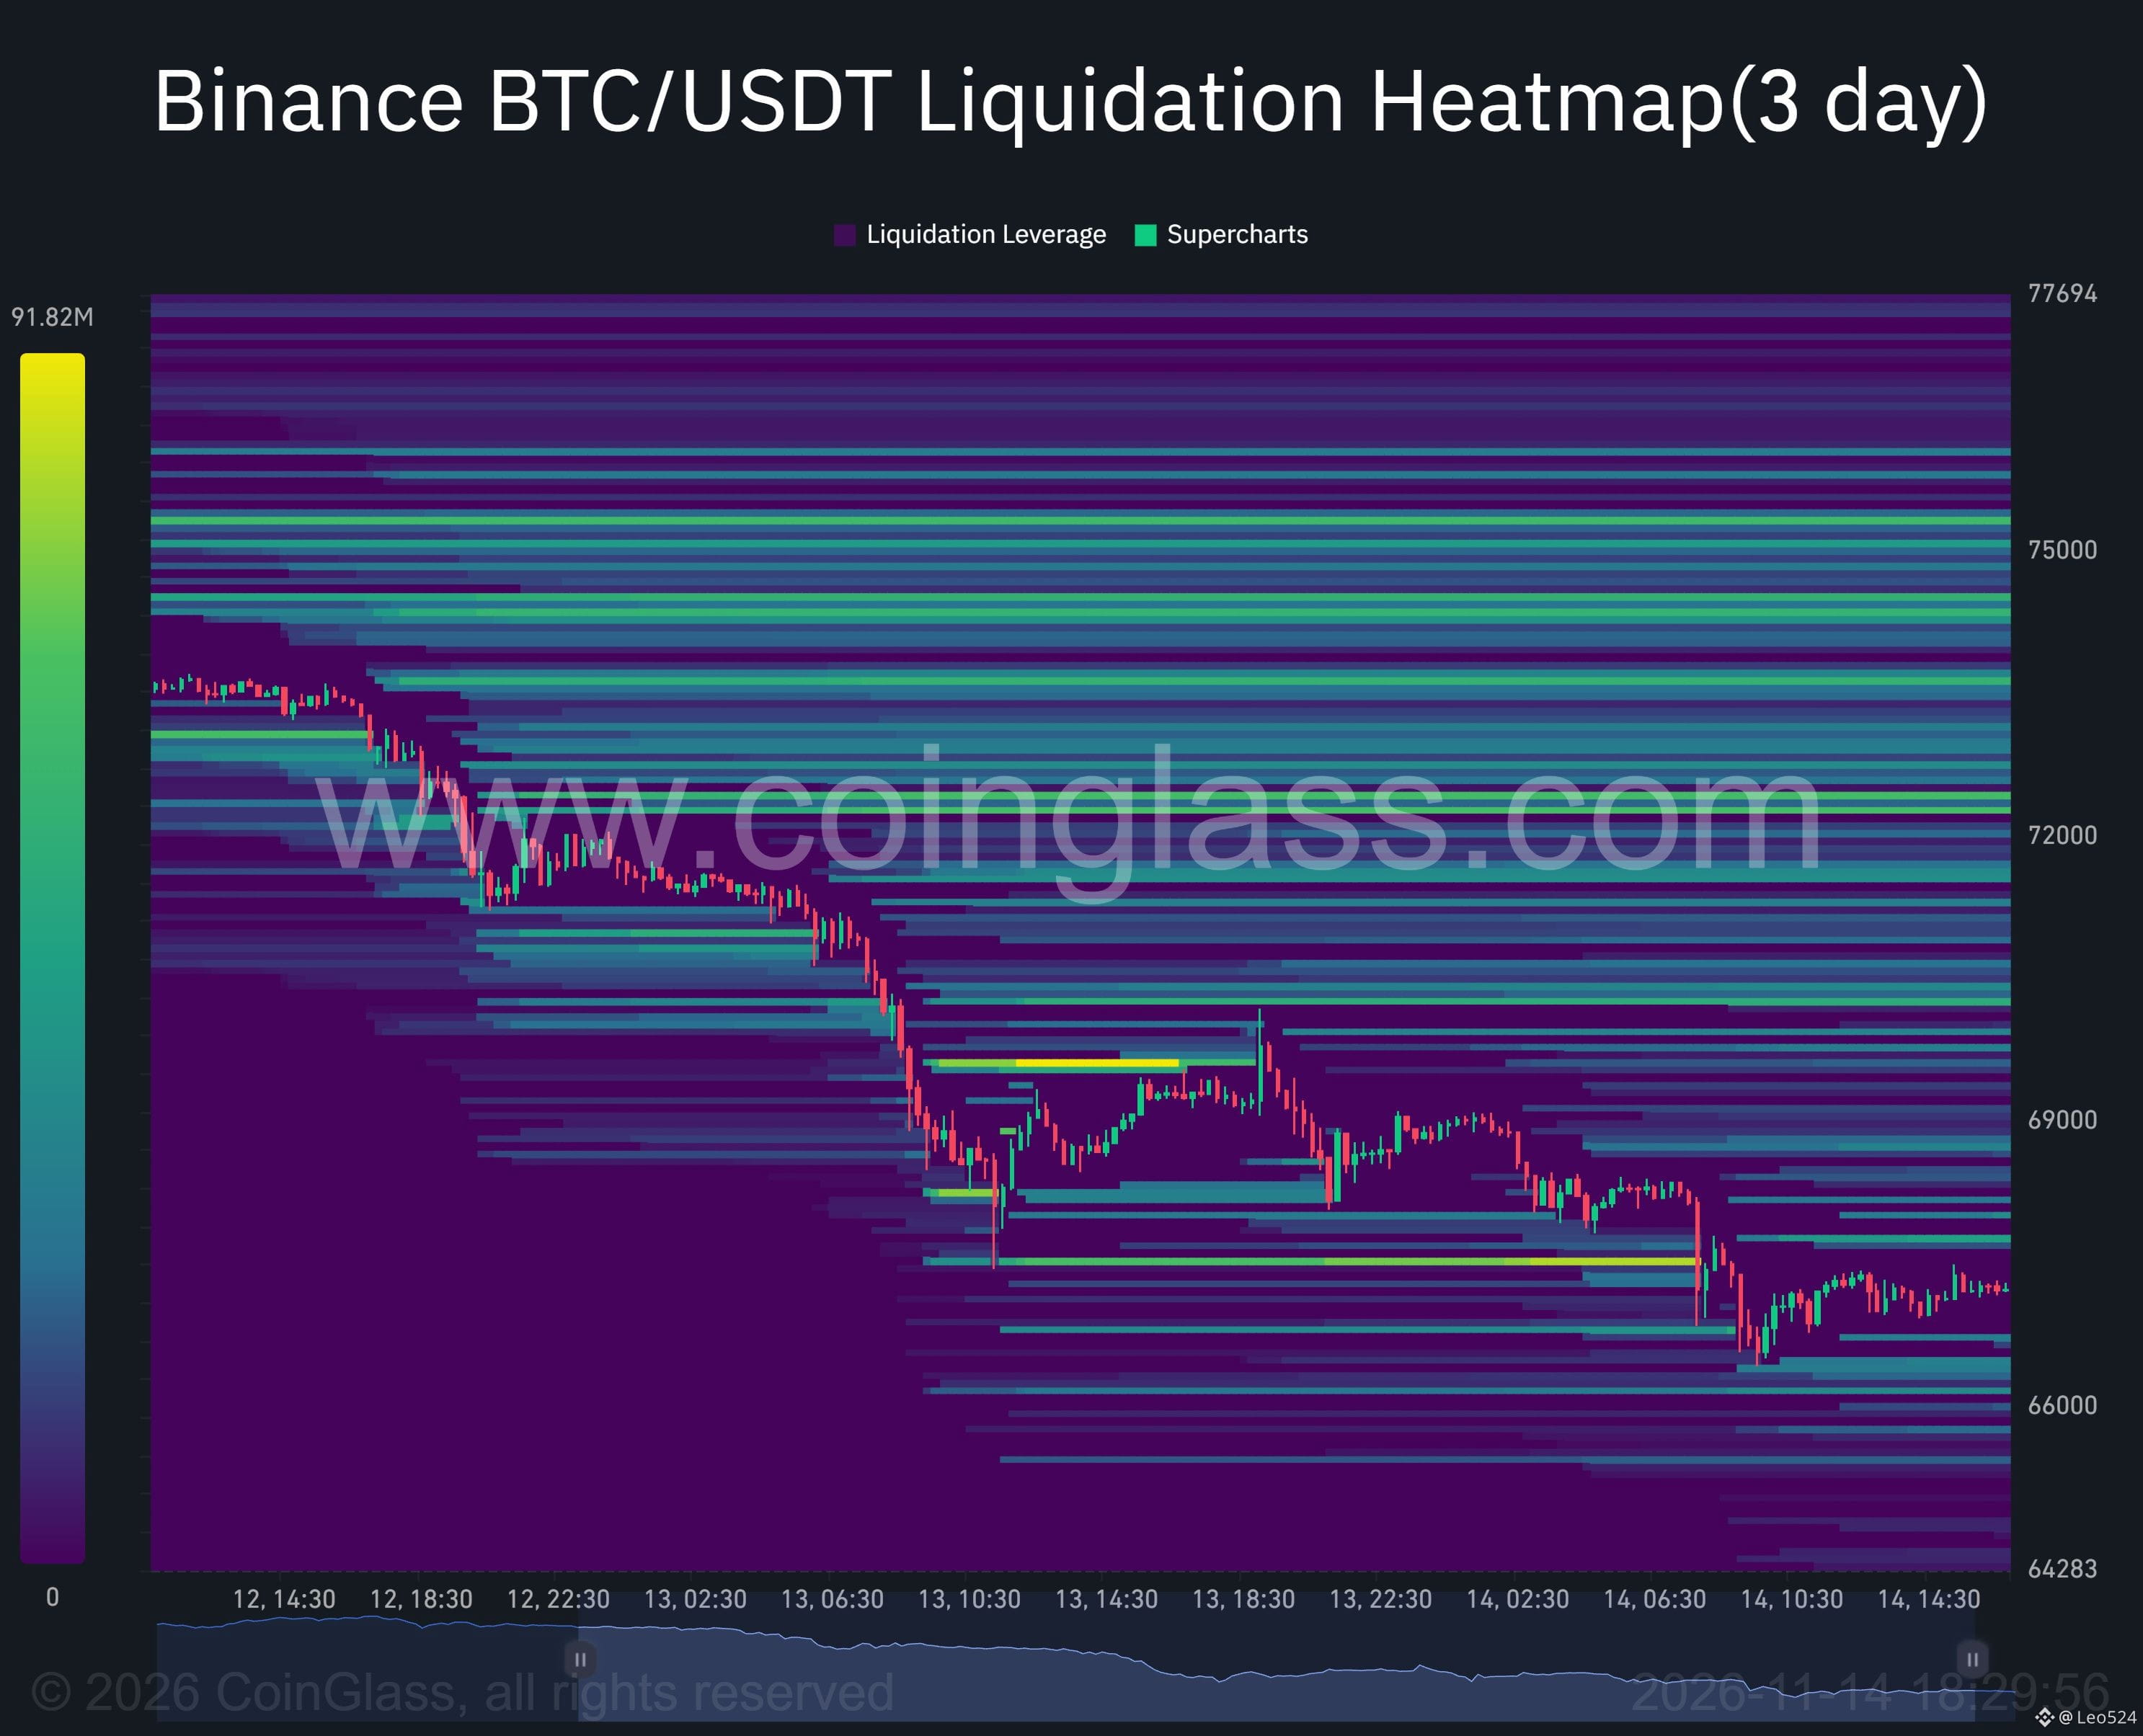
$1.76 BILLION LIQUIDATED — LONGS TAKE THE BIGGEST HIT!
The crypto market has seen $1.76B in liquidations over the past 24 hours, with 93.8% coming from long positions. This clearly shows how aggressively leveraged bullish traders have been wiped out during the recent market decline.
BTC recorded the largest liquidation exposure at $210.66M, followed by ETH at $194.44M. The liquidation heatmap is heavily dominated by long positions across major assets, highlighting the massive pressure on leveraged buyers. ⚠️
#Crypto #CryptoTrading #LEO524 #BTC
$1.76 BILLION LIQUIDATED — LONGS TAKE THE BIGGEST HIT!
The crypto market has seen $1.76B in liquidations over the past 24 hours, with 93.8% coming from long positions. This clearly shows how aggressively leveraged bullish traders have been wiped out during the recent market decline.
BTC recorded the largest liquidation exposure at $210.66M, followed by ETH at $194.44M. The liquidation heatmap is heavily dominated by long positions across major assets, highlighting the massive pressure on leveraged buyers. ⚠️
#Crypto #CryptoTrading #LEO524 #BTC
The crypto market has seen $1.76B in liquidations over the past 24 hours, with 93.8% coming from long positions. This clearly shows how aggressively leveraged bullish traders have been wiped out during the recent market decline.
BTC recorded the largest liquidation exposure at $210.66M, followed by ETH at $194.44M. The liquidation heatmap is heavily dominated by long positions across major assets, highlighting the massive pressure on leveraged buyers. ⚠️
#Crypto #CryptoTrading #LEO524 #BTC
3
1.5k
·
--
Bearish
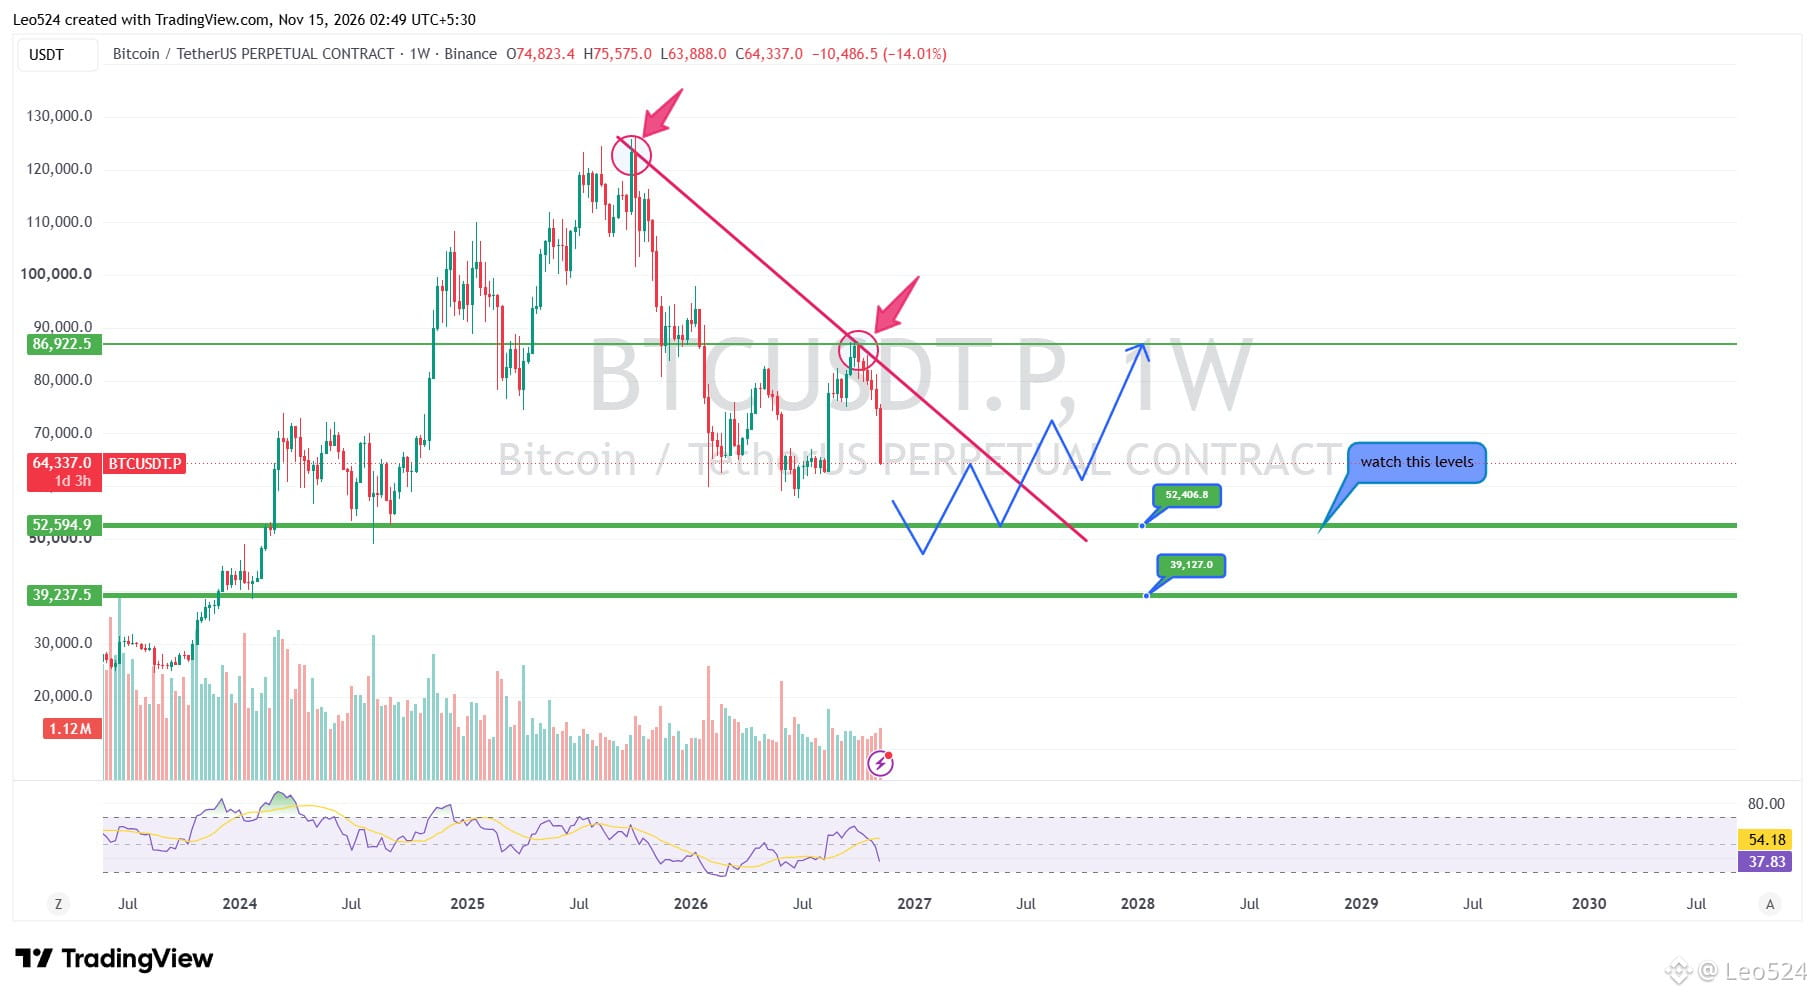
$BTC A MAJOR SUPPORT ZONE COULD DECIDE THE NEXT TREND 🔍
{spot}(BTCUSDT)
Bitcoin is facing serious selling pressure on the weekly chart after rejecting from the $125K region. The market has now returned to a major support zone around $52K, which could become an important area for buyers to defend. RSI is also approaching oversold territory, but that alone is not enough to confirm a reversal.
If Bitcoin manages to hold this support and buyers start showing strength, we could see a recovery attempt toward $86K. However, a bullish reversal is not confirmed yet. Lower timeframe market structure, a strong bullish BOS/CHoCH, and clear buying displacement are important confirmations to watch before expecting a sustained recovery.
The key is simple: support must hold. If Bitcoin loses this zone with strong selling pressure, the next major support sits around $39K. The continuation of an uptrend depends on buyers successfully defending the current support area.
Analysis by LEO524
#BTC #Bitcoin #Crypto #LEO524
$BTC A MAJOR SUPPORT ZONE COULD DECIDE THE NEXT TREND 🔍
Bitcoin is facing serious selling pressure on the weekly chart after rejecting from the $125K region. The market has now returned to a major support zone around $52K, which could become an important area for buyers to defend. RSI is also approaching oversold territory, but that alone is not enough to confirm a reversal.
If Bitcoin manages to hold this support and buyers start showing strength, we could see a recovery attempt toward $86K. However, a bullish reversal is not confirmed yet. Lower timeframe market structure, a strong bullish BOS/CHoCH, and clear buying displacement are important confirmations to watch before expecting a sustained recovery.
The key is simple: support must hold. If Bitcoin loses this zone with strong selling pressure, the next major support sits around $39K. The continuation of an uptrend depends on buyers successfully defending the current support area.
Analysis by LEO524
#BTC #Bitcoin #Crypto #LEO524
Bitcoin is facing serious selling pressure on the weekly chart after rejecting from the $125K region. The market has now returned to a major support zone around $52K, which could become an important area for buyers to defend. RSI is also approaching oversold territory, but that alone is not enough to confirm a reversal.
If Bitcoin manages to hold this support and buyers start showing strength, we could see a recovery attempt toward $86K. However, a bullish reversal is not confirmed yet. Lower timeframe market structure, a strong bullish BOS/CHoCH, and clear buying displacement are important confirmations to watch before expecting a sustained recovery.
The key is simple: support must hold. If Bitcoin loses this zone with strong selling pressure, the next major support sits around $39K. The continuation of an uptrend depends on buyers successfully defending the current support area.
Analysis by LEO524
#BTC #Bitcoin #Crypto #LEO524
1
219
·
--
3
392
·
--
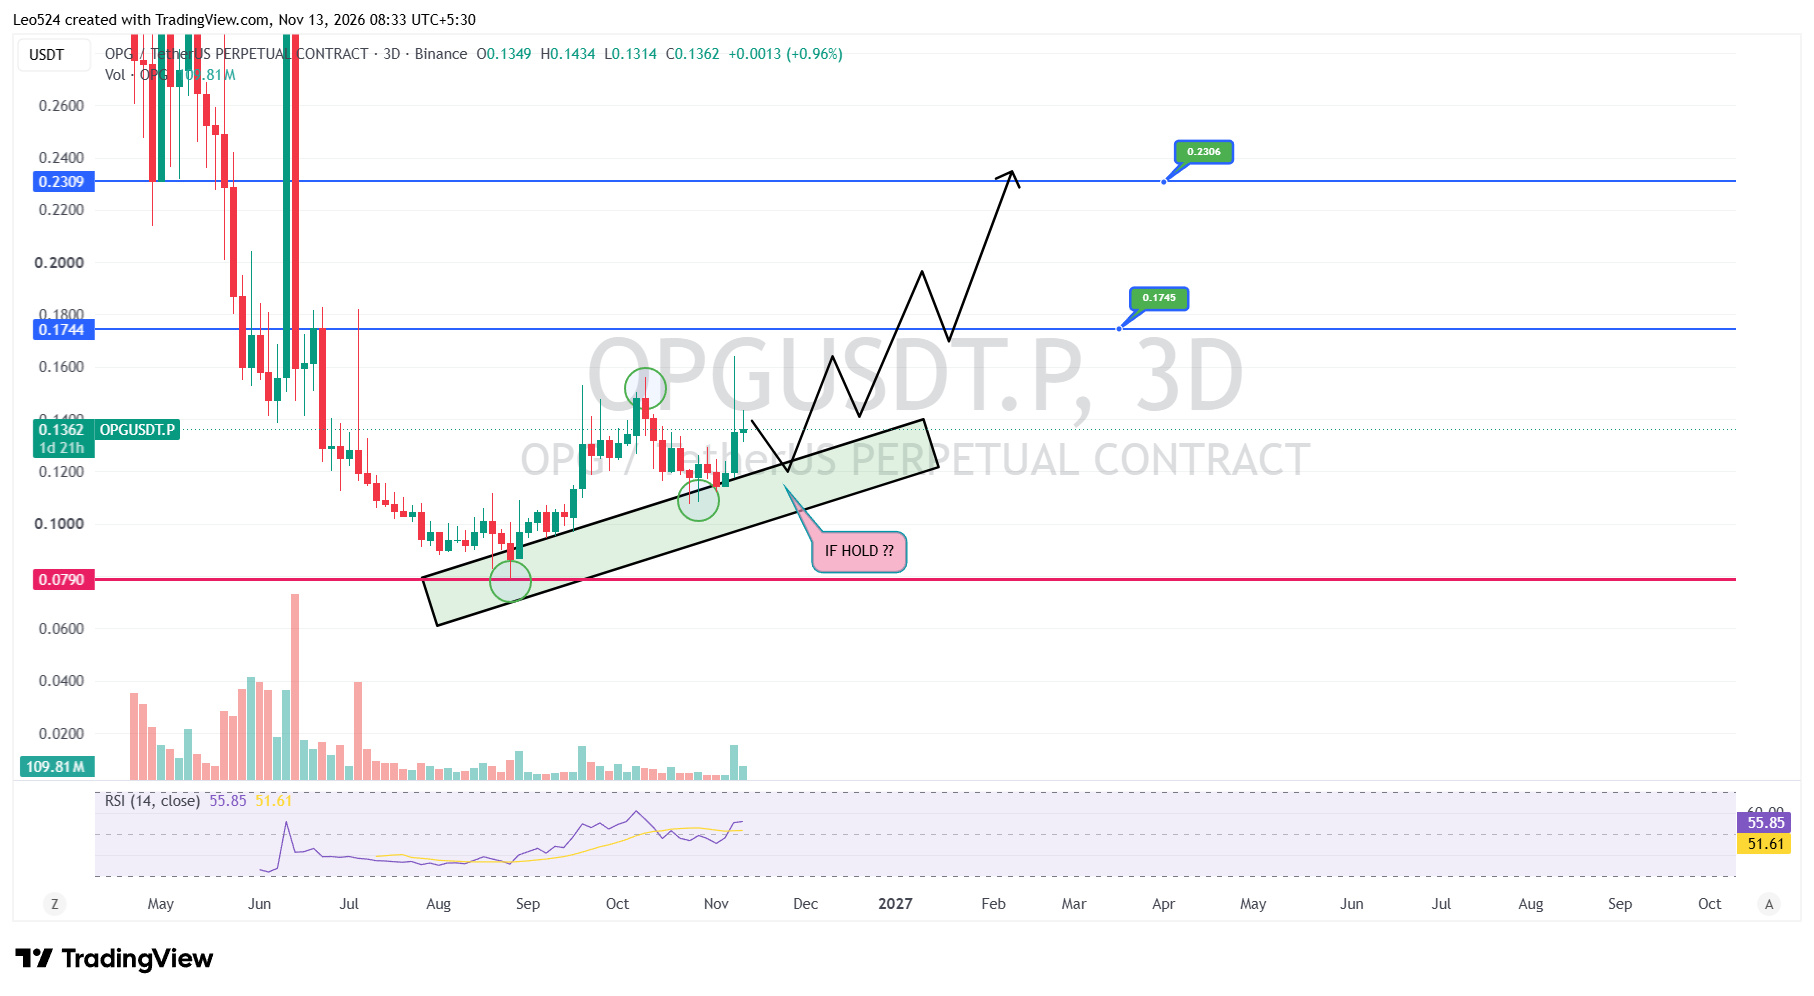
$OPG — Bullish Reversal Setup or Another Breakdown..?
$OPG is showing an interesting shift after an extended bearish trend. Price has started forming higher lows inside a rising support channel, suggesting buyers are gradually gaining control. The recent pullback is now testing this structure, making the rising support a critical level to watch.
If this support holds, OPG could continue its recovery toward $0.1745, with $0.2306 as the next major resistance. However, a confirmed bullish reversal still requires LTF confirmations, including bullish market structure and strong buying momentum.
The key is the rising support. As long as this structure remains intact, the bullish continuation scenario stays alive. A breakdown below it could invalidate the recovery setup and expose price to further downside.
Analysis by LEO524
#Crypto #CryptoTrading #LEO524
$OPG — Bullish Reversal Setup or Another Breakdown..?
$OPG is showing an interesting shift after an extended bearish trend. Price has started forming higher lows inside a rising support channel, suggesting buyers are gradually gaining control. The recent pullback is now testing this structure, making the rising support a critical level to watch.
If this support holds, OPG could continue its recovery toward $0.1745, with $0.2306 as the next major resistance. However, a confirmed bullish reversal still requires LTF confirmations, including bullish market structure and strong buying momentum.
The key is the rising support. As long as this structure remains intact, the bullish continuation scenario stays alive. A breakdown below it could invalidate the recovery setup and expose price to further downside.
Analysis by LEO524
#Crypto #CryptoTrading #LEO524
$OPG is showing an interesting shift after an extended bearish trend. Price has started forming higher lows inside a rising support channel, suggesting buyers are gradually gaining control. The recent pullback is now testing this structure, making the rising support a critical level to watch.
If this support holds, OPG could continue its recovery toward $0.1745, with $0.2306 as the next major resistance. However, a confirmed bullish reversal still requires LTF confirmations, including bullish market structure and strong buying momentum.
The key is the rising support. As long as this structure remains intact, the bullish continuation scenario stays alive. A breakdown below it could invalidate the recovery setup and expose price to further downside.
Analysis by LEO524
#Crypto #CryptoTrading #LEO524
2
2
1.2k
·
--
Bullish
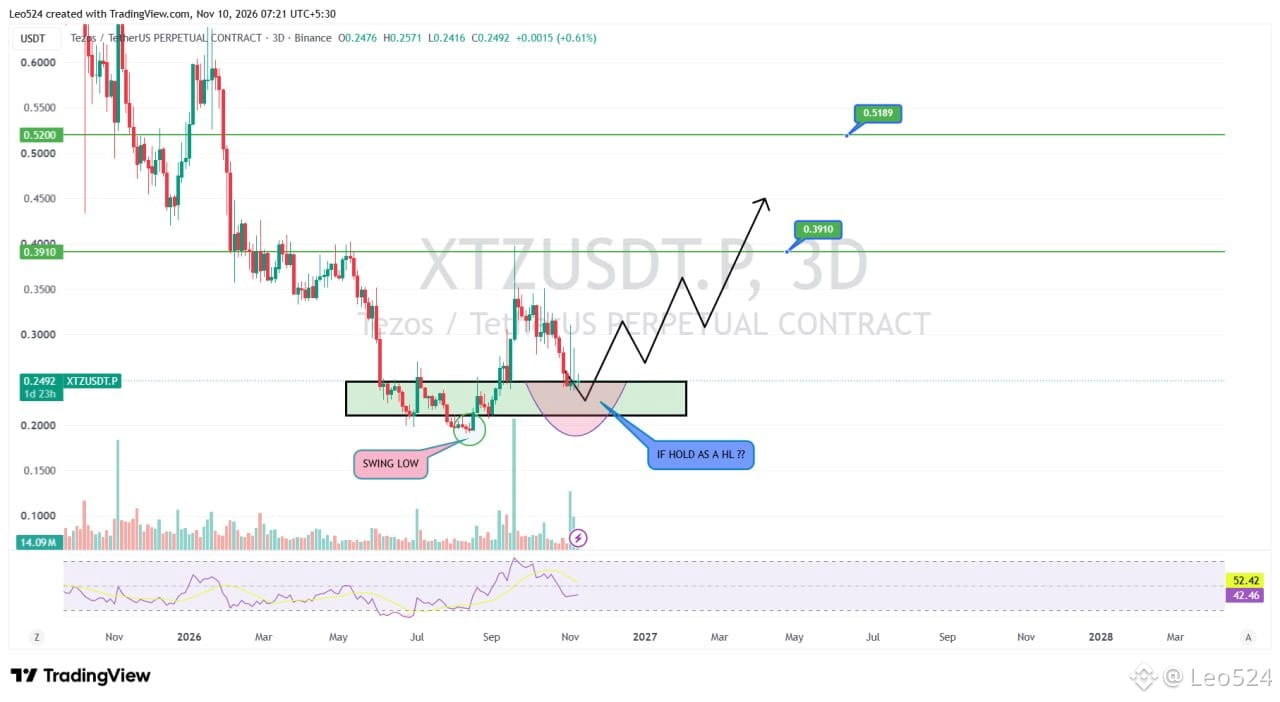
$XTZ: Is This the Beginning of a Major Recovery?
XTZ is approaching a critical demand zone around $0.21–$0.25 after an extended downtrend. This area previously attracted strong buying pressure and triggered a significant recovery. Now price is returning to the same zone, creating an interesting opportunity for a potential bullish reversal. The current reaction could become an important turning point for XTZ.
If buyers successfully defend this zone and start building higher lows, XTZ could gradually shift its market structure toward the bullish side. A recovery toward $0.3910 would be the first major upside objective, while a stronger breakout could potentially open the path toward $0.5189. The key is how price develops from the current demand area.
The bigger picture is becoming interesting. XTZ is testing a zone where a new bullish structure could begin developing. If this demand area continues holding and bullish confirmation appears, the next recovery could become much more significant. This is a zone worth watching closely. 👀
#LEO524 #XTZ
Analysis by LEO524
$XTZ: Is This the Beginning of a Major Recovery?
XTZ is approaching a critical demand zone around $0.21–$0.25 after an extended downtrend. This area previously attracted strong buying pressure and triggered a significant recovery. Now price is returning to the same zone, creating an interesting opportunity for a potential bullish reversal. The current reaction could become an important turning point for XTZ.
If buyers successfully defend this zone and start building higher lows, XTZ could gradually shift its market structure toward the bullish side. A recovery toward $0.3910 would be the first major upside objective, while a stronger breakout could potentially open the path toward $0.5189. The key is how price develops from the current demand area.
The bigger picture is becoming interesting. XTZ is testing a zone where a new bullish structure could begin developing. If this demand area continues holding and bullish confirmation appears, the next recovery could become much more significant. This is a zone worth watching closely. 👀
#LEO524 #XTZ
Analysis by LEO524
XTZ is approaching a critical demand zone around $0.21–$0.25 after an extended downtrend. This area previously attracted strong buying pressure and triggered a significant recovery. Now price is returning to the same zone, creating an interesting opportunity for a potential bullish reversal. The current reaction could become an important turning point for XTZ.
If buyers successfully defend this zone and start building higher lows, XTZ could gradually shift its market structure toward the bullish side. A recovery toward $0.3910 would be the first major upside objective, while a stronger breakout could potentially open the path toward $0.5189. The key is how price develops from the current demand area.
The bigger picture is becoming interesting. XTZ is testing a zone where a new bullish structure could begin developing. If this demand area continues holding and bullish confirmation appears, the next recovery could become much more significant. This is a zone worth watching closely. 👀
#LEO524 #XTZ
Analysis by LEO524
338
·
--
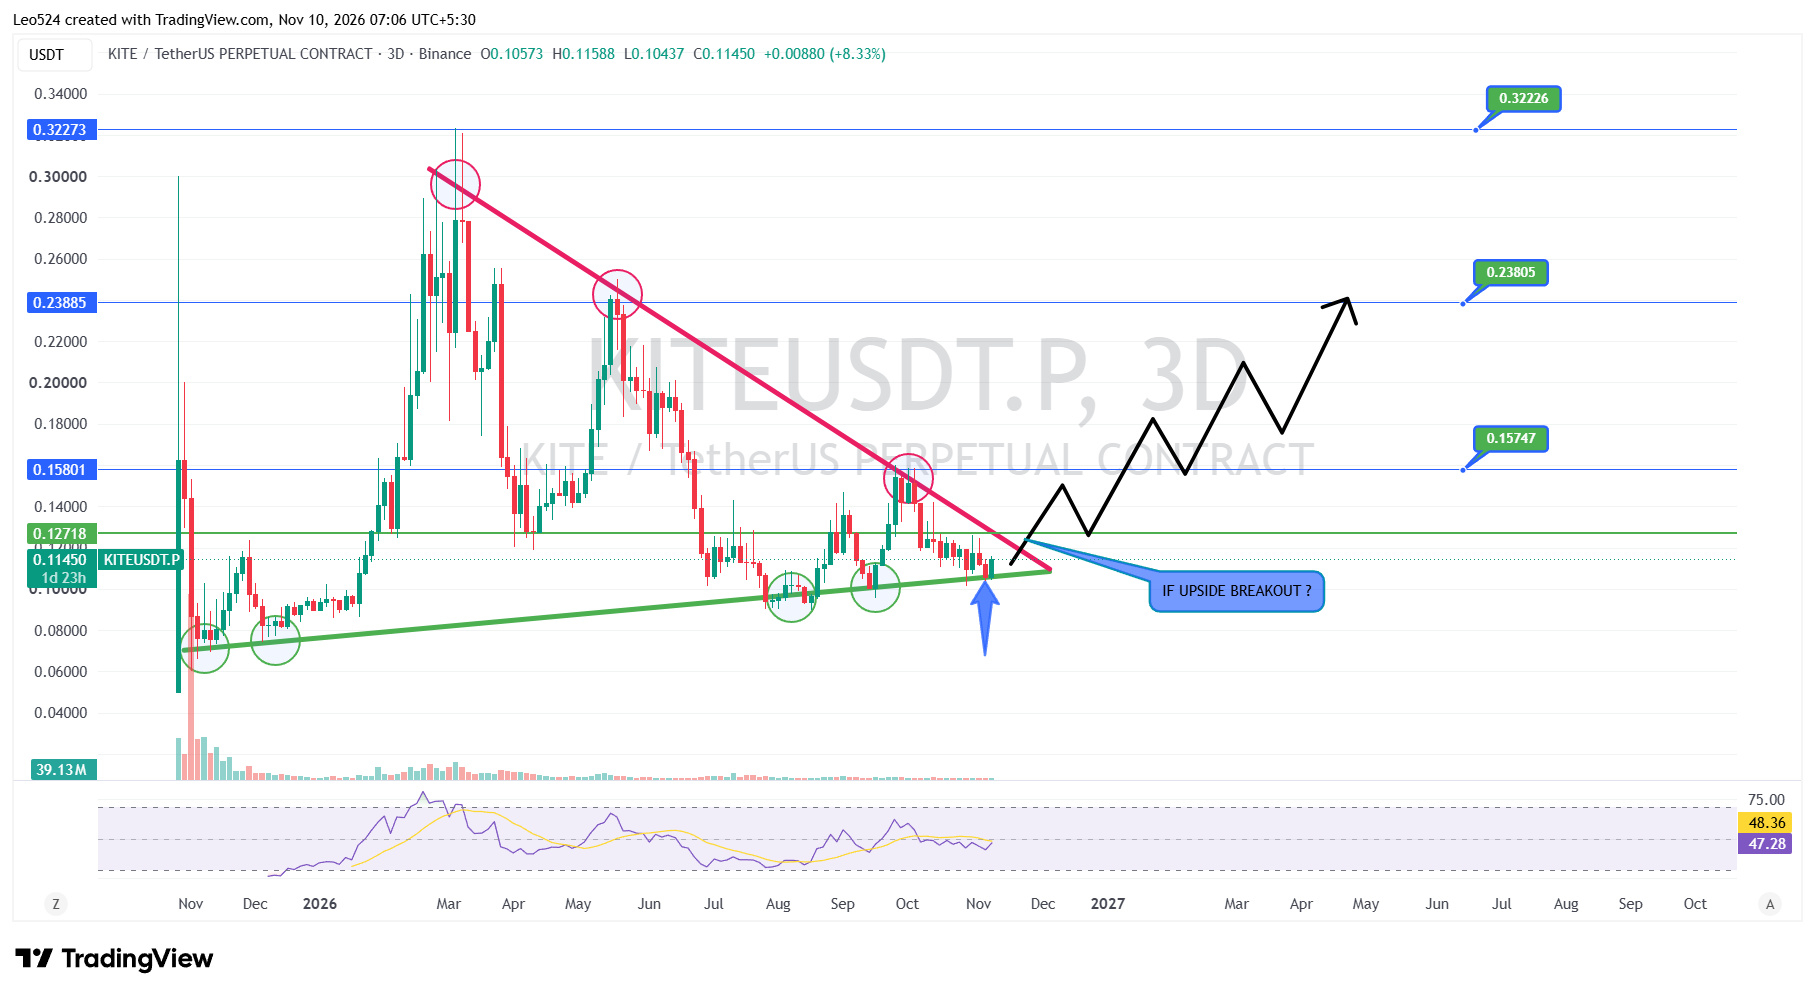
$KITE: Is a Major Breakout Finally Coming..?
$KITE is approaching a critical point on the 3D chart. After months of lower highs, price is now compressing between a rising support trendline and a descending resistance trendline. This creates a clear triangle structure, and the market is getting closer to a major decision. Buyers are defending the lower zone, but the descending resistance remains the biggest obstacle.
Bullish Scenario: If KITE breaks above the descending trendline and holds above $0.12718, the next important resistance levels are $0.15801 and $0.23885. A strong breakout with volume could open the door for a much larger recovery toward $0.32273.
Bearish Scenario:If price loses the rising support trendline and breaks below the $0.09–$0.10 region, the current structure could fail. Buyers may lose control, leading to another downside move and a possible retest of previous lows. Until a confirmed breakout happens, both scenarios remain on the table.
#Crypto #CryptoTrading #LEO524
$KITE : Is a Major Breakout Finally Coming..?
$KITE is approaching a critical point on the 3D chart. After months of lower highs, price is now compressing between a rising support trendline and a descending resistance trendline. This creates a clear triangle structure, and the market is getting closer to a major decision. Buyers are defending the lower zone, but the descending resistance remains the biggest obstacle.
Bullish Scenario: If KITE breaks above the descending trendline and holds above $0.12718, the next important resistance levels are $0.15801 and $0.23885. A strong breakout with volume could open the door for a much larger recovery toward $0.32273.
Bearish Scenario:If price loses the rising support trendline and breaks below the $0.09–$0.10 region, the current structure could fail. Buyers may lose control, leading to another downside move and a possible retest of previous lows. Until a confirmed breakout happens, both scenarios remain on the table.
#Crypto #CryptoTrading #LEO524
$KITE is approaching a critical point on the 3D chart. After months of lower highs, price is now compressing between a rising support trendline and a descending resistance trendline. This creates a clear triangle structure, and the market is getting closer to a major decision. Buyers are defending the lower zone, but the descending resistance remains the biggest obstacle.
Bullish Scenario: If KITE breaks above the descending trendline and holds above $0.12718, the next important resistance levels are $0.15801 and $0.23885. A strong breakout with volume could open the door for a much larger recovery toward $0.32273.
Bearish Scenario:If price loses the rising support trendline and breaks below the $0.09–$0.10 region, the current structure could fail. Buyers may lose control, leading to another downside move and a possible retest of previous lows. Until a confirmed breakout happens, both scenarios remain on the table.
#Crypto #CryptoTrading #LEO524
359
·
--
Bullish
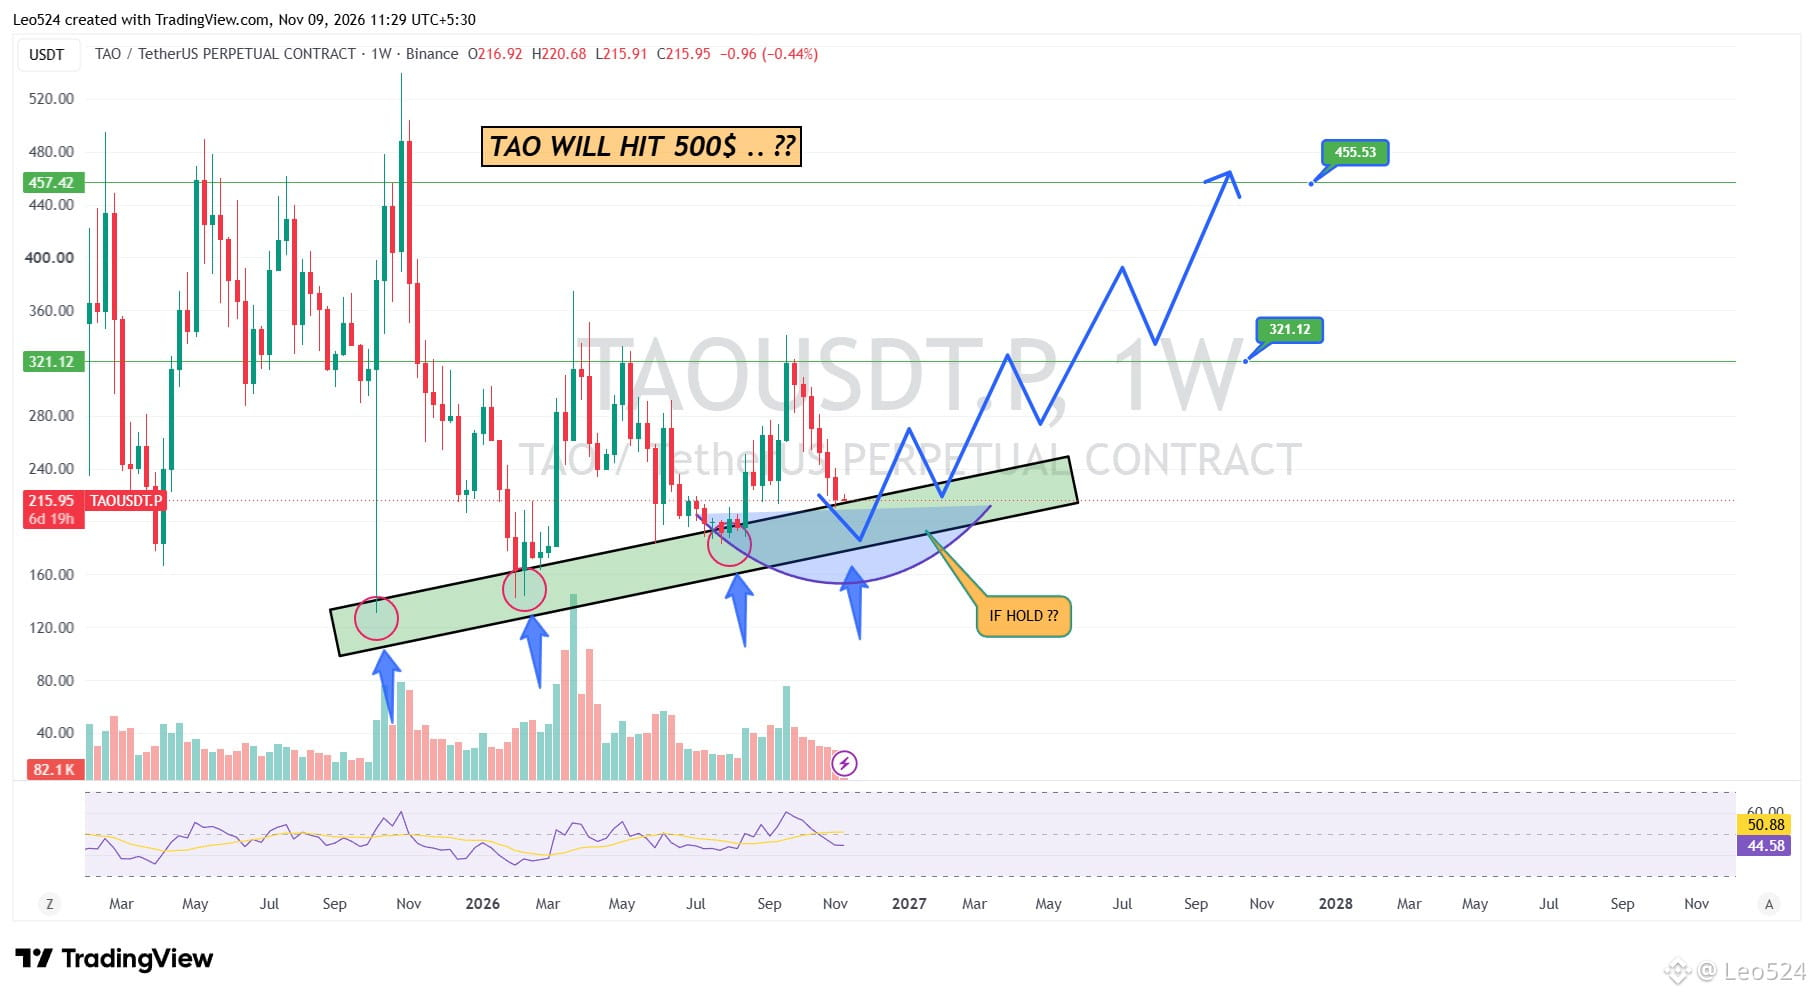
$TAO TO $500? THE BIG MOVE MAY BE COMING ..?
TAO is still moving inside a long-term ascending channel on the weekly chart. Every major drop into the lower part of this channel has attracted buyers, and price is now testing another important area around $180–$200. This zone could become a strong base if buyers continue to defend it.
If this support holds and TAO starts building bullish momentum, the first major resistance is around $321, followed by $455. A breakout above these levels could open the door toward the $500 area. But first, we need to see a strong recovery and confirmation from the weekly structure.
#TAO #bittensor r #crypto #Leo524
Analysis by LEO524
$TAO TO $500? THE BIG MOVE MAY BE COMING ..?
TAO is still moving inside a long-term ascending channel on the weekly chart. Every major drop into the lower part of this channel has attracted buyers, and price is now testing another important area around $180–$200. This zone could become a strong base if buyers continue to defend it.
If this support holds and TAO starts building bullish momentum, the first major resistance is around $321, followed by $455. A breakout above these levels could open the door toward the $500 area. But first, we need to see a strong recovery and confirmation from the weekly structure.
#TAO #bittensor r #crypto #Leo524
Analysis by LEO524
TAO is still moving inside a long-term ascending channel on the weekly chart. Every major drop into the lower part of this channel has attracted buyers, and price is now testing another important area around $180–$200. This zone could become a strong base if buyers continue to defend it.
If this support holds and TAO starts building bullish momentum, the first major resistance is around $321, followed by $455. A breakout above these levels could open the door toward the $500 area. But first, we need to see a strong recovery and confirmation from the weekly structure.
#TAO #bittensor r #crypto #Leo524
Analysis by LEO524
2
6
6.5k
·
--
The market is not stable right now. Please avoid trading in these conditions and protect your capital. Don't risk losing your hard-earned money. For now, just watch the market and wait for better opportunities. Stay safe. ❤️
The market is not stable right now. Please avoid trading in these conditions and protect your capital. Don't risk losing your hard-earned money. For now, just watch the market and wait for better opportunities. Stay safe. ❤️
1
3
378
·
--
Bullish
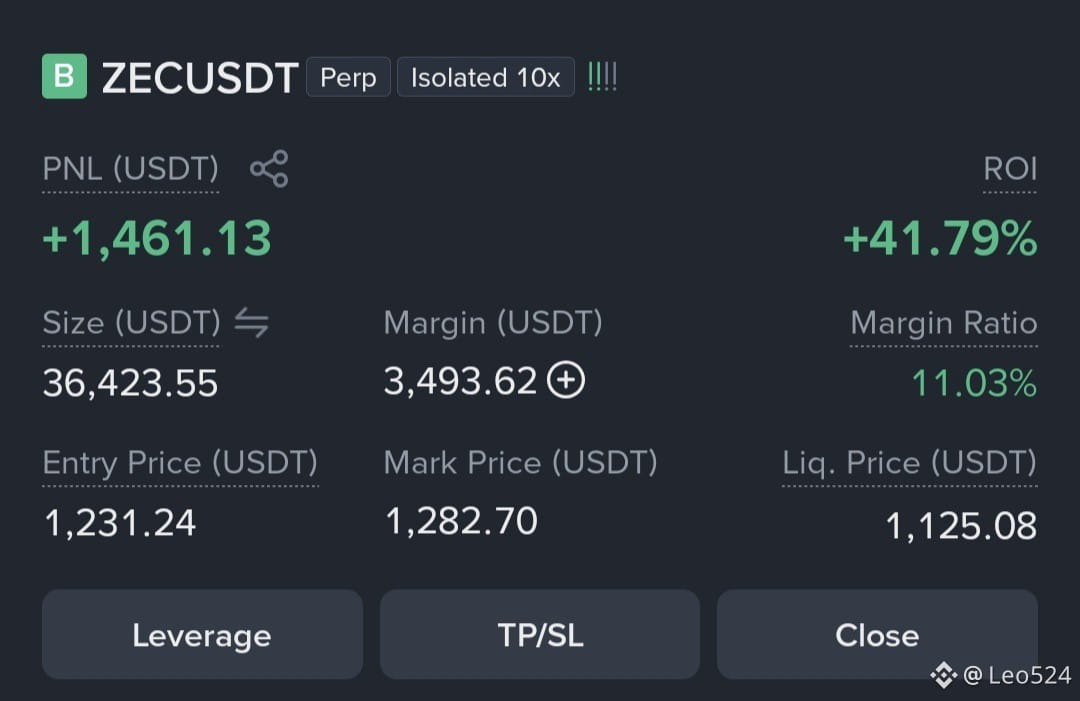
$ZEC I never take guess entries. I wait for the right time, proper confirmation, and a clear setup before entering a trade. Patience is part of my strategy. I always wait for the right moment and take my entry at the right place 💸💸
$ZEC I never take guess entries. I wait for the right time, proper confirmation, and a clear setup before entering a trade. Patience is part of my strategy. I always wait for the right moment and take my entry at the right place 💸💸
Leo524
·
--
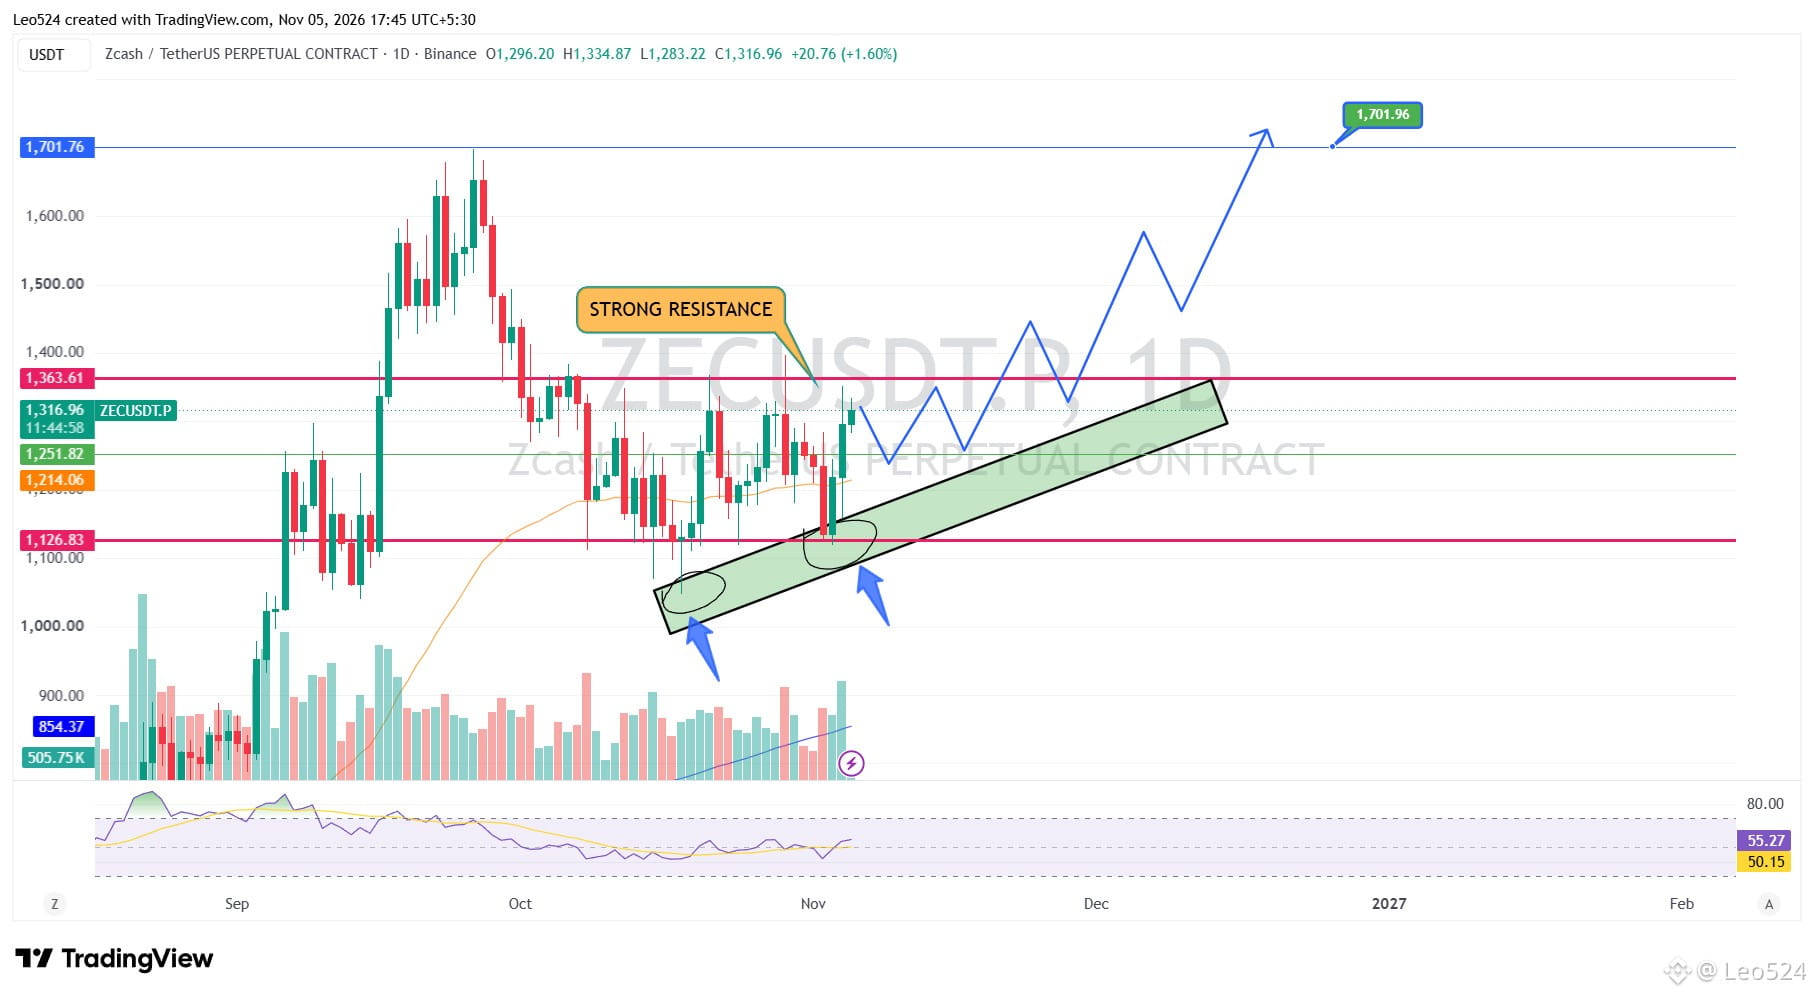
Bullish$ZEC Is This the Beginning of a Major Breakout ..?
Zcash is showing some interesting price action on the daily chart. After the massive rally and the recent correction, price has started building a structure inside an ascending channel. Buyers are defending the rising support zone, and we're seeing another attempt to push the market higher.
The $1,363 area remains a strong resistance level. If bulls can break above this level and hold it as support, the next major challenge sits around $1,700. A clean breakout above that level could open the door for another significant upside move.
For now, I'm watching how price reacts around the ascending support and the $1,363 resistance. As long as buyers continue defending this structure, the bullish scenario remains interesting. However, losing the channel support could change the entire picture.
#Crypto #CryptoTrading #LEO524 #ZEC
Zcash is showing some interesting price action on the daily chart. After the massive rally and the recent correction, price has started building a structure inside an ascending channel. Buyers are defending the rising support zone, and we're seeing another attempt to push the market higher.
The $1,363 area remains a strong resistance level. If bulls can break above this level and hold it as support, the next major challenge sits around $1,700. A clean breakout above that level could open the door for another significant upside move.
For now, I'm watching how price reacts around the ascending support and the $1,363 resistance. As long as buyers continue defending this structure, the bullish scenario remains interesting. However, losing the channel support could change the entire picture.
#Crypto #CryptoTrading #LEO524 #ZEC
1
6
3.1k
·
--
Bullish
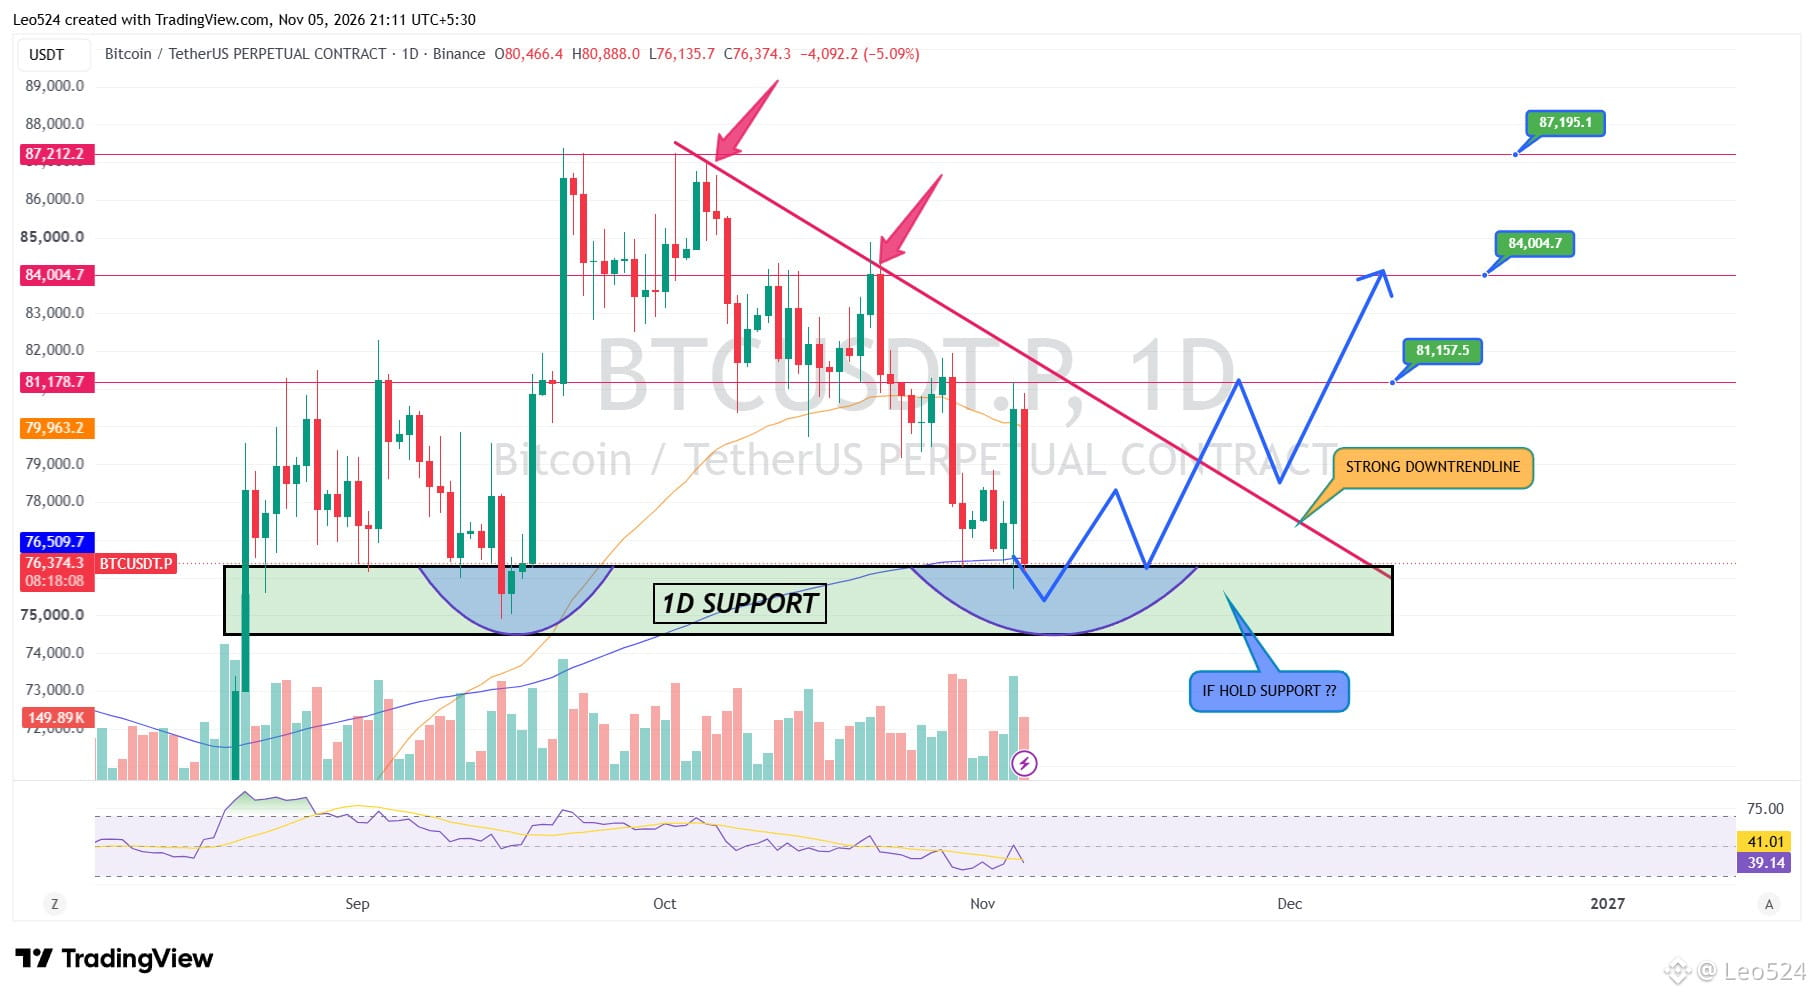
$BTC AT A CRITICAL SUPPORT — BOUNCE OR ANOTHER LEG DOWN ..?
Bitcoin is approaching a major daily support zone around $74.5K–$76K after facing strong rejection from the $87K region. The market structure remains bearish, with lower highs forming along a strong descending trendline. Sellers are still controlling the momentum, and RSI is showing weakness.
I'm closely watching this daily support zone because it could become an important turning point. If buyers successfully defend this area and start building bullish structure, BTC could attempt a recovery toward $81K, followed by $84K. However, these resistance levels must be reclaimed before expecting a stronger bullish move.
If daily support fails to hold, the market could face another wave of downside pressure. For now, this is a critical zone where BTC needs to prove that buyers are still present. The next reaction here could determine the direction of the coming move.
#crypto #cryptotrading #Leo524 #BTC
$BTC AT A CRITICAL SUPPORT — BOUNCE OR ANOTHER LEG DOWN ..?
Bitcoin is approaching a major daily support zone around $74.5K–$76K after facing strong rejection from the $87K region. The market structure remains bearish, with lower highs forming along a strong descending trendline. Sellers are still controlling the momentum, and RSI is showing weakness.
I'm closely watching this daily support zone because it could become an important turning point. If buyers successfully defend this area and start building bullish structure, BTC could attempt a recovery toward $81K, followed by $84K. However, these resistance levels must be reclaimed before expecting a stronger bullish move.
If daily support fails to hold, the market could face another wave of downside pressure. For now, this is a critical zone where BTC needs to prove that buyers are still present. The next reaction here could determine the direction of the coming move.
#crypto #cryptotrading #Leo524 #BTC
Bitcoin is approaching a major daily support zone around $74.5K–$76K after facing strong rejection from the $87K region. The market structure remains bearish, with lower highs forming along a strong descending trendline. Sellers are still controlling the momentum, and RSI is showing weakness.
I'm closely watching this daily support zone because it could become an important turning point. If buyers successfully defend this area and start building bullish structure, BTC could attempt a recovery toward $81K, followed by $84K. However, these resistance levels must be reclaimed before expecting a stronger bullish move.
If daily support fails to hold, the market could face another wave of downside pressure. For now, this is a critical zone where BTC needs to prove that buyers are still present. The next reaction here could determine the direction of the coming move.
#crypto #cryptotrading #Leo524 #BTC
2
282
·
--
Bullish
$ZEC Is This the Beginning of a Major Breakout ..?
Zcash is showing some interesting price action on the daily chart. After the massive rally and the recent correction, price has started building a structure inside an ascending channel. Buyers are defending the rising support zone, and we're seeing another attempt to push the market higher.
The $1,363 area remains a strong resistance level. If bulls can break above this level and hold it as support, the next major challenge sits around $1,700. A clean breakout above that level could open the door for another significant upside move.
For now, I'm watching how price reacts around the ascending support and the $1,363 resistance. As long as buyers continue defending this structure, the bullish scenario remains interesting. However, losing the channel support could change the entire picture.
#Crypto #CryptoTrading #LEO524 #ZEC
$ZEC Is This the Beginning of a Major Breakout ..?
Zcash is showing some interesting price action on the daily chart. After the massive rally and the recent correction, price has started building a structure inside an ascending channel. Buyers are defending the rising support zone, and we're seeing another attempt to push the market higher.
The $1,363 area remains a strong resistance level. If bulls can break above this level and hold it as support, the next major challenge sits around $1,700. A clean breakout above that level could open the door for another significant upside move.
For now, I'm watching how price reacts around the ascending support and the $1,363 resistance. As long as buyers continue defending this structure, the bullish scenario remains interesting. However, losing the channel support could change the entire picture.
#Crypto #CryptoTrading #LEO524 #ZEC
Zcash is showing some interesting price action on the daily chart. After the massive rally and the recent correction, price has started building a structure inside an ascending channel. Buyers are defending the rising support zone, and we're seeing another attempt to push the market higher.
The $1,363 area remains a strong resistance level. If bulls can break above this level and hold it as support, the next major challenge sits around $1,700. A clean breakout above that level could open the door for another significant upside move.
For now, I'm watching how price reacts around the ascending support and the $1,363 resistance. As long as buyers continue defending this structure, the bullish scenario remains interesting. However, losing the channel support could change the entire picture.
#Crypto #CryptoTrading #LEO524 #ZEC
1
3
1.6k
·
--
$BTC TO $160K? I'M PLAYING THE BIGGER PICTURE.
Bitcoin is still holding inside an important support zone, and personally, I'm looking at this as a potential accumulation opportunity.
My BTC buying zone starts around $77K and extends down to $68K. I'm gradually accumulating spot across this range, with $72K and $68K being important levels where I'm prepared to add more.
Looking at the bigger picture, I believe BTC has the potential for a major recovery, with $160K as my long-term target.
I'm accumulating, not chasing. Let's see what happens.
#bitcoin #BTC #Leo524
$BTC TO $160K? I'M PLAYING THE BIGGER PICTURE.
Bitcoin is still holding inside an important support zone, and personally, I'm looking at this as a potential accumulation opportunity.
My BTC buying zone starts around $77K and extends down to $68K. I'm gradually accumulating spot across this range, with $72K and $68K being important levels where I'm prepared to add more.
Looking at the bigger picture, I believe BTC has the potential for a major recovery, with $160K as my long-term target.
I'm accumulating, not chasing. Let's see what happens.
#bitcoin #BTC #Leo524
Bitcoin is still holding inside an important support zone, and personally, I'm looking at this as a potential accumulation opportunity.
My BTC buying zone starts around $77K and extends down to $68K. I'm gradually accumulating spot across this range, with $72K and $68K being important levels where I'm prepared to add more.
Looking at the bigger picture, I believe BTC has the potential for a major recovery, with $160K as my long-term target.
I'm accumulating, not chasing. Let's see what happens.
#bitcoin #BTC #Leo524
7
1
186
99.7k
·
--
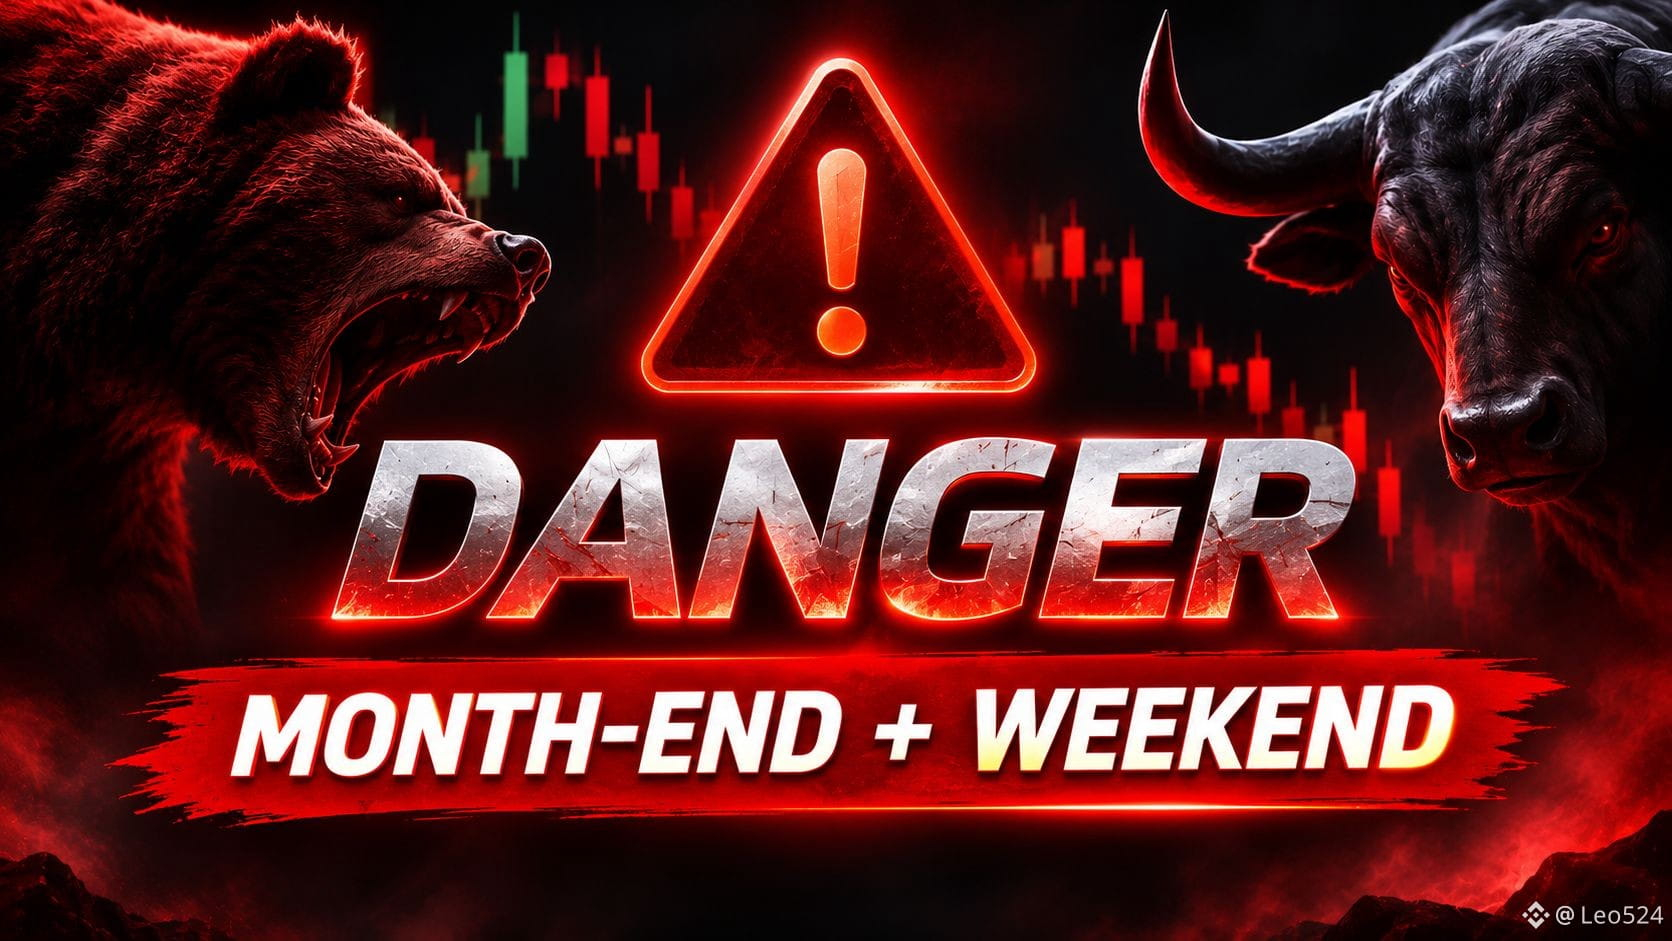
MONTH-END + WEEKEND — BE CAREFUL WITH THE MARKET!
Today marks the end of the month, and we are also heading into the weekend. This is a period where market movements can become unpredictable, and liquidity hunts are very possible.
Large players may take advantage of lower weekend liquidity to push prices in either direction, trigger stop losses, sweep liquidity levels, and create sudden moves that can trap both long and short traders.
Don't rush into trades just because you see a sudden breakout or breakdown. Some of these moves may look like real market direction but could simply be liquidity grabs before the market makes its actual move.
My advice : Stay away from unnecessary trades and focus on watching the market until Monday.
#Crypto #CryptoTrading #LEO524
MONTH-END + WEEKEND — BE CAREFUL WITH THE MARKET!
Today marks the end of the month, and we are also heading into the weekend. This is a period where market movements can become unpredictable, and liquidity hunts are very possible.
Large players may take advantage of lower weekend liquidity to push prices in either direction, trigger stop losses, sweep liquidity levels, and create sudden moves that can trap both long and short traders.
Don't rush into trades just because you see a sudden breakout or breakdown. Some of these moves may look like real market direction but could simply be liquidity grabs before the market makes its actual move.
My advice : Stay away from unnecessary trades and focus on watching the market until Monday.
#Crypto #CryptoTrading #LEO524
Today marks the end of the month, and we are also heading into the weekend. This is a period where market movements can become unpredictable, and liquidity hunts are very possible.
Large players may take advantage of lower weekend liquidity to push prices in either direction, trigger stop losses, sweep liquidity levels, and create sudden moves that can trap both long and short traders.
Don't rush into trades just because you see a sudden breakout or breakdown. Some of these moves may look like real market direction but could simply be liquidity grabs before the market makes its actual move.
My advice : Stay away from unnecessary trades and focus on watching the market until Monday.
#Crypto #CryptoTrading #LEO524
1
4
568
Log in to explore more content
Join global crypto users on Binance Square
⚡️ Get latest and useful information about crypto.
💬 Trusted by the world’s largest crypto exchange.
👍 Discover real insights from verified creators.
Email / Phone number
Trending Topics
AnthropicIPOTestsInvestorAppetiteForAI
394 views
27 Discussing
🚨 ANTHROPIC IPO: THE BIGGEST TEST OF AI INVESTOR CONFIDENCE?
$ANTHROPIC
What if Anthropic's IPO reveals whether Wall Street still believes in the AI revolution — or whether the AI hype is finally facing a reality check?
The numbers are getting serious. 👀
Anthropic's massive IPO is attracting extraordinary institutional investor attention, with reports indicating that demand reached approximately 6 times the available shares during its roadshow.
Here's why the market is watching closely:
🔥 1. Massive Investor Demand: Institutional investors are showing strong interest in Anthropic's public offering, signaling that appetite for leading AI companies remains powerful.
📈 2. A Billion-Dollar AI Battle: Anthropic's proposed IPO could raise approximately $64 billion, potentially valuing the company around $1.3–$1.4 trillion.
🤖 3. The Claude Factor: Anthropic isn't just selling an AI story. Its Claude ecosystem is competing in one of the fastest-growing technology markets in history.
⚠️ 4. The Biggest Risk: Strong IPO demand doesn't automatically mean a successful long-term investment. Investors must consider valuation, computing expenses, competition, and whether AI revenue can justify enormous spending.
WHY DOES THIS MATTER FOR THE CRYPTO MARKET?
Because AI is becoming one of the biggest investment narratives across global financial markets.
If Anthropic delivers a successful market debut, confidence in the broader AI investment theme could strengthen.
That could also bring renewed attention to AI-related crypto projects.
But remember: AI stocks and AI crypto tokens are different markets. A successful IPO does not guarantee that AI tokens will pump.
My take: This IPO could become a major benchmark for how much investors are willing to pay for the future of artificial intelligence.
The real question isn't whether AI is powerful.
It's whether today's valuations can survive tomorrow's reality.
Drop your opinion below. Let's see where the market stands!
#AnthropicIPO #AnthropicIPOTestsInvestorAppetiteForAI
Bilal Trade Signals
·1 Likes
·33 views
A Packed Week of Earnings and Data Tests Markets
3,044 views
55 Discussing
HuangReportedlyConsidersReturnToNvidia
17,178 views
272 Discussing