
周东野
461 Posts

周东野
I'm Dongye from Rian,Dedicated to making life more interesting.
热爱自己热爱的东西,分析、家庭、分享、新闻、加密、公益。
声明:所有推文皆为个人观点,不构成任何投资建议。
投资有风险,入市需谨慎。合作可私
Open Trade
High-Frequency Trader
5.3 Years
31 Following
5.5K+ Followers
868 Liked
Posts
Portfolio
All
Quotes
Videos
Live
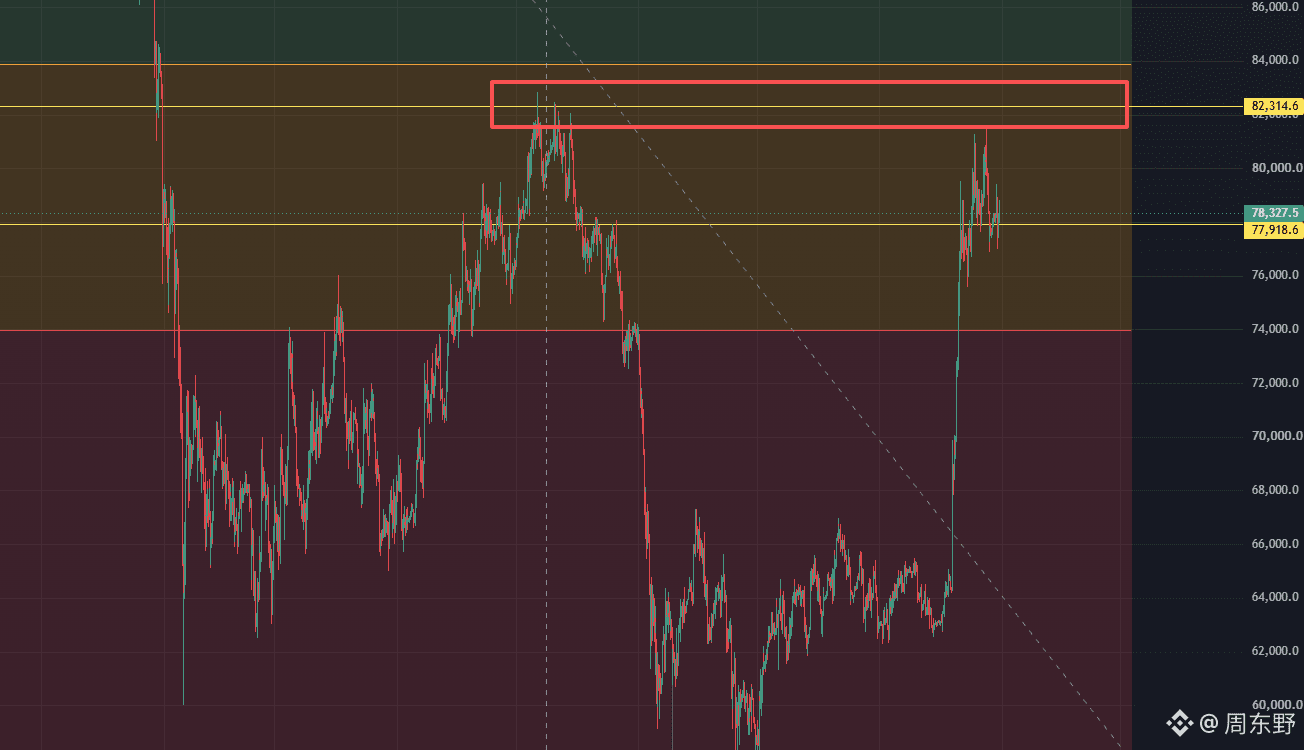
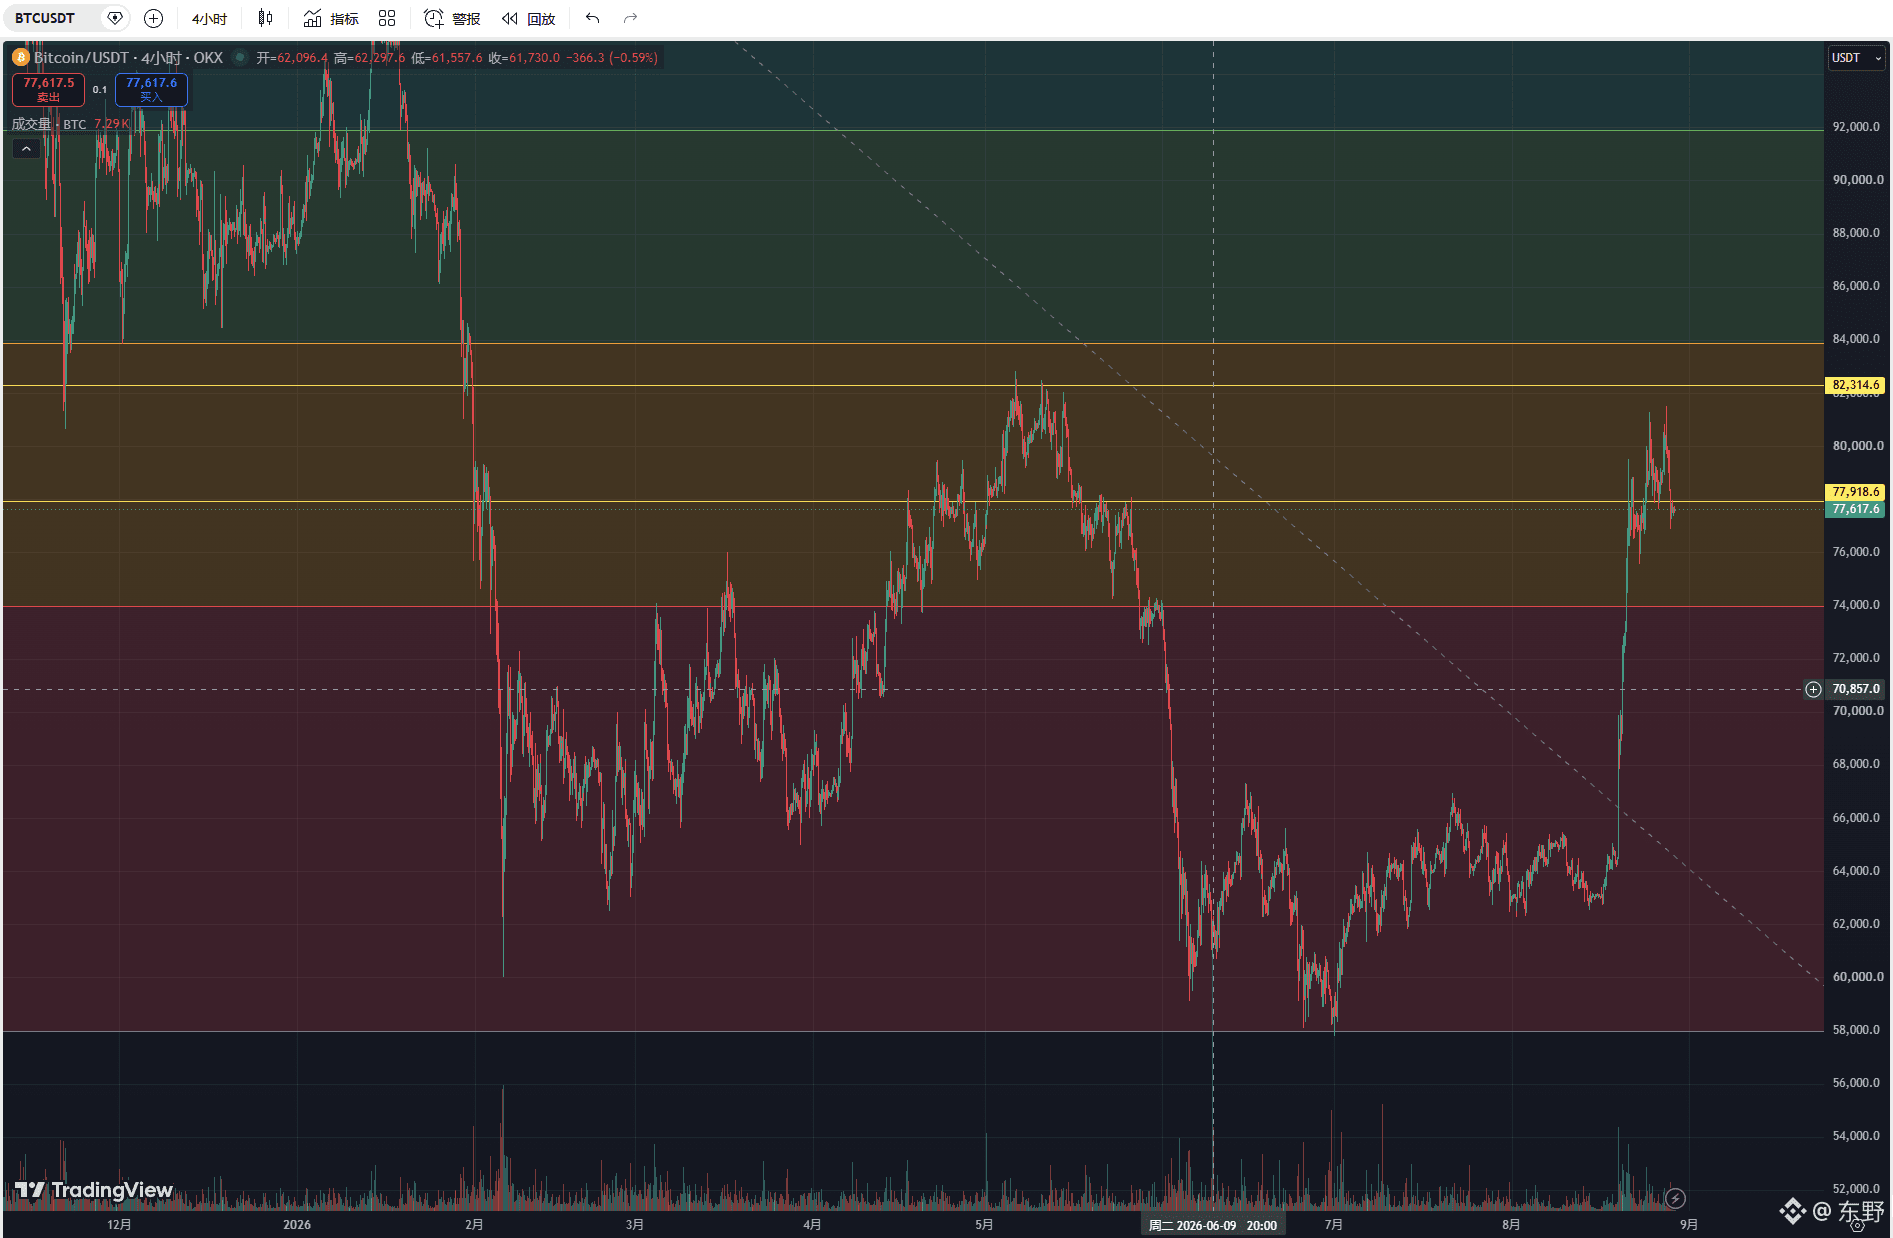
At $78,000, it’s like pinning the $BTC Bitcoin at a crossroads. After a violent surge of 24% in August, the market didn’t choose to keep blasting higher, nor did it undergo a sharp, textbook-style correction. Instead, it displayed a disturbing kind of eerie silence.
If you break down the underlying data, the August session opened at 62,814, dipped to 62,277, and then within less than two weeks rallied to 81,455—up more than 24% for the month, marking the strongest August since 2017. The next part of the script will be familiar to everyone: Fed Chair Warsh sent hawkish signals at Jackson Hole, and the probability of rate hikes in September jumped to 56%. Bitcoin promptly pulled back to 76,845, triggering liquidations across the entire network totaling $486 million, including $368 million in long liquidations.
Based on past logic, this kind of macro negative news should be enough to trigger a deep dip. But the order book resilience is extremely strong—the price is still steadily holding above $78,000, while total market cap remains around $1.57 trillion.
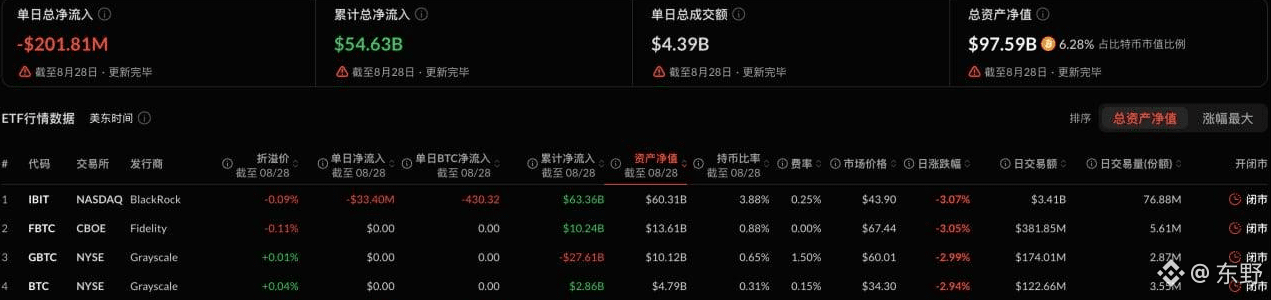
Looking at the microstructure of the ETFs, the single-day net outflow of $201.8 million looks frightening at first glance. But BlackRock’s IBIT saw only a $33.4 million outflow. The main selling pressure came from Ark ARK’s $114.9 million. This is just partial profit-taking by funds that were up at the highs—not a mass exit by institutions. Even so, the ETF net inflow for the entire month of August still exceeds $3.1 billion.
$78,000 isn’t the end of the trend—it’s a stopover where bulls and bears trade hands. As long as the key level at $77,000 isn’t broken, the overall structure hasn’t been damaged. If it loses that level, support below could be seen down to $75,500 and even $70,000. Right now, macro forces and capital are colliding violently. Spot holdings can be held steady, while high-leverage positions are extremely fragile in the face of extreme wick “needle” spikes.
This period of sideways consolidation is essentially cleansing weak hands to prepare for the next stage of the battle over pricing power.
#比特币8月上涨23%跑赢黄金股市
If you break down the underlying data, the August session opened at 62,814, dipped to 62,277, and then within less than two weeks rallied to 81,455—up more than 24% for the month, marking the strongest August since 2017. The next part of the script will be familiar to everyone: Fed Chair Warsh sent hawkish signals at Jackson Hole, and the probability of rate hikes in September jumped to 56%. Bitcoin promptly pulled back to 76,845, triggering liquidations across the entire network totaling $486 million, including $368 million in long liquidations.
Based on past logic, this kind of macro negative news should be enough to trigger a deep dip. But the order book resilience is extremely strong—the price is still steadily holding above $78,000, while total market cap remains around $1.57 trillion.
Looking at the microstructure of the ETFs, the single-day net outflow of $201.8 million looks frightening at first glance. But BlackRock’s IBIT saw only a $33.4 million outflow. The main selling pressure came from Ark ARK’s $114.9 million. This is just partial profit-taking by funds that were up at the highs—not a mass exit by institutions. Even so, the ETF net inflow for the entire month of August still exceeds $3.1 billion.
$78,000 isn’t the end of the trend—it’s a stopover where bulls and bears trade hands. As long as the key level at $77,000 isn’t broken, the overall structure hasn’t been damaged. If it loses that level, support below could be seen down to $75,500 and even $70,000. Right now, macro forces and capital are colliding violently. Spot holdings can be held steady, while high-leverage positions are extremely fragile in the face of extreme wick “needle” spikes.
This period of sideways consolidation is essentially cleansing weak hands to prepare for the next stage of the battle over pricing power.
#比特币8月上涨23%跑赢黄金股市

The big pancake $BTC has shown strength at the 78,000 level—harder than many people think. On the 4H chart, when it drops to the lower band, it’s quickly kicked back with a long lower wick. This isn’t retail “buying the dip”; it’s market makers and quantitative programs at this position that are placing orders aggressively to eat the sell pressure. At this level, the shorts can’t push it, so the liquidity pool naturally locks the float.
The current order book is very pure. After the 4H reclaims the mid-band, the densely concentrated short-leverage liquidation zone on the short-term liquidation map is in the 80,000 to 81,000 area. As long as price holds steady around 78,500, market makers will have strong momentum to sweep buys upward and consume all the liquidity that has accumulated above.
After the gap on the 1H, the opening move is extremely clean. Price runs tight along the upper band, and the slope has become very steep. In this kind of formation, trying to open shorts aggressively or waiting for a pullback to enter again will most likely get crushed by a momentum squeeze that leaves you behind.
My personal strategy is very straightforward. The current market doesn’t require elaborate long-term macro narratives—only the current highest-certainty liquidity squeeze. Push longs along with the flow in the 78,300 to 78,600 zone where the highest concentration of chip exchange is happening. Place the first take-profit order at the 80,000 round-number level, and keep the remaining position to hit the 81,000 prior high liquidity.
The only risk here isn’t a break of the formation—it’s the sideways “fake breakdown” before the U.S. stock market opens. If the price breaks down below 78,000 on low volume and the 1H cannot reclaim it within half an hour, that means big capital is expanding the shakeout range. At that point, exit immediately—never stubbornly hold on.
#比特币守稳78000美元上方
The current order book is very pure. After the 4H reclaims the mid-band, the densely concentrated short-leverage liquidation zone on the short-term liquidation map is in the 80,000 to 81,000 area. As long as price holds steady around 78,500, market makers will have strong momentum to sweep buys upward and consume all the liquidity that has accumulated above.
After the gap on the 1H, the opening move is extremely clean. Price runs tight along the upper band, and the slope has become very steep. In this kind of formation, trying to open shorts aggressively or waiting for a pullback to enter again will most likely get crushed by a momentum squeeze that leaves you behind.
My personal strategy is very straightforward. The current market doesn’t require elaborate long-term macro narratives—only the current highest-certainty liquidity squeeze. Push longs along with the flow in the 78,300 to 78,600 zone where the highest concentration of chip exchange is happening. Place the first take-profit order at the 80,000 round-number level, and keep the remaining position to hit the 81,000 prior high liquidity.
The only risk here isn’t a break of the formation—it’s the sideways “fake breakdown” before the U.S. stock market opens. If the price breaks down below 78,000 on low volume and the 1H cannot reclaim it within half an hour, that means big capital is expanding the shakeout range. At that point, exit immediately—never stubbornly hold on.
#比特币守稳78000美元上方
SK Hynix extends its reach into Miyagi, Japan, planning to build factories worth hundreds of billions of dollars. On the surface, it looks like multinational capacity expansion, but underneath it is all about capacity anxiety forced on it by major tech giants.
The site selection criteria laid out by Choi Tae-won are extremely practical: adequate water and electricity. In the end, as wafer fabs are pushed to the limit, it’s not grand rhetoric—it’s the most basic industrial energy inputs.
Let’s do a straightforward benefit calculation. South Korea’s home market puts in 54 trillion won; in the United States, advanced packaging plants have just started construction; and then Japan is added as well. This “Made in South Korea + U.S. packaging + Japanese materials and equipment” triangular setup effectively leverages Japan’s existing equipment, material reserves, and government subsidies, forcibly shortening delivery times in the supply chain.
This is absolutely not marketing talk pulled out of thin air. HBM consumes wafer capacity at an astonishing rate. To produce HBM with the same capacity, the wafer area consumed is nearly more than three times that of traditional DDR5—directly choking off DRAM capacity. On top of that, AI inference drives a massive surge in demand for enterprise SSDs, and the supply-demand structure has been completely rewritten, with $NVDA.US involved.
The biggest misconception in the market is still to treat this cycle as if it were the previous cycle of periodic alternation. The AI infrastructure’s appetite has turned memory chips—from standardized commodity products—into bespoke, high-barrier computing components.
Japan’s factories are projected to start production as early as 2028, but that won’t solve shortages within the next one or two to three years. This confirms a harsh reality: before 2028, physical capacity can never catch up with the rate at which computing demand consumes it. Memory suppliers will lock in excessive profits at high prices, while end users will have no choice but to keep paying for expensive storage premiums.
#sk海力士研究在日本合建存储芯片厂
The site selection criteria laid out by Choi Tae-won are extremely practical: adequate water and electricity. In the end, as wafer fabs are pushed to the limit, it’s not grand rhetoric—it’s the most basic industrial energy inputs.
Let’s do a straightforward benefit calculation. South Korea’s home market puts in 54 trillion won; in the United States, advanced packaging plants have just started construction; and then Japan is added as well. This “Made in South Korea + U.S. packaging + Japanese materials and equipment” triangular setup effectively leverages Japan’s existing equipment, material reserves, and government subsidies, forcibly shortening delivery times in the supply chain.
This is absolutely not marketing talk pulled out of thin air. HBM consumes wafer capacity at an astonishing rate. To produce HBM with the same capacity, the wafer area consumed is nearly more than three times that of traditional DDR5—directly choking off DRAM capacity. On top of that, AI inference drives a massive surge in demand for enterprise SSDs, and the supply-demand structure has been completely rewritten, with $NVDA.US involved.
The biggest misconception in the market is still to treat this cycle as if it were the previous cycle of periodic alternation. The AI infrastructure’s appetite has turned memory chips—from standardized commodity products—into bespoke, high-barrier computing components.
Japan’s factories are projected to start production as early as 2028, but that won’t solve shortages within the next one or two to three years. This confirms a harsh reality: before 2028, physical capacity can never catch up with the rate at which computing demand consumes it. Memory suppliers will lock in excessive profits at high prices, while end users will have no choice but to keep paying for expensive storage premiums.
#sk海力士研究在日本合建存储芯片厂

As soon as geopolitical war breaks out, crude oil surges wildly, and crypto markets are the first to get dumped.
Last night, the U.S. military bombed Iran's Larak Island, and Iran immediately fired missiles back at U.S. bases.
Brent crude broke through $90, and WTI crude rose more than 2%. Traditional safe-haven assets gold and silver saw an early spike and then pulled back, U.S. stock futures fell across the board, and $BTC Bitcoin, after surging past $78,000, retraced nearly 0.7% within 4 hours.
Many people think Bitcoin is digital gold and should rise sharply as a safe haven when geopolitical crises hit. That is a complete misreading of the current market liquidity structure.
Geopolitical conflicts directly drive oil prices sharply higher. As the mother of industry, when crude prices rise, the impact quickly passes through transportation, manufacturing, and end consumption, causing recently cooled inflation data to face renewed upward pressure. Market expectations for a Federal Reserve rate hike in September immediately jumped to 56.9%.
As soon as expectations for a Fed rate hike rise, dollar liquidity across the entire macro market tightens immediately.
For traders who go long with leverage on-chain and in the secondary market, once macro liquidity expectations deteriorate, borrowing costs and hedge costs rise instantly. At this point, the first reaction from institutions and high-frequency quant funds is definitely not to buy Bitcoin as a safe haven, but to immediately liquidate the most liquid risk assets with the largest profit potential, in order to replenish margin or convert into U.S. dollar cash.
Bitcoin's current role on institutional balance sheets is still, at its core, a high-beta global risk asset sensitive to liquidity.
Only when war evolves into a long-term fiat credit crisis, or when the traditional banking system faces systemic liquidation, will its decentralized safe-haven properties take effect. Under the first wave of macro inflation and rate-hike expectations, it must first bear the consequences of liquidity being drained.
Before inflation expectations fall again and before the rate hike actually materializes, blindly treating Bitcoin as a hedging tool and going long with leverage is essentially trying to smash head-on into the iron wall of a liquidity tightening cycle.
#布伦特原油涨破90美元 #霍尔木兹海峡战事再起 #美国空袭伊朗火箭发射器
Last night, the U.S. military bombed Iran's Larak Island, and Iran immediately fired missiles back at U.S. bases.
Brent crude broke through $90, and WTI crude rose more than 2%. Traditional safe-haven assets gold and silver saw an early spike and then pulled back, U.S. stock futures fell across the board, and $BTC Bitcoin, after surging past $78,000, retraced nearly 0.7% within 4 hours.
Many people think Bitcoin is digital gold and should rise sharply as a safe haven when geopolitical crises hit. That is a complete misreading of the current market liquidity structure.
Geopolitical conflicts directly drive oil prices sharply higher. As the mother of industry, when crude prices rise, the impact quickly passes through transportation, manufacturing, and end consumption, causing recently cooled inflation data to face renewed upward pressure. Market expectations for a Federal Reserve rate hike in September immediately jumped to 56.9%.
As soon as expectations for a Fed rate hike rise, dollar liquidity across the entire macro market tightens immediately.
For traders who go long with leverage on-chain and in the secondary market, once macro liquidity expectations deteriorate, borrowing costs and hedge costs rise instantly. At this point, the first reaction from institutions and high-frequency quant funds is definitely not to buy Bitcoin as a safe haven, but to immediately liquidate the most liquid risk assets with the largest profit potential, in order to replenish margin or convert into U.S. dollar cash.
Bitcoin's current role on institutional balance sheets is still, at its core, a high-beta global risk asset sensitive to liquidity.
Only when war evolves into a long-term fiat credit crisis, or when the traditional banking system faces systemic liquidation, will its decentralized safe-haven properties take effect. Under the first wave of macro inflation and rate-hike expectations, it must first bear the consequences of liquidity being drained.
Before inflation expectations fall again and before the rate hike actually materializes, blindly treating Bitcoin as a hedging tool and going long with leverage is essentially trying to smash head-on into the iron wall of a liquidity tightening cycle.
#布伦特原油涨破90美元 #霍尔木兹海峡战事再起 #美国空袭伊朗火箭发射器

From the spotlight valuation of $100 billion down to just over 20% when exiting, Xu Yangtian’s personal fortune evaporated by $15 billion. On the surface, it looks like they missed the best window to cash out in the capital markets. In reality, it’s the fast-fashion playbook—built on information asymmetry and supply-chain arbitrage—that was brutally squeezed dry once the macro narrative shifted.
In the past, Shein could expand without restraint, driven by two core logics: an extremely tight, terminal small-parcel duty-free policy; and a real-time supply chain response built on China’s absolute labor-cost advantage. But after the U.S. directly cut off the duty-free channel for small parcels, this mechanism immediately exposed its extreme fragility. In a single quarter, it plunged from profitability of nearly $400 million into losses approaching $100 million, and revenue also declined. This shows that its model essentially has no hedging capability against policy changes—its past high profits were entirely riding the windfall of policy arbitrage.
An even more lethal threat comes from the equalization of technical supply. The “measure-the-item, make-it-a-hit, follow up on reorders” data-algorithm system Shein once prided itself on has had its barrier completely erased in today’s era where generative AI tools are booming. Competitors no longer need to build massive technical teams; they can simply leverage AI to perform trend forecasting and design iteration. Once its core technical moat is attacked on a lower plane and everyone is back racing on the same starting line to compete based on fulfillment and supply-chain hard power, the valuation premium it enjoyed no longer exists.
Secondary-market capital flows are always the most honest. When funds start rushing wildly into deterministic targets with infrastructure-like attributes—like AI—whether it’s traditional consumption or cross-border e-commerce, they get pushed out of the high-growth narrative framework and repriced as mature, red-ocean businesses. Look at the recent Hong Kong-listed consumer giants: from Dongpeng to Mixue Bingcheng, the valuation logic the capital market is using has become extremely harsh, centered on discounted cash flows. At this point, listing could hardly be described as “seizing the moment of glory.” More accurately, it’s a forced liquidation under pressure to retreat. Xu Yangtian’s fortune shrinkage is not an isolated case; it marks the end of the cross-border e-commerce era that surged by exploiting macro policy loopholes and traditional data information gaps.
#SheinCEO许仰天财富缩水150亿美元
In the past, Shein could expand without restraint, driven by two core logics: an extremely tight, terminal small-parcel duty-free policy; and a real-time supply chain response built on China’s absolute labor-cost advantage. But after the U.S. directly cut off the duty-free channel for small parcels, this mechanism immediately exposed its extreme fragility. In a single quarter, it plunged from profitability of nearly $400 million into losses approaching $100 million, and revenue also declined. This shows that its model essentially has no hedging capability against policy changes—its past high profits were entirely riding the windfall of policy arbitrage.
An even more lethal threat comes from the equalization of technical supply. The “measure-the-item, make-it-a-hit, follow up on reorders” data-algorithm system Shein once prided itself on has had its barrier completely erased in today’s era where generative AI tools are booming. Competitors no longer need to build massive technical teams; they can simply leverage AI to perform trend forecasting and design iteration. Once its core technical moat is attacked on a lower plane and everyone is back racing on the same starting line to compete based on fulfillment and supply-chain hard power, the valuation premium it enjoyed no longer exists.
Secondary-market capital flows are always the most honest. When funds start rushing wildly into deterministic targets with infrastructure-like attributes—like AI—whether it’s traditional consumption or cross-border e-commerce, they get pushed out of the high-growth narrative framework and repriced as mature, red-ocean businesses. Look at the recent Hong Kong-listed consumer giants: from Dongpeng to Mixue Bingcheng, the valuation logic the capital market is using has become extremely harsh, centered on discounted cash flows. At this point, listing could hardly be described as “seizing the moment of glory.” More accurately, it’s a forced liquidation under pressure to retreat. Xu Yangtian’s fortune shrinkage is not an isolated case; it marks the end of the cross-border e-commerce era that surged by exploiting macro policy loopholes and traditional data information gaps.
#SheinCEO许仰天财富缩水150亿美元

Verified
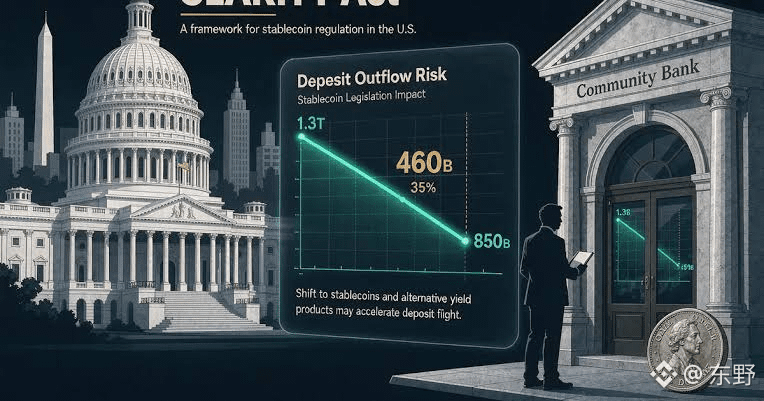
On the eve of the Senate vote on September 15 over the CLARITY Act, the Independent Community Bankers of America (ICBA) directly and decisively called for the complete shutdown of any stablecoin yield mechanism. The association’s CEO was extremely firm, saying there is no middle ground—either it is completely banned, or they will fight it to the bitter end.
On the surface, this tug-of-war is about disputes over legal provisions. At its core, it is a direct showdown between traditional finance and on-chain capital over pricing power for the underlying “digital dollar” deposits.
When users keep their dollars in a traditional bank, they receive pitifully low checking-account interest, while the bank turns around and lends out the funds to profit from the spread. Now, when users swap dollars into stablecoins, crypto platforms return the yield to users through mechanisms such as trading kickbacks, staking rewards, or holding subsidies. To the banks, this is essentially interest-bearing deposits dressed up in another form.
ICBA’s 5,000 community banks ran the numbers on the brutal impact: once the yield loophole is recognized by law, $1.3 trillion in deposits would evaporate from the traditional banking system, and local lending would shrink by $850 billion. For community banks that rely on lending spreads to survive, this is tantamount to draining the capital pool.
In a report, the White House Council of Economic Advisers tried to downplay the risk of deposit outflows, but community banks are not buying it. On-chain capital is extremely efficient at pursuing profit, and the money it takes will never realistically flow back into traditional community lending.
The sticking point in the Senate debate is particularly delicate. The regulatory framework would distinguish between pure holding-for-yield and yield generated by transactions. As long as the latter leaves a loophole, crypto platforms can keep sending the yield to users through product design.
If the vote on September 15 fails to reach 60 votes and the bill stalls, crypto platforms can continue to siphon off deposits through the gray areas. But if regulators force a one-size-fits-all crackdown that shuts down the yield channel, the entire stablecoin yield model will undergo severe pain.
Everyone talks about financial compliance, but at the root it is a battle over balance sheets worth trillions of dollars. Stablecoins are no longer just liquidity toys for insiders—they have very concretely hit the most central “core business” of traditional finance. As long as the yield-rate spread remains, this war over control of deposits cannot end in a calm, gentle way.
$BTC $BNB #icba反对clarity法案稳定币奖励漏洞
On the surface, this tug-of-war is about disputes over legal provisions. At its core, it is a direct showdown between traditional finance and on-chain capital over pricing power for the underlying “digital dollar” deposits.
When users keep their dollars in a traditional bank, they receive pitifully low checking-account interest, while the bank turns around and lends out the funds to profit from the spread. Now, when users swap dollars into stablecoins, crypto platforms return the yield to users through mechanisms such as trading kickbacks, staking rewards, or holding subsidies. To the banks, this is essentially interest-bearing deposits dressed up in another form.
ICBA’s 5,000 community banks ran the numbers on the brutal impact: once the yield loophole is recognized by law, $1.3 trillion in deposits would evaporate from the traditional banking system, and local lending would shrink by $850 billion. For community banks that rely on lending spreads to survive, this is tantamount to draining the capital pool.
In a report, the White House Council of Economic Advisers tried to downplay the risk of deposit outflows, but community banks are not buying it. On-chain capital is extremely efficient at pursuing profit, and the money it takes will never realistically flow back into traditional community lending.
The sticking point in the Senate debate is particularly delicate. The regulatory framework would distinguish between pure holding-for-yield and yield generated by transactions. As long as the latter leaves a loophole, crypto platforms can keep sending the yield to users through product design.
If the vote on September 15 fails to reach 60 votes and the bill stalls, crypto platforms can continue to siphon off deposits through the gray areas. But if regulators force a one-size-fits-all crackdown that shuts down the yield channel, the entire stablecoin yield model will undergo severe pain.
Everyone talks about financial compliance, but at the root it is a battle over balance sheets worth trillions of dollars. Stablecoins are no longer just liquidity toys for insiders—they have very concretely hit the most central “core business” of traditional finance. As long as the yield-rate spread remains, this war over control of deposits cannot end in a calm, gentle way.
$BTC $BNB #icba反对clarity法案稳定币奖励漏洞
Verified
As geopolitics evolves to today, the fighting has long since spread from physical missile battlefields to real-time showdowns over on-chain addresses and the global capital ledger.
U.S.-Iran relations have deteriorated again. The U.S. Treasury has added nearly 60 entities, individuals, and digital-asset targets to the sanctions list, while Iran vows retaliation. Meanwhile, Trump has finalized a 25-year development agreement with Venezuela covering 17 strategic oil fields. Put these two sides into the same ledger and the underlying logic is clear enough to send chills down one’s spine.
The most direct side effect of the U.S.’s maximum pressure on Iran is that Middle Eastern crude oil supply is disrupted; a sudden surge in crude oil premiums will quickly backfire on U.S. inflation. Pushing the Venezuela development agreement is, in essence, using South America’s long-term production capacity to hedge geopolitical risks in the Middle East—seizing leverage for later.
But the most realistic part of this is what financial markets do: they can’t be held in check by long-dated macro narratives when immediate imbalances are unfolding right now.
Venezuela’s aging infrastructure and pipelines require years and trillions in capital to reach full production. This time gap—“a Middle East supply cutoff that takes effect by the second” versus “South American capacity that can only be realized years from now”—can’t possibly block the current risk premium surge in crude oil.
For crypto assets such as $BTC $BNB , the impact in this scenario is twofold: the fighting in the Middle East raises inflation expectations and U.S. Treasury yields, directly choking off liquidity that would have been supported by rate cuts; meanwhile, the Venezuela agreement will lock up a large amount of institutional existing capital in physical oil-field infrastructure.
With macro liquidity suppressed and existing capital siphoned toward heavy assets, on-chain liquidity supply can only be drained further. Rather than trying to bet on long-dated production capacity, it’s better to watch U.S. Treasury yields and the crude oil forward spread—that’s the real ledger that decides whether liquidity lives or dies.#委内瑞拉美国签25年石油合作协议 #特朗普达成委内瑞拉17油田开发协议
U.S.-Iran relations have deteriorated again. The U.S. Treasury has added nearly 60 entities, individuals, and digital-asset targets to the sanctions list, while Iran vows retaliation. Meanwhile, Trump has finalized a 25-year development agreement with Venezuela covering 17 strategic oil fields. Put these two sides into the same ledger and the underlying logic is clear enough to send chills down one’s spine.
The most direct side effect of the U.S.’s maximum pressure on Iran is that Middle Eastern crude oil supply is disrupted; a sudden surge in crude oil premiums will quickly backfire on U.S. inflation. Pushing the Venezuela development agreement is, in essence, using South America’s long-term production capacity to hedge geopolitical risks in the Middle East—seizing leverage for later.
But the most realistic part of this is what financial markets do: they can’t be held in check by long-dated macro narratives when immediate imbalances are unfolding right now.
Venezuela’s aging infrastructure and pipelines require years and trillions in capital to reach full production. This time gap—“a Middle East supply cutoff that takes effect by the second” versus “South American capacity that can only be realized years from now”—can’t possibly block the current risk premium surge in crude oil.
For crypto assets such as $BTC $BNB , the impact in this scenario is twofold: the fighting in the Middle East raises inflation expectations and U.S. Treasury yields, directly choking off liquidity that would have been supported by rate cuts; meanwhile, the Venezuela agreement will lock up a large amount of institutional existing capital in physical oil-field infrastructure.
With macro liquidity suppressed and existing capital siphoned toward heavy assets, on-chain liquidity supply can only be drained further. Rather than trying to bet on long-dated production capacity, it’s better to watch U.S. Treasury yields and the crude oil forward spread—that’s the real ledger that decides whether liquidity lives or dies.#委内瑞拉美国签25年石油合作协议 #特朗普达成委内瑞拉17油田开发协议

Today’s hot topic #韩国单股杠杆ETF交易下降 : everyone is watching South Korea’s regulators squeeze the leverage out of the market!! On the surface, it looks like retail investors have been completely subdued. Financial regulators have directly raised the baseline margin requirement for single-stock leveraged ETFs from 10 million won to 30 million won, and added thresholds for simulated trading. In August, the average daily trading value of the related products collapsed from 116.8 trillion won to 10.1 trillion won.
Samsung Electronics $SAMSUNG and SK Hynix’s leveraged ETFs were net-sold by retail investors to the tune of 1.773 trillion won within a month.
Many people think this is just a traditional stock-market deleveraging. Even some believe that once this high-leverage “chip” is fully wiped out, the stock market can once again move forward based on spot capital.
But you might have missed another data point: after South Korean regulators clamped down on single-stock leverage for domestic brokers, this pool of retail money that had grown used to high volatility and was extremely hungry for high leverage didn’t disappear out of thin air—it simply shifted directly into the on-chain perpetual futures market. Throughout August, the perpetual futures trading volume tracking $KORU (3x long on South Korea ETFs) on offshore exchanges has already reached 2.69 times the trading volume of the original U.S.-listed ETFs, with monthly trading value breaking $24 billion.
Those on-chain perpetual contracts that can be opened with just “5U” and come with high leverage have become the fallbacks after South Korean equities were deleveraged.
That’s why today’s crypto market is increasingly resembling a shadowy casino that absorbs the overflow risk from global regulation. The tighter traditional finance squeezes leverage, the more those die-hard leverage players will flow to the chain. The result is that on-chain there’s a lack of real industry application—everything is just betting on all kinds of volatility, derivatives, and “shitcoin” meme culture.
For large-cap spot markets, forcibly cleaning out high-leverage chips is indeed part of removing the poison, but as long as the chain keeps creating game tools with lower entry barriers and higher multipliers, the “slow bull run driven by spot” from a traditional perspective is hard to come by. Before spot capital truly reprices, the market will likely grind through quite a long period in the morass of liquidity discounts and image breakdown.
Samsung Electronics $SAMSUNG and SK Hynix’s leveraged ETFs were net-sold by retail investors to the tune of 1.773 trillion won within a month.
Many people think this is just a traditional stock-market deleveraging. Even some believe that once this high-leverage “chip” is fully wiped out, the stock market can once again move forward based on spot capital.
But you might have missed another data point: after South Korean regulators clamped down on single-stock leverage for domestic brokers, this pool of retail money that had grown used to high volatility and was extremely hungry for high leverage didn’t disappear out of thin air—it simply shifted directly into the on-chain perpetual futures market. Throughout August, the perpetual futures trading volume tracking $KORU (3x long on South Korea ETFs) on offshore exchanges has already reached 2.69 times the trading volume of the original U.S.-listed ETFs, with monthly trading value breaking $24 billion.
Those on-chain perpetual contracts that can be opened with just “5U” and come with high leverage have become the fallbacks after South Korean equities were deleveraged.
That’s why today’s crypto market is increasingly resembling a shadowy casino that absorbs the overflow risk from global regulation. The tighter traditional finance squeezes leverage, the more those die-hard leverage players will flow to the chain. The result is that on-chain there’s a lack of real industry application—everything is just betting on all kinds of volatility, derivatives, and “shitcoin” meme culture.
For large-cap spot markets, forcibly cleaning out high-leverage chips is indeed part of removing the poison, but as long as the chain keeps creating game tools with lower entry barriers and higher multipliers, the “slow bull run driven by spot” from a traditional perspective is hard to come by. Before spot capital truly reprices, the market will likely grind through quite a long period in the morass of liquidity discounts and image breakdown.

Bitcoin $BTC spot ETF saw a net outflow of $202 million yesterday, ending a 9-day streak of net inflows
Many people’s first reaction is that institutions are trying to run. But there’s really no need to scare yourself. This 9-day steady accumulation has pushed Bitcoin up from a low level. The spot holdings have laid a very solid “floor,” with the lower tranche of chips well supported. At the current level, some short-term profit-taking funds choose to lock in gains—this is a typical rotation of capital and holdings.
The data details are even more interesting: even during the overall net outflow phase of more than $200 million, Morgan Stanley’s MSBT still posted a contrarian net inflow of $9.33 million, with historical cumulative accumulation nearing $500 million. The main force behind the sell-off is Ark’s ARKB, which dumped $115 million in a single day. This suggests that institutions are also internally split—some are closing positions to realize profits, while others take advantage of the adjustment to keep building.
The key point is not about this single day’s outflow, but the quality of follow-through next. Currently, the total net asset value of the spot ETFs remains as high as $97.593 billion, accounting for 6.28% of Bitcoin’s total market value. Historical cumulative net inflows have reached $54.631 billion. With a base of this size, it’s impossible for a single-day $200 million sell pressure to simply wipe it out.
Next week is the real stress test.
If, going forward, funds quickly turn back to net inflows (turn green again), and BTC can trade sideways around key support levels and hold steady, it would indicate that the overall institutional accumulation logic has not changed at all—this is only a shakeout during the upswing. Conversely, if it evolves into a sustained, multi-day wave of redemptions, then short-term chips will need more time to digest, absorb, and settle.
Spot ETF data is clearly visible and is currently the most direct barometer of market capital. If the institutions’ rhythm changes, it does not mean the logic of a bull market is broken— it’s simply a reminder not to use too much leverage in short-term trading. The “spot catalyst” is still here. Once this pullback squeezes out the floating gains, the market will naturally show the clearest direction.
#比特币现货etf结束9日净流入
Many people’s first reaction is that institutions are trying to run. But there’s really no need to scare yourself. This 9-day steady accumulation has pushed Bitcoin up from a low level. The spot holdings have laid a very solid “floor,” with the lower tranche of chips well supported. At the current level, some short-term profit-taking funds choose to lock in gains—this is a typical rotation of capital and holdings.
The data details are even more interesting: even during the overall net outflow phase of more than $200 million, Morgan Stanley’s MSBT still posted a contrarian net inflow of $9.33 million, with historical cumulative accumulation nearing $500 million. The main force behind the sell-off is Ark’s ARKB, which dumped $115 million in a single day. This suggests that institutions are also internally split—some are closing positions to realize profits, while others take advantage of the adjustment to keep building.
The key point is not about this single day’s outflow, but the quality of follow-through next. Currently, the total net asset value of the spot ETFs remains as high as $97.593 billion, accounting for 6.28% of Bitcoin’s total market value. Historical cumulative net inflows have reached $54.631 billion. With a base of this size, it’s impossible for a single-day $200 million sell pressure to simply wipe it out.
Next week is the real stress test.
If, going forward, funds quickly turn back to net inflows (turn green again), and BTC can trade sideways around key support levels and hold steady, it would indicate that the overall institutional accumulation logic has not changed at all—this is only a shakeout during the upswing. Conversely, if it evolves into a sustained, multi-day wave of redemptions, then short-term chips will need more time to digest, absorb, and settle.
Spot ETF data is clearly visible and is currently the most direct barometer of market capital. If the institutions’ rhythm changes, it does not mean the logic of a bull market is broken— it’s simply a reminder not to use too much leverage in short-term trading. The “spot catalyst” is still here. Once this pullback squeezes out the floating gains, the market will naturally show the clearest direction.
#比特币现货etf结束9日净流入
Verified
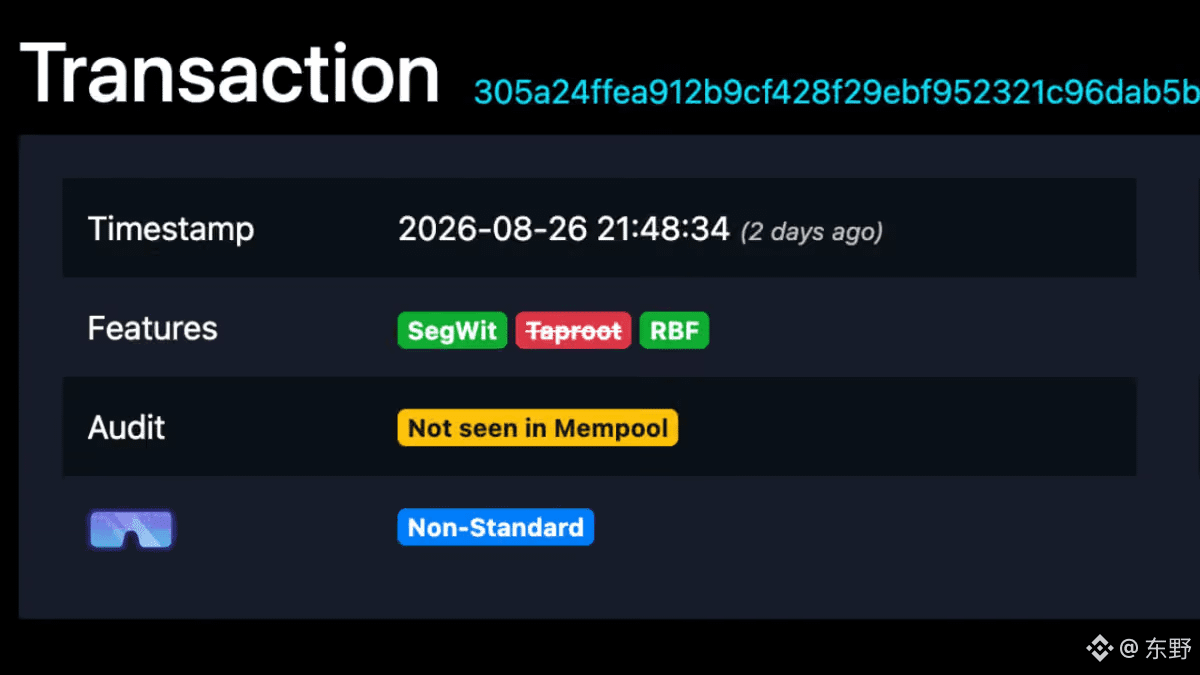
StarkWare has carried out its first “quantum-secure transactions” (QSB) on the Bitcoin mainnet at $BTC , and on the surface it appears to use hash-based algorithms to achieve post-quantum verification without changing consensus. But the real agenda behind it is StarkWare’s move to seize the highest-spec “technical orthodoxy” in Bitcoin’s ecosystem.
Zooming back to the actual on-chain actors and how incentives are distributed, the real impact here is very specific.
For StarkWare itself, the Ethereum Layer 2 space is already a deadlocked, all-or-nothing battlefield. In that context, putting its most core cryptographic asset into the Bitcoin mainnet is effectively opening a second front by force. This isn’t charity—it’s laying groundwork for Starknet’s Bitcoin Layer 2 plans. The later story of onboarding BTC staking and building a native ZK expansion layer can then make logical sense.
For large Bitcoin holders, this provides an emergency defense route. QSB uses off-chain GPUs to “grind” signatures, forcibly embedding post-quantum logic into Bitcoin’s script limitations. That means that before the network-wide soft-fork upgrade is rolled out, institutions get another on-chain fallback channel they can choose independently—without needing to change the mainnet consensus.
However, the pain points exposed by this test are even more apparent than the breakthrough.
To bypass mempool constraints, this transaction uses a miner-direct custom mining channel. The off-chain GPU computation burned nearly $200. In Bitcoin’s expensive block space, such a high-cost, non-standard transaction format is simply not feasible for everyday use—it’s more of a technical showpiece. Unless the Bitcoin mainnet later performs dedicated soft-fork upgrades targeting advanced opcodes (such as OP_CAT), this approach can only remain on the fringes of edge-case scenarios involving emergency transfers of extremely high-value assets.
Don’t let this story stay at the level of grand narratives like “quantum resistance.” The quantum crisis is a perfect shell—inside it is StarkWare’s strategic shift to escape the Ethereum red ocean. The technology can run through thanks to brute computational power, but whether it can evolve into real, revenue-backed scenarios ultimately depends on whether Bitcoin scripts can later provide sufficiently cheap space for advanced cryptography.
#首笔抗量子比特币交易主网完成
Zooming back to the actual on-chain actors and how incentives are distributed, the real impact here is very specific.
For StarkWare itself, the Ethereum Layer 2 space is already a deadlocked, all-or-nothing battlefield. In that context, putting its most core cryptographic asset into the Bitcoin mainnet is effectively opening a second front by force. This isn’t charity—it’s laying groundwork for Starknet’s Bitcoin Layer 2 plans. The later story of onboarding BTC staking and building a native ZK expansion layer can then make logical sense.
For large Bitcoin holders, this provides an emergency defense route. QSB uses off-chain GPUs to “grind” signatures, forcibly embedding post-quantum logic into Bitcoin’s script limitations. That means that before the network-wide soft-fork upgrade is rolled out, institutions get another on-chain fallback channel they can choose independently—without needing to change the mainnet consensus.
However, the pain points exposed by this test are even more apparent than the breakthrough.
To bypass mempool constraints, this transaction uses a miner-direct custom mining channel. The off-chain GPU computation burned nearly $200. In Bitcoin’s expensive block space, such a high-cost, non-standard transaction format is simply not feasible for everyday use—it’s more of a technical showpiece. Unless the Bitcoin mainnet later performs dedicated soft-fork upgrades targeting advanced opcodes (such as OP_CAT), this approach can only remain on the fringes of edge-case scenarios involving emergency transfers of extremely high-value assets.
Don’t let this story stay at the level of grand narratives like “quantum resistance.” The quantum crisis is a perfect shell—inside it is StarkWare’s strategic shift to escape the Ethereum red ocean. The technology can run through thanks to brute computational power, but whether it can evolve into real, revenue-backed scenarios ultimately depends on whether Bitcoin scripts can later provide sufficiently cheap space for advanced cryptography.
#首笔抗量子比特币交易主网完成
Recently, $BTC has produced an indicator shift that leaves anyone who uses old models to read the market feeling extremely uncomfortable.
Grayscale data shows that the 90-day correlation between BTC and gold has risen from near 0 at the start of the year to above 50%+. At the same time, the correlation with the Nasdaq 100 has been slashed from over 60% to around 33%. This means that over the past two years, macro Quant funds that have treated Bitcoin as a “leveraged Nasdaq” are forcibly removing its risk label and stuffing it into an asset pool for “currency debasement hedges.”
The driver behind this is not crypto-market narrative, but the fact that after U.S. Treasury issuance ballooned past $40 trillion, the long-end Treasury yields and fiscal deficits have pushed the Debasement Trade into a market consensus. When expectations of fiat liquidity dilution overwhelm the short-term rate-trading tug-of-war, gold and Bitcoin are inevitably pushed onto the same value-anchored trajectory.
But don’t get excited just because correlation is rising and rush to proclaim that “digital gold” is taking shape.
Last week, BTC spot ETFs cut off net inflows that had run for 9 consecutive days, with daily outflows bleeding more than $200 million. This reveals a very real fact: the main force that controls Bitcoin’s marginal pricing power is still a class of institutional capital that is extremely sensitive to macro interest rates. They can chase bids today on the logic of Treasury debasement, and tomorrow they can tweak macro expectations and discount BTC as a high-liquidity beta asset, then smash the price.
Trying to wrap Bitcoin’s internal “halving cycle” logic around the macro market basically amounts to handing the counterparty money.
For future BTC pricing, at its core it’s about eating from three macro balance sheets: when you look at gold, you’re measuring the collapse of fiat credit and the risk-off premium; when you look at Treasuries, you’re gauging institutional borrowing costs and liquidation lines; when you look at the U.S. dollar index, you’re turning the valve of global base liquidity.
If over the next two quarters BTC can stably maintain a high correlation with gold and a low correlation with the Nasdaq 100, the valuation anchor of the entire crypto market will be rewritten completely—no longer a derivative beta of tech stocks, but the only ultra-high-liquidity risk-off asset with second-level settlement capability and an absolute ceiling amid the global debt crisis.#比特币24小时跌3.4%至7.74万美元 #黄金代币化
Grayscale data shows that the 90-day correlation between BTC and gold has risen from near 0 at the start of the year to above 50%+. At the same time, the correlation with the Nasdaq 100 has been slashed from over 60% to around 33%. This means that over the past two years, macro Quant funds that have treated Bitcoin as a “leveraged Nasdaq” are forcibly removing its risk label and stuffing it into an asset pool for “currency debasement hedges.”
The driver behind this is not crypto-market narrative, but the fact that after U.S. Treasury issuance ballooned past $40 trillion, the long-end Treasury yields and fiscal deficits have pushed the Debasement Trade into a market consensus. When expectations of fiat liquidity dilution overwhelm the short-term rate-trading tug-of-war, gold and Bitcoin are inevitably pushed onto the same value-anchored trajectory.
But don’t get excited just because correlation is rising and rush to proclaim that “digital gold” is taking shape.
Last week, BTC spot ETFs cut off net inflows that had run for 9 consecutive days, with daily outflows bleeding more than $200 million. This reveals a very real fact: the main force that controls Bitcoin’s marginal pricing power is still a class of institutional capital that is extremely sensitive to macro interest rates. They can chase bids today on the logic of Treasury debasement, and tomorrow they can tweak macro expectations and discount BTC as a high-liquidity beta asset, then smash the price.
Trying to wrap Bitcoin’s internal “halving cycle” logic around the macro market basically amounts to handing the counterparty money.
For future BTC pricing, at its core it’s about eating from three macro balance sheets: when you look at gold, you’re measuring the collapse of fiat credit and the risk-off premium; when you look at Treasuries, you’re gauging institutional borrowing costs and liquidation lines; when you look at the U.S. dollar index, you’re turning the valve of global base liquidity.
If over the next two quarters BTC can stably maintain a high correlation with gold and a low correlation with the Nasdaq 100, the valuation anchor of the entire crypto market will be rewritten completely—no longer a derivative beta of tech stocks, but the only ultra-high-liquidity risk-off asset with second-level settlement capability and an absolute ceiling amid the global debt crisis.#比特币24小时跌3.4%至7.74万美元 #黄金代币化
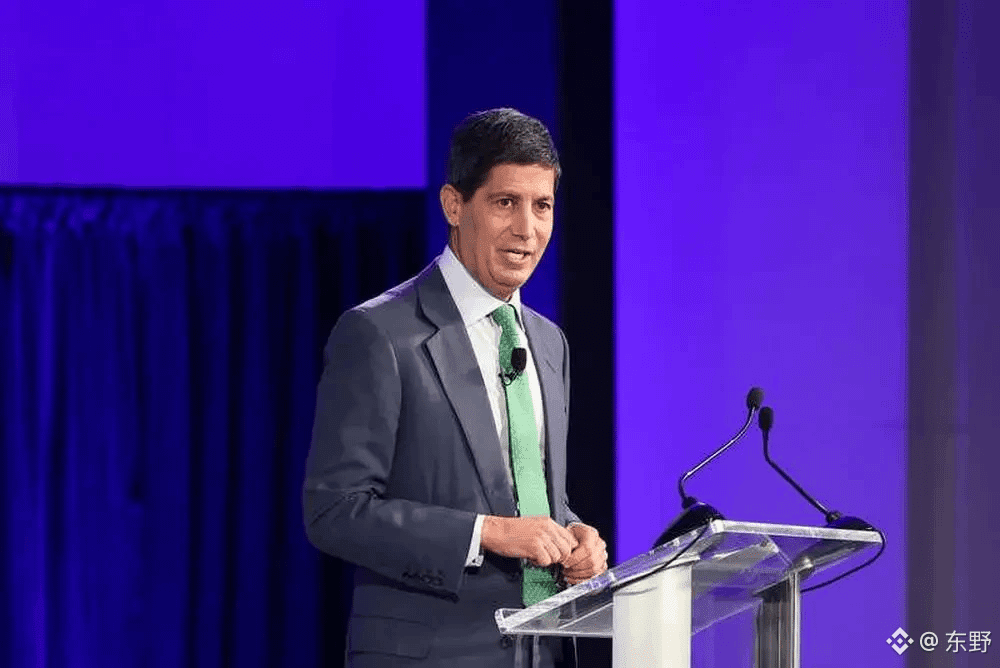
The Fed’s whole routine for managing expectations—after playing this game for so many years, the market still always cooperates and hands over its chips.
Last night’s hawkish remarks from Wosch, in essence, was forcing the “possibility of a rate hike in September” expectation onto the market. The precious metals market reacted most directly: gold and silver dropped sharply, and $BTC also pulled back in step, dipping to around 77,000. Many people are starting to panic, thinking that the big plunge is coming.
But if you watch on-chain data and institutional chip distribution every day, you’ll see that this kind of selloff triggered by macro rhetoric is, for the most part, just a shakeout—not a structural turn to outright short.
The Fed’s strategy is very clear right now: as long as inflation data is still hovering at high levels, even just verbally calling for a rate hike can achieve the goal of tightening financial conditions. That doesn’t mean September is definitely going to see the rate-hike “shoe drop.” Put another way, even if the market pushes up the probability of a hike, the capital structure within the crypto market itself has not shown a break-like deterioration.
To read the current market properly, you need two hard indicators. First is the 200-day moving average around 75,000, where a large amount of turnover has accumulated; the technical support there is extremely solid.
Second is the institutions’ real actions: with how aggressively the market was smashed last night, there was no catastrophic net outflow from spot ETFs. The chips held by institutions haven’t loosened; if retail investors follow panic and cut losses, the only thing that happens is they end up handing over cheap chips with open hands.
To judge a trend reversal, you can’t rely on one or two speeches from Fed officials, and you definitely can’t rely on hunches. If it truly is the start of a major drop, then on-chain you should see at least three “escape” signals at the same time: spot ETFs continue and experience large-scale net outflows, Coinbase shows a deep negative premium, and the 7-day moving average of net realized profit/loss on-chain flips completely from profit to loss.
Until none of these three signals are met, blindly going short is as dangerous as blindly chasing higher prices. A few days ago, I already started taking partial profits and locking in some gains, but that doesn’t mean I’ll impulsively reverse and go short.
Market clearing takes time. The current turbulence looks more like the pain of liquidity being repriced than the beginning of a structural breakdown.
Don’t let market sentiment lead you by the nose. At this stage, keeping cash flow, holding your chips, and quietly waiting for on-chain signals to provide the true direction is the safest choice.
#沃什称通胀是美联储首要关注
#纽约白银期货跌3%
Last night’s hawkish remarks from Wosch, in essence, was forcing the “possibility of a rate hike in September” expectation onto the market. The precious metals market reacted most directly: gold and silver dropped sharply, and $BTC also pulled back in step, dipping to around 77,000. Many people are starting to panic, thinking that the big plunge is coming.
But if you watch on-chain data and institutional chip distribution every day, you’ll see that this kind of selloff triggered by macro rhetoric is, for the most part, just a shakeout—not a structural turn to outright short.
The Fed’s strategy is very clear right now: as long as inflation data is still hovering at high levels, even just verbally calling for a rate hike can achieve the goal of tightening financial conditions. That doesn’t mean September is definitely going to see the rate-hike “shoe drop.” Put another way, even if the market pushes up the probability of a hike, the capital structure within the crypto market itself has not shown a break-like deterioration.
To read the current market properly, you need two hard indicators. First is the 200-day moving average around 75,000, where a large amount of turnover has accumulated; the technical support there is extremely solid.
Second is the institutions’ real actions: with how aggressively the market was smashed last night, there was no catastrophic net outflow from spot ETFs. The chips held by institutions haven’t loosened; if retail investors follow panic and cut losses, the only thing that happens is they end up handing over cheap chips with open hands.
To judge a trend reversal, you can’t rely on one or two speeches from Fed officials, and you definitely can’t rely on hunches. If it truly is the start of a major drop, then on-chain you should see at least three “escape” signals at the same time: spot ETFs continue and experience large-scale net outflows, Coinbase shows a deep negative premium, and the 7-day moving average of net realized profit/loss on-chain flips completely from profit to loss.
Until none of these three signals are met, blindly going short is as dangerous as blindly chasing higher prices. A few days ago, I already started taking partial profits and locking in some gains, but that doesn’t mean I’ll impulsively reverse and go short.
Market clearing takes time. The current turbulence looks more like the pain of liquidity being repriced than the beginning of a structural breakdown.
Don’t let market sentiment lead you by the nose. At this stage, keeping cash flow, holding your chips, and quietly waiting for on-chain signals to provide the true direction is the safest choice.
#沃什称通胀是美联储首要关注
#纽约白银期货跌3%

Verified
What traditional institutions fear most when entering the market isn’t volatility itself, but not being able to find a reasonable and compliant pretext for their allocation.
Back in May, when Charles Schwab Personal Trust launched $BTC and spot ETH trading, large institutions were still watching from the sidelines with a cold stare. But just three months later, they directly put $SOL , AVAX, and LINK onto their trading panels.
When rolling out BTC and ETH in May, the official messaging was very cautious, saying they were providing customers with access channels. By August, when they announced the addition of new tradable assets, the playbook had completely changed. SOL and AVAX are core public-chain infrastructure, while LINK is an oracle. They went from treating “buy-point digital gold blocks” as a hobby, straight into adopting tools that enable configuring the entire crypto ecosystem’s productive capacity.
After the news broke, SOL surged by nearly 13% on the day, and ETF fund flows ramped up right along with it. When a giant managing $13 trillion in assets extends its holdings from store-of-value products into public chains and infrastructure within just three months, it’s not “testing the waters by the river”—it’s outright starting to claim territory and build an investment portfolio.
Even more critical is the execution logic. Schwab embeds crypto trading directly into traditional platforms like thinkorswim, so customers can view tokens and stocks/bonds side by side. Each trade charges 75 basis points, handled by Schwab’s affiliated banks, and rolled out across most states in the U.S. In essence, it uses an extremely smooth user experience to route money from traditional brokerage accounts directly into the crypto world.
By contrast, competitors like Vanguard and Fidelity’s moves have seemed extremely sluggish. Schwab’s quick start has shifted the battle from “whether to allocate to crypto assets” to “how to help customers deeply allocate across the ecosystem.”
As of today, the proportion of traditional financial capital allocated to the crypto market is still under 1%. After Schwab’s official statement that it will add more tradable assets going forward, that means how the remaining 99% of the water gets in—Schwab has already carved open a big outlet. If other traditional institutions don’t follow suit, it means handing over the asset-scale competition to others.
Over the past couple of days, the hawkish Fed has caused a pullback in the broader market—Bitcoin even broke below the $80,000 threshold—but that fundamentally doesn’t change the long-term logic of capital migration.
The $13 trillion channel is fully opened and rapidly expanding. This is not to help coordinate short-term trading swings in response to market moves; it’s the traditional financial system setting the stage for a massive relocation of capital. The starter pistol has already gone off—most people just still have their eyes glued to short-term price charts.
#嘉信理财拟新增solavaxlink交易
Back in May, when Charles Schwab Personal Trust launched $BTC and spot ETH trading, large institutions were still watching from the sidelines with a cold stare. But just three months later, they directly put $SOL , AVAX, and LINK onto their trading panels.
When rolling out BTC and ETH in May, the official messaging was very cautious, saying they were providing customers with access channels. By August, when they announced the addition of new tradable assets, the playbook had completely changed. SOL and AVAX are core public-chain infrastructure, while LINK is an oracle. They went from treating “buy-point digital gold blocks” as a hobby, straight into adopting tools that enable configuring the entire crypto ecosystem’s productive capacity.
After the news broke, SOL surged by nearly 13% on the day, and ETF fund flows ramped up right along with it. When a giant managing $13 trillion in assets extends its holdings from store-of-value products into public chains and infrastructure within just three months, it’s not “testing the waters by the river”—it’s outright starting to claim territory and build an investment portfolio.
Even more critical is the execution logic. Schwab embeds crypto trading directly into traditional platforms like thinkorswim, so customers can view tokens and stocks/bonds side by side. Each trade charges 75 basis points, handled by Schwab’s affiliated banks, and rolled out across most states in the U.S. In essence, it uses an extremely smooth user experience to route money from traditional brokerage accounts directly into the crypto world.
By contrast, competitors like Vanguard and Fidelity’s moves have seemed extremely sluggish. Schwab’s quick start has shifted the battle from “whether to allocate to crypto assets” to “how to help customers deeply allocate across the ecosystem.”
As of today, the proportion of traditional financial capital allocated to the crypto market is still under 1%. After Schwab’s official statement that it will add more tradable assets going forward, that means how the remaining 99% of the water gets in—Schwab has already carved open a big outlet. If other traditional institutions don’t follow suit, it means handing over the asset-scale competition to others.
Over the past couple of days, the hawkish Fed has caused a pullback in the broader market—Bitcoin even broke below the $80,000 threshold—but that fundamentally doesn’t change the long-term logic of capital migration.
The $13 trillion channel is fully opened and rapidly expanding. This is not to help coordinate short-term trading swings in response to market moves; it’s the traditional financial system setting the stage for a massive relocation of capital. The starter pistol has already gone off—most people just still have their eyes glued to short-term price charts.
#嘉信理财拟新增solavaxlink交易

If you read my previous analysis of Woshe's statement last night, then you don't need to panic over the indiscriminate sell-off across U.S. Treasuries, gold, stocks, and crypto over the past two days.
The two-year U.S. Treasury yield surged more than 10 basis points intraday, marking the sharpest hawkish reaction to a Fed chair's remarks by the market since 2009. Spot gold plunged nearly 3% in a single day, breaking below the $4,500 mark; Bitcoin and Ethereum also pulled back in sync, with nearly 100,000 people liquidated across the network within 24 hours and liquidation amounts approaching $475 million. The Philadelphia Semiconductor Index in the U.S. stock market fell a staggering 3.47%.
Many people saw the probability of a September rate hike jump from 35% to 60% and thought the crypto bull market was about to end.
But if you strip back the surface, this was nothing more than a concentrated liquidation triggered by the gap between macro expectations in a highly leveraged derivatives market, and it didn't damage Bitcoin's core pricing foundation at all.
Short term, watch sentiment; medium term, watch liquidity; long term, watch supply-demand structure and production costs. The disturbance caused by Woshe's insistence on a 2% inflation target is, at most, just a temporary pain in the process of medium-term liquidity repricing.
And the real hidden card determining the ceiling of Bitcoin$BTC 's current cycle remains the miner economics model that has been completely rewritten after the halving.
Based on current network hash rate and difficulty, miners' marginal shutdown cost is around $60,000. After the output halving took effect, if we ignore a large-scale exodus of hash power, the physical cost of merely maintaining the current network security has been forced up to around $120,000.
Prices may temporarily break below this level due to a liquidity crisis triggered by soaring U.S. Treasury yields, but the profit-seeking instinct of capital determines that it cannot remain below marginal production cost for long.
Working backward from the $120,000 cost line to estimate this cycle's top, a conservative target of $150,000, or even a run toward $200,000, is entirely logical and can be supported by both mathematical models and token distribution.
The tug-of-war over Federal Reserve policy expectations will continue to create liquidation noise, shaking out retail investors who lack token protection. The people who truly make big money are never the short-term traders who predict Fed hikes and cuts every day, but those who can instantly see the underlying clearing cost and pricing anchor when macro conditions are in turmoil. Once the logic is clear, the chips in hand naturally become steady.
#比特币24小时跌3.4%至7.74万美元
The two-year U.S. Treasury yield surged more than 10 basis points intraday, marking the sharpest hawkish reaction to a Fed chair's remarks by the market since 2009. Spot gold plunged nearly 3% in a single day, breaking below the $4,500 mark; Bitcoin and Ethereum also pulled back in sync, with nearly 100,000 people liquidated across the network within 24 hours and liquidation amounts approaching $475 million. The Philadelphia Semiconductor Index in the U.S. stock market fell a staggering 3.47%.
Many people saw the probability of a September rate hike jump from 35% to 60% and thought the crypto bull market was about to end.
But if you strip back the surface, this was nothing more than a concentrated liquidation triggered by the gap between macro expectations in a highly leveraged derivatives market, and it didn't damage Bitcoin's core pricing foundation at all.
Short term, watch sentiment; medium term, watch liquidity; long term, watch supply-demand structure and production costs. The disturbance caused by Woshe's insistence on a 2% inflation target is, at most, just a temporary pain in the process of medium-term liquidity repricing.
And the real hidden card determining the ceiling of Bitcoin$BTC 's current cycle remains the miner economics model that has been completely rewritten after the halving.
Based on current network hash rate and difficulty, miners' marginal shutdown cost is around $60,000. After the output halving took effect, if we ignore a large-scale exodus of hash power, the physical cost of merely maintaining the current network security has been forced up to around $120,000.
Prices may temporarily break below this level due to a liquidity crisis triggered by soaring U.S. Treasury yields, but the profit-seeking instinct of capital determines that it cannot remain below marginal production cost for long.
Working backward from the $120,000 cost line to estimate this cycle's top, a conservative target of $150,000, or even a run toward $200,000, is entirely logical and can be supported by both mathematical models and token distribution.
The tug-of-war over Federal Reserve policy expectations will continue to create liquidation noise, shaking out retail investors who lack token protection. The people who truly make big money are never the short-term traders who predict Fed hikes and cuts every day, but those who can instantly see the underlying clearing cost and pricing anchor when macro conditions are in turmoil. Once the logic is clear, the chips in hand naturally become steady.
#比特币24小时跌3.4%至7.74万美元
Verified
Summary of Kevin Walsh’s remarks yesterday:
Last night’s comments from Kevin Walsh essentially poured a bucket of cold water over the bulls in the market.
The core logic of the entire speech is very straightforward: inflation is still far from the 2% target, yet employment and consumption data are unusually robust.
As long as the real economy hasn’t shown signs of a stall and a crash, the Federal Reserve still has absolute initiative, and there is no real motivation to immediately pivot and “open the taps.”
What’s especially thought-provoking is the line, “If inflation can’t clearly and quickly trend downward, the Fed still has work to do.”
This kind of classic central-bank phrasing effectively puts options back on the table—namely extending the high-rate cycle further, and even not ruling out raising the threshold again.
He didn’t explicitly lock the next move to a rate hike, but this kind of wording that leaves room for maneuver—by itself—is a highly intimidating way to manage expectations.
Although he mentioned how AI can improve long-term productivity, and he also acknowledged that the labor market and credit system remain solid, from the perspective of liquidity trading, the notion that “the economy hasn’t broken down and employment is too strong” becomes the biggest original sin for risky assets.
Since the real economy hasn’t shown signs of a stall and crash, the Fed’s initiative remains rock solid—there’s simply no realistic impetus to pivot to easing right away.
The sharp tremors in both on-chain activity and the secondary market last night are actually logically consistent.
Crypto assets are, in essence, a sensitive amplifier of global liquidity premium.
When expectations for macro funding costs are forcibly pushed higher, the risk appetite of incremental marginal capital instantly falls to zero. In the liquidity haze, highly leveraged positions naturally have no choice but to dump first to hedge.
Macro capital markets are waiting for rate cuts, and the crypto market is waiting for liquidity to be released. But the Fed officials’ bottom line is whether the data confirms it. As long as the data hasn’t broken, any pricing based on wishful thinking will ultimately be taught a hard lesson by real yields.
In this situation, as long as inflation data shows so much as a minor reversal, the market’s pain period is far from over. $BTC
#沃什称通胀是美联储首要关注
Last night’s comments from Kevin Walsh essentially poured a bucket of cold water over the bulls in the market.
The core logic of the entire speech is very straightforward: inflation is still far from the 2% target, yet employment and consumption data are unusually robust.
As long as the real economy hasn’t shown signs of a stall and a crash, the Federal Reserve still has absolute initiative, and there is no real motivation to immediately pivot and “open the taps.”
What’s especially thought-provoking is the line, “If inflation can’t clearly and quickly trend downward, the Fed still has work to do.”
This kind of classic central-bank phrasing effectively puts options back on the table—namely extending the high-rate cycle further, and even not ruling out raising the threshold again.
He didn’t explicitly lock the next move to a rate hike, but this kind of wording that leaves room for maneuver—by itself—is a highly intimidating way to manage expectations.
Although he mentioned how AI can improve long-term productivity, and he also acknowledged that the labor market and credit system remain solid, from the perspective of liquidity trading, the notion that “the economy hasn’t broken down and employment is too strong” becomes the biggest original sin for risky assets.
Since the real economy hasn’t shown signs of a stall and crash, the Fed’s initiative remains rock solid—there’s simply no realistic impetus to pivot to easing right away.
The sharp tremors in both on-chain activity and the secondary market last night are actually logically consistent.
Crypto assets are, in essence, a sensitive amplifier of global liquidity premium.
When expectations for macro funding costs are forcibly pushed higher, the risk appetite of incremental marginal capital instantly falls to zero. In the liquidity haze, highly leveraged positions naturally have no choice but to dump first to hedge.
Macro capital markets are waiting for rate cuts, and the crypto market is waiting for liquidity to be released. But the Fed officials’ bottom line is whether the data confirms it. As long as the data hasn’t broken, any pricing based on wishful thinking will ultimately be taught a hard lesson by real yields.
In this situation, as long as inflation data shows so much as a minor reversal, the market’s pain period is far from over. $BTC
#沃什称通胀是美联储首要关注
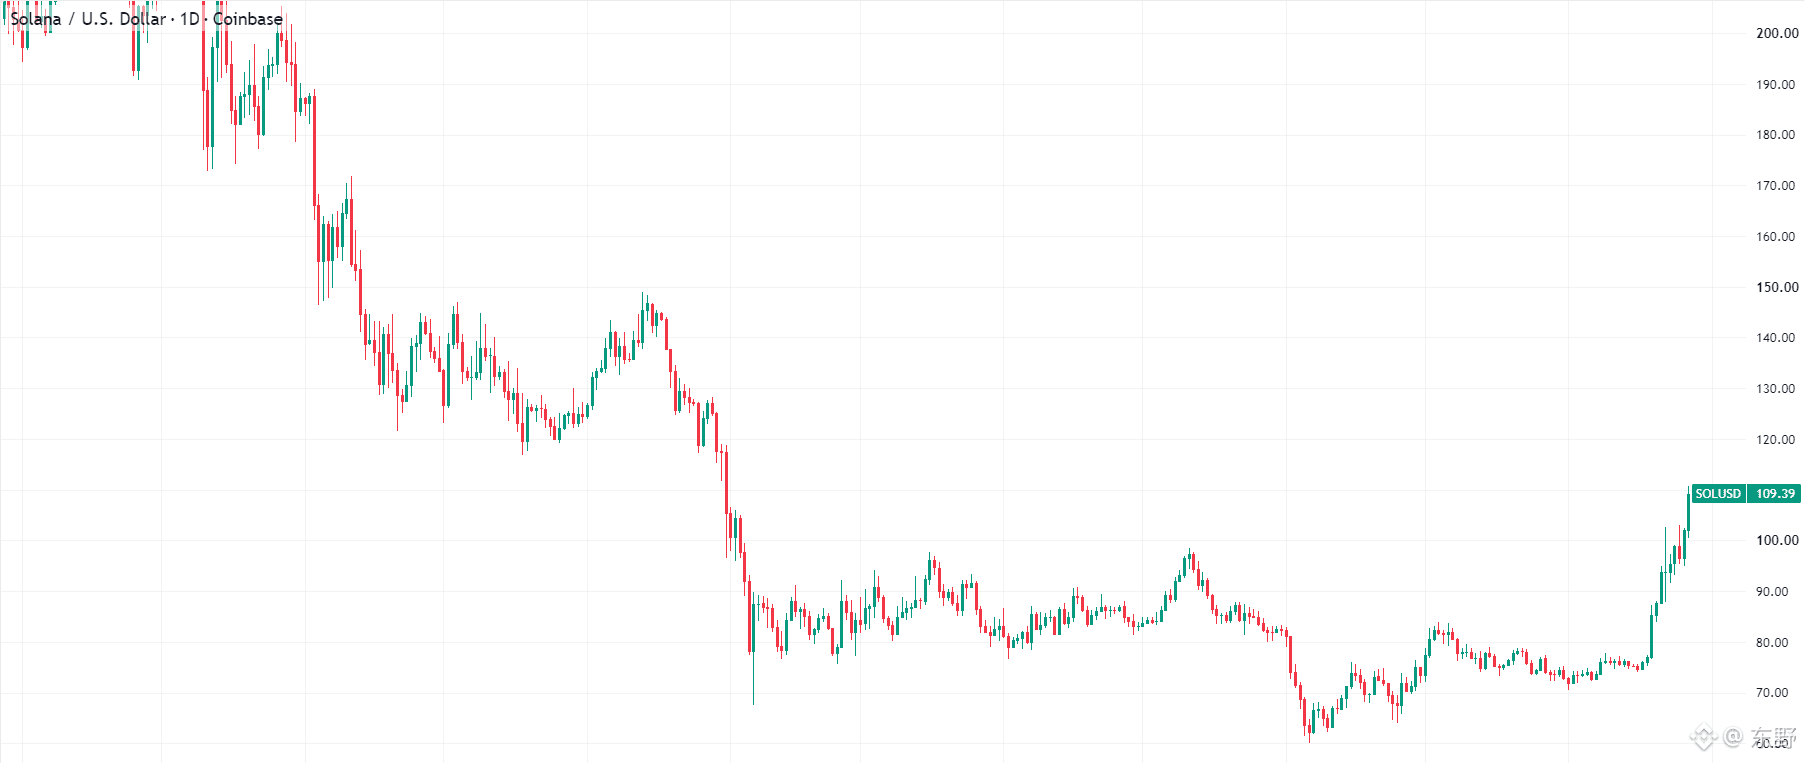
SOL jumped nearly 47% in a single month. This week, $SOL surged nearly 20% to 104.92, getting stuck at the level where it was smashed down from—110.60, the previous high.
Many people watch several consecutive bearish candles for a pullback, and with the RSI dropping to 25 and the MACD green bars turning red, they start to think the rebound is over.
But if you only look at the indicators, chances are you’ll get shaken out by the main force.
The real key is in the open interest (OI). When the price started climbing in step-like fashion from 94.82, OI kept rising, reaching 9.25M contracts. The notional value was pressured by nearly $970 million.
This is absolutely not a fake breakout caused by short squeezing. It’s real accumulation—major players are building positions with genuine money.
Now the price is pulling back, but OI hasn’t shown large-scale liquidations or withdrawal. This suggests the chips aren’t dispersing. The structure is basically one where price retraces on decreasing volume, yet OI remains high and沉淀—meaning bulls are consuming the earlier de-risked positions from getting out of break-even and short-term profit-taking.
The current market action is simple: MA7 is capping at 105.68, while the super trend line is at 104.56.
If you’re a long position player in the market, 104.56 is your lifeline.
Holding that level means this pullback is only high-level position rotation—turning over crowded chips—building fuel for the next push above 110. But once there’s a valid breakdown below 104.56, it means a substantial portion of the roughly $970 million worth of chasing positions will face liquidation or stop-loss. The chart will quickly turn into a stampede.
From a risk/reward perspective, this is definitely not the moment to chase aggressively with your eyes closed.
The real trading opportunity isn’t in guessing at the halfway point, but in waiting for a right-side signal: either wait for the market to finish clearing and then chase after the leverage is shaken down, with clear stop-decline support forming near 104.56;
or wait for the price to directly regain 105.68 with volume and forcefully hold above it.
Until the main force finishes its shakeout, keep your hand tight—don’t contribute liquidity to the liquidation map.
#sol本周上涨20%
Many people watch several consecutive bearish candles for a pullback, and with the RSI dropping to 25 and the MACD green bars turning red, they start to think the rebound is over.
But if you only look at the indicators, chances are you’ll get shaken out by the main force.
The real key is in the open interest (OI). When the price started climbing in step-like fashion from 94.82, OI kept rising, reaching 9.25M contracts. The notional value was pressured by nearly $970 million.
This is absolutely not a fake breakout caused by short squeezing. It’s real accumulation—major players are building positions with genuine money.
Now the price is pulling back, but OI hasn’t shown large-scale liquidations or withdrawal. This suggests the chips aren’t dispersing. The structure is basically one where price retraces on decreasing volume, yet OI remains high and沉淀—meaning bulls are consuming the earlier de-risked positions from getting out of break-even and short-term profit-taking.
The current market action is simple: MA7 is capping at 105.68, while the super trend line is at 104.56.
If you’re a long position player in the market, 104.56 is your lifeline.
Holding that level means this pullback is only high-level position rotation—turning over crowded chips—building fuel for the next push above 110. But once there’s a valid breakdown below 104.56, it means a substantial portion of the roughly $970 million worth of chasing positions will face liquidation or stop-loss. The chart will quickly turn into a stampede.
From a risk/reward perspective, this is definitely not the moment to chase aggressively with your eyes closed.
The real trading opportunity isn’t in guessing at the halfway point, but in waiting for a right-side signal: either wait for the market to finish clearing and then chase after the leverage is shaken down, with clear stop-decline support forming near 104.56;
or wait for the price to directly regain 105.68 with volume and forcefully hold above it.
Until the main force finishes its shakeout, keep your hand tight—don’t contribute liquidity to the liquidation map.
#sol本周上涨20%
The linkage between this August wave of gold and $BTC is far more serious than the few red bullish candles shown by charting/quoting software.
A nearly 14% monthly gain has pushed the price of gold $XAU to around $4,696. Many people are still instinctively attributing it to a sudden geopolitical risk-driven safe-haven move, but that’s essentially using short-term thinking to force-fit a long-term structure.
The fundamental driver behind this wave of buying is the systemic pressure on macro balance sheets. The ongoing expansion of U.S. Treasury issuance, the structural nature of fiscal deficits, and long-term inflation stickiness are steadily eroding the real purchasing power of the fiat currency.
When the central bank and large institutions begin to swap fiat holdings for gold at no regard for cost, the market is effectively re-pricing the credibility of the U.S. dollar.
An even more critical signal is that BTC is also rising within the same time window.
In the past, many institutions treated BTC as a high-beta risk asset, moving in sync with tech stocks and oscillating together. But during this cycle of dollar pressure, BTC has shown increasingly strong anti-inflation characteristics and a “hard-capped, scarce supply” nature.
Smart money knows very well that whether it’s gold in the physical world or BTC in the code world, their essence is “assets that cannot be infinitely printed at zero cost.”
Gold first drives the direction of the macro trade, and BTC then follows. This indicates that the whole market is shifting from a game driven purely by risk appetite toward a more macro, defense-oriented stance against currency depreciation.
For on-chain participants and macro traders alike, going forward you can’t just watch the battlefield and short-term noise like rate decisions. What truly needs monitoring is the movement of the U.S. Treasury yield curve and the net changes in the balance sheets of global central banks.
As long as the endgame logic—fiat over-issuance and debt compression—has not changed, the trend of scarce assets like gold and BTC competing for pricing power won’t easily come to an end.
Short-term pullbacks and volatility are merely leverage clearing. But the rise in the macro “water level” is the only main line that will determine how assets are valued over the next six months. #黄金8月上涨约14%
A nearly 14% monthly gain has pushed the price of gold $XAU to around $4,696. Many people are still instinctively attributing it to a sudden geopolitical risk-driven safe-haven move, but that’s essentially using short-term thinking to force-fit a long-term structure.
The fundamental driver behind this wave of buying is the systemic pressure on macro balance sheets. The ongoing expansion of U.S. Treasury issuance, the structural nature of fiscal deficits, and long-term inflation stickiness are steadily eroding the real purchasing power of the fiat currency.
When the central bank and large institutions begin to swap fiat holdings for gold at no regard for cost, the market is effectively re-pricing the credibility of the U.S. dollar.
An even more critical signal is that BTC is also rising within the same time window.
In the past, many institutions treated BTC as a high-beta risk asset, moving in sync with tech stocks and oscillating together. But during this cycle of dollar pressure, BTC has shown increasingly strong anti-inflation characteristics and a “hard-capped, scarce supply” nature.
Smart money knows very well that whether it’s gold in the physical world or BTC in the code world, their essence is “assets that cannot be infinitely printed at zero cost.”
Gold first drives the direction of the macro trade, and BTC then follows. This indicates that the whole market is shifting from a game driven purely by risk appetite toward a more macro, defense-oriented stance against currency depreciation.
For on-chain participants and macro traders alike, going forward you can’t just watch the battlefield and short-term noise like rate decisions. What truly needs monitoring is the movement of the U.S. Treasury yield curve and the net changes in the balance sheets of global central banks.
As long as the endgame logic—fiat over-issuance and debt compression—has not changed, the trend of scarce assets like gold and BTC competing for pricing power won’t easily come to an end.
Short-term pullbacks and volatility are merely leverage clearing. But the rise in the macro “water level” is the only main line that will determine how assets are valued over the next six months. #黄金8月上涨约14%

周东野
·
--
The力度 of buying gold in the Chinese mainland has quietly picked up again.
In July, Hong Kong’s net gold exports to the mainland were 56.193 tonnes, up from the previous 50.679 tonnes. In July, Hong Kong’s total gold exports to the mainland were 75.457 tonnes, down from the previous 78.147 tonnes.
With a month-on-month increase of more than ten percent, year-on-year growth is even close to 28%. If we look only at Hong Kong’s total gold exports to the mainland, the data actually shows a slight decline. However, net exports rose instead of falling. This points to a very clear one-way flow of funds: after gold flows from Hong Kong into the mainland, the phenomenon of it being sold back to Hong Kong has become noticeably less common.
Most people in the market are still focused on jewelry retail consumption, but they’re completely looking in the wrong direction. According to practical data from the China Gold Association, overall gold consumption nationwide in the first half of the year fell slightly, but the structure has split sharply—gold jewelry consumption declined by nearly 27% year-on-year, while gold bars and gold coins with very low premiums surged by 46% year-on-year. People no longer want to pay for expensive, less liquid craftsmanship and processing fees; instead, they use hard gold to hedge assets directly.
Even more hard-core data comes from central banks and the ETF side. The central bank previously completed a streak of 18 consecutive months of adding to gold reserves, and domestic gold ETFs also saw net inflows that broke the historical record for the same period. If we zoom out, the market used to attribute gold’s pricing power mainly to expectations for Federal Reserve rate cuts and arbitrage moves by macro funds in Europe and the United States. But now, strong local demand for physical gold in Asia and central bank reserve accumulation have already laid a solid layer of pricing support at the bottom.
When more institutions and individuals are willing to force-convert their devaluing fiat currency into physical gold, it sends an extremely clear signal for Web3 asset architecture: global consensus on “an absolutely scarce asset with no hedging risk” has not cooled down—instead, it is accelerating and condensing as confidence in the fiat system declines.
Within the price arbitrage range between <$BTC > BitGold and physical gold, whoever can absorb this panic-driven demand for absolute scarcity will be the ultimate receiving endpoint for the next round of capital flight.
#香港7月对内地黄金净出口56.193吨 #
In July, Hong Kong’s net gold exports to the mainland were 56.193 tonnes, up from the previous 50.679 tonnes. In July, Hong Kong’s total gold exports to the mainland were 75.457 tonnes, down from the previous 78.147 tonnes.
With a month-on-month increase of more than ten percent, year-on-year growth is even close to 28%. If we look only at Hong Kong’s total gold exports to the mainland, the data actually shows a slight decline. However, net exports rose instead of falling. This points to a very clear one-way flow of funds: after gold flows from Hong Kong into the mainland, the phenomenon of it being sold back to Hong Kong has become noticeably less common.
Most people in the market are still focused on jewelry retail consumption, but they’re completely looking in the wrong direction. According to practical data from the China Gold Association, overall gold consumption nationwide in the first half of the year fell slightly, but the structure has split sharply—gold jewelry consumption declined by nearly 27% year-on-year, while gold bars and gold coins with very low premiums surged by 46% year-on-year. People no longer want to pay for expensive, less liquid craftsmanship and processing fees; instead, they use hard gold to hedge assets directly.
Even more hard-core data comes from central banks and the ETF side. The central bank previously completed a streak of 18 consecutive months of adding to gold reserves, and domestic gold ETFs also saw net inflows that broke the historical record for the same period. If we zoom out, the market used to attribute gold’s pricing power mainly to expectations for Federal Reserve rate cuts and arbitrage moves by macro funds in Europe and the United States. But now, strong local demand for physical gold in Asia and central bank reserve accumulation have already laid a solid layer of pricing support at the bottom.
When more institutions and individuals are willing to force-convert their devaluing fiat currency into physical gold, it sends an extremely clear signal for Web3 asset architecture: global consensus on “an absolutely scarce asset with no hedging risk” has not cooled down—instead, it is accelerating and condensing as confidence in the fiat system declines.
Within the price arbitrage range between <$BTC > BitGold and physical gold, whoever can absorb this panic-driven demand for absolute scarcity will be the ultimate receiving endpoint for the next round of capital flight.
#香港7月对内地黄金净出口56.193吨 #
Verified
NVIDIA $NVDA opened and traded $33.5 billion in the first 140 minutes, equivalent to sucking nearly all of a normal full day’s liquidity dry in just two hours.
Many people only see the number as exaggerated, but the real capital battle behind it was extremely brutal. Just before earnings were released, NVIDIA had just gone through a seven-day gradual decline, and rumors everywhere in the market were saying that AI capital spending had already peaked. In response, the bulls turned around and used a massive trading volume to precisely strangle the shorts in a liquidity trap.
It surged 7.1% in the first 7 minutes after the open, adding $442 billion in market value in a single day, pushing its total market cap to $5.47 trillion. The market value added in one day was more than enough to buy the entire old Moutai, the highest-valued stock in the A-share market.
Second-quarter revenue reached $96.2 billion, doubling year over year, with the data center business alone contributing $89 billion, soaring 117% year over year. This directly shattered doubts about supply-side bottlenecks. Next quarter’s revenue guidance was set at $108 billion, and even more unusually, it pre-announced fiscal 2028 revenue growth of about 70%, backed by more than $2 trillion in unfulfilled orders from cloud giants.
Jensen Huang summed up the logic in one sentence during the earnings call: today’s spending on computing power is directly equivalent to future cash revenue.
For tech giants, buying NVIDIA GPUs is not just an IT expense, but a must-win race to secure production capacity. Buy one fewer card, and it means surrendering ground in the next generation of generative services. The hidden cost of missing out on AI infrastructure buildout has already far exceeded the financial risk of buying expensive chips.
After the earnings report, institutions raised their price target to $550, implying a $13 trillion market cap. This seemingly absurd valuation is, in essence, a way of re-anchoring the price of computing infrastructure using its expected share of future global GDP.
When real money poured in疯狂 during those 140 minutes, the capital that chose to stand aside and watch may have seemed to avoid the volatility at the top, but in reality it had already been shut out from the next wave of productivity gains. The one who controls the pricing power of computing power is the mint of the hardest currency.
#英伟达开盘140分钟成交335亿美元
Many people only see the number as exaggerated, but the real capital battle behind it was extremely brutal. Just before earnings were released, NVIDIA had just gone through a seven-day gradual decline, and rumors everywhere in the market were saying that AI capital spending had already peaked. In response, the bulls turned around and used a massive trading volume to precisely strangle the shorts in a liquidity trap.
It surged 7.1% in the first 7 minutes after the open, adding $442 billion in market value in a single day, pushing its total market cap to $5.47 trillion. The market value added in one day was more than enough to buy the entire old Moutai, the highest-valued stock in the A-share market.
Second-quarter revenue reached $96.2 billion, doubling year over year, with the data center business alone contributing $89 billion, soaring 117% year over year. This directly shattered doubts about supply-side bottlenecks. Next quarter’s revenue guidance was set at $108 billion, and even more unusually, it pre-announced fiscal 2028 revenue growth of about 70%, backed by more than $2 trillion in unfulfilled orders from cloud giants.
Jensen Huang summed up the logic in one sentence during the earnings call: today’s spending on computing power is directly equivalent to future cash revenue.
For tech giants, buying NVIDIA GPUs is not just an IT expense, but a must-win race to secure production capacity. Buy one fewer card, and it means surrendering ground in the next generation of generative services. The hidden cost of missing out on AI infrastructure buildout has already far exceeded the financial risk of buying expensive chips.
After the earnings report, institutions raised their price target to $550, implying a $13 trillion market cap. This seemingly absurd valuation is, in essence, a way of re-anchoring the price of computing infrastructure using its expected share of future global GDP.
When real money poured in疯狂 during those 140 minutes, the capital that chose to stand aside and watch may have seemed to avoid the volatility at the top, but in reality it had already been shut out from the next wave of productivity gains. The one who controls the pricing power of computing power is the mint of the hardest currency.
#英伟达开盘140分钟成交335亿美元
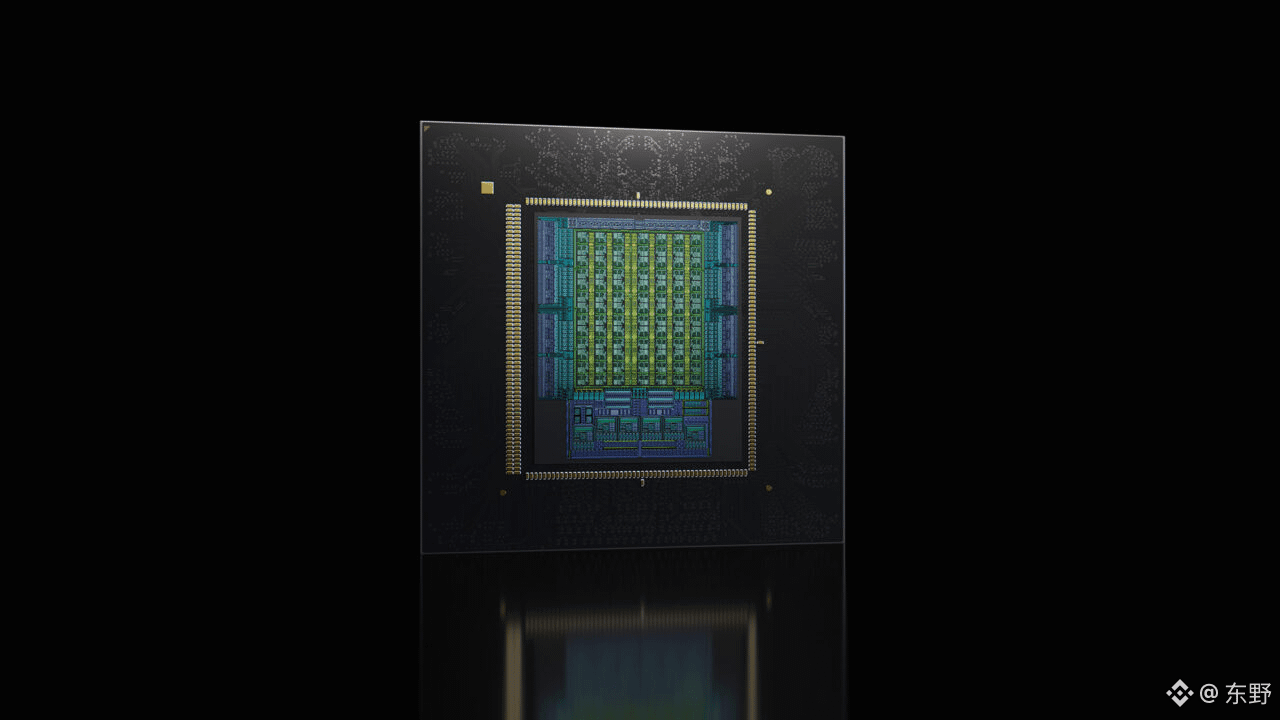
In the market, there’s no shortage of people who use indicators to draw lines and predict price movements—but truly living off trading is rare.
Most people go off track from step one, treating technical analysis like a crystal ball for predicting the future. The truth is: technical analysis is never meant to predict the future. It’s meant to build your probabilistic edge and a framework for risk.
If you really want to understand trading logic, John Murphy’s Technical Analysis of the Futures Markets is the foundation you can’t get around.
The core of this book is to explain, in depth, that “market behavior encompasses all information.” The real flow of funds is more honest than any piece of news. When large money enters or distributes, its path will inevitably show up in price and volume. The essence of technical analysis is a quantified record of the psychological battle among participants and the resulting outcome of the funds’ game.
For example, support and resistance are essentially a contest between areas of concentrated positions (chips) and points where liquidity faces pressure. A breakout of key levels must rely on large capital absorbing the selling pressure wall and breaking the existing balance.
But most people who still end up losing money after finishing the book fail because they treat patterns as rigid, mechanical setups. Seeing a head-and-shoulders bottom and assuming it must rise, while ignoring that widely visible chart patterns are easily targeted by market makers. A “perfect” breakout on a chart may well be a liquidity trap designed for retail traders.
The real benefit from technical analysis is not improving your win rate; it’s giving you a clear logic and a rationale for placing stops.
It tells you when your assumptions have failed. Even if your win rate is only 40%, by controlling losses and amplifying the reward-to-risk ratio, you can still survive by relying on positive expected value. Clear out the flashy indicators and return to the most original K-line (candlesticks) and volume. Trading has never been about who can predict more accurately—it’s about who can hold on when they’re right, and who can run fast when they’re wrong.$BTC #交易
Most people go off track from step one, treating technical analysis like a crystal ball for predicting the future. The truth is: technical analysis is never meant to predict the future. It’s meant to build your probabilistic edge and a framework for risk.
If you really want to understand trading logic, John Murphy’s Technical Analysis of the Futures Markets is the foundation you can’t get around.
The core of this book is to explain, in depth, that “market behavior encompasses all information.” The real flow of funds is more honest than any piece of news. When large money enters or distributes, its path will inevitably show up in price and volume. The essence of technical analysis is a quantified record of the psychological battle among participants and the resulting outcome of the funds’ game.
For example, support and resistance are essentially a contest between areas of concentrated positions (chips) and points where liquidity faces pressure. A breakout of key levels must rely on large capital absorbing the selling pressure wall and breaking the existing balance.
But most people who still end up losing money after finishing the book fail because they treat patterns as rigid, mechanical setups. Seeing a head-and-shoulders bottom and assuming it must rise, while ignoring that widely visible chart patterns are easily targeted by market makers. A “perfect” breakout on a chart may well be a liquidity trap designed for retail traders.
The real benefit from technical analysis is not improving your win rate; it’s giving you a clear logic and a rationale for placing stops.
It tells you when your assumptions have failed. Even if your win rate is only 40%, by controlling losses and amplifying the reward-to-risk ratio, you can still survive by relying on positive expected value. Clear out the flashy indicators and return to the most original K-line (candlesticks) and volume. Trading has never been about who can predict more accurately—it’s about who can hold on when they’re right, and who can run fast when they’re wrong.$BTC #交易
Today’s Key Events
1. Trump family encrypted bank acquires 49% stake in the UAE [Independent Event]
[Regulation·New] WSJ reports that the Emirati Sheikh investment is 49%, PURR surges 20%, signaling a political-capital linkage
2. Ethena ends VC token buyback unlocking, ENA skyrockets [← Mainline 1]
[Governance/Contract·Confirmation] Ends monthly unlocks for early buyback tokens, initiates revenue buyback, and materially improves token structure
3. Core Lightning fixes a real vulnerability [Independent Event]
[Market Structure·Heating Up] Advises node operators to restart with --offline; Lightning Network security is under scrutiny
4. GTA6 hacker sells Meme coin holdings to cash out $125,000 [Independent Event]
[Regulatory·Pulse] Sells $CYBERLEEK before official release; drops 46% in 24 hours; concerns about insider trading intensify
5. A giant whale moves 177M USDC to Aave [← Mainline 2]
[Position/Liquidation·New] Large USDC enters a lending protocol—possibly to prepare for further leverage; monitor closely
6. TRON upgrades its quantum-resistant public chain before year-end [Independent Event]
[Product Expectation·New] Quantum-resistant addresses have already gone live on the testnet; Sun Yuchen announced at a Hong Kong conference, boosting the quantum narrative
Sentiment and Disagreement:
Shared View: Institutional capital continues to flow in, lifting the mid-term bottom
Most Worrying Topic: The risk of HYPE pulling back at high levels and losses from shorting
Largest Disagreement: Is the Robinhood ecosystem an early opportunity or a top signal?
Primary Sentiment: $BTC is moderately bullish but cautious, with both FOMO and fear-of-highs coexisting
External Constraints:
- Macro: US Q2 GDP grows 1.5%, NVDA revenue beats expectations; economic resilience supports risk assets
- Regulation: SEC plans to reform crypto custody rules; Bithumb wins a lawsuit to recover $43B in mistakenly sent BTC
- Traditional Finance: Charles Schwab adds trading products for SOL/AVAX/LINK; compliance channels expand
#比特币守于7.94万美元
1. Trump family encrypted bank acquires 49% stake in the UAE [Independent Event]
[Regulation·New] WSJ reports that the Emirati Sheikh investment is 49%, PURR surges 20%, signaling a political-capital linkage
2. Ethena ends VC token buyback unlocking, ENA skyrockets [← Mainline 1]
[Governance/Contract·Confirmation] Ends monthly unlocks for early buyback tokens, initiates revenue buyback, and materially improves token structure
3. Core Lightning fixes a real vulnerability [Independent Event]
[Market Structure·Heating Up] Advises node operators to restart with --offline; Lightning Network security is under scrutiny
4. GTA6 hacker sells Meme coin holdings to cash out $125,000 [Independent Event]
[Regulatory·Pulse] Sells $CYBERLEEK before official release; drops 46% in 24 hours; concerns about insider trading intensify
5. A giant whale moves 177M USDC to Aave [← Mainline 2]
[Position/Liquidation·New] Large USDC enters a lending protocol—possibly to prepare for further leverage; monitor closely
6. TRON upgrades its quantum-resistant public chain before year-end [Independent Event]
[Product Expectation·New] Quantum-resistant addresses have already gone live on the testnet; Sun Yuchen announced at a Hong Kong conference, boosting the quantum narrative
Sentiment and Disagreement:
Shared View: Institutional capital continues to flow in, lifting the mid-term bottom
Most Worrying Topic: The risk of HYPE pulling back at high levels and losses from shorting
Largest Disagreement: Is the Robinhood ecosystem an early opportunity or a top signal?
Primary Sentiment: $BTC is moderately bullish but cautious, with both FOMO and fear-of-highs coexisting
External Constraints:
- Macro: US Q2 GDP grows 1.5%, NVDA revenue beats expectations; economic resilience supports risk assets
- Regulation: SEC plans to reform crypto custody rules; Bithumb wins a lawsuit to recover $43B in mistakenly sent BTC
- Traditional Finance: Charles Schwab adds trading products for SOL/AVAX/LINK; compliance channels expand
#比特币守于7.94万美元
Log in to explore more content