
News_web3
441 Posts

News_web3
Report
Block User
独立加密货币新闻媒体。覆盖公链、市场、监管与安全事件,以公开来源与链上数据核验事实
Open Trade
Frequent Trader
6.2 Years
6 Following
29 Followers
12 Liked
Posts
Portfolio
All
Quotes
Live
·
--
🐋 $HANA broke through the 0.017 level.
A lot of orders tend to cluster around whole-number levels, so let’s first understand why these levels matter.
A large number of stop-loss orders often cluster around these levels. Once the price crosses one, those stops are triggered all at once, and volatility can suddenly spike.
When the price returns to a level after a long time, people who entered around that level before may take the opportunity to exit at break-even or add to their positions, often making trading more active.
Understanding this indicator is meant to help you avoid being misled by numbers—not to predict whether prices will rise or fall.
#HANA
🐋 $HANA broke through the 0.017 level.
A lot of orders tend to cluster around whole-number levels, so let’s first understand why these levels matter.
A large number of stop-loss orders often cluster around these levels. Once the price crosses one, those stops are triggered all at once, and volatility can suddenly spike.
When the price returns to a level after a long time, people who entered around that level before may take the opportunity to exit at break-even or add to their positions, often making trading more active.
Understanding this indicator is meant to help you avoid being misled by numbers—not to predict whether prices will rise or fall.
#HANA
A lot of orders tend to cluster around whole-number levels, so let’s first understand why these levels matter.
A large number of stop-loss orders often cluster around these levels. Once the price crosses one, those stops are triggered all at once, and volatility can suddenly spike.
When the price returns to a level after a long time, people who entered around that level before may take the opportunity to exit at break-even or add to their positions, often making trading more active.
Understanding this indicator is meant to help you avoid being misled by numbers—not to predict whether prices will rise or fall.
#HANA
2
·
--
$BR 1 hours +7.69%💪
Short-term momentum is strong; watch whether trading volume can continue.
Current price: 0.4978. The first pullback after a sharp rally is the best test of the quality of buying pressure. Leave a comment with your take.
$BR 1 hours +7.69%💪
Short-term momentum is strong; watch whether trading volume can continue.
Current price: 0.4978. The first pullback after a sharp rally is the best test of the quality of buying pressure. Leave a comment with your take.
Short-term momentum is strong; watch whether trading volume can continue.
Current price: 0.4978. The first pullback after a sharp rally is the best test of the quality of buying pressure. Leave a comment with your take.
25
·
--
$INJ |Breaking below the 8 level
Before looking at capital flows, first understand round-number levels.
A lot of stop-loss orders tend to cluster near these levels. If the price moves past one, those stops can be triggered all at once, often causing volatility to spike.
When the price repeatedly crosses back and forth near a key level, both bulls and bears may get stopped out repeatedly. Keeping positions small is often a better choice until the direction becomes clear.
All indicators summarize market movements that have already happened; the market can move in the opposite direction at any time.
$INJ |Breaking below the 8 level
Before looking at capital flows, first understand round-number levels.
A lot of stop-loss orders tend to cluster near these levels. If the price moves past one, those stops can be triggered all at once, often causing volatility to spike.
When the price repeatedly crosses back and forth near a key level, both bulls and bears may get stopped out repeatedly. Keeping positions small is often a better choice until the direction becomes clear.
All indicators summarize market movements that have already happened; the market can move in the opposite direction at any time.
Before looking at capital flows, first understand round-number levels.
A lot of stop-loss orders tend to cluster near these levels. If the price moves past one, those stops can be triggered all at once, often causing volatility to spike.
When the price repeatedly crosses back and forth near a key level, both bulls and bears may get stopped out repeatedly. Keeping positions small is often a better choice until the direction becomes clear.
All indicators summarize market movements that have already happened; the market can move in the opposite direction at any time.
36
·
--
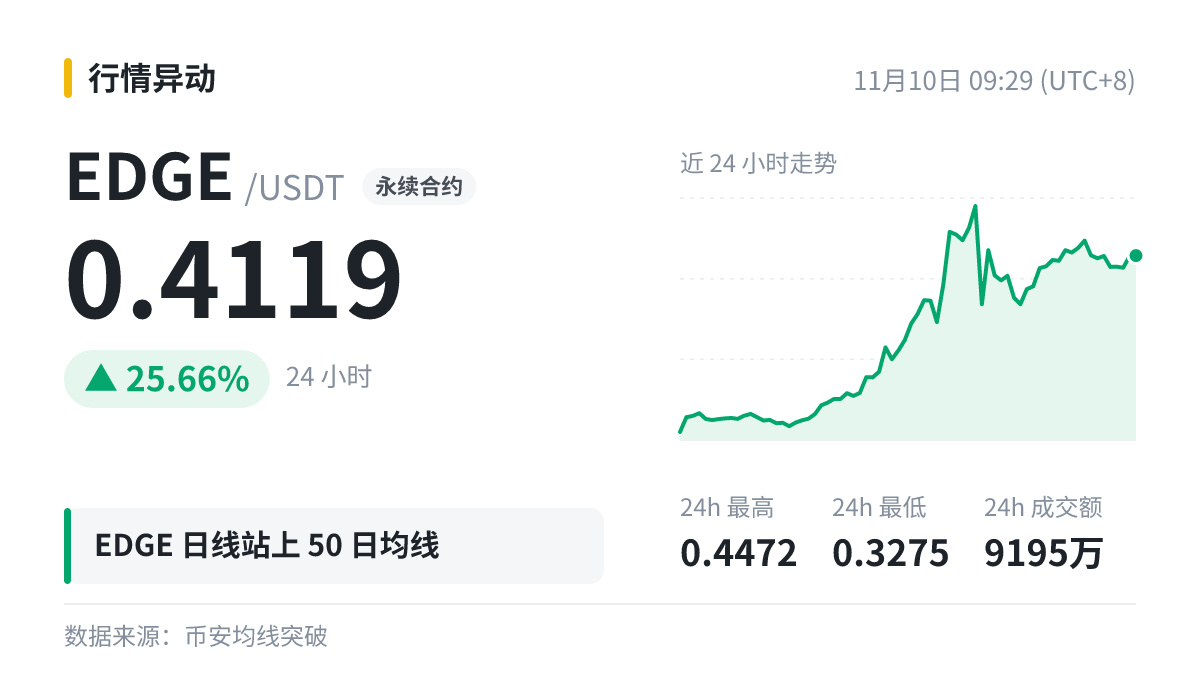
🎯 $EDGE is trading above MA50 on the daily chart (0.3971), with the current price at 0.4119.
Be cautious of a pullback after a low-volume surge; a sustained move above the level on higher volume is what counts. Will the market change direction next?
🎯 $EDGE is trading above MA50 on the daily chart (0.3971), with the current price at 0.4119.
Be cautious of a pullback after a low-volume surge; a sustained move above the level on higher volume is what counts. Will the market change direction next?
Be cautious of a pullback after a low-volume surge; a sustained move above the level on higher volume is what counts. Will the market change direction next?
71
·
--
I was stunned! $ENA finally broke above the 0.155 mark! Do you think it can hold? Share your bets in the comments 👇
I was stunned! $ENA finally broke above the 0.155 mark! Do you think it can hold? Share your bets in the comments 👇
1
·
--
$ONDO 1 Hourly volume suddenly surged: 11.9 times the average, up 6.51%.
If the price doesn’t move much after the volume spike, it means buyers and sellers are evenly matched. Whichever side gives way first, the price will move in the opposite direction.
#ONDO
$ONDO 1 Hourly volume suddenly surged: 11.9 times the average, up 6.51%.
If the price doesn’t move much after the volume spike, it means buyers and sellers are evenly matched. Whichever side gives way first, the price will move in the opposite direction.
#ONDO
If the price doesn’t move much after the volume spike, it means buyers and sellers are evenly matched. Whichever side gives way first, the price will move in the opposite direction.
#ONDO
8
·
--
$KORUB hit a new 24-hour high of 7.53; the previous high of 7.44 is now a thing of the past.
If you’re afraid of heights, buckle up 🎢
Join the comment chain: describe your mood today in three words.
#KORUB
$KORUB hit a new 24-hour high of 7.53; the previous high of 7.44 is now a thing of the past.
If you’re afraid of heights, buckle up 🎢
Join the comment chain: describe your mood today in three words.
#KORUB
If you’re afraid of heights, buckle up 🎢
Join the comment chain: describe your mood today in three words.
#KORUB
·
--
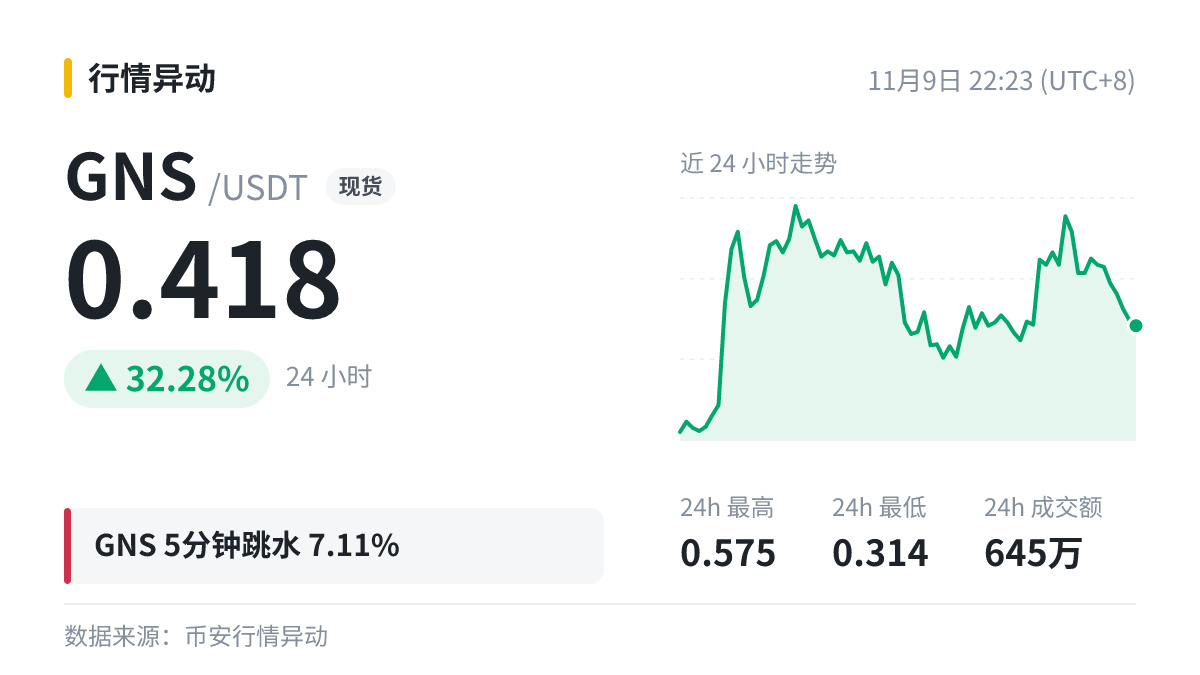
$GNS 5 minutes -7.11%💣
The market's cooled off, so let's sit on the sidelines.
Have you gotten in, or are you still waiting?
$GNS 5 minutes -7.11%💣
The market's cooled off, so let's sit on the sidelines.
Have you gotten in, or are you still waiting?
The market's cooled off, so let's sit on the sidelines.
Have you gotten in, or are you still waiting?
·
--
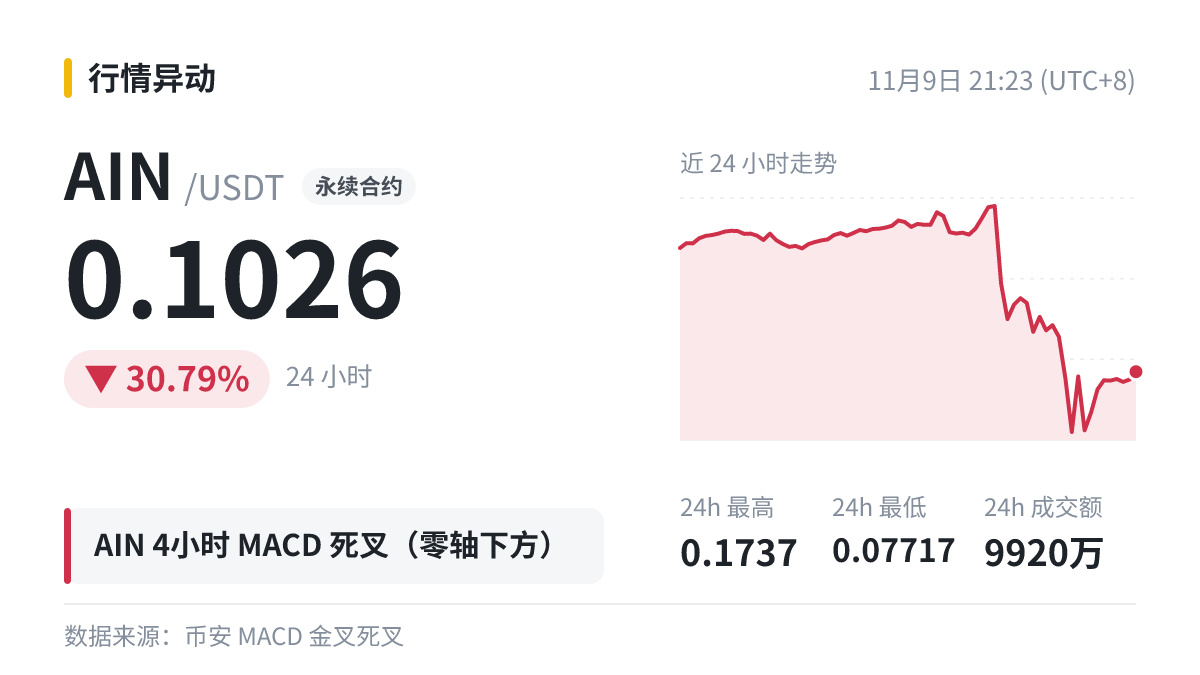
$AIN 4 hours: MACD forms a death cross below the zero line.
A question every beginner asks: What is MACD?
DIF (also called the MACD line) = 12-period EMA − 26-period EMA; DEA (also called the signal line) is calculated by taking a 9-period EMA of DIF.
A death cross above the zero line is often seen as weakening bullish momentum, but it doesn’t necessarily mean the trend is over; a death cross below the zero line is often seen as a sign that the downtrend will continue.
When trading with leverage, first work out whether you can withstand the worst-case scenario, then consider what the signal is telling you.
#AIN
$AIN 4 hours: MACD forms a death cross below the zero line.
A question every beginner asks: What is MACD?
DIF (also called the MACD line) = 12-period EMA − 26-period EMA; DEA (also called the signal line) is calculated by taking a 9-period EMA of DIF.
A death cross above the zero line is often seen as weakening bullish momentum, but it doesn’t necessarily mean the trend is over; a death cross below the zero line is often seen as a sign that the downtrend will continue.
When trading with leverage, first work out whether you can withstand the worst-case scenario, then consider what the signal is telling you.
#AIN
A question every beginner asks: What is MACD?
DIF (also called the MACD line) = 12-period EMA − 26-period EMA; DEA (also called the signal line) is calculated by taking a 9-period EMA of DIF.
A death cross above the zero line is often seen as weakening bullish momentum, but it doesn’t necessarily mean the trend is over; a death cross below the zero line is often seen as a sign that the downtrend will continue.
When trading with leverage, first work out whether you can withstand the worst-case scenario, then consider what the signal is telling you.
#AIN
2
·
--
Just now | $SOL Network-wide account long/short ratio 3.39 (3.37 1 hour ago)
Longs dominate (77.2%), price 24h -3.63%.
#SOL
Just now | $SOL Network-wide account long/short ratio 3.39 (3.37 1 hour ago)
Longs dominate (77.2%), price 24h -3.63%.
#SOL
Longs dominate (77.2%), price 24h -3.63%.
#SOL
1
·
--
$GTC fell below the 0.17 level (current price: 0.1704, now back above the level)
Futures traders, keep an eye on your holding costs—holding on for too long can get expensive. Do you think it’ll go up or down next? Leave a comment and vote.
$GTC fell below the 0.17 level (current price: 0.1704, now back above the level)
Futures traders, keep an eye on your holding costs—holding on for too long can get expensive. Do you think it’ll go up or down next? Leave a comment and vote.
Futures traders, keep an eye on your holding costs—holding on for too long can get expensive. Do you think it’ll go up or down next? Leave a comment and vote.
6
·
--
Position Notes | $BTC
Long positions account for 74.6% across all accounts, with a long/short ratio of 2.93.
Keep a little extra margin for futures positions; sudden volatility never picks a convenient time.
#BTC
Position Notes | $BTC
Long positions account for 74.6% across all accounts, with a long/short ratio of 2.93.
Keep a little extra margin for futures positions; sudden volatility never picks a convenient time.
#BTC
Long positions account for 74.6% across all accounts, with a long/short ratio of 2.93.
Keep a little extra margin for futures positions; sudden volatility never picks a convenient time.
#BTC
·
--
🩸 $CC hit a new 30-day low of 0.08786, breaking below the previous low of 0.0882.
The longs got wiped out again. When support breaks, it often turns into resistance. How much more can the bears make?
#CC
🩸 $CC hit a new 30-day low of 0.08786, breaking below the previous low of 0.0882.
The longs got wiped out again. When support breaks, it often turns into resistance. How much more can the bears make?
#CC
The longs got wiped out again. When support breaks, it often turns into resistance. How much more can the bears make?
#CC
·
--
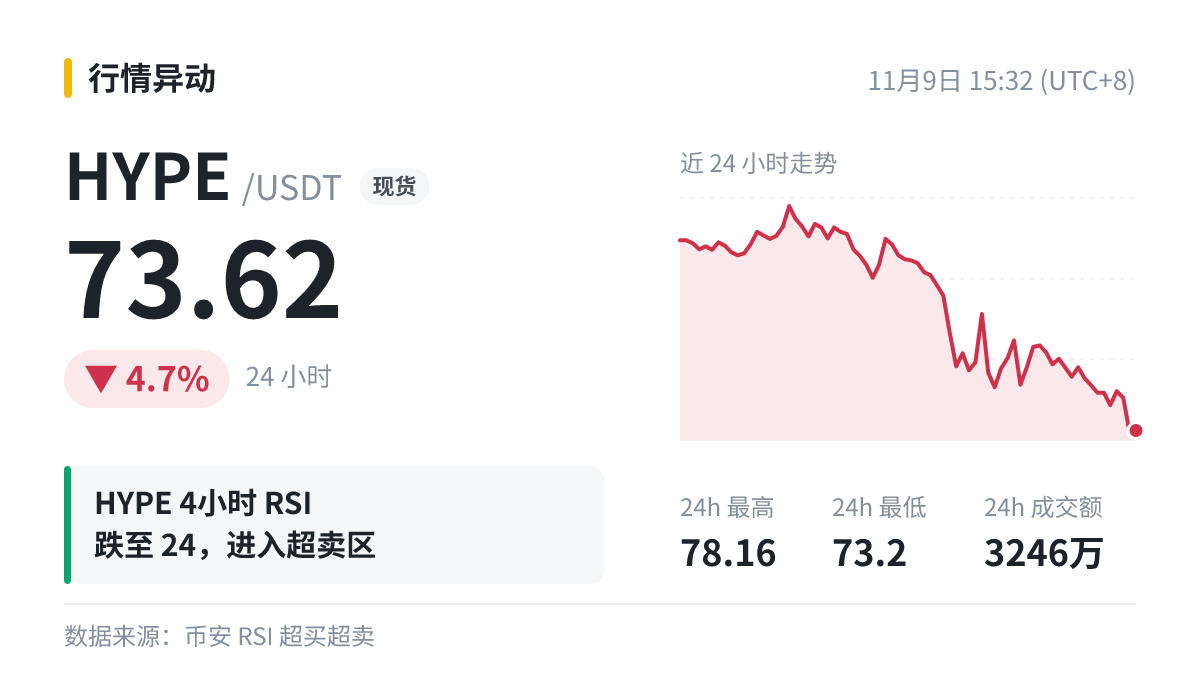
Something that just happened: $HYPE 4-hour RSI 23.7.
An oversold RSI is like your wallet before payday: everyone knows it’ll eventually recover, but nobody can say how many more days you’ll have to wait.
Indicators are for reference, not switches; in the end, it’s the price itself that matters.
#HYPE
Something that just happened: $HYPE 4-hour RSI 23.7.
An oversold RSI is like your wallet before payday: everyone knows it’ll eventually recover, but nobody can say how many more days you’ll have to wait.
Indicators are for reference, not switches; in the end, it’s the price itself that matters.
#HYPE
An oversold RSI is like your wallet before payday: everyone knows it’ll eventually recover, but nobody can say how many more days you’ll have to wait.
Indicators are for reference, not switches; in the end, it’s the price itself that matters.
#HYPE
2
·
--
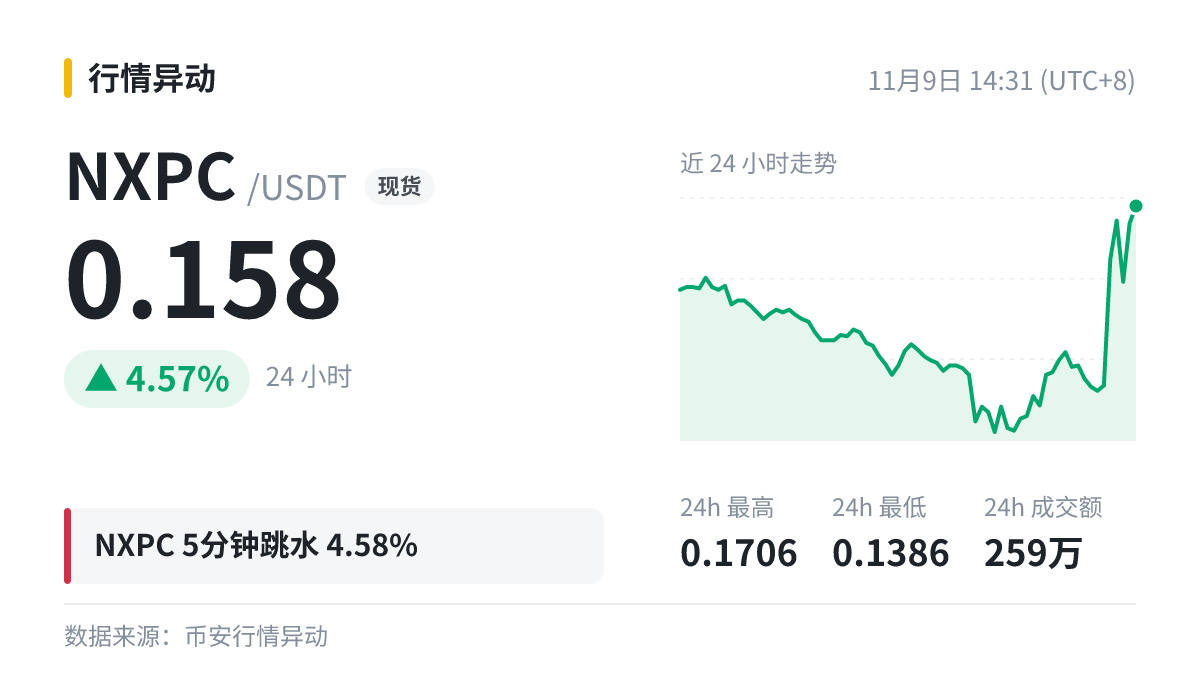
I just took a quick look at the market—$NXPC fell 4.58% in 5 minutes.
Don't sell just because it drops, and don't go all in to buy the dip at the first sign of a drop.
I just took a quick look at the market—$NXPC fell 4.58% in 5 minutes.
Don't sell just because it drops, and don't go all in to buy the dip at the first sign of a drop.
Don't sell just because it drops, and don't go all in to buy the dip at the first sign of a drop.
4
·
--
$HANA 15 minutes -10.78%.
One bearish candlestick down, and lunch went from adding a chicken leg to plain white rice 🍜 Be wary of a high-volume drop, and don't let your guard down with a slow, low-volume decline either—neither is a signal that the price has bottomed out.
#HANA
$HANA 15 minutes -10.78%.
One bearish candlestick down, and lunch went from adding a chicken leg to plain white rice 🍜 Be wary of a high-volume drop, and don't let your guard down with a slow, low-volume decline either—neither is a signal that the price has bottomed out.
#HANA
One bearish candlestick down, and lunch went from adding a chicken leg to plain white rice 🍜 Be wary of a high-volume drop, and don't let your guard down with a slow, low-volume decline either—neither is a signal that the price has bottomed out.
#HANA
31
·
--
🔥 $HANA hits a 30-day high of 0.01761, surpassing the previous high of 0.0169.
This move has some momentum. Whether it can hold steady after the rally matters more than how much it has risen. Would you chase at this level?
#HANA
🔥 $HANA hits a 30-day high of 0.01761, surpassing the previous high of 0.0169.
This move has some momentum. Whether it can hold steady after the rally matters more than how much it has risen. Would you chase at this level?
#HANA
This move has some momentum. Whether it can hold steady after the rally matters more than how much it has risen. Would you chase at this level?
#HANA
28
·
--
$AIOT broke through 0.15.
A whole-number milestone is like a whole number on the scale: before crossing it, you look forward to it every day; after crossing it, you worry every day about falling back.
Everyone here, did you make money today—or lose sleep?
#AIOT
$AIOT broke through 0.15.
A whole-number milestone is like a whole number on the scale: before crossing it, you look forward to it every day; after crossing it, you worry every day about falling back.
Everyone here, did you make money today—or lose sleep?
#AIOT
A whole-number milestone is like a whole number on the scale: before crossing it, you look forward to it every day; after crossing it, you worry every day about falling back.
Everyone here, did you make money today—or lose sleep?
#AIOT
41
·
--
$UAI 5 minutes, down 14.31%; 24h: -39.3%.
To be honest, what I care about most now isn’t how much it goes up, but avoiding a major mistake.
#UAI
$UAI 5 minutes, down 14.31%; 24h: -39.3%.
To be honest, what I care about most now isn’t how much it goes up, but avoiding a major mistake.
#UAI
To be honest, what I care about most now isn’t how much it goes up, but avoiding a major mistake.
#UAI
46
·
--
The jokester weighs in: $AVAX The daily chart has fallen below MA200.
A typical conversation between trend followers and short-term traders: “The trend has turned bearish.” “So what’s next?” “You’ll have to ask the market.”
Moving averages are always a bit slow to react. Don’t expect them to catch the exact highs and lows.
#AVAX
The jokester weighs in: $AVAX The daily chart has fallen below MA200.
A typical conversation between trend followers and short-term traders: “The trend has turned bearish.” “So what’s next?” “You’ll have to ask the market.”
Moving averages are always a bit slow to react. Don’t expect them to catch the exact highs and lows.
#AVAX
A typical conversation between trend followers and short-term traders: “The trend has turned bearish.” “So what’s next?” “You’ll have to ask the market.”
Moving averages are always a bit slow to react. Don’t expect them to catch the exact highs and lows.
#AVAX
74
Log in to explore more content
Join global crypto users on Binance Square
⚡️ Get latest and useful information about crypto.
💬 Trusted by the world’s largest crypto exchange.
👍 Discover real insights from verified creators.
Email / Phone number
Trending Topics
CPITestsDecemberRateOutlook
691,804 views
3,062 Discussing
October CPI Seen Up 0.3%, Keeping Fed on Course for December Rate Increase
Binance News
·1 Likes
·849 views
NvidiaInvestigatesAfterHuang’sAffairApology
245,384 views
1,970 Discussing
AnthropicRejectsIPODelayValuationinQuestion
58,481 views
553 Discussing