
Lâm Đồng
42 Posts

Lâm Đồng
High-Frequency Trader
5.7 Years
9 Following
19 Followers
86 Liked
Posts
All
Quotes
$BTC Current price: 103.876 USDT
Just approached the EMA50 region (103.744) and is close to EMA100 (104.329) – a significant resistance area.
Strong recovery from the low of 100.372, increasing nearly 3,500 USDT in 12 hours.
Signals from indicators:
EMA50 & EMA100: Price just touched EMA50 but has not yet surpassed EMA100.
If it breaks through 104.329 (EMA100), it will trigger additional buying pressure → confirming short-term upward momentum.
MACD: Strong positive MACD Histogram, MACD line clearly crossing upwards → distinct recovery trend.
However, due to continuous increases, there is a risk of being overbought in the short term.
Volume:
Volume is maintaining quite well, supporting the upward trend.
However, stronger volume is needed to effectively break the 104.3–105 area.
Market sentiment: 77.44% choose Buy → indicating that the market is quite enthusiastic.
However, this could be a short-term profit-taking area if EMA100 is not broken.
Just approached the EMA50 region (103.744) and is close to EMA100 (104.329) – a significant resistance area.
Strong recovery from the low of 100.372, increasing nearly 3,500 USDT in 12 hours.
Signals from indicators:
EMA50 & EMA100: Price just touched EMA50 but has not yet surpassed EMA100.
If it breaks through 104.329 (EMA100), it will trigger additional buying pressure → confirming short-term upward momentum.
MACD: Strong positive MACD Histogram, MACD line clearly crossing upwards → distinct recovery trend.
However, due to continuous increases, there is a risk of being overbought in the short term.
Volume:
Volume is maintaining quite well, supporting the upward trend.
However, stronger volume is needed to effectively break the 104.3–105 area.
Market sentiment: 77.44% choose Buy → indicating that the market is quite enthusiastic.
However, this could be a short-term profit-taking area if EMA100 is not broken.

$BTC Important technical milestones:
• Short-term resistance: 103.700 → EMA50
• Stronger resistance: 104.300 – 104.800 → EMA100 + old sideways zone
• Nearest support: 102.800 – 101.500
Market signals:
• 83.26% choose "Buy" → market sentiment is optimistic after a strong rebound.
• However, entering a strong resistance zone, so caution is needed regarding the potential for price rejection.
Conclusion:
• BTC is in a technical rebound after a deep dump.
• However, it has approached the resistance zone → need to wait for a reaction to confirm whether to continue rising or adjust.
• Prioritize staying out or taking profit if already Long, do not Long new positions at this zone without clear breakout signals.
• Short-term resistance: 103.700 → EMA50
• Stronger resistance: 104.300 – 104.800 → EMA100 + old sideways zone
• Nearest support: 102.800 – 101.500
Market signals:
• 83.26% choose "Buy" → market sentiment is optimistic after a strong rebound.
• However, entering a strong resistance zone, so caution is needed regarding the potential for price rejection.
Conclusion:
• BTC is in a technical rebound after a deep dump.
• However, it has approached the resistance zone → need to wait for a reaction to confirm whether to continue rising or adjust.
• Prioritize staying out or taking profit if already Long, do not Long new positions at this zone without clear breakout signals.

$BTC • Current price: 106,250 USDT
• Change in 24h: +0.84%
• Highest price in 24h: 106,400.00 USDT (touched)
• Lowest price in 24h: 103,659.88 USDT
• Trading volume increase: 13,835 BTC / 1.45B USDT
Detailed analysis:
1. Moving Average (EMA):
• EMA(50): ~104,892 USDT
• EMA(100): ~105,218 USDT
The current price exceeds both EMA50 and EMA100, indicating that a short-term uptrend has formed. This is a strong bullish signal.
2. MACD Indicator:
• MACD: 220.93 (Strongly Positive)
• DIF: 305.19
• DEA: 84.26
Very positive signals:
• MACD crosses above the signal line (DEA)
• The distance between the two lines is widening → Clear bullish signal
• Buying pressure is dominating
3. Trading Volume:
• Volume has surged, confirming the uptrend.
4. Price Pattern:
• Could form a breakout pattern from the previous accumulation zone.
• Just touched the resistance level near 106,400 and was temporarily rejected.
5. Important support & resistance zones:
• Nearest resistance: 106,400 (has been tested)
• Next resistance: ~107,911
• Near support: 105,218 (EMA100) and 104,892 (EMA50)
• Stronger support: ~103,903
Proposed strategy:
If you are in a BUY position:
• Short-term take profit: ~106,900 - 107,900
• Move SL (stop loss) up: to the area of 105,000 to secure profits
• Warning: There may be a slight adjustment due to just testing resistance
If you have not entered a position:
• Wait for a pullback to near support: 105,200 – 105,500 to enter a buy order
• Cut loss: below 104,800 if the price breaks through EMA50
Market sentiment:
• Buying pressure is absolutely dominant (99.05% according to the market sentiment bar below)
• Be cautious of the possibility of a short-term “bull trap” if it cannot break through 106,400 in the next few sessions
• Change in 24h: +0.84%
• Highest price in 24h: 106,400.00 USDT (touched)
• Lowest price in 24h: 103,659.88 USDT
• Trading volume increase: 13,835 BTC / 1.45B USDT
Detailed analysis:
1. Moving Average (EMA):
• EMA(50): ~104,892 USDT
• EMA(100): ~105,218 USDT
The current price exceeds both EMA50 and EMA100, indicating that a short-term uptrend has formed. This is a strong bullish signal.
2. MACD Indicator:
• MACD: 220.93 (Strongly Positive)
• DIF: 305.19
• DEA: 84.26
Very positive signals:
• MACD crosses above the signal line (DEA)
• The distance between the two lines is widening → Clear bullish signal
• Buying pressure is dominating
3. Trading Volume:
• Volume has surged, confirming the uptrend.
4. Price Pattern:
• Could form a breakout pattern from the previous accumulation zone.
• Just touched the resistance level near 106,400 and was temporarily rejected.
5. Important support & resistance zones:
• Nearest resistance: 106,400 (has been tested)
• Next resistance: ~107,911
• Near support: 105,218 (EMA100) and 104,892 (EMA50)
• Stronger support: ~103,903
Proposed strategy:
If you are in a BUY position:
• Short-term take profit: ~106,900 - 107,900
• Move SL (stop loss) up: to the area of 105,000 to secure profits
• Warning: There may be a slight adjustment due to just testing resistance
If you have not entered a position:
• Wait for a pullback to near support: 105,200 – 105,500 to enter a buy order
• Cut loss: below 104,800 if the price breaks through EMA50
Market sentiment:
• Buying pressure is absolutely dominant (99.05% according to the market sentiment bar below)
• Be cautious of the possibility of a short-term “bull trap” if it cannot break through 106,400 in the next few sessions

$BTC whales are short, you guys are all their people, if they liquidate now, that money still belongs to them. If a real whale is trading, they will divide many accounts to trade, not stupid enough to show it for me to get slaughtered. Only we can lose money, while that whale wins, it goes back to them, and if they lose, it also goes back to them.

$BTC • Current price: 104,326.50 USDT
• 24h change: +0.07%
• Highest price 24h: 105,935.63 USDT
• Lowest price 24h: 103,857.14 USDT
• 24h trading volume: ~12,821 BTC / 1.35 billion USDT
Technical analysis:
1. Moving average (EMA):
• EMA(50): ~104,782 USDT
• EMA(100): ~105,274 USDT
=> The current price is below both EMA50 and EMA100, indicating that the short-term downtrend still prevails. However, the price is approaching EMA50, a reaction or technical rebound may occur.
2. MACD indicator:
• MACD: -135.17 (below 0) → Downtrend
• DIF: -89.59
• DEA: 45.58
=> MACD shows strong downward momentum, the MACD line is below the signal line (DEA), indicating that selling pressure remains high. However, the gap is narrowing, with signs of convergence → a slight reversal signal or rebound may be imminent.
3. Trading volume (Volume):
• There is a slight increase in the most recent green candle → buying pressure is reacting at the support area around 103,752 USDT.
4. Candle structure & price area:
• Strong support: ~103,643 - 103,752 USDT
• Nearby resistance: ~104,782 USDT (EMA50), ~105,274 USDT (EMA100)
• The latest candle is a green candle → indicating a return of buying pressure, possibly a technical rebound.
Conclusion & Suggested strategy:
Short-term trend: Down
Current signal: Light technical rebound from support
📌 Suggested strategy:
• Short-term trading:
• Buy zone: around the support area 103,700 - 104,000 USDT
• Short profit target: 104,700 - 105,200 USDT
• Cut loss if it breaks: 103,500 USDT
• Wait for longer-term buy: if the price adjusts deeper to the area of 102,000 - 100,000 USDT (if BTC continues to drop following the macro trend).
• 24h change: +0.07%
• Highest price 24h: 105,935.63 USDT
• Lowest price 24h: 103,857.14 USDT
• 24h trading volume: ~12,821 BTC / 1.35 billion USDT
Technical analysis:
1. Moving average (EMA):
• EMA(50): ~104,782 USDT
• EMA(100): ~105,274 USDT
=> The current price is below both EMA50 and EMA100, indicating that the short-term downtrend still prevails. However, the price is approaching EMA50, a reaction or technical rebound may occur.
2. MACD indicator:
• MACD: -135.17 (below 0) → Downtrend
• DIF: -89.59
• DEA: 45.58
=> MACD shows strong downward momentum, the MACD line is below the signal line (DEA), indicating that selling pressure remains high. However, the gap is narrowing, with signs of convergence → a slight reversal signal or rebound may be imminent.
3. Trading volume (Volume):
• There is a slight increase in the most recent green candle → buying pressure is reacting at the support area around 103,752 USDT.
4. Candle structure & price area:
• Strong support: ~103,643 - 103,752 USDT
• Nearby resistance: ~104,782 USDT (EMA50), ~105,274 USDT (EMA100)
• The latest candle is a green candle → indicating a return of buying pressure, possibly a technical rebound.
Conclusion & Suggested strategy:
Short-term trend: Down
Current signal: Light technical rebound from support
📌 Suggested strategy:
• Short-term trading:
• Buy zone: around the support area 103,700 - 104,000 USDT
• Short profit target: 104,700 - 105,200 USDT
• Cut loss if it breaks: 103,500 USDT
• Wait for longer-term buy: if the price adjusts deeper to the area of 102,000 - 100,000 USDT (if BTC continues to drop following the macro trend).
$BTC Current price: 104,400.00 USDT
🔍 Key indicators:
• EMA(50): ~105,038
• EMA(100): ~104,939
→ The current price is below both EMA50 and EMA100 → Short-term bearish signal.
•MACD:
•MACD: -97.02 (negative zone)
•DIF: -132.24, DEA: -35.22
→ The MACD line crosses below the signal line → Sell signal.
•Volume:
•There is an increase in volume in recent red candles → Strong selling pressure.
•Fibonacci Retracement (levels around 104,123 - 105,935):
•The price has bounced down from the Fibonacci 0.618 zone (~105,935) and is approaching the 0.382 zone (~104,123)
→ This is a strong support area, if broken will easily drop to the 103,600 - 103,700 range.
Liquidation map
•Many long positions were liquidated around the ~105,500 - 106,000 mark
→ This is a strong resistance area due to many orders being “swept.”
Strong liquidation support in the 103,800 - 104,000 range
→ Many short positions are placed below this area, which could create buying pressure if the price drops here → potential support area.
🔍 Key indicators:
• EMA(50): ~105,038
• EMA(100): ~104,939
→ The current price is below both EMA50 and EMA100 → Short-term bearish signal.
•MACD:
•MACD: -97.02 (negative zone)
•DIF: -132.24, DEA: -35.22
→ The MACD line crosses below the signal line → Sell signal.
•Volume:
•There is an increase in volume in recent red candles → Strong selling pressure.
•Fibonacci Retracement (levels around 104,123 - 105,935):
•The price has bounced down from the Fibonacci 0.618 zone (~105,935) and is approaching the 0.382 zone (~104,123)
→ This is a strong support area, if broken will easily drop to the 103,600 - 103,700 range.
Liquidation map
•Many long positions were liquidated around the ~105,500 - 106,000 mark
→ This is a strong resistance area due to many orders being “swept.”
Strong liquidation support in the 103,800 - 104,000 range
→ Many short positions are placed below this area, which could create buying pressure if the price drops here → potential support area.
$BTC Current price: 104.**** USDT.
• EMA(50): 104.800 – very close to the current price.
• EMA(100): 105.380,58 – above the current price.
• Conclusion: The price is between EMA50 and EMA100 => the market shows signs of recovery, but there is still pressure from EMA100.
2. Support and resistance levels
• Nearest support: ~103.068 (the nearest bottom).
• Nearest resistance: ~105.866 (24h high), close to EMA100.
• If it surpasses 105.380 → the possibility of retesting 105.866 and further to 106.051.
3. MACD indicator
• MACD histogram is positive but has just started to narrow → the upward momentum shows signs of slowing down.
• DIF (147.23) < DEA (199.15) → a bearish crossover may be forming.
4. Trading volume
• Current volume is at an average level → not strong enough to confirm an upward trend.
5. Market sentiment
• Sell ratio accounts for 76.24%, buy only 23.76% → market sentiment still leans towards the selling side.
Proposed trading strategy
✳️ In case you want to enter a buy order:
• Entry point: Wait for confirmation of the price clearly surpassing EMA100 (~105.380) with increasing volume.
• Stop loss: Below support level 103.000 (for example: 102.800).
• Take profit: 106.000 → 107.700 (the next resistance zones).
🔻 In case you want to enter a sell order:
• Entry point: If the price is rejected at EMA100 and breaks below 104.300.
• Stop loss: Above 105.400 (EMA100).
• Take profit: 103.000 → 102.700.
⸻
📌 Conclusion:
• The market is in a weak recovery phase after the decline.
• The strong trend is unclear as EMA50 and EMA100 have not confirmed the "Golden Cross."
• Priority strategy: wait for a clear breakout or confirmation signal before entering a trade.
• EMA(50): 104.800 – very close to the current price.
• EMA(100): 105.380,58 – above the current price.
• Conclusion: The price is between EMA50 and EMA100 => the market shows signs of recovery, but there is still pressure from EMA100.
2. Support and resistance levels
• Nearest support: ~103.068 (the nearest bottom).
• Nearest resistance: ~105.866 (24h high), close to EMA100.
• If it surpasses 105.380 → the possibility of retesting 105.866 and further to 106.051.
3. MACD indicator
• MACD histogram is positive but has just started to narrow → the upward momentum shows signs of slowing down.
• DIF (147.23) < DEA (199.15) → a bearish crossover may be forming.
4. Trading volume
• Current volume is at an average level → not strong enough to confirm an upward trend.
5. Market sentiment
• Sell ratio accounts for 76.24%, buy only 23.76% → market sentiment still leans towards the selling side.
Proposed trading strategy
✳️ In case you want to enter a buy order:
• Entry point: Wait for confirmation of the price clearly surpassing EMA100 (~105.380) with increasing volume.
• Stop loss: Below support level 103.000 (for example: 102.800).
• Take profit: 106.000 → 107.700 (the next resistance zones).
🔻 In case you want to enter a sell order:
• Entry point: If the price is rejected at EMA100 and breaks below 104.300.
• Stop loss: Above 105.400 (EMA100).
• Take profit: 103.000 → 102.700.
⸻
📌 Conclusion:
• The market is in a weak recovery phase after the decline.
• The strong trend is unclear as EMA50 and EMA100 have not confirmed the "Golden Cross."
• Priority strategy: wait for a clear breakout or confirmation signal before entering a trade.

$BTC I have been in this market for almost 5 years now. I swear if I recover all the money I lost, I will delete the app immediately. It's too manipulated; everyone knows that, but I keep trying to recover. It's probably time to delete the app. If anyone doesn't have capital, just delete the app.
So let's go short there and then place the long order there, as if saying.
Quoted content has been removed
So, for those who follow this doctor, this doctor says that BTC will soar to 108k or 110k, surely there are quite a few new players following along.

SimsonMai
·
--
$BTC might fly back to the range of 108-110k.
The Long Short ratio is about to balance.
Brothers, let's short a bit more strongly.
The Long Short ratio is about to balance.
Brothers, let's short a bit more strongly.
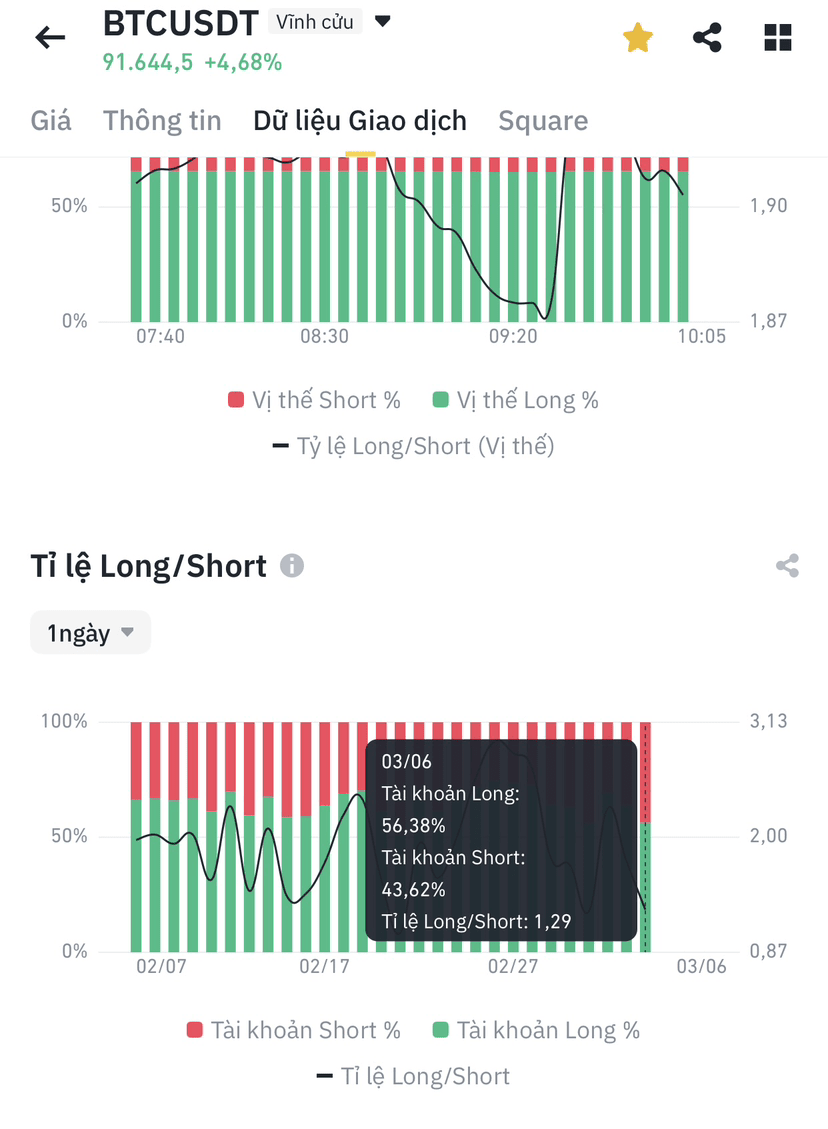
The net is swept, my friend, I dug in and finished eating, my shorts are askew.

Đại Thiếu Gia 1996
·
--
$SEI I wonder if it scans this area, bros. I'm planning to hold this a bit, can you guys give me your opinions?
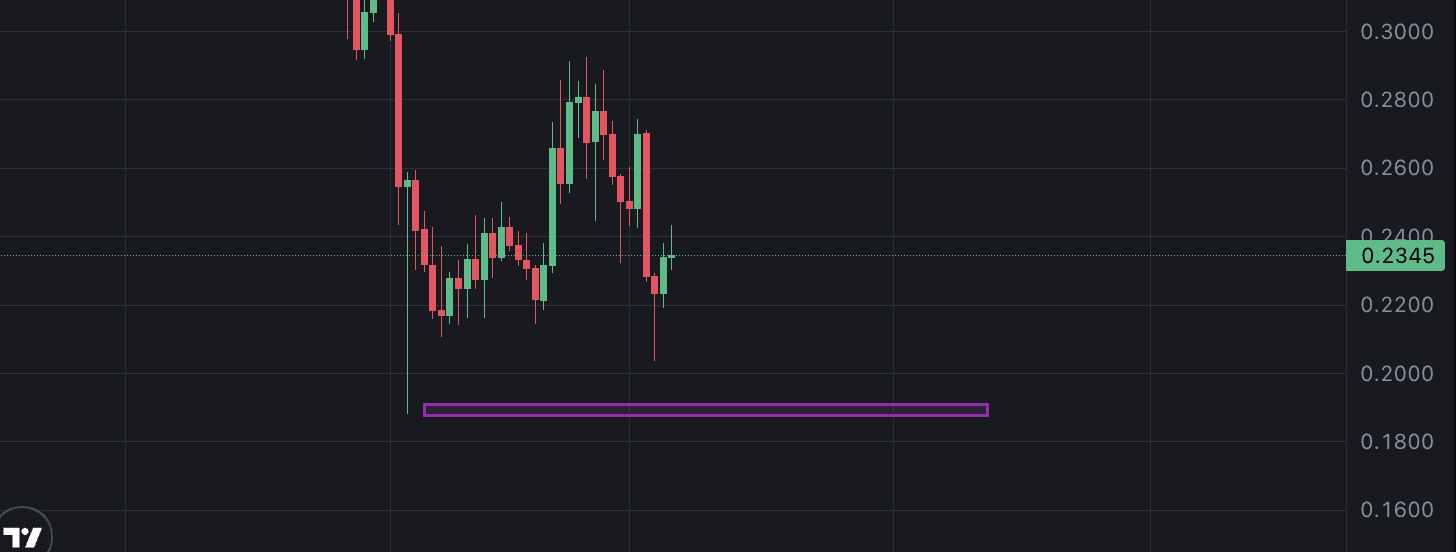
If it rises to 108 110k then invite you to long and show the deviation up, sir
SimsonMai
·
--
$BTC might fly back to the range of 108-110k.
The Long Short ratio is about to balance.
Brothers, let's short a bit more strongly.
The Long Short ratio is about to balance.
Brothers, let's short a bit more strongly.
I don't understand how to make judgments based on this, but okay, let's go and then burn.
SimsonMai
·
--
$BTC might fly back to the range of 108-110k.
The Long Short ratio is about to balance.
Brothers, let's short a bit more strongly.
The Long Short ratio is about to balance.
Brothers, let's short a bit more strongly.
Don't cut, just hold on, I will also come in early like you, 5 off, here at BTC 90

Anh NV
·
--
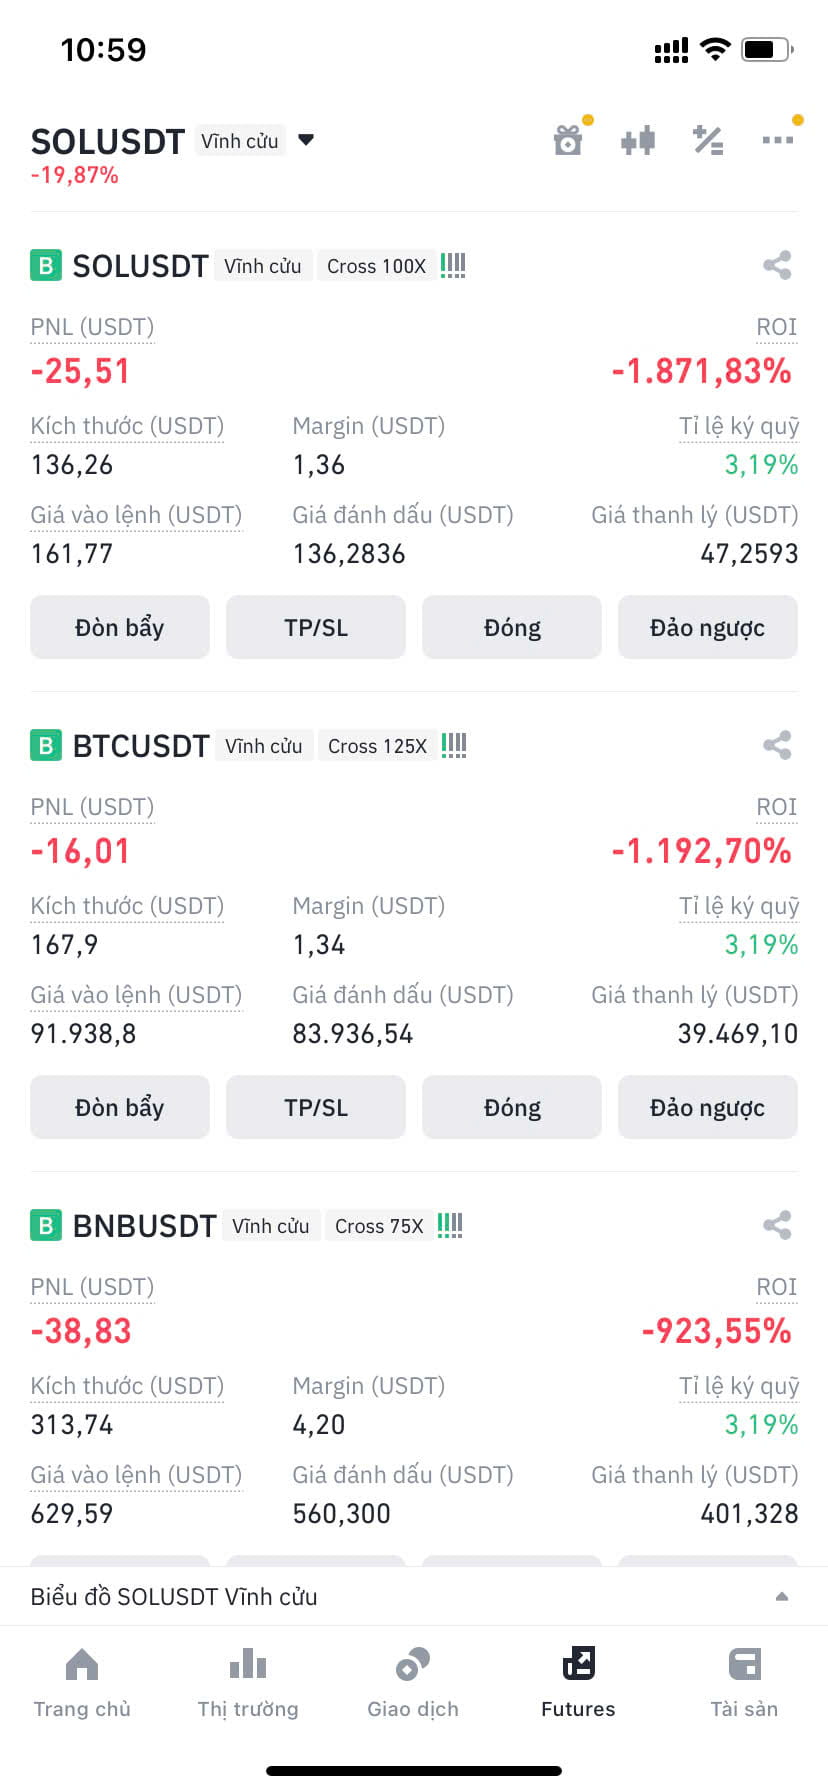
Bearish🤩🤩🤩 It's shaking a lot, everyone. I don't understand why when I short it goes up and when I long it drops drastically. Do you have any signals for me to follow to recover?
$BTC $SOL $BNB
$BTC $SOL $BNB
Increase the dragon, sir kkk

Hoàn vốn 2000 đố lờ
·
--
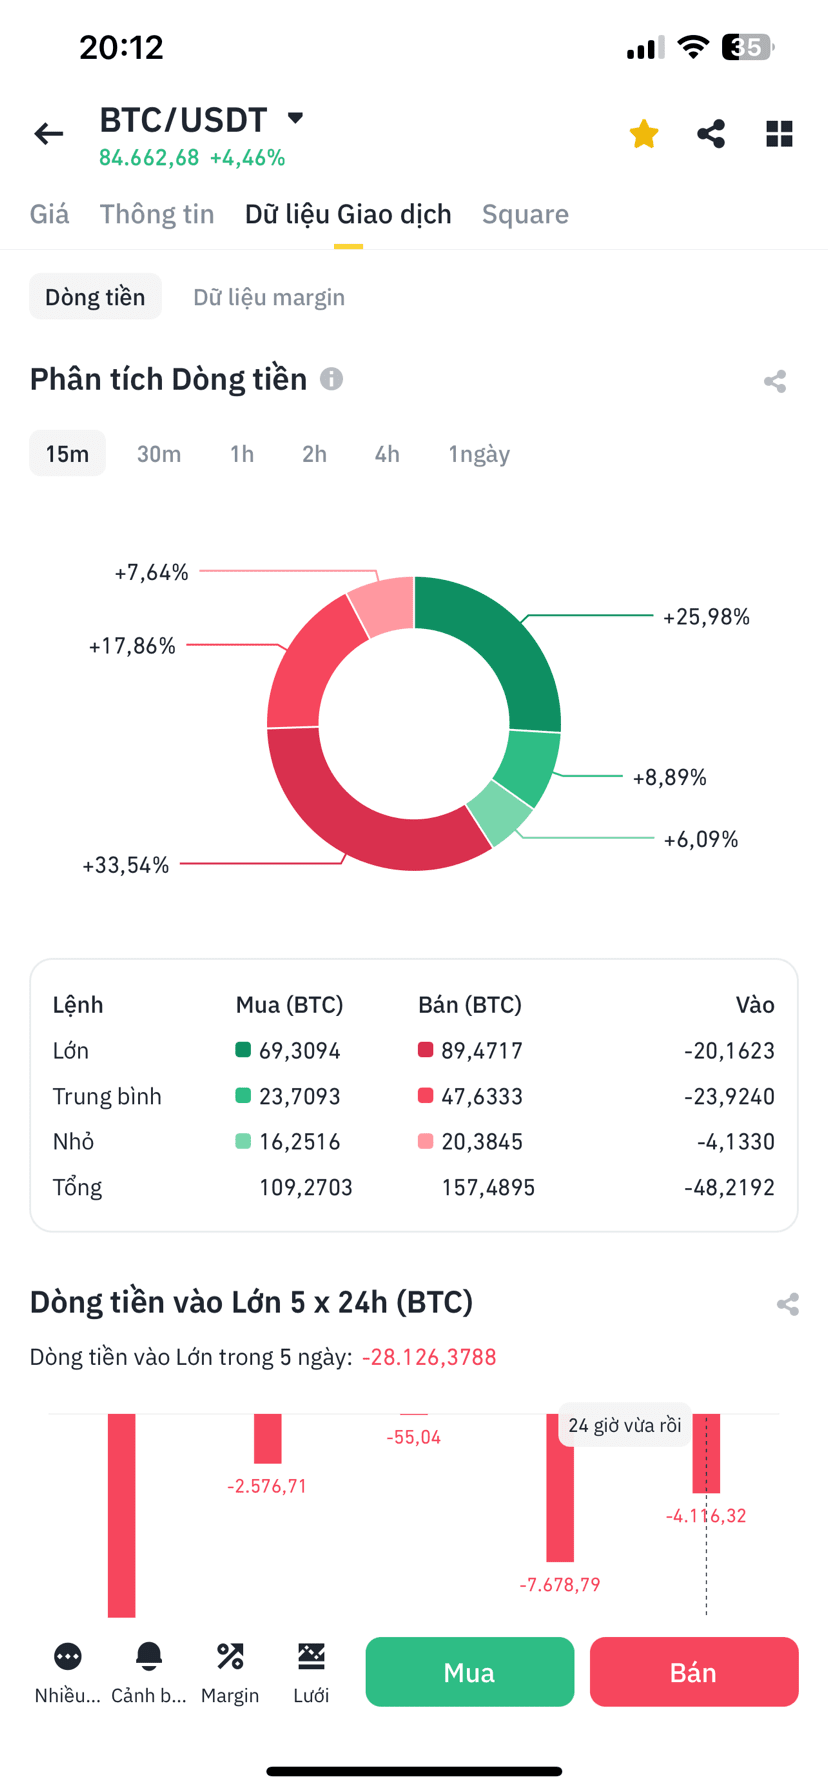
Is this platform self-play? Watching for 15 minutes always in the negative while the price increases :)))
Playing this, losing 10% at level 1 and losing 100% at level 2. Losing 10% can be easily recovered that day, but losing 100% will make you psychologically afraid of burning out, so it's hard to recover that 100%. Sorry to hear that 😞
Donald Castanado zhWL
·
--
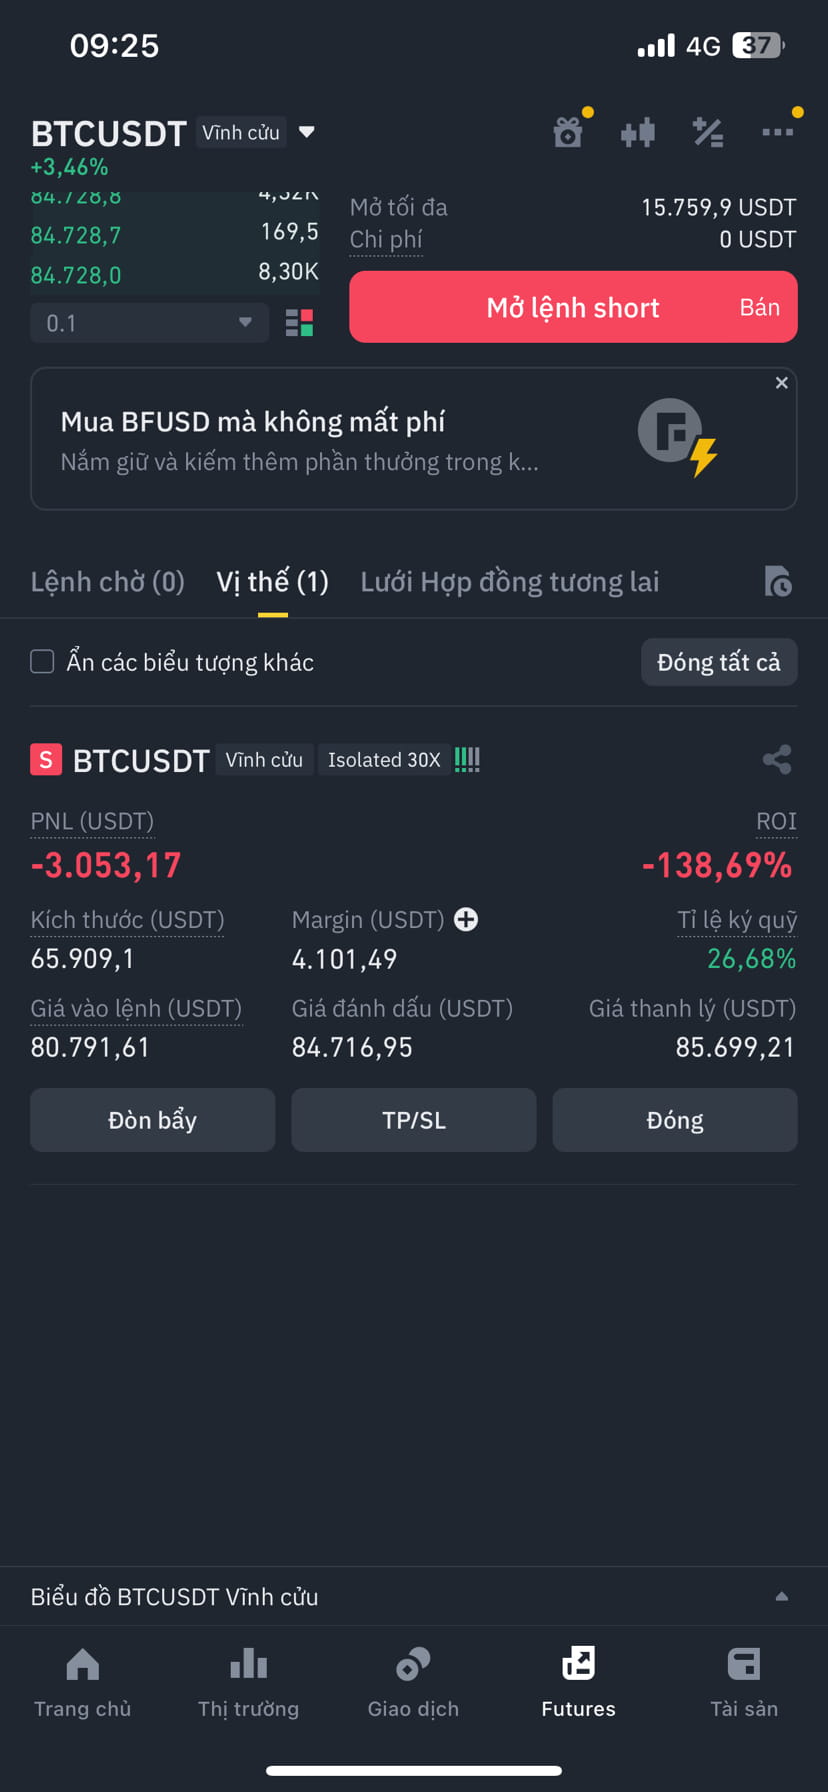
Hey, can you give me some advice? Should I cut it or add more? It’s about 500$ in the end.
Log in to explore more content