

SKY- 254
98 Posts

SKY- 254
turn market waves into winning trades with a dash of strategy and a sprinkle of daring. 🌊🚀
62 Following
173 Followers
73 Liked
Posts
All
Quotes




CaptainAltcoin
·
--
XRP Price Hits the Level We’ve Waited Months for – Two Paths Forward
XRP price is recovering fairly well along with the broader market in the past 24‑48 hours. The token now trades above $1.19 after bouncing from lows near $1.05 over the weekend.
A lot of crypto traders are updating their XRP price outlooks. Most of them are guessing. But CasiTrades is among the high‑quality ones. She just updated her XRP price prediction with a clear, rules‑based analysis.
She called the exact support level months ago. XRP hit it perfectly. Now she lays out two paths forward.
CasiTrades: The Level We’ve Waited Months For
CasiTrades posted an update today. She said XRP finally hit the major .786 macro support level at $1.09 on Coinbase – exactly where she had been waiting for it to land. The daily chart is respecting that level cleanly so far.
Now all attention turns to how price reacts.
She named two resistance levels to watch: $1.19 and $1.27. Both keep the larger correction structure alive. If those hold, a deeper move down toward the $0.90 support zone (which aligns with the 0.854 Fibonacci level) remains possible.
But if XRP shows real strength and pushes through those resistance levels, then the market could be building a new trend instead of preparing for another leg lower.
Her final point: this is the most important moment of the entire correction. The target support has been reached. Now everyone watches what happens next.
CasiTrades’ XRP Chart Analysis: .786 Macro Support in Focus
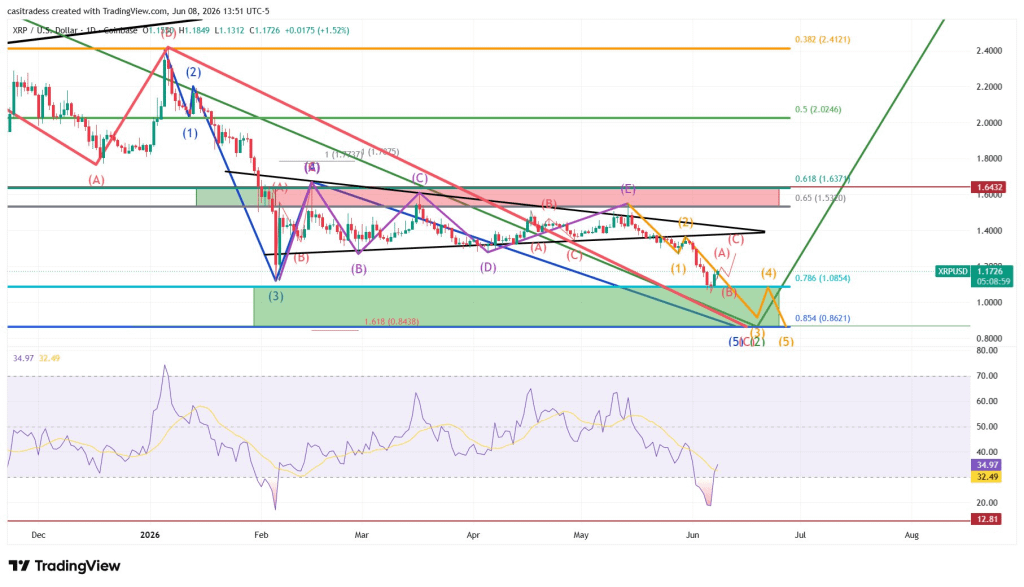
The attached TradingView chart from CasiTrades shows XRP/USD on the daily timeframe (Coinbase). The chart dates from early May to June 8, 2026.
The most prominent feature is the horizontal line drawn at $1.09, marked as the .786 macro support level. Price action on June 6 and June 7 printed lows right around that line. The daily candles show wicks touching $1.09 and closing higher, confirming that buyers stepped in exactly at that level.
Source: X/@CasiTrades
From there, XRP bounced toward the $1.19 resistance area. The chart labels $1.19 as the first key resistance that keeps the larger correction alive. Above that, $1.27 is the second resistance level.
The chart also shows a lower Fibonacci extension zone near $0.8438 (1.618) and $0.854 (0.782). CasiTrades references $0.90 as a possible deeper low if the bounce fails. That zone aligns with the .854 level on her chart.
The overall structure on the daily timeframe is a descending channel or a corrective pullback from higher levels. The bounce off .786 support is technically significant. But the trend remains down until price clears $1.19 and $1.27 convincingly.
Read also: Here’s the XRP Price if the US and Iran Sign a Peace Deal in June
XRP Price Prediction for Today (From Our Daily PP)
XRP followed a path similar to Cardano over the weekend. Ripple’s token found support around $1.05 on Saturday and has since recovered toward $1.17.
A closer look at the XRP chart shows that $1.18 has acted as resistance since June 4. Price tested that area again yesterday. Another rejection remains possible before buyers attempt another breakout.
Here is the current indicator breakdown for XRP:
RSI (14): 58.6 – Buy signal. Positive momentum remains intact.
STOCH (9,6): 35.519 – Sell signal. Short‑term pullbacks remain possible.
ADX (14): 20.921 – Sell signal. Current trend lacks strong conviction.
CCI (14): 21.7929 – Neutral. Market remains balanced.
As we mentioned in our daily XRP price prediction, here are the possible scenarios:
Bullish scenario: XRP price needs to break above the $1.18 resistance level. A successful breakout could open the door for a move toward $1.20 before the day ends.
Neutral scenario: Continued resistance at $1.18 could keep XRP trading between $1.14 and $1.17 throughout today’s session.
Bearish scenario: A break below $1.14 would weaken the current structure and could push Ripple’s token toward $1.12.
XRP News: Formal Verification and the Clarity Act
Two pieces of XRP‑related news could affect price in the coming days.
First, RippleX, in collaboration with research firm Common Prefix, is applying formal mathematical verification to the XRP Ledger’s new native DeFi protocols – the Lending Protocol and Single Asset Vaults. This method, common in aerospace and banking, constructs proofs to ensure protocol safety under all conditions. It catches edge cases missed by standard testing. For institutions, this level of rigor matters.
Second, a senior White House official indicated significant behind‑the‑scenes progress on the Digital Asset Market Clarity Act (H.R. 3633). The bill passed the Senate Banking Committee on May 14, 2026, and is now on the Senate calendar. Negotiations are focused on DeFi safe harbors and stablecoin provisions.
If the bill passes, it would provide a federal market framework for digital assets. XRP, as a digital commodity with clear regulatory standing, stands to benefit.
Our Take: Two Clear Paths, One Decision Point
CasiTrades laid out the two paths correctly. The bounce off $1.09 .786 support is technically sound. But the daily trend remains fragile.
The RSI at 58.6 supports further upside, but the ADX at 20.92 shows weak trend strength. XRP needs a daily close above $1.19 to confirm that the correction is over. Below that, the $0.90‑$1.00 zone remains a live target.
For traders, the risk‑reward favors waiting for a clean break above $1.19 before adding long positions. For long‑term holders, the $1.09‑$1.14 area offers a reasonable entry.
FAQs
How does the Clarity Act affect XRP
It would establish a federal market framework for digital assets. XRP is already classified as a digital commodity, so clear rules could accelerate institutional adoption.
Where will XRP price go next
Path one: resistance at $1.19 and $1.27 holds, leading to a deeper low toward $0.90. Path two: XRP breaks resistance, builds a new trend, and avoids that deeper low.
Why isn’t XRP pumping
XRP isn’t pumping because, like most cryptocurrencies, its price is still tightly correlated with Bitcoin’s recent downturn, and the token is struggling with significant supply pressure from Ripple’s monthly escrow releases and persistent whale selling. On top of that, key bullish narratives (such as Ripple’s long-anticipated IPO and growth in the XRP Ledger’s tokenized asset market) have either stalled or shown recent declines, failing to generate enough buying demand to break through heavy technical resistance around $1.18-$1.28.
Subscribe to our YouTube channel for daily crypto updates, market insights, and expert analysis.
The post XRP Price Hits the Level We’ve Waited Months For – Two Paths Forward appeared first on CaptainAltcoin.
A lot of crypto traders are updating their XRP price outlooks. Most of them are guessing. But CasiTrades is among the high‑quality ones. She just updated her XRP price prediction with a clear, rules‑based analysis.
She called the exact support level months ago. XRP hit it perfectly. Now she lays out two paths forward.
CasiTrades: The Level We’ve Waited Months For
CasiTrades posted an update today. She said XRP finally hit the major .786 macro support level at $1.09 on Coinbase – exactly where she had been waiting for it to land. The daily chart is respecting that level cleanly so far.
Now all attention turns to how price reacts.
She named two resistance levels to watch: $1.19 and $1.27. Both keep the larger correction structure alive. If those hold, a deeper move down toward the $0.90 support zone (which aligns with the 0.854 Fibonacci level) remains possible.
But if XRP shows real strength and pushes through those resistance levels, then the market could be building a new trend instead of preparing for another leg lower.
Her final point: this is the most important moment of the entire correction. The target support has been reached. Now everyone watches what happens next.
CasiTrades’ XRP Chart Analysis: .786 Macro Support in Focus
The attached TradingView chart from CasiTrades shows XRP/USD on the daily timeframe (Coinbase). The chart dates from early May to June 8, 2026.
The most prominent feature is the horizontal line drawn at $1.09, marked as the .786 macro support level. Price action on June 6 and June 7 printed lows right around that line. The daily candles show wicks touching $1.09 and closing higher, confirming that buyers stepped in exactly at that level.
Source: X/@CasiTrades
From there, XRP bounced toward the $1.19 resistance area. The chart labels $1.19 as the first key resistance that keeps the larger correction alive. Above that, $1.27 is the second resistance level.
The chart also shows a lower Fibonacci extension zone near $0.8438 (1.618) and $0.854 (0.782). CasiTrades references $0.90 as a possible deeper low if the bounce fails. That zone aligns with the .854 level on her chart.
The overall structure on the daily timeframe is a descending channel or a corrective pullback from higher levels. The bounce off .786 support is technically significant. But the trend remains down until price clears $1.19 and $1.27 convincingly.
Read also: Here’s the XRP Price if the US and Iran Sign a Peace Deal in June
XRP Price Prediction for Today (From Our Daily PP)
XRP followed a path similar to Cardano over the weekend. Ripple’s token found support around $1.05 on Saturday and has since recovered toward $1.17.
A closer look at the XRP chart shows that $1.18 has acted as resistance since June 4. Price tested that area again yesterday. Another rejection remains possible before buyers attempt another breakout.
Here is the current indicator breakdown for XRP:
RSI (14): 58.6 – Buy signal. Positive momentum remains intact.
STOCH (9,6): 35.519 – Sell signal. Short‑term pullbacks remain possible.
ADX (14): 20.921 – Sell signal. Current trend lacks strong conviction.
CCI (14): 21.7929 – Neutral. Market remains balanced.
As we mentioned in our daily XRP price prediction, here are the possible scenarios:
Bullish scenario: XRP price needs to break above the $1.18 resistance level. A successful breakout could open the door for a move toward $1.20 before the day ends.
Neutral scenario: Continued resistance at $1.18 could keep XRP trading between $1.14 and $1.17 throughout today’s session.
Bearish scenario: A break below $1.14 would weaken the current structure and could push Ripple’s token toward $1.12.
XRP News: Formal Verification and the Clarity Act
Two pieces of XRP‑related news could affect price in the coming days.
First, RippleX, in collaboration with research firm Common Prefix, is applying formal mathematical verification to the XRP Ledger’s new native DeFi protocols – the Lending Protocol and Single Asset Vaults. This method, common in aerospace and banking, constructs proofs to ensure protocol safety under all conditions. It catches edge cases missed by standard testing. For institutions, this level of rigor matters.
Second, a senior White House official indicated significant behind‑the‑scenes progress on the Digital Asset Market Clarity Act (H.R. 3633). The bill passed the Senate Banking Committee on May 14, 2026, and is now on the Senate calendar. Negotiations are focused on DeFi safe harbors and stablecoin provisions.
If the bill passes, it would provide a federal market framework for digital assets. XRP, as a digital commodity with clear regulatory standing, stands to benefit.
Our Take: Two Clear Paths, One Decision Point
CasiTrades laid out the two paths correctly. The bounce off $1.09 .786 support is technically sound. But the daily trend remains fragile.
The RSI at 58.6 supports further upside, but the ADX at 20.92 shows weak trend strength. XRP needs a daily close above $1.19 to confirm that the correction is over. Below that, the $0.90‑$1.00 zone remains a live target.
For traders, the risk‑reward favors waiting for a clean break above $1.19 before adding long positions. For long‑term holders, the $1.09‑$1.14 area offers a reasonable entry.
FAQs
How does the Clarity Act affect XRP
It would establish a federal market framework for digital assets. XRP is already classified as a digital commodity, so clear rules could accelerate institutional adoption.
Where will XRP price go next
Path one: resistance at $1.19 and $1.27 holds, leading to a deeper low toward $0.90. Path two: XRP breaks resistance, builds a new trend, and avoids that deeper low.
Why isn’t XRP pumping
XRP isn’t pumping because, like most cryptocurrencies, its price is still tightly correlated with Bitcoin’s recent downturn, and the token is struggling with significant supply pressure from Ripple’s monthly escrow releases and persistent whale selling. On top of that, key bullish narratives (such as Ripple’s long-anticipated IPO and growth in the XRP Ledger’s tokenized asset market) have either stalled or shown recent declines, failing to generate enough buying demand to break through heavy technical resistance around $1.18-$1.28.
Subscribe to our YouTube channel for daily crypto updates, market insights, and expert analysis.
The post XRP Price Hits the Level We’ve Waited Months For – Two Paths Forward appeared first on CaptainAltcoin.
SKY- 254
·
--
$XRP
Idk why m thinking this but just gotta share it anyway,
What if we’ve all been reading it wrong?
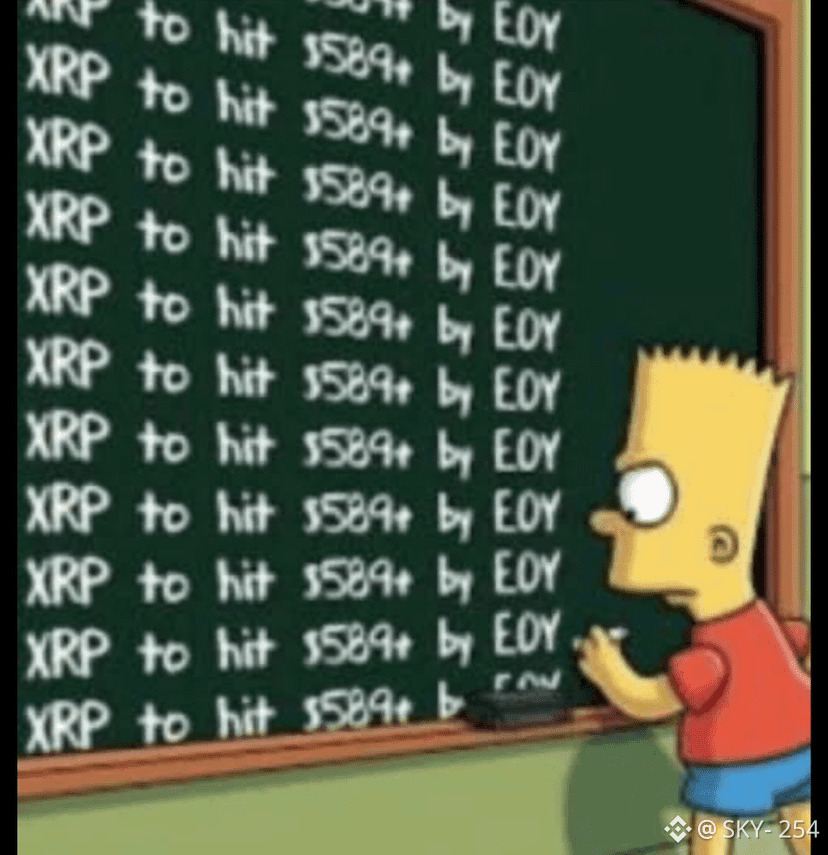
EOY ≠ End Of Year.
EOY = Economy of Yuan or Yen
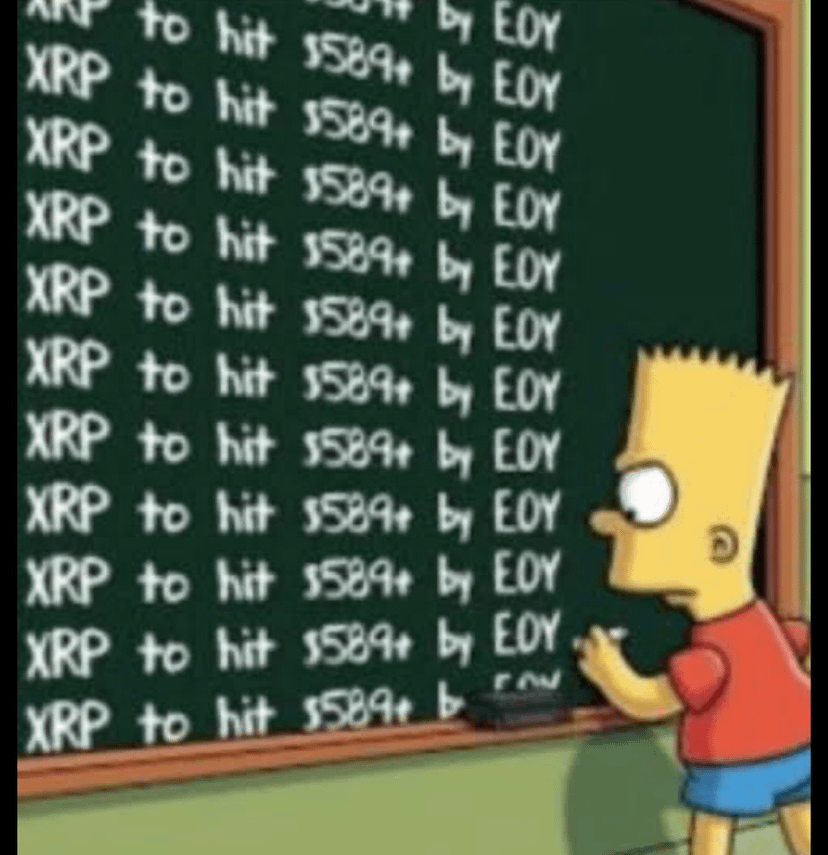
Maybe “$589 XRP by EOY” was never a date prediction… it was a macroeconomic trigger hidden in plain sight.
If XRP ever becomes a bridge asset between major monetary systems, the clock isn’t measuring time—it’s measuring adoption.
🤔 #XRP #Ripple
Idk why m thinking this but just gotta share it anyway,
What if we’ve all been reading it wrong?
EOY ≠ End Of Year.
EOY = Economy of Yuan or Yen
Maybe “$589 XRP by EOY” was never a date prediction… it was a macroeconomic trigger hidden in plain sight.
If XRP ever becomes a bridge asset between major monetary systems, the clock isn’t measuring time—it’s measuring adoption.
🤔 #XRP #Ripple


BlockchainBaller
·
--
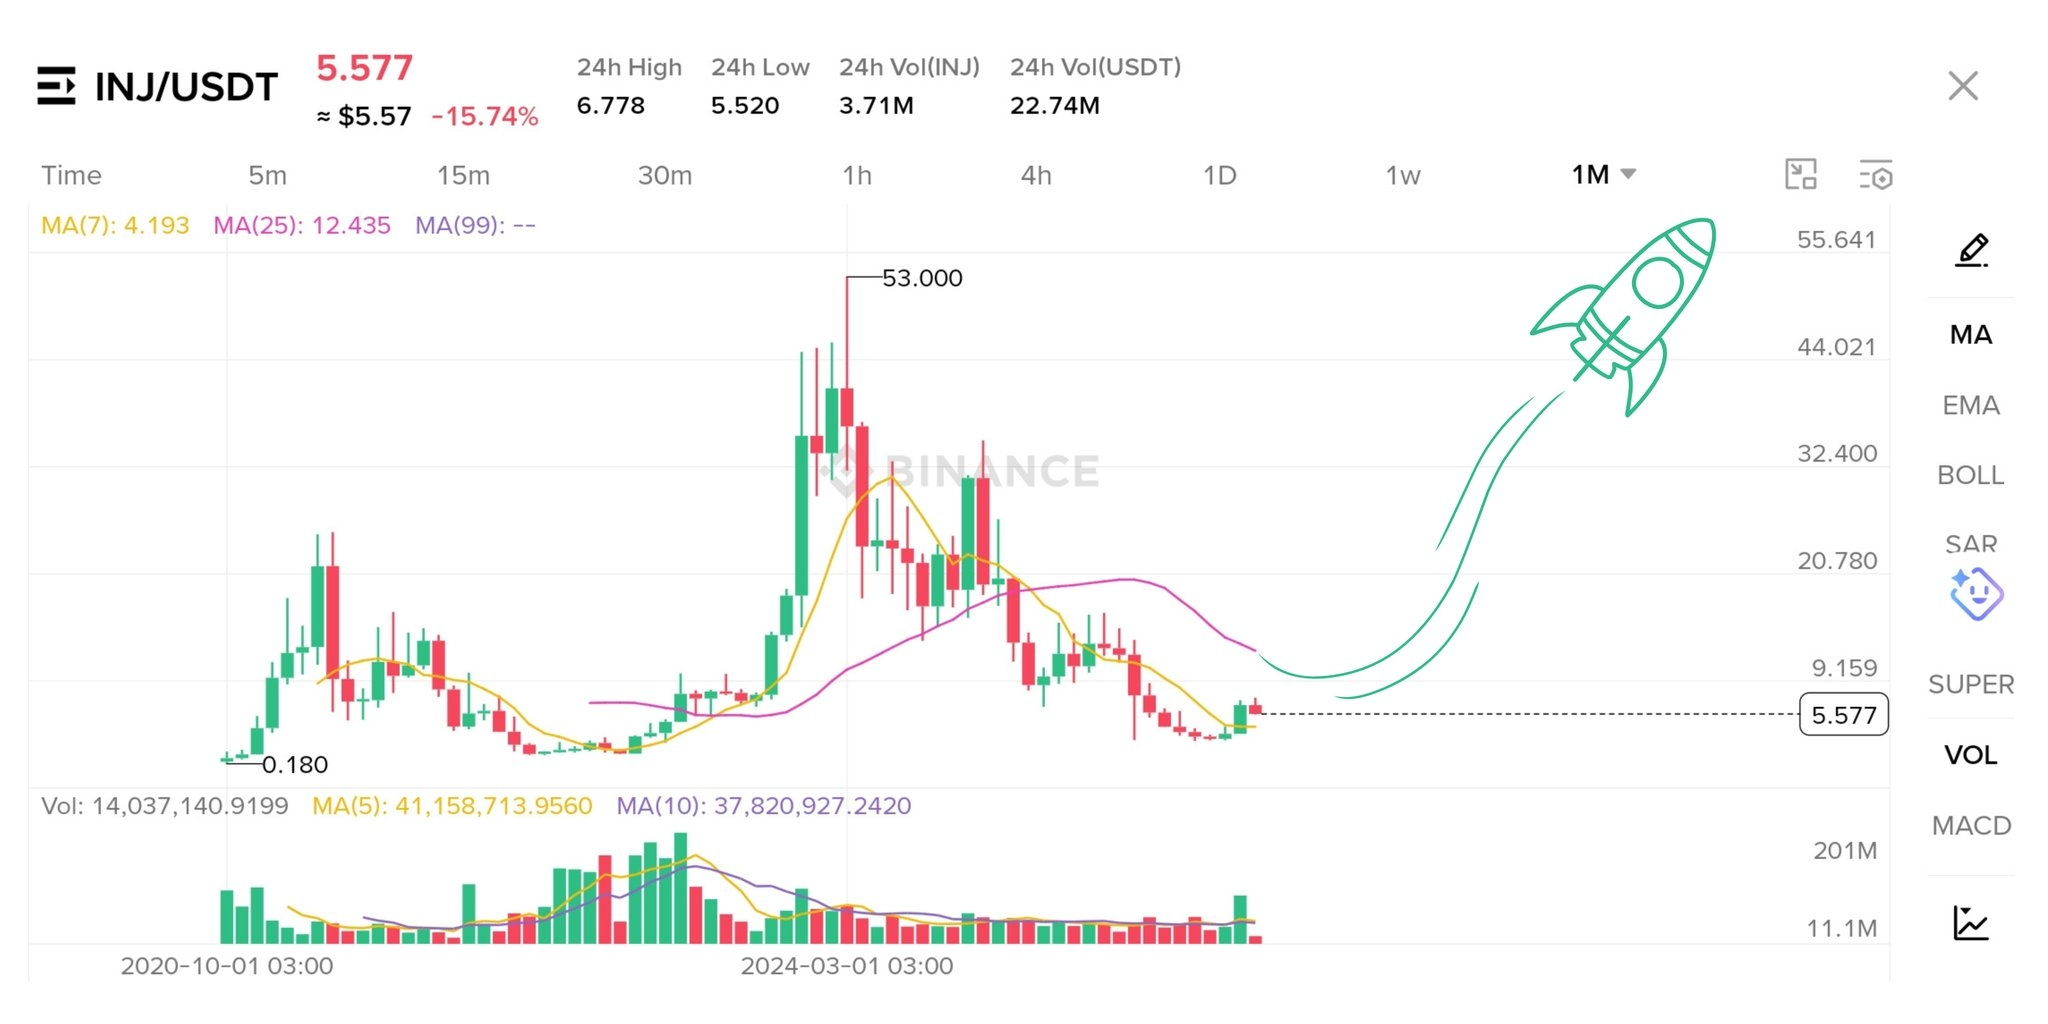
$INJ 's repeating one of the cleanest cycles I've seen.
From $0.18 → $25 (over 13k% gain), followed by a brutal 95%+ correction.
Then did the same thing after the 2024 parabolic run.. massive rally → 95%+ Wipeout.
Now, we’re sitting at ~$5.57 with volume starting to pick up.
History doesn’t repeat… but it often rhymes.
Are we entering the third leg up for #INJ ? Drop your thoughts 👇
From $0.18 → $25 (over 13k% gain), followed by a brutal 95%+ correction.
Then did the same thing after the 2024 parabolic run.. massive rally → 95%+ Wipeout.
Now, we’re sitting at ~$5.57 with volume starting to pick up.
History doesn’t repeat… but it often rhymes.
Are we entering the third leg up for #INJ ? Drop your thoughts 👇
Log in to explore more content