

cyberman
431 Posts

cyberman
Report
Block User
Frequent Trader
5.6 Years
17 Following
61 Followers
87 Liked
Posts
All
Quotes
Videos
·
--
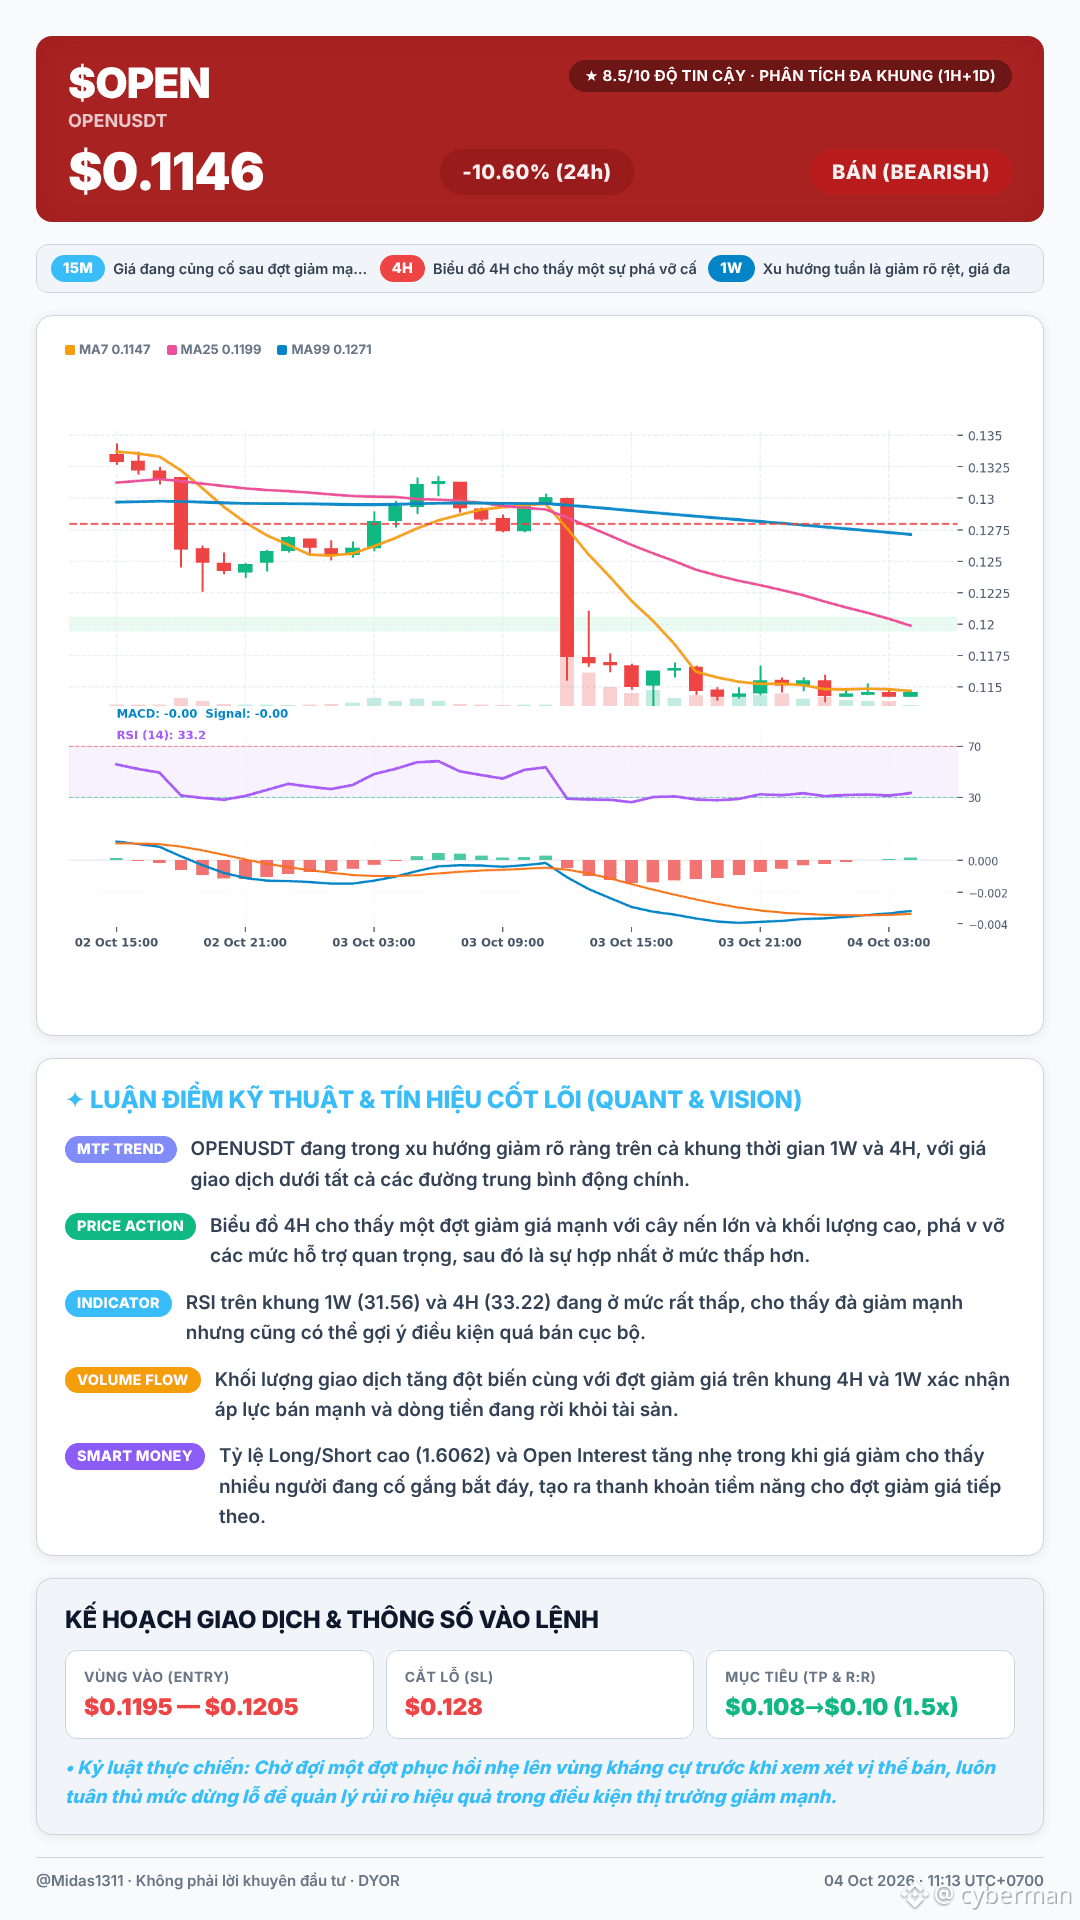
Just look at the chart of $OPEN —it gives me chills, guys 😏. It’s been dropping hard; it’s exactly the kind of move we’ve been waiting for so they can scoop up the over-saturated supply.
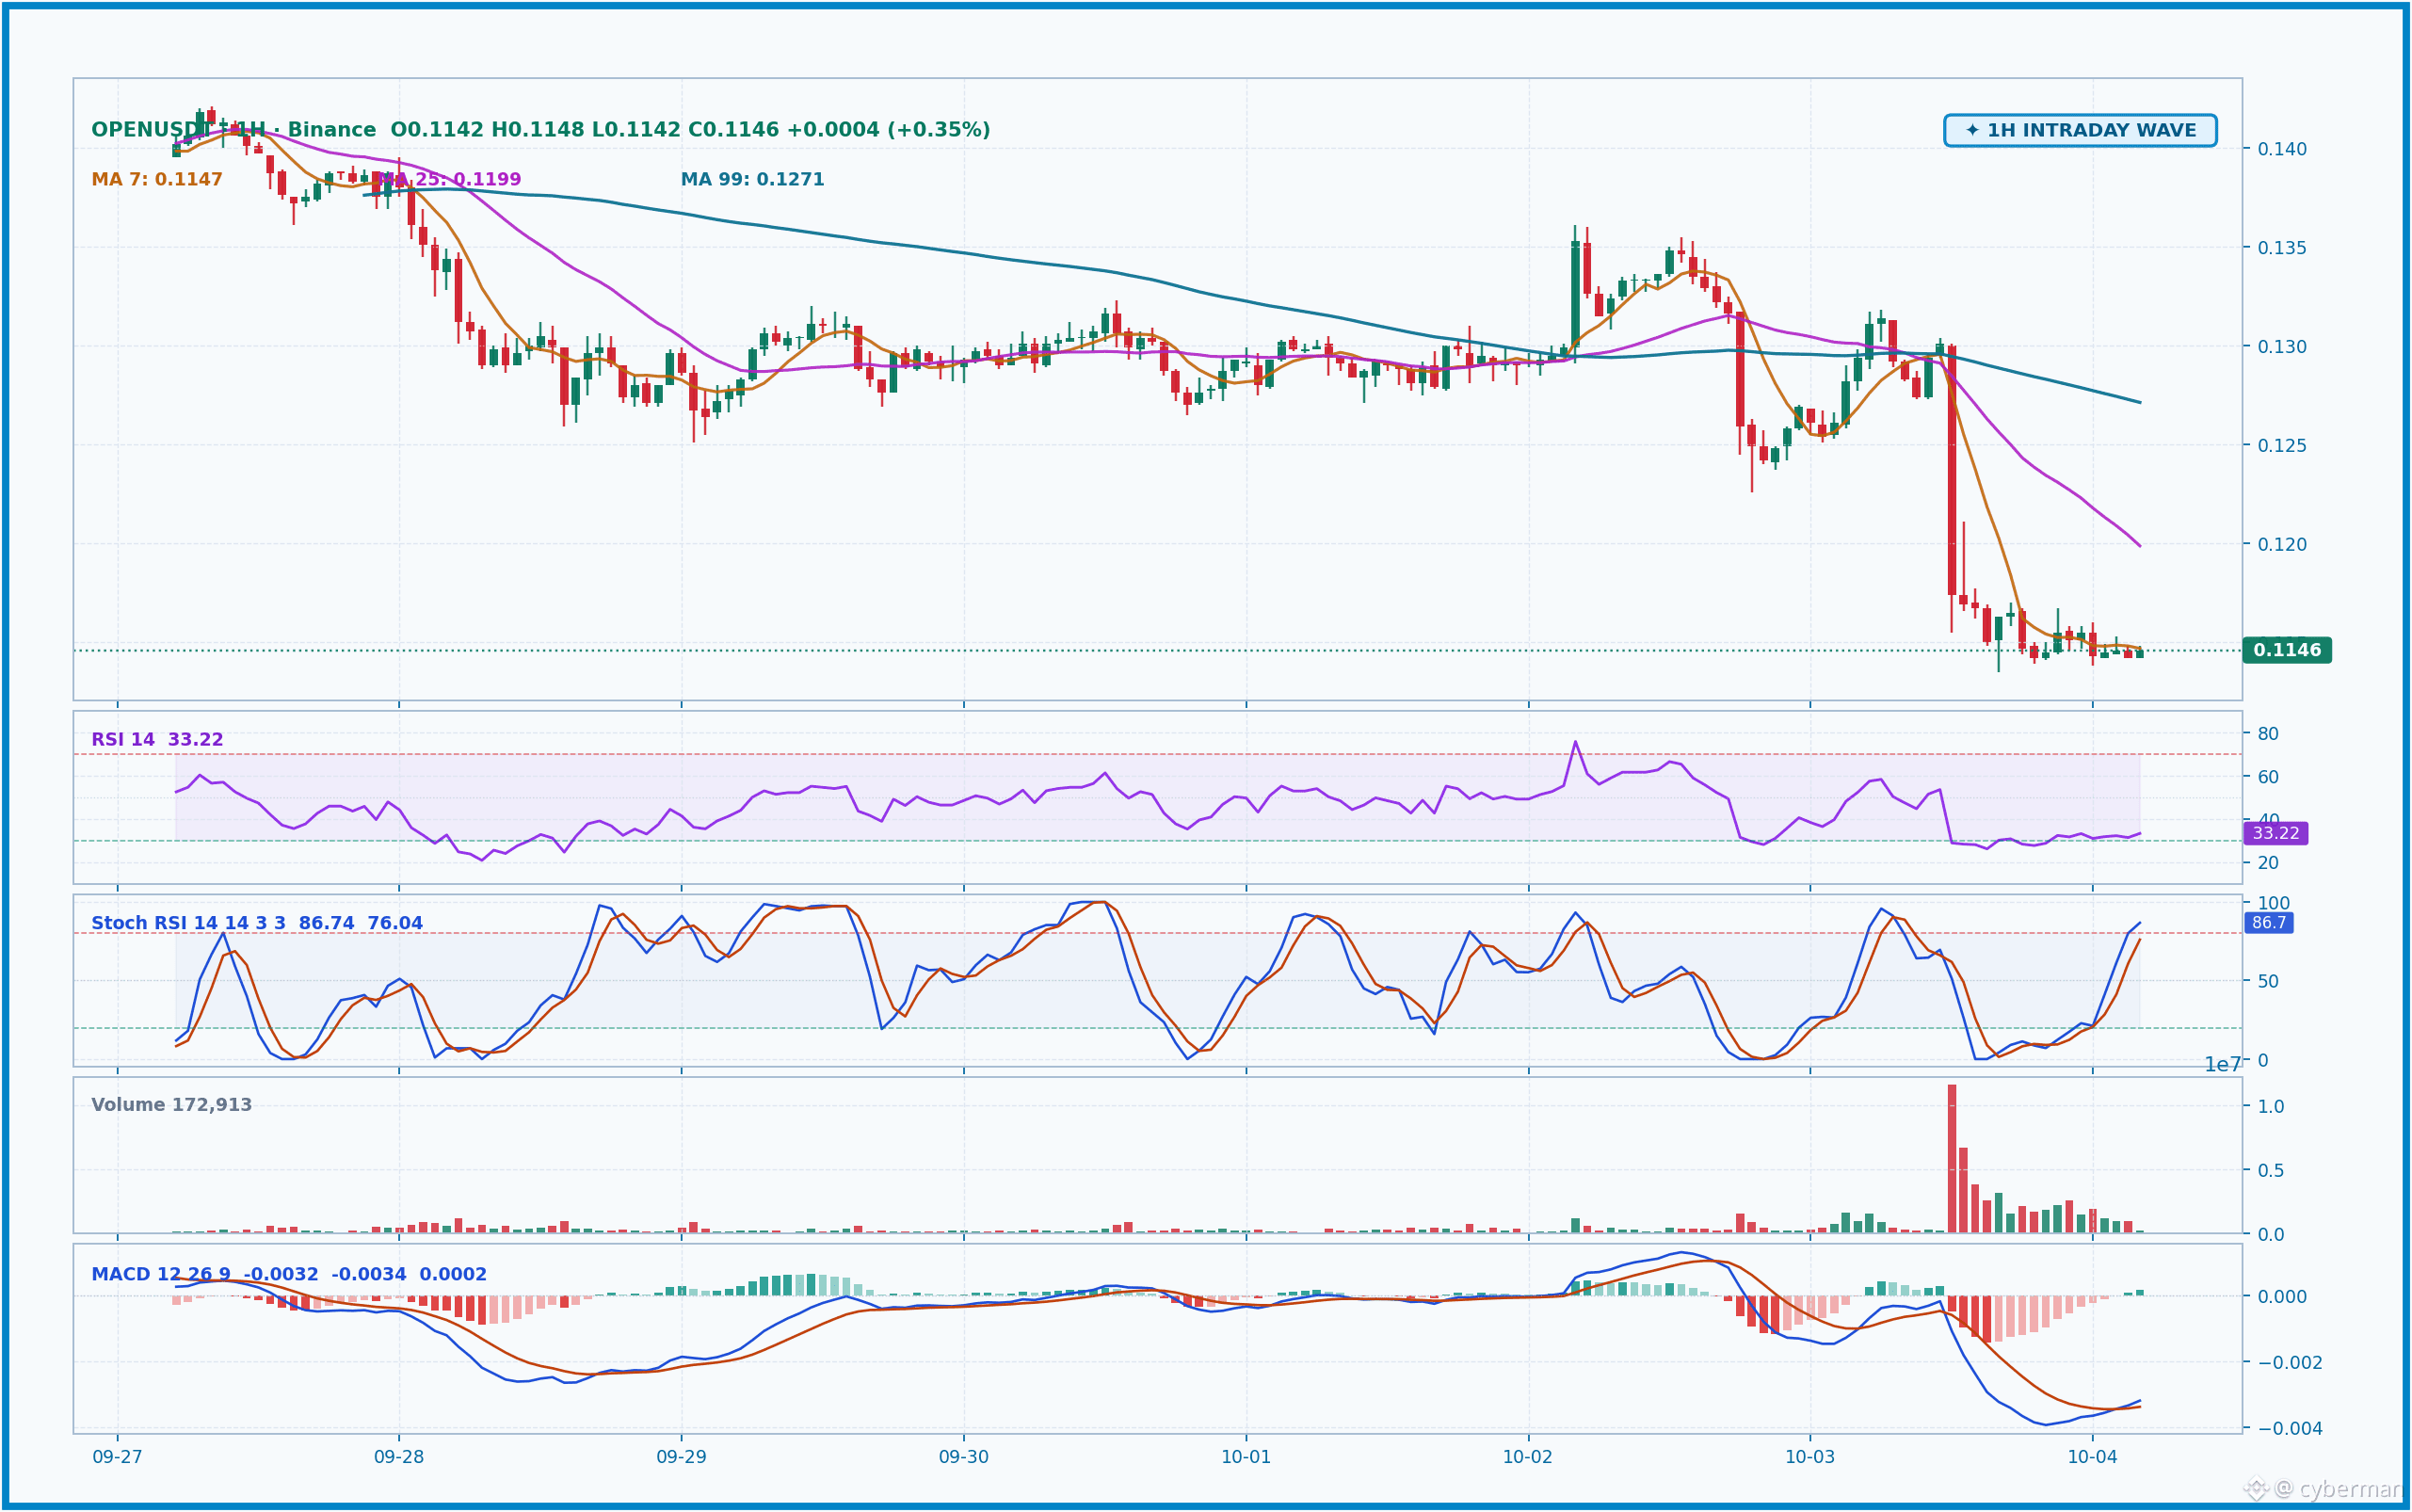
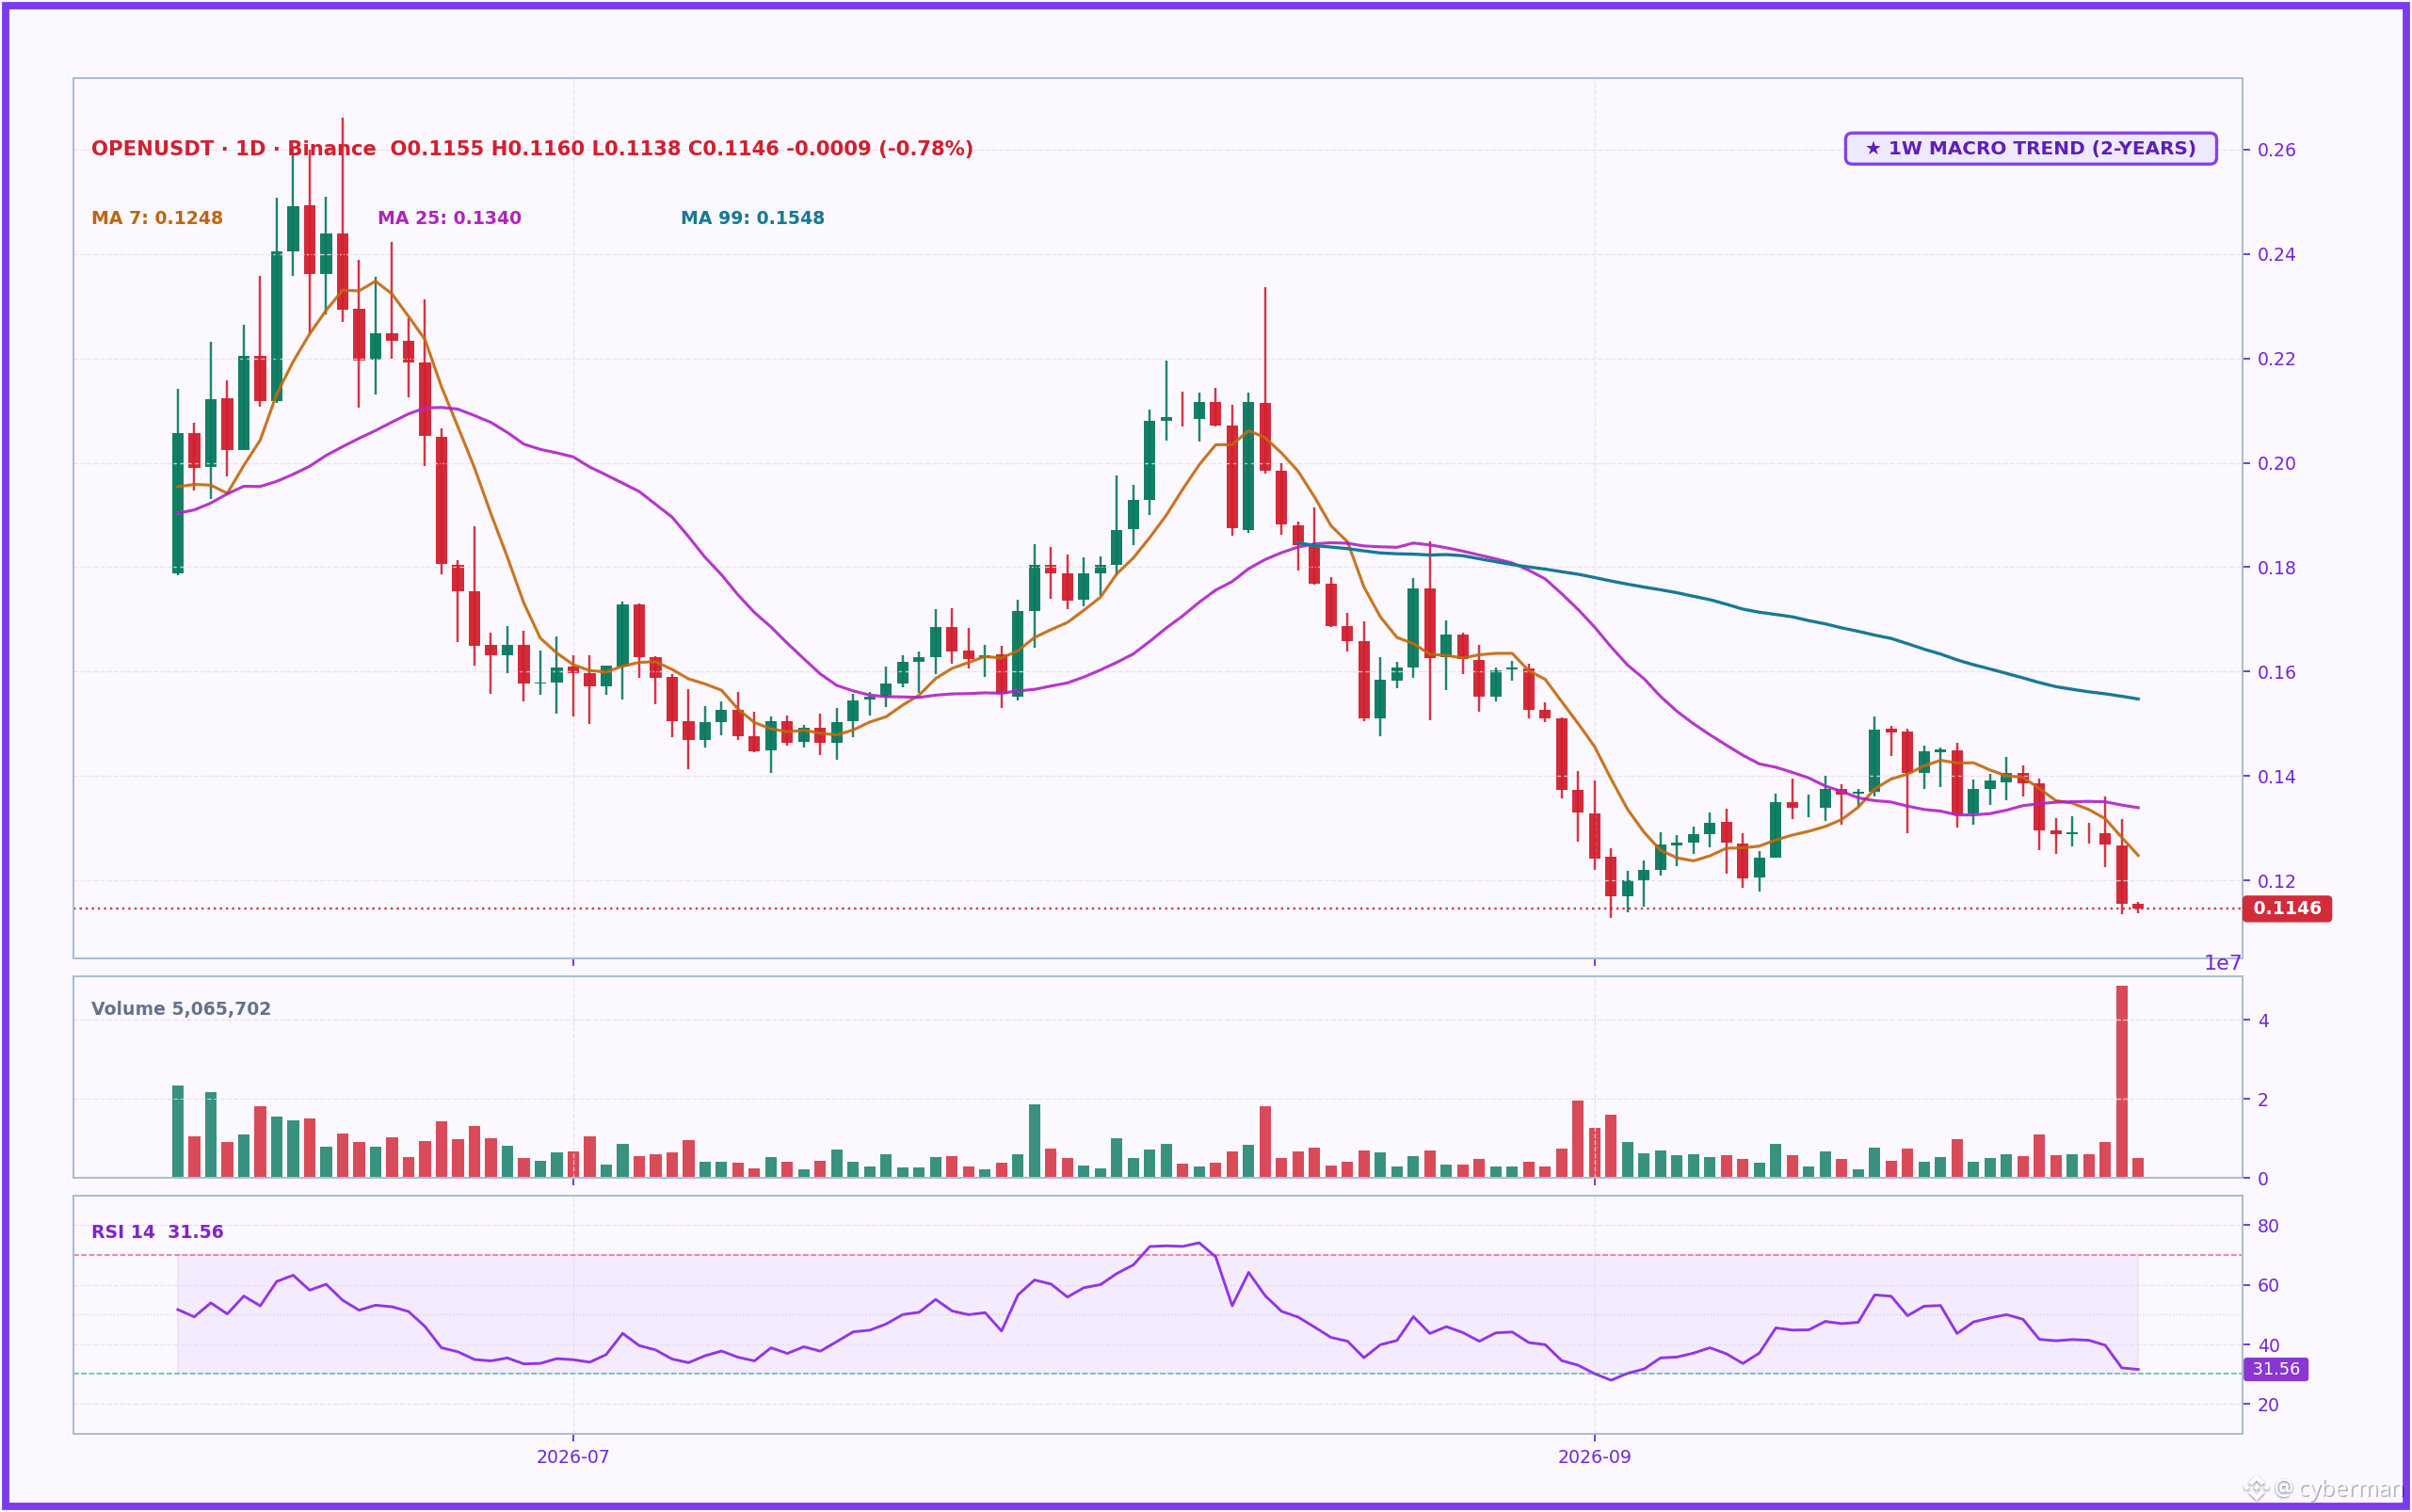
On the 1D chart, the downtrend of $OPEN is crystal clear— the price is below all the major MA lines, suggesting a not-so-bright macro picture. The 1H timeframe doesn’t look much better either. After a strong dump with a big bearish candle and a sudden spike in volume, the price is currently struggling to consolidate in the lower zone at $0.1146. The cause may be the massive token unlock schedule for $OPEN around September/October 2026, when early investors’ token tranches and the team all sell off after a 12-month cliff. This creates extremely heavy supply pressure that the market can hardly absorb.
RSI on both the 1D (31.6) and 1H (33.2) are very low, reflecting a strong bearish momentum—but it could also signal a local oversold condition, meaning there may be a small rebound. However, the surge in trading volume alongside the price drop confirms that money is leaving this asset very quickly.
Just look at the chart of $OPEN —it gives me chills, guys 😏. It’s been dropping hard; it’s exactly the kind of move we’ve been waiting for so they can scoop up the over-saturated supply.
On the 1D chart, the downtrend of $OPEN is crystal clear— the price is below all the major MA lines, suggesting a not-so-bright macro picture. The 1H timeframe doesn’t look much better either. After a strong dump with a big bearish candle and a sudden spike in volume, the price is currently struggling to consolidate in the lower zone at $0.1146. The cause may be the massive token unlock schedule for $OPEN around September/October 2026, when early investors’ token tranches and the team all sell off after a 12-month cliff. This creates extremely heavy supply pressure that the market can hardly absorb.
RSI on both the 1D (31.6) and 1H (33.2) are very low, reflecting a strong bearish momentum—but it could also signal a local oversold condition, meaning there may be a small rebound. However, the surge in trading volume alongside the price drop confirms that money is leaving this asset very quickly.
On the 1D chart, the downtrend of $OPEN is crystal clear— the price is below all the major MA lines, suggesting a not-so-bright macro picture. The 1H timeframe doesn’t look much better either. After a strong dump with a big bearish candle and a sudden spike in volume, the price is currently struggling to consolidate in the lower zone at $0.1146. The cause may be the massive token unlock schedule for $OPEN around September/October 2026, when early investors’ token tranches and the team all sell off after a 12-month cliff. This creates extremely heavy supply pressure that the market can hardly absorb.
RSI on both the 1D (31.6) and 1H (33.2) are very low, reflecting a strong bearish momentum—but it could also signal a local oversold condition, meaning there may be a small rebound. However, the surge in trading volume alongside the price drop confirms that money is leaving this asset very quickly.
175
·
--
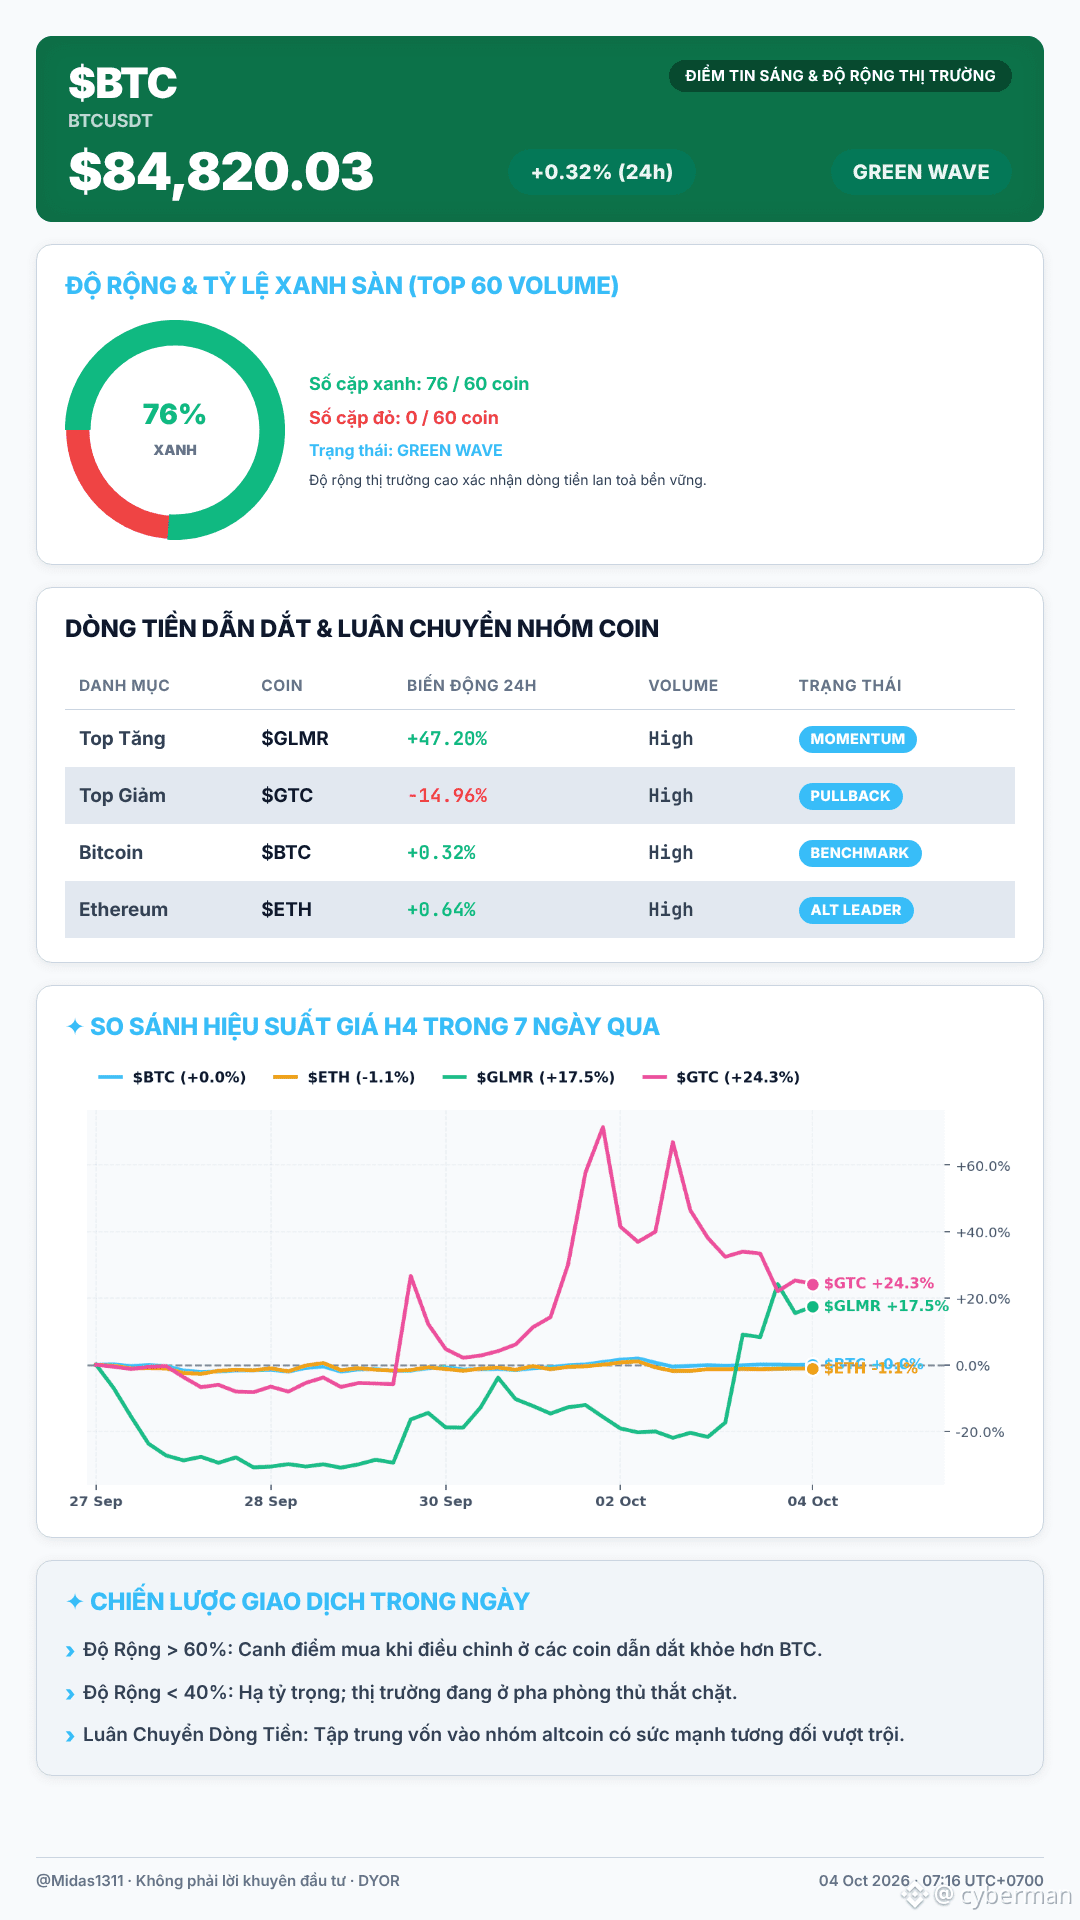
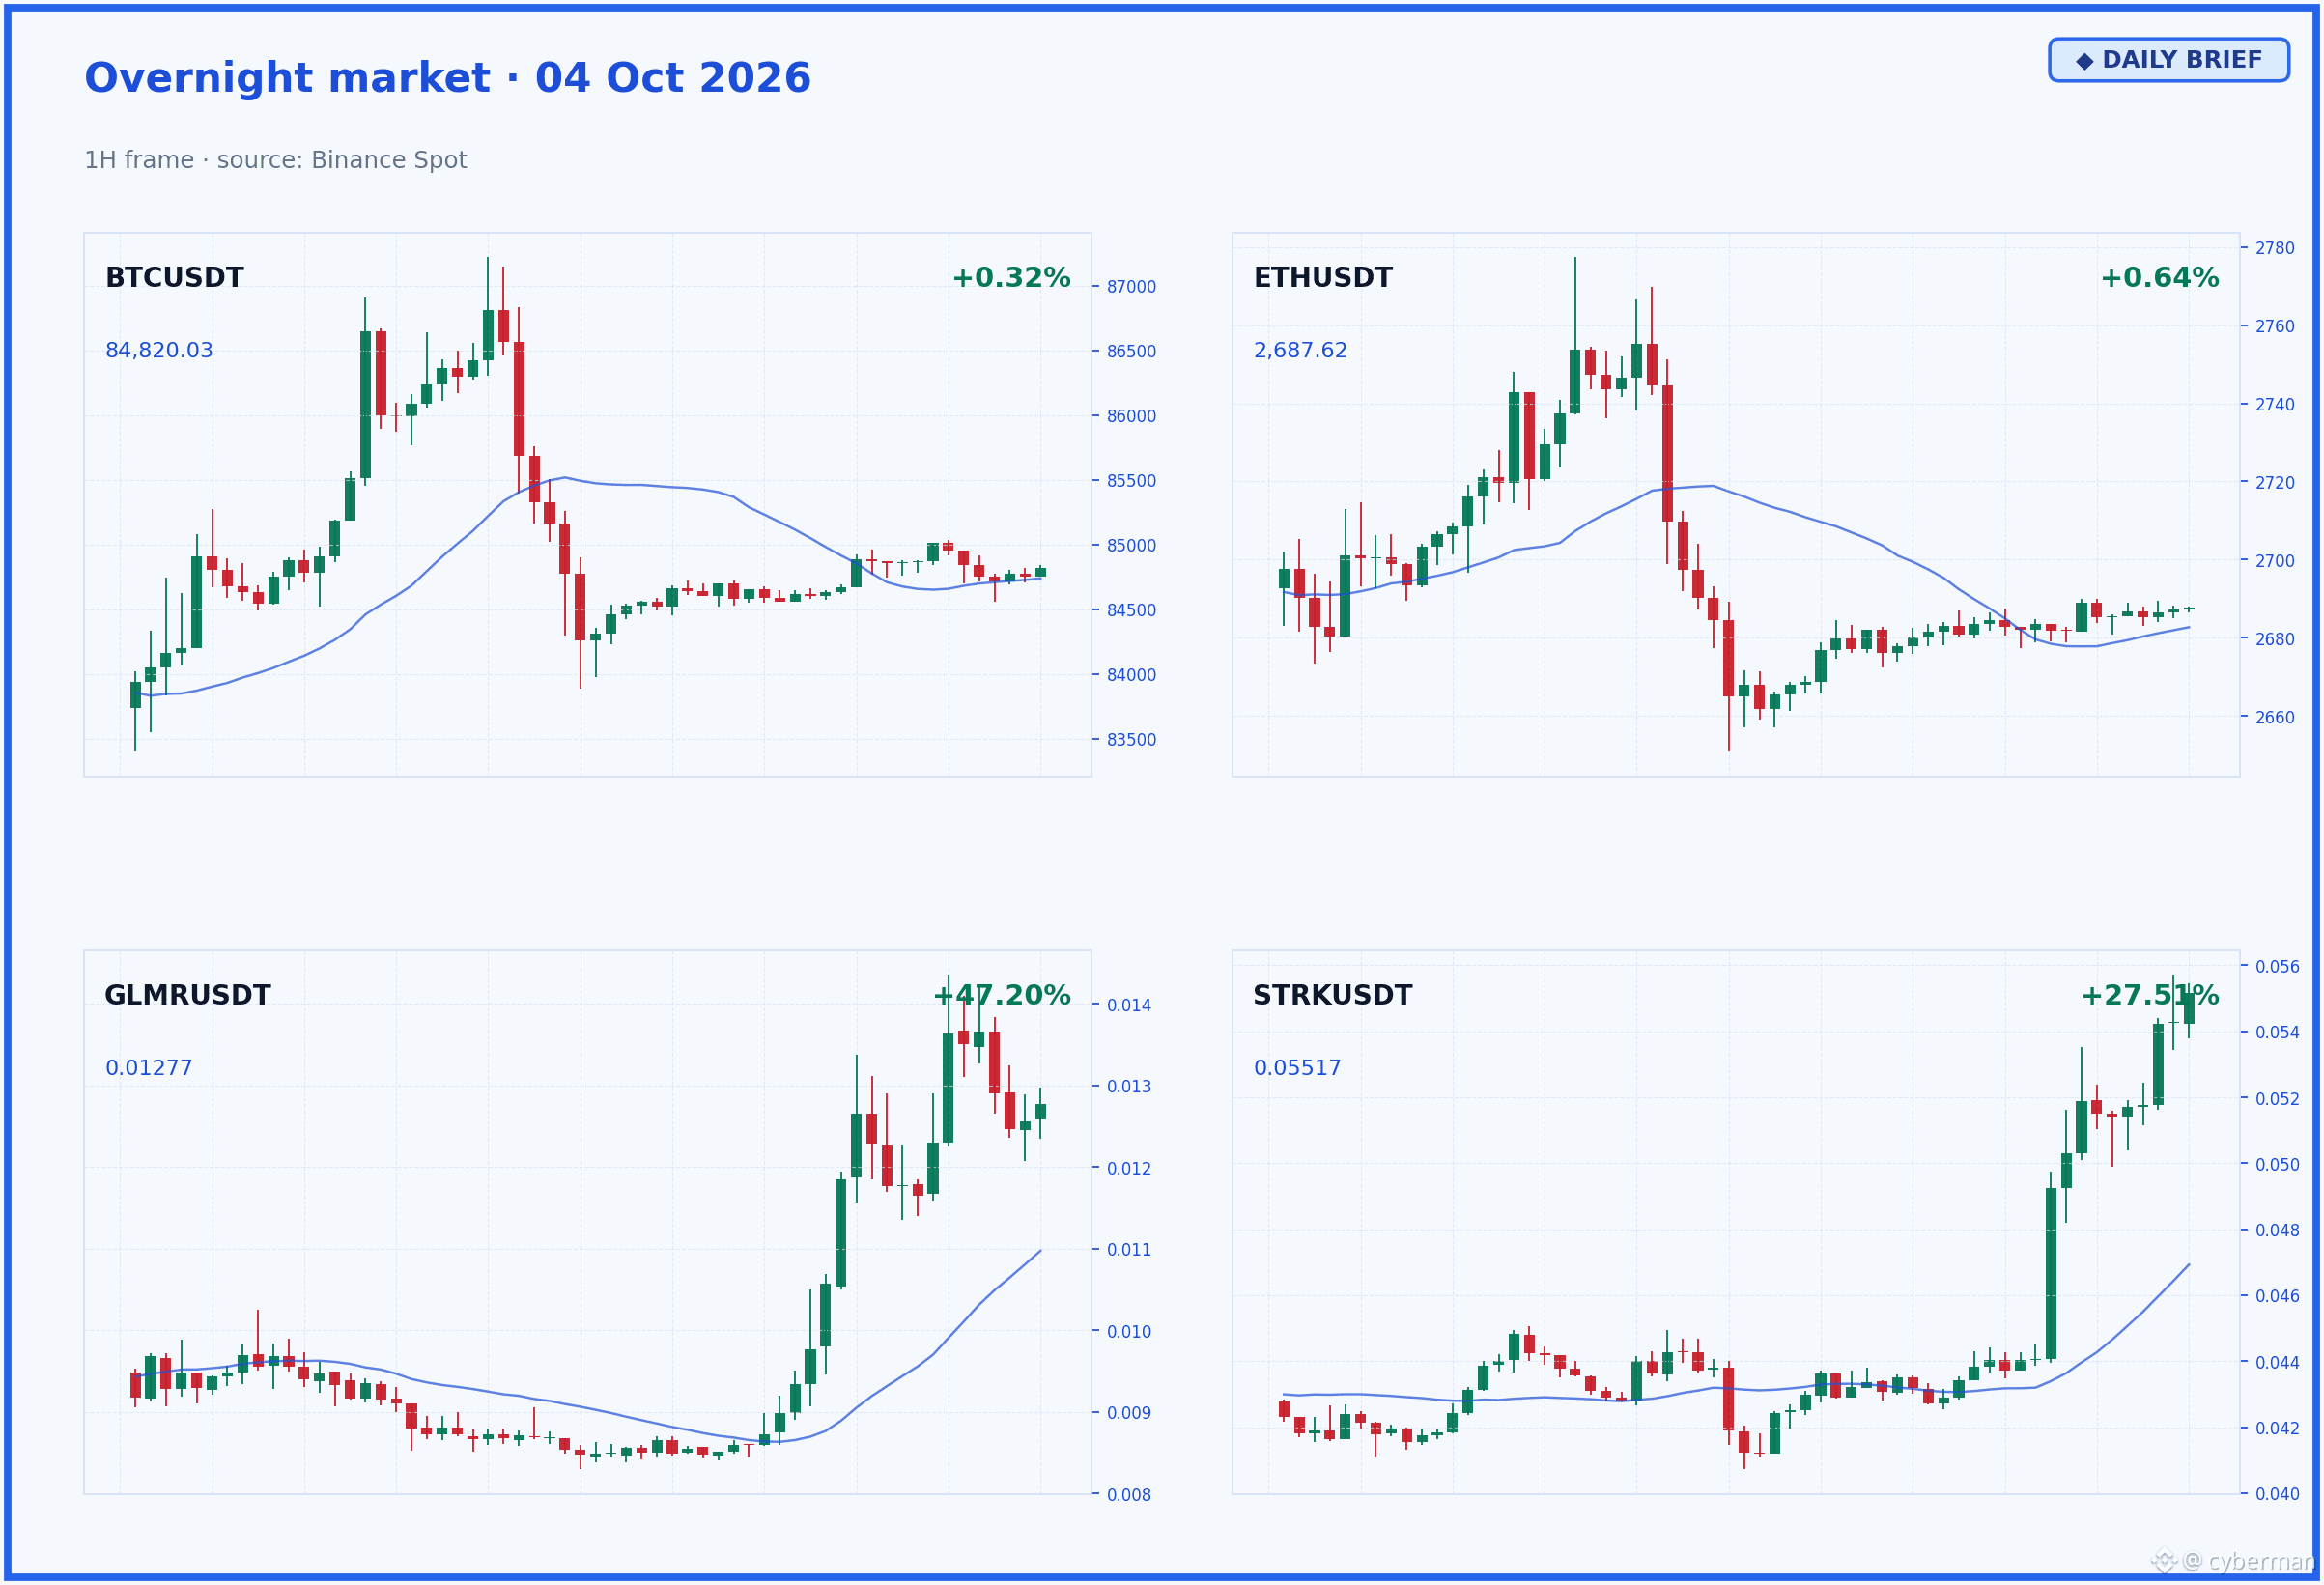
Bitcoin’s price is hovering around $84.8k these days, but market breadth shows 76% of coins in the Top 60 volume are green, and the total volume is $2,356,535,974 overnight—indicating that money is still milling around, looking for opportunities. 🤓
BTC holds the $84,820.03 level (+0.32%) despite a slight slowdown in Bitcoin ETF flows. Specifically, the U.S. spot Bitcoin ETF recorded a $102.7 million inflow on 1/10, but total year-to-date net flows have fallen to $985 million after Q3, which saw $6.3 billion pulled in, following withdrawals in the first half of the year. Ethereum is at $2,687.61 (+0.64%), but the ETH ETFs have been seeing $118 million in outflows over the past 3 days—an indication of capital rotation. BlackRock and the SEC have approved a 3x leveraged ETP for both Bitcoin and Ether.
Leading the move are $GLMR (+47.20%) and STRK (+27.51%) with explosive gains, while GTC (-14.96%) and AT (-10.60%) are lagging. Clearly, the market is hunting for individual catalysts. 📐
Weak employment data could lead the Fed to keep interest rates unchanged at its late-October meeting. Today, watch for signs of capital rotating between groups of coins.
The money’s still there—it’s just flowing elsewhere.
Bitcoin’s price is hovering around $84.8k these days, but market breadth shows 76% of coins in the Top 60 volume are green, and the total volume is $2,356,535,974 overnight—indicating that money is still milling around, looking for opportunities. 🤓
BTC holds the $84,820.03 level (+0.32%) despite a slight slowdown in Bitcoin ETF flows. Specifically, the U.S. spot Bitcoin ETF recorded a $102.7 million inflow on 1/10, but total year-to-date net flows have fallen to $985 million after Q3, which saw $6.3 billion pulled in, following withdrawals in the first half of the year. Ethereum is at $2,687.61 (+0.64%), but the ETH ETFs have been seeing $118 million in outflows over the past 3 days—an indication of capital rotation. BlackRock and the SEC have approved a 3x leveraged ETP for both Bitcoin and Ether.
Leading the move are $GLMR (+47.20%) and STRK (+27.51%) with explosive gains, while GTC (-14.96%) and AT (-10.60%) are lagging. Clearly, the market is hunting for individual catalysts. 📐
Weak employment data could lead the Fed to keep interest rates unchanged at its late-October meeting. Today, watch for signs of capital rotating between groups of coins.
The money’s still there—it’s just flowing elsewhere.
BTC holds the $84,820.03 level (+0.32%) despite a slight slowdown in Bitcoin ETF flows. Specifically, the U.S. spot Bitcoin ETF recorded a $102.7 million inflow on 1/10, but total year-to-date net flows have fallen to $985 million after Q3, which saw $6.3 billion pulled in, following withdrawals in the first half of the year. Ethereum is at $2,687.61 (+0.64%), but the ETH ETFs have been seeing $118 million in outflows over the past 3 days—an indication of capital rotation. BlackRock and the SEC have approved a 3x leveraged ETP for both Bitcoin and Ether.
Leading the move are $GLMR (+47.20%) and STRK (+27.51%) with explosive gains, while GTC (-14.96%) and AT (-10.60%) are lagging. Clearly, the market is hunting for individual catalysts. 📐
Weak employment data could lead the Fed to keep interest rates unchanged at its late-October meeting. Today, watch for signs of capital rotating between groups of coins.
The money’s still there—it’s just flowing elsewhere.
135
·
--
Hi everyone, newbie 🧑🏫, I’ve been seeing $UNI dạo lately—everything seems so slow and sluggish. People think the app is frozen, right? Sometimes we only watch the price go up and down and forget about the “force” pushing behind it. That’s a common mistake!
Imagine the price as a scale, and the “force” is the number of people standing on the scale. In crypto, that “force” is Open Interest (OI) — the total value of all outstanding derivatives contracts. It tells you how much “real money” is actually betting on the direction of an asset. Like a party, OI is the number of guests showing up. 💡
So if $UNI is around $9.011 and the price ticks up, I need to check whether OI is also increasing. If OI rises 📈, that means new money is flowing in—“big players” are buying. That’s real buying pressure. On the other hand, if the price keeps rising but OI drops 📉, then it’s likely just short positions closing (short cover), and there’s no fresh money coming in. Be careful of that “turnaround.”
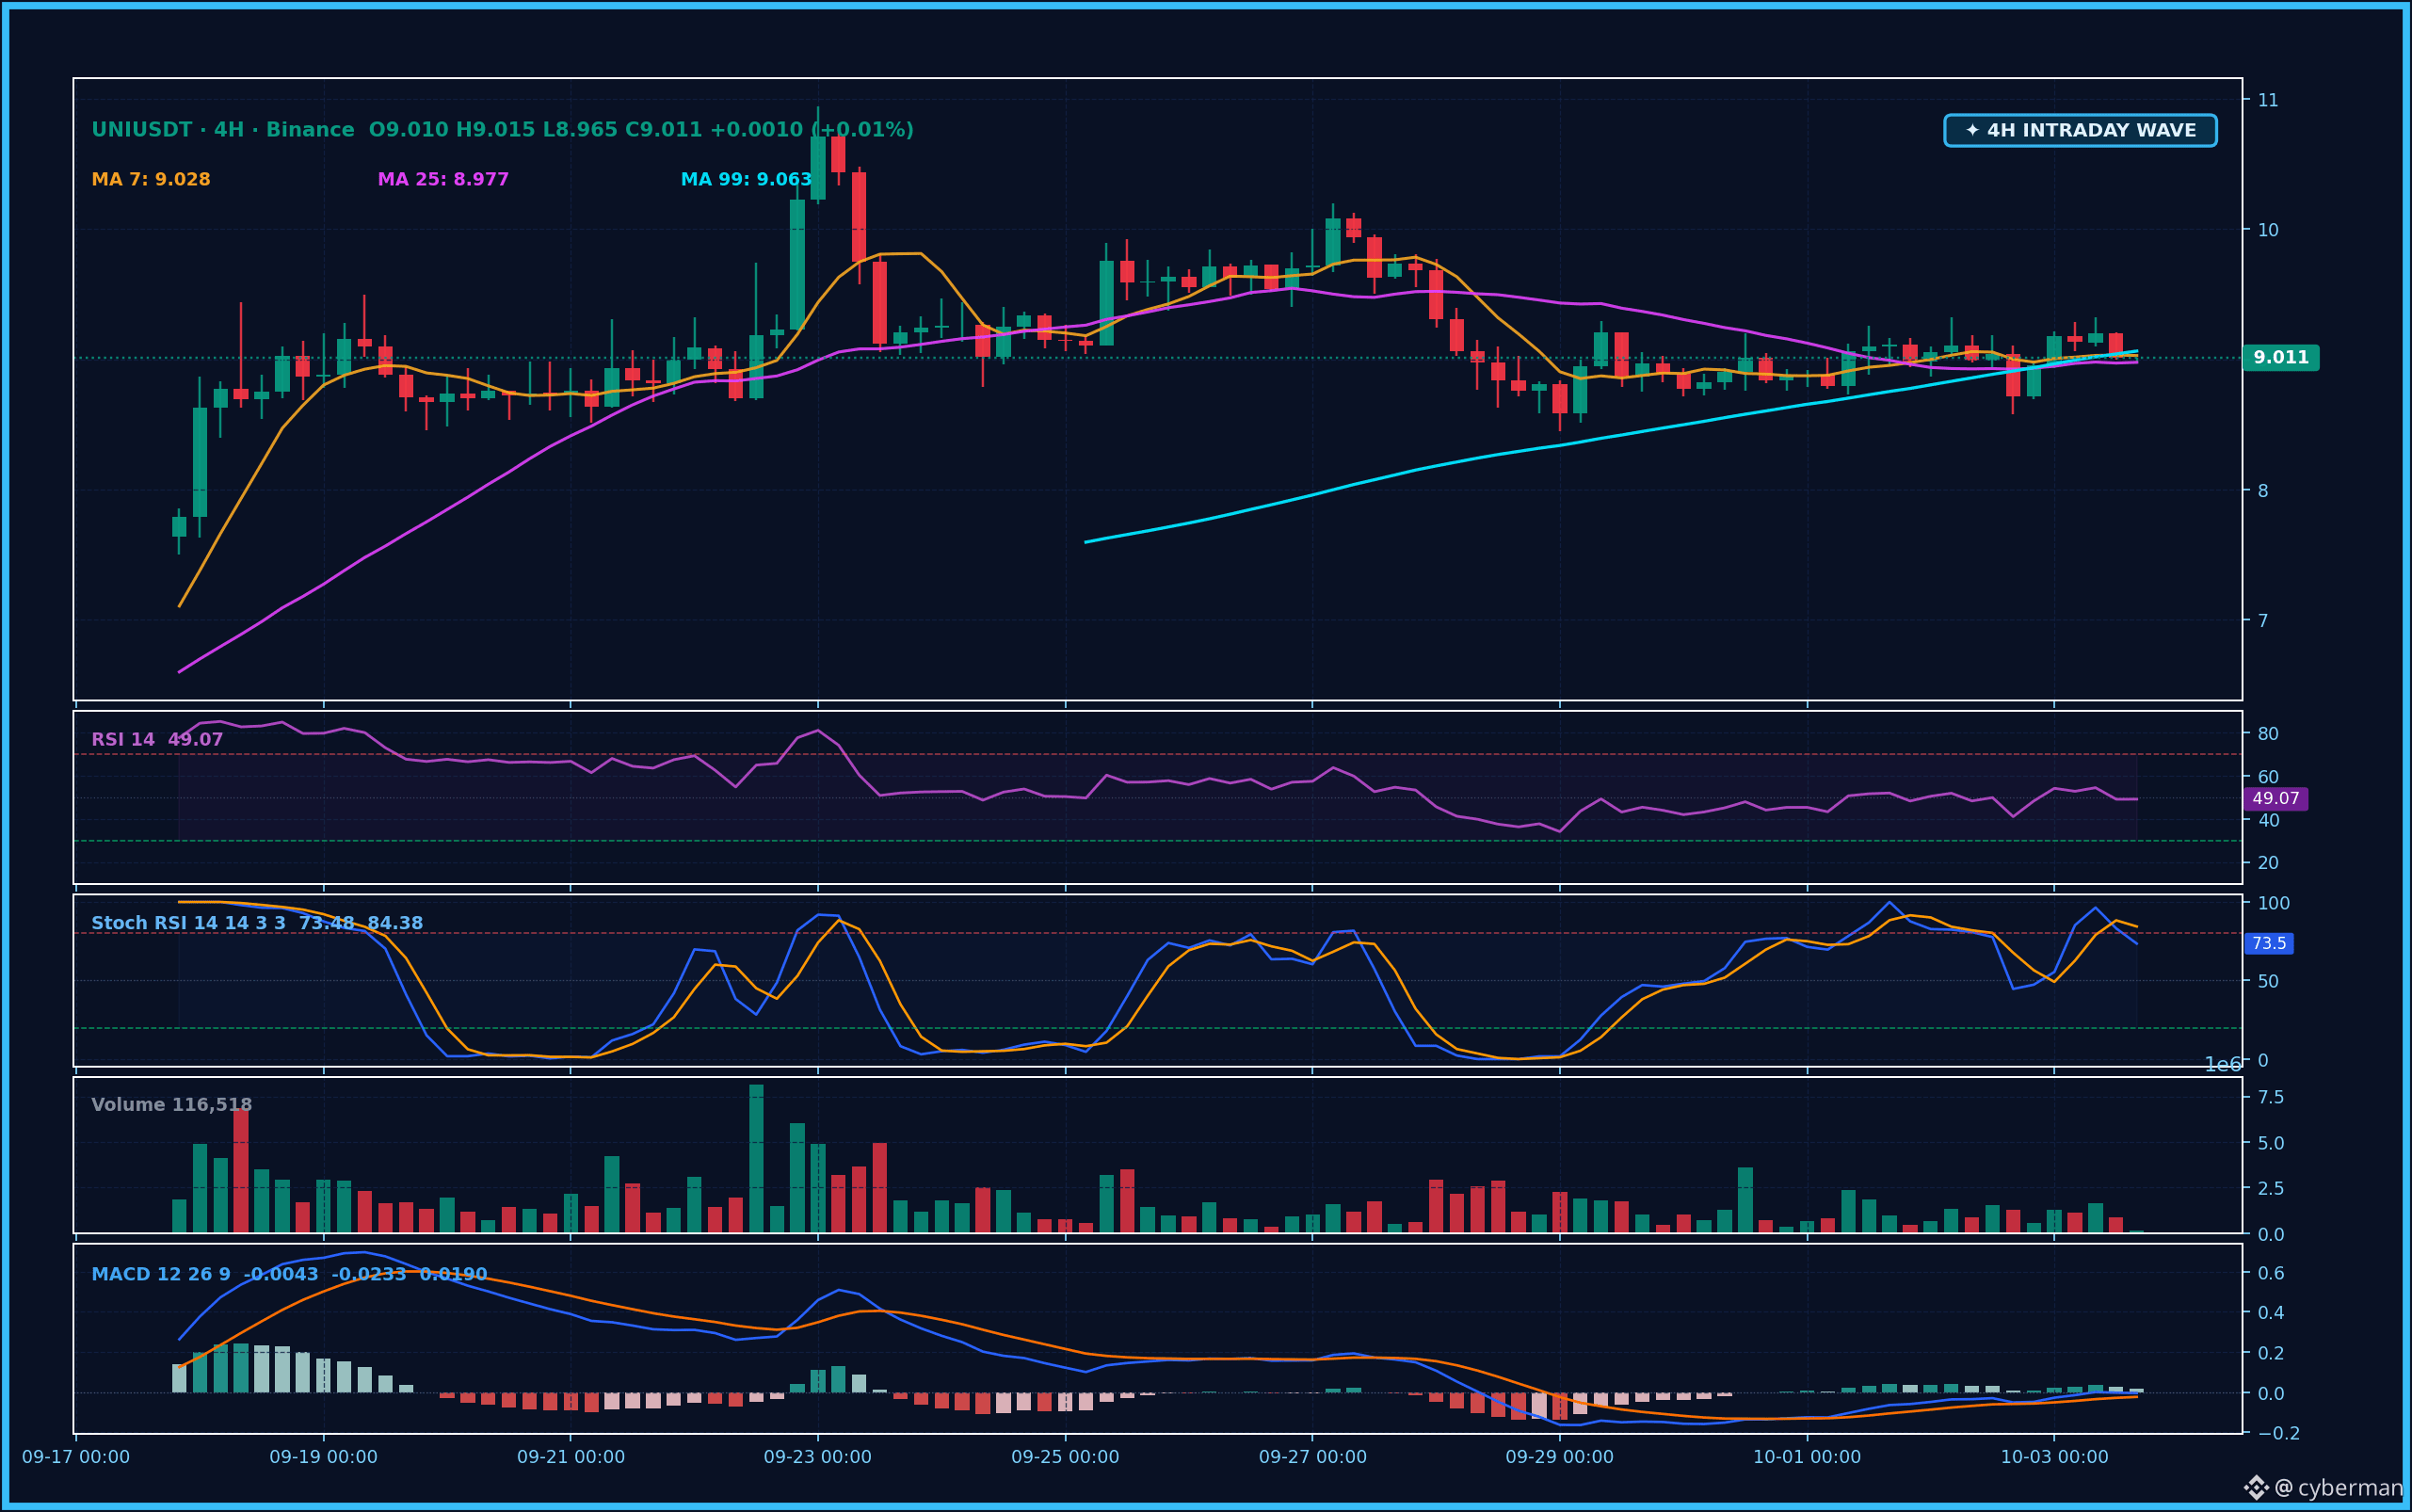
Right now, $UNI is hovering around $9.011, slightly below MA7 ($9.0284) and above MA25 ($8.9766). RSI is 49.1—no standout signal yet.
Hi everyone, newbie 🧑🏫, I’ve been seeing $UNI dạo lately—everything seems so slow and sluggish. People think the app is frozen, right? Sometimes we only watch the price go up and down and forget about the “force” pushing behind it. That’s a common mistake!
Imagine the price as a scale, and the “force” is the number of people standing on the scale. In crypto, that “force” is Open Interest (OI) — the total value of all outstanding derivatives contracts. It tells you how much “real money” is actually betting on the direction of an asset. Like a party, OI is the number of guests showing up. 💡
So if $UNI is around $9.011 and the price ticks up, I need to check whether OI is also increasing. If OI rises 📈, that means new money is flowing in—“big players” are buying. That’s real buying pressure. On the other hand, if the price keeps rising but OI drops 📉, then it’s likely just short positions closing (short cover), and there’s no fresh money coming in. Be careful of that “turnaround.”
Right now, $UNI is hovering around $9.011, slightly below MA7 ($9.0284) and above MA25 ($8.9766). RSI is 49.1—no standout signal yet.
Imagine the price as a scale, and the “force” is the number of people standing on the scale. In crypto, that “force” is Open Interest (OI) — the total value of all outstanding derivatives contracts. It tells you how much “real money” is actually betting on the direction of an asset. Like a party, OI is the number of guests showing up. 💡
So if $UNI is around $9.011 and the price ticks up, I need to check whether OI is also increasing. If OI rises 📈, that means new money is flowing in—“big players” are buying. That’s real buying pressure. On the other hand, if the price keeps rising but OI drops 📉, then it’s likely just short positions closing (short cover), and there’s no fresh money coming in. Be careful of that “turnaround.”
Right now, $UNI is hovering around $9.011, slightly below MA7 ($9.0284) and above MA25 ($8.9766). RSI is 49.1—no standout signal yet.
128
·
--
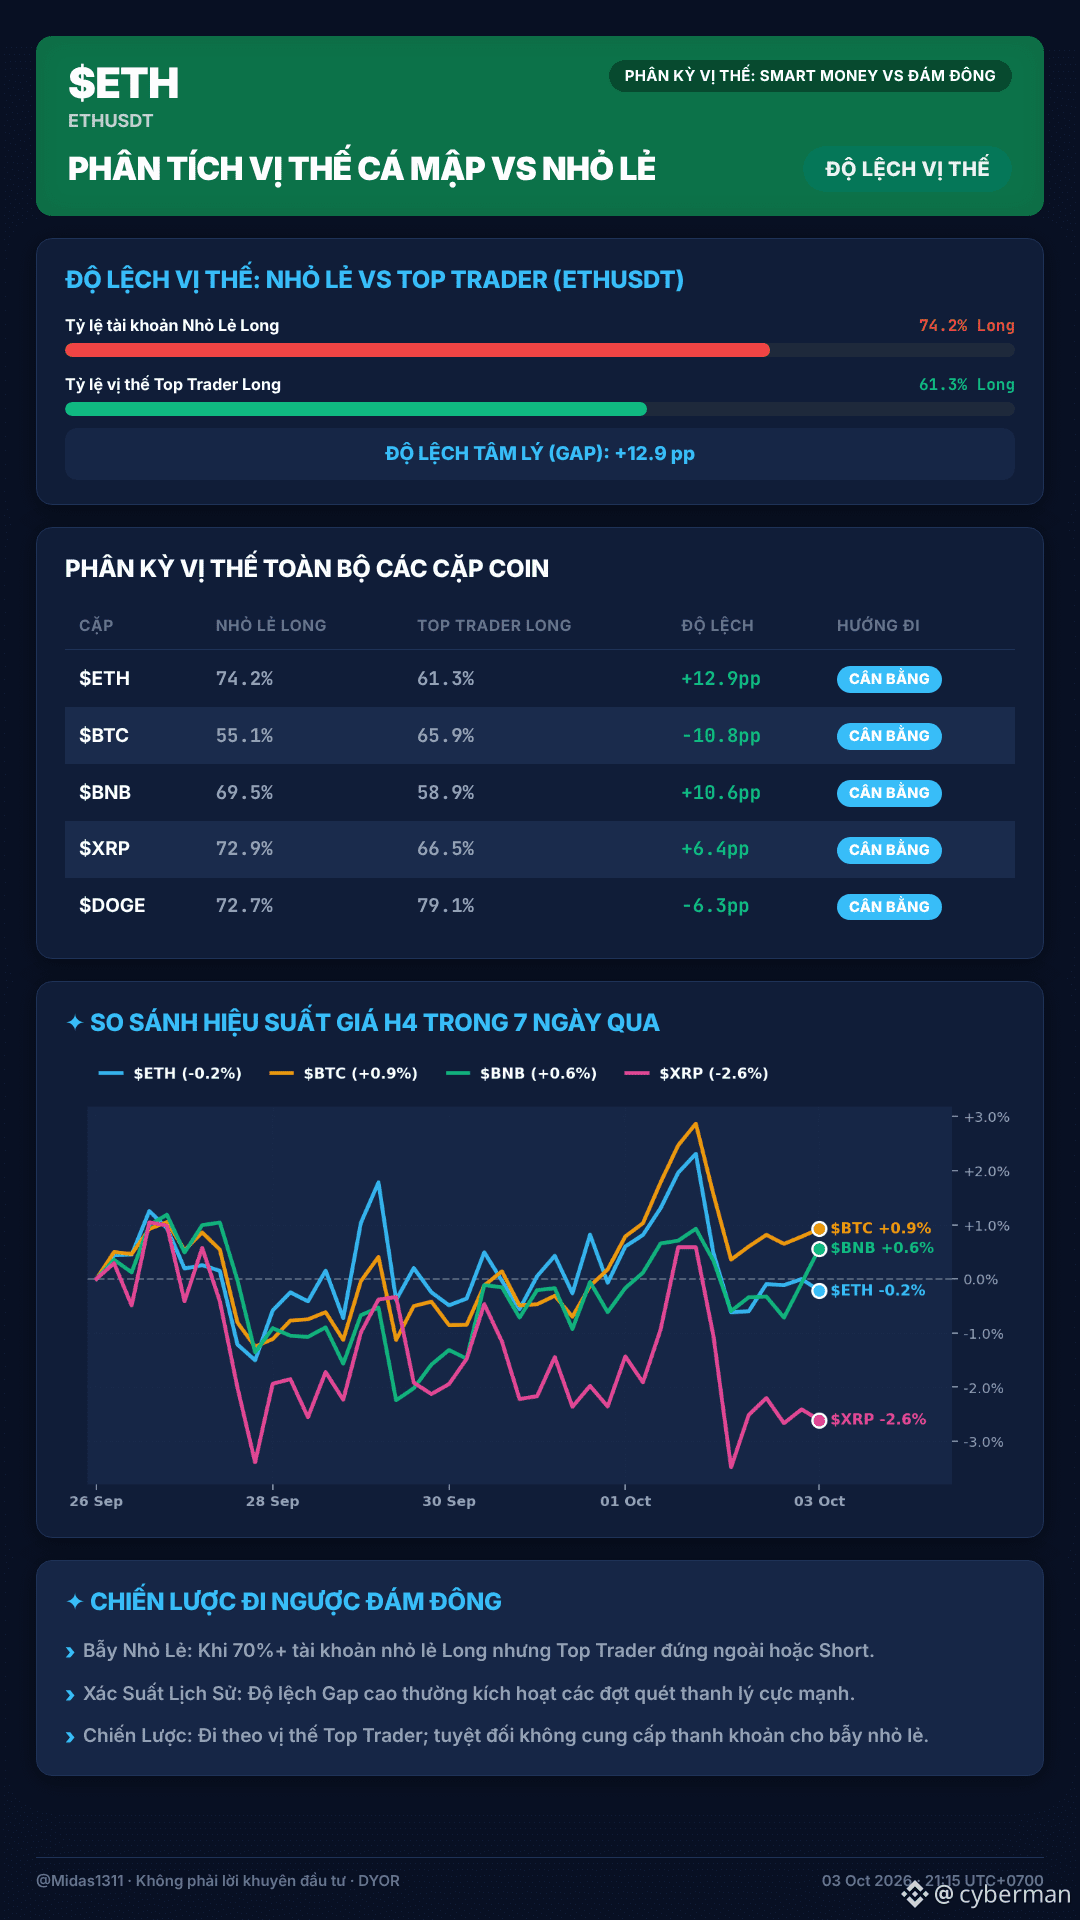
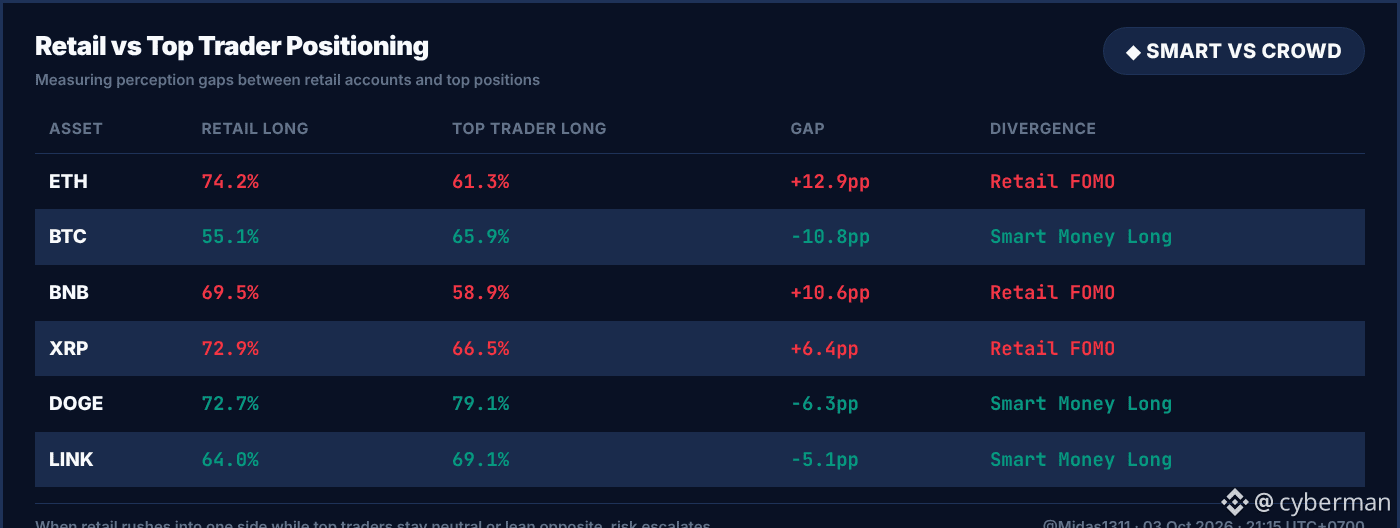
Just sitting and scrolling through the $ETH chart, I catch a familiar smell—could it be the same old script? 🤔 Looking at the positioning data, the crowd is absolutely euphoric. Over 74.2% of retail accounts are Long $ETH, while the big players are only 61.3%. That +12.9pp gap isn’t a joke. Every time retail FOMO like this happens, it’s pretty much the same story: something’s about to move, and the whales are preparing to pull a classic rug. 😏
On the flip side, looking at Bitcoin: retail is Long only 55.1%, while Top Traders quietly accumulate Long at 65.9%. The -10.8pp spread suggests “smart money” is discreetly betting on BTC. And for BNB and XRP too—there’s the same warning signal as ETH: retail Long dominates, but Top Traders are clearly more cautious, with gaps of +10.6pp and +6.4pp respectively. As for DOGE, the whales are quietly accumulating 6.3% there, too, folks.
So, for this trade, are you going to follow the crowd that’s in a frenzy, or go alongside the whales who are accumulating/investing cautiously? 😏 Because honestly, anything too much is never good. 📊
$ETH #Write2Earn #BinanceFutures #Altcoin
(DYOR & NFA)
---
Just sitting and scrolling through the $ETH chart, I catch a familiar smell—could it be the same old script? 🤔 Looking at the positioning data, the crowd is absolutely euphoric. Over 74.2% of retail accounts are Long $ETH , while the big players are only 61.3%. That +12.9pp gap isn’t a joke. Every time retail FOMO like this happens, it’s pretty much the same story: something’s about to move, and the whales are preparing to pull a classic rug. 😏
On the flip side, looking at Bitcoin: retail is Long only 55.1%, while Top Traders quietly accumulate Long at 65.9%. The -10.8pp spread suggests “smart money” is discreetly betting on BTC. And for BNB and XRP too—there’s the same warning signal as ETH: retail Long dominates, but Top Traders are clearly more cautious, with gaps of +10.6pp and +6.4pp respectively. As for DOGE, the whales are quietly accumulating 6.3% there, too, folks.
So, for this trade, are you going to follow the crowd that’s in a frenzy, or go alongside the whales who are accumulating/investing cautiously? 😏 Because honestly, anything too much is never good. 📊
$ETH #Write2Earn #BinanceFutures #Altcoin
(DYOR & NFA)
---
On the flip side, looking at Bitcoin: retail is Long only 55.1%, while Top Traders quietly accumulate Long at 65.9%. The -10.8pp spread suggests “smart money” is discreetly betting on BTC. And for BNB and XRP too—there’s the same warning signal as ETH: retail Long dominates, but Top Traders are clearly more cautious, with gaps of +10.6pp and +6.4pp respectively. As for DOGE, the whales are quietly accumulating 6.3% there, too, folks.
So, for this trade, are you going to follow the crowd that’s in a frenzy, or go alongside the whales who are accumulating/investing cautiously? 😏 Because honestly, anything too much is never good. 📊
$ETH #Write2Earn #BinanceFutures #Altcoin
(DYOR & NFA)
---
1
744
·
--
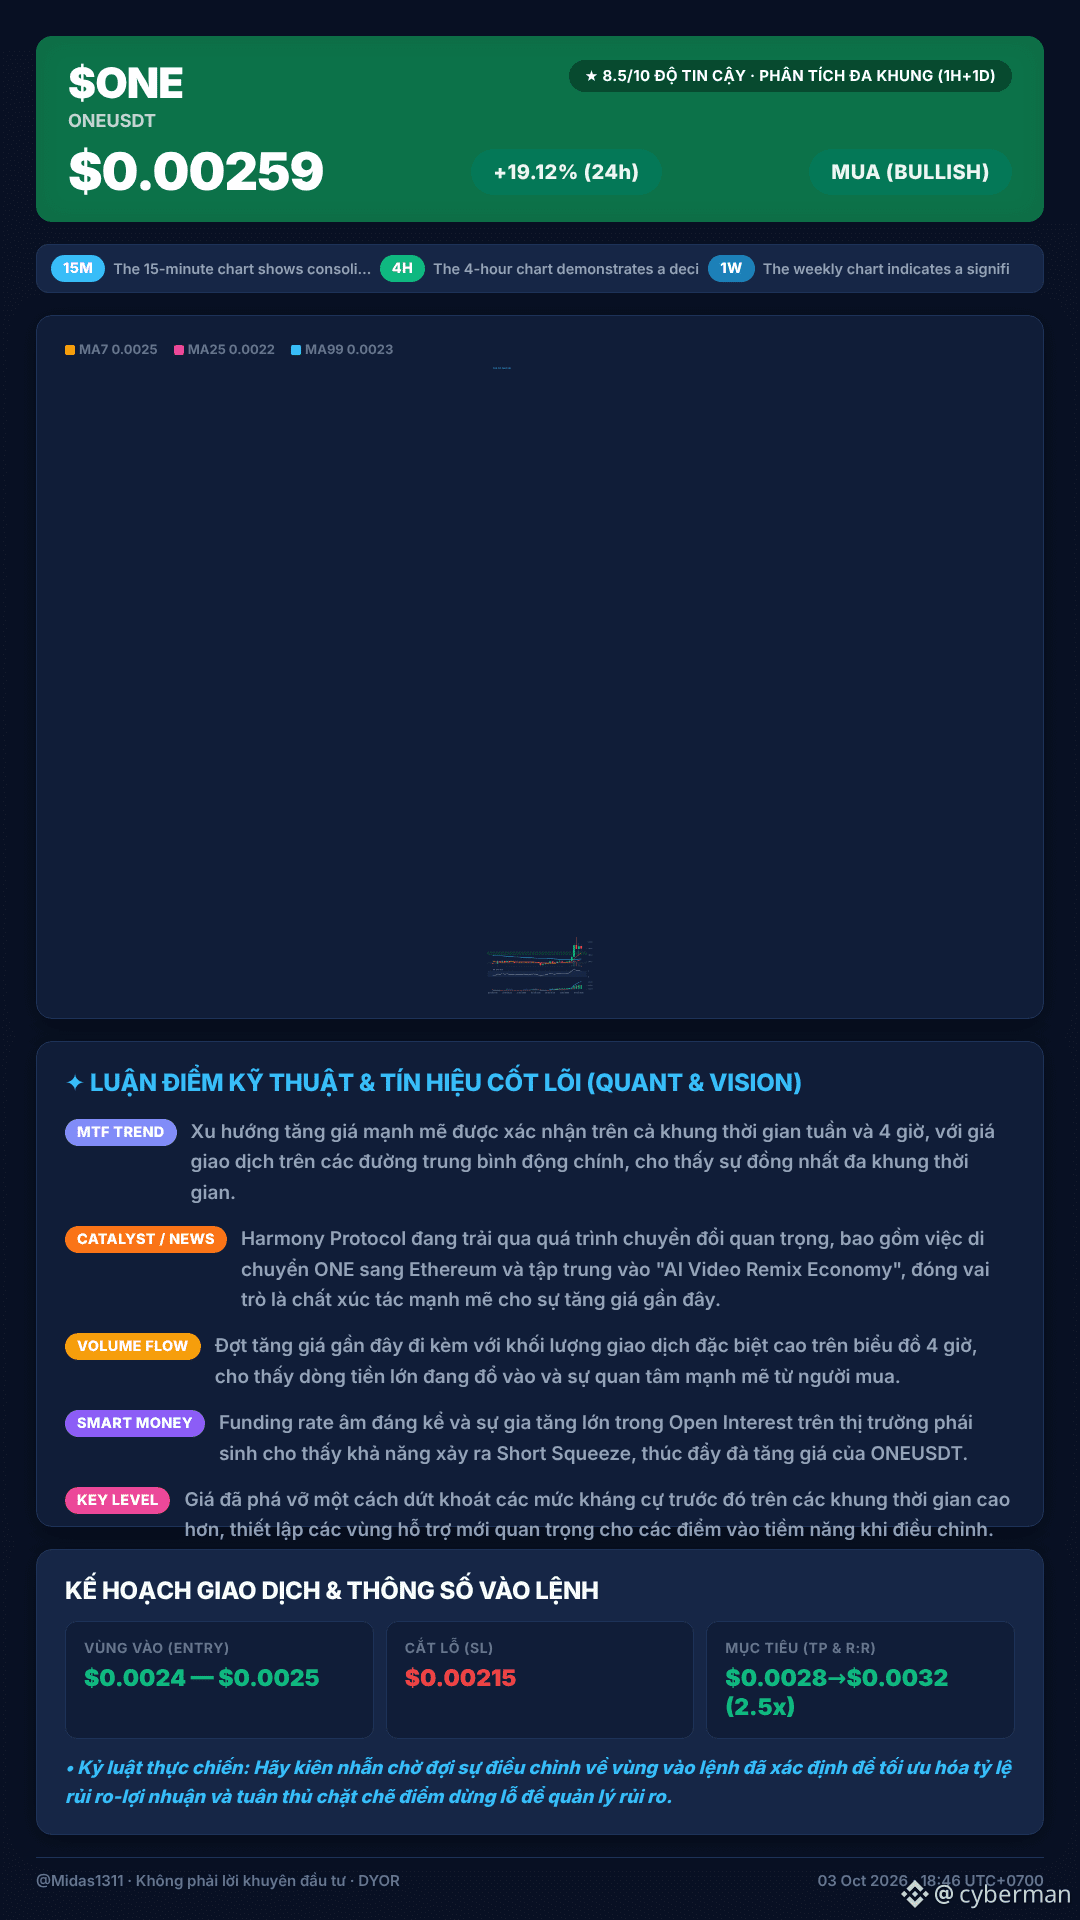
Oh my goodness, oh my brothers, $ONE what are you doing on the chart like this! 👀 The market is so quiet, yet $ONE is charging forward alone like it’s going straight up like a missile! 🚀
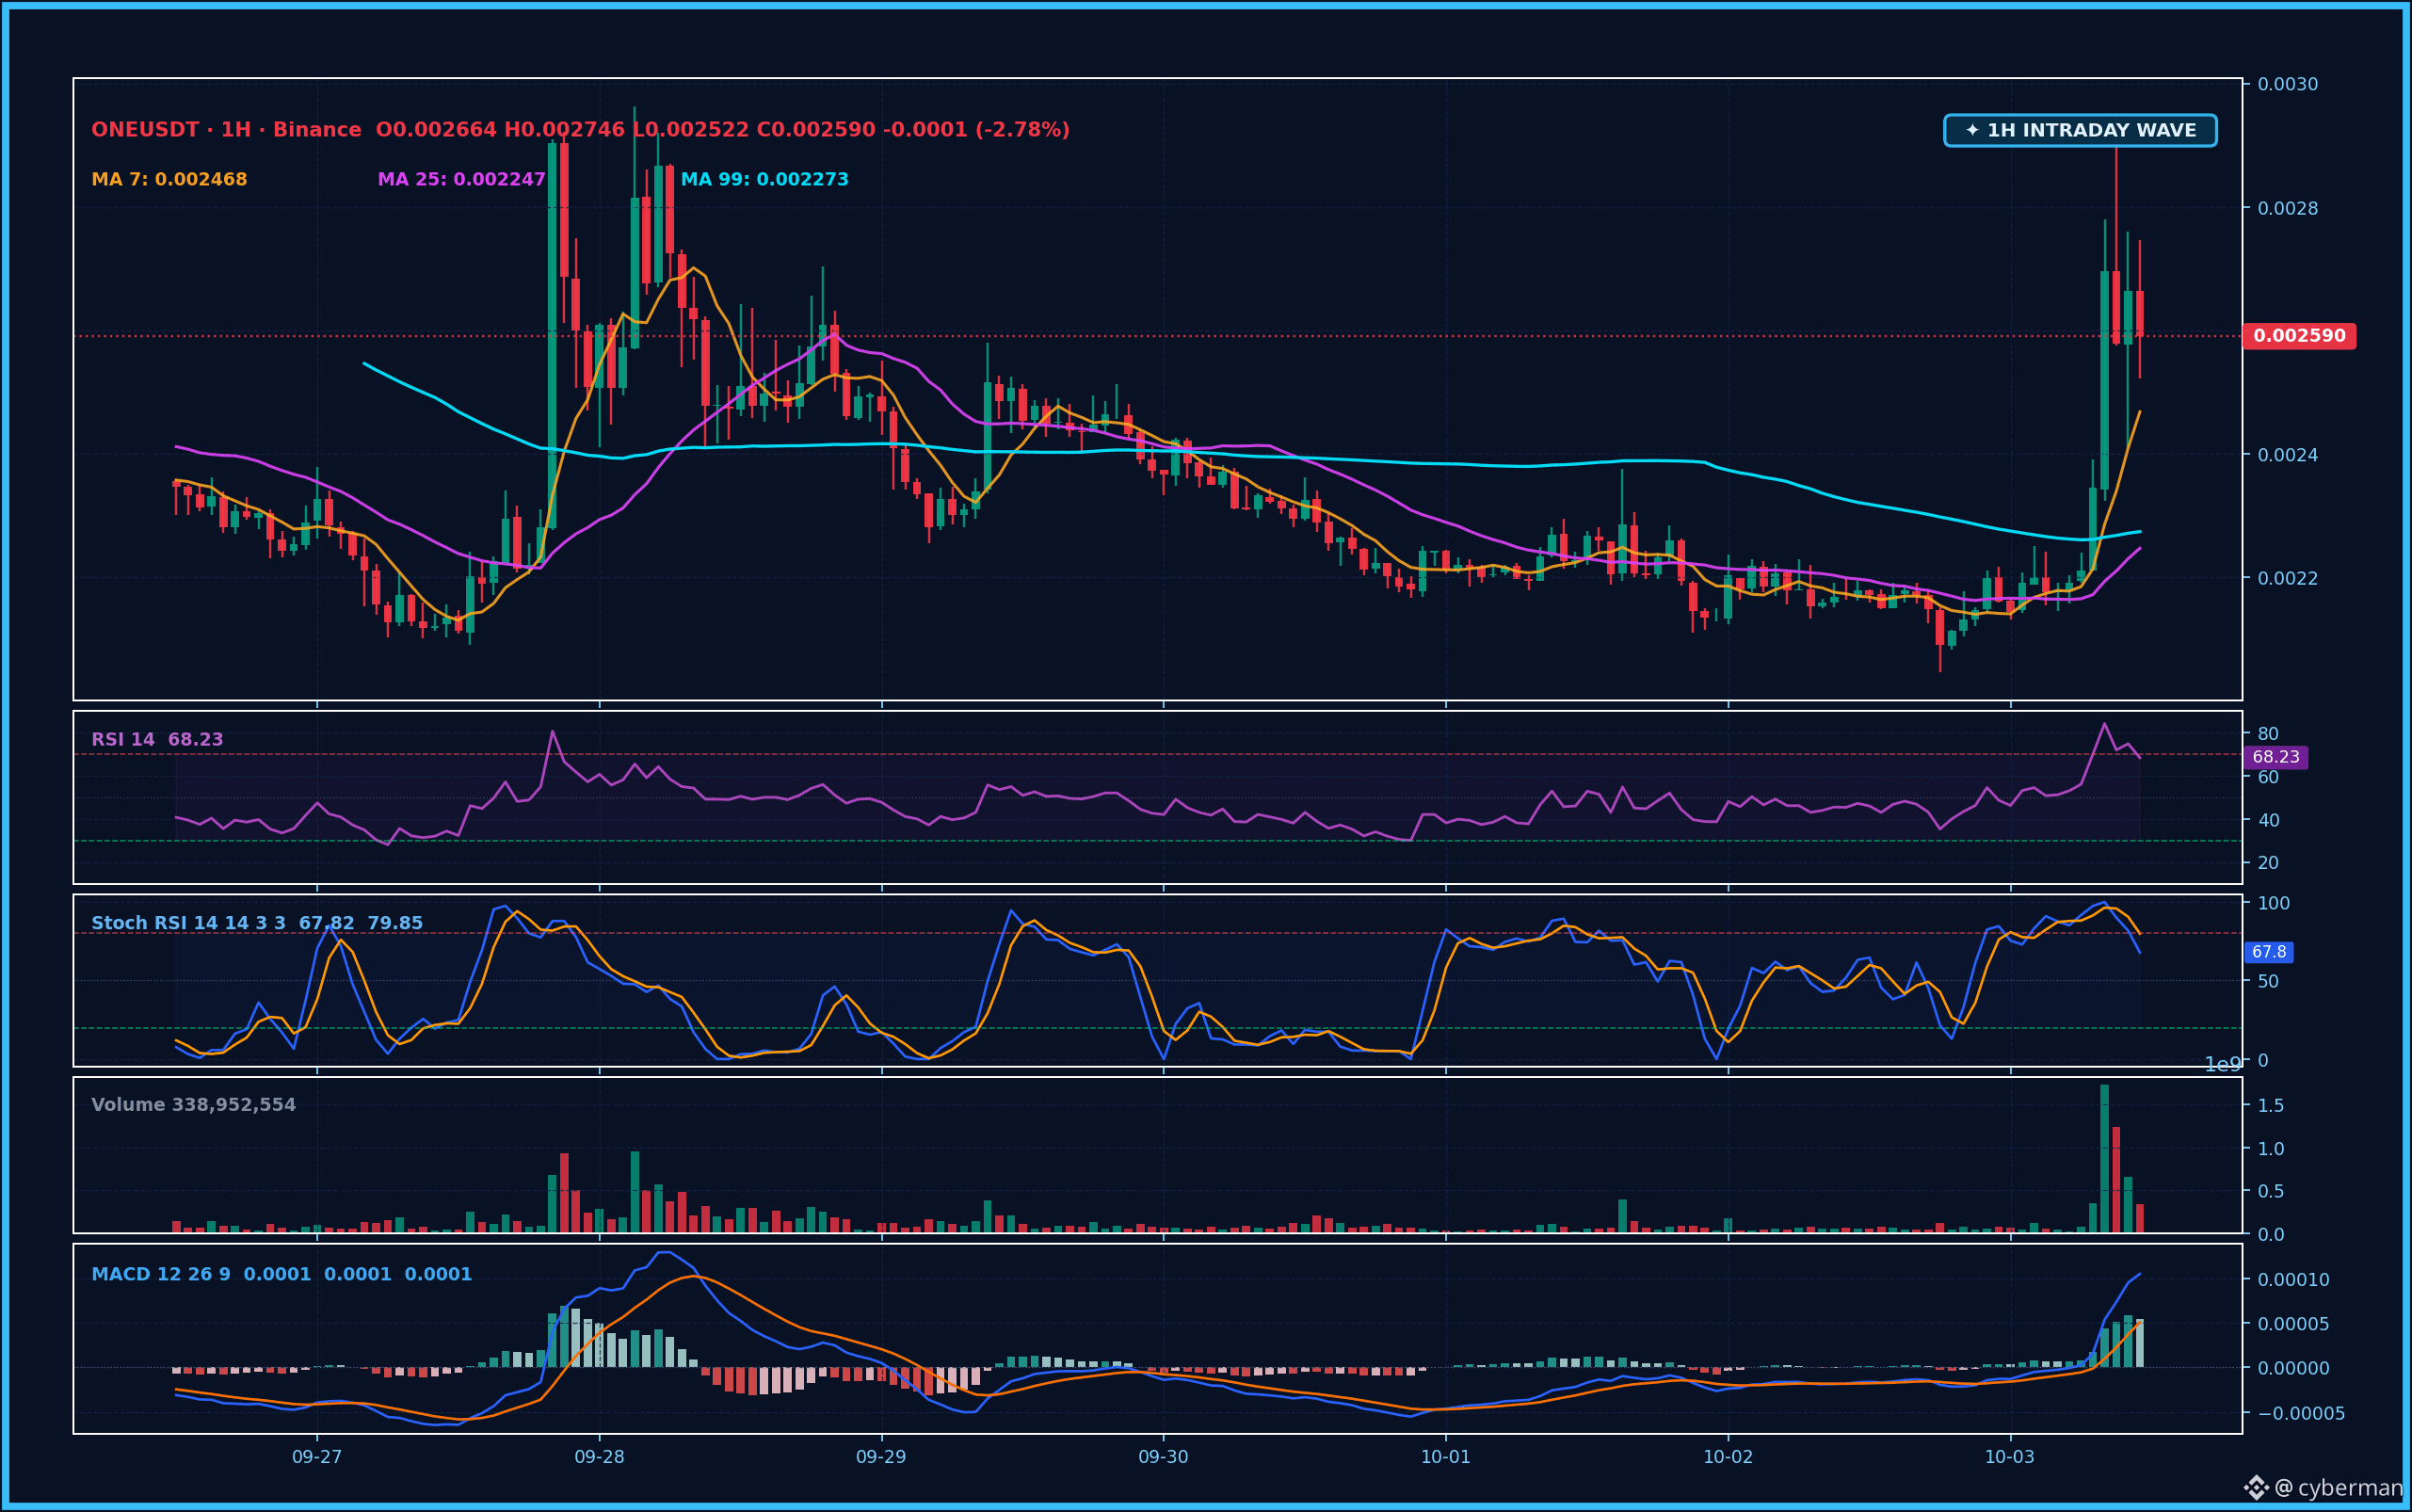
Look at the 1H chart: the price at $0.00259 is soaring above all the MA lines (MA7 $0.0025, MA25 $0.0022, MA99 $0.0023) after a strong breakout. RSI is at 68.2—there’s still room for a slight increase, not overly overheated yet. Plus, the BB width of 34.54% signals extremely high volatility. And the H4 candle volume yesterday was 13.77x the average of 20 candles—now you can see how intense the capital inflow is!
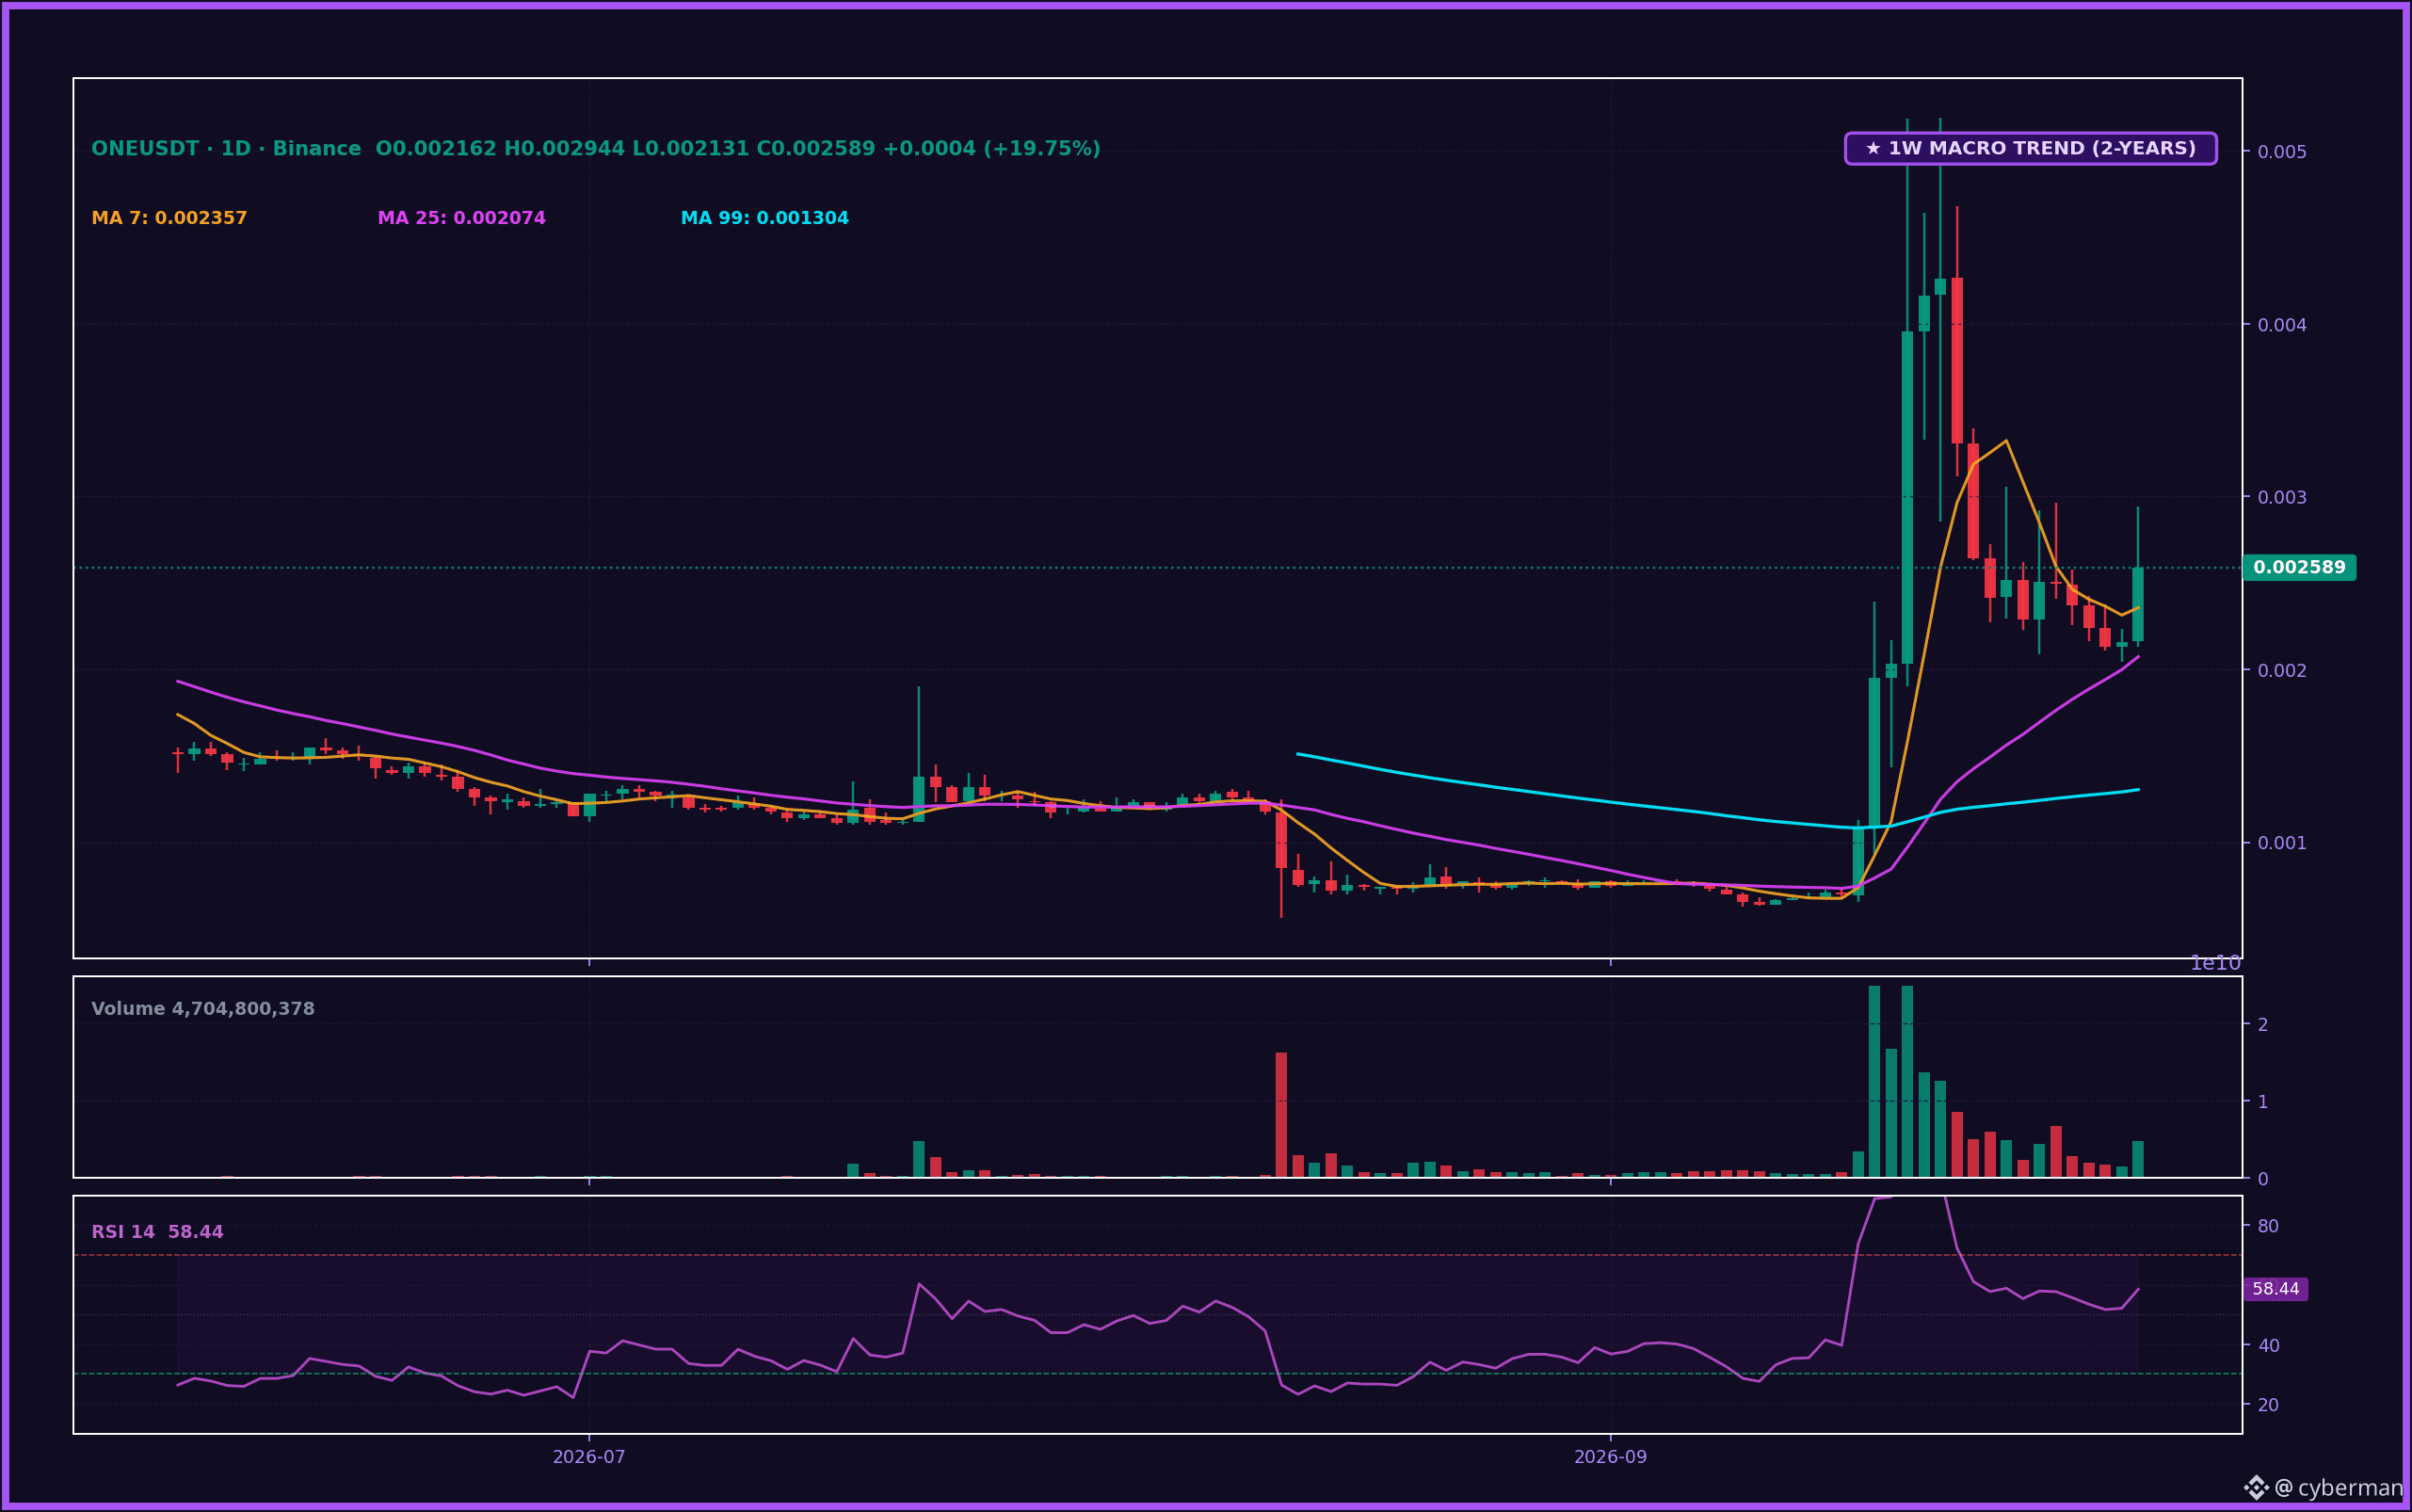
The bigger picture on the 1D timeframe is even more impressive! After a long period of drifting sideways, $ONE has made a spectacular “U-turn.” The price is trading above key moving average lines, confirming a strong uptrend across both the weekly and 4-hour charts. This comes from information that Harmony Protocol is undergoing a major strategic shift—from moving $ONE from being on its previous chain to Ethereum and switching to an ERC-20 token, all the way to focusing on “AI Video Remix Economy.”
Oh my goodness, oh my brothers, $ONE what are you doing on the chart like this! 👀 The market is so quiet, yet $ONE is charging forward alone like it’s going straight up like a missile! 🚀
Look at the 1H chart: the price at $0.00259 is soaring above all the MA lines (MA7 $0.0025, MA25 $0.0022, MA99 $0.0023) after a strong breakout. RSI is at 68.2—there’s still room for a slight increase, not overly overheated yet. Plus, the BB width of 34.54% signals extremely high volatility. And the H4 candle volume yesterday was 13.77x the average of 20 candles—now you can see how intense the capital inflow is!
The bigger picture on the 1D timeframe is even more impressive! After a long period of drifting sideways, $ONE has made a spectacular “U-turn.” The price is trading above key moving average lines, confirming a strong uptrend across both the weekly and 4-hour charts. This comes from information that Harmony Protocol is undergoing a major strategic shift—from moving $ONE from being on its previous chain to Ethereum and switching to an ERC-20 token, all the way to focusing on “AI Video Remix Economy.”
Look at the 1H chart: the price at $0.00259 is soaring above all the MA lines (MA7 $0.0025, MA25 $0.0022, MA99 $0.0023) after a strong breakout. RSI is at 68.2—there’s still room for a slight increase, not overly overheated yet. Plus, the BB width of 34.54% signals extremely high volatility. And the H4 candle volume yesterday was 13.77x the average of 20 candles—now you can see how intense the capital inflow is!
The bigger picture on the 1D timeframe is even more impressive! After a long period of drifting sideways, $ONE has made a spectacular “U-turn.” The price is trading above key moving average lines, confirming a strong uptrend across both the weekly and 4-hour charts. This comes from information that Harmony Protocol is undergoing a major strategic shift—from moving $ONE from being on its previous chain to Ethereum and switching to an ERC-20 token, all the way to focusing on “AI Video Remix Economy.”
1
271
·
--
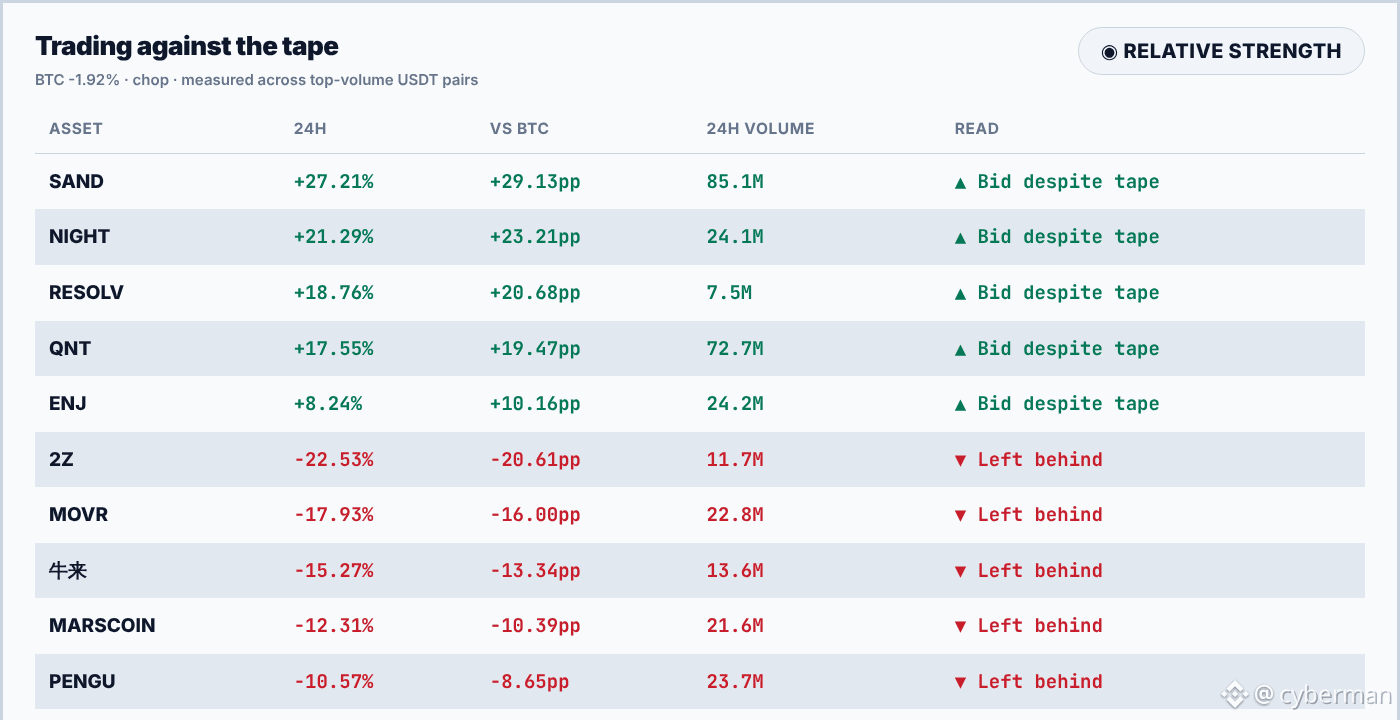
BTC slips sideways -1.92% in 24h, and lots of people are complaining about being bored. But I’m watching the ones that are clearly “going against the tide.” 👀 When the whole market is red, and they’re still green—that’s the point worth noting.
Don’t just look at the absolute % change. What matters is how they perform relative to BTC when the broader market is weak. BTC is down by nearly 2%, yet $SAND is up 27.21%—stronger than BTC by 29.13 percentage points. NIGHT and QNT also have a volume surge. This is the “relative strength” you should be tracking.
On the other hand, 2Z (-22.53%) and MOVR are clearly weaker than BTC. These “drowned” coins are hard to bounce back when the market rebounds. If you’re holding and stuck underwater, you might want to take a second look.
Personally, I’ll focus on strong groups like SAND. When the market recovers, they have the potential for the biggest breakout. As for the weak ones, it’s best to stay away—don’t FOMO into the dip; getting rugged is all too easy. 😏
Do you all share the same view? Or is there a coin I missed? I really like being challenged with counterarguments. 🍻
#Write2Earn #BinanceFutures #CryptoAnalysis
(DYOR—your money, your decision)
---
BTC slips sideways -1.92% in 24h, and lots of people are complaining about being bored. But I’m watching the ones that are clearly “going against the tide.” 👀 When the whole market is red, and they’re still green—that’s the point worth noting.
Don’t just look at the absolute % change. What matters is how they perform relative to BTC when the broader market is weak. BTC is down by nearly 2%, yet $SAND is up 27.21%—stronger than BTC by 29.13 percentage points. NIGHT and QNT also have a volume surge. This is the “relative strength” you should be tracking.
On the other hand, 2Z (-22.53%) and MOVR are clearly weaker than BTC. These “drowned” coins are hard to bounce back when the market rebounds. If you’re holding and stuck underwater, you might want to take a second look.
Personally, I’ll focus on strong groups like SAND. When the market recovers, they have the potential for the biggest breakout. As for the weak ones, it’s best to stay away—don’t FOMO into the dip; getting rugged is all too easy. 😏
Do you all share the same view? Or is there a coin I missed? I really like being challenged with counterarguments. 🍻
#Write2Earn #BinanceFutures #CryptoAnalysis
(DYOR—your money, your decision)
---
Don’t just look at the absolute % change. What matters is how they perform relative to BTC when the broader market is weak. BTC is down by nearly 2%, yet $SAND is up 27.21%—stronger than BTC by 29.13 percentage points. NIGHT and QNT also have a volume surge. This is the “relative strength” you should be tracking.
On the other hand, 2Z (-22.53%) and MOVR are clearly weaker than BTC. These “drowned” coins are hard to bounce back when the market rebounds. If you’re holding and stuck underwater, you might want to take a second look.
Personally, I’ll focus on strong groups like SAND. When the market recovers, they have the potential for the biggest breakout. As for the weak ones, it’s best to stay away—don’t FOMO into the dip; getting rugged is all too easy. 😏
Do you all share the same view? Or is there a coin I missed? I really like being challenged with counterarguments. 🍻
#Write2Earn #BinanceFutures #CryptoAnalysis
(DYOR—your money, your decision)
---
374
·
--
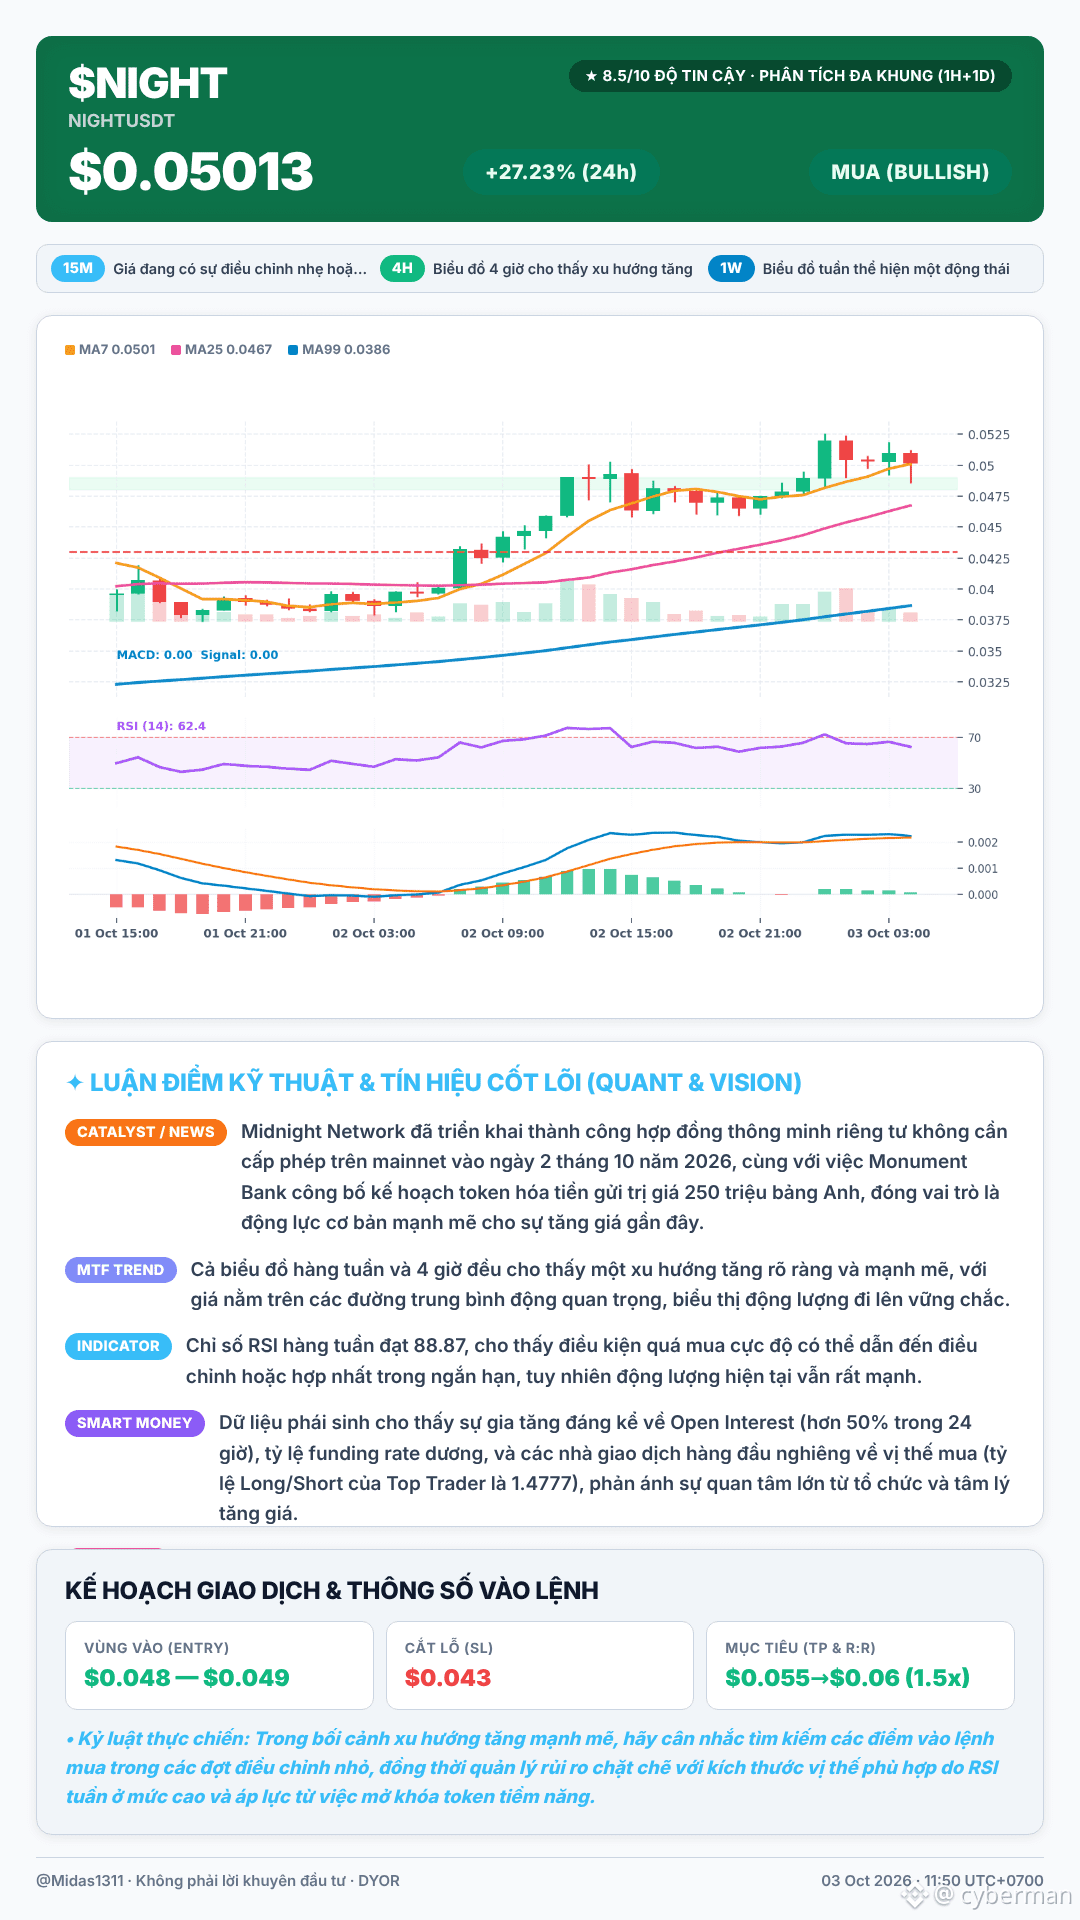
Oh my goodness, $NIGHT what did it just do on the chart 👀 Only 24h and it’s already up +27.23% with volume $22,186,547 USDT—whoever has held this until now, I’m truly bowing in respect!
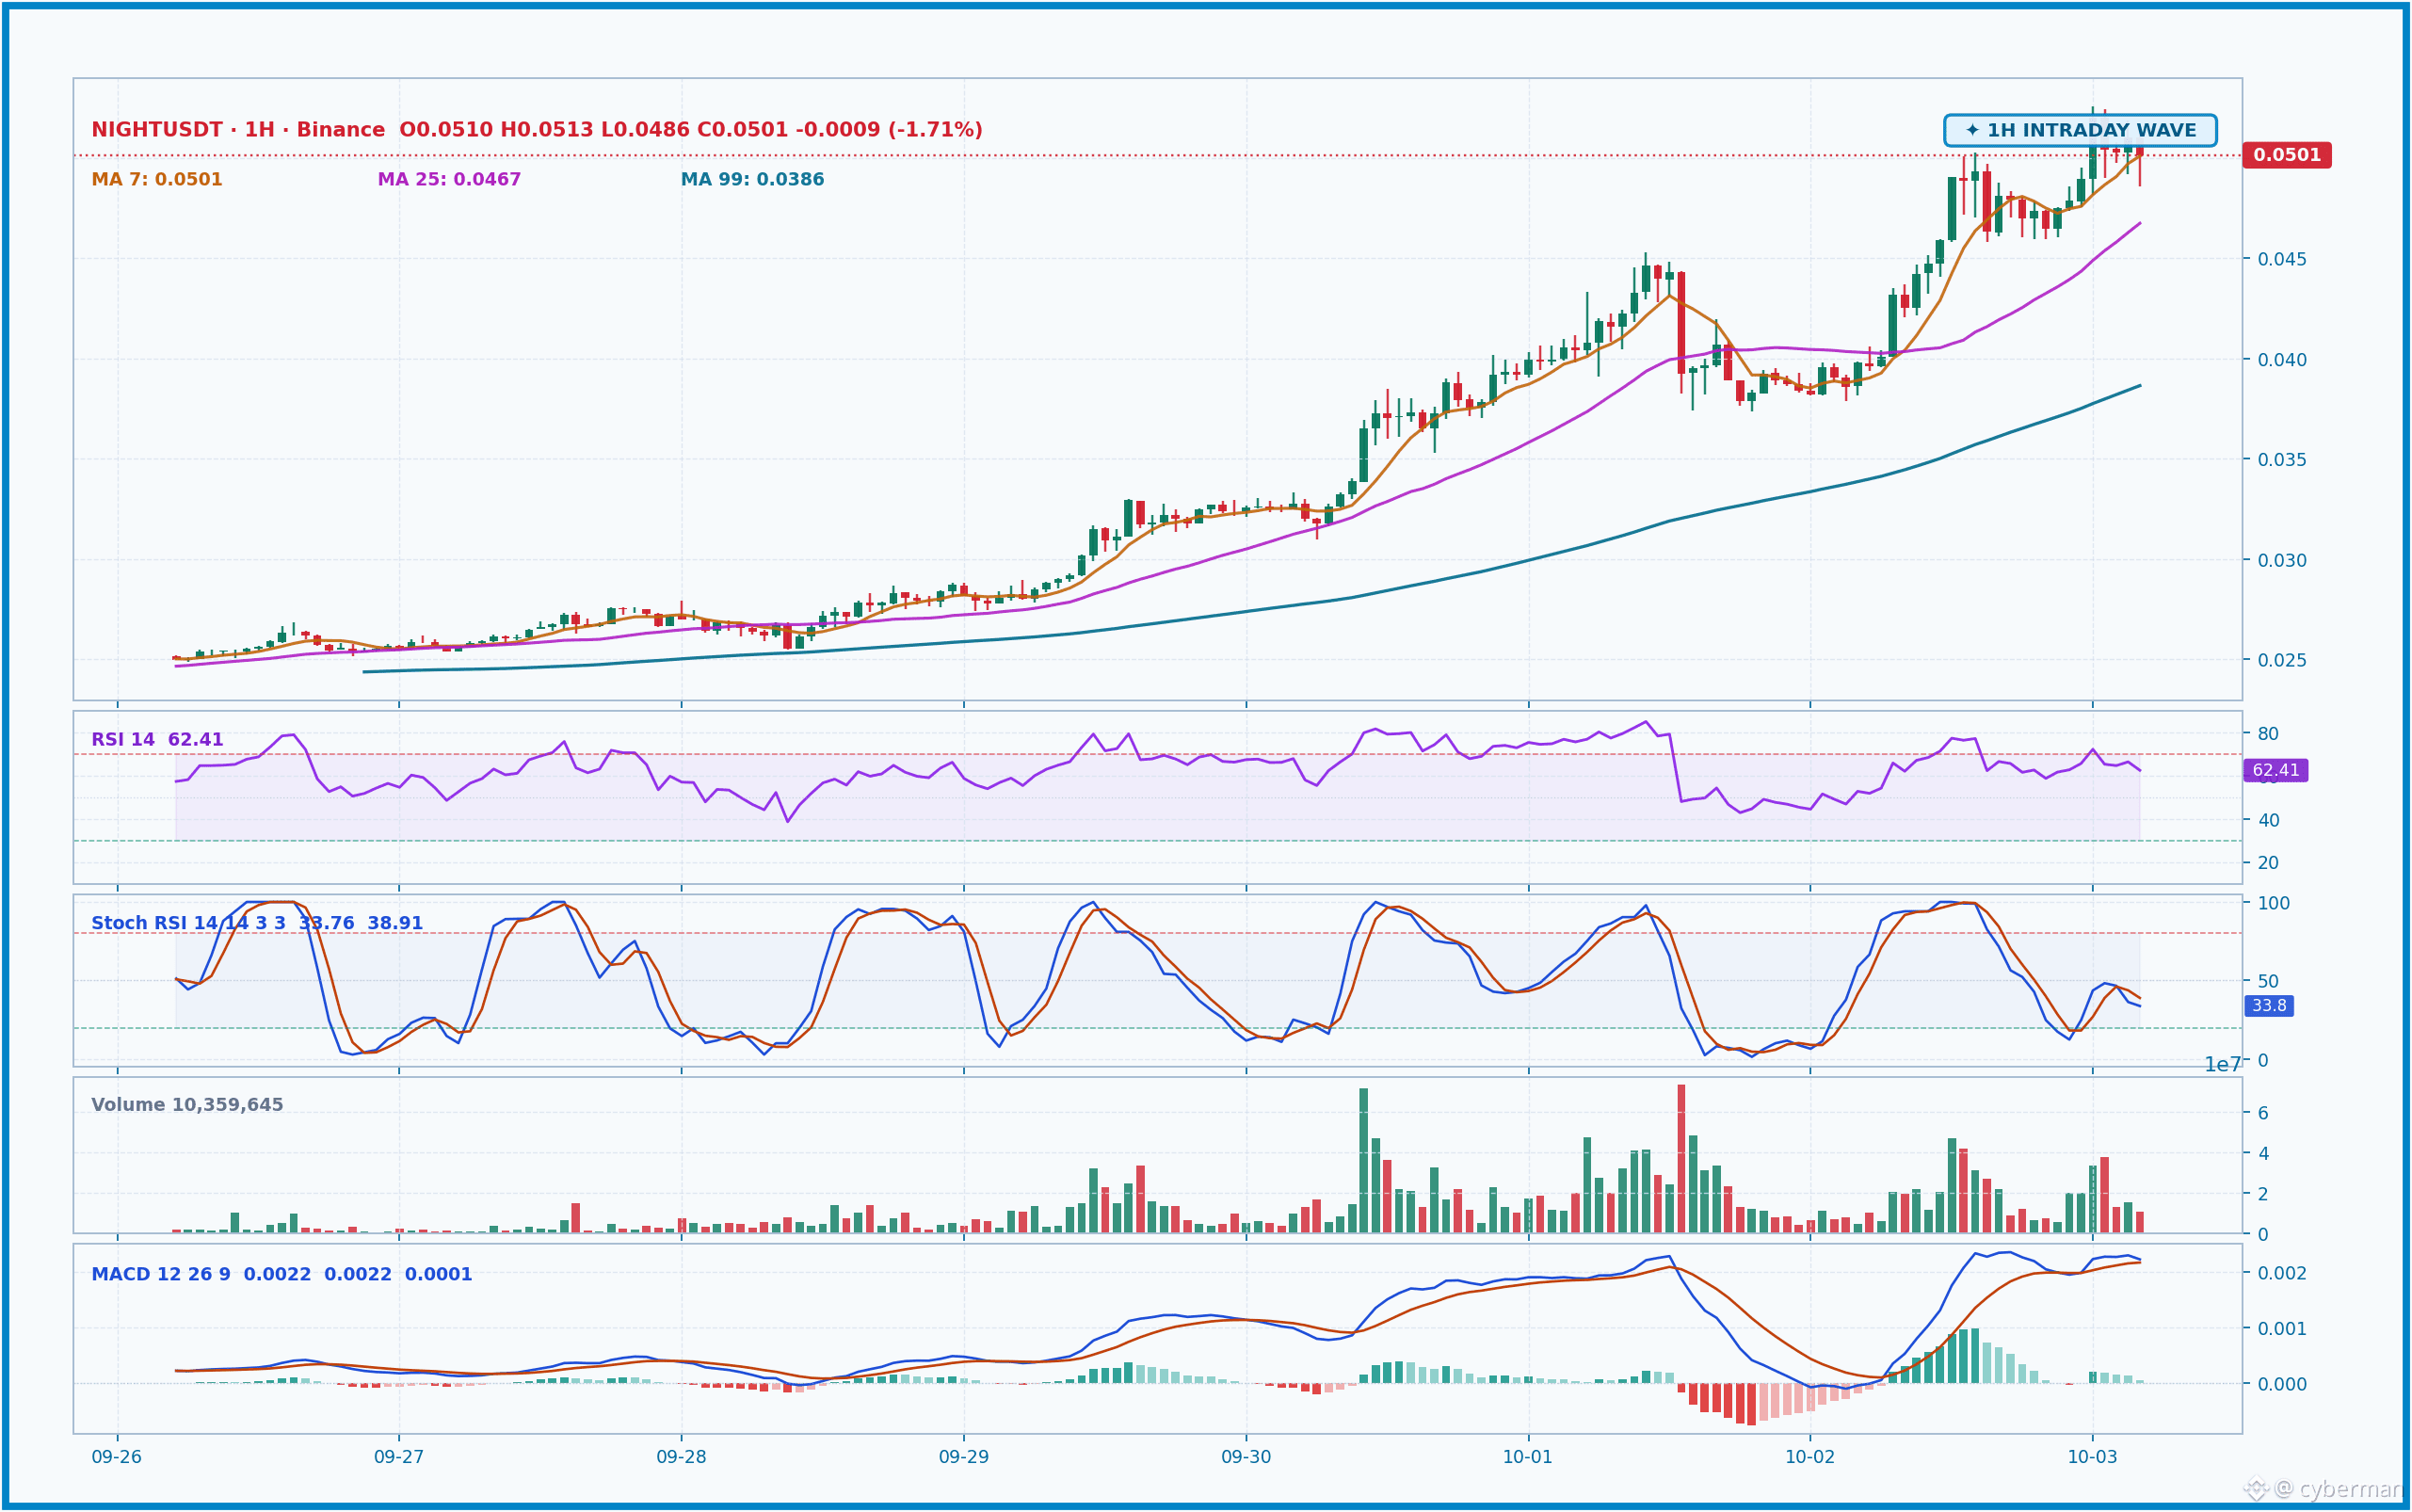
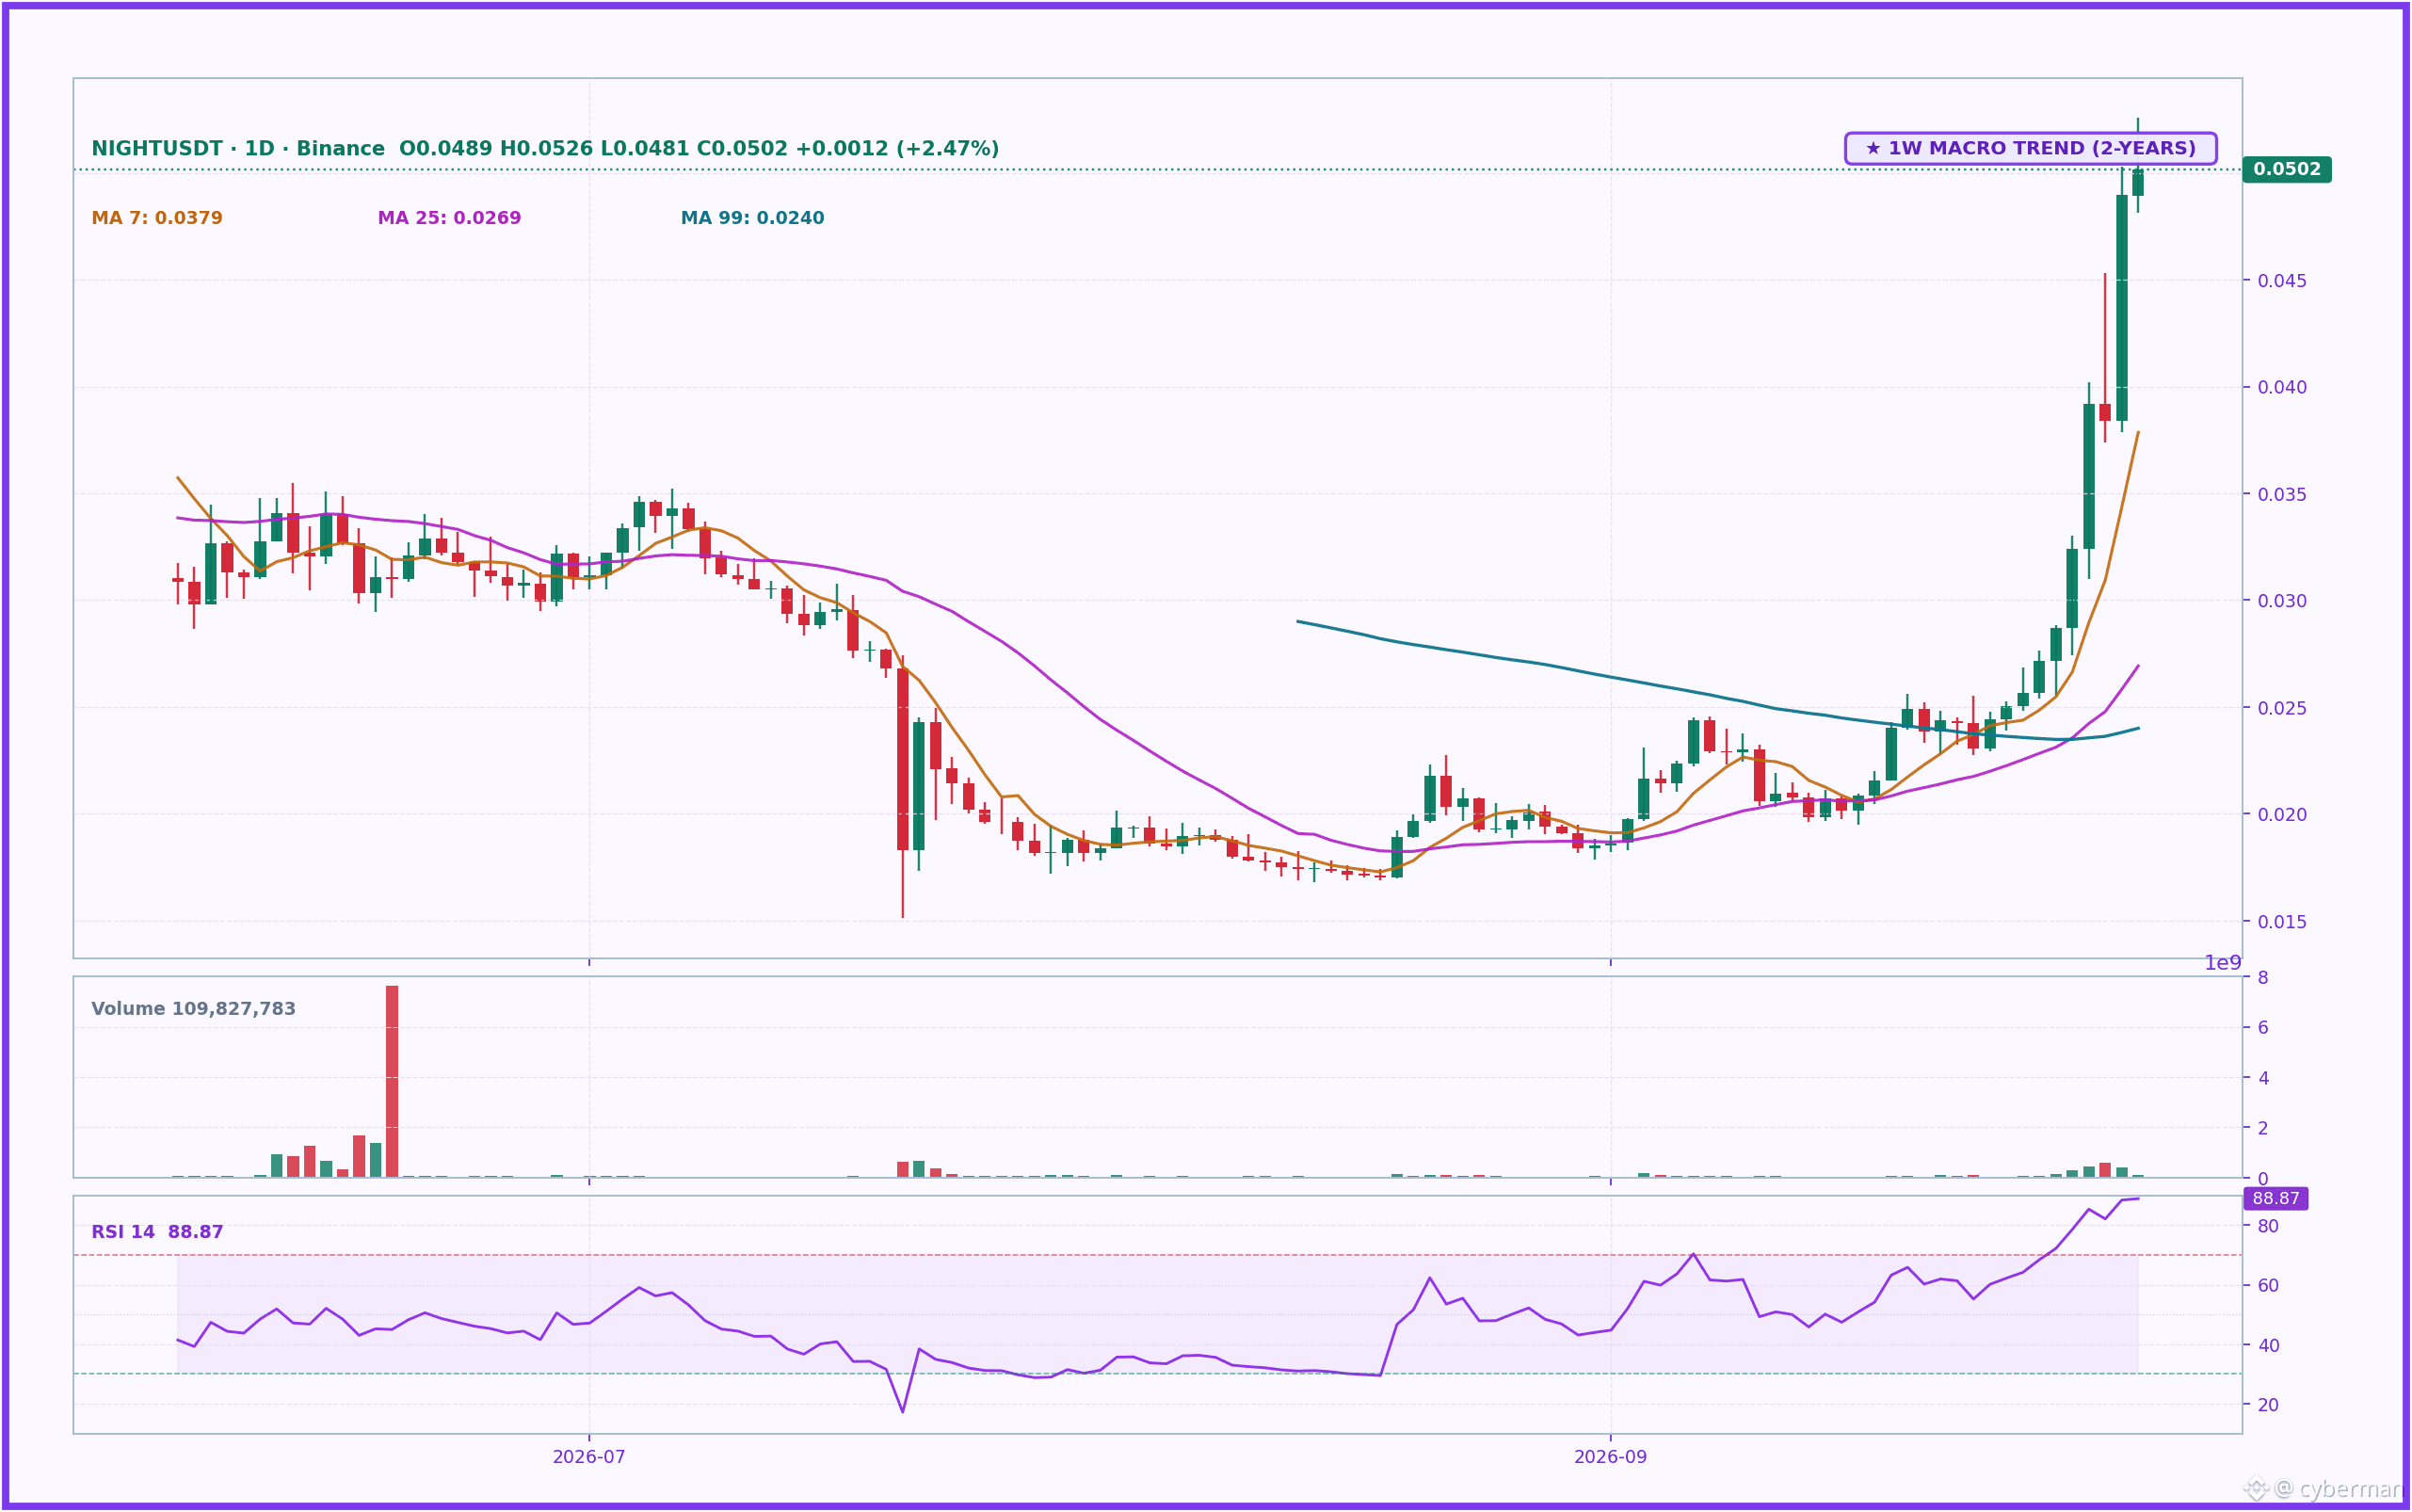
Just look at the 1D chart and you can see the big picture clearly—the uptrend is unmistakable. This wasn’t random, guys; Midnight Network has successfully deployed its own permissionless private smart contracts on the mainnet on October 2, 2026. Along with that, Monument Bank also announced a plan to tokenize deposit funds worth £250 million on Midnight, acting as an extremely strong fundamental driver for this pump. The price has broken through major resistances, and now 0.044 to 0.048 can become support. The MA lines 7, 25, 99 on the 1H and 1D charts are all backing the Long side—the price is sitting comfortably above them. Smart money is also joining in heavily: Open Interest is up +54.0% in 24 hours, the funding rate is soaring positive at +0.0050%/8h, and 51.1% of accounts are Long. This reflects major institutional interest and bullish sentiment.
Oh my goodness, $NIGHT what did it just do on the chart 👀 Only 24h and it’s already up +27.23% with volume $22,186,547 USDT—whoever has held this until now, I’m truly bowing in respect!
Just look at the 1D chart and you can see the big picture clearly—the uptrend is unmistakable. This wasn’t random, guys; Midnight Network has successfully deployed its own permissionless private smart contracts on the mainnet on October 2, 2026. Along with that, Monument Bank also announced a plan to tokenize deposit funds worth £250 million on Midnight, acting as an extremely strong fundamental driver for this pump. The price has broken through major resistances, and now 0.044 to 0.048 can become support. The MA lines 7, 25, 99 on the 1H and 1D charts are all backing the Long side—the price is sitting comfortably above them. Smart money is also joining in heavily: Open Interest is up +54.0% in 24 hours, the funding rate is soaring positive at +0.0050%/8h, and 51.1% of accounts are Long. This reflects major institutional interest and bullish sentiment.
Just look at the 1D chart and you can see the big picture clearly—the uptrend is unmistakable. This wasn’t random, guys; Midnight Network has successfully deployed its own permissionless private smart contracts on the mainnet on October 2, 2026. Along with that, Monument Bank also announced a plan to tokenize deposit funds worth £250 million on Midnight, acting as an extremely strong fundamental driver for this pump. The price has broken through major resistances, and now 0.044 to 0.048 can become support. The MA lines 7, 25, 99 on the 1H and 1D charts are all backing the Long side—the price is sitting comfortably above them. Smart money is also joining in heavily: Open Interest is up +54.0% in 24 hours, the funding rate is soaring positive at +0.0050%/8h, and 51.1% of accounts are Long. This reflects major institutional interest and bullish sentiment.
181
·
--
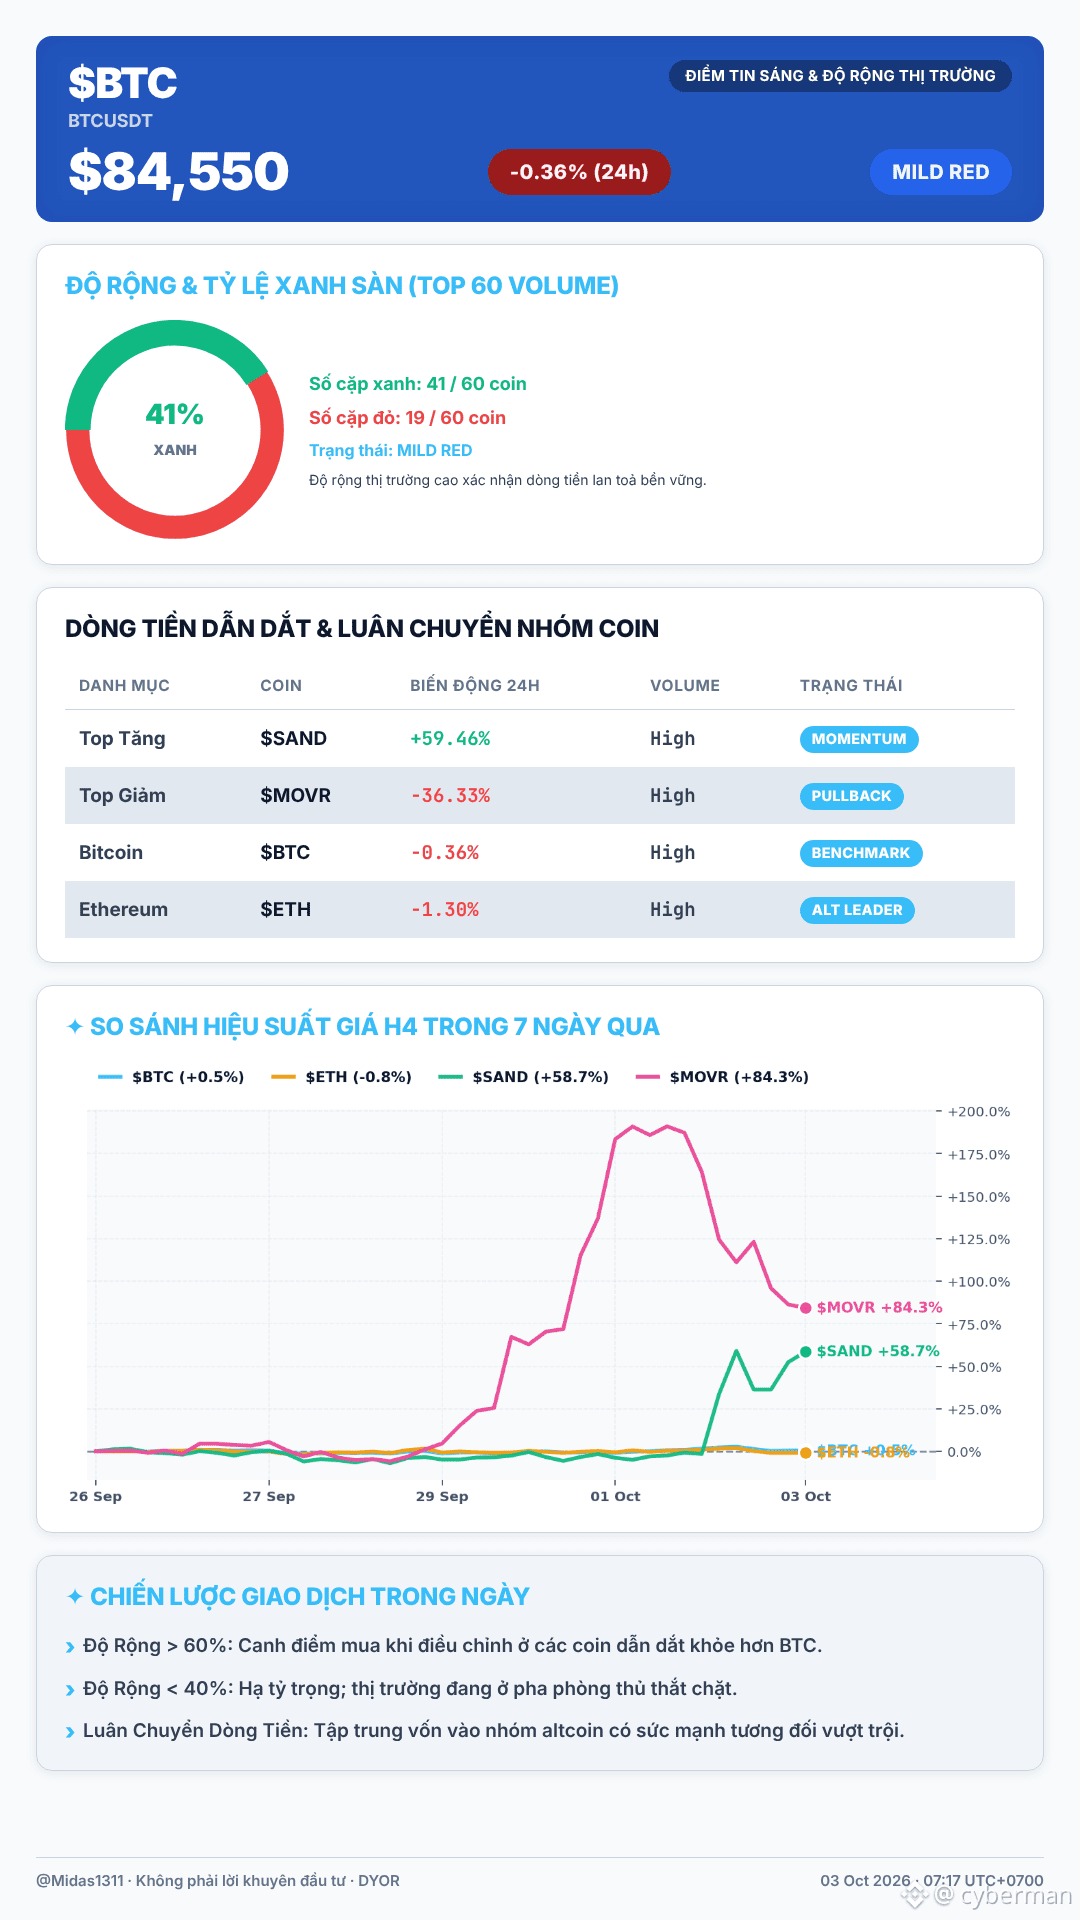
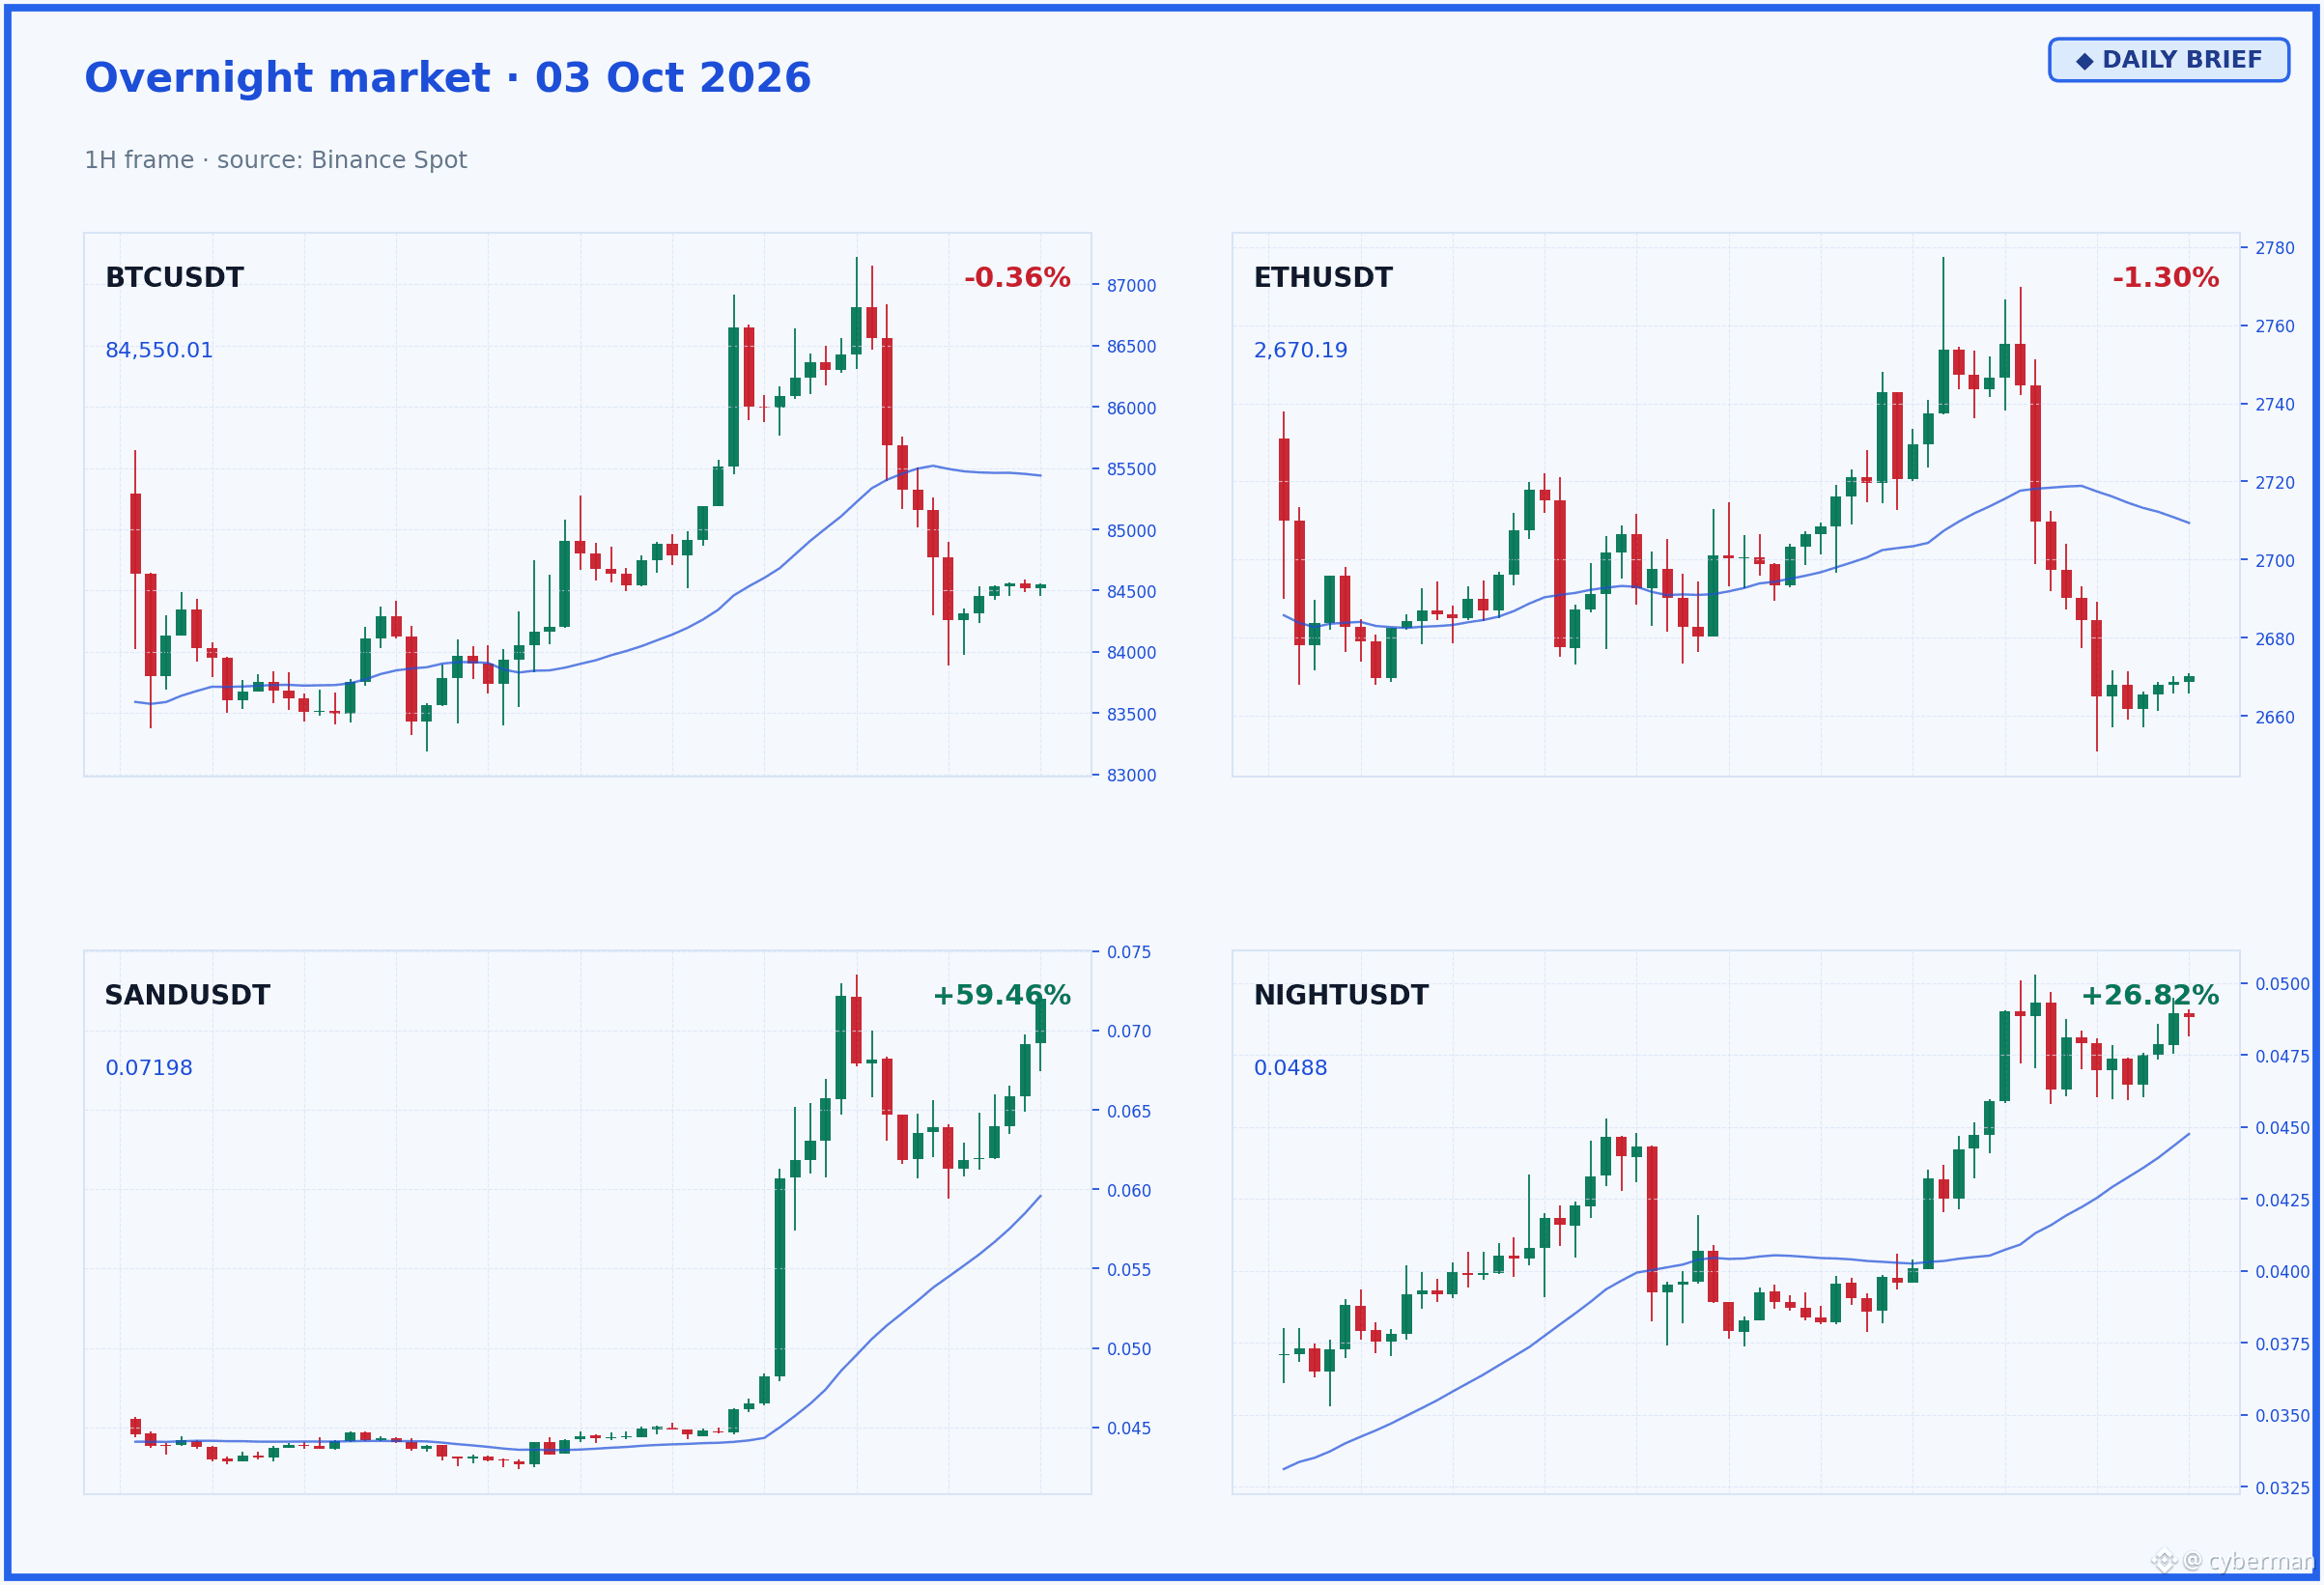
BTC is hovering around $84,550 after a 0.36% overnight drop. US Bitcoin ETF flows rebounded, attracting $102.7 million on 1/10 following a prior sell-off of $148.7 million, bringing the net total for 2026 back into positive territory at $970 million.
Meanwhile, ETH at $2,670 is down 1.30%, with the ETF outflow streak not yet over. Ether ETF funds saw additional net withdrawals of $59.6 million overnight and $55.37 million on 1/10, lifting total net outflows to nearly $118 million over the last 3 sessions. News that the iShares Ethereum Trust ETF will execute a reverse split 1-for-3 on 6/10 is also notable.
Market breadth is only 41% of coins in the green 😐. $SAND d leads up +59.46%, a “deep feast” bet for anyone picking up spots early, alongside NIGHT +26.82%. On the side that got left behind, MOVR fell -36.33%. Market sentiment remains “greedy,” with the Fear & Greed index at 72.
The market is tightening up, waiting for signals from the Fed (expected to keep rates unchanged in October) and the CPI report on 10/14. Are you “holding gains” or “catching a falling knife”?
#Write2Earn #BinanceFutures #MarketUpdate
BTC is hovering around $84,550 after a 0.36% overnight drop. US Bitcoin ETF flows rebounded, attracting $102.7 million on 1/10 following a prior sell-off of $148.7 million, bringing the net total for 2026 back into positive territory at $970 million.
Meanwhile, ETH at $2,670 is down 1.30%, with the ETF outflow streak not yet over. Ether ETF funds saw additional net withdrawals of $59.6 million overnight and $55.37 million on 1/10, lifting total net outflows to nearly $118 million over the last 3 sessions. News that the iShares Ethereum Trust ETF will execute a reverse split 1-for-3 on 6/10 is also notable.
Market breadth is only 41% of coins in the green 😐. $SAND d leads up +59.46%, a “deep feast” bet for anyone picking up spots early, alongside NIGHT +26.82%. On the side that got left behind, MOVR fell -36.33%. Market sentiment remains “greedy,” with the Fear & Greed index at 72.
The market is tightening up, waiting for signals from the Fed (expected to keep rates unchanged in October) and the CPI report on 10/14. Are you “holding gains” or “catching a falling knife”?
#Write2Earn #BinanceFutures #MarketUpdate
Meanwhile, ETH at $2,670 is down 1.30%, with the ETF outflow streak not yet over. Ether ETF funds saw additional net withdrawals of $59.6 million overnight and $55.37 million on 1/10, lifting total net outflows to nearly $118 million over the last 3 sessions. News that the iShares Ethereum Trust ETF will execute a reverse split 1-for-3 on 6/10 is also notable.
Market breadth is only 41% of coins in the green 😐. $SAND d leads up +59.46%, a “deep feast” bet for anyone picking up spots early, alongside NIGHT +26.82%. On the side that got left behind, MOVR fell -36.33%. Market sentiment remains “greedy,” with the Fear & Greed index at 72.
The market is tightening up, waiting for signals from the Fed (expected to keep rates unchanged in October) and the CPI report on 10/14. Are you “holding gains” or “catching a falling knife”?
#Write2Earn #BinanceFutures #MarketUpdate
144
·
--
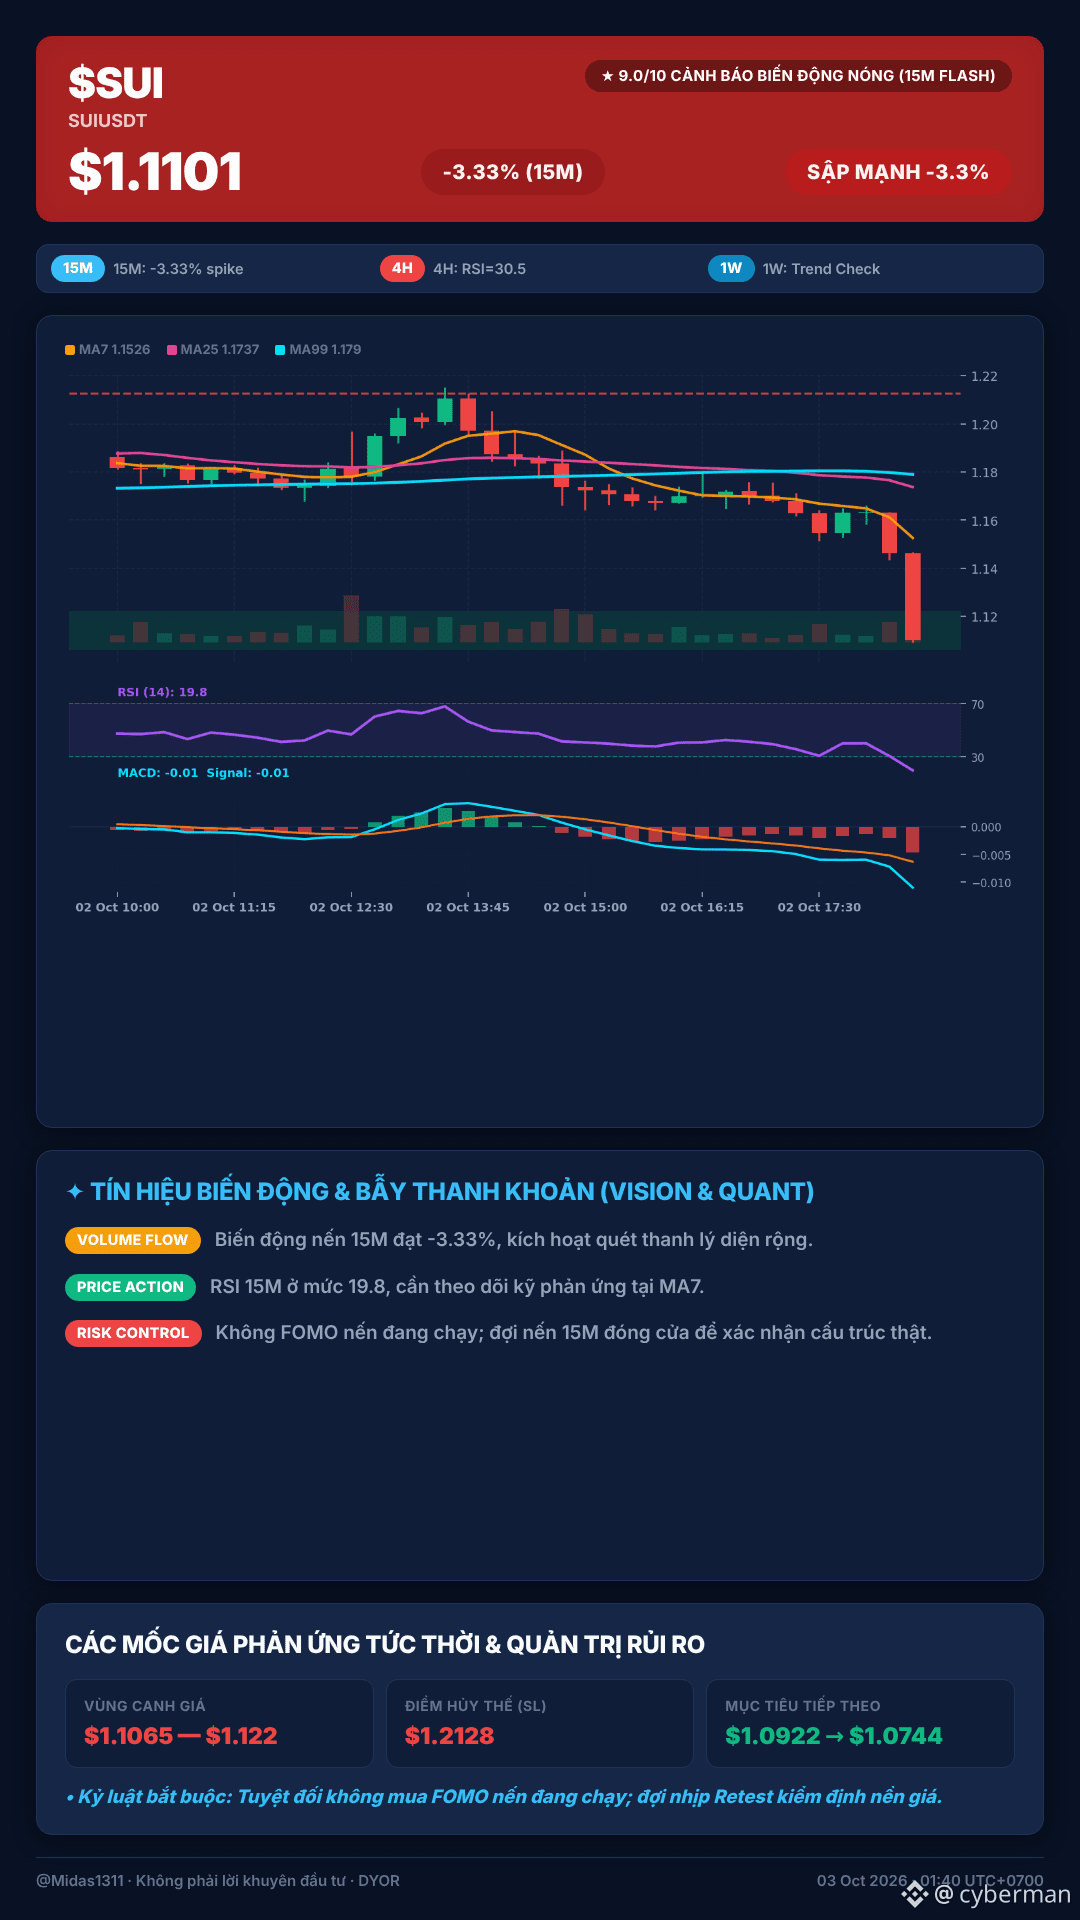
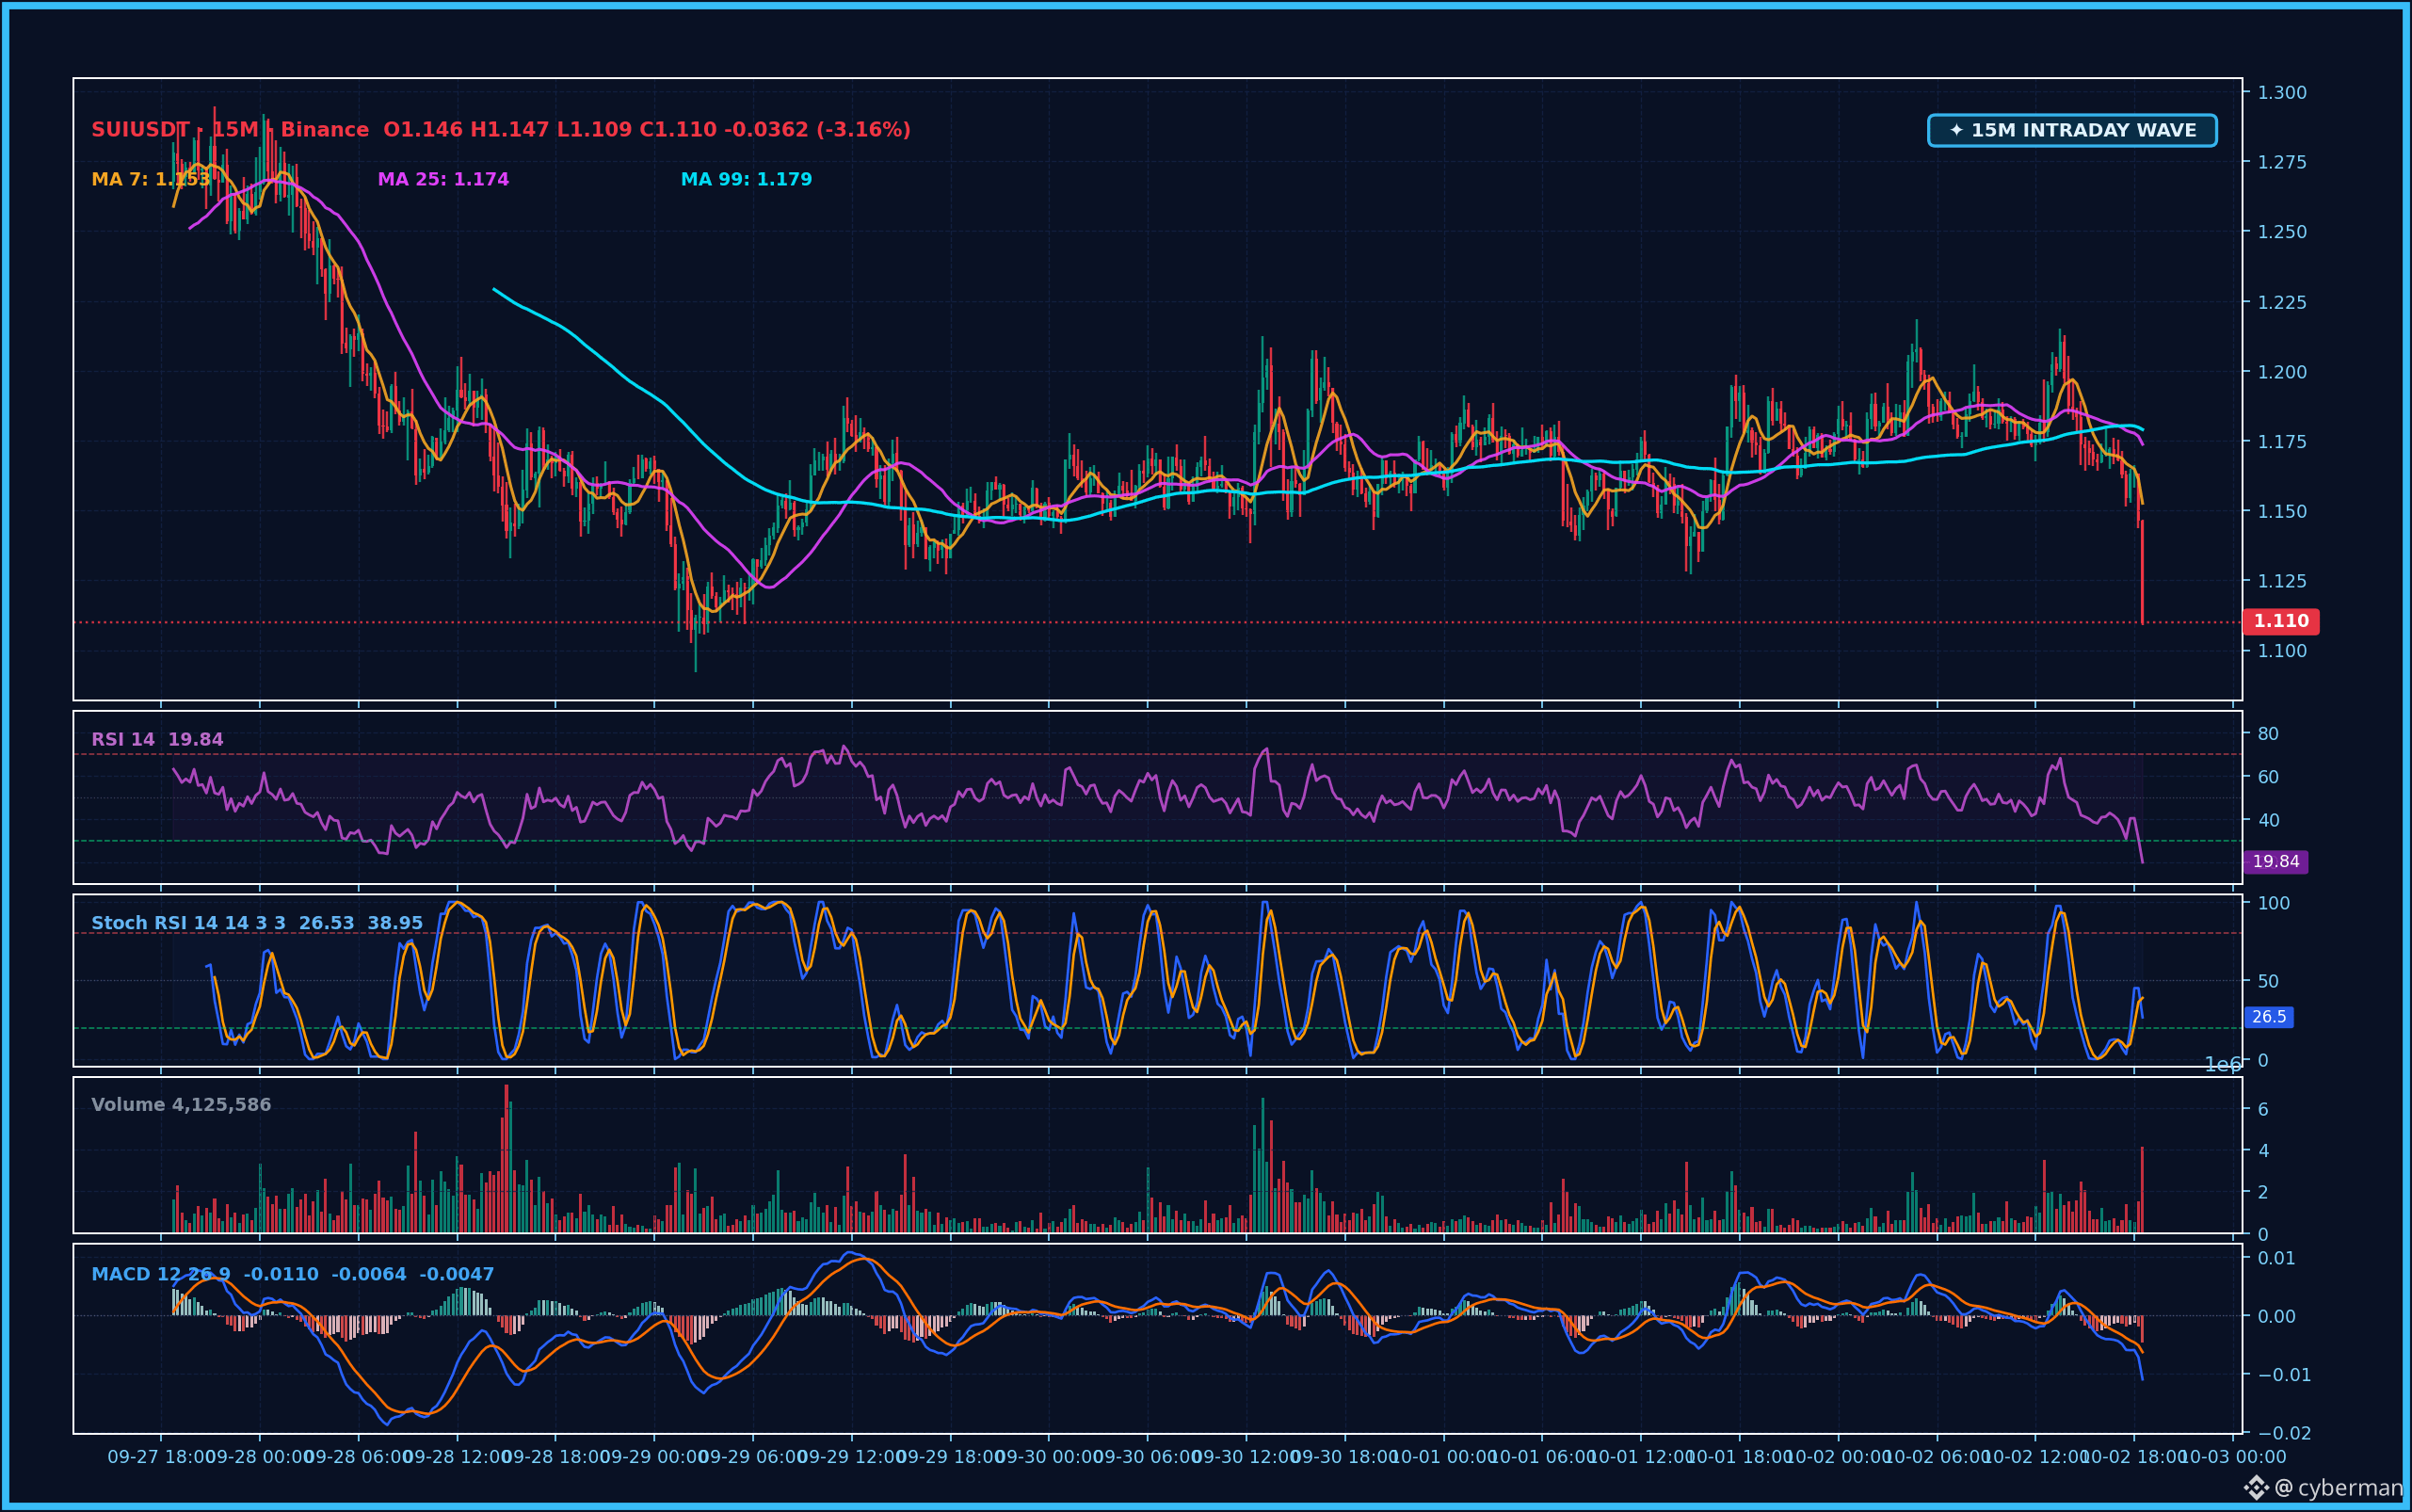
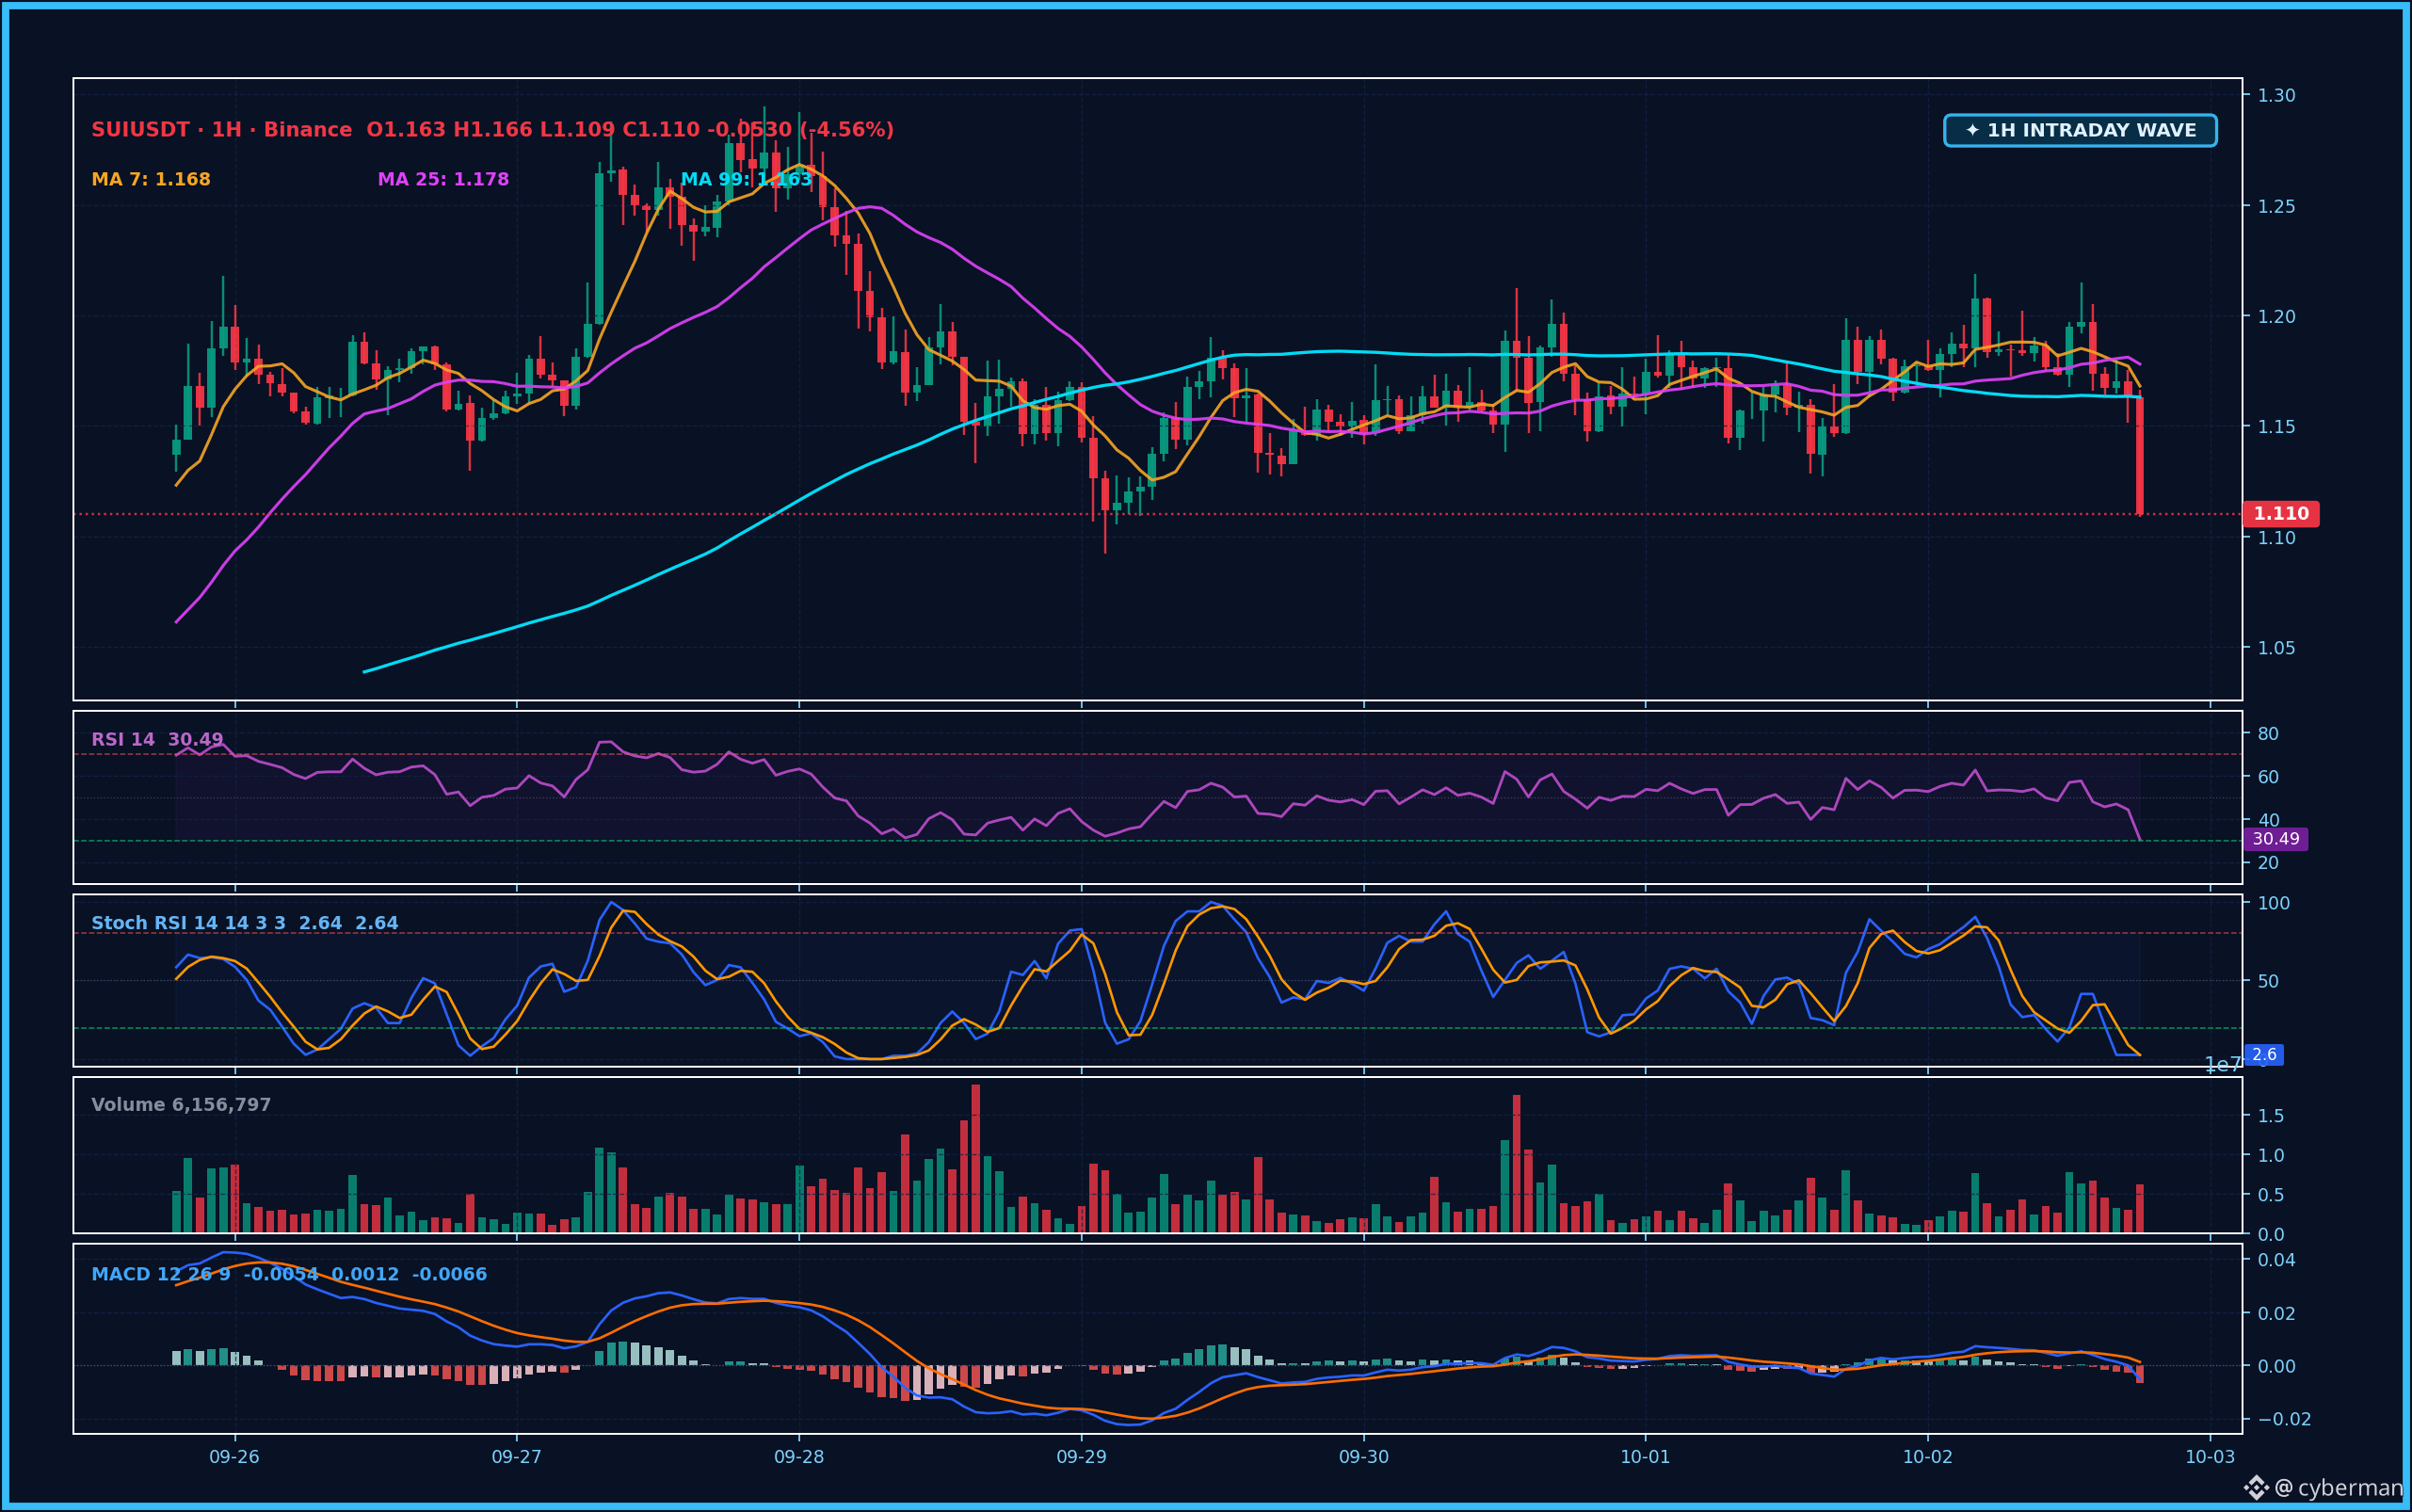
URGENT WARNING $SUI! A flash dump just happened -3.33% to $SUI , hitting $1.1101 right now. The 15M candle has volume 3.8x the average, signaling extremely strong selling pressure. The 15M RSI is at 19.8, showing the asset is severely oversold after a sweeping liquidation move that wiped out long positions. While the funding rate is slightly negative (-0.0014%/8h), the Long ratio is dominant at 70.6% and OI is up 1.9%, which clearly looks like a shakeout to accumulate or to sweep stop-losses. Brothers, ABSOLUTELY do not FOMO into the top or catch a falling knife when there isn’t a confirmed candle closing firmly above the support zone at $1.109. The nearest resistance is around $1.1526 (MA7 on 15M), and farther out is $1.21xx. Will $SUI hold the $1.109 level, brothers? Share your take! $SUI #EmergencyAlert #CryptoAlert
---
🌐 EN: FLASH ALERT: $SUI just experienced a -3.33% flash dump, hitting $1.1101 with 3.8x average volume, indicating a strong liquidation sweep targeting longs given 70.6% long ratio and negative funding.
URGENT WARNING $SUI ! A flash dump just happened -3.33% to $SUI , hitting $1.1101 right now. The 15M candle has volume 3.8x the average, signaling extremely strong selling pressure. The 15M RSI is at 19.8, showing the asset is severely oversold after a sweeping liquidation move that wiped out long positions. While the funding rate is slightly negative (-0.0014%/8h), the Long ratio is dominant at 70.6% and OI is up 1.9%, which clearly looks like a shakeout to accumulate or to sweep stop-losses. Brothers, ABSOLUTELY do not FOMO into the top or catch a falling knife when there isn’t a confirmed candle closing firmly above the support zone at $1.109. The nearest resistance is around $1.1526 (MA7 on 15M), and farther out is $1.21xx. Will $SUI hold the $1.109 level, brothers? Share your take! $SUI #EmergencyAlert #CryptoAlert
---
🌐 EN: FLASH ALERT: $SUI just experienced a -3.33% flash dump, hitting $1.1101 with 3.8x average volume, indicating a strong liquidation sweep targeting longs given 70.6% long ratio and negative funding.
---
🌐 EN: FLASH ALERT: $SUI just experienced a -3.33% flash dump, hitting $1.1101 with 3.8x average volume, indicating a strong liquidation sweep targeting longs given 70.6% long ratio and negative funding.
24
·
--
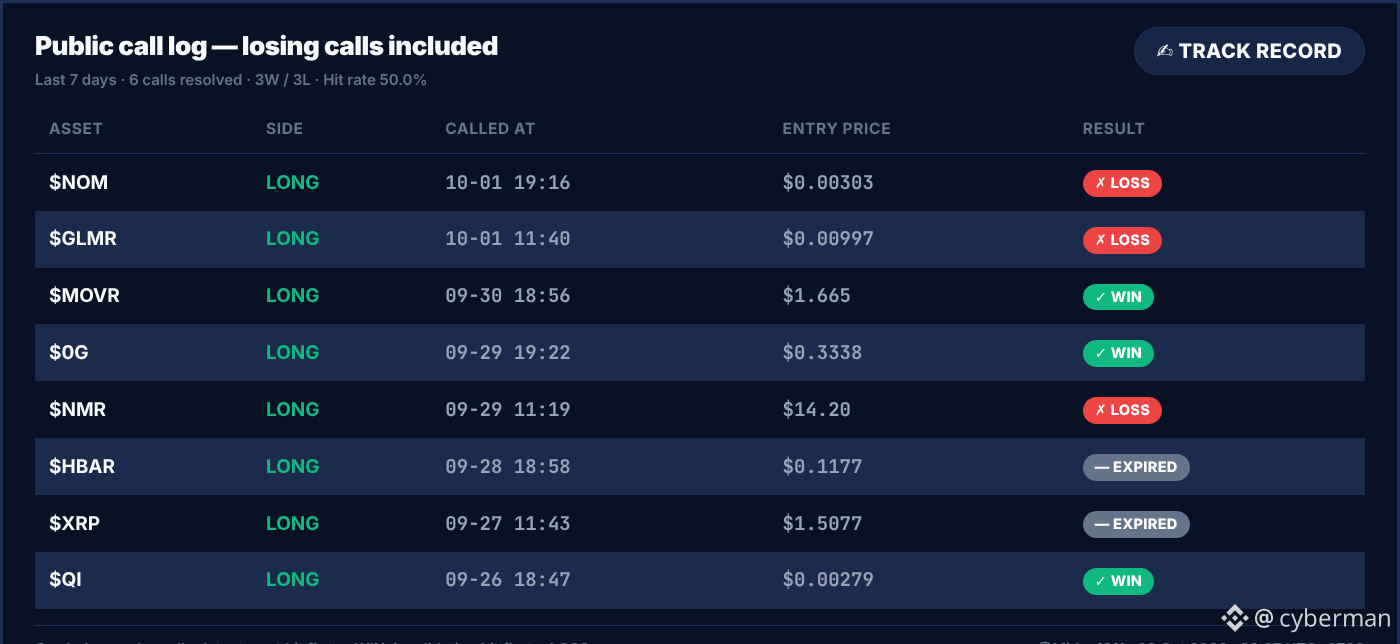
The BTC market has been battling back and forth these past days, and I’ve been just as conflicted when looking back at last week’s order log. In 7 days, we called 8 trades, and of the 6 that closed, it was exactly 3 correct and 3 wrong. A nice round 50%—to be honest, I’m not exactly happy 😅.
Let’s get straight to the trades that went bad. The NOMUSDT trade lost its invalidation level of 0.002800 fairly quickly on 1/10. Entry was 0.00303. I expected to catch a bounce, but selling pressure was too strong—the structure broke immediately. I was too complacent for not checking the volume and the overall market pressure carefully enough. 💀
GLMRUSDT met the same fate on 1/10 as well, breaking 0.009100. I entered a bit too hastily here: the confirm signal wasn’t clear yet, but I picked up the spot already, and it blew up quickly.
NMRUSDT called a LONG at $14.20. The plan was to break through the resistance, but the force wasn’t enough. It got pushed down to the invalidation at 11.500000. This is a regrettable trade because after that, price ran again exactly in the direction of the target—but I had already been stopped out by the SL. Maybe I should set a wider SL a bit, or wait for a retest of a stronger support zone.
As for the trades that went well, they were pretty smooth. MOVRUSDT called a LONG at 1.665 and hit the target 2.000000 neatly.
The BTC market has been battling back and forth these past days, and I’ve been just as conflicted when looking back at last week’s order log. In 7 days, we called 8 trades, and of the 6 that closed, it was exactly 3 correct and 3 wrong. A nice round 50%—to be honest, I’m not exactly happy 😅.
Let’s get straight to the trades that went bad. The NOMUSDT trade lost its invalidation level of 0.002800 fairly quickly on 1/10. Entry was 0.00303. I expected to catch a bounce, but selling pressure was too strong—the structure broke immediately. I was too complacent for not checking the volume and the overall market pressure carefully enough. 💀
GLMRUSDT met the same fate on 1/10 as well, breaking 0.009100. I entered a bit too hastily here: the confirm signal wasn’t clear yet, but I picked up the spot already, and it blew up quickly.
NMRUSDT called a LONG at $14.20. The plan was to break through the resistance, but the force wasn’t enough. It got pushed down to the invalidation at 11.500000. This is a regrettable trade because after that, price ran again exactly in the direction of the target—but I had already been stopped out by the SL. Maybe I should set a wider SL a bit, or wait for a retest of a stronger support zone.
As for the trades that went well, they were pretty smooth. MOVRUSDT called a LONG at 1.665 and hit the target 2.000000 neatly.
Let’s get straight to the trades that went bad. The NOMUSDT trade lost its invalidation level of 0.002800 fairly quickly on 1/10. Entry was 0.00303. I expected to catch a bounce, but selling pressure was too strong—the structure broke immediately. I was too complacent for not checking the volume and the overall market pressure carefully enough. 💀
GLMRUSDT met the same fate on 1/10 as well, breaking 0.009100. I entered a bit too hastily here: the confirm signal wasn’t clear yet, but I picked up the spot already, and it blew up quickly.
NMRUSDT called a LONG at $14.20. The plan was to break through the resistance, but the force wasn’t enough. It got pushed down to the invalidation at 11.500000. This is a regrettable trade because after that, price ran again exactly in the direction of the target—but I had already been stopped out by the SL. Maybe I should set a wider SL a bit, or wait for a retest of a stronger support zone.
As for the trades that went well, they were pretty smooth. MOVRUSDT called a LONG at 1.665 and hit the target 2.000000 neatly.
334
·
--
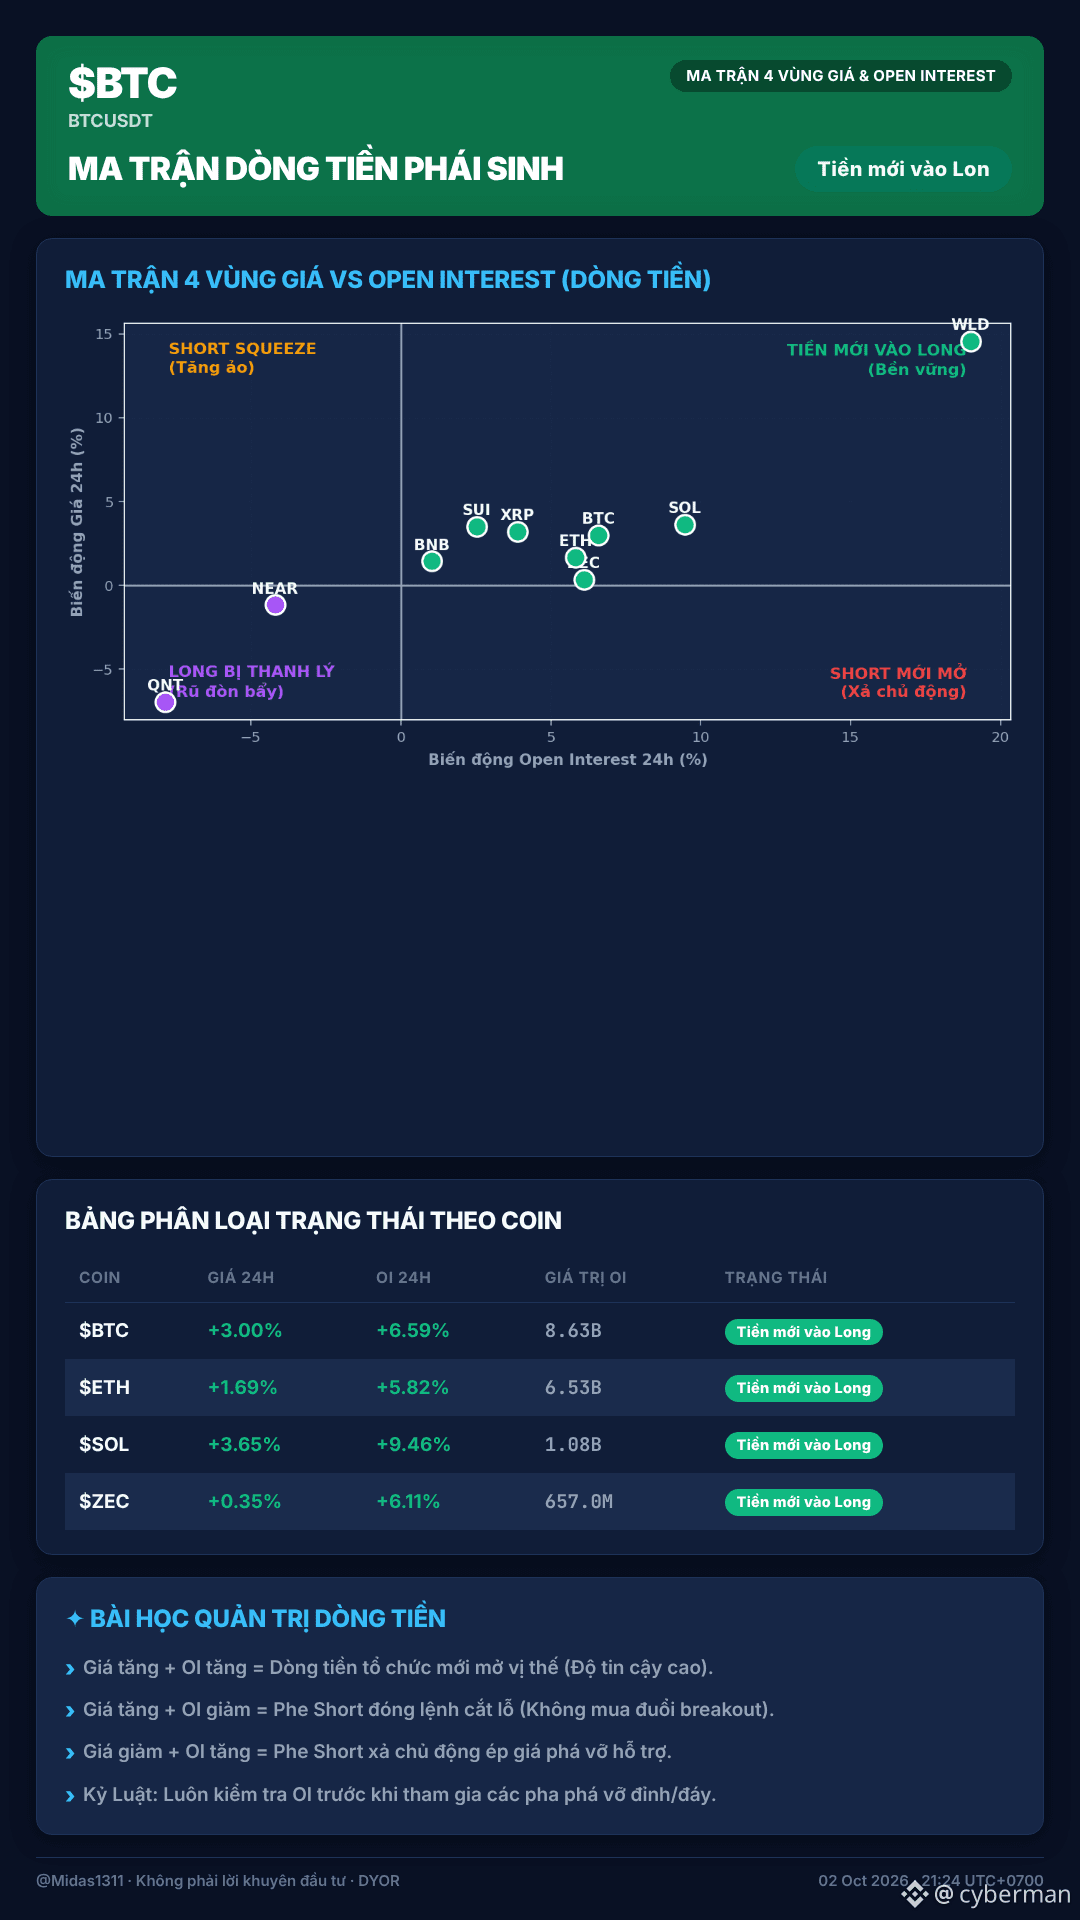
A green candle in 24h is not always a “sure thing.” You need to examine Open Interest (OI) carefully to see where the real money is actually going—not just some “pump-and-dump” or “luring the flock” scheme. 🤓
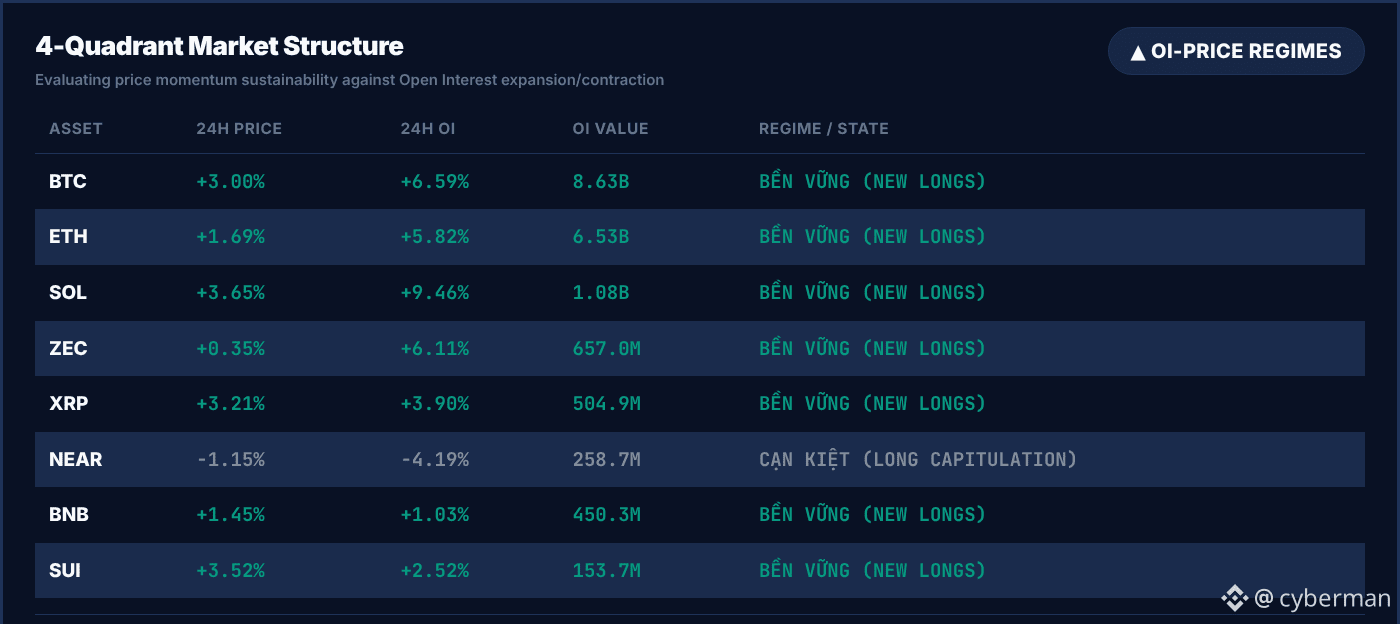
Looking at the data, $BTC rose 3.00% alongside OI +6.59%, and Solana (SOL) jumped 3.65% with OI +9.46%—both are classic examples of fresh capital flowing into Long positions. This is a sign of sustainable upward momentum and a stable hunting ground for setups. Conversely, NEAR fell 1.15% and OI dropped 4.19%. That indicates the Long side is running out of steam, cutting losses. This zone is often a potential bottom, waiting for new capital to arrive. 🧮
Not every green setup is durable. Sometimes price rises but OI declines, like when the Short side gets liquidated. That kind of trade is more likely to run out of energy, with weak momentum, causing investors to “take profits too early” or get stuck holding bags. On the other hand, when price drops and OI increases, it’s a sign the Short side is confident and opening new positions, pushing prices even lower. 📐
So what’s the takeaway? Don’t just look at price and fomo. Always check OI before putting money in.
A green candle in 24h is not always a “sure thing.” You need to examine Open Interest (OI) carefully to see where the real money is actually going—not just some “pump-and-dump” or “luring the flock” scheme. 🤓
Looking at the data, $BTC rose 3.00% alongside OI +6.59%, and Solana (SOL) jumped 3.65% with OI +9.46%—both are classic examples of fresh capital flowing into Long positions. This is a sign of sustainable upward momentum and a stable hunting ground for setups. Conversely, NEAR fell 1.15% and OI dropped 4.19%. That indicates the Long side is running out of steam, cutting losses. This zone is often a potential bottom, waiting for new capital to arrive. 🧮
Not every green setup is durable. Sometimes price rises but OI declines, like when the Short side gets liquidated. That kind of trade is more likely to run out of energy, with weak momentum, causing investors to “take profits too early” or get stuck holding bags. On the other hand, when price drops and OI increases, it’s a sign the Short side is confident and opening new positions, pushing prices even lower. 📐
So what’s the takeaway? Don’t just look at price and fomo. Always check OI before putting money in.
Looking at the data, $BTC rose 3.00% alongside OI +6.59%, and Solana (SOL) jumped 3.65% with OI +9.46%—both are classic examples of fresh capital flowing into Long positions. This is a sign of sustainable upward momentum and a stable hunting ground for setups. Conversely, NEAR fell 1.15% and OI dropped 4.19%. That indicates the Long side is running out of steam, cutting losses. This zone is often a potential bottom, waiting for new capital to arrive. 🧮
Not every green setup is durable. Sometimes price rises but OI declines, like when the Short side gets liquidated. That kind of trade is more likely to run out of energy, with weak momentum, causing investors to “take profits too early” or get stuck holding bags. On the other hand, when price drops and OI increases, it’s a sign the Short side is confident and opening new positions, pushing prices even lower. 📐
So what’s the takeaway? Don’t just look at price and fomo. Always check OI before putting money in.
233
·
--
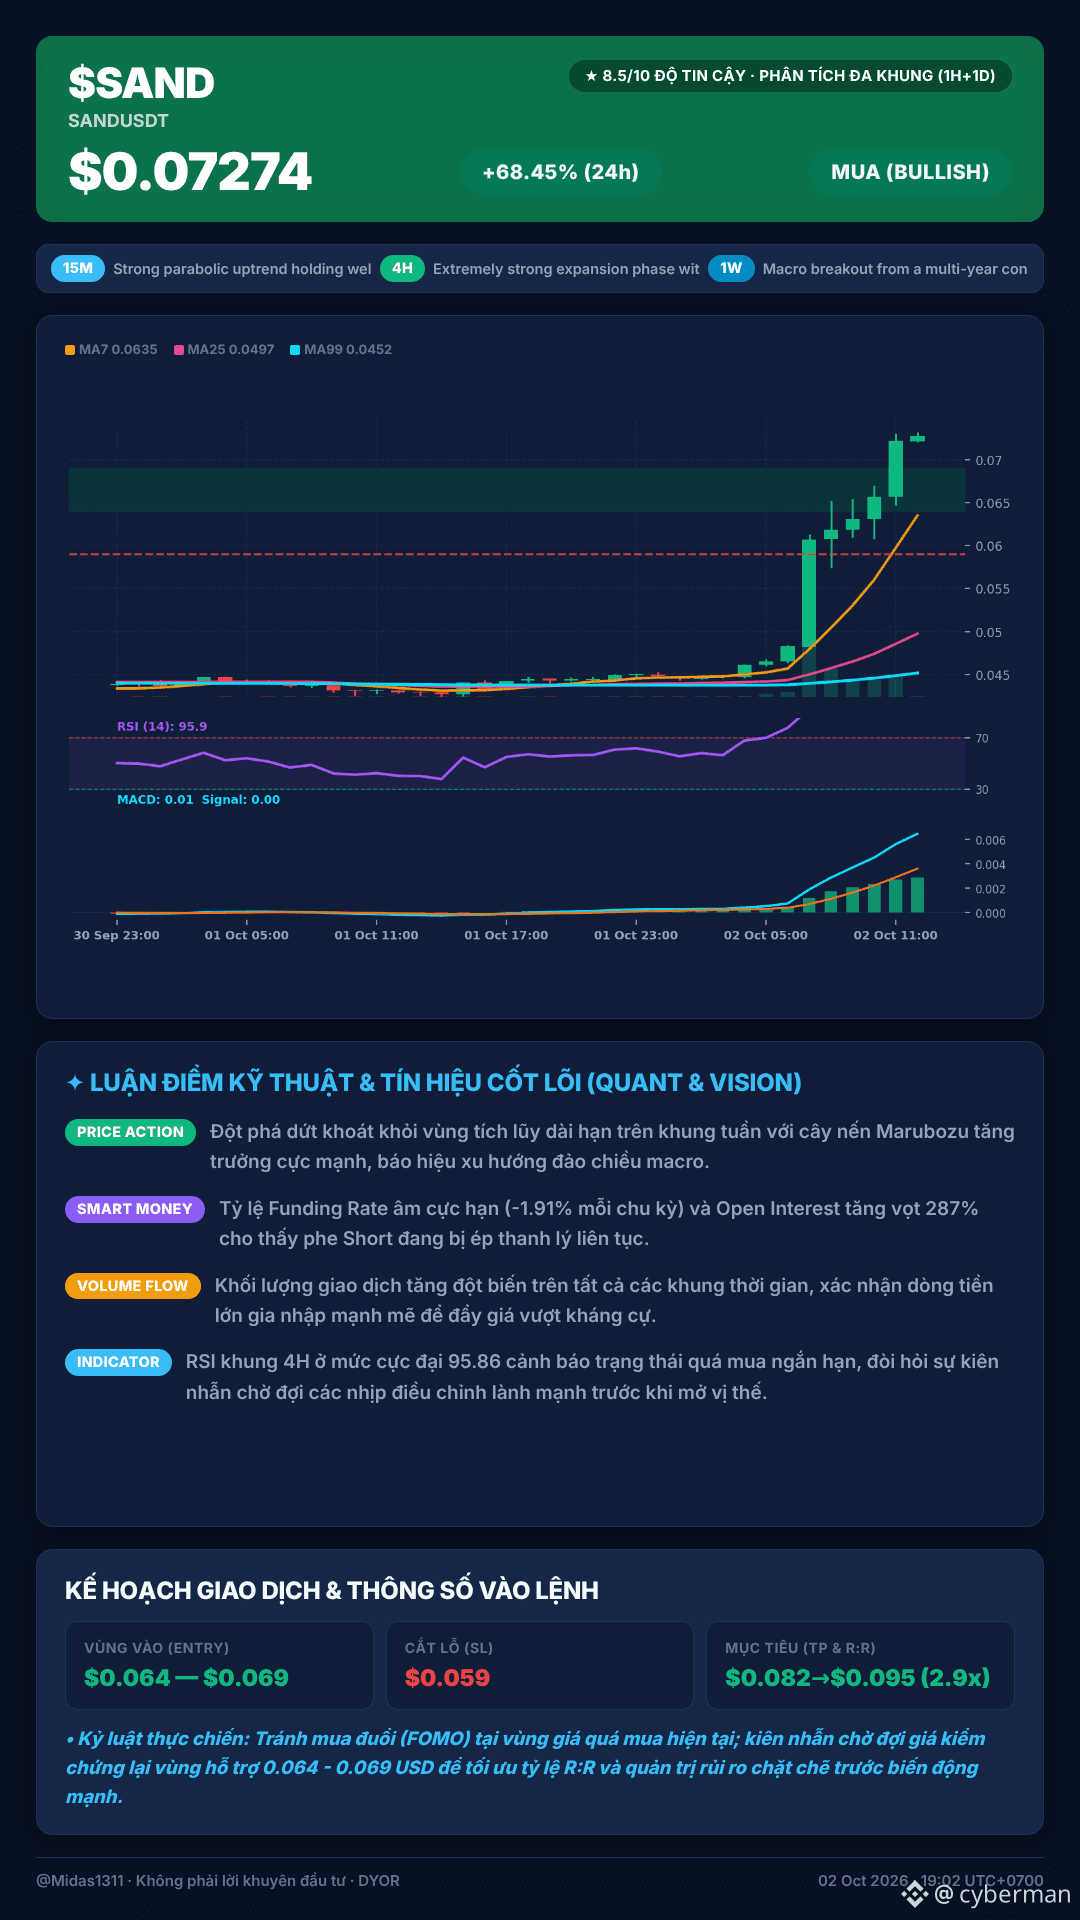
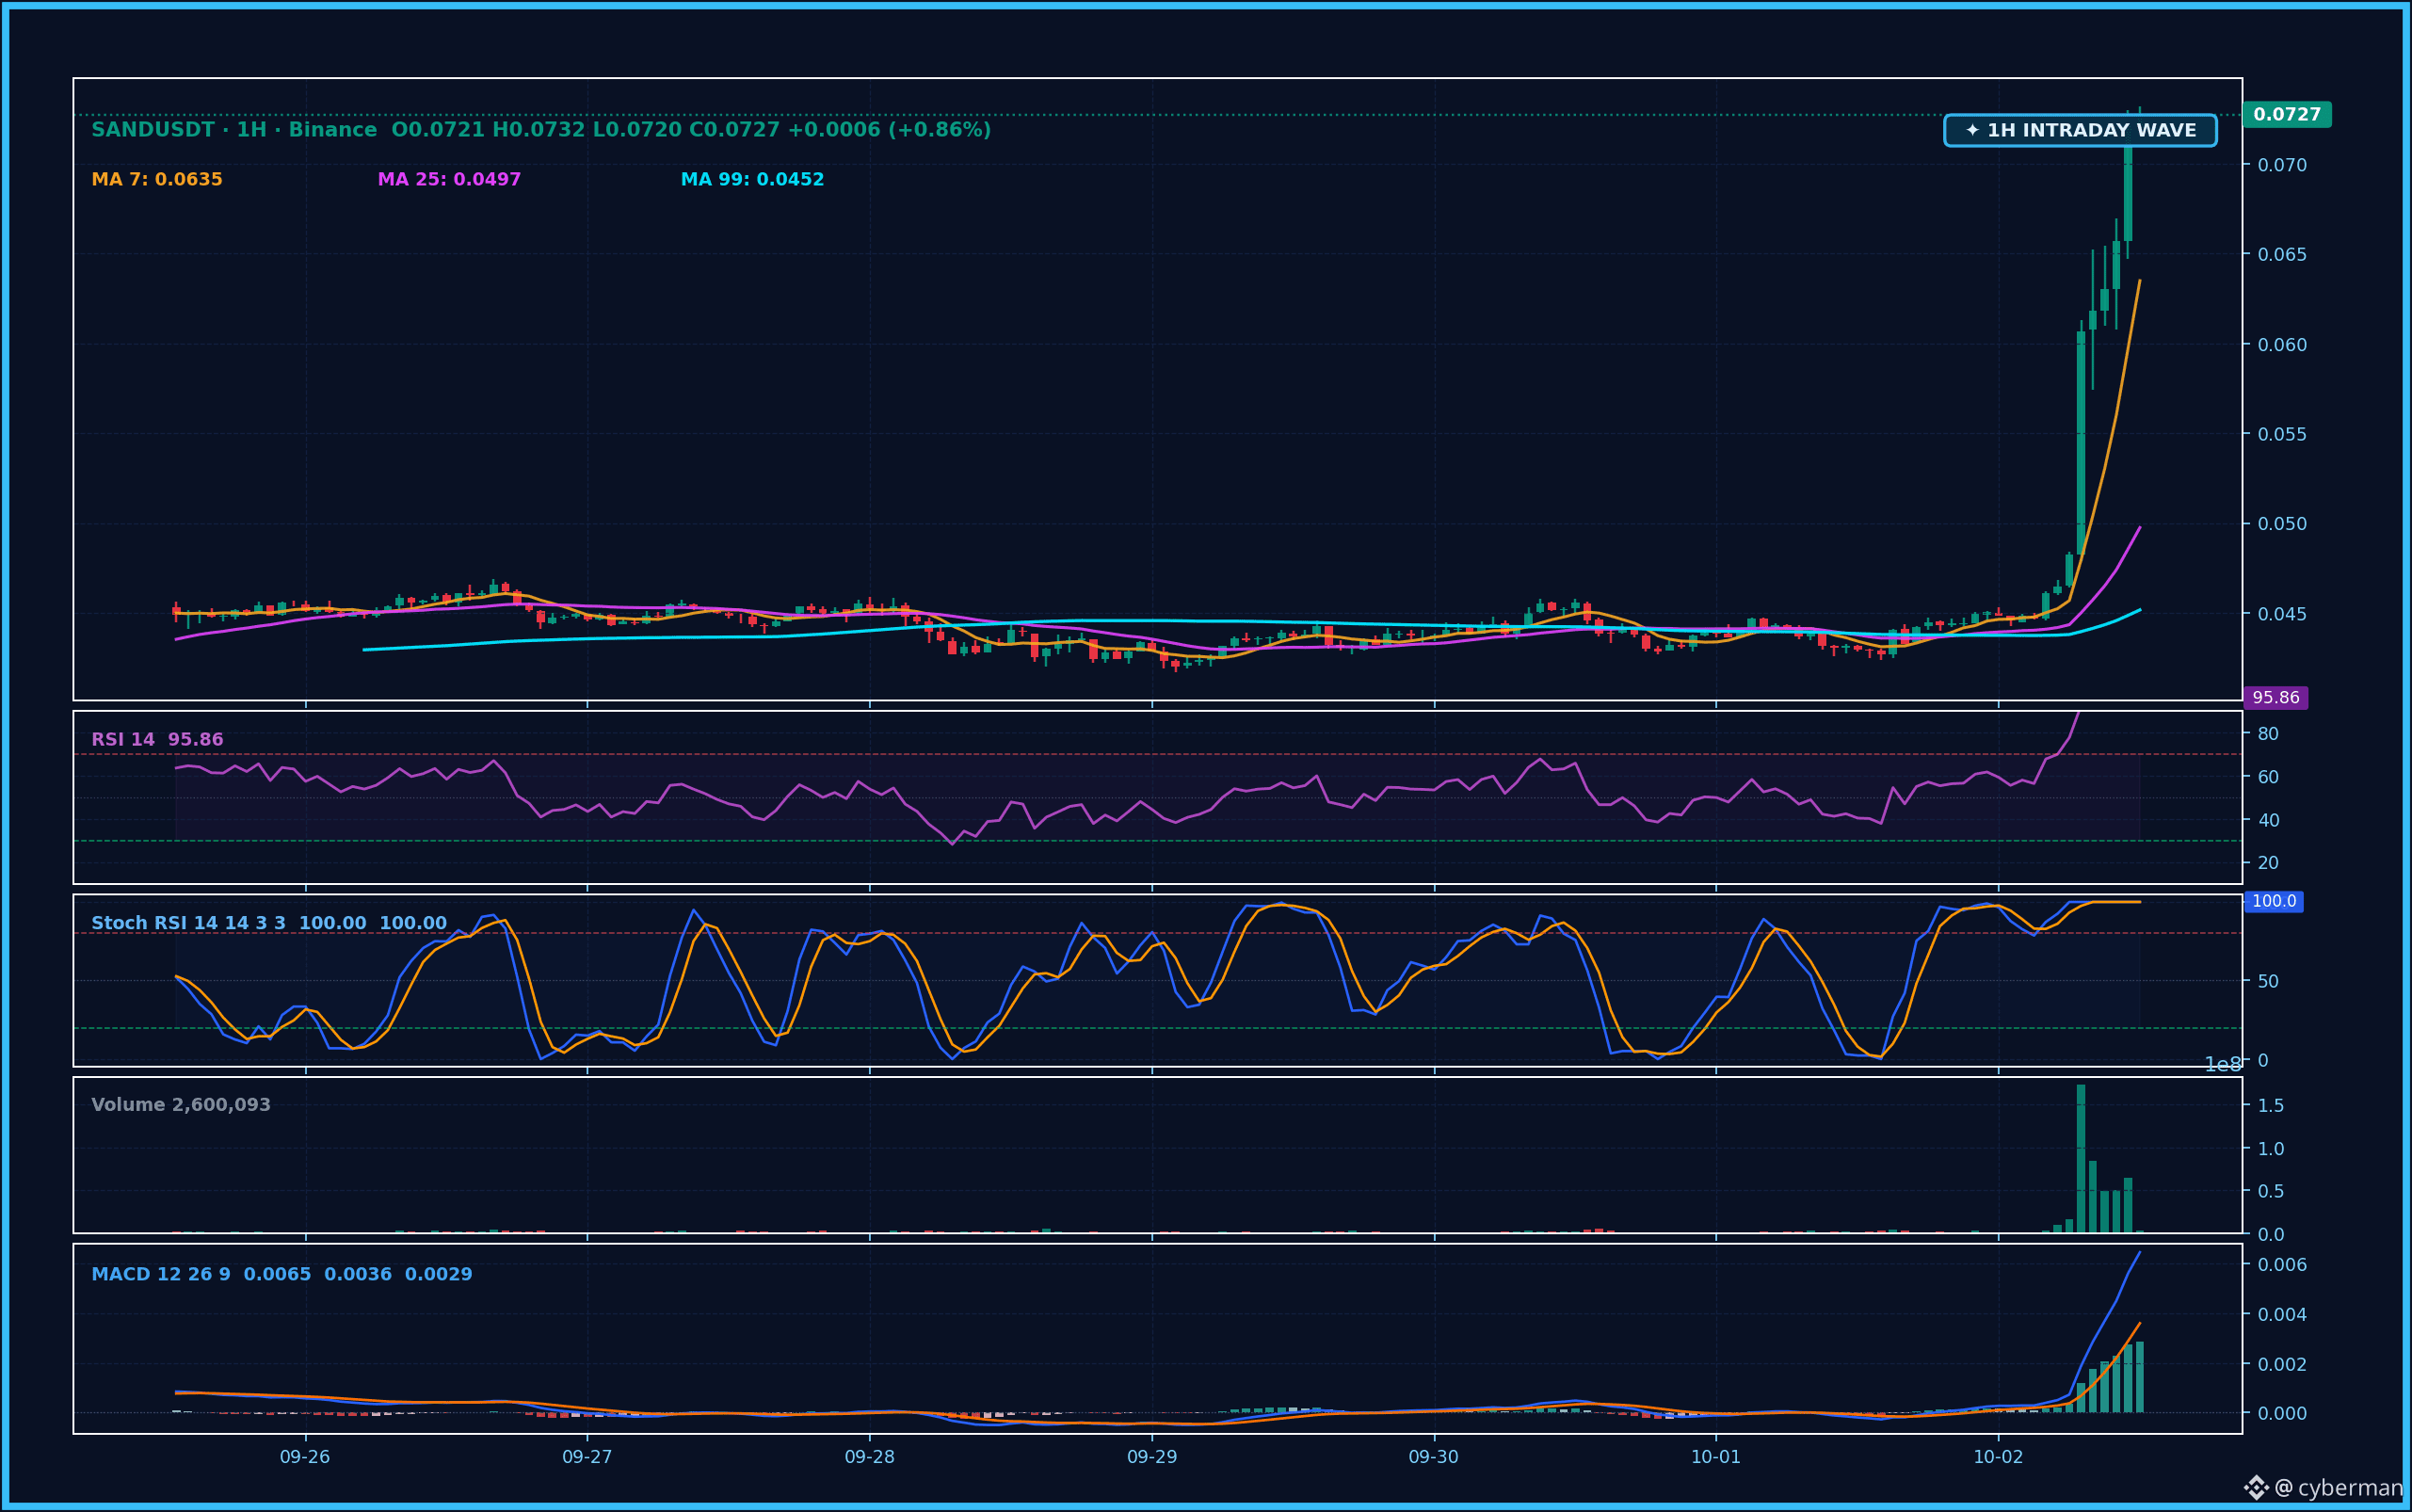
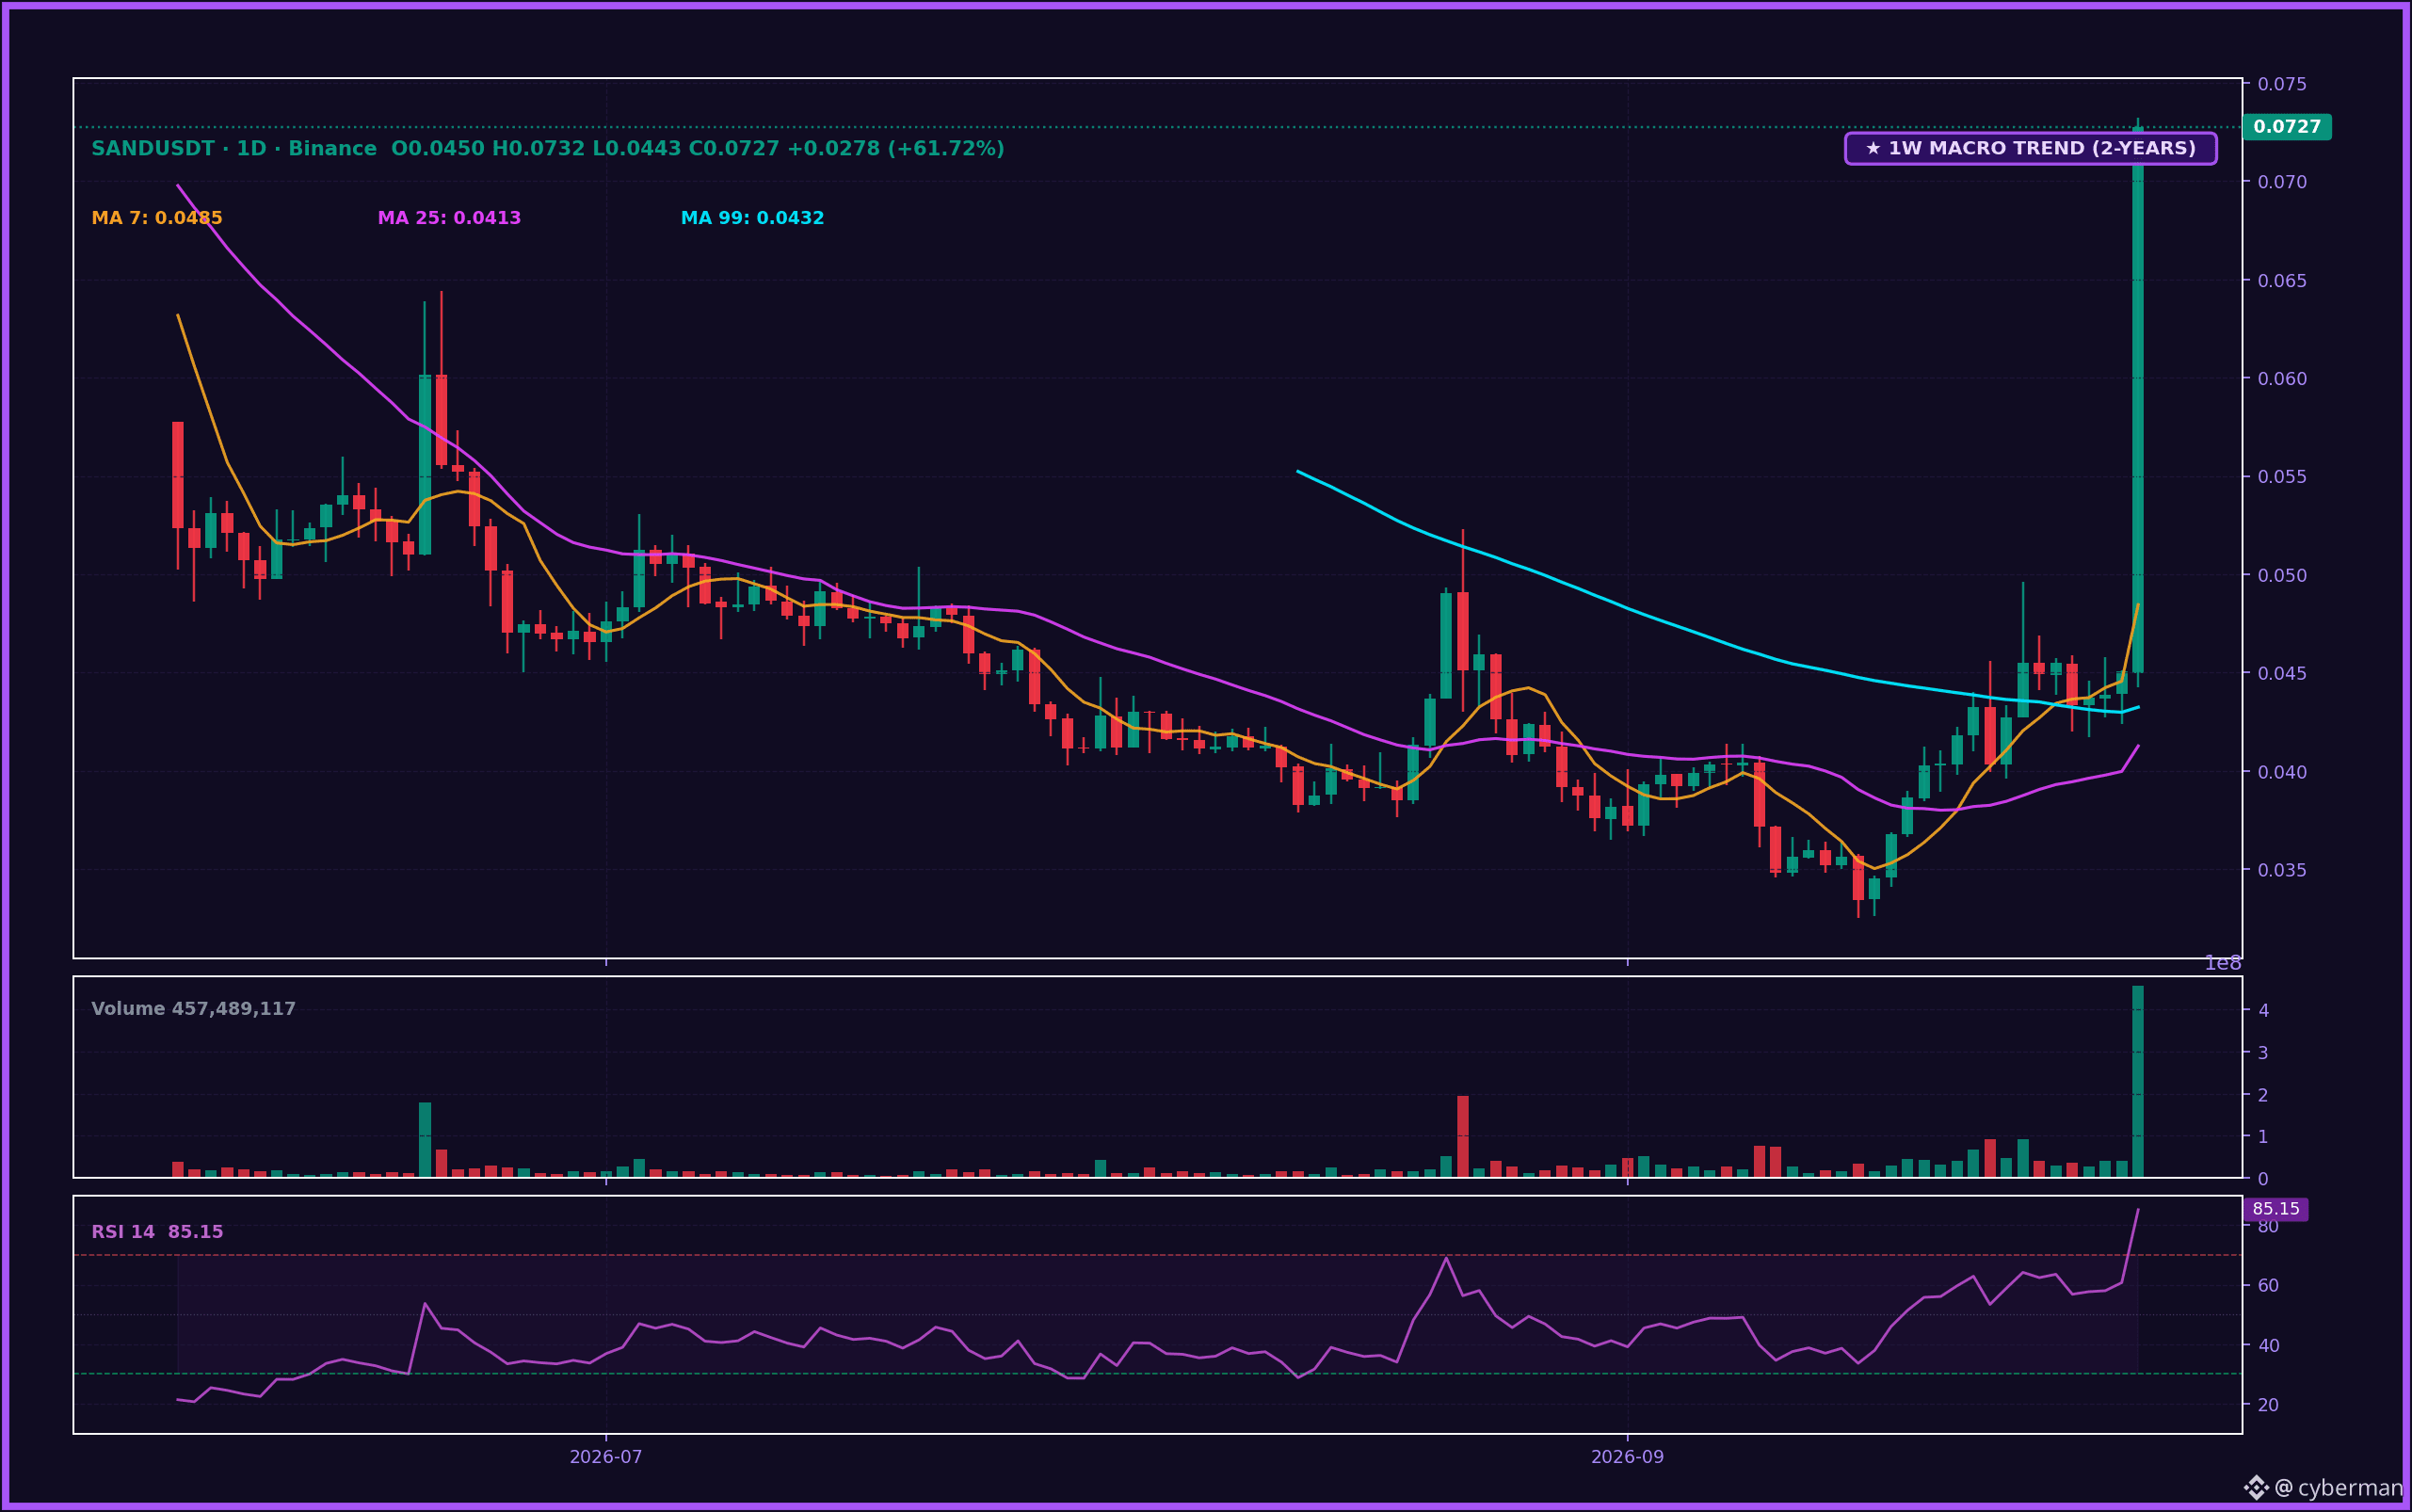
Woke up and opened my eyes to see $SAND d dựng (erect) a pillar—holy wow, brothers! 😮💨 Truly the “big hands” are in the game: a Marubozu candle that sweeps clean a long-term accumulation zone, officially sending an extremely clear macro reversal signal. Just looking at the derivatives board makes you go, wow: the funding rate is deeply negative at -1.9176%/8h, and open interest surged by as much as 287%. Clearly this is a classic short squeeze—when the sell-side got vacuumed, with stop losses getting hit continuously. Huge capital is flowing in nonstop, pushing 24h volume to over $28 million.
But no matter how excited you are, you still have to stay sharp! RSI on the 1H timeframe is up to 95.9, and Stoch RSI is pinned at the ceiling like that—jumping in right now is likely to get hit by a pullback. I personally lean LONG, but I’ll stay patient and wait for the move to test the 0.064–0.069 zone before considering entry. The next expected targets are 0.082, then 0.095. And if a candle closes below 0.059, then consider this trade to have flipped—cancel the plan.
Is anyone here quick enough to get on board early and scoop spot? Share with me so I get some extra momentum!
#Write2Earn #BinanceFutures #MarketUpdate
Woke up and opened my eyes to see $SAND d dựng (erect) a pillar—holy wow, brothers! 😮💨 Truly the “big hands” are in the game: a Marubozu candle that sweeps clean a long-term accumulation zone, officially sending an extremely clear macro reversal signal. Just looking at the derivatives board makes you go, wow: the funding rate is deeply negative at -1.9176%/8h, and open interest surged by as much as 287%. Clearly this is a classic short squeeze—when the sell-side got vacuumed, with stop losses getting hit continuously. Huge capital is flowing in nonstop, pushing 24h volume to over $28 million.
But no matter how excited you are, you still have to stay sharp! RSI on the 1H timeframe is up to 95.9, and Stoch RSI is pinned at the ceiling like that—jumping in right now is likely to get hit by a pullback. I personally lean LONG, but I’ll stay patient and wait for the move to test the 0.064–0.069 zone before considering entry. The next expected targets are 0.082, then 0.095. And if a candle closes below 0.059, then consider this trade to have flipped—cancel the plan.
Is anyone here quick enough to get on board early and scoop spot? Share with me so I get some extra momentum!
#Write2Earn #BinanceFutures #MarketUpdate
But no matter how excited you are, you still have to stay sharp! RSI on the 1H timeframe is up to 95.9, and Stoch RSI is pinned at the ceiling like that—jumping in right now is likely to get hit by a pullback. I personally lean LONG, but I’ll stay patient and wait for the move to test the 0.064–0.069 zone before considering entry. The next expected targets are 0.082, then 0.095. And if a candle closes below 0.059, then consider this trade to have flipped—cancel the plan.
Is anyone here quick enough to get on board early and scoop spot? Share with me so I get some extra momentum!
#Write2Earn #BinanceFutures #MarketUpdate
1
140
·
--
The market is as quiet as a sheet today. $UNI, ARB... glance and you can tell bulls and bears are playing Go, just waiting for the right moment 😐. When the Bollinger Bandwidth tightens, it means the price is being compressed like a spring—the force released will be very strong. Big volatility is only a matter of time, sooner or later.
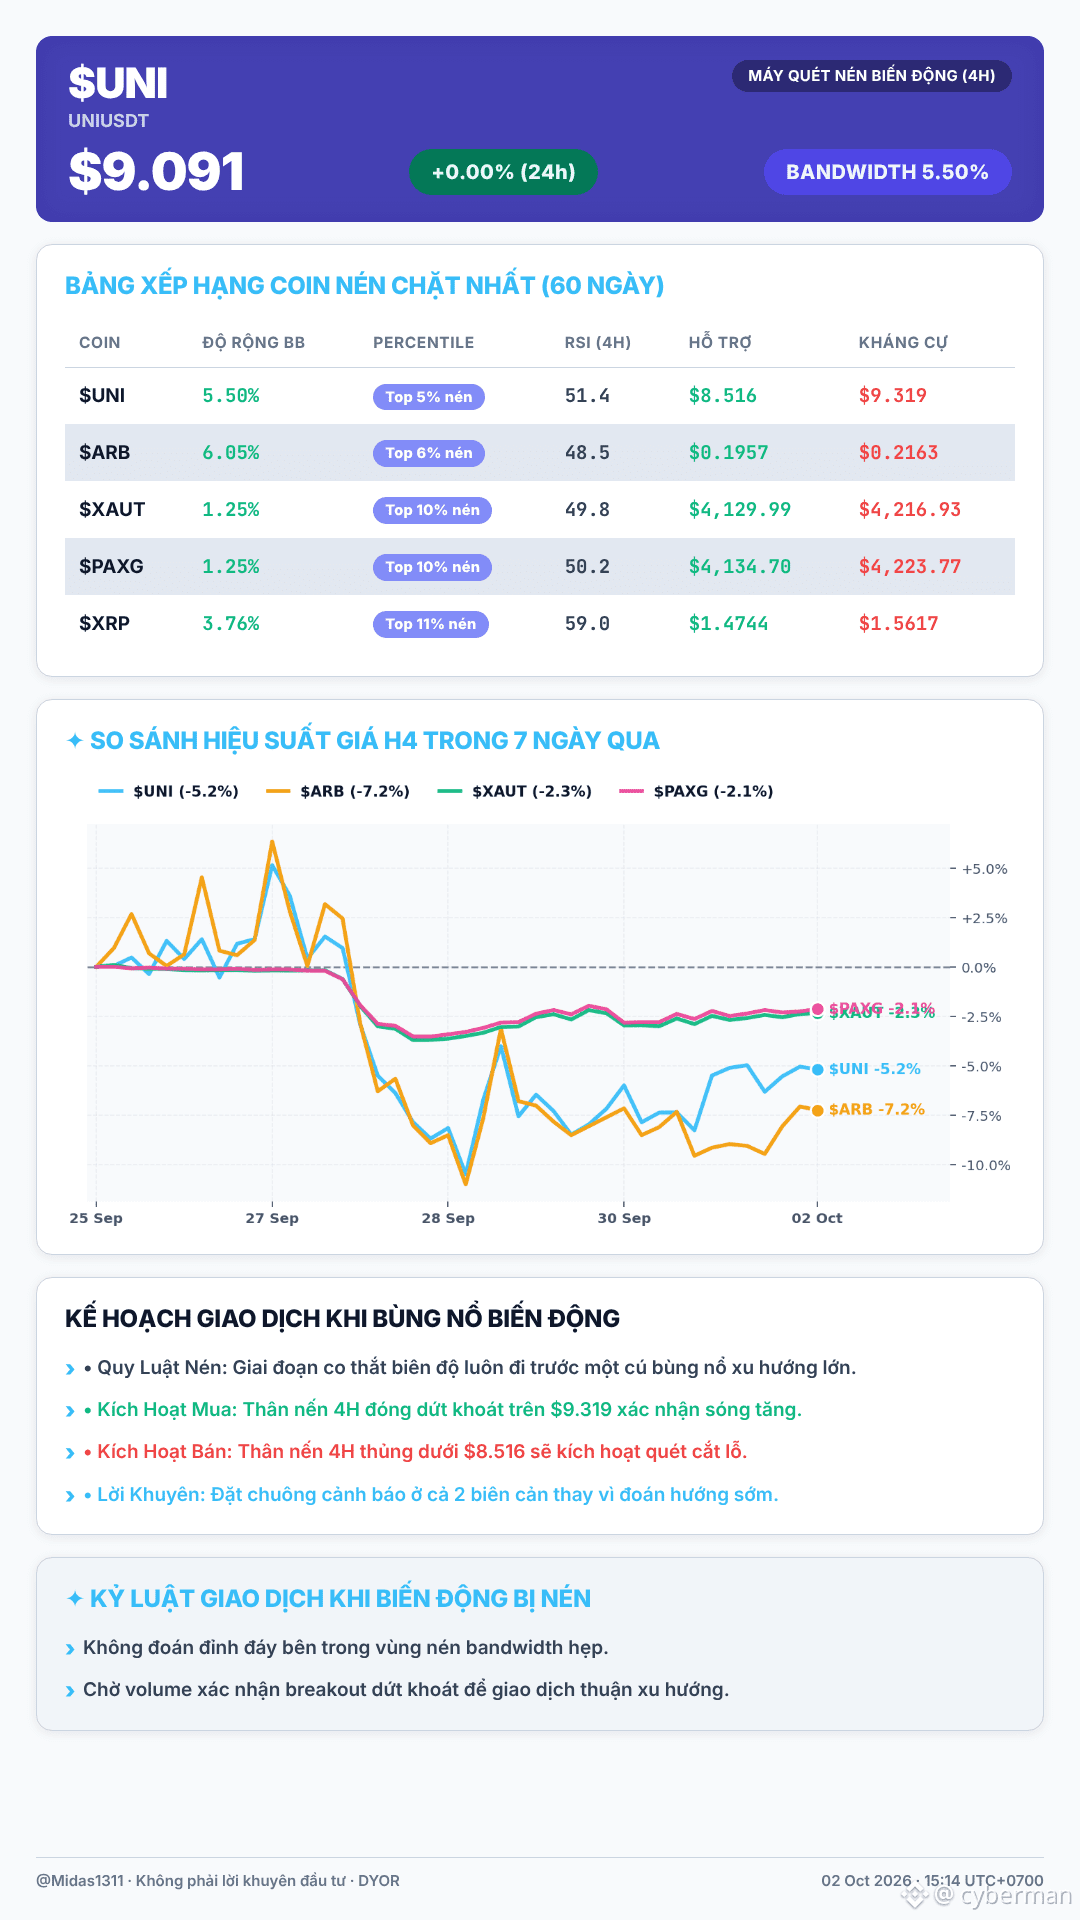
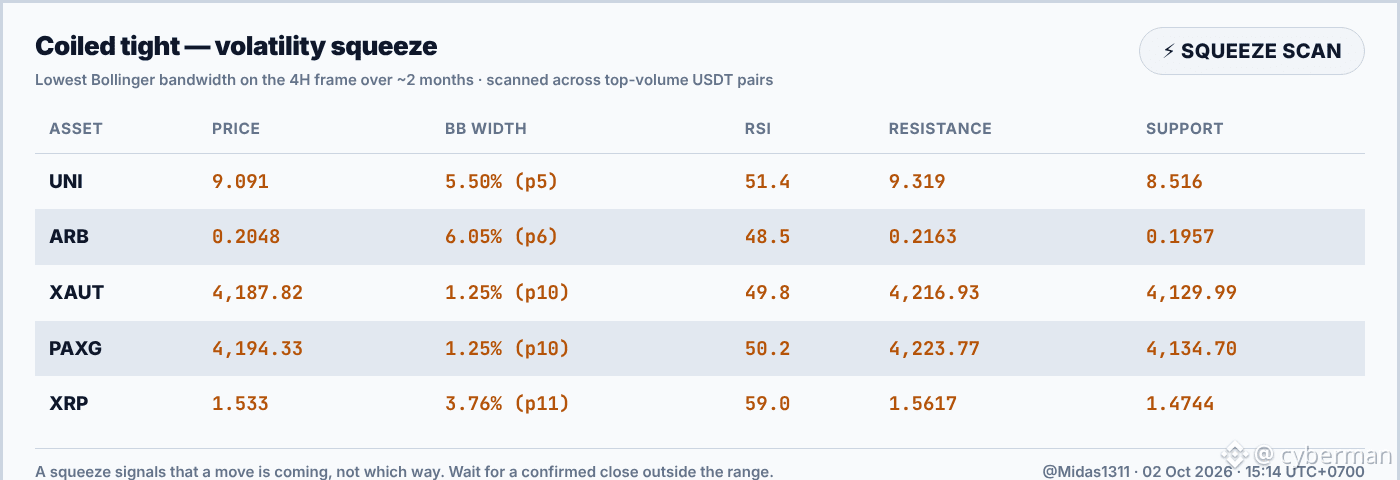
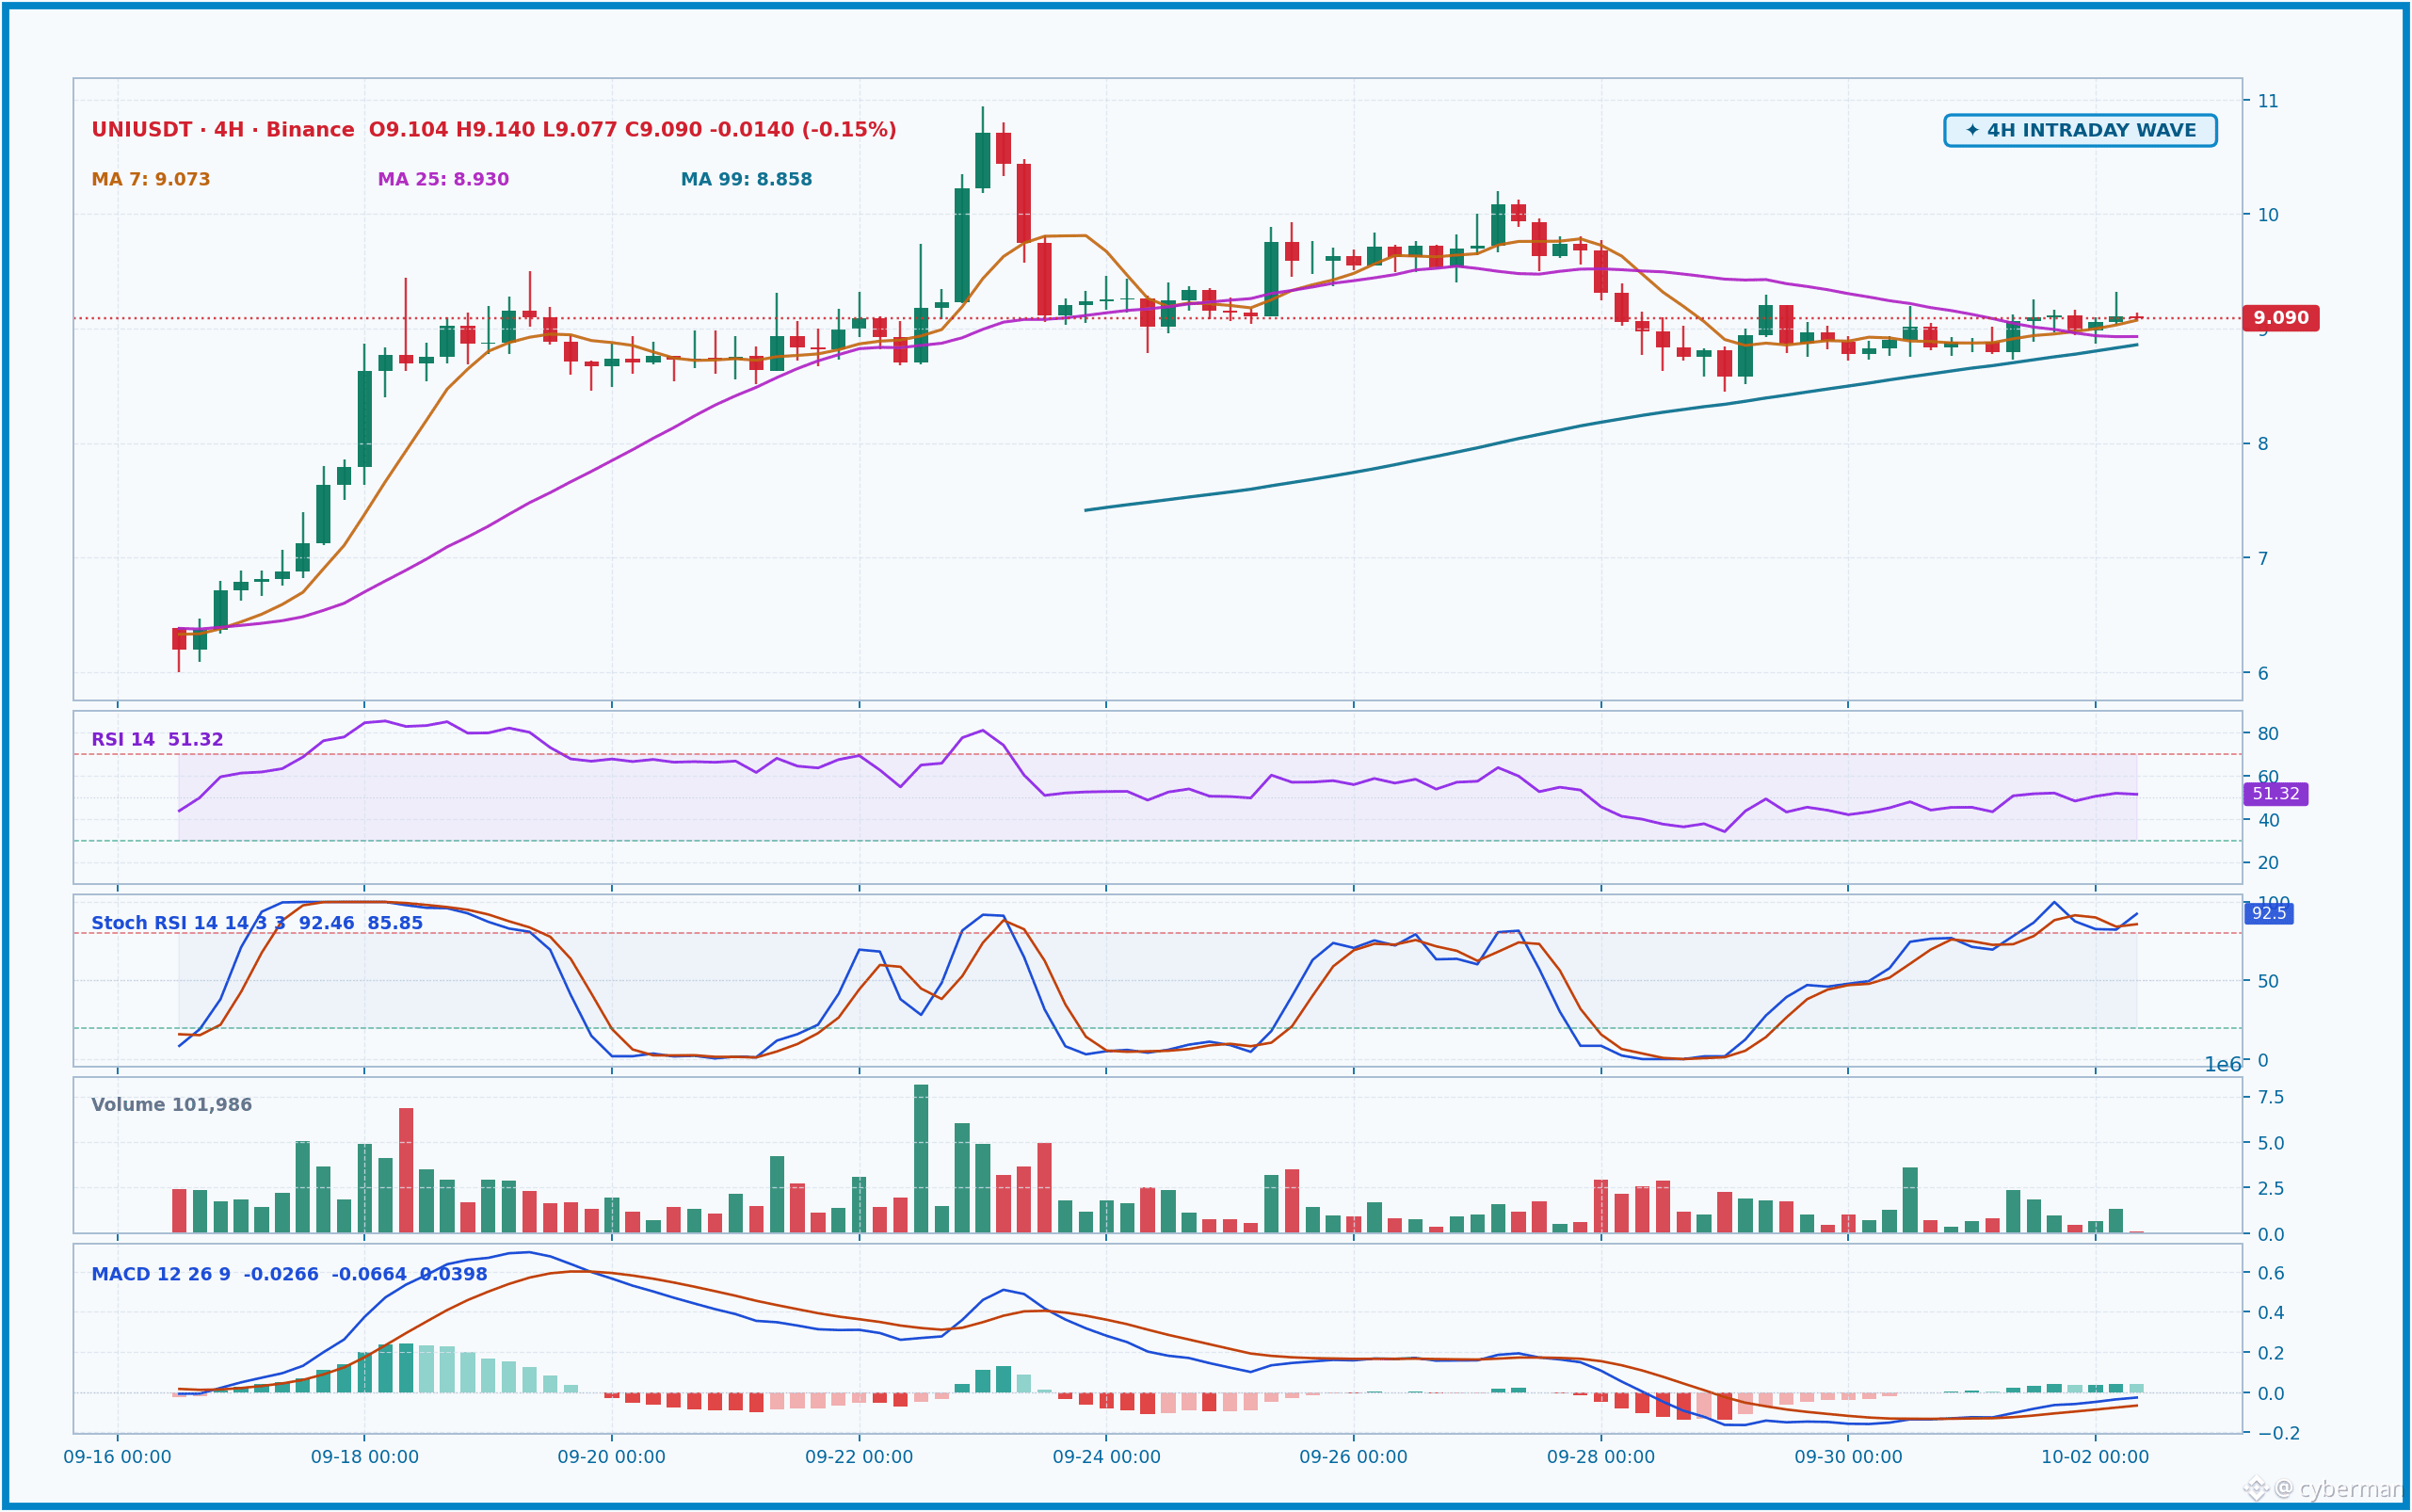
Quick scan on the 4H timeframe: $UNI with bandwidth at 5.50% is in the top 5% tightest levels over the past two months. RSI 51.4 is also hovering in mid-air. Its resistance level is $9.319, and its support is $8.516. With compression like this, the probability of a strong breakout is fairly high. Next up is ARB, bandwidth 6.05% (top 6%). Price is $0.2048, resistance $0.2163, support $0.1957. The gold pairs XAUT and PAXG are also tightly compressed by 1.25% (top 10%). For XAUT: resistance $4,216.93, support $4,129.99. For PAXG: resistance $4,223.77, support $4,134.70.
Most importantly, compression tells us a move is coming, but it does NOT indicate the direction. If anyone has time to guess the top and bottom, feel free to try. I’ll just wait for the 4H candle to close clearly above resistance $9.319 for $UNI , then look for a long; or if it breaks below $8.516, follow the short side. This setup must place stop-losses on both ends—don’t dream about taking a small profit too early 🤓.
Which direction are you all watching for $UNI ?
The market is as quiet as a sheet today. $UNI , ARB... glance and you can tell bulls and bears are playing Go, just waiting for the right moment 😐. When the Bollinger Bandwidth tightens, it means the price is being compressed like a spring—the force released will be very strong. Big volatility is only a matter of time, sooner or later.
Quick scan on the 4H timeframe: $UNI with bandwidth at 5.50% is in the top 5% tightest levels over the past two months. RSI 51.4 is also hovering in mid-air. Its resistance level is $9.319, and its support is $8.516. With compression like this, the probability of a strong breakout is fairly high. Next up is ARB, bandwidth 6.05% (top 6%). Price is $0.2048, resistance $0.2163, support $0.1957. The gold pairs XAUT and PAXG are also tightly compressed by 1.25% (top 10%). For XAUT: resistance $4,216.93, support $4,129.99. For PAXG: resistance $4,223.77, support $4,134.70.
Most importantly, compression tells us a move is coming, but it does NOT indicate the direction. If anyone has time to guess the top and bottom, feel free to try. I’ll just wait for the 4H candle to close clearly above resistance $9.319 for $UNI , then look for a long; or if it breaks below $8.516, follow the short side. This setup must place stop-losses on both ends—don’t dream about taking a small profit too early 🤓.
Which direction are you all watching for $UNI ?
Quick scan on the 4H timeframe: $UNI with bandwidth at 5.50% is in the top 5% tightest levels over the past two months. RSI 51.4 is also hovering in mid-air. Its resistance level is $9.319, and its support is $8.516. With compression like this, the probability of a strong breakout is fairly high. Next up is ARB, bandwidth 6.05% (top 6%). Price is $0.2048, resistance $0.2163, support $0.1957. The gold pairs XAUT and PAXG are also tightly compressed by 1.25% (top 10%). For XAUT: resistance $4,216.93, support $4,129.99. For PAXG: resistance $4,223.77, support $4,134.70.
Most importantly, compression tells us a move is coming, but it does NOT indicate the direction. If anyone has time to guess the top and bottom, feel free to try. I’ll just wait for the 4H candle to close clearly above resistance $9.319 for $UNI , then look for a long; or if it breaks below $8.516, follow the short side. This setup must place stop-losses on both ends—don’t dream about taking a small profit too early 🤓.
Which direction are you all watching for $UNI ?
172
·
--
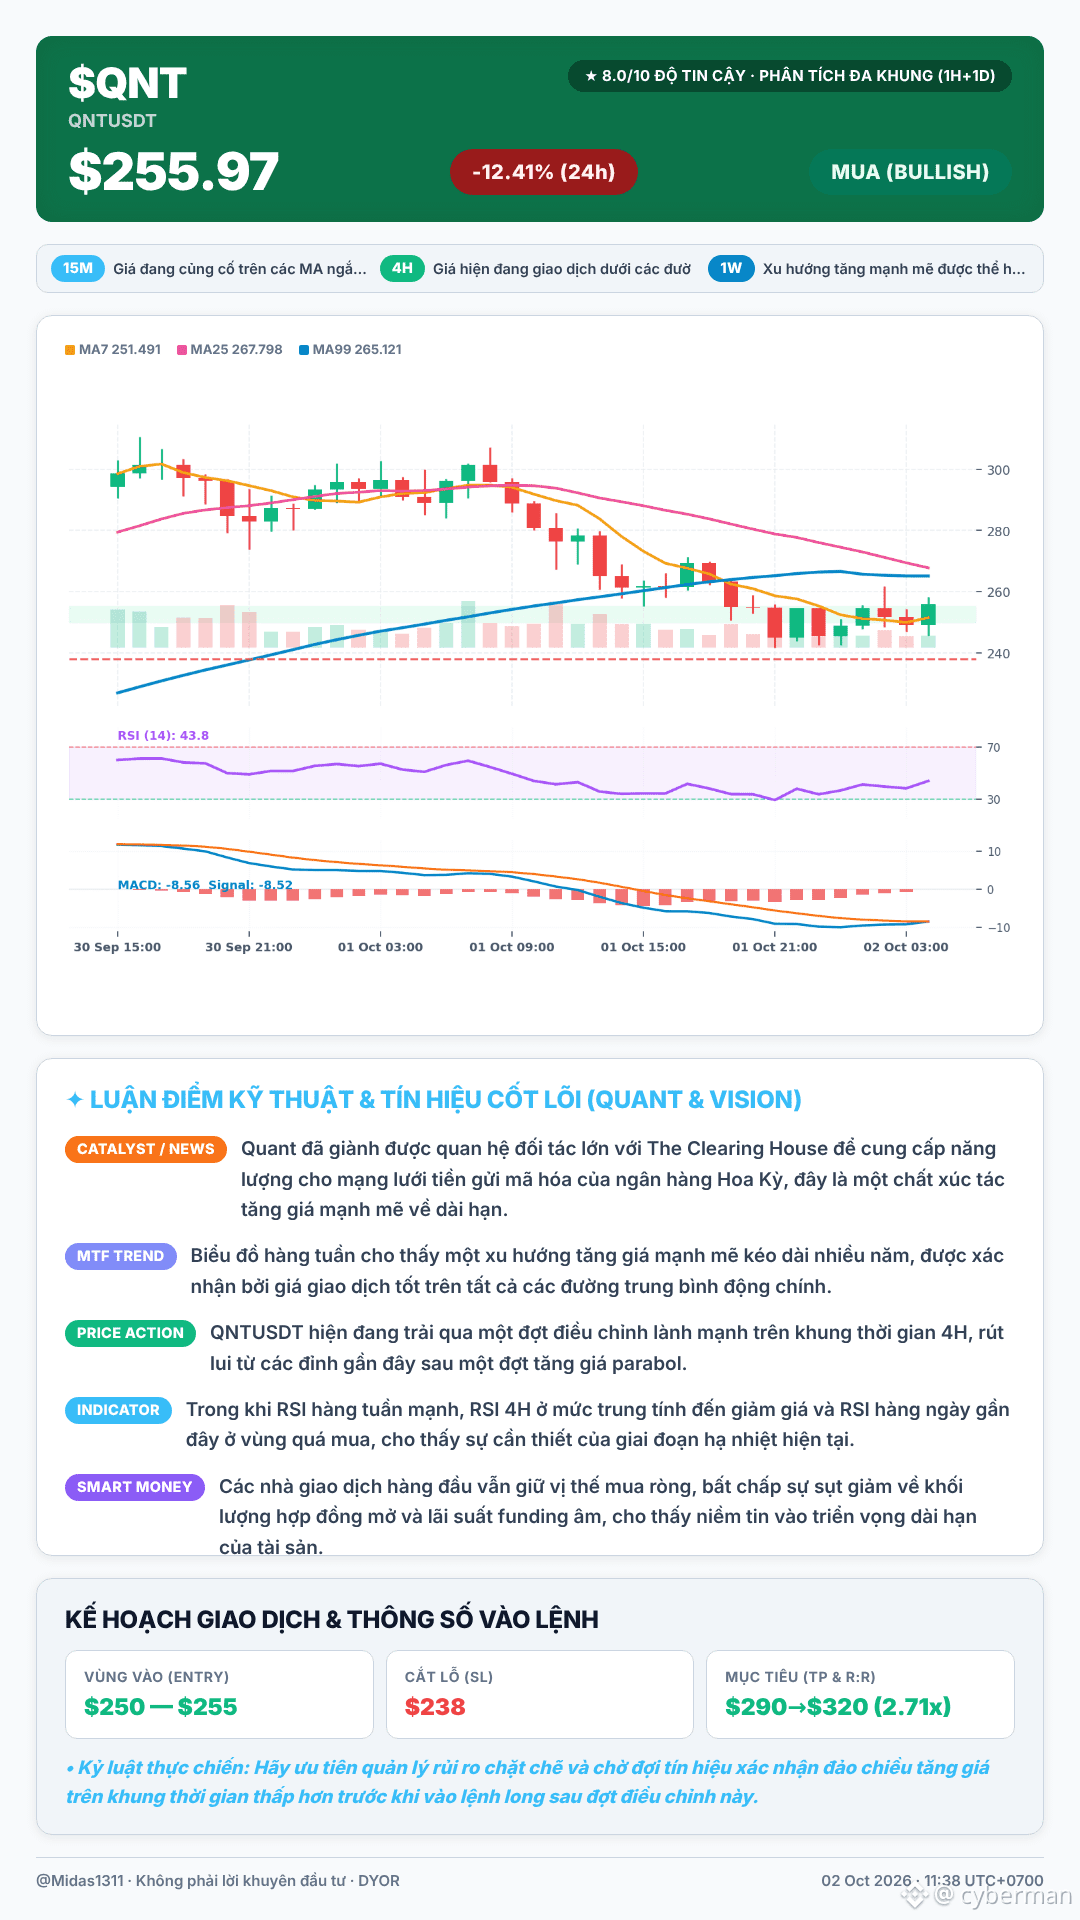
Seeing QNT red as hell and my tears are almost falling, but I still have to force a smile, guys 🤡. This market hits you without missing a beat—especially when QNT just went through a “healthy” correction after a parabolic run. Still, there are some faint bright spots for us to hold onto.
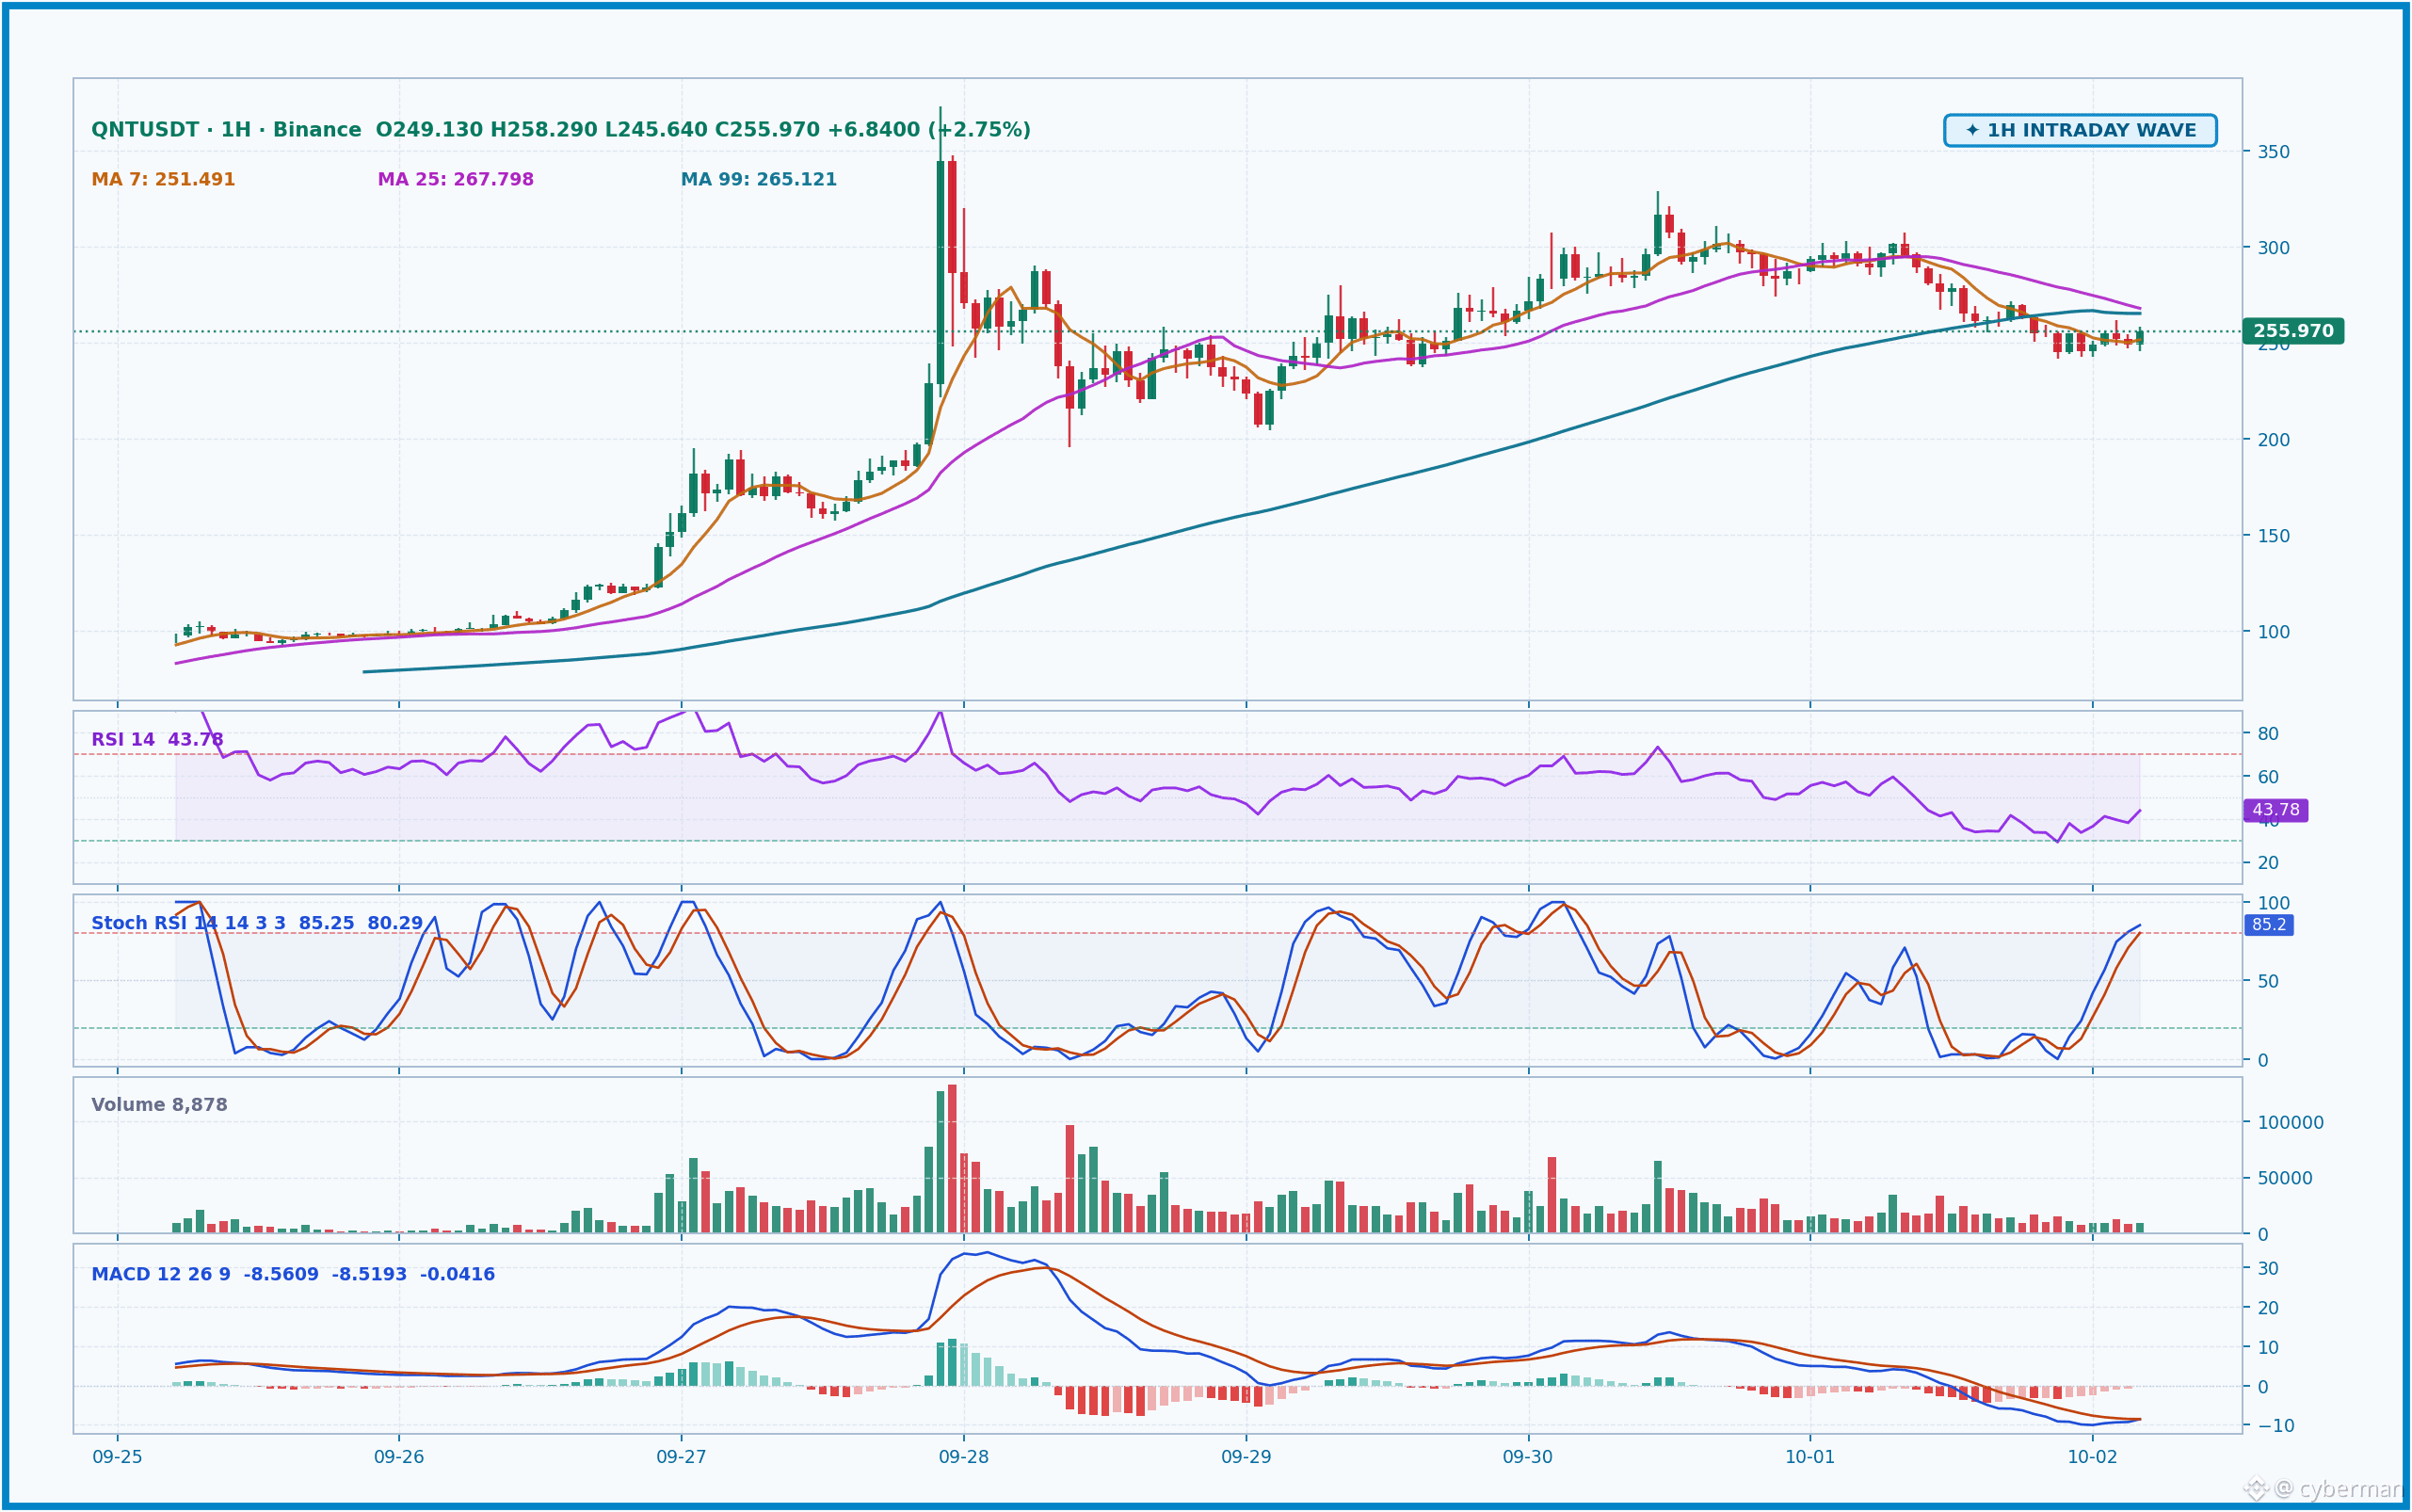
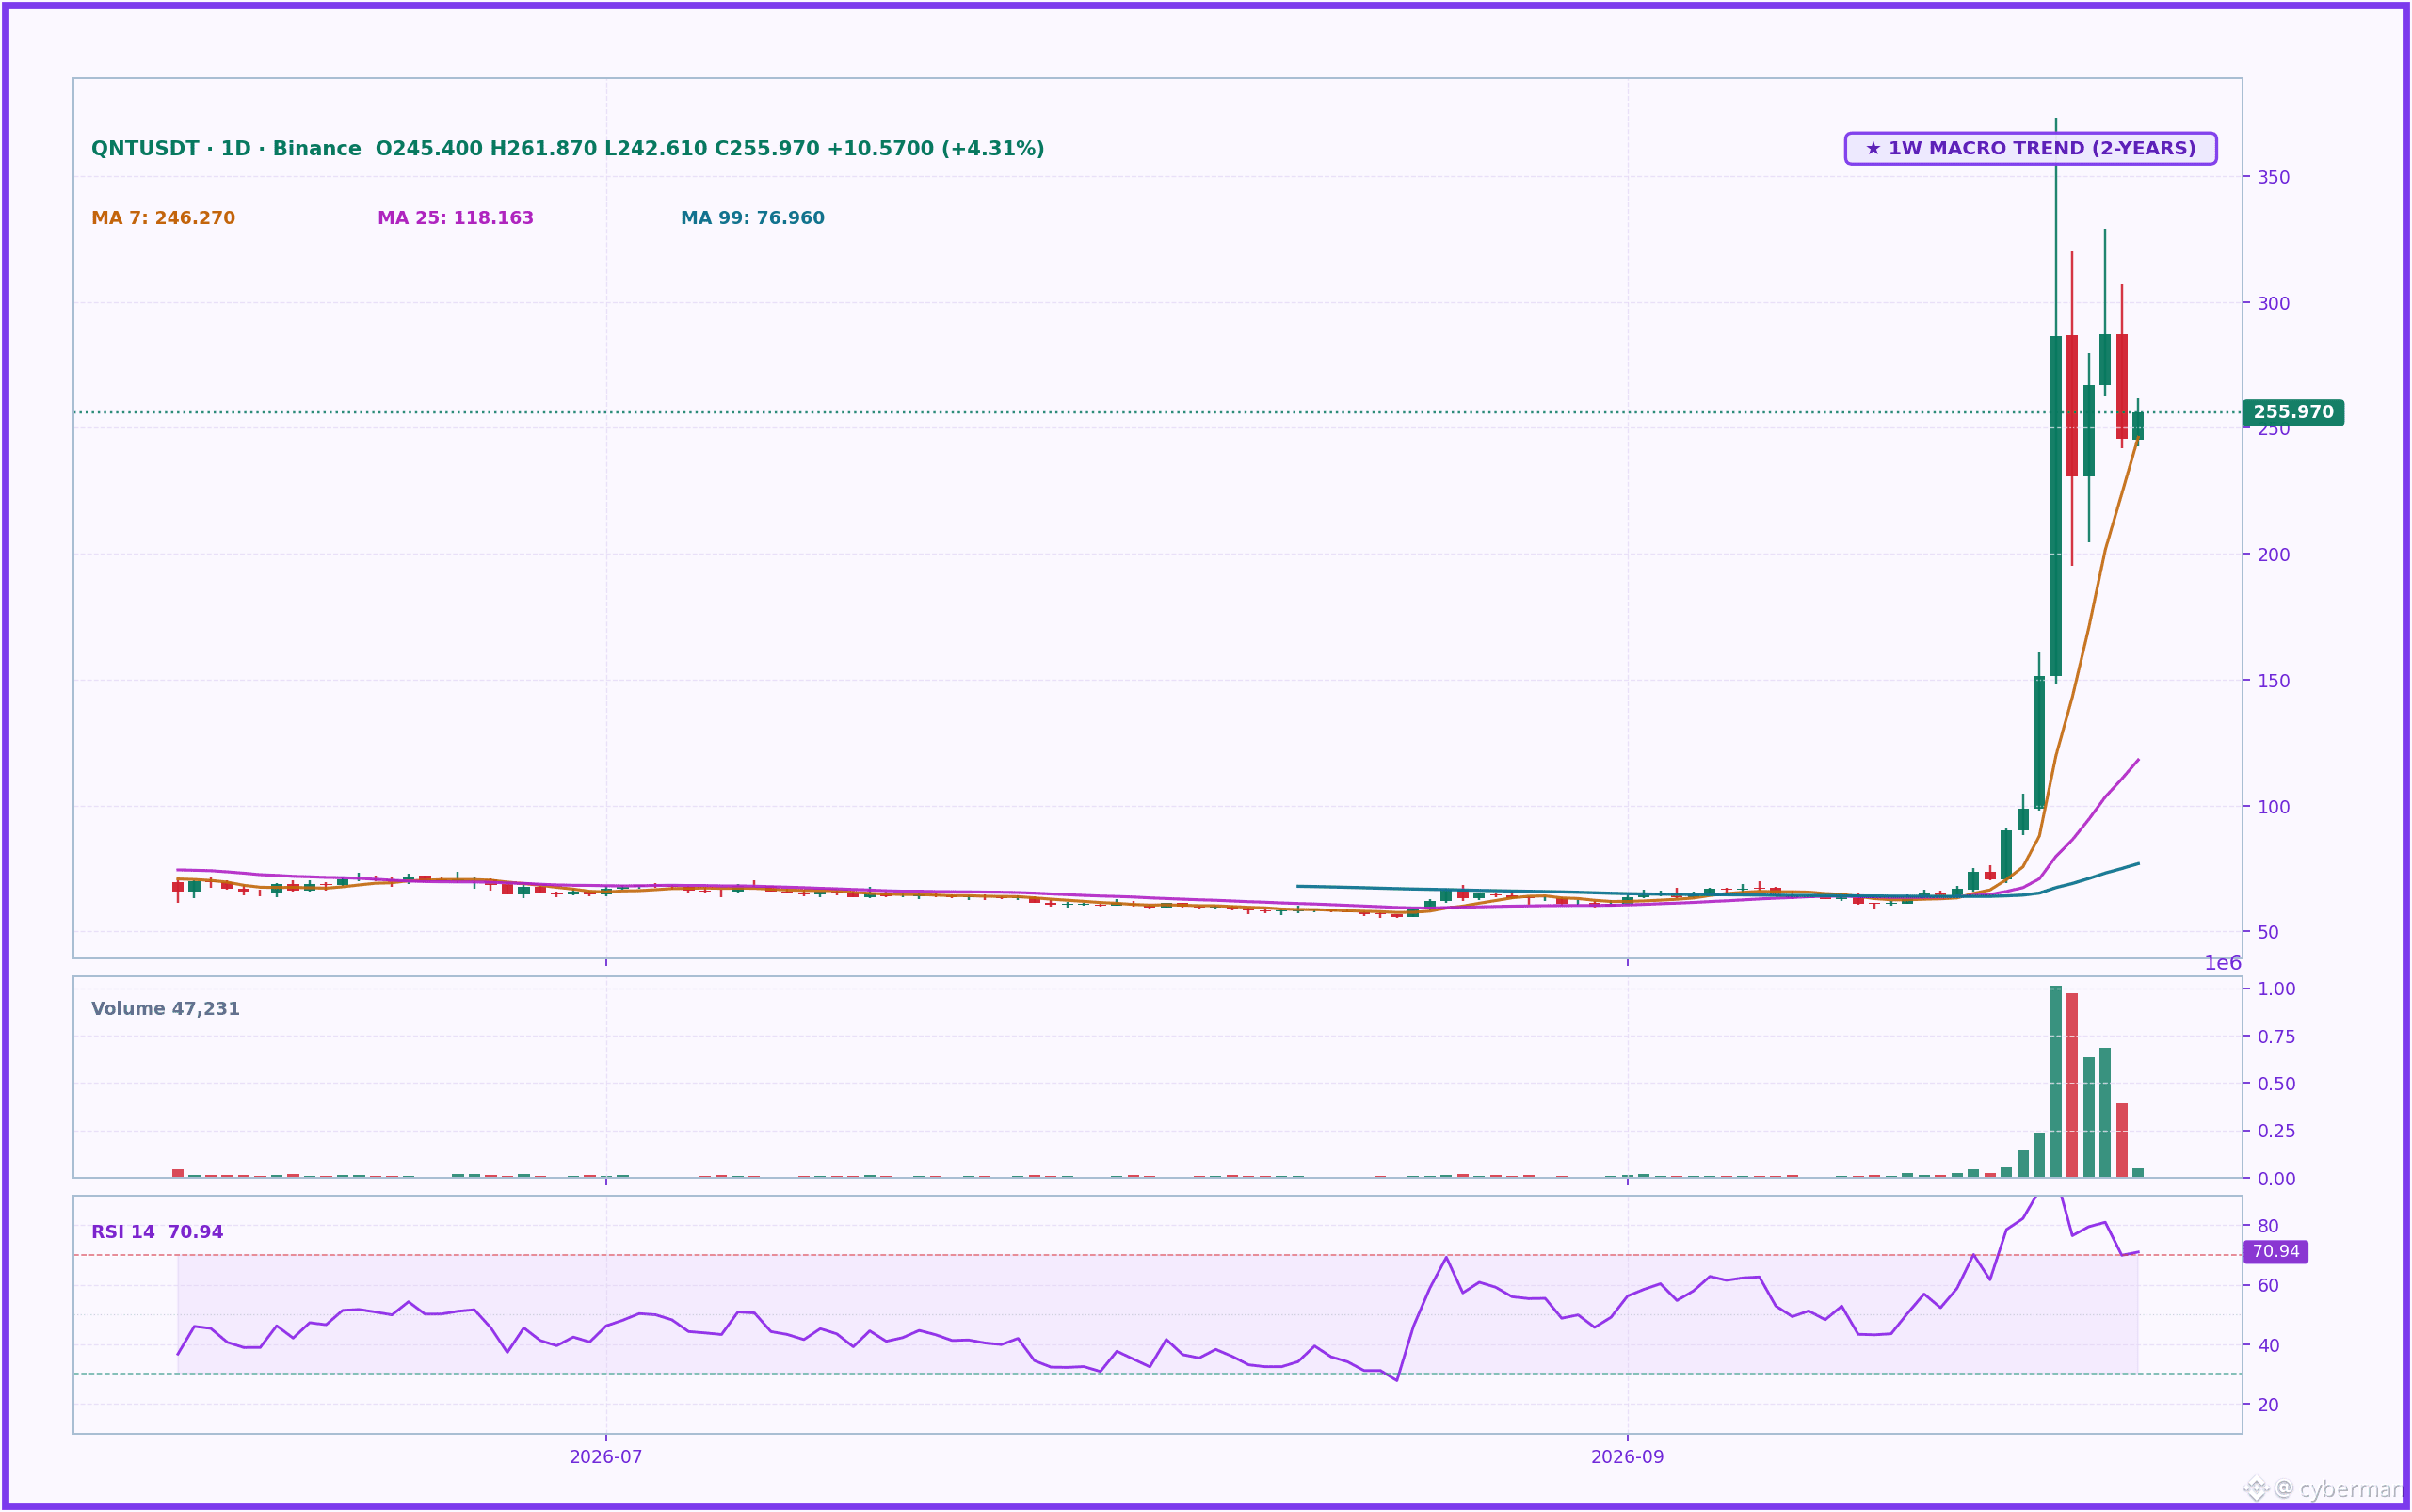
On the 1H chart, QNT is trading at $255.97, with RSI 43.8 indicating the momentum is cooling down. Price is below MA25 ($267.798) and MA99 ($265.121), but above MA7 ($251.491). This suggests that short-term selling pressure is pretty clear. The trading volume over the past 24 hours is also over $102 million USDT, down -12.41%—truly “blood flowing like a river” 📉. However, if we look at the 1D timeframe, the macro picture is much brighter. QNT has had a strong uptrend lasting for years, confirmed by the price trading well above all the major moving averages. The 1D RSI is at 70.9—there’s still room to recover after cooling off from the overbought zone.
Seeing QNT red as hell and my tears are almost falling, but I still have to force a smile, guys 🤡. This market hits you without missing a beat—especially when QNT just went through a “healthy” correction after a parabolic run. Still, there are some faint bright spots for us to hold onto.
On the 1H chart, QNT is trading at $255.97, with RSI 43.8 indicating the momentum is cooling down. Price is below MA25 ($267.798) and MA99 ($265.121), but above MA7 ($251.491). This suggests that short-term selling pressure is pretty clear. The trading volume over the past 24 hours is also over $102 million USDT, down -12.41%—truly “blood flowing like a river” 📉. However, if we look at the 1D timeframe, the macro picture is much brighter. QNT has had a strong uptrend lasting for years, confirmed by the price trading well above all the major moving averages. The 1D RSI is at 70.9—there’s still room to recover after cooling off from the overbought zone.
On the 1H chart, QNT is trading at $255.97, with RSI 43.8 indicating the momentum is cooling down. Price is below MA25 ($267.798) and MA99 ($265.121), but above MA7 ($251.491). This suggests that short-term selling pressure is pretty clear. The trading volume over the past 24 hours is also over $102 million USDT, down -12.41%—truly “blood flowing like a river” 📉. However, if we look at the 1D timeframe, the macro picture is much brighter. QNT has had a strong uptrend lasting for years, confirmed by the price trading well above all the major moving averages. The 1D RSI is at 70.9—there’s still room to recover after cooling off from the overbought zone.
115
·
--
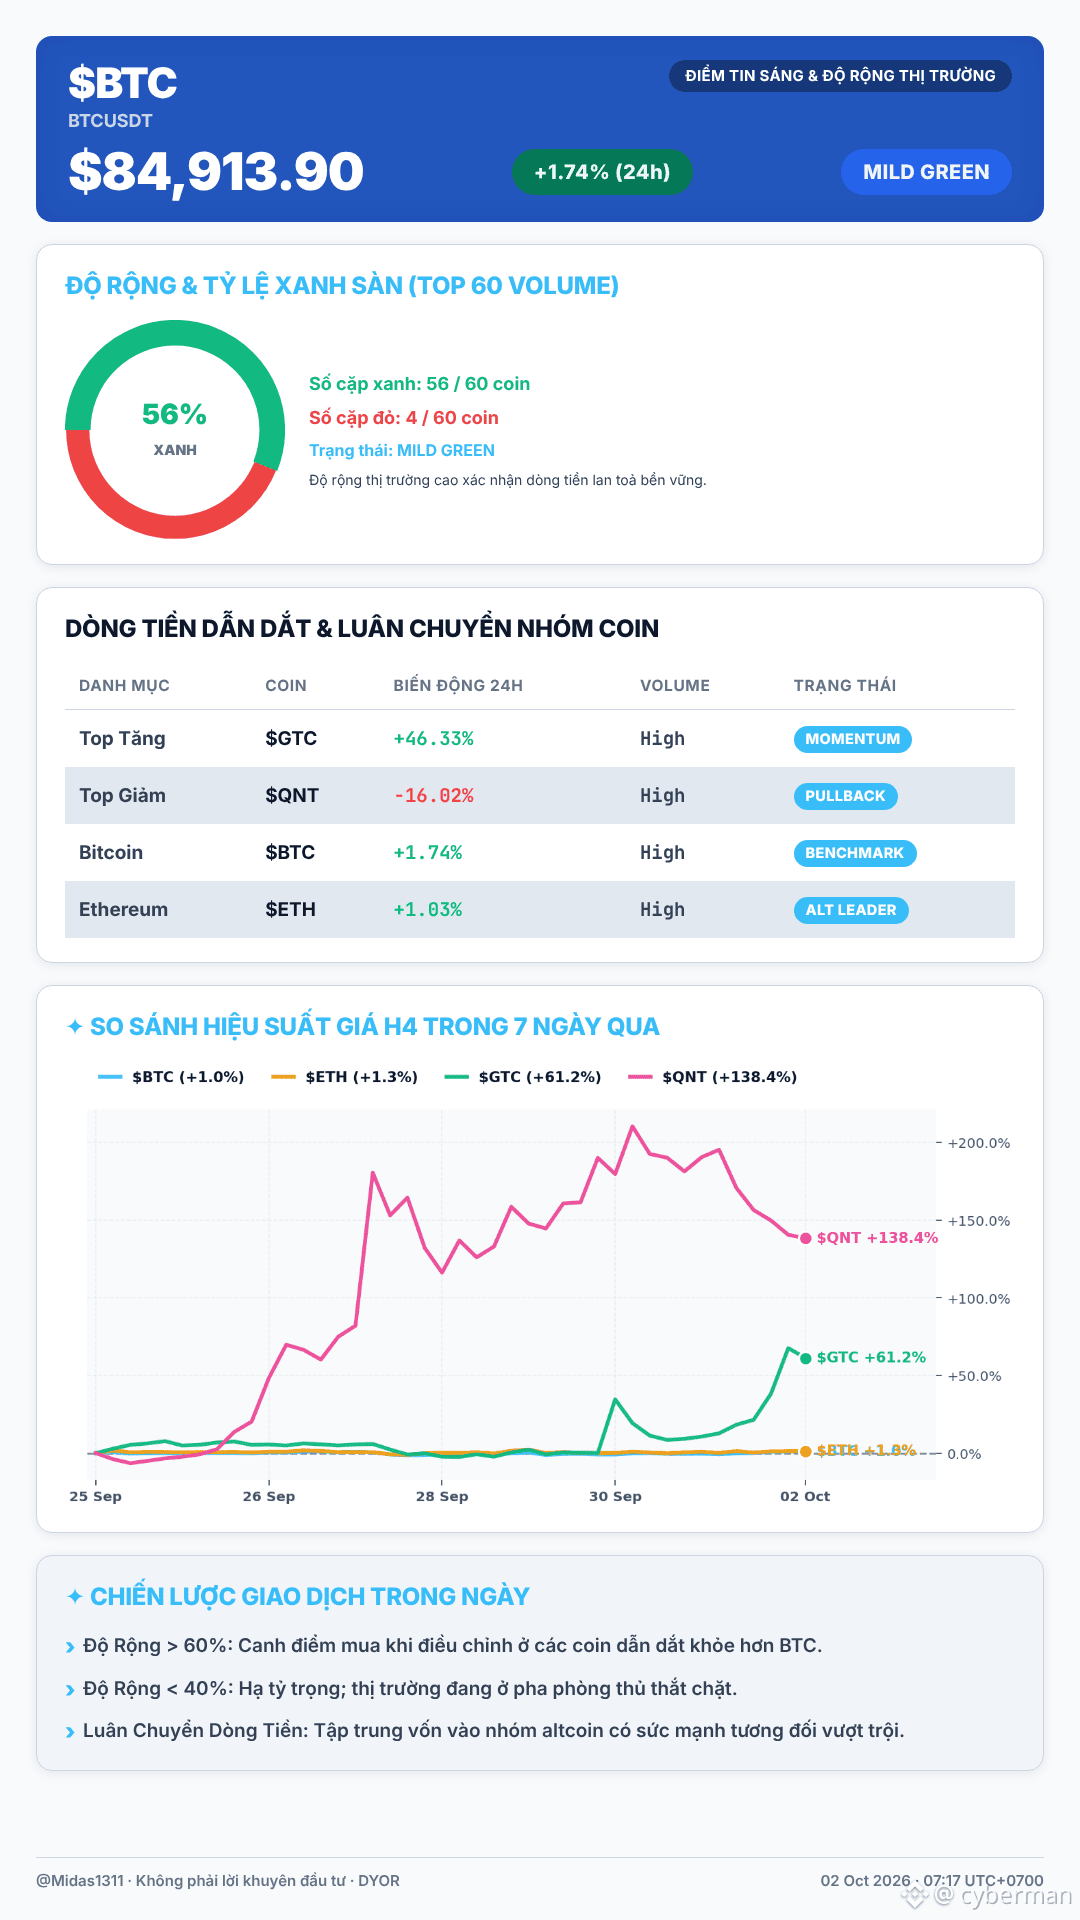
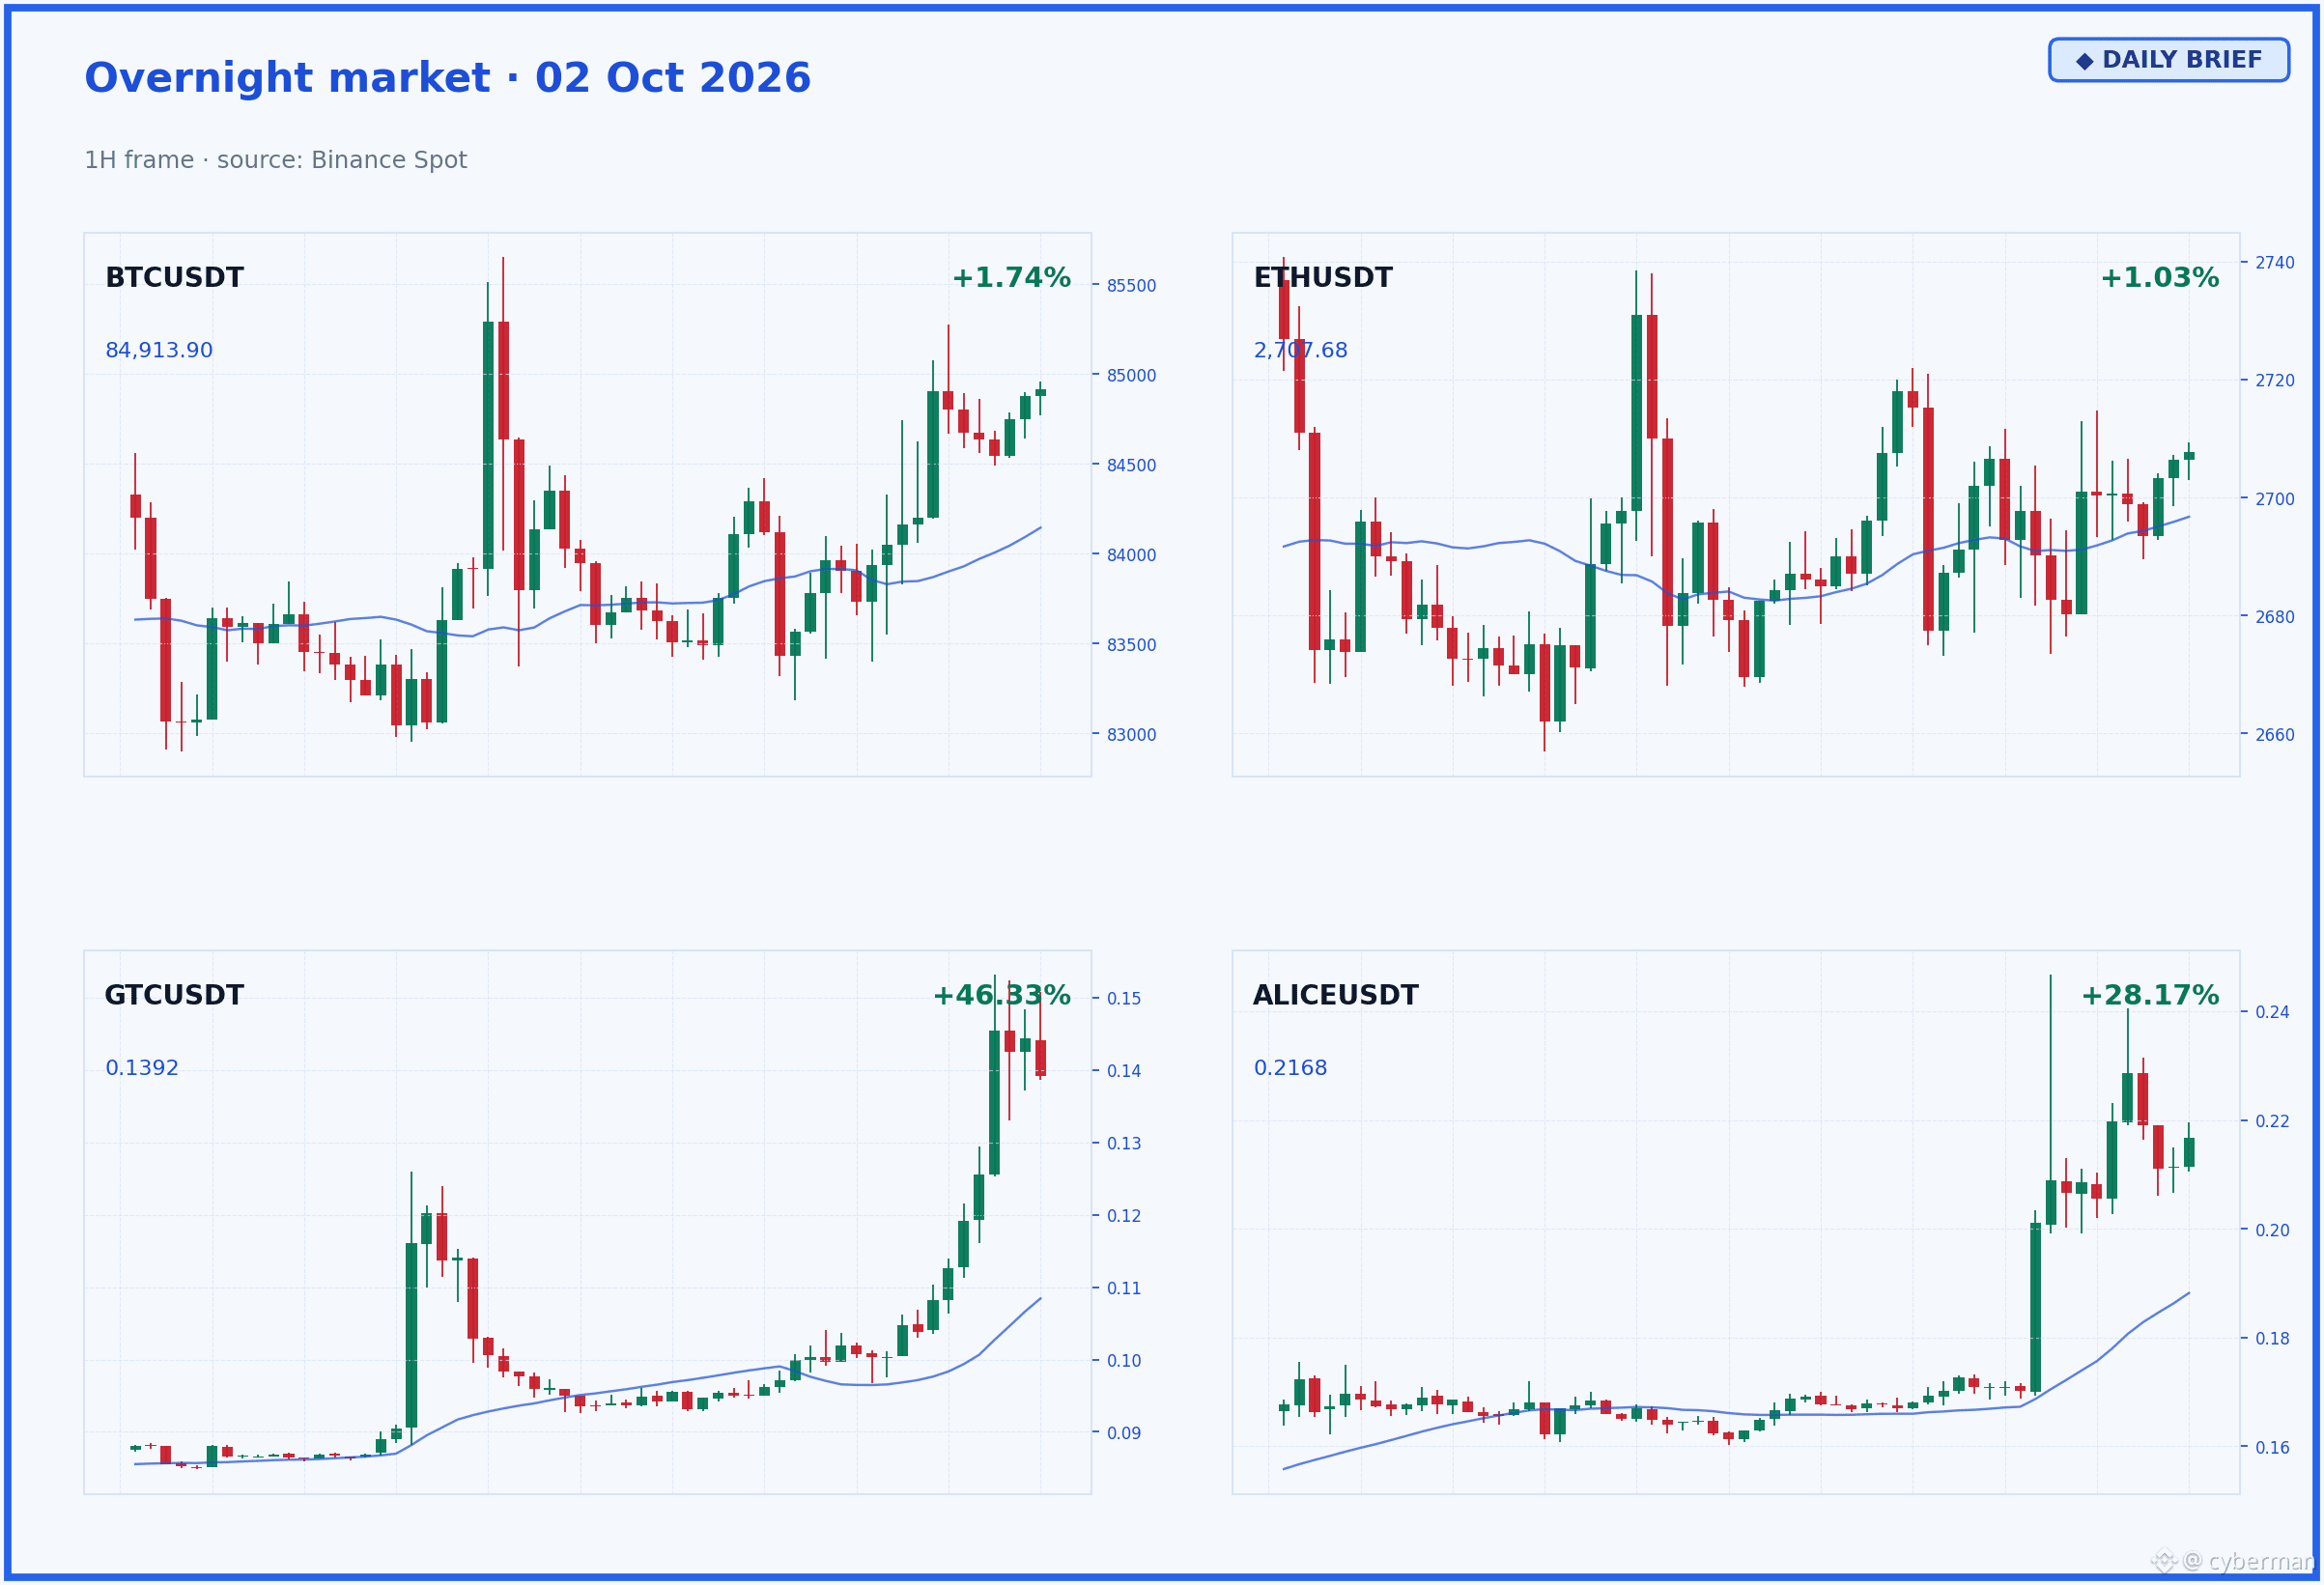
This morning, BTC rose slightly; it looks okay, but the ETF flow data has shown signs of a reversal. BTC broke above 84.9k, up 1.74%. ETH also edged up 1.03% to 2.7k. Notably, the Bitcoin ETF ended a 9-day streak of attracting capital, with $148.7 million flowing out on 30/9. The Ether ETF was no better, recording $59.58 million in net outflows on the same day, ending 7 green sessions.
Market breadth stalled at 56% of coins in the green. The standout was $GTC leading the pack with +46.33%, followed by ALICE at +28.17%. QNT fell back to the bottom with -16.02%, and NEAR also dropped 8.39% after a recent $3.8 million mining incident.
PCE inflation data came in lower than expected on 30/9, easing some pressure for the Fed’s October rate hikes; the probability is now below 40%. However, the fact that BTC and ETH ETF flows turned into net outflows at the same time suggests whale sentiment is adjusting. Keeping a close watch on BTC’s $84,000 support level is key.
With capital rotating like this nonstop, have you cashed out profits yet, or are you still holding on? 😐
#Write2Earn #CryptoTrading #TechnicalAnalysis
(DYOR—your money, your decision)
---
This morning, BTC rose slightly; it looks okay, but the ETF flow data has shown signs of a reversal. BTC broke above 84.9k, up 1.74%. ETH also edged up 1.03% to 2.7k. Notably, the Bitcoin ETF ended a 9-day streak of attracting capital, with $148.7 million flowing out on 30/9. The Ether ETF was no better, recording $59.58 million in net outflows on the same day, ending 7 green sessions.
Market breadth stalled at 56% of coins in the green. The standout was $GTC leading the pack with +46.33%, followed by ALICE at +28.17%. QNT fell back to the bottom with -16.02%, and NEAR also dropped 8.39% after a recent $3.8 million mining incident.
PCE inflation data came in lower than expected on 30/9, easing some pressure for the Fed’s October rate hikes; the probability is now below 40%. However, the fact that BTC and ETH ETF flows turned into net outflows at the same time suggests whale sentiment is adjusting. Keeping a close watch on BTC’s $84,000 support level is key.
With capital rotating like this nonstop, have you cashed out profits yet, or are you still holding on? 😐
#Write2Earn #CryptoTrading #TechnicalAnalysis
(DYOR—your money, your decision)
---
Market breadth stalled at 56% of coins in the green. The standout was $GTC leading the pack with +46.33%, followed by ALICE at +28.17%. QNT fell back to the bottom with -16.02%, and NEAR also dropped 8.39% after a recent $3.8 million mining incident.
PCE inflation data came in lower than expected on 30/9, easing some pressure for the Fed’s October rate hikes; the probability is now below 40%. However, the fact that BTC and ETH ETF flows turned into net outflows at the same time suggests whale sentiment is adjusting. Keeping a close watch on BTC’s $84,000 support level is key.
With capital rotating like this nonstop, have you cashed out profits yet, or are you still holding on? 😐
#Write2Earn #CryptoTrading #TechnicalAnalysis
(DYOR—your money, your decision)
---
421
·
--
Many new brothers coming into the market often get swept into a few small pullbacks, thinking the price is going to “turn around,” so they jump in and then end up “holding the loss” without understanding why. 💡 Don’t worry—everyone has been caught like that. 🧑🏫
Today, I’m sharing a small tip: treat MA99 as the “trend boundary.” Imagine MA99 as the equator line. Price above this line means the market is in “hot season”—every drop is an opportunity to “buy the dip” and “eat well.” On the other hand, when price is below MA99, it’s in “cold season,” and any rally is just a short “pullback,” not a real “turnaround.” At this time, the “train barrier” is a recipe for getting “account burnt.” 👀
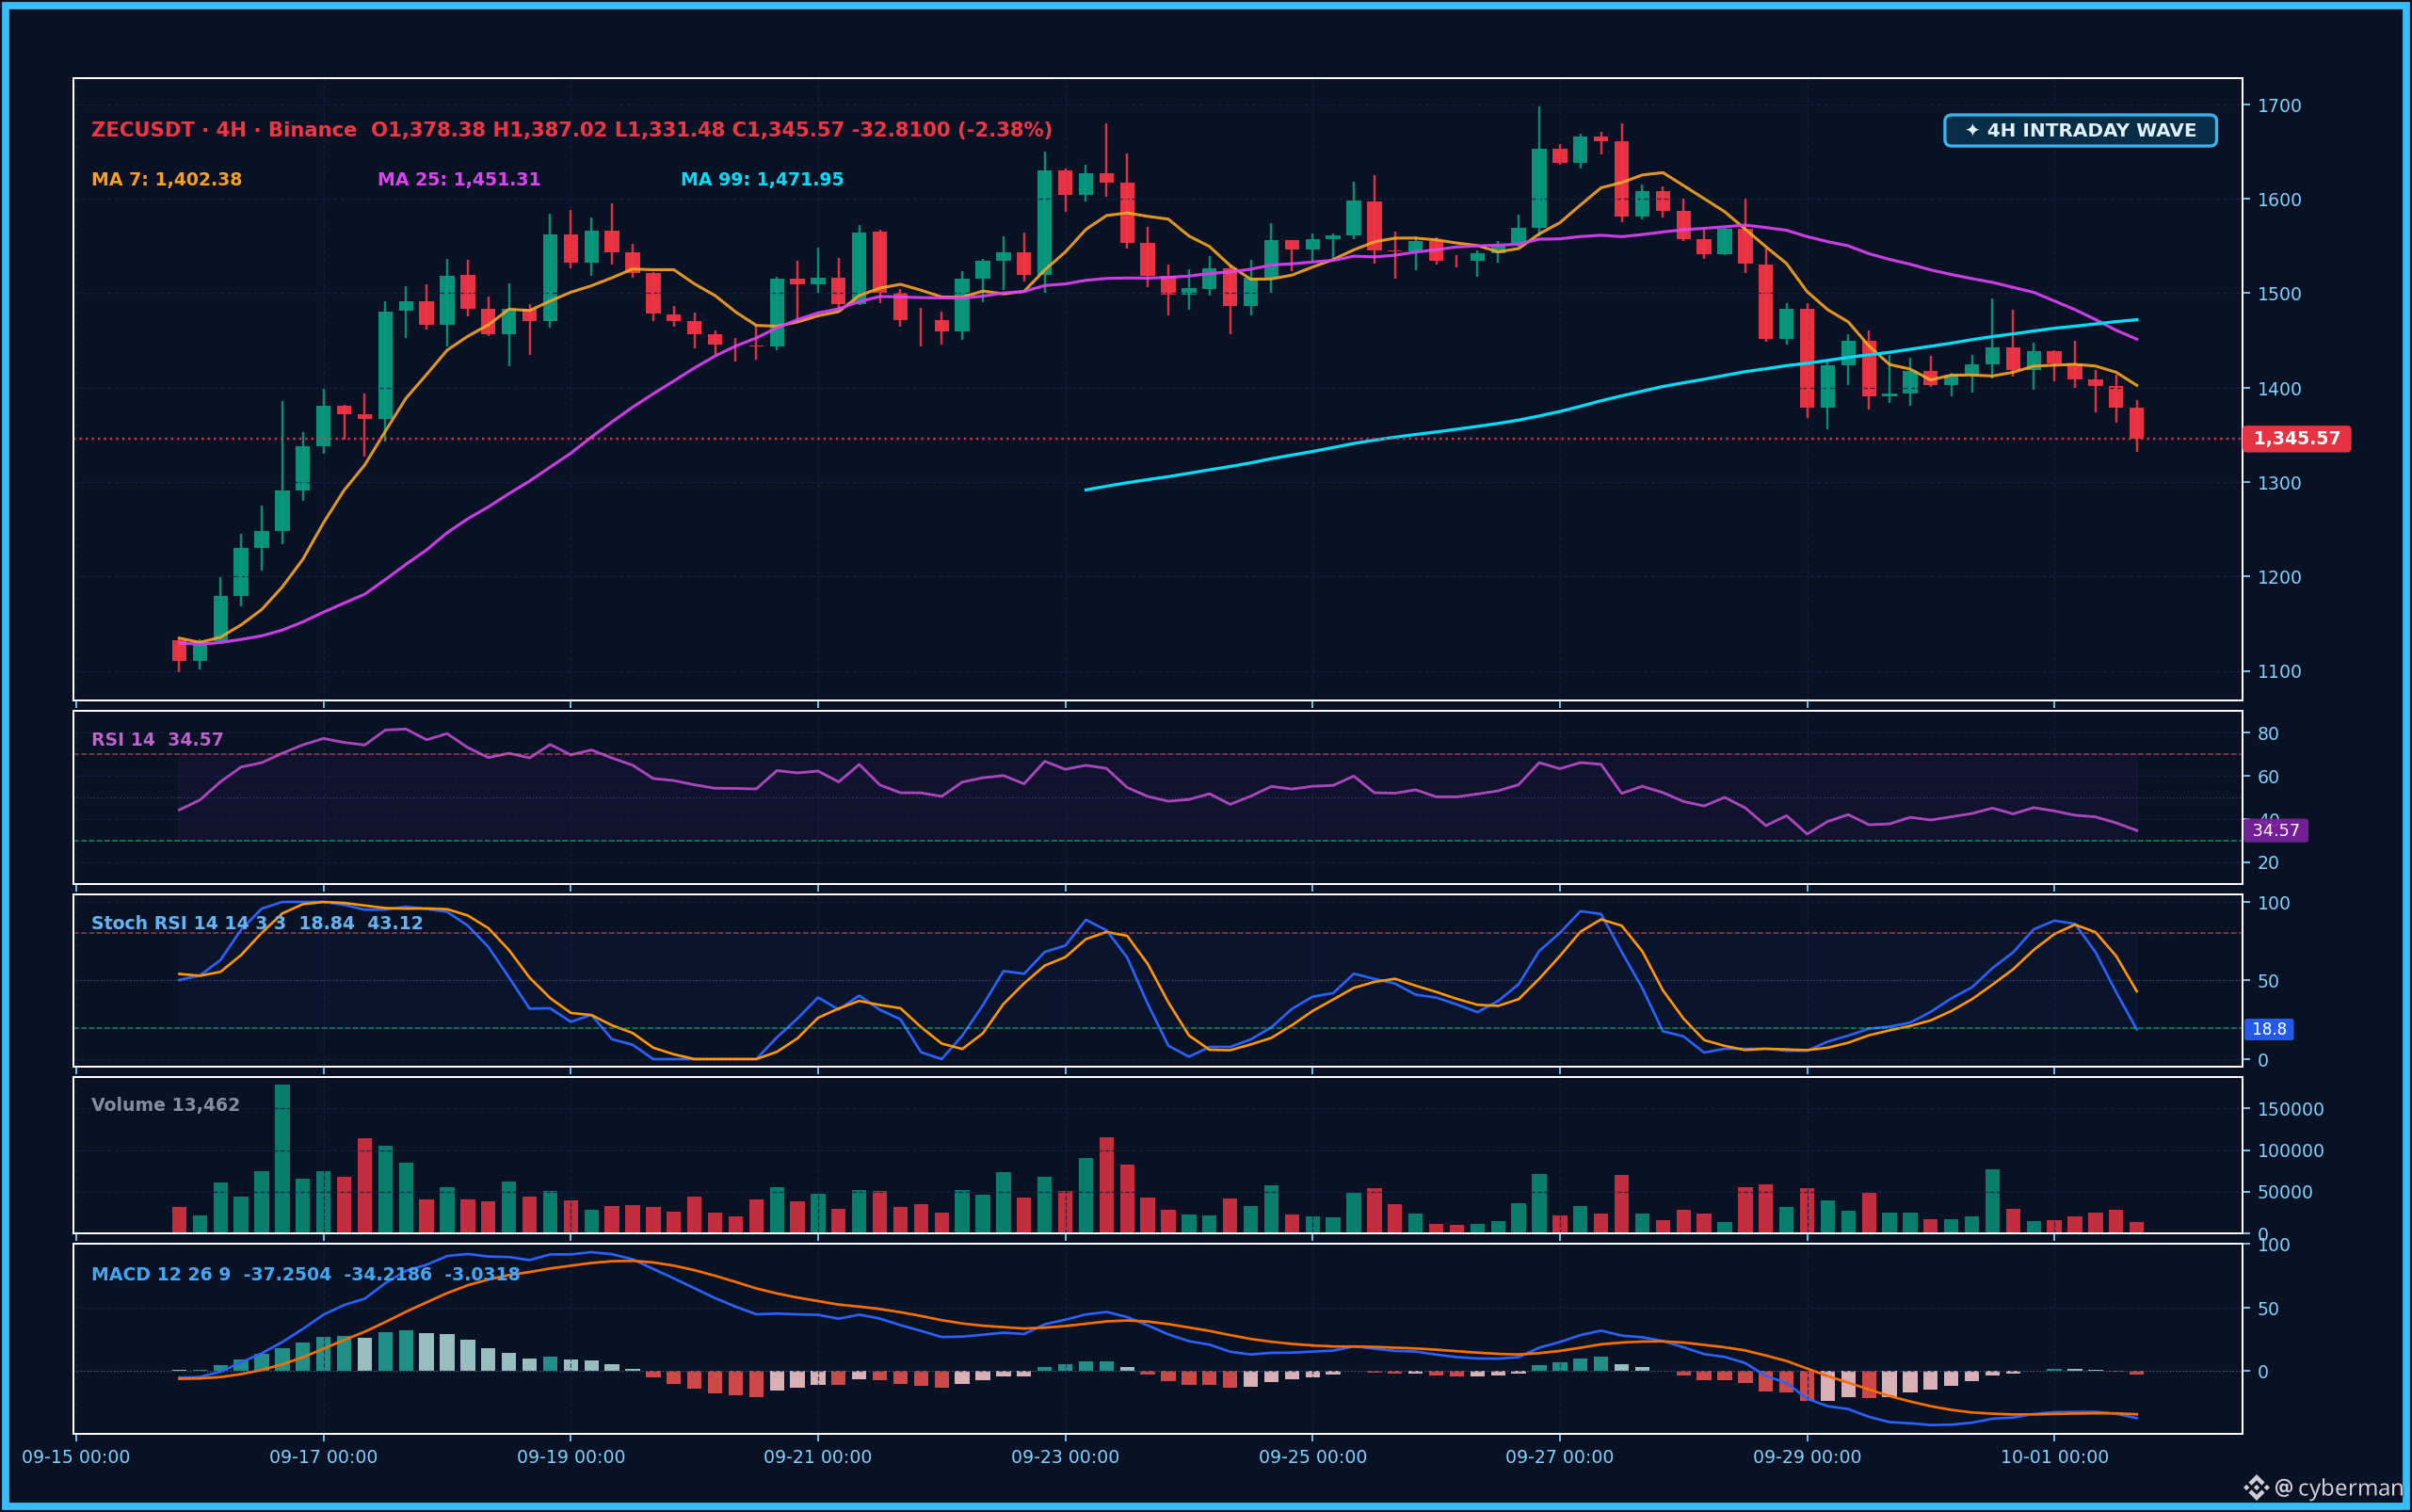
Look at the chart $ZEC right now, brothers. The price is $1,345.57, which is much lower than MA99 at $1,471.95. Clearly, $ZEC is “below the equator” now. The RSI is also weak, at just 34.6. This signal shows selling pressure is dominant. So if $ZEC bounces up just a little, don’t get too excited yet. That could only be a technical “pullback.” For a real “turnaround,” it must break above MA99.
Many new brothers coming into the market often get swept into a few small pullbacks, thinking the price is going to “turn around,” so they jump in and then end up “holding the loss” without understanding why. 💡 Don’t worry—everyone has been caught like that. 🧑🏫
Today, I’m sharing a small tip: treat MA99 as the “trend boundary.” Imagine MA99 as the equator line. Price above this line means the market is in “hot season”—every drop is an opportunity to “buy the dip” and “eat well.” On the other hand, when price is below MA99, it’s in “cold season,” and any rally is just a short “pullback,” not a real “turnaround.” At this time, the “train barrier” is a recipe for getting “account burnt.” 👀
Look at the chart $ZEC right now, brothers. The price is $1,345.57, which is much lower than MA99 at $1,471.95. Clearly, $ZEC is “below the equator” now. The RSI is also weak, at just 34.6. This signal shows selling pressure is dominant. So if $ZEC bounces up just a little, don’t get too excited yet. That could only be a technical “pullback.” For a real “turnaround,” it must break above MA99.
Today, I’m sharing a small tip: treat MA99 as the “trend boundary.” Imagine MA99 as the equator line. Price above this line means the market is in “hot season”—every drop is an opportunity to “buy the dip” and “eat well.” On the other hand, when price is below MA99, it’s in “cold season,” and any rally is just a short “pullback,” not a real “turnaround.” At this time, the “train barrier” is a recipe for getting “account burnt.” 👀
Look at the chart $ZEC right now, brothers. The price is $1,345.57, which is much lower than MA99 at $1,471.95. Clearly, $ZEC is “below the equator” now. The RSI is also weak, at just 34.6. This signal shows selling pressure is dominant. So if $ZEC bounces up just a little, don’t get too excited yet. That could only be a technical “pullback.” For a real “turnaround,” it must break above MA99.
63
·
--
Just look at this $ETH stalemate like this—I feel all tingly already, guys. 🤔 It feels like there’s a juicy setup coming for whoever’s willing to go against the current.
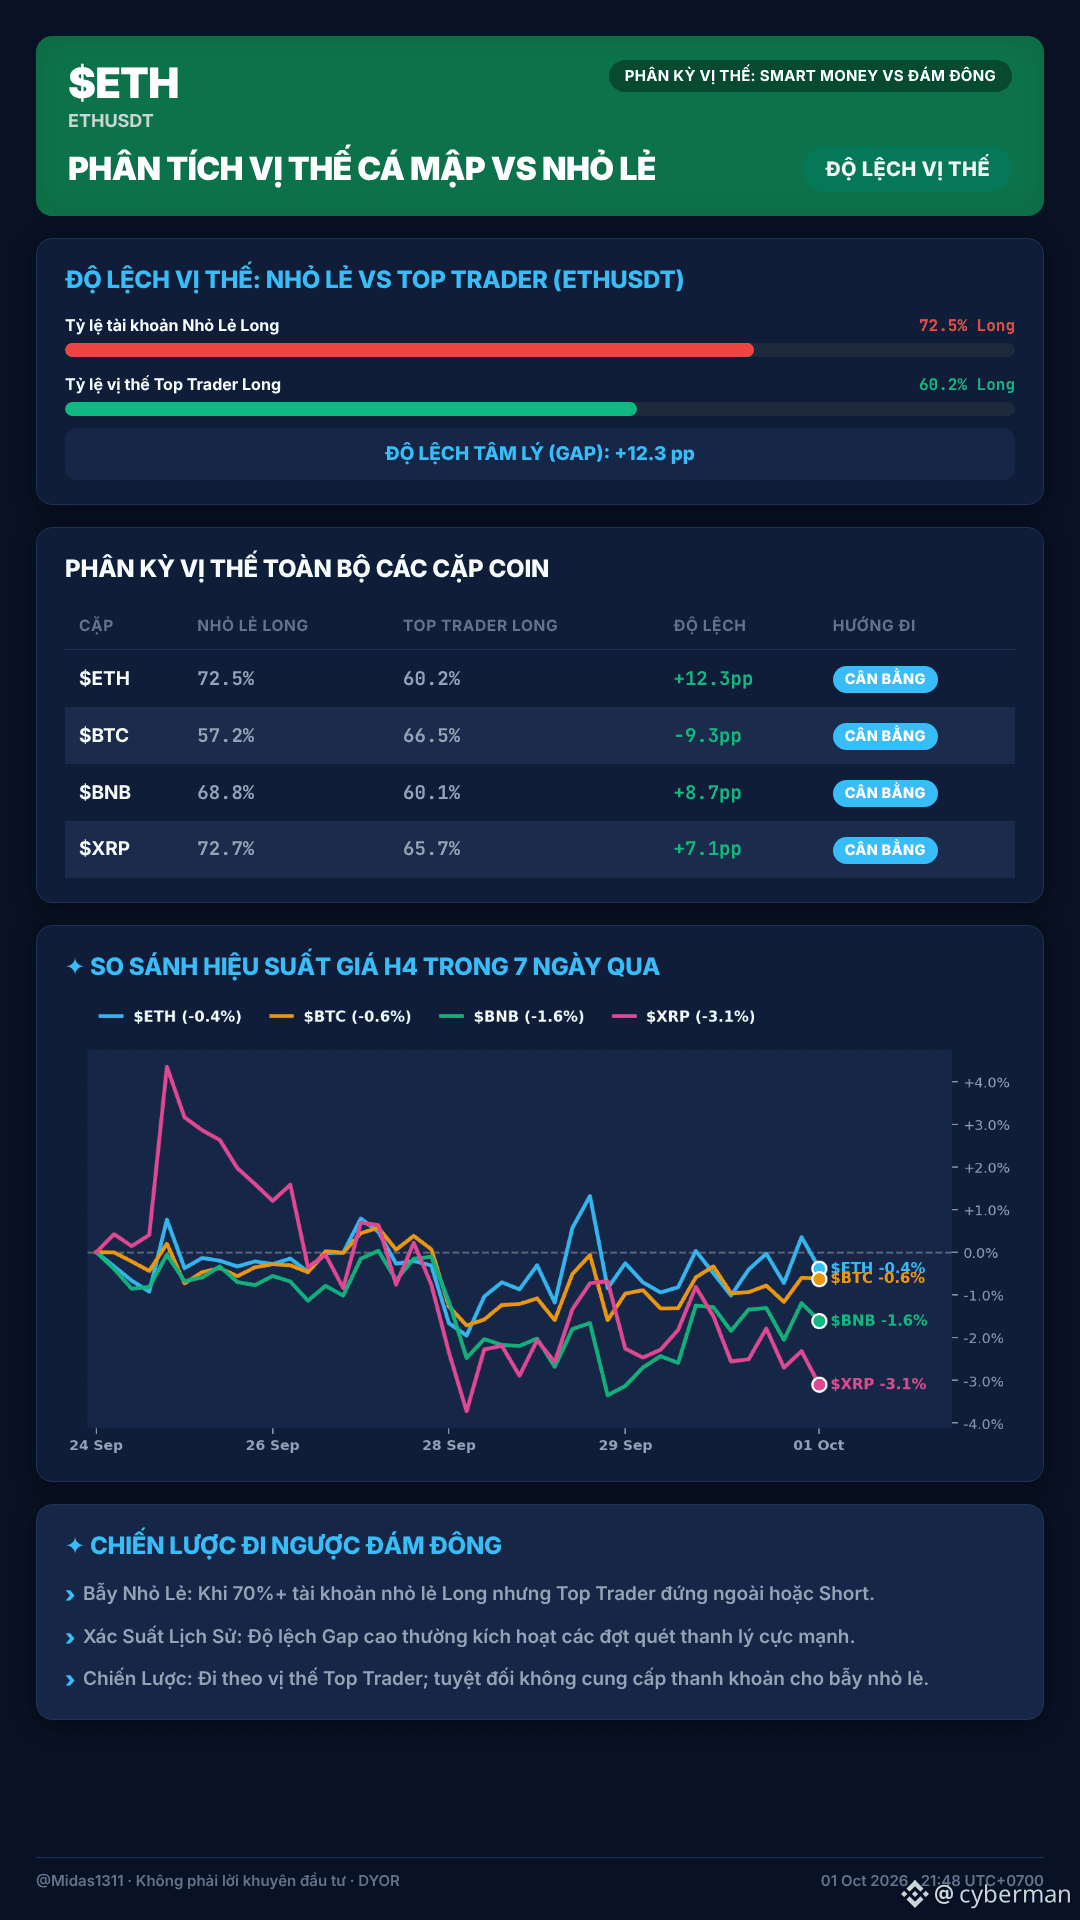
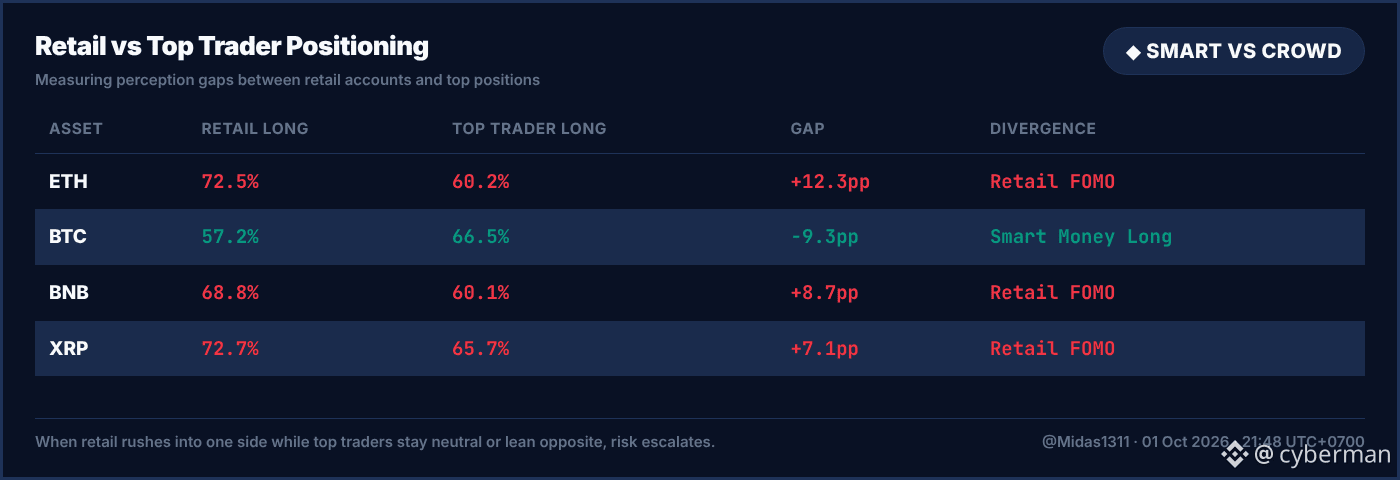
Analyzing positioning on Binance Futures shows that the retail crowd is Long $ETH up to 72.5%, while the whales are only Long 60.2%. This +12.3pp gap is no joke—clearly, it’s a FOMO signal from the masses.
On the other hand, Bitcoin is totally different. Top Traders are more strongly Long than retail (66.5% vs 57.2%, gap -9.3pp). Anyone quietly accumulating spot knows what I mean. BNB and XRP are similar to ETH: retail is more strongly Long than Top Traders, indicating a clear sense of caution from the whale camp.
So the real question is: will you follow the emotions of the FOMO crowd, or swim with the whales to feast? As for me, my hard-earned experience says: just follow the Top Traders and buy. When the crowd is Long too aggressively—that’s usually when the market is easiest to turn around. Don’t let yourself be led by the nose! 😏
$ETH #Write2Earn #MarketUpdate #BinanceFutures
(Not investment advice—do your own research)
---
Just look at this $ETH stalemate like this—I feel all tingly already, guys. 🤔 It feels like there’s a juicy setup coming for whoever’s willing to go against the current.
Analyzing positioning on Binance Futures shows that the retail crowd is Long $ETH up to 72.5%, while the whales are only Long 60.2%. This +12.3pp gap is no joke—clearly, it’s a FOMO signal from the masses.
On the other hand, Bitcoin is totally different. Top Traders are more strongly Long than retail (66.5% vs 57.2%, gap -9.3pp). Anyone quietly accumulating spot knows what I mean. BNB and XRP are similar to ETH: retail is more strongly Long than Top Traders, indicating a clear sense of caution from the whale camp.
So the real question is: will you follow the emotions of the FOMO crowd, or swim with the whales to feast? As for me, my hard-earned experience says: just follow the Top Traders and buy. When the crowd is Long too aggressively—that’s usually when the market is easiest to turn around. Don’t let yourself be led by the nose! 😏
$ETH #Write2Earn #MarketUpdate #BinanceFutures
(Not investment advice—do your own research)
---
Analyzing positioning on Binance Futures shows that the retail crowd is Long $ETH up to 72.5%, while the whales are only Long 60.2%. This +12.3pp gap is no joke—clearly, it’s a FOMO signal from the masses.
On the other hand, Bitcoin is totally different. Top Traders are more strongly Long than retail (66.5% vs 57.2%, gap -9.3pp). Anyone quietly accumulating spot knows what I mean. BNB and XRP are similar to ETH: retail is more strongly Long than Top Traders, indicating a clear sense of caution from the whale camp.
So the real question is: will you follow the emotions of the FOMO crowd, or swim with the whales to feast? As for me, my hard-earned experience says: just follow the Top Traders and buy. When the crowd is Long too aggressively—that’s usually when the market is easiest to turn around. Don’t let yourself be led by the nose! 😏
$ETH #Write2Earn #MarketUpdate #BinanceFutures
(Not investment advice—do your own research)
---
1
119
·
--
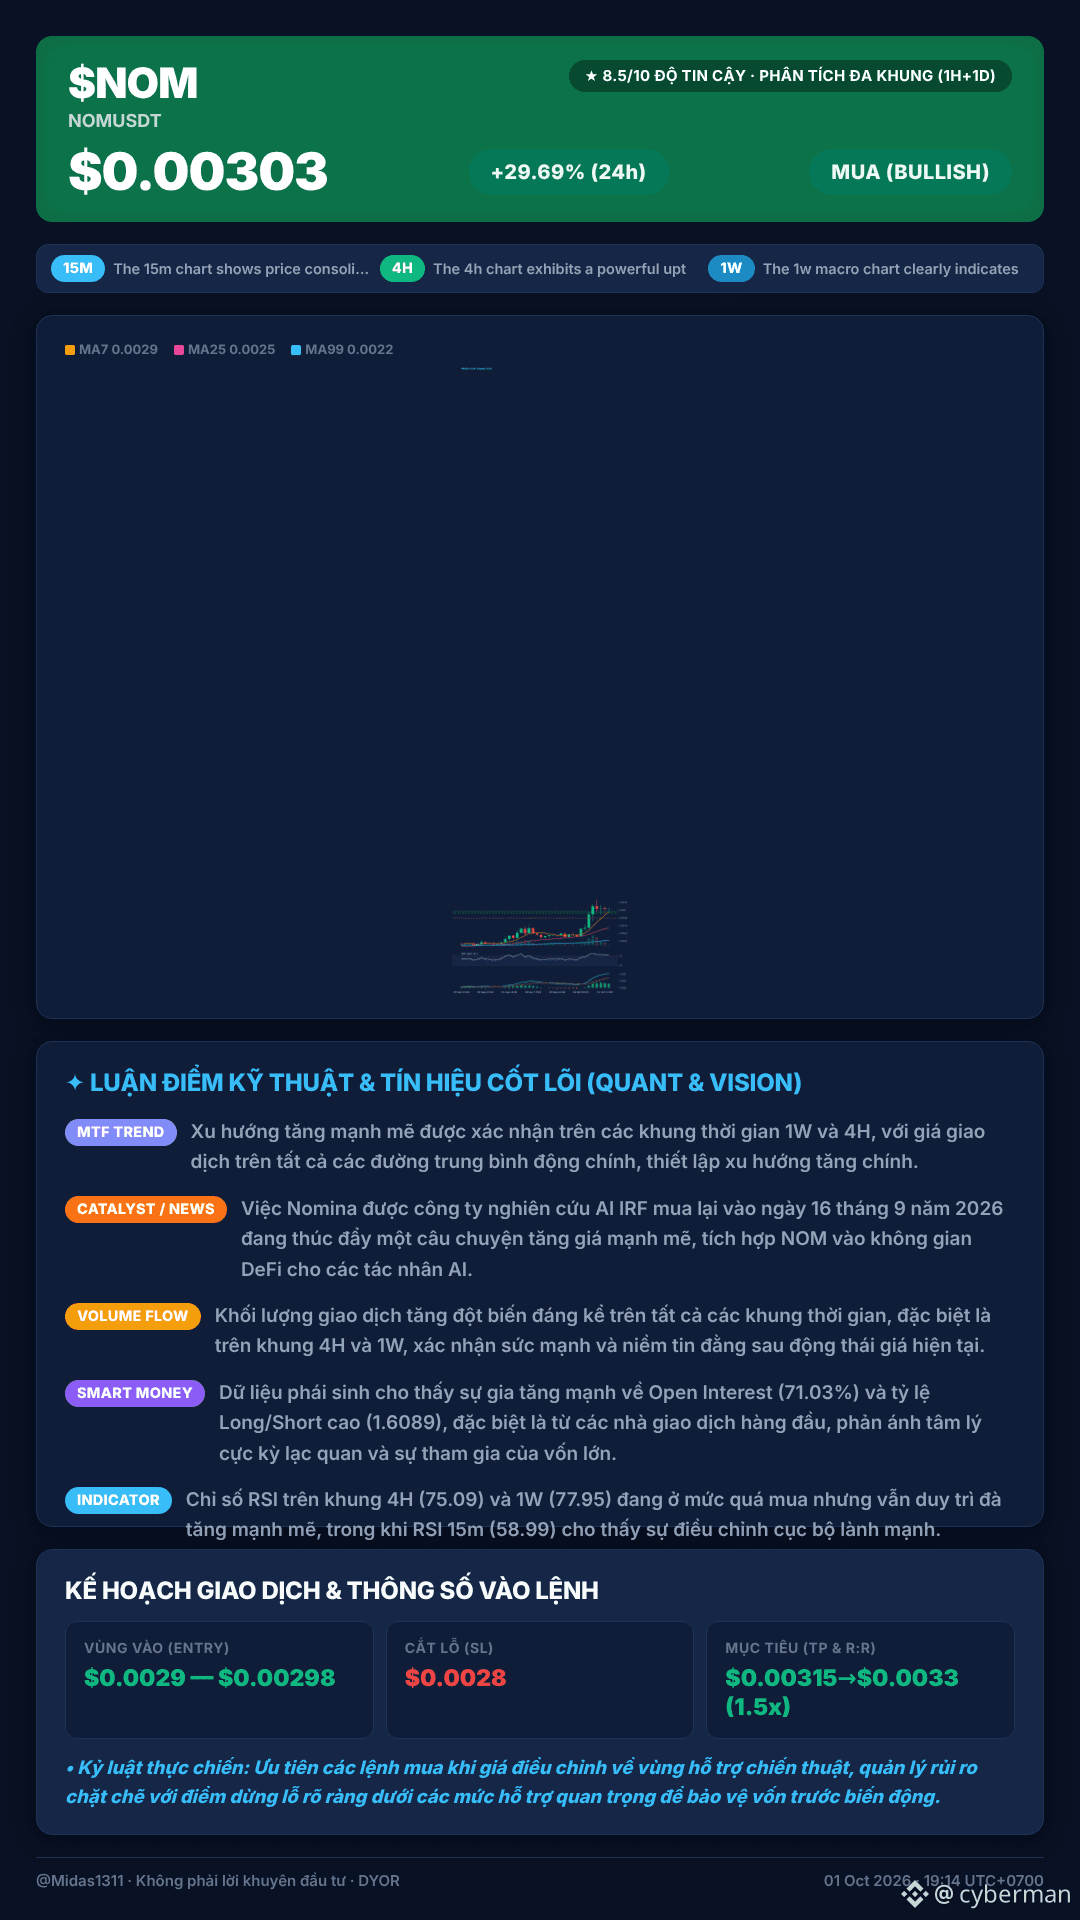
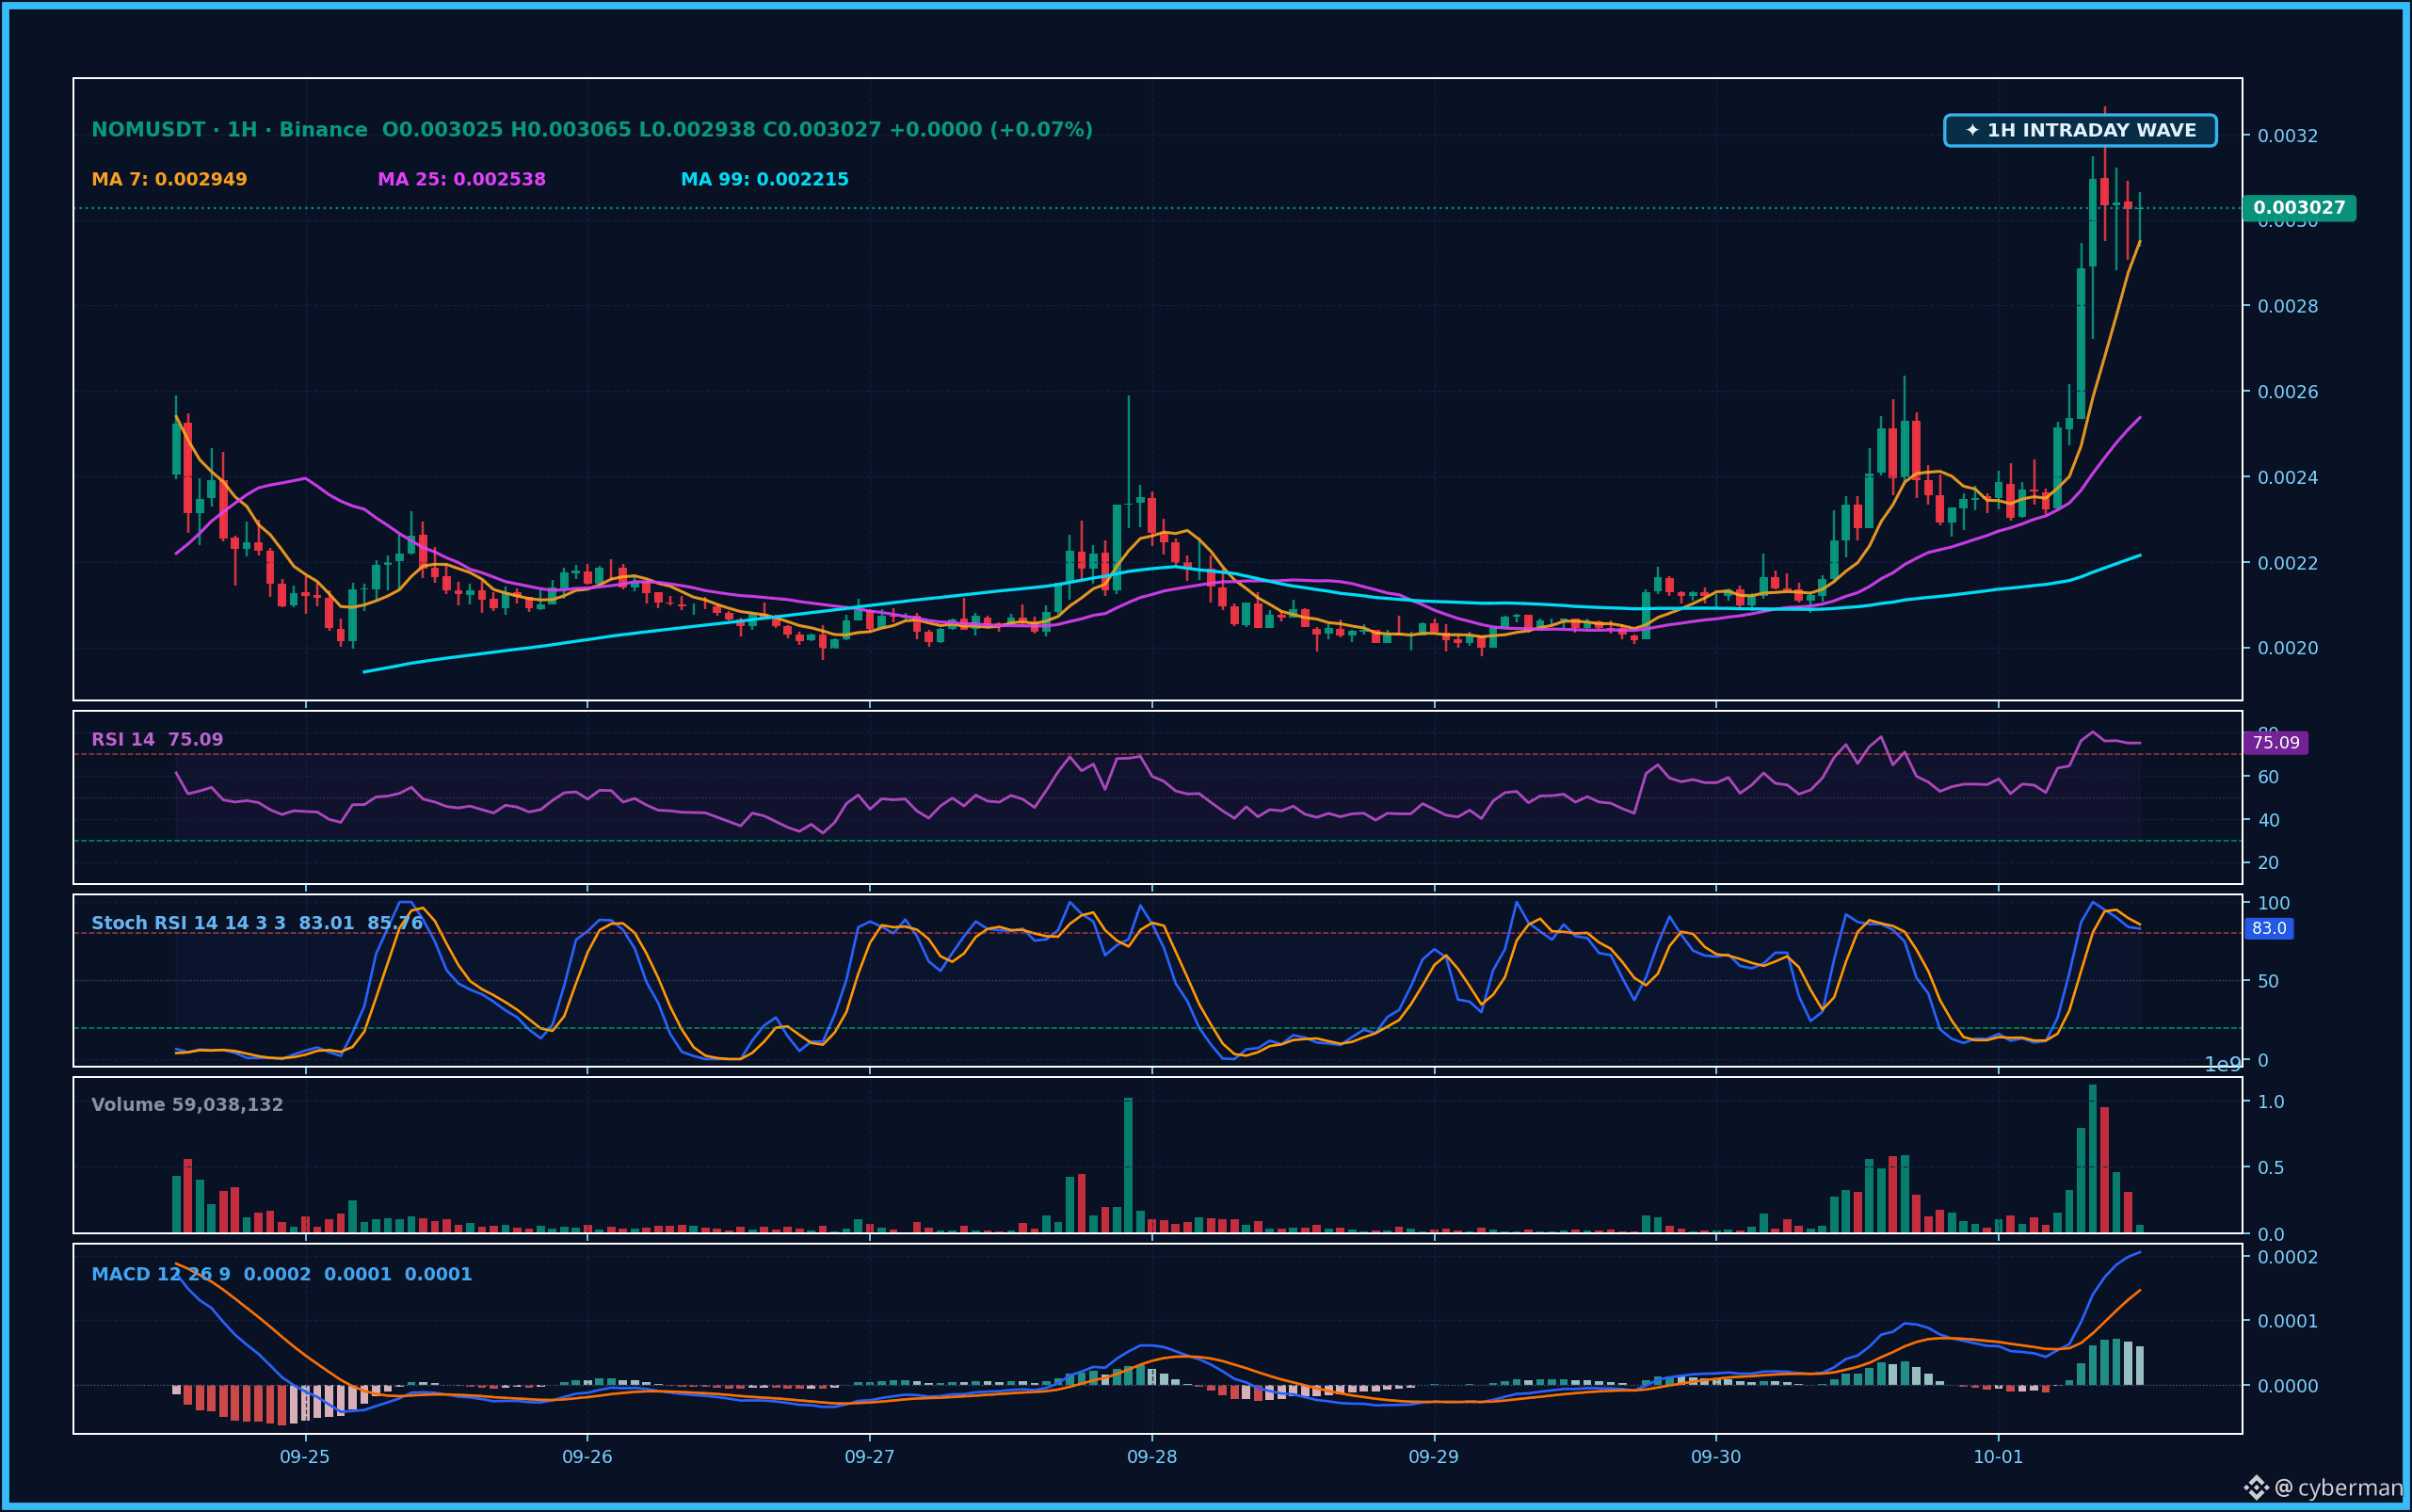
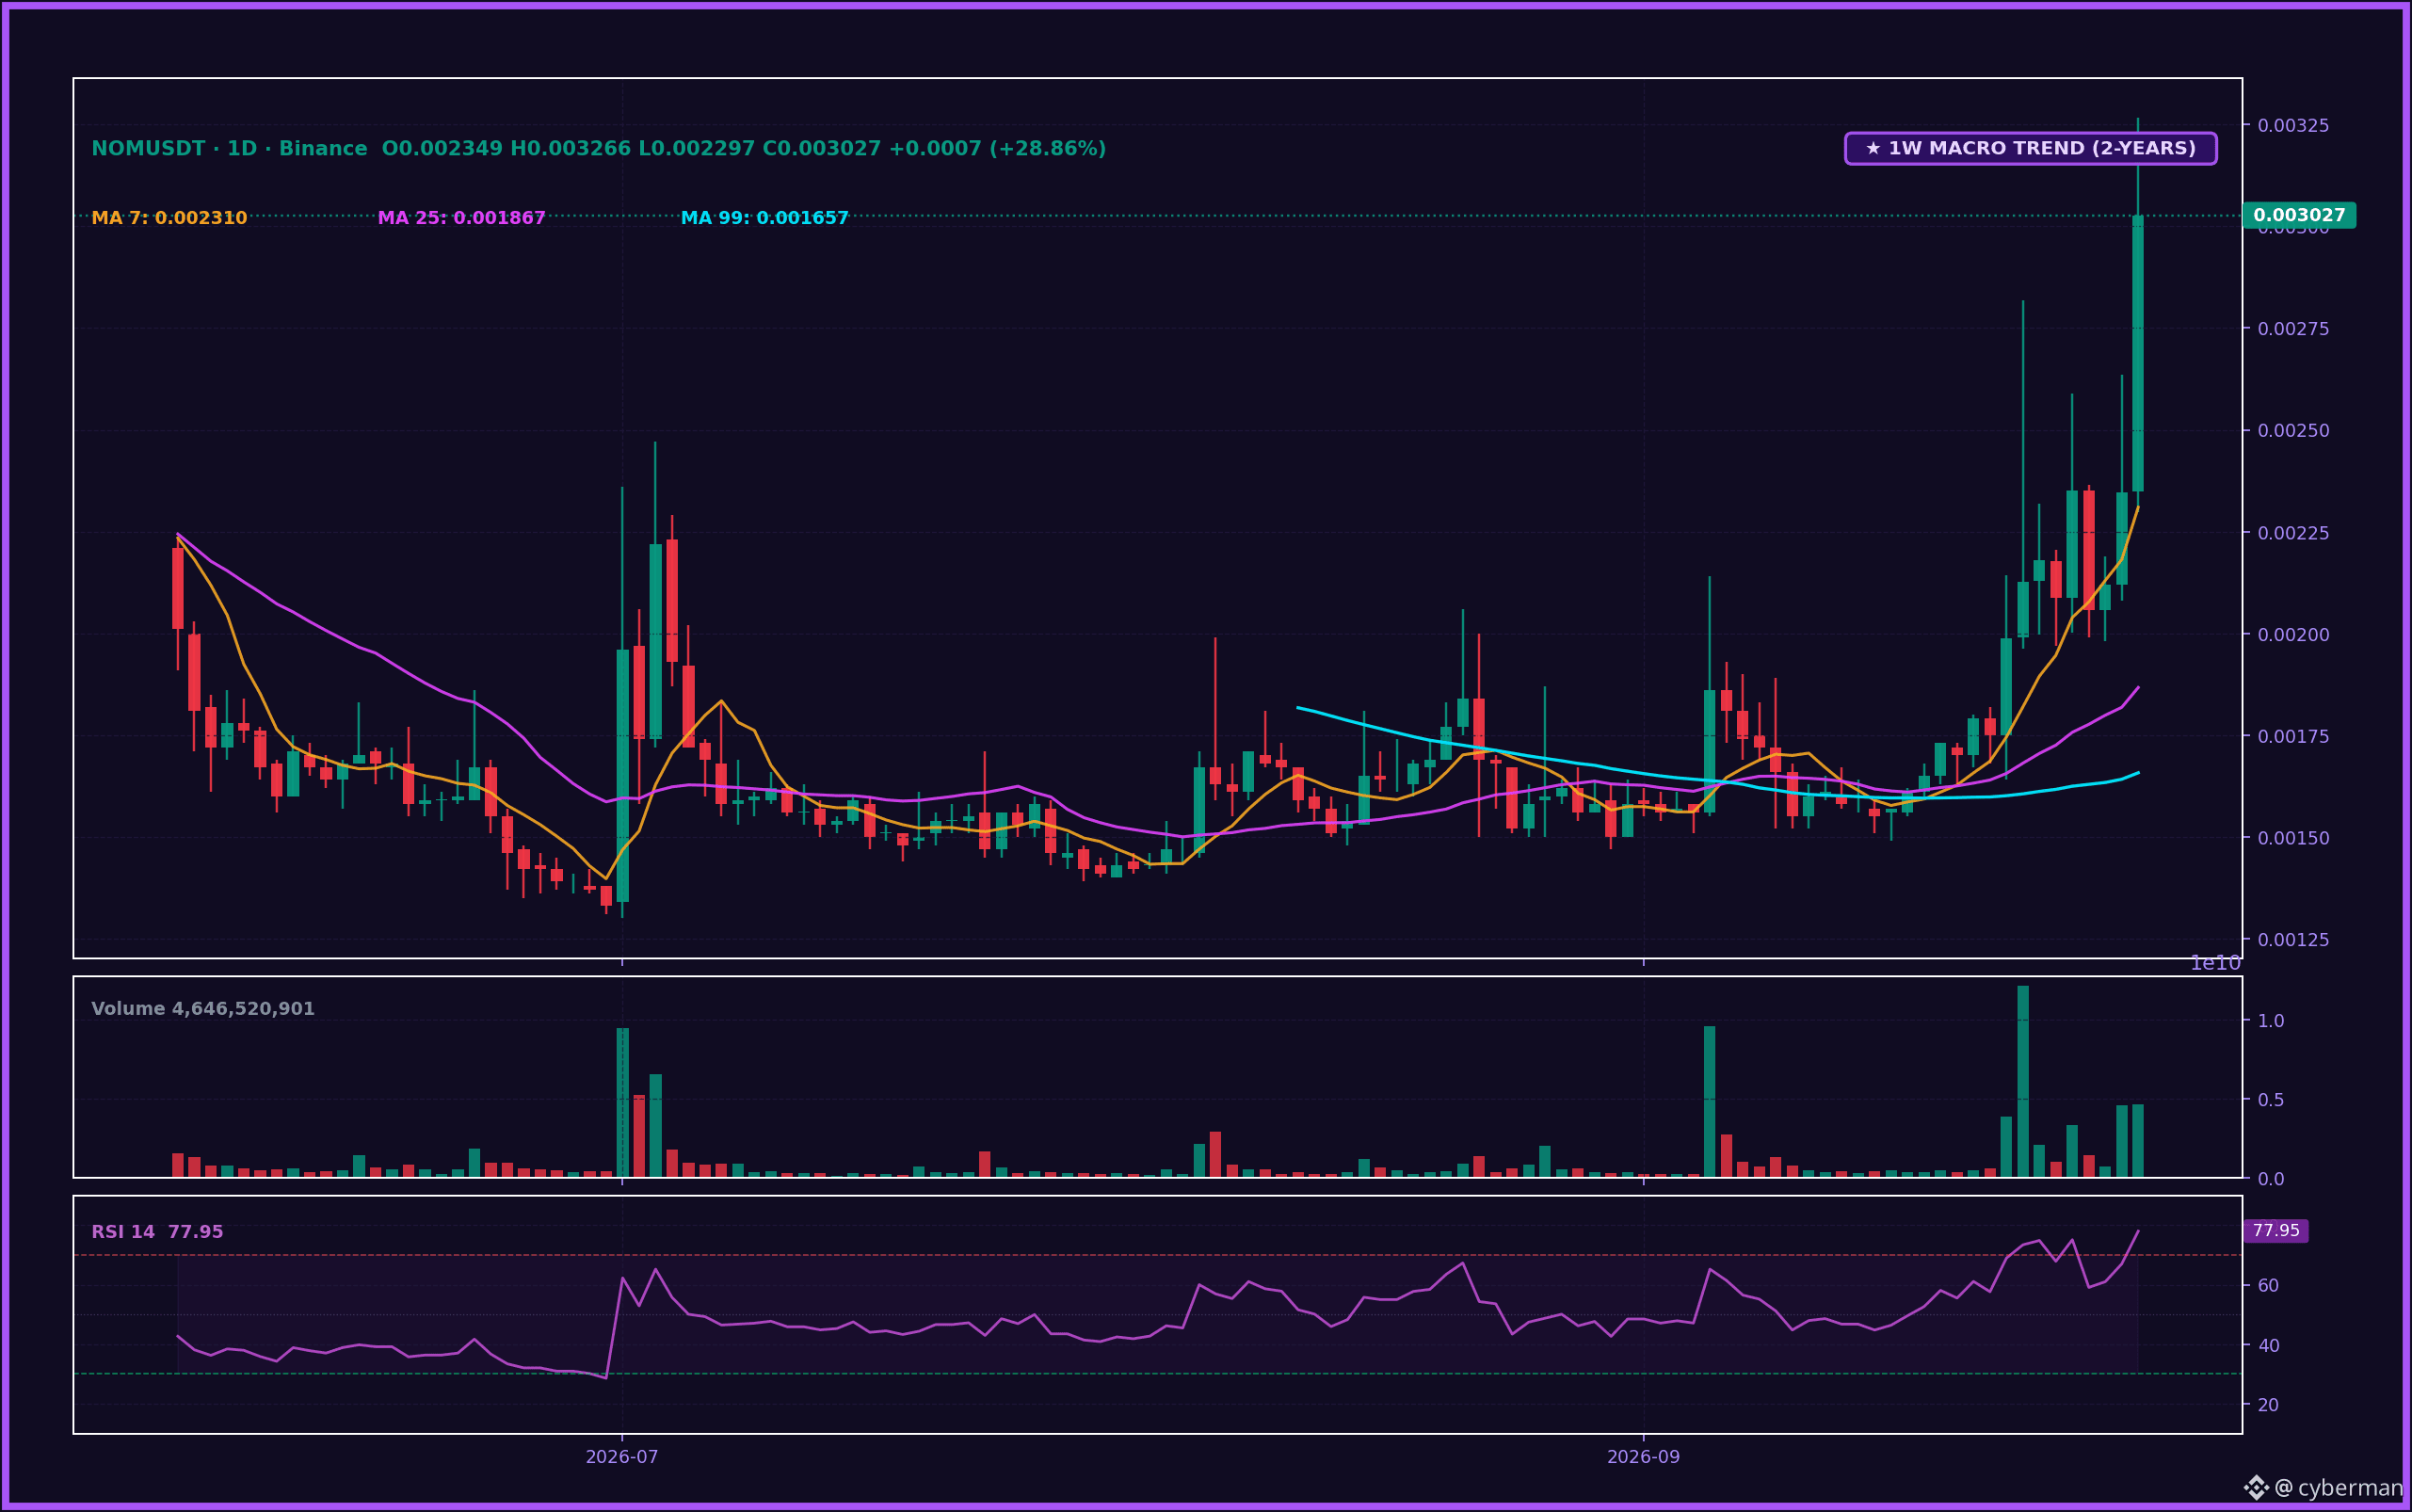
Oh wow, $NOM is running like crazy, brothers and sisters! I didn’t even finish loading the chart when it already jerked up another towering green candle 👀. Looking at both the 1H and 1D timeframes, $NOM really is in an extremely strong uptrend— the main trend is confirmed when the price is above all the key MA lines.
Price is at 0.00303, up nearly 30% in 24h with a huge volume of 21,371,467 USDT. Trading volume has surged sharply across both the 4H and 1W timeframes—the big money is clearly flowing in. Especially the Nomina news: it’s in the hands of AI IRF company from 16/9/2026, integrating $NOM into the DeFi space for AI agents, creating an extremely strong narrative that’s pushing the price.
The derivatives data makes me even more confident: Open Interest is up 71.0%, 61.7% of accounts are Long, and the funding rate is positive—plus top traders are strongly Long. Are the whales just sweeping up the orders?
Oh wow, $NOM is running like crazy, brothers and sisters! I didn’t even finish loading the chart when it already jerked up another towering green candle 👀. Looking at both the 1H and 1D timeframes, $NOM really is in an extremely strong uptrend— the main trend is confirmed when the price is above all the key MA lines.
Price is at 0.00303, up nearly 30% in 24h with a huge volume of 21,371,467 USDT. Trading volume has surged sharply across both the 4H and 1W timeframes—the big money is clearly flowing in. Especially the Nomina news: it’s in the hands of AI IRF company from 16/9/2026, integrating $NOM into the DeFi space for AI agents, creating an extremely strong narrative that’s pushing the price.
The derivatives data makes me even more confident: Open Interest is up 71.0%, 61.7% of accounts are Long, and the funding rate is positive—plus top traders are strongly Long. Are the whales just sweeping up the orders?
Price is at 0.00303, up nearly 30% in 24h with a huge volume of 21,371,467 USDT. Trading volume has surged sharply across both the 4H and 1W timeframes—the big money is clearly flowing in. Especially the Nomina news: it’s in the hands of AI IRF company from 16/9/2026, integrating $NOM into the DeFi space for AI agents, creating an extremely strong narrative that’s pushing the price.
The derivatives data makes me even more confident: Open Interest is up 71.0%, 61.7% of accounts are Long, and the funding rate is positive—plus top traders are strongly Long. Are the whales just sweeping up the orders?
85
·
--
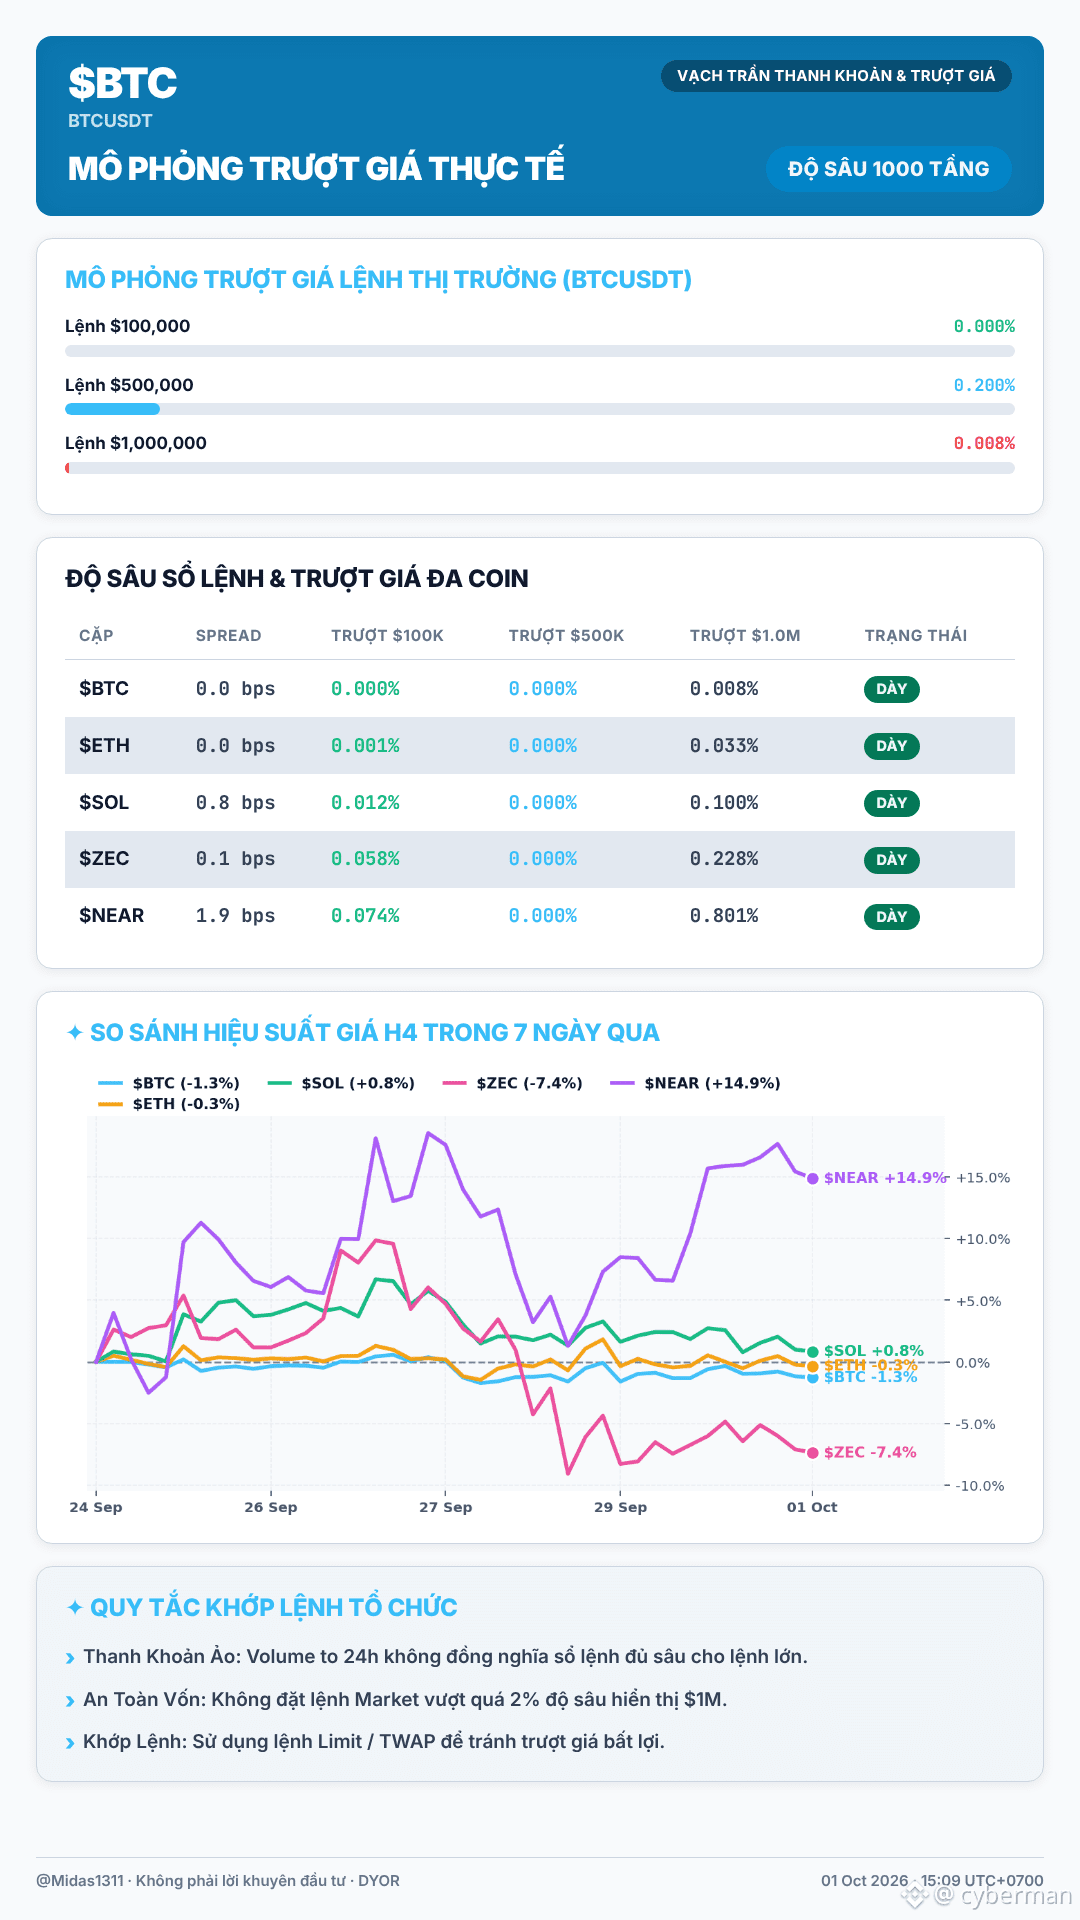
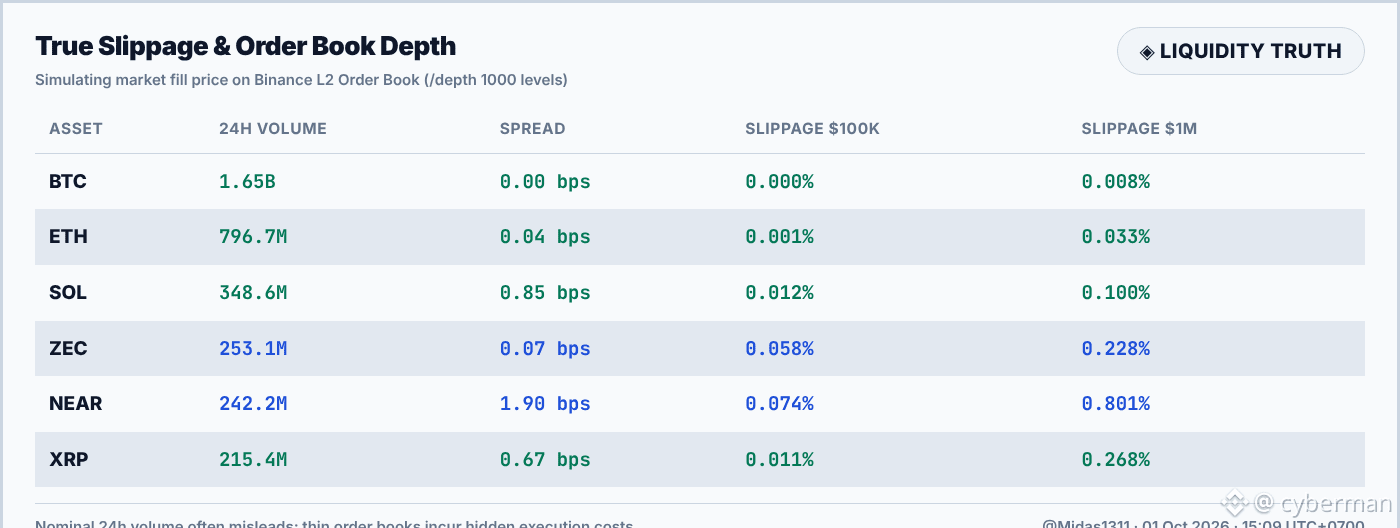
After seeing $BTC a tug-of-war, everyone thought it was normal. But looking deeper into the order book, many coins with massive 24h volume had $1M orders that “disappeared” due to slippage. Don’t let the 24h volume numbers mislead you—they’re just past events and don’t reflect the current depth of the order book 🧮.
$BTC with 24h volume of $1.65B, a $1M order only suffered 0.008% slippage—evidence of real liquidity. ETH is similar: volume $796.7M, $1M order slippage of just 0.033% 🤓. But look at NEAR: with $242.2M volume, the spread is 1.90 bps, and a $1M order slips by 0.801% 😐. Or ZEC: volume $253.1M, yet a $1M order slips as much as 0.228%. Clearly, a thin order book means “big players” moving in can eat through the whole block and cause slippage. Hidden costs from spread and slippage can destroy an account faster than making the wrong call on the chart.
So traders should always check the order book depth (/depth 1000) before buying. Prefer Limit orders instead of Market orders to protect your capital. Market orders when the order book is dry are very easy to get “drained” of liquidity without you even noticing 👀.
$BTC has already entered this price zone—can it still “hold and keep profit”?
After seeing $BTC a tug-of-war, everyone thought it was normal. But looking deeper into the order book, many coins with massive 24h volume had $1M orders that “disappeared” due to slippage. Don’t let the 24h volume numbers mislead you—they’re just past events and don’t reflect the current depth of the order book 🧮.
$BTC with 24h volume of $1.65B, a $1M order only suffered 0.008% slippage—evidence of real liquidity. ETH is similar: volume $796.7M, $1M order slippage of just 0.033% 🤓. But look at NEAR: with $242.2M volume, the spread is 1.90 bps, and a $1M order slips by 0.801% 😐. Or ZEC: volume $253.1M, yet a $1M order slips as much as 0.228%. Clearly, a thin order book means “big players” moving in can eat through the whole block and cause slippage. Hidden costs from spread and slippage can destroy an account faster than making the wrong call on the chart.
So traders should always check the order book depth (/depth 1000) before buying. Prefer Limit orders instead of Market orders to protect your capital. Market orders when the order book is dry are very easy to get “drained” of liquidity without you even noticing 👀.
$BTC has already entered this price zone—can it still “hold and keep profit”?
$BTC with 24h volume of $1.65B, a $1M order only suffered 0.008% slippage—evidence of real liquidity. ETH is similar: volume $796.7M, $1M order slippage of just 0.033% 🤓. But look at NEAR: with $242.2M volume, the spread is 1.90 bps, and a $1M order slips by 0.801% 😐. Or ZEC: volume $253.1M, yet a $1M order slips as much as 0.228%. Clearly, a thin order book means “big players” moving in can eat through the whole block and cause slippage. Hidden costs from spread and slippage can destroy an account faster than making the wrong call on the chart.
So traders should always check the order book depth (/depth 1000) before buying. Prefer Limit orders instead of Market orders to protect your capital. Market orders when the order book is dry are very easy to get “drained” of liquidity without you even noticing 👀.
$BTC has already entered this price zone—can it still “hold and keep profit”?
163
·
--
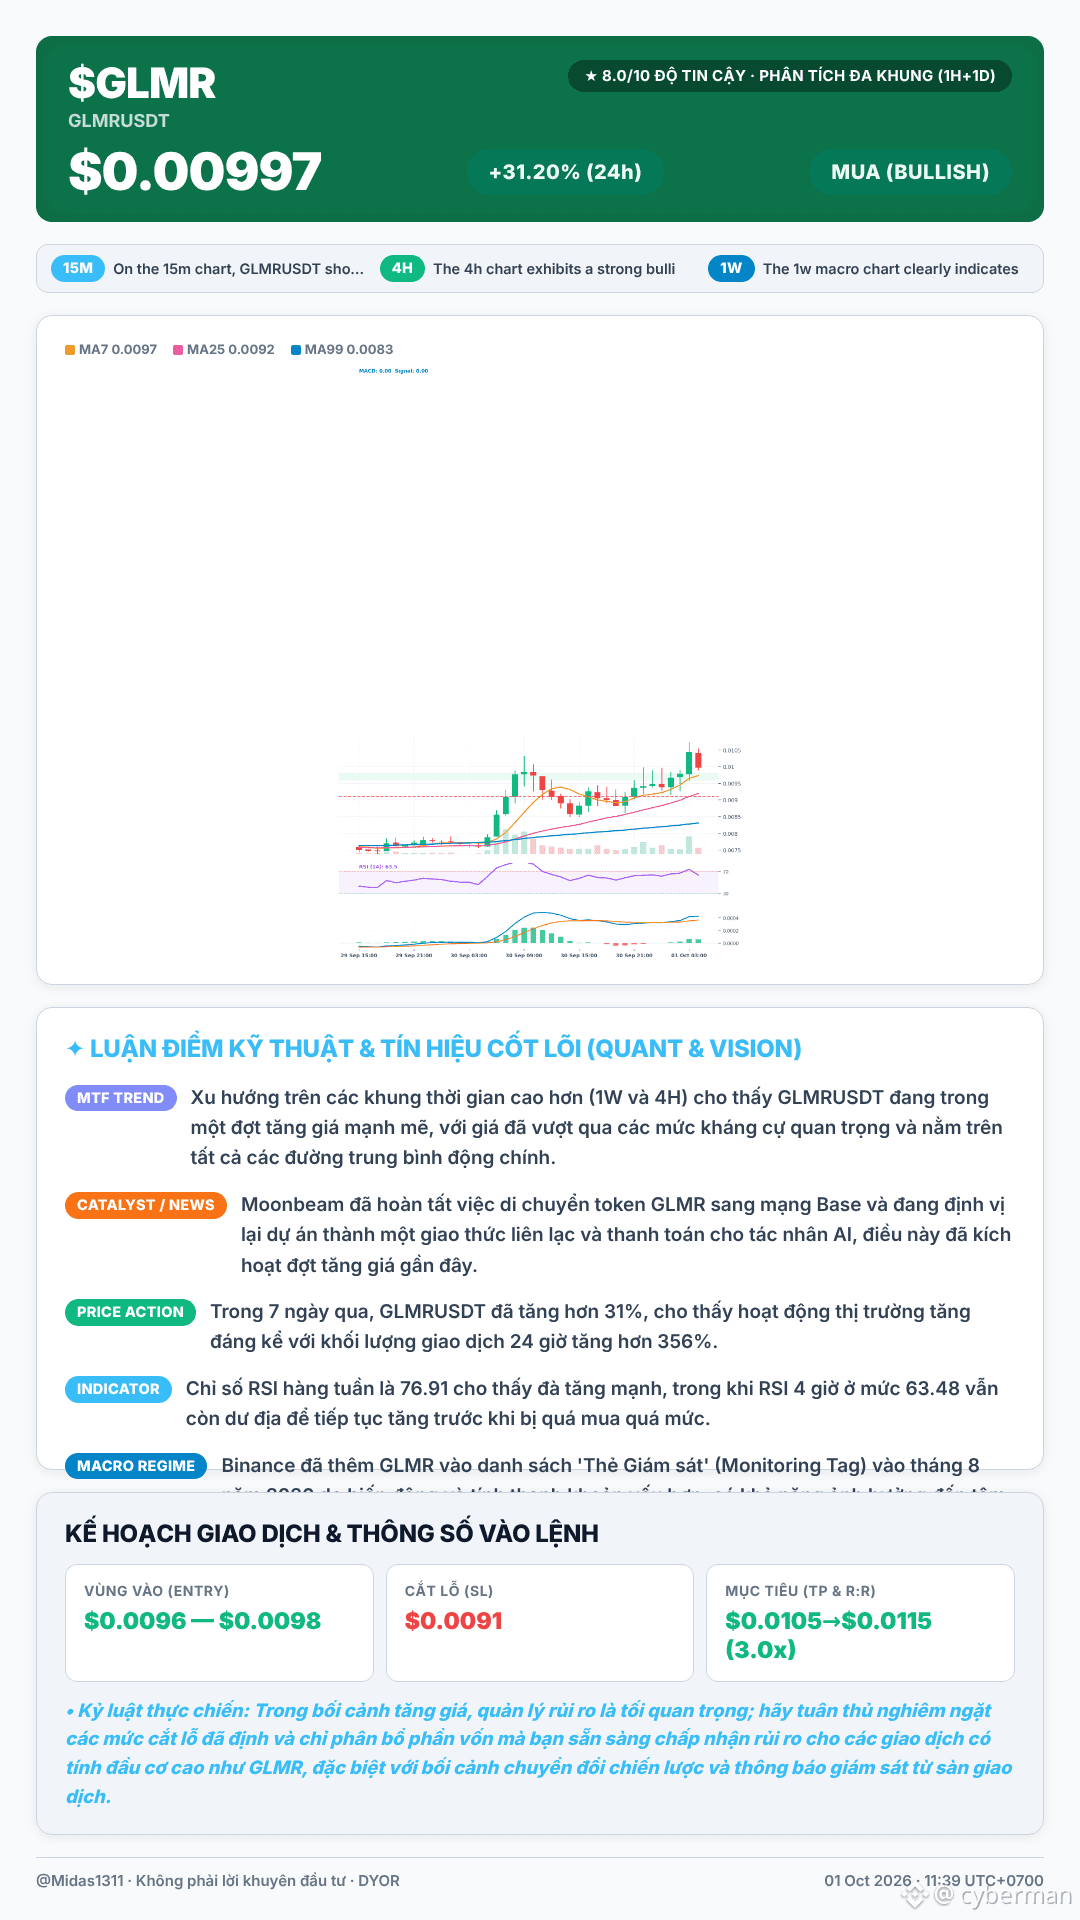
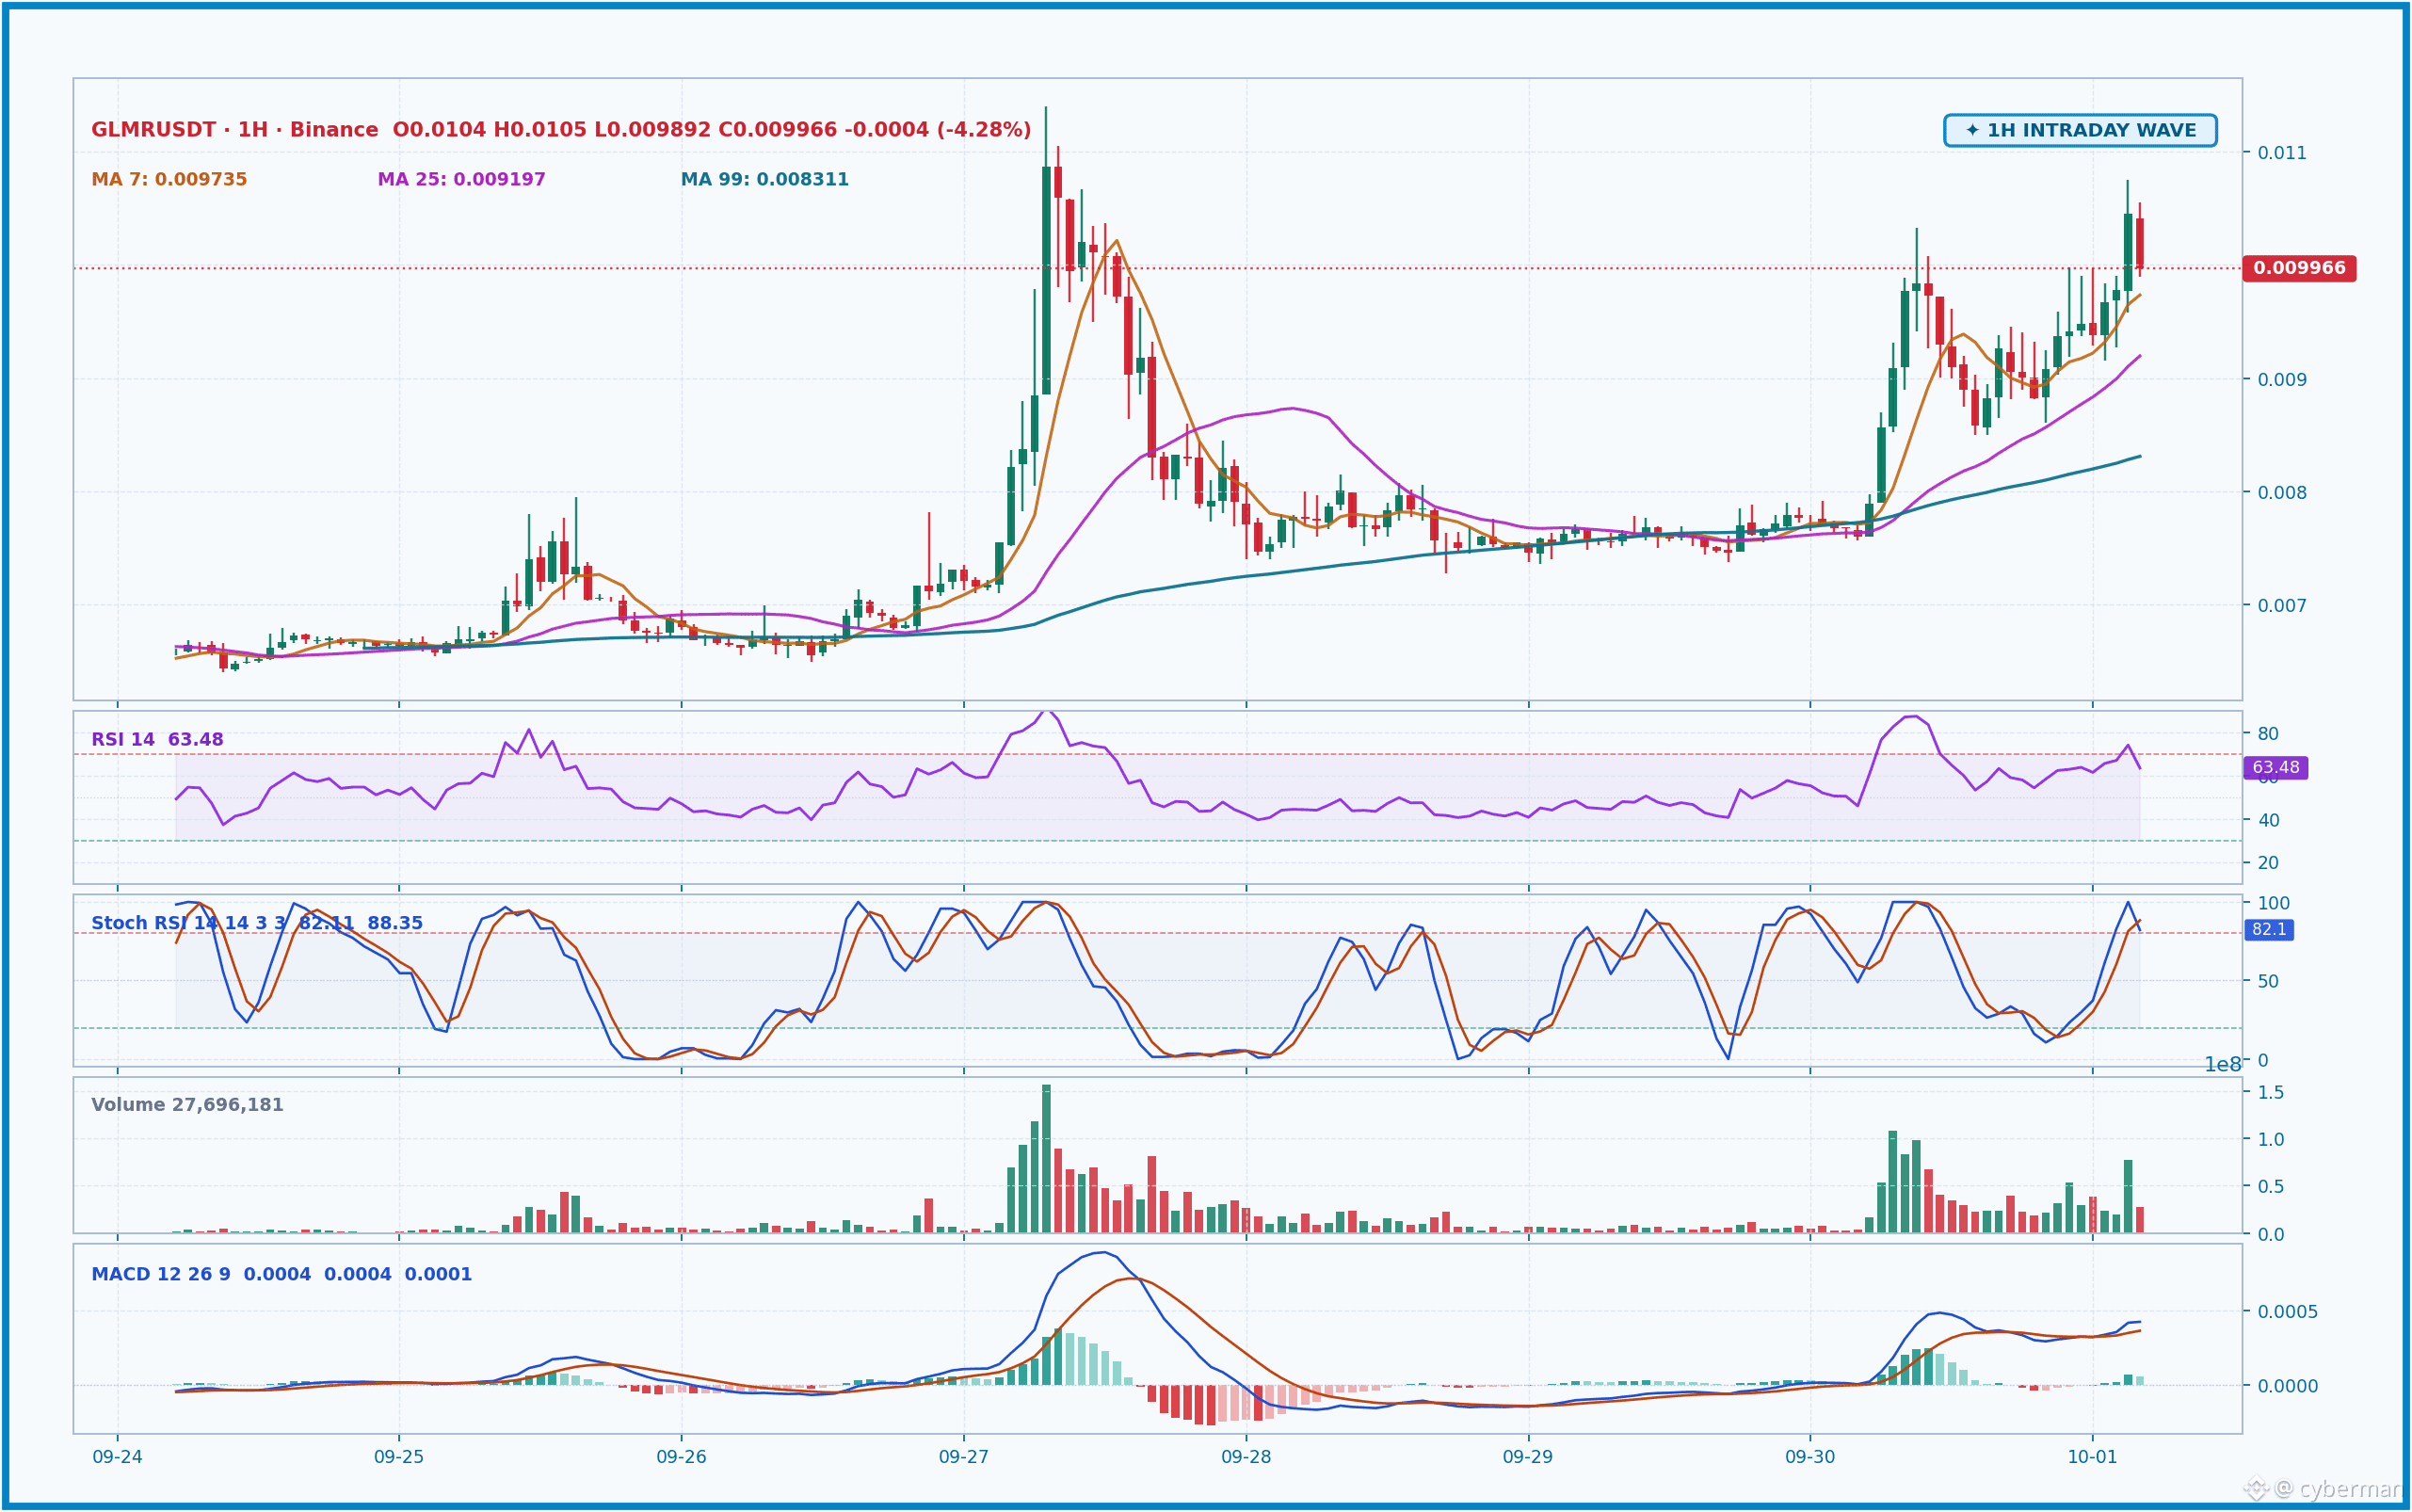
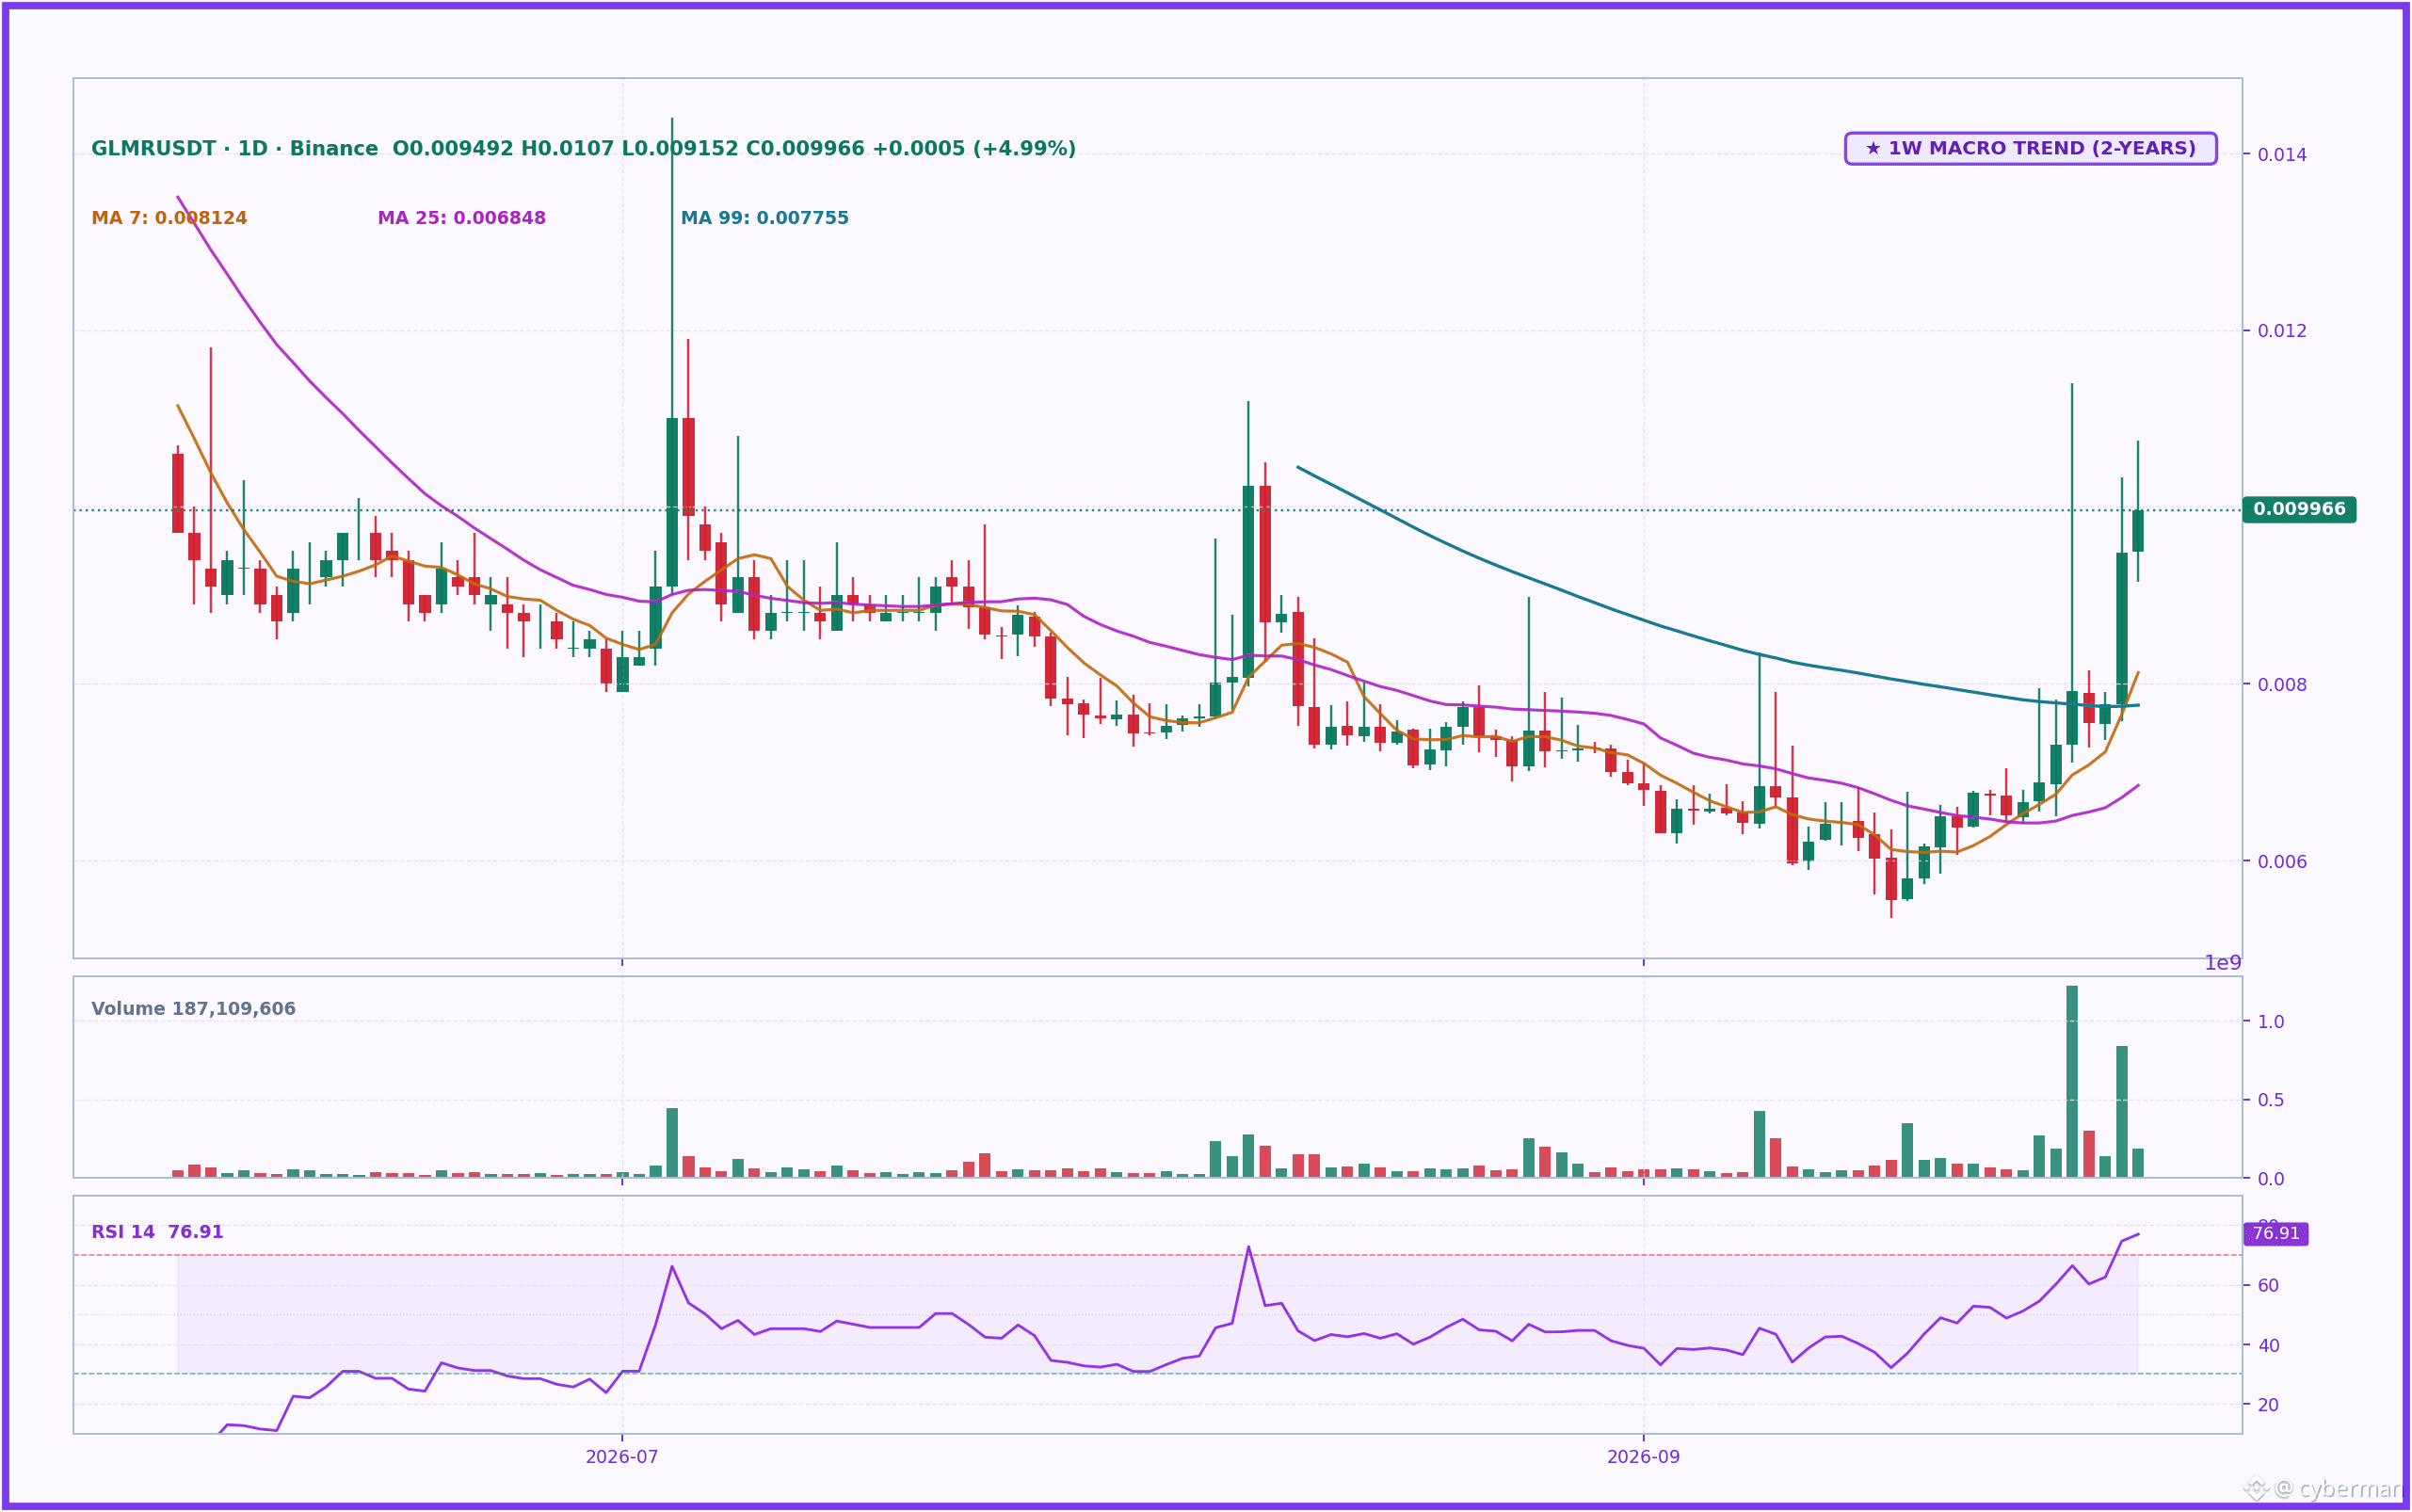
Oh my goodness, $GLMR —how does it run, with all those endless green candles on the 1D chart there, folks! 👀 The weekly RSI at 76.9 shows an unreal surge in momentum. The 1H timeframe is also bullish, with RSI at 63.5—there’s still room to push further. Price has broken through key MA lines, confirming a strong uptrend.
It’s not like it just flew out of nowhere! Moonbeam has just finished moving $GLMR to the Base and repositioning it as an AI protocol, triggering this historic pump. Money is pouring in relentlessly—24h volume is up over 356%! But keep a cool head: Binance added $GLMR to the “Monitoring Tag” back in August due to high volatility; liquidity is weaker, which may affect sentiment.
With this situation, I still lean toward the LONG side for $GLMR with confidence level 4/5. The price zone to watch is 0.0096 - 0.0098. Targets, if correct: 0.0105, then 0.0115. BUT if price breaks down below 0.0091, this view is COMPLETELY WRONG, okay folks! Don’t force it.
The biggest risk right now is that $GLMR has already surged +31.2% within 24h—the easiest profit might have already passed.
Oh my goodness, $GLMR —how does it run, with all those endless green candles on the 1D chart there, folks! 👀 The weekly RSI at 76.9 shows an unreal surge in momentum. The 1H timeframe is also bullish, with RSI at 63.5—there’s still room to push further. Price has broken through key MA lines, confirming a strong uptrend.
It’s not like it just flew out of nowhere! Moonbeam has just finished moving $GLMR to the Base and repositioning it as an AI protocol, triggering this historic pump. Money is pouring in relentlessly—24h volume is up over 356%! But keep a cool head: Binance added $GLMR to the “Monitoring Tag” back in August due to high volatility; liquidity is weaker, which may affect sentiment.
With this situation, I still lean toward the LONG side for $GLMR with confidence level 4/5. The price zone to watch is 0.0096 - 0.0098. Targets, if correct: 0.0105, then 0.0115. BUT if price breaks down below 0.0091, this view is COMPLETELY WRONG, okay folks! Don’t force it.
The biggest risk right now is that $GLMR has already surged +31.2% within 24h—the easiest profit might have already passed.
It’s not like it just flew out of nowhere! Moonbeam has just finished moving $GLMR to the Base and repositioning it as an AI protocol, triggering this historic pump. Money is pouring in relentlessly—24h volume is up over 356%! But keep a cool head: Binance added $GLMR to the “Monitoring Tag” back in August due to high volatility; liquidity is weaker, which may affect sentiment.
With this situation, I still lean toward the LONG side for $GLMR with confidence level 4/5. The price zone to watch is 0.0096 - 0.0098. Targets, if correct: 0.0105, then 0.0115. BUT if price breaks down below 0.0091, this view is COMPLETELY WRONG, okay folks! Don’t force it.
The biggest risk right now is that $GLMR has already surged +31.2% within 24h—the easiest profit might have already passed.
1
172
Log in to explore more content
Join global crypto users on Binance Square
⚡️ Get latest and useful information about crypto.
💬 Trusted by the world’s largest crypto exchange.
👍 Discover real insights from verified creators.
Email / Phone number
Trending Topics
SECHaltsCryptoETFReviewsAmidFundingLapse
11,812 views
192 Discussing
#SECHaltsCryptoETFReviewsAmidFundingLapse
SEC Halts Crypto ETF Reviews Amid Funding Lapse
The U.S. Securities and Exchange Commission (SEC) has reportedly paused certain cryptocurrency ETF review activities amid a government funding lapse.
This development has created uncertainty in the crypto market, particularly for investors and companies waiting for regulatory decisions on crypto-related exchange-traded funds (ETFs).
Impact on the Crypto Market
The delay could affect the approval timeline of pending crypto ETF applications. Investors are closely monitoring the situation as regulatory clarity remains an important factor in the growth of the digital asset industry.
Although the pause does not necessarily mean that crypto ETF applications will be rejected, it highlights how government funding disruptions can influence financial regulatory processes.
What Happens Next?
Market participants will be watching for updates on government funding and the SEC's ability to resume normal operations.
Crypto ETFs remain an important topic for institutional adoption, market development, and investor confidence.
Conclusion: The temporary halt highlights the importance of regulatory stability for the future of cryptocurrency investments.
#Crypto #Bitcoin #ETF #SEC #CryptoNews #Blockchain #Binance
King2112
·0 Likes
·115 views
ZcashETFPostsFirstWeeklyOutflow$93.6M
57,190 views
173 Discussing
GreekPoliceBustCryptoScamRingArrest17
174,782 views
1,212 Discussing