Binance Square
David Brightster
80 Posts

David Brightster

89 Following
63 Followers
61 Liked
Posts
·
--
🚨 China Is Quietly Changing Its Reserve Strategy — And Gold Is At The Center China has been steadily reducing its exposure to U.S. Treasuries while increasing its gold reserves. The latest Treasury data shows China’s holdings of U.S. government debt have fallen to their lowest level in years. At the same time, China has now increased its official gold reserves for 21 consecutive months. But this isn't just about buying gold. China is also building financial infrastructure that could strengthen the yuan’s role in global markets. 🇨🇳 In July 2026, Hong Kong began trial operations of a new gold clearing and settlement system, with connections to the Shanghai Gold Exchange. China is also working with BRICS countries on alternative payment and settlement infrastructure. The broader strategy appears clear: → Diversify away from excessive reliance on the U.S. dollar → Increase gold reserves → Strengthen the yuan → Build alternative payment infrastructure → Expand China’s role in global finance And China isn't alone. 🇰🇷 South Korea has announced gold purchases after 13 years. 🌎 Several major economies have been reassessing their reserve strategies. 🥇 Central banks around the world have continued accumulating gold. This doesn't mean the U.S. dollar is about to collapse. But it does show something important: The global financial system is gradually becoming more diversified. For decades, the dollar has dominated global reserves, trade and international finance. Now, countries are increasingly looking for alternatives. And gold appears to be one of the biggest beneficiaries. The important question isn't: “Will the dollar disappear tomorrow?” It's: “What happens if the world gradually becomes less dependent on it?” That is the trend worth watching. 👀 #bitcoin #GOLD #china #usd #crypto
🚨 China Is Quietly Changing Its Reserve Strategy — And Gold Is At The Center

China has been steadily reducing its exposure to U.S. Treasuries while increasing its gold reserves.

The latest Treasury data shows China’s holdings of U.S. government debt have fallen to their lowest level in years.

At the same time, China has now increased its official gold reserves for 21 consecutive months.

But this isn't just about buying gold.

China is also building financial infrastructure that could strengthen the yuan’s role in global markets.

🇨🇳 In July 2026, Hong Kong began trial operations of a new gold clearing and settlement system, with connections to the Shanghai Gold Exchange.

China is also working with BRICS countries on alternative payment and settlement infrastructure.

The broader strategy appears clear:

→ Diversify away from excessive reliance on the U.S. dollar
→ Increase gold reserves
→ Strengthen the yuan
→ Build alternative payment infrastructure
→ Expand China’s role in global finance

And China isn't alone.

🇰🇷 South Korea has announced gold purchases after 13 years.

🌎 Several major economies have been reassessing their reserve strategies.

🥇 Central banks around the world have continued accumulating gold.

This doesn't mean the U.S. dollar is about to collapse.

But it does show something important:

The global financial system is gradually becoming more diversified.

For decades, the dollar has dominated global reserves, trade and international finance.

Now, countries are increasingly looking for alternatives.

And gold appears to be one of the biggest beneficiaries.

The important question isn't:

“Will the dollar disappear tomorrow?”

It's:

“What happens if the world gradually becomes less dependent on it?”

That is the trend worth watching. 👀

#bitcoin #GOLD #china #usd #crypto
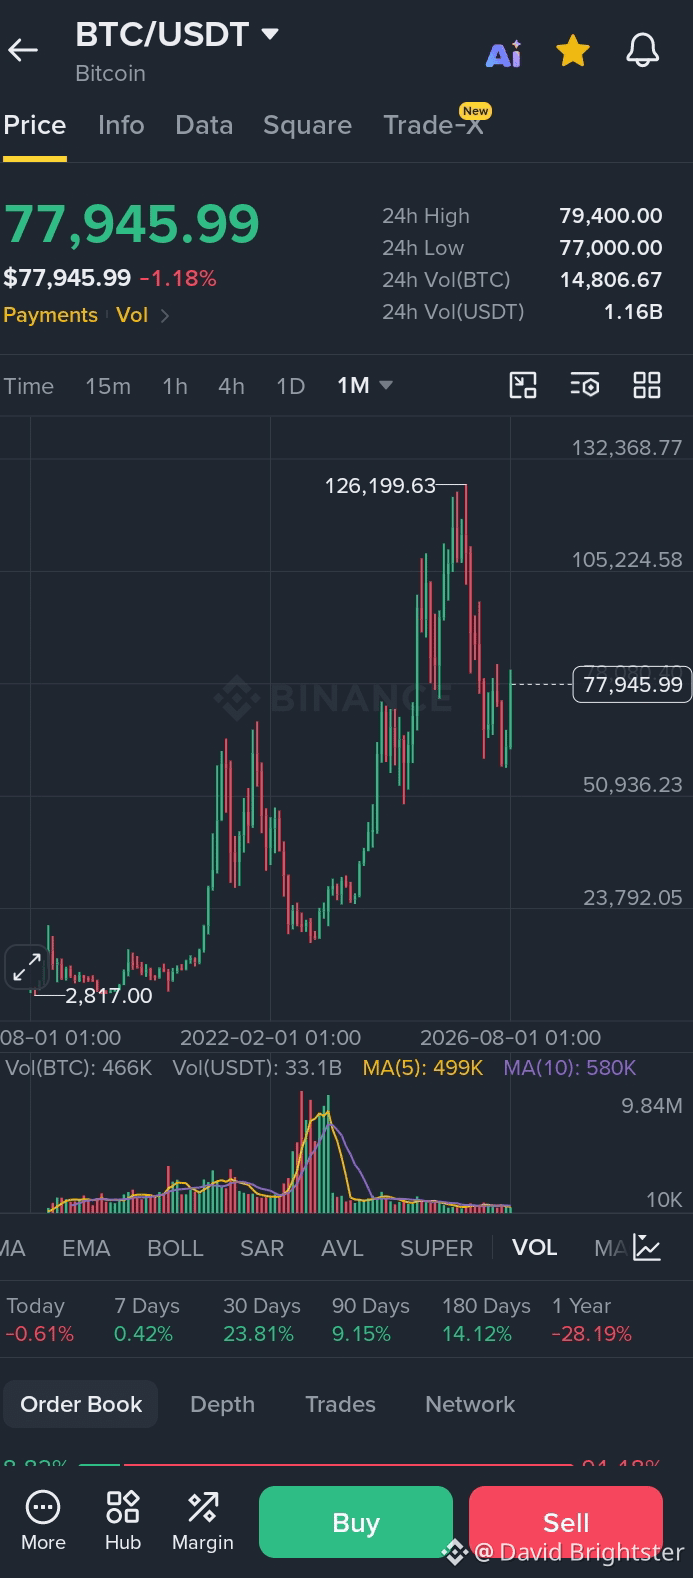
📊 My Analysis of the $BTC chart Current price: $77,946 The monthly structure shows: BTC made a major high around $126,200. It then had a strong correction, falling toward the $50,000–$55,000 region. Price has bounced strongly from that area and is now around $78K. However, BTC is still below the major $105K–$126K supply/resistance zone. August has been a strong recovery month, but BTC is currently struggling around $78K–$80K. 🔑 Important levels Level Importance $105K–$126K Major resistance / previous ATH zone $90K–$95K Next resistance if $80K breaks $80K–$82K Immediate breakout zone $75K–$77K Immediate support $70K–$72K Stronger support $50K–$55K Major HTF demand 🟢 Bullish scenario If BTC gets a monthly/weekly close above $80K–$82K, I would become significantly more bullish. Potential path: $80K → $90K–$95K → $105K → $120K+ A sustained move above $105K would be particularly important because it would put BTC back toward the previous ATH region. 🔴 Bearish scenario If BTC gets rejected around $80K and loses $75K, expect a deeper correction. The next areas I'd watch are: $72K → $68K–$70K → $60K–$62K A break below ~$70K would weaken the current recovery considerably. 🎯 My trading bias High-timeframe bias: cautiously bullish, but NOT confirmed bullish yet. I'd avoid blindly buying at $77.9K. The better setup would be: LONG: Wait for a convincing breakout/retest of $80K–$82K Target: $90K → $95K → $105K Invalidation: Sustained loss of ~$75K Or, if BTC rejects $80K: SHORT: Rejection + breakdown below $75K Targets: $72K → $68K–$70K. Recent market data also shows BTC's August recovery has been substantial, while macro uncertainty around the Fed is creating potential volatility. Important: Since this is a 1M chart Analysis, I would use the 4H/1H/15M to actually time the entry. The monthly chart tells us where BTC is likely going, while the lower timeframes tell us when to enter.
📊 My Analysis of the $BTC chart

Current price: $77,946

The monthly structure shows:

BTC made a major high around $126,200.

It then had a strong correction, falling toward the $50,000–$55,000 region.

Price has bounced strongly from that area and is now around $78K.

However, BTC is still below the major $105K–$126K supply/resistance zone.

August has been a strong recovery month, but BTC is currently struggling around $78K–$80K.

🔑 Important levels

Level Importance

$105K–$126K Major resistance / previous ATH zone
$90K–$95K Next resistance if $80K breaks
$80K–$82K Immediate breakout zone
$75K–$77K Immediate support
$70K–$72K Stronger support
$50K–$55K Major HTF demand

🟢 Bullish scenario

If BTC gets a monthly/weekly close above $80K–$82K, I would become significantly more bullish.

Potential path:

$80K → $90K–$95K → $105K → $120K+

A sustained move above $105K would be particularly important because it would put BTC back toward the previous ATH region.

🔴 Bearish scenario

If BTC gets rejected around $80K and loses $75K, expect a deeper correction.

The next areas I'd watch are:

$72K → $68K–$70K → $60K–$62K

A break below ~$70K would weaken the current recovery considerably.

🎯 My trading bias

High-timeframe bias: cautiously bullish, but NOT confirmed bullish yet.

I'd avoid blindly buying at $77.9K. The better setup would be:

LONG: Wait for a convincing breakout/retest of $80K–$82K
Target: $90K → $95K → $105K
Invalidation: Sustained loss of ~$75K

Or, if BTC rejects $80K:

SHORT: Rejection + breakdown below $75K
Targets: $72K → $68K–$70K.

Recent market data also shows BTC's August recovery has been substantial, while macro uncertainty around the Fed is creating potential volatility.

Important: Since this is a 1M chart Analysis, I would use the 4H/1H/15M to actually time the entry. The monthly chart tells us where BTC is likely going, while the lower timeframes tell us when to enter.
Top 10 Gainers you should trade. $HEMI $MANTRA $EDEN $PROM $TRUMP $HEI $CHIP $ENA $TST $HUMA Bonus coin $BMT I will drop some of my analysis on this coins.
Top 10 Gainers you should trade.

$HEMI
$MANTRA
$EDEN
$PROM
$TRUMP
$HEI
$CHIP
$ENA
$TST
$HUMA
Bonus coin $BMT

I will drop some of my analysis on this coins.
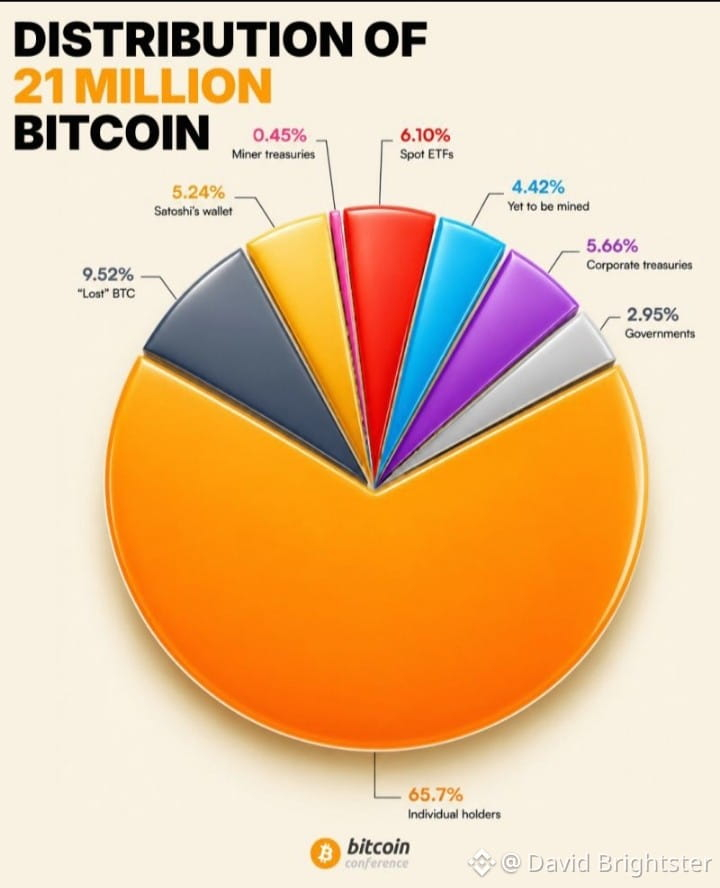
This chart breaks down the total supply distribution of all 21 million Bitcoin. Individual Retail Holders (65.7%): The clear majority remains in the hands of individual users, highlighting Bitcoin's decentralized foundation. Lost Supply & Early Wallets (14.76%): Roughly 9.52% is estimated to be permanently lost or inaccessible, while Satoshi Nakamoto’s early untouched wallets hold 5.24%. Institutional & Corporate Funds (11.76%): Institutional exposure is climbing, split between Spot ETFs (6.10%) and corporate treasuries (5.66%). Governments & Miners (3.4%): Global governments control 2.95% (primarily through asset seizures), while miner treasuries hold 0.45%. Unmined Supply (4.42%): Only a tiny sliver of the 21 million hard cap is left to be issued via block rewards. $BTC 🚀
This chart breaks down the total supply distribution of all 21 million Bitcoin.

Individual Retail Holders (65.7%): The clear majority remains in the hands of individual users, highlighting Bitcoin's decentralized foundation.

Lost Supply & Early Wallets (14.76%): Roughly 9.52% is estimated to be permanently lost or inaccessible, while Satoshi Nakamoto’s early untouched wallets hold 5.24%.

Institutional & Corporate Funds (11.76%): Institutional exposure is climbing, split between Spot ETFs (6.10%) and corporate treasuries (5.66%).

Governments & Miners (3.4%): Global governments control 2.95% (primarily through asset seizures), while miner treasuries hold 0.45%.

Unmined Supply (4.42%): Only a tiny sliver of the 21 million hard cap is left to be issued via block rewards.

$BTC 🚀
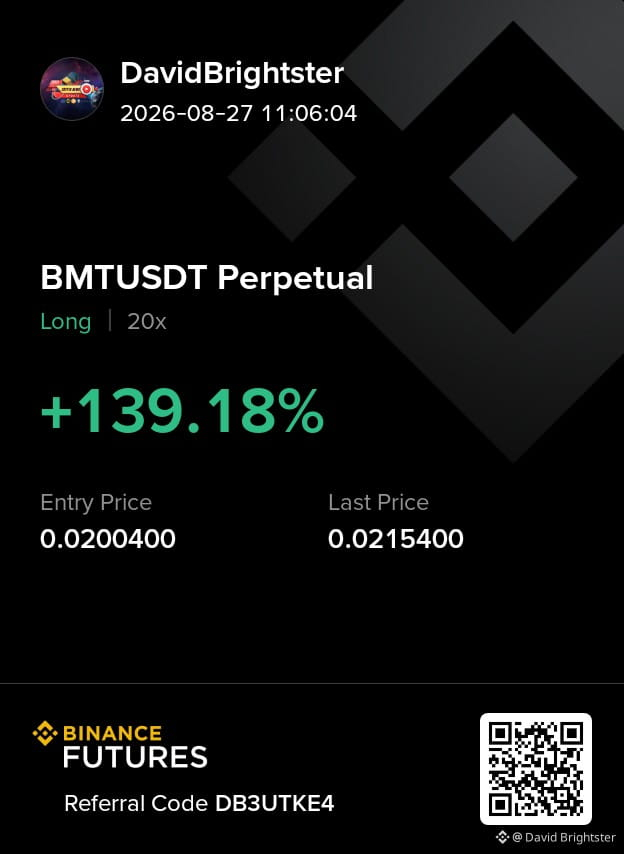
Though i got stopped out, i re-entered at $0.02004 it's going as supposed. my conviction was because of the quick rejection at 0.01959
Though i got stopped out, i re-entered at $0.02004 it's going as supposed.

my conviction was because of the quick rejection at 0.01959
David Brightster
·
--

$BMT — Trading Summary

Overall bias: 🟢 Bullish

Best Trading Idea — Long the Pullback

Don't buy at $0.02467 immediately.

Wait for price to pull back into:

Entry zone: $0.0228 – $0.0235

Then wait for a 5M bullish reversal + break of the recent 5M lower high before entering.

Targets:

TP1: $0.0256

TP2: $0.0278–$0.0280

TP3: $0.0300+

Stop-loss: around $0.0218

🚀 Alternative — Breakout Long

If BMT doesn't pull back:

Wait for a confirmed break above $0.0279, then a 5M retest that holds.

Entry: ~$0.0280–$0.0285

SL: ~$0.0267–$0.0270

TP: $0.0300 → $0.0320 → $0.0350

🔴 Short Setup

Only consider a short if $0.0227 breaks decisively and the retest fails.

Potential target: $0.0200, then ~$0.0190.

My choice: 🟢 Wait for $0.0228–$0.0235 and LONG after 5M confirmation.

Don't chase the current $0.02467 price after a ~60% move. The trend is bullish, but volatility is extremely high.
$SOMI — Trading Setup The 15m chart shows a strong breakout with a huge volume spike, but price immediately wicked from 0.1208 → 0.112–0.113, showing heavy rejection. The broader recent data also shows SOMI has been volatile around the $0.10–$0.11 area. My preferred idea: 🟢 LONG on confirmation, not at market. Entry: 0.1110 – 0.1125 after a successful retest SL: 0.1085 TP1: 0.1158 TP2: 0.1185 TP3: 0.1208 Invalidation: 15m candle closes below 0.1085 Why: the breakout came with exceptionally high volume, and price is holding above the breakout area. But the 0.1208 wick means chasing at 0.1133 has poor risk/reward. If 0.1085 breaks: abandon the long idea; a short toward 0.1079 becomes more attractive. NFA. {future}(SOMIUSDT)
$SOMI — Trading Setup
The 15m chart shows a strong breakout with a huge volume spike, but price immediately wicked from 0.1208 → 0.112–0.113, showing heavy rejection. The broader recent data also shows SOMI has been volatile around the $0.10–$0.11 area.

My preferred idea: 🟢 LONG on confirmation, not at market.
Entry: 0.1110 – 0.1125 after a successful retest
SL: 0.1085
TP1: 0.1158
TP2: 0.1185
TP3: 0.1208

Invalidation: 15m candle closes below 0.1085
Why: the breakout came with exceptionally high volume, and price is holding above the breakout area. But the 0.1208 wick means chasing at 0.1133 has poor risk/reward.
If 0.1085 breaks: abandon the long idea; a short toward 0.1079 becomes more attractive.

NFA.
if you took this trade you should be on massive gain 🚀
David Brightster
·
--
if you want to trade ONG/USDT looking at the 1D chart has a very volatile setup, so I would not chase the current green candle.
$ONG has recently gone from roughly $0.04 → $0.195, then sharply retraced and is now around $0.098. The huge upper wick shows strong profit-taking/selling pressure. Current market data also confirms unusually high volatility and substantial volume.

🎯 My preferred trade Setup: WAIT FOR A PULLBACK
Entry zone: $0.082 – $0.090
I'd prefer to see price come back into this region and hold it as support before entering.
Stop loss: around $0.075
Targets:
TP1: $0.105 — previous immediate resistance
TP2: $0.120 – $0.125
TP3: $0.135
TP4: $0.165 if momentum becomes extremely strong
A possible setup around $0.087 entry / $0.075 SL / $0.135 TP gives roughly 4:1 reward-to-risk.

🚀 Alternative: breakout trade
If ONG doesn't pull back and instead breaks $0.105–$0.106 with strong volume and a daily candle closes above it, I'd consider a breakout entry around $0.106–$0.110.
Then:
SL: ~$0.096
TP: $0.120 → $0.135 → $0.165
Don't buy simply because it touches $0.105; I want confirmation + volume.

⚠️ Why I'm cautious
The chart has already made an extraordinary move. The 1D Chart shows a high around $0.195, while the current price is ~$0.098 meaning the market has already rejected prices almost 2× higher.
Also, ONG's tokenomics have recently changed: Ontology says the supply was capped at 800M, with 200M ONG burned and a permanent liquidity-lock mechanism introduced. That's fundamentally supportive, but it doesn't prevent short-term speculation and violent retracements.

So my ranking would be:
🟢 Best: Wait for $0.082–0.090 support and enter on confirmation.

🟡 Second: Buy confirmed breakout above $0.105–0.110.

🔴 Worst: Market-buy at $0.098 after a +34% day.
The fundamental case (for Bitcoin) is as good as ever" Bill Miller IV educates CNBC: "If you look at budget deficit this year in the United States, at 1.8 TRILLION, the entire market cap of Bitcoin is smaller than the dollars that have to be invented from just this year's behavior alone."
The fundamental case (for Bitcoin) is as good as ever"

Bill Miller IV educates CNBC:

"If you look at budget deficit this year in the United States, at 1.8 TRILLION, the entire market cap of Bitcoin is smaller than the dollars that have to be invented from just this year's behavior alone."
$PORTAL — Trading idea 💡 🎯 Best setup: SHORT the rejection Entry: 0.01720 – 0.01750 Stop-loss: 0.01785 – 0.01805 TP1: 0.01620 TP2: 0.01555 TP3: 0.01470 Why: 0.01730 is acting as immediate resistance from the 15m chart. Price is making lower highs after the 0.02220 spike. Volume has dried up considerably after the pump. A rejection around 0.0172–0.0175 would give a much better risk/reward than shorting at 0.01647. The 0.0155 area is the next important support visible on your chart. 🚨 Bullish alternative If PORTAL breaks and closes above 0.0175 with strong volume, don't take the short. Wait for a retest of 0.0173–0.0175 and consider: LONG: 0.0174–0.0176 SL: 0.0169 TP: 0.0185 → 0.0191 → 0.0208 The recent market data also shows PORTAL has been extremely volatile, so position sizing should be small. Keep leverage low because this coin can move several percent very quickly. {future}(PORTALUSDT)
$PORTAL — Trading idea 💡

🎯 Best setup: SHORT the rejection

Entry: 0.01720 – 0.01750
Stop-loss: 0.01785 – 0.01805
TP1: 0.01620
TP2: 0.01555
TP3: 0.01470
Why:
0.01730 is acting as immediate resistance from the 15m chart.
Price is making lower highs after the 0.02220 spike.
Volume has dried up considerably after the pump.
A rejection around 0.0172–0.0175 would give a much better risk/reward than shorting at 0.01647.
The 0.0155 area is the next important support visible on your chart.

🚨 Bullish alternative
If PORTAL breaks and closes above 0.0175 with strong volume, don't take the short.
Wait for a retest of 0.0173–0.0175 and consider:

LONG: 0.0174–0.0176
SL: 0.0169
TP: 0.0185 → 0.0191 → 0.0208
The recent market data also shows PORTAL has been extremely volatile, so position sizing should be small.

Keep leverage low because this coin can move several percent very quickly.
🟢 $GIGGLE — Trade Idea Bias: LONG Entry: $35.20–$35.70 on pullback SL: $34.70 TP1: $36.30 TP2: $37.50 TP3: $39.00 Alternative: If price breaks and closes above $36.50, wait for a retest and then consider the long. Invalidation: 15m close below $34.85. 👉 Best play: buy the pullback, don't chase $36+ {future}(GIGGLEUSDT)
🟢 $GIGGLE — Trade Idea

Bias: LONG
Entry: $35.20–$35.70 on pullback
SL: $34.70
TP1: $36.30
TP2: $37.50
TP3: $39.00
Alternative: If price breaks and closes above $36.50, wait for a retest and then consider the long.
Invalidation: 15m close below $34.85.
👉 Best play: buy the pullback, don't chase $36+
{future}(BMTUSDT) $BMT — Trading Summary Overall bias: 🟢 Bullish Best Trading Idea — Long the Pullback Don't buy at $0.02467 immediately. Wait for price to pull back into: Entry zone: $0.0228 – $0.0235 Then wait for a 5M bullish reversal + break of the recent 5M lower high before entering. Targets: TP1: $0.0256 TP2: $0.0278–$0.0280 TP3: $0.0300+ Stop-loss: around $0.0218 🚀 Alternative — Breakout Long If BMT doesn't pull back: Wait for a confirmed break above $0.0279, then a 5M retest that holds. Entry: ~$0.0280–$0.0285 SL: ~$0.0267–$0.0270 TP: $0.0300 → $0.0320 → $0.0350 🔴 Short Setup Only consider a short if $0.0227 breaks decisively and the retest fails. Potential target: $0.0200, then ~$0.0190. My choice: 🟢 Wait for $0.0228–$0.0235 and LONG after 5M confirmation. Don't chase the current $0.02467 price after a ~60% move. The trend is bullish, but volatility is extremely high.
$BMT — Trading Summary

Overall bias: 🟢 Bullish

Best Trading Idea — Long the Pullback

Don't buy at $0.02467 immediately.

Wait for price to pull back into:

Entry zone: $0.0228 – $0.0235

Then wait for a 5M bullish reversal + break of the recent 5M lower high before entering.

Targets:

TP1: $0.0256

TP2: $0.0278–$0.0280

TP3: $0.0300+

Stop-loss: around $0.0218

🚀 Alternative — Breakout Long

If BMT doesn't pull back:

Wait for a confirmed break above $0.0279, then a 5M retest that holds.

Entry: ~$0.0280–$0.0285

SL: ~$0.0267–$0.0270

TP: $0.0300 → $0.0320 → $0.0350

🔴 Short Setup

Only consider a short if $0.0227 breaks decisively and the retest fails.

Potential target: $0.0200, then ~$0.0190.

My choice: 🟢 Wait for $0.0228–$0.0235 and LONG after 5M confirmation.

Don't chase the current $0.02467 price after a ~60% move. The trend is bullish, but volatility is extremely high.
David Brightster
·
--
My Trade idea on $BMT

The main catalyst behind $BMT surge appears to be the recent Upbit listing, amplified heavily by BMT's relatively small market cap and a huge increase in trading activity.

🎯 MY BEST SETUPs

🟢 Setup 1 — BUY THE PULLBACK
This is my preferred trade.
I would NOT buy at $0.02467 immediately.
Instead, wait for BMT to pull back into approximately:
Entry zone:
$0.0228 – $0.0235

Because that's around the previous consolidation/breakout area visible on your chart.
Then go to 5M.
I want to see:
Price enters the $0.0228–$0.0235 zone.
Sellers push price lower.
Price stops making lower lows.
5M creates a bullish reversal.
Price breaks the most recent 5M lower high.
Preferably volume increases on the breakout.
Enter on the confirmation/retest.
Long/Buy
Entry: $0.0232
Stop: ~$0.0218
TP1: $0.0256
TP2: $0.0278–$0.0280
TP3: $0.0300+
Approximate risk/reward from $0.0232 with a $0.0218 stop:
TP1 ≈ 1.7R
TP2 ≈ 3.3R
TP3 ≈ 4.9R
That's considerably better than chasing $0.02467.
🚀 Setup #2 — BREAKOUT LONG
There is another setup I really like.
Watch:
$0.0279
That's your major recent high.
If BMT breaks:
$0.0279
don't immediately market-buy the first wick.
I want:
5M close above $0.0279 → pullback/retest → bullish reaction
Then:
Entry:
$0.0280–$0.0285
Stop:
Approximately $0.0267–$0.0270
Targets:
$0.0300
$0.0320
$0.0350
This is the momentum setup.
🔴 When I would consider a SHORT
I wouldn't short BMT simply because the 4H RSI is 80.
That's a common mistake.
I'd only become interested in a short if the bullish structure actually breaks.
The critical area is:
$0.0227–$0.0228
If we get:
5M/15M close below $0.0227 → retest $0.0227 from underneath → rejection
then a short becomes interesting.
Possible targets:
$0.0200
then potentially:
$0.0188–$0.0190
But because the 1D/4H/1H are currently bullish, I'd treat this as a countertrend scalp, not my primary position.

My Trade idea on $BMT The main catalyst behind $BMT surge appears to be the recent Upbit listing, amplified heavily by BMT's relatively small market cap and a huge increase in trading activity. 🎯 MY BEST SETUPs 🟢 Setup 1 — BUY THE PULLBACK This is my preferred trade. I would NOT buy at $0.02467 immediately. Instead, wait for BMT to pull back into approximately: Entry zone: $0.0228 – $0.0235 Because that's around the previous consolidation/breakout area visible on your chart. Then go to 5M. I want to see: Price enters the $0.0228–$0.0235 zone. Sellers push price lower. Price stops making lower lows. 5M creates a bullish reversal. Price breaks the most recent 5M lower high. Preferably volume increases on the breakout. Enter on the confirmation/retest. Long/Buy Entry: $0.0232 Stop: ~$0.0218 TP1: $0.0256 TP2: $0.0278–$0.0280 TP3: $0.0300+ Approximate risk/reward from $0.0232 with a $0.0218 stop: TP1 ≈ 1.7R TP2 ≈ 3.3R TP3 ≈ 4.9R That's considerably better than chasing $0.02467. 🚀 Setup #2 — BREAKOUT LONG There is another setup I really like. Watch: $0.0279 That's your major recent high. If BMT breaks: $0.0279 don't immediately market-buy the first wick. I want: 5M close above $0.0279 → pullback/retest → bullish reaction Then: Entry: $0.0280–$0.0285 Stop: Approximately $0.0267–$0.0270 Targets: $0.0300 $0.0320 $0.0350 This is the momentum setup. 🔴 When I would consider a SHORT I wouldn't short BMT simply because the 4H RSI is 80. That's a common mistake. I'd only become interested in a short if the bullish structure actually breaks. The critical area is: $0.0227–$0.0228 If we get: 5M/15M close below $0.0227 → retest $0.0227 from underneath → rejection then a short becomes interesting. Possible targets: $0.0200 then potentially: $0.0188–$0.0190 But because the 1D/4H/1H are currently bullish, I'd treat this as a countertrend scalp, not my primary position. {future}(BMTUSDT)
My Trade idea on $BMT

The main catalyst behind $BMT surge appears to be the recent Upbit listing, amplified heavily by BMT's relatively small market cap and a huge increase in trading activity.

🎯 MY BEST SETUPs

🟢 Setup 1 — BUY THE PULLBACK
This is my preferred trade.
I would NOT buy at $0.02467 immediately.
Instead, wait for BMT to pull back into approximately:
Entry zone:
$0.0228 – $0.0235

Because that's around the previous consolidation/breakout area visible on your chart.
Then go to 5M.
I want to see:
Price enters the $0.0228–$0.0235 zone.
Sellers push price lower.
Price stops making lower lows.
5M creates a bullish reversal.
Price breaks the most recent 5M lower high.
Preferably volume increases on the breakout.
Enter on the confirmation/retest.
Long/Buy
Entry: $0.0232
Stop: ~$0.0218
TP1: $0.0256
TP2: $0.0278–$0.0280
TP3: $0.0300+
Approximate risk/reward from $0.0232 with a $0.0218 stop:
TP1 ≈ 1.7R
TP2 ≈ 3.3R
TP3 ≈ 4.9R
That's considerably better than chasing $0.02467.
🚀 Setup #2 — BREAKOUT LONG
There is another setup I really like.
Watch:
$0.0279
That's your major recent high.
If BMT breaks:
$0.0279
don't immediately market-buy the first wick.
I want:
5M close above $0.0279 → pullback/retest → bullish reaction
Then:
Entry:
$0.0280–$0.0285
Stop:
Approximately $0.0267–$0.0270
Targets:
$0.0300
$0.0320
$0.0350
This is the momentum setup.
🔴 When I would consider a SHORT
I wouldn't short BMT simply because the 4H RSI is 80.
That's a common mistake.
I'd only become interested in a short if the bullish structure actually breaks.
The critical area is:
$0.0227–$0.0228
If we get:
5M/15M close below $0.0227 → retest $0.0227 from underneath → rejection
then a short becomes interesting.
Possible targets:
$0.0200
then potentially:
$0.0188–$0.0190
But because the 1D/4H/1H are currently bullish, I'd treat this as a countertrend scalp, not my primary position.
Analysing $AMP 📊 What I See in the 1D chart. Major low: ~$0.000355 Price broke strongly out of the ~$0.00040 area. Breakout volume is huge — that's a positive confirmation. Price reached $0.000629, then was rejected heavily. It has recovered to $0.000508, which is encouraging. The key question now is whether AMP can reclaim $0.000522–$0.000530. The broader AMP picture is still speculative: AMP is a collateral token associated with Flexa, and its current market structure remains far below its historical peak. 🎯 My preferred trade Setup. 🟢 Strategy 1 — Buy the pullback This is the one I'd prefer. Entry: 0.000455 – 0.000480 Ideally, price pulls back toward the previous breakout area and holds it. Stop loss: 0.000425 – 0.000435 Take profits: Target Price TP1 0.000522 TP2 0.000580 TP3 0.000625–0.000630 TP4 0.000700+ if momentum explodes For example, an entry around 0.000470 with SL 0.000430 gives roughly: Risk: 8.5% TP1: +11% TP2: +23% TP3: +34% That's much better than buying blindly at $0.000508. 🚀 Strategy 2 — Breakout If AMP doesn't pull back and instead breaks $0.000522–$0.000530 with strong volume: Entry: ~$0.000525–0.000535 after confirmation/retest SL: ~$0.000485 TP1: $0.000580 TP2: $0.000630 TP3: $0.000700+ I would not enter just because price briefly touches $0.000522. I want a convincing breakout and preferably a retest. 🔴 What would make me bearish? If AMP loses $0.000455 and can't reclaim it, the breakout is becoming questionable. Then I'd watch: $0.000415 → $0.000400 → $0.000355 A fall back below ~$0.00040 would significantly weaken the current bullish setup. For a new entry, I'd wait for AMP around $0.00046–$0.00048 rather than buying $0.000508. And if AMP breaks $0.00063, that's when I'd start looking for a much larger continuation move. AMP's recent market data also shows substantial volatility, so position sizing matters more than usual. {spot}(AMPUSDT)
Analysing $AMP

📊 What I See in the 1D chart.

Major low: ~$0.000355

Price broke strongly out of the ~$0.00040 area.

Breakout volume is huge — that's a positive confirmation.

Price reached $0.000629, then was rejected heavily.

It has recovered to $0.000508, which is encouraging.

The key question now is whether AMP can reclaim $0.000522–$0.000530.

The broader AMP picture is still speculative: AMP is a collateral token associated with Flexa, and its current market structure remains far below its historical peak.

🎯 My preferred trade Setup.

🟢 Strategy 1 — Buy the pullback

This is the one I'd prefer.

Entry: 0.000455 – 0.000480

Ideally, price pulls back toward the previous breakout area and holds it.

Stop loss: 0.000425 – 0.000435

Take profits:

Target Price

TP1 0.000522
TP2 0.000580
TP3 0.000625–0.000630
TP4 0.000700+ if momentum explodes

For example, an entry around 0.000470 with SL 0.000430 gives roughly:

Risk: 8.5%

TP1: +11%

TP2: +23%

TP3: +34%

That's much better than buying blindly at $0.000508.

🚀 Strategy 2 — Breakout

If AMP doesn't pull back and instead breaks $0.000522–$0.000530 with strong volume:

Entry: ~$0.000525–0.000535 after confirmation/retest
SL: ~$0.000485
TP1: $0.000580
TP2: $0.000630
TP3: $0.000700+

I would not enter just because price briefly touches $0.000522. I want a convincing breakout and preferably a retest.

🔴 What would make me bearish?

If AMP loses $0.000455 and can't reclaim it, the breakout is becoming questionable.

Then I'd watch:

$0.000415 → $0.000400 → $0.000355

A fall back below ~$0.00040 would significantly weaken the current bullish setup.

For a new entry, I'd wait for AMP around $0.00046–$0.00048 rather than buying $0.000508.

And if AMP breaks $0.00063, that's when I'd start looking for a much larger continuation move.

AMP's recent market data also shows substantial volatility, so position sizing matters more than usual.
if you want to trade ONG/USDT looking at the 1D chart has a very volatile setup, so I would not chase the current green candle. $ONG has recently gone from roughly $0.04 → $0.195, then sharply retraced and is now around $0.098. The huge upper wick shows strong profit-taking/selling pressure. Current market data also confirms unusually high volatility and substantial volume. 🎯 My preferred trade Setup: WAIT FOR A PULLBACK Entry zone: $0.082 – $0.090 I'd prefer to see price come back into this region and hold it as support before entering. Stop loss: around $0.075 Targets: TP1: $0.105 — previous immediate resistance TP2: $0.120 – $0.125 TP3: $0.135 TP4: $0.165 if momentum becomes extremely strong A possible setup around $0.087 entry / $0.075 SL / $0.135 TP gives roughly 4:1 reward-to-risk. 🚀 Alternative: breakout trade If ONG doesn't pull back and instead breaks $0.105–$0.106 with strong volume and a daily candle closes above it, I'd consider a breakout entry around $0.106–$0.110. Then: SL: ~$0.096 TP: $0.120 → $0.135 → $0.165 Don't buy simply because it touches $0.105; I want confirmation + volume. ⚠️ Why I'm cautious The chart has already made an extraordinary move. The 1D Chart shows a high around $0.195, while the current price is ~$0.098 meaning the market has already rejected prices almost 2× higher. Also, ONG's tokenomics have recently changed: Ontology says the supply was capped at 800M, with 200M ONG burned and a permanent liquidity-lock mechanism introduced. That's fundamentally supportive, but it doesn't prevent short-term speculation and violent retracements. So my ranking would be: 🟢 Best: Wait for $0.082–0.090 support and enter on confirmation. 🟡 Second: Buy confirmed breakout above $0.105–0.110. 🔴 Worst: Market-buy at $0.098 after a +34% day. {future}(ONGUSDT)
if you want to trade ONG/USDT looking at the 1D chart has a very volatile setup, so I would not chase the current green candle.
$ONG has recently gone from roughly $0.04 → $0.195, then sharply retraced and is now around $0.098. The huge upper wick shows strong profit-taking/selling pressure. Current market data also confirms unusually high volatility and substantial volume.

🎯 My preferred trade Setup: WAIT FOR A PULLBACK
Entry zone: $0.082 – $0.090
I'd prefer to see price come back into this region and hold it as support before entering.
Stop loss: around $0.075
Targets:
TP1: $0.105 — previous immediate resistance
TP2: $0.120 – $0.125
TP3: $0.135
TP4: $0.165 if momentum becomes extremely strong
A possible setup around $0.087 entry / $0.075 SL / $0.135 TP gives roughly 4:1 reward-to-risk.

🚀 Alternative: breakout trade
If ONG doesn't pull back and instead breaks $0.105–$0.106 with strong volume and a daily candle closes above it, I'd consider a breakout entry around $0.106–$0.110.
Then:
SL: ~$0.096
TP: $0.120 → $0.135 → $0.165
Don't buy simply because it touches $0.105; I want confirmation + volume.

⚠️ Why I'm cautious
The chart has already made an extraordinary move. The 1D Chart shows a high around $0.195, while the current price is ~$0.098 meaning the market has already rejected prices almost 2× higher.
Also, ONG's tokenomics have recently changed: Ontology says the supply was capped at 800M, with 200M ONG burned and a permanent liquidity-lock mechanism introduced. That's fundamentally supportive, but it doesn't prevent short-term speculation and violent retracements.

So my ranking would be:
🟢 Best: Wait for $0.082–0.090 support and enter on confirmation.

🟡 Second: Buy confirmed breakout above $0.105–0.110.

🔴 Worst: Market-buy at $0.098 after a +34% day.
·
--
Bullish
This Exactly what's happening in the market presently, and remember Bitcoin 4yrs Cycle is about to break, The Crypto market will now be moved by global macroeconomic policies, institutional rebalancing, and operational utility no more retail driven speculative cycles and Liquidity will come from institutional financial channels and automated, programmatic money flows all this will happen once Clarity Act is passed.
Panda Traders
·
--
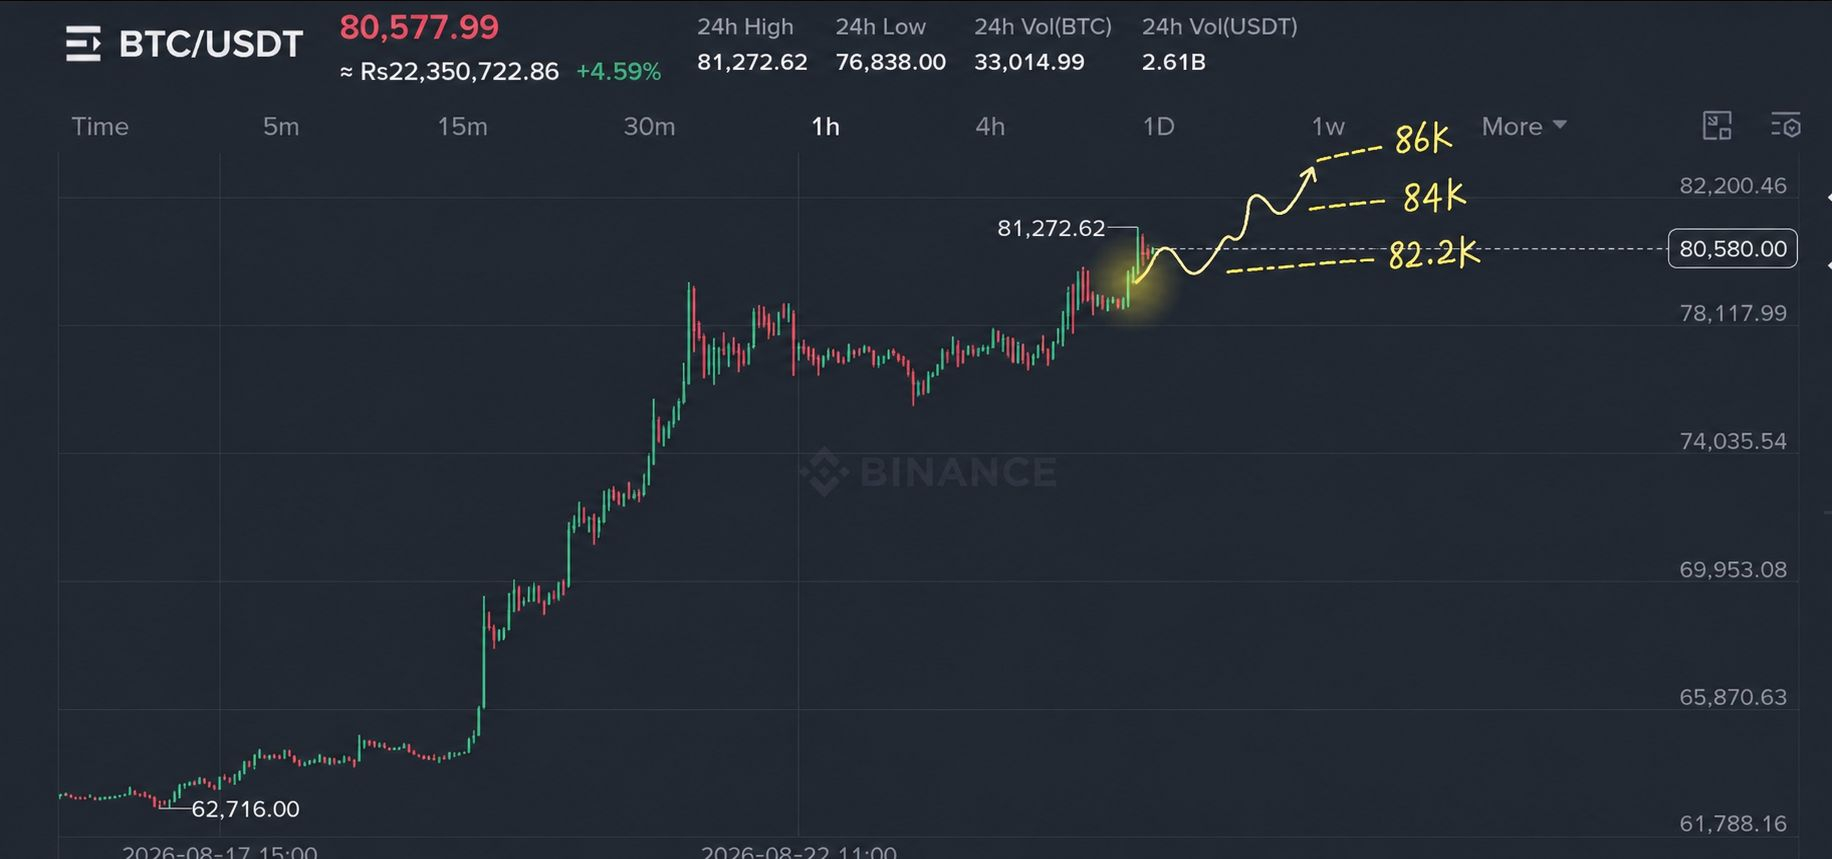
🚨 BITCOIN UPDATE — BTC MAY STAY STRONG UNTIL AROUND SEPTEMBER 15
Everybody is wondering why Bitcoin suddenly pumped so hard.
This move is not only because of hype. There are two major catalysts supporting the current Bitcoin rally, and both are happening very close to each other.
Let me explain them in simple words.
1️⃣ The first catalyst is the CLARITY Act
The CLARITY Act is again becoming an important topic in the U.S., and the market is watching its progress very closely.
One important date being discussed is September 15.
Why does this matter for Bitcoin?
Because markets usually start moving before an important event actually happens. Traders buy when they expect good news, and when the real news finally comes, some of them start taking profit.
This is what we call:
“Buy the rumor, sell the news.”
So there is a good chance that Bitcoin will continue to pump as we move closer to September 15.
But remember one thing.
If BTC keeps pumping before this date, we should also be ready for more volatility or even a correction once the news is actually out.
That does not mean the bull move is finished. It simply means the market may need to cool down after a strong rally.
2️⃣ The second catalyst is the U.S. Treasury market
The second reason is coming from the U.S. bond market.
U.S. Treasury yields have been very high, and there has been a lot of pressure in the bond market.
When investors start worrying about government debt, interest rates and the value of money, assets like gold and Bitcoin usually get more attention.
Bitcoin is seen by many investors as an asset that is outside the normal banking system, so during this type of uncertainty, demand can increase.
Another date to keep in mind is around September 9, because there may be more activity in the Treasury market around that time.
So now we have two important dates sitting very close together:
📅 September 9 — Treasury activity
📅 September 15 — CLARITY Act related expectations
This is why Bitcoin may continue to stay strong into the first half of September.

$BTC
·
--
Bullish
Best 3 coins to Accumulate based on Supply. $LPT with Total Supply of Approx. 50m $DN with Total Supply of 100m $BERA with total supply of 500m+ This coins are cheap to Accumulate presenty. NFA...DYOR #CryptoTrends2024
Best 3 coins to Accumulate based on Supply.

$LPT with Total Supply of Approx. 50m
$DN with Total Supply of 100m
$BERA with total supply of 500m+

This coins are cheap to Accumulate presenty.

NFA...DYOR
#CryptoTrends2024
LATEST: 🇺🇸 CFTC Chair Michael Selig says he has directed staff to explore new crypto market rules, warning the agency will move ahead on its own if Congress fails to pass the CLARITY Act.
JUST IN: Scammers are sending fake IRS letters with QR codes designed to steal crypto wallet credentials and exchange logins.
·
--
Bullish
LATEST: 🇺🇸 Former NY Governor Andrew Cuomo warns if the CLARITY Act fails, "the next two years will be horrendous" as regulators fill the void while a Democratic Congress questions them.#TrumpPressesCongressToPassClarityAct
·
--
Bullish
List of Possible 100x Coins. ‌Somnia $SOMI ‌Berachain $BERA ‌Aptos $APT ‌Immutable $IMX ‌Lido $LDO ‌Pi Network $PI ‌Drift Protocol $DRIFT ‌Dogecoin $DOGE ‌Zora $ZORA ‌Grass $GRASS ‌Celestia $TIA ‌Aster $ASTER ‌Caldera $ERA ‌Succinct Network $Prove ‌WalletConnect Network $WCT ‌Plasma Network $XPL ‌SUI $SUI ‌IO Network $IO ‌DeepNode $DN ‌Lagrange $LA ‌Redstone $RED ‌SEI $SEI
List of Possible 100x Coins.

‌Somnia $SOMI
‌Berachain $BERA
‌Aptos $APT
‌Immutable $IMX
‌Lido $LDO
‌Pi Network $PI
‌Drift Protocol $DRIFT
‌Dogecoin $DOGE
‌Zora $ZORA
‌Grass $GRASS
‌Celestia $TIA
‌Aster $ASTER
‌Caldera $ERA
‌Succinct Network $Prove
‌WalletConnect Network $WCT
‌Plasma Network $XPL
‌SUI $SUI
‌IO Network $IO
‌DeepNode $DN
‌Lagrange $LA
‌Redstone $RED
‌SEI $SEI
Log in to explore more content
Join global crypto users on Binance Square
⚡️ Get latest and useful information about crypto.
💬 Trusted by the world’s largest crypto exchange.
👍 Discover real insights from verified creators.
Email / Phone number
Sitemap
Cookie Preferences
Platform T&Cs