

Global_Crypto_Research
2.5k Posts

Global_Crypto_Research
Report
Block User
🌍 GlobalCryptoResearch | Daily Crypto Analysis | Spot & Futures Trade Setups | Technical Analysis | Market Insights | Risk Management | DYOR
147 Following
258 Followers
1.2K+ Liked
Posts
All
Quotes
Videos
Live
Guys 🔥 $OP
{future}(OPUSDT)
Rallies Over 24% #ASICHasReceivedNoPredictionMarketApplications Can Buyers Hold Above $0.1221?
$OP is trading near $0.1213, up 24.54% in 24 hours, after climbing from the $0.0969 low. Buyers have pushed price close to the $0.1221 resistance, making this a crucial level for the next move. 📊
A confirmed breakout above $0.1221 could open the way toward $0.1254. If momentum fades, the $0.1180 area is worth monitoring, followed by support near $0.1093 and $0.1042. 🤝💎
RSI(6) is around 94.5, showing extremely overheated short-term momentum. After such a sharp rally, profit-taking or a pullback is possible. Watch for a confirmed candle close and a successful retest before assuming the breakout will continue. 🚀
Guys 🔥 $OP
Rallies Over 24% #ASICHasReceivedNoPredictionMarketApplications Can Buyers Hold Above $0.1221?
$OP is trading near $0.1213, up 24.54% in 24 hours, after climbing from the $0.0969 low. Buyers have pushed price close to the $0.1221 resistance, making this a crucial level for the next move. 📊
A confirmed breakout above $0.1221 could open the way toward $0.1254. If momentum fades, the $0.1180 area is worth monitoring, followed by support near $0.1093 and $0.1042. 🤝💎
RSI(6) is around 94.5, showing extremely overheated short-term momentum. After such a sharp rally, profit-taking or a pullback is possible. Watch for a confirmed candle close and a successful retest before assuming the breakout will continue. 🚀
Rallies Over 24% #ASICHasReceivedNoPredictionMarketApplications Can Buyers Hold Above $0.1221?
$OP is trading near $0.1213, up 24.54% in 24 hours, after climbing from the $0.0969 low. Buyers have pushed price close to the $0.1221 resistance, making this a crucial level for the next move. 📊
A confirmed breakout above $0.1221 could open the way toward $0.1254. If momentum fades, the $0.1180 area is worth monitoring, followed by support near $0.1093 and $0.1042. 🤝💎
RSI(6) is around 94.5, showing extremely overheated short-term momentum. After such a sharp rally, profit-taking or a pullback is possible. Watch for a confirmed candle close and a successful retest before assuming the breakout will continue. 🚀
141
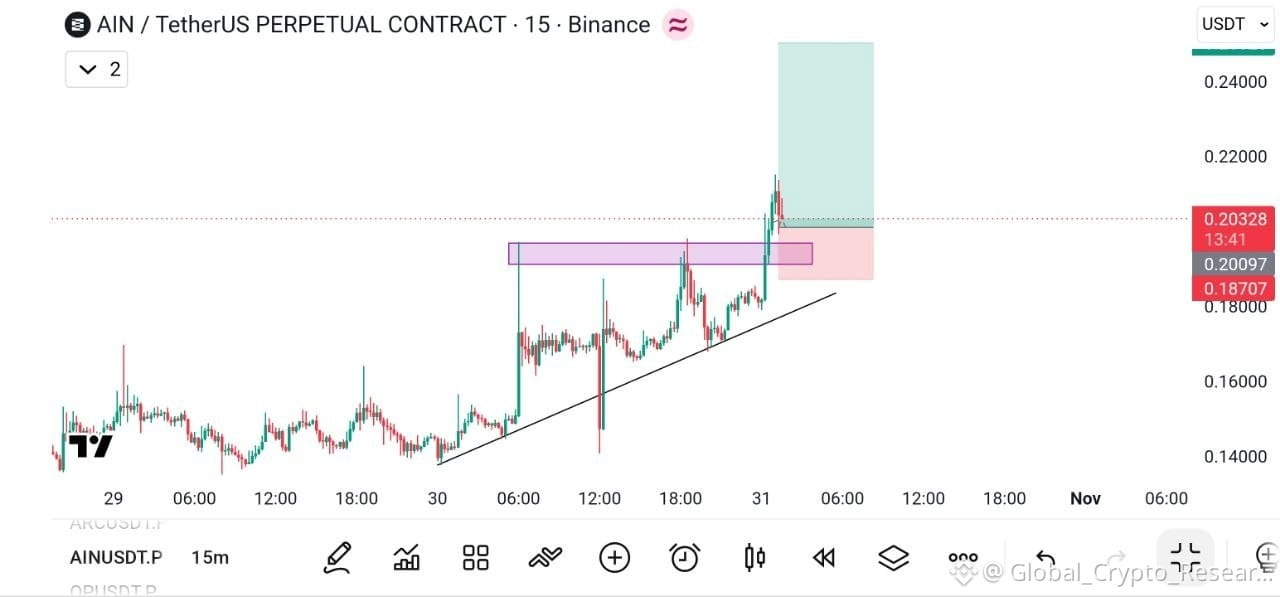
Coin $AIN
{future}(AINUSDT)
/USDT
Position: LONG
Leverage: Cross 20×
Entries: 0.2030 - 0.1950
Targets: 🎯 0.2135, 0.2280, 0.2500
Stop Loss: 0.1870below
Coin $AIN
/USDT
Position: LONG
Leverage: Cross 20×
Entries: 0.2030 - 0.1950
Targets: 🎯 0.2135, 0.2280, 0.2500
Stop Loss: 0.1870below
/USDT
Position: LONG
Leverage: Cross 20×
Entries: 0.2030 - 0.1950
Targets: 🎯 0.2135, 0.2280, 0.2500
Stop Loss: 0.1870below
37
🚨 $TRX
{spot}(TRXUSDT)
Drops Over 9% — Can Buyers Defend the $0.32213 Support?
$TRX is trading near $0.32480, down 9.21% in 24 hours, after falling from the $0.35977 high. Selling pressure remains strong, and price is now close to the $0.32213 support zone. 📊
A recovery above $0.33485 could bring short-term relief, with $0.34310 as the next resistance. However, if $0.32213 breaks, further downside pressure may follow. 🤝💎
RSI(6) is around 26, indicating oversold short-term conditions. A relief bounce is possible, but it is not a confirmed reversal. Watch for buying volume and a strong candle close before assuming recovery. 🚀
🚨 $TRX
Drops Over 9% — Can Buyers Defend the $0.32213 Support?
$TRX is trading near $0.32480, down 9.21% in 24 hours, after falling from the $0.35977 high. Selling pressure remains strong, and price is now close to the $0.32213 support zone. 📊
A recovery above $0.33485 could bring short-term relief, with $0.34310 as the next resistance. However, if $0.32213 breaks, further downside pressure may follow. 🤝💎
RSI(6) is around 26, indicating oversold short-term conditions. A relief bounce is possible, but it is not a confirmed reversal. Watch for buying volume and a strong candle close before assuming recovery. 🚀
Drops Over 9% — Can Buyers Defend the $0.32213 Support?
$TRX is trading near $0.32480, down 9.21% in 24 hours, after falling from the $0.35977 high. Selling pressure remains strong, and price is now close to the $0.32213 support zone. 📊
A recovery above $0.33485 could bring short-term relief, with $0.34310 as the next resistance. However, if $0.32213 breaks, further downside pressure may follow. 🤝💎
RSI(6) is around 26, indicating oversold short-term conditions. A relief bounce is possible, but it is not a confirmed reversal. Watch for buying volume and a strong candle close before assuming recovery. 🚀
52
🔥 $QNT
{future}(QNTUSDT)
Gains Over 7%..
..
Can Buyers Break the $193.84 Resistance?
$QNT is trading near $193.54, up 7.09% in 24 hours, after recovering from the $186.63 low. Buyers have pushed price toward the $193.84 resistance zone, making this a key level for the next move. 📊
A confirmed breakout above $193.84 could open the way toward $197.00. If momentum fades, the $192.37 area is worth monitoring, followed by support near $189.12. 🤝💎
RSI readings are around 54–62, showing improving bullish momentum without extreme overbought conditions. The 15-minute chart is recovering, but price is still testing resistance. Watch for a strong candle close and sustained volume before assuming the breakout will hold. 🚀
🔥 $QNT
Gains Over 7%..
..
Can Buyers Break the $193.84 Resistance?
$QNT is trading near $193.54, up 7.09% in 24 hours, after recovering from the $186.63 low. Buyers have pushed price toward the $193.84 resistance zone, making this a key level for the next move. 📊
A confirmed breakout above $193.84 could open the way toward $197.00. If momentum fades, the $192.37 area is worth monitoring, followed by support near $189.12. 🤝💎
RSI readings are around 54–62, showing improving bullish momentum without extreme overbought conditions. The 15-minute chart is recovering, but price is still testing resistance. Watch for a strong candle close and sustained volume before assuming the breakout will hold. 🚀
Gains Over 7%..
..
Can Buyers Break the $193.84 Resistance?
$QNT is trading near $193.54, up 7.09% in 24 hours, after recovering from the $186.63 low. Buyers have pushed price toward the $193.84 resistance zone, making this a key level for the next move. 📊
A confirmed breakout above $193.84 could open the way toward $197.00. If momentum fades, the $192.37 area is worth monitoring, followed by support near $189.12. 🤝💎
RSI readings are around 54–62, showing improving bullish momentum without extreme overbought conditions. The 15-minute chart is recovering, but price is still testing resistance. Watch for a strong candle close and sustained volume before assuming the breakout will hold. 🚀
231
🔥 $LINK
{future}(LINKUSDT)
Gains Nearly 11% Can Buyers Break $11.738?
$LINK is trading near $11.686, up 10.79% in 24 hours, after recovering from the $10.271 low. Buyers have pushed price close to the $11.738 resistance, making this a crucial level for the next move. 📊
A confirmed breakout above $11.738 could open the way toward $12.015. If momentum fades, the $11.237 area is worth monitoring, followed by support near $10.909. 🤝💎
RSI(6) is around 88, showing overheated short-term momentum. Although buying pressure has increased, a pullback is possible if resistance holds. Watch for a confirmed candle close and sustained volume before assuming the rally will continue. 🚀
🔥 $LINK
Gains Nearly 11% Can Buyers Break $11.738?
$LINK is trading near $11.686, up 10.79% in 24 hours, after recovering from the $10.271 low. Buyers have pushed price close to the $11.738 resistance, making this a crucial level for the next move. 📊
A confirmed breakout above $11.738 could open the way toward $12.015. If momentum fades, the $11.237 area is worth monitoring, followed by support near $10.909. 🤝💎
RSI(6) is around 88, showing overheated short-term momentum. Although buying pressure has increased, a pullback is possible if resistance holds. Watch for a confirmed candle close and sustained volume before assuming the rally will continue. 🚀
Gains Nearly 11% Can Buyers Break $11.738?
$LINK is trading near $11.686, up 10.79% in 24 hours, after recovering from the $10.271 low. Buyers have pushed price close to the $11.738 resistance, making this a crucial level for the next move. 📊
A confirmed breakout above $11.738 could open the way toward $12.015. If momentum fades, the $11.237 area is worth monitoring, followed by support near $10.909. 🤝💎
RSI(6) is around 88, showing overheated short-term momentum. Although buying pressure has increased, a pullback is possible if resistance holds. Watch for a confirmed candle close and sustained volume before assuming the rally will continue. 🚀
119
🔥 $GWEI Surges Over 30% — Can Buyers Break the $0.025113 Resistance?
$GWEI is trading near $0.022225, up 30.48% in 24 hours, after a sharp recovery from the $0.016776 low. Buyers have pushed price higher, but the $0.025113 resistance remains the key barrier to watch. 📊
A confirmed breakout above $0.025113 could open the way toward $0.0261. If momentum fades, the $0.02125 area is worth monitoring, followed by support near $0.016461. 🤝💎
RSI readings are around 49–58, showing recovering momentum without extreme overbought conditions. However, the recent sharp price swings indicate volatility remains high. Watch for a strong daily candle close and sustained volume before assuming the rally will continue. 🚀
🔥 $GWEI Surges Over 30% — Can Buyers Break the $0.025113 Resistance?
$GWEI is trading near $0.022225, up 30.48% in 24 hours, after a sharp recovery from the $0.016776 low. Buyers have pushed price higher, but the $0.025113 resistance remains the key barrier to watch. 📊
A confirmed breakout above $0.025113 could open the way toward $0.0261. If momentum fades, the $0.02125 area is worth monitoring, followed by support near $0.016461. 🤝💎
RSI readings are around 49–58, showing recovering momentum without extreme overbought conditions. However, the recent sharp price swings indicate volatility remains high. Watch for a strong daily candle close and sustained volume before assuming the rally will continue. 🚀
$GWEI is trading near $0.022225, up 30.48% in 24 hours, after a sharp recovery from the $0.016776 low. Buyers have pushed price higher, but the $0.025113 resistance remains the key barrier to watch. 📊
A confirmed breakout above $0.025113 could open the way toward $0.0261. If momentum fades, the $0.02125 area is worth monitoring, followed by support near $0.016461. 🤝💎
RSI readings are around 49–58, showing recovering momentum without extreme overbought conditions. However, the recent sharp price swings indicate volatility remains high. Watch for a strong daily candle close and sustained volume before assuming the rally will continue. 🚀
228
🔥 $SOL
{future}(SOLUSDT)
Drops Over 6% — Can Buyers Defend the $93.69 Support?
#sol is trading near $94.01, down 6.44% in 24 hours, after falling from the $100.83 high. Selling pressure remains strong, and price is testing the $93.69 support zone, making this a critical area to watch. 📊
A recovery above $95.22 could bring short-term relief, with $98.58 as the next resistance. If support at $93.69 breaks, the $92.36 daily low becomes the next level to monitor. 🤝💎
RSI(6) is near 24, showing oversold short-term conditions. A relief bounce is possible, but oversold readings alone do not confirm a reversal. Watch for buying volume and a strong candle close before assuming recovery. 🚀 $BEAMX
{spot}(BEAMXUSDT)
$MAGMA
{future}(MAGMAUSDT)
🔥 $SOL
Drops Over 6% — Can Buyers Defend the $93.69 Support?
#sol is trading near $94.01, down 6.44% in 24 hours, after falling from the $100.83 high. Selling pressure remains strong, and price is testing the $93.69 support zone, making this a critical area to watch. 📊
A recovery above $95.22 could bring short-term relief, with $98.58 as the next resistance. If support at $93.69 breaks, the $92.36 daily low becomes the next level to monitor. 🤝💎
RSI(6) is near 24, showing oversold short-term conditions. A relief bounce is possible, but oversold readings alone do not confirm a reversal. Watch for buying volume and a strong candle close before assuming recovery. 🚀 $BEAMX
$MAGMA
Drops Over 6% — Can Buyers Defend the $93.69 Support?
#sol is trading near $94.01, down 6.44% in 24 hours, after falling from the $100.83 high. Selling pressure remains strong, and price is testing the $93.69 support zone, making this a critical area to watch. 📊
A recovery above $95.22 could bring short-term relief, with $98.58 as the next resistance. If support at $93.69 breaks, the $92.36 daily low becomes the next level to monitor. 🤝💎
RSI(6) is near 24, showing oversold short-term conditions. A relief bounce is possible, but oversold readings alone do not confirm a reversal. Watch for buying volume and a strong candle close before assuming recovery. 🚀 $BEAMX
$MAGMA
194
🔥 $SOPH Rallies Nearly 60% — Can Buyers Sustain the Momentum?
#SOPH is trading near $0.002417, up 59.33% in 24 hours, after climbing from the $0.001197 low. Price is now testing the $0.002441 resistance, making this a critical area for the next move. 📊
A confirmed breakout and sustained hold above $0.002441 could open the way toward $0.002584. If buyers face rejection, the $0.002265 area is worth watching, followed by support near $0.001886 and $0.001507. 🤝💎
RSI readings are between 74 and 84, indicating overheated momentum. After such a sharp rally, profit-taking and a pullback are possible.
My Take: The trend is strong, but chasing the pump here carries significant risk. Waiting for a confirmed breakout and retest, or a healthier pullback, may be more cautious than entering at the current price. 🚀$IDOL
{future}(IDOLUSDT)
$BIRB
🔥 $SOPH Rallies Nearly 60% — Can Buyers Sustain the Momentum?
#SOPH is trading near $0.002417, up 59.33% in 24 hours, after climbing from the $0.001197 low. Price is now testing the $0.002441 resistance, making this a critical area for the next move. 📊
A confirmed breakout and sustained hold above $0.002441 could open the way toward $0.002584. If buyers face rejection, the $0.002265 area is worth watching, followed by support near $0.001886 and $0.001507. 🤝💎
RSI readings are between 74 and 84, indicating overheated momentum. After such a sharp rally, profit-taking and a pullback are possible.
My Take: The trend is strong, but chasing the pump here carries significant risk. Waiting for a confirmed breakout and retest, or a healthier pullback, may be more cautious than entering at the current price. 🚀$IDOL
$BIRB
#SOPH is trading near $0.002417, up 59.33% in 24 hours, after climbing from the $0.001197 low. Price is now testing the $0.002441 resistance, making this a critical area for the next move. 📊
A confirmed breakout and sustained hold above $0.002441 could open the way toward $0.002584. If buyers face rejection, the $0.002265 area is worth watching, followed by support near $0.001886 and $0.001507. 🤝💎
RSI readings are between 74 and 84, indicating overheated momentum. After such a sharp rally, profit-taking and a pullback are possible.
My Take: The trend is strong, but chasing the pump here carries significant risk. Waiting for a confirmed breakout and retest, or a healthier pullback, may be more cautious than entering at the current price. 🚀$IDOL
$BIRB
818
🔥 $IDOL Explodes Over 120% — Is Another Breakout Worth Chasing?
$IDOL is trading near $0.02692, up 120.29% in 24 hours, after a sharp rally from $0.01039. Price is now close to its $0.02754 daily high, making this resistance zone critical for the next move. 📊
A sustained breakout above $0.02754 could open the way toward $0.02951. However, if buyers fail to hold momentum, $0.02511 is the first level to watch, followed by $0.01989. The chart also shows support around $0.01430.
RSI readings are extremely high, with RSI(6) above 91. This signals overheated momentum and increases the risk of profit-taking or a sharp pullback.
My Take: The trend is strongly bullish, but entering after a 120% surge carries significant risk. I would wait for a confirmed breakout and retest, or a healthier pullback, rather than chase the current price. 🤝💎$INIT
{spot}(INITUSDT)
🔥 $IDOL Explodes Over 120% — Is Another Breakout Worth Chasing?
$IDOL is trading near $0.02692, up 120.29% in 24 hours, after a sharp rally from $0.01039. Price is now close to its $0.02754 daily high, making this resistance zone critical for the next move. 📊
A sustained breakout above $0.02754 could open the way toward $0.02951. However, if buyers fail to hold momentum, $0.02511 is the first level to watch, followed by $0.01989. The chart also shows support around $0.01430.
RSI readings are extremely high, with RSI(6) above 91. This signals overheated momentum and increases the risk of profit-taking or a sharp pullback.
My Take: The trend is strongly bullish, but entering after a 120% surge carries significant risk. I would wait for a confirmed breakout and retest, or a healthier pullback, rather than chase the current price. 🤝💎$INIT
$IDOL is trading near $0.02692, up 120.29% in 24 hours, after a sharp rally from $0.01039. Price is now close to its $0.02754 daily high, making this resistance zone critical for the next move. 📊
A sustained breakout above $0.02754 could open the way toward $0.02951. However, if buyers fail to hold momentum, $0.02511 is the first level to watch, followed by $0.01989. The chart also shows support around $0.01430.
RSI readings are extremely high, with RSI(6) above 91. This signals overheated momentum and increases the risk of profit-taking or a sharp pullback.
My Take: The trend is strongly bullish, but entering after a 120% surge carries significant risk. I would wait for a confirmed breakout and retest, or a healthier pullback, rather than chase the current price. 🤝💎$INIT
1
380
$BBX short setup
{future}(BBXUSDT)
Entry $8.395
Tp 8.633625
Tp 8.26960
$BBX short setup
Entry $8.395
Tp 8.633625
Tp 8.26960
Entry $8.395
Tp 8.633625
Tp 8.26960
9
$BIRB
{future}(BIRBUSDT)
🔥 BIRB Surges Nearly 45% — Can Buyers Break $0.10231?
$BIRB is trading near $0.10000, up 44.82% in 24 hours, after climbing from the $0.06510 low. Buyers are pushing price close to the $0.10231 resistance, making this a crucial level for the next move. 📊
A confirmed breakout above $0.10231 could open the way toward $0.10659. If momentum fades, the $0.09704 area is worth monitoring, followed by support near $0.08571. 🤝💎
RSI(6) is above 92, showing extremely overheated short-term momentum. After such a sharp rally, profit-taking and a pullback are possible. Watch for a confirmed breakout or healthy retest before assuming the rally will continue. 🚀
$BIRB
🔥 BIRB Surges Nearly 45% — Can Buyers Break $0.10231?
$BIRB is trading near $0.10000, up 44.82% in 24 hours, after climbing from the $0.06510 low. Buyers are pushing price close to the $0.10231 resistance, making this a crucial level for the next move. 📊
A confirmed breakout above $0.10231 could open the way toward $0.10659. If momentum fades, the $0.09704 area is worth monitoring, followed by support near $0.08571. 🤝💎
RSI(6) is above 92, showing extremely overheated short-term momentum. After such a sharp rally, profit-taking and a pullback are possible. Watch for a confirmed breakout or healthy retest before assuming the rally will continue. 🚀
🔥 BIRB Surges Nearly 45% — Can Buyers Break $0.10231?
$BIRB is trading near $0.10000, up 44.82% in 24 hours, after climbing from the $0.06510 low. Buyers are pushing price close to the $0.10231 resistance, making this a crucial level for the next move. 📊
A confirmed breakout above $0.10231 could open the way toward $0.10659. If momentum fades, the $0.09704 area is worth monitoring, followed by support near $0.08571. 🤝💎
RSI(6) is above 92, showing extremely overheated short-term momentum. After such a sharp rally, profit-taking and a pullback are possible. Watch for a confirmed breakout or healthy retest before assuming the rally will continue. 🚀
152
🔥 $MAGMA
{future}(MAGMAUSDT)
Jumps Over 33%...... #UniswapA16zSeekDeFiExemptionFromIllinoisCryptoTax Can Buyers Break $0.39256?
$MAGMA is trading near $0.38438, up 33.61% in 24 hours, after climbing from the $0.27933 low. Buyers are approaching the $0.39256 resistance zone, making this the key level to watch next. 📊
A confirmed breakout above $0.39256 could open the way toward $0.40810. If momentum fades, the $0.37340 area is worth monitoring, followed by support near $0.33221. 🤝💎
RSI readings are around 73–80, showing strong but overheated momentum. After such a sharp rally, profit-taking is possible. Watch for a confirmed breakout or healthy retest before assuming the upside will continue. 🚀
🔥 $MAGMA
Jumps Over 33%...... #UniswapA16zSeekDeFiExemptionFromIllinoisCryptoTax Can Buyers Break $0.39256?
$MAGMA is trading near $0.38438, up 33.61% in 24 hours, after climbing from the $0.27933 low. Buyers are approaching the $0.39256 resistance zone, making this the key level to watch next. 📊
A confirmed breakout above $0.39256 could open the way toward $0.40810. If momentum fades, the $0.37340 area is worth monitoring, followed by support near $0.33221. 🤝💎
RSI readings are around 73–80, showing strong but overheated momentum. After such a sharp rally, profit-taking is possible. Watch for a confirmed breakout or healthy retest before assuming the upside will continue. 🚀
Jumps Over 33%...... #UniswapA16zSeekDeFiExemptionFromIllinoisCryptoTax Can Buyers Break $0.39256?
$MAGMA is trading near $0.38438, up 33.61% in 24 hours, after climbing from the $0.27933 low. Buyers are approaching the $0.39256 resistance zone, making this the key level to watch next. 📊
A confirmed breakout above $0.39256 could open the way toward $0.40810. If momentum fades, the $0.37340 area is worth monitoring, followed by support near $0.33221. 🤝💎
RSI readings are around 73–80, showing strong but overheated momentum. After such a sharp rally, profit-taking is possible. Watch for a confirmed breakout or healthy retest before assuming the upside will continue. 🚀
5
Ok 🔥 $PARTI
{future}(PARTIUSDT)
Jumps Over 64% — Can Buyers Reclaim $0.06818?
$PARTI is trading near $0.05269, up 64.60% in 24 hours, after a strong rally from the $0.03154 low. Buyers have taken control, but the $0.06818 high remains the key resistance to watch. 📊
A confirmed breakout above $0.06818 could open the way toward $0.07317. If momentum cools, the $0.04880 area is worth monitoring, followed by support near $0.03557. 🤝💎
RSI readings are around 70–72, showing strong but overheated momentum. After such a sharp rally, profit-taking is possible. Watch for a confirmed breakout or healthy retest before assuming the upside will continue. 🚀
Ok 🔥 $PARTI
Jumps Over 64% — Can Buyers Reclaim $0.06818?
$PARTI is trading near $0.05269, up 64.60% in 24 hours, after a strong rally from the $0.03154 low. Buyers have taken control, but the $0.06818 high remains the key resistance to watch. 📊
A confirmed breakout above $0.06818 could open the way toward $0.07317. If momentum cools, the $0.04880 area is worth monitoring, followed by support near $0.03557. 🤝💎
RSI readings are around 70–72, showing strong but overheated momentum. After such a sharp rally, profit-taking is possible. Watch for a confirmed breakout or healthy retest before assuming the upside will continue. 🚀
Jumps Over 64% — Can Buyers Reclaim $0.06818?
$PARTI is trading near $0.05269, up 64.60% in 24 hours, after a strong rally from the $0.03154 low. Buyers have taken control, but the $0.06818 high remains the key resistance to watch. 📊
A confirmed breakout above $0.06818 could open the way toward $0.07317. If momentum cools, the $0.04880 area is worth monitoring, followed by support near $0.03557. 🤝💎
RSI readings are around 70–72, showing strong but overheated momentum. After such a sharp rally, profit-taking is possible. Watch for a confirmed breakout or healthy retest before assuming the upside will continue. 🚀
52
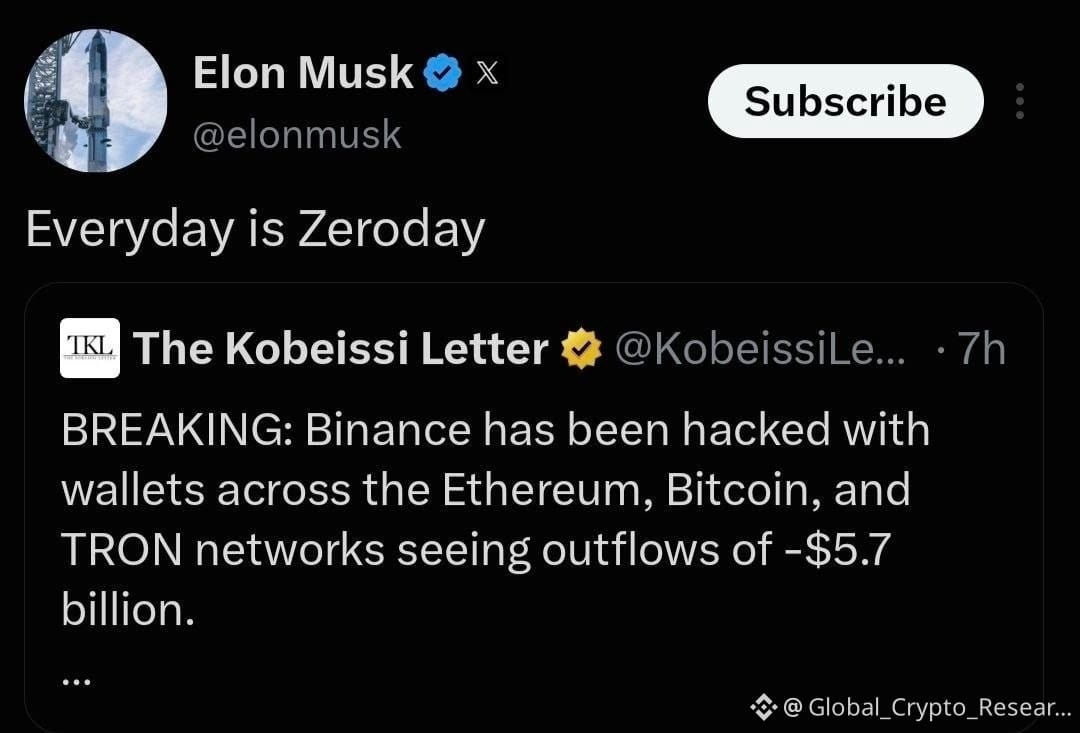
$BEAMX $PARTI $LSK Binance’s investigation has uncovered additional breach points beyond a potentially compromised laptop.
Withdrawals are expected to resume in 45 hours.
$BEAMX $PARTI $LSK Binance’s investigation has uncovered additional breach points beyond a potentially compromised laptop.
Withdrawals are expected to resume in 45 hours.
Withdrawals are expected to resume in 45 hours.

5
🔥 $ALPINE
{future}(ALPINEUSDT)
Explodes Over 220%... Can Buyers Hold Above $0.96?
$ALPINE is trading near $0.9650, up 221.99% in 24 hours, after a massive surge from the $0.2677 low. Price briefly touched $1.5014 before pulling back, making this a highly volatile move. 📊
A recovery above $1.00 could bring another test of $1.20, while the $1.5014 high remains the major resistance. If momentum weakens, the $0.80 area is worth watching, followed by support near $0.5752. 🤝💎
RSI readings are around 64–65, showing positive momentum, but the sharp rally and fading volume call for caution. Watch for a stable retest before assuming the next leg higher is coming. 🚀#KOSPIFalls3.53%BackBelow6000
🔥 $ALPINE
Explodes Over 220%... Can Buyers Hold Above $0.96?
$ALPINE is trading near $0.9650, up 221.99% in 24 hours, after a massive surge from the $0.2677 low. Price briefly touched $1.5014 before pulling back, making this a highly volatile move. 📊
A recovery above $1.00 could bring another test of $1.20, while the $1.5014 high remains the major resistance. If momentum weakens, the $0.80 area is worth watching, followed by support near $0.5752. 🤝💎
RSI readings are around 64–65, showing positive momentum, but the sharp rally and fading volume call for caution. Watch for a stable retest before assuming the next leg higher is coming. 🚀#KOSPIFalls3.53%BackBelow6000
Explodes Over 220%... Can Buyers Hold Above $0.96?
$ALPINE is trading near $0.9650, up 221.99% in 24 hours, after a massive surge from the $0.2677 low. Price briefly touched $1.5014 before pulling back, making this a highly volatile move. 📊
A recovery above $1.00 could bring another test of $1.20, while the $1.5014 high remains the major resistance. If momentum weakens, the $0.80 area is worth watching, followed by support near $0.5752. 🤝💎
RSI readings are around 64–65, showing positive momentum, but the sharp rally and fading volume call for caution. Watch for a stable retest before assuming the next leg higher is coming. 🚀#KOSPIFalls3.53%BackBelow6000
1
255
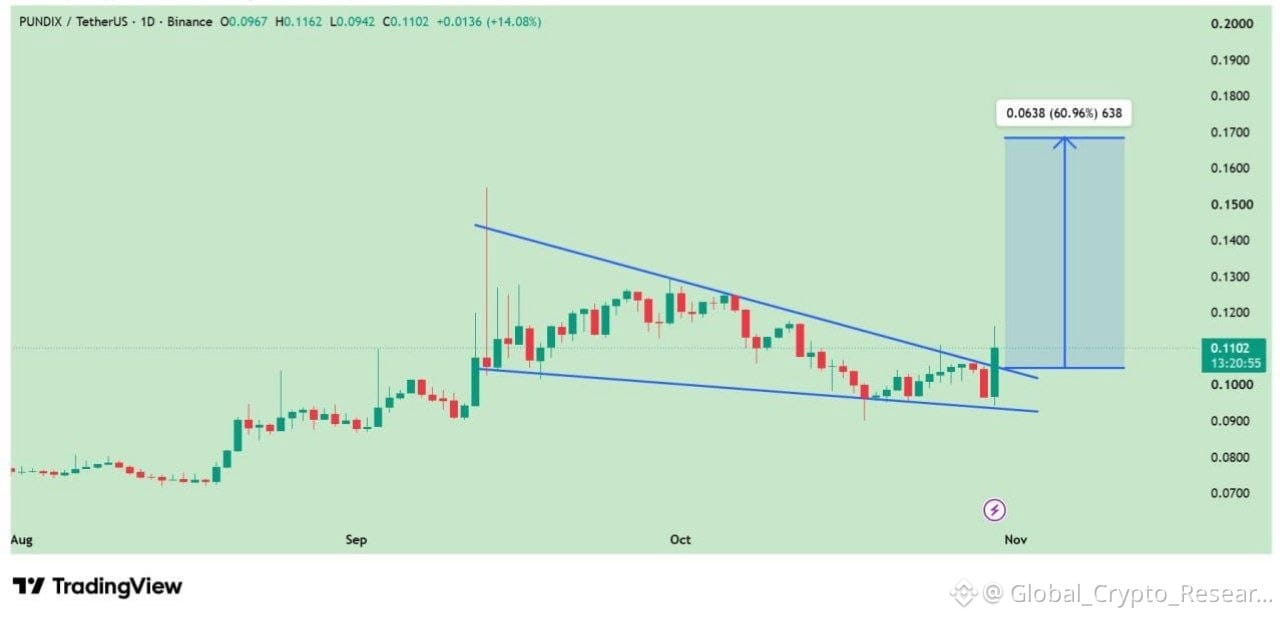
$PUNDIX
{spot}(PUNDIXUSDT)
USDT buy and hold big Move soon 🚀🤑
$PUNDIX
USDT buy and hold big Move soon 🚀🤑
USDT buy and hold big Move soon 🚀🤑
49
Gooooooooooooooooo
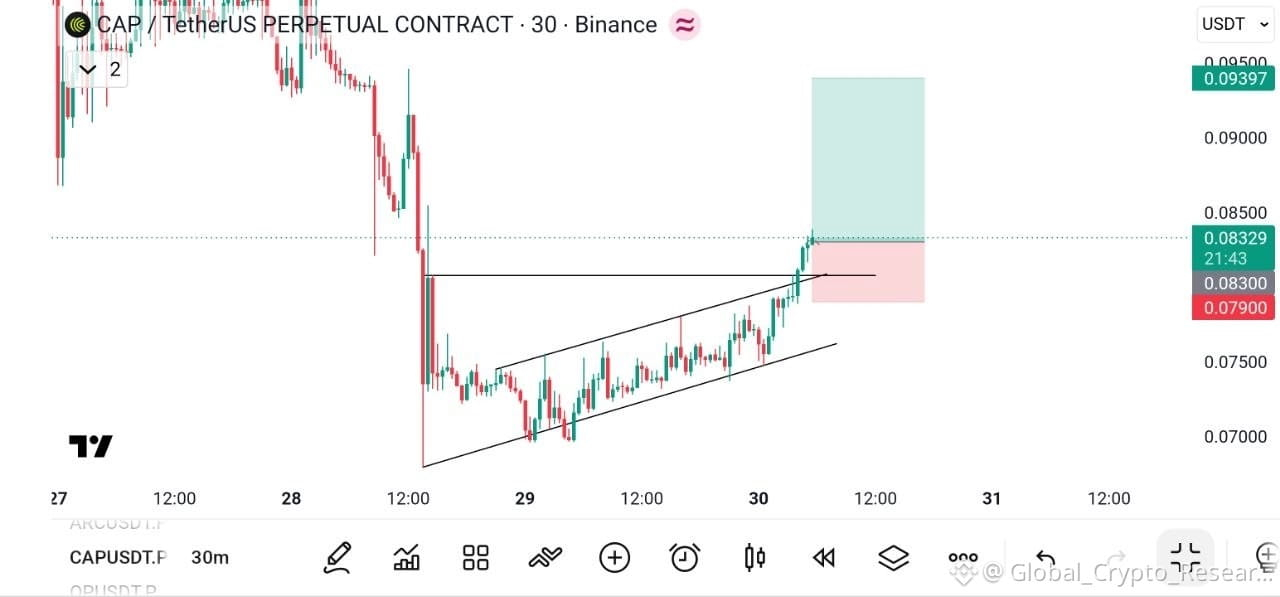
Coin $CAP
{future}(CAPUSDT)
Position: LONG
Leverage: Cross 20×
Entries: 0.0830 - 0.0810
Targets: 🎯 0.0860, 0.0895, 0.0940
Stop Loss: 0.0790 below
#BinanceSquareFamily
Gooooooooooooooooo
Coin $CAP
Position: LONG
Leverage: Cross 20×
Entries: 0.0830 - 0.0810
Targets: 🎯 0.0860, 0.0895, 0.0940
Stop Loss: 0.0790 below
#BinanceSquareFamily
Coin $CAP
Position: LONG
Leverage: Cross 20×
Entries: 0.0830 - 0.0810
Targets: 🎯 0.0860, 0.0895, 0.0940
Stop Loss: 0.0790 below
#BinanceSquareFamily
66
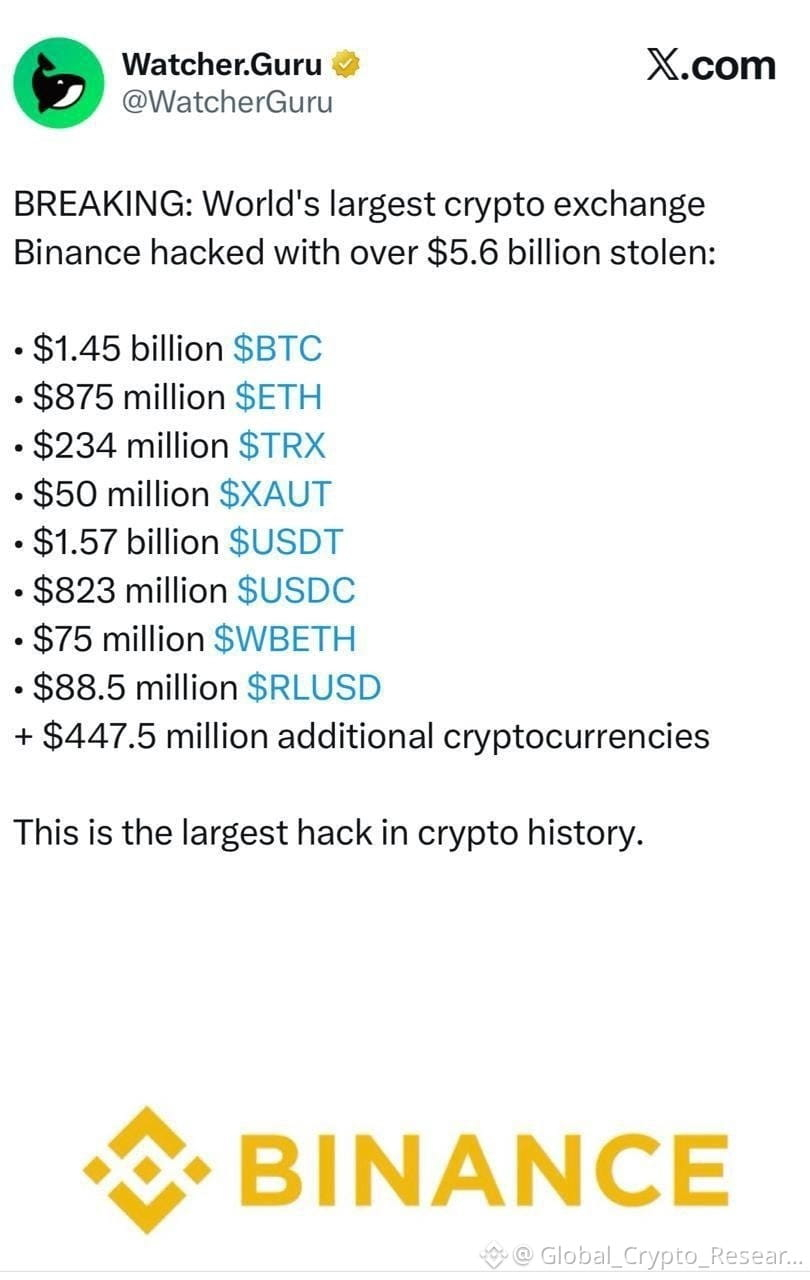
Is it true??if yes plz don't panic your funds are safu $BTC $ETH $SOL
Is it true??if yes plz don't panic your funds are safu $BTC $ETH $SOL
1
51
🔥 $MAGMA
{future}(MAGMAUSDT)
Is Up 11% #FedWatch Can Buyers Break the $0.2994 Barrier?
$MAGMA is trading near $0.29057, up 11.16% in 24 hours, after recovering from the $0.25762 low. Buyers are approaching the $0.29942 resistance zone, which could decide the next move. 📊
A confirmed breakout above $0.29942 could open the way toward $0.30598. If momentum fades, the $0.28000 area is worth monitoring, followed by support near $0.27394. 🤝💎
RSI readings are around 58–62, showing positive momentum without the extreme overbought conditions seen in some recent rallies. Watch for a strong candle close and sustained volume before assuming the breakout will hold. 🚀
🔥 $MAGMA
Is Up 11% #FedWatch Can Buyers Break the $0.2994 Barrier?
$MAGMA is trading near $0.29057, up 11.16% in 24 hours, after recovering from the $0.25762 low. Buyers are approaching the $0.29942 resistance zone, which could decide the next move. 📊
A confirmed breakout above $0.29942 could open the way toward $0.30598. If momentum fades, the $0.28000 area is worth monitoring, followed by support near $0.27394. 🤝💎
RSI readings are around 58–62, showing positive momentum without the extreme overbought conditions seen in some recent rallies. Watch for a strong candle close and sustained volume before assuming the breakout will hold. 🚀
Is Up 11% #FedWatch Can Buyers Break the $0.2994 Barrier?
$MAGMA is trading near $0.29057, up 11.16% in 24 hours, after recovering from the $0.25762 low. Buyers are approaching the $0.29942 resistance zone, which could decide the next move. 📊
A confirmed breakout above $0.29942 could open the way toward $0.30598. If momentum fades, the $0.28000 area is worth monitoring, followed by support near $0.27394. 🤝💎
RSI readings are around 58–62, showing positive momentum without the extreme overbought conditions seen in some recent rallies. Watch for a strong candle close and sustained volume before assuming the breakout will hold. 🚀
165
Log in to explore more content
Join global crypto users on Binance Square
⚡️ Get latest and useful information about crypto.
💬 Trusted by the world’s largest crypto exchange.
👍 Discover real insights from verified creators.
Email / Phone number
Trending Topics
SuspectedNorthKoreaAttacksAccountForNearly89%OfCryptoHackLosses
0 views
1 Discussing
$IDOL IDOL is still doing very well and its price will continue to rise sharply, so those who are shorting should be careful.
Trade Setup: Long - IDOL
Entry: $0.022732
SL: $0.021625
TP1: $0.027125
TP2: $0.030952
TP3: $0.035898 - $0.038539
✅ Click here to trade: 👇
#SuspectedNorthKoreaAttacksAccountForNearly89%OfCryptoHackLosses
Dai BNB
·0 Likes
·192 views
OpenAICutsFundraisingTargetBy$10B
39 views
22 Discussing
ASICHasReceivedNoPredictionMarketApplications
2,200 views
105 Discussing