

Crypt0Rachel
2.3k Posts

Crypt0Rachel
Report
Block User
Crypto expert / sharing Market insights , Trends Twitter/x.com/Crypt0Rachel
1.3K+ Following
11.8K+ Followers
3.2K+ Liked
Posts
All
Quotes
Videos
Live
·
--
Bullish
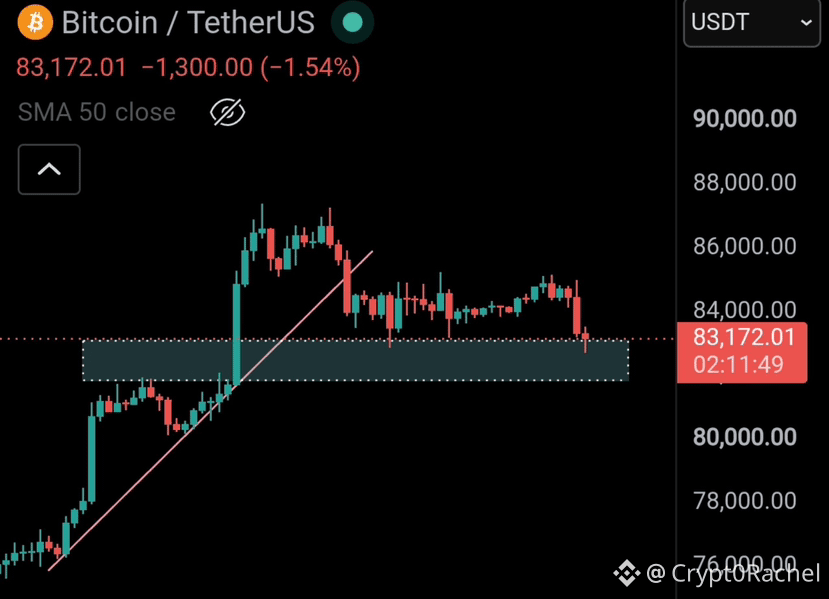
$BTC is facing some downside pressure amid the current geopolitical uncertainty, which is impacting market sentiment.
For now, $BTC is holding its key support level, keeping the market structure in focus.
Let's see how it moves from here. DYOR.
#Write2Earn
$BTC is facing some downside pressure amid the current geopolitical uncertainty, which is impacting market sentiment.
For now, $BTC is holding its key support level, keeping the market structure in focus.
Let's see how it moves from here. DYOR.
#Write2Earn
For now, $BTC is holding its key support level, keeping the market structure in focus.
Let's see how it moves from here. DYOR.
#Write2Earn
10
12
449
·
--
Bullish
🚨 META Faces Profit-Taking After a Powerful Rally — Is $800 Next?
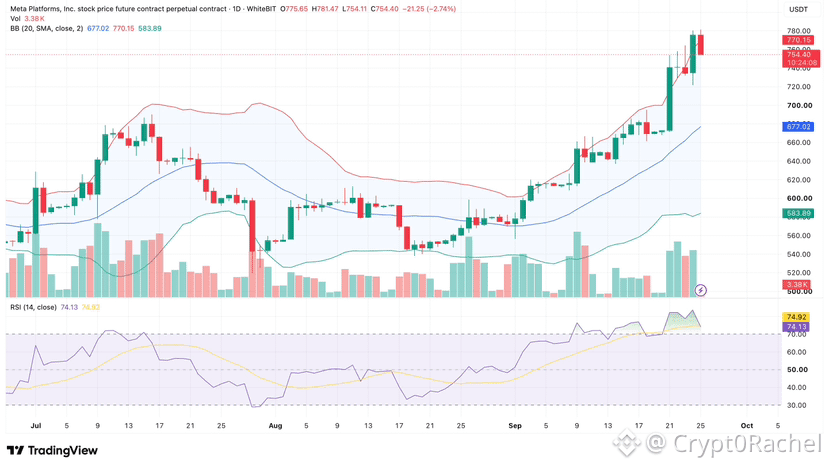
Meta Platforms ($META) has been showing strong bullish momentum, with price climbing from the $600–$670 zone to a recent high near $781.
But after this impressive rally, the daily chart is flashing some signals traders should keep an eye on. 👀
📊 Key Technical Levels (1D)
At the time of the chart snapshot:
Current price: $754.40
Recent high: $781.47
Bollinger Bands upper: $770.15
Bollinger Bands middle (20-day SMA): $677.02
Bollinger Bands lower: $583.89
RSI (14): 74.13
🔥 1. Bulls Still Have the Momentum
META has broken above its previous consolidation zone around $670–$700, with strong bullish candles indicating increased buying pressure.
Price remains well above the 20-day SMA at $677.02, keeping the broader daily trend bullish for now.
⚠️ 2. RSI Signals an Overbought Market
The daily RSI is sitting around 74, above the traditional 70 overbought threshold.
This doesn't automatically mean a reversal is coming, but it does suggest the rally may be stretched in the short term.
A period of consolidation or a healthy pullback would not be surprising after such a strong move.
🎯 3. Important Levels to Watch
Resistance:
$770–$781: Immediate resistance and recent high zone.
$800: Psychological level and potential upside target if buyers reclaim momentum.
Support:
$740–$750: Near-term price support zone.
$720–$730: Potential pullback area.
$677: Daily middle Bollinger Band and a key technical reference.
📈 My Outlook
As long as META holds above its recent breakout zones, the bullish structure remains intact.
A clean breakout above $781 could open the door toward the $800 psychological level. However, failure to reclaim the upper Bollinger Band, combined with the elevated RSI, could bring further profit-taking.
Personally, I would watch for confirmation rather than chase the move after such a strong rally.
Do you think META can break $800 next, or are we heading for a deeper retracement first? Drop your thoughts below! 👇
#meta #BinanceSquare #Write2Earn
10
11
422
·
--
Bullish
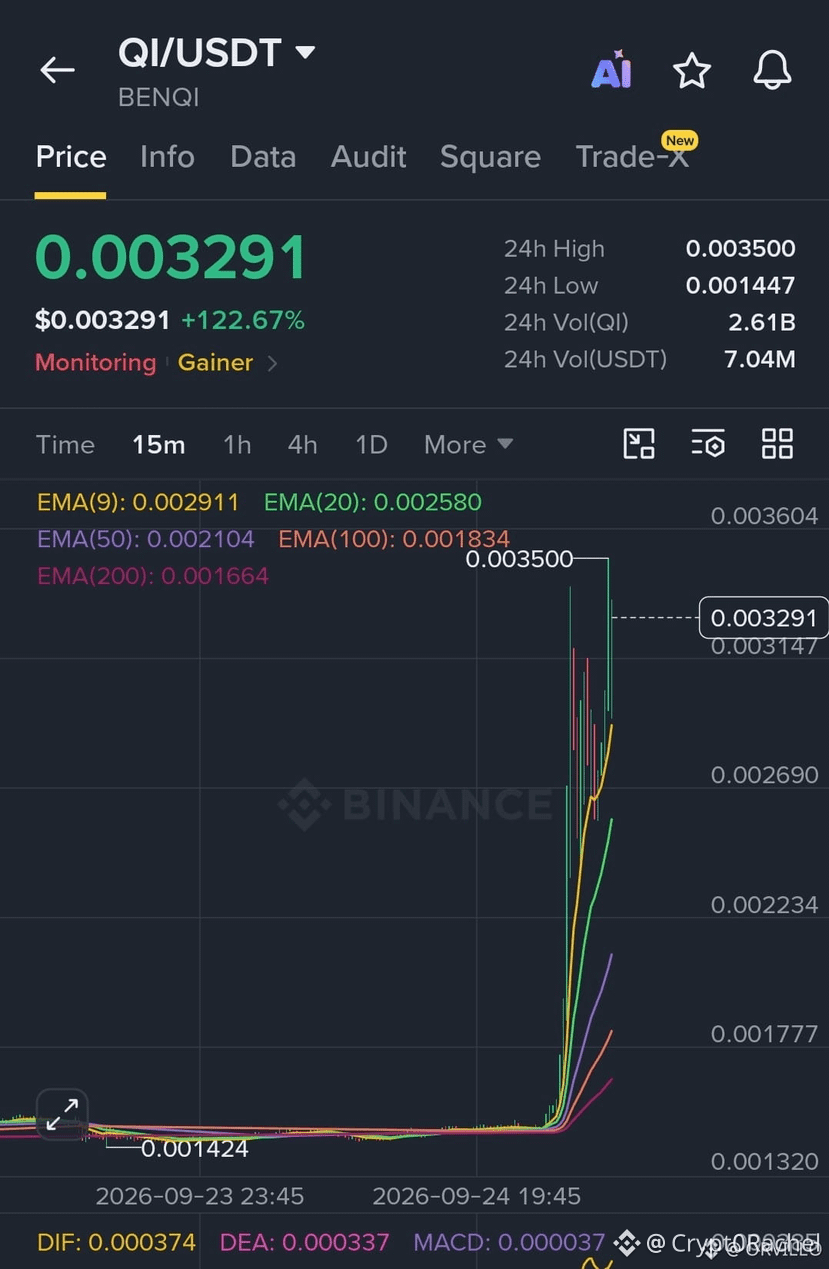
$QI is absolutely on fire! 🔥 Up another 130% in the last 24 hours!
Even after this massive rally, its market cap is still around $15M, compared to $DEXE at $100M.
That gap is definitely worth keeping an eye on. 👀
I’m watching for a healthy retracement before considering adding more to my position.
What’s your price target for $QI? 🚀
#QI #DEXEPriceAnalysis
$QI is absolutely on fire! 🔥 Up another 130% in the last 24 hours!
Even after this massive rally, its market cap is still around $15M, compared to $DEXE at $100M.
That gap is definitely worth keeping an eye on. 👀
I’m watching for a healthy retracement before considering adding more to my position.
What’s your price target for $QI ? 🚀
#QI #DEXEPriceAnalysis
Even after this massive rally, its market cap is still around $15M, compared to $DEXE at $100M.
That gap is definitely worth keeping an eye on. 👀
I’m watching for a healthy retracement before considering adding more to my position.
What’s your price target for $QI ? 🚀
#QI #DEXEPriceAnalysis
2
352
·
--
Bullish
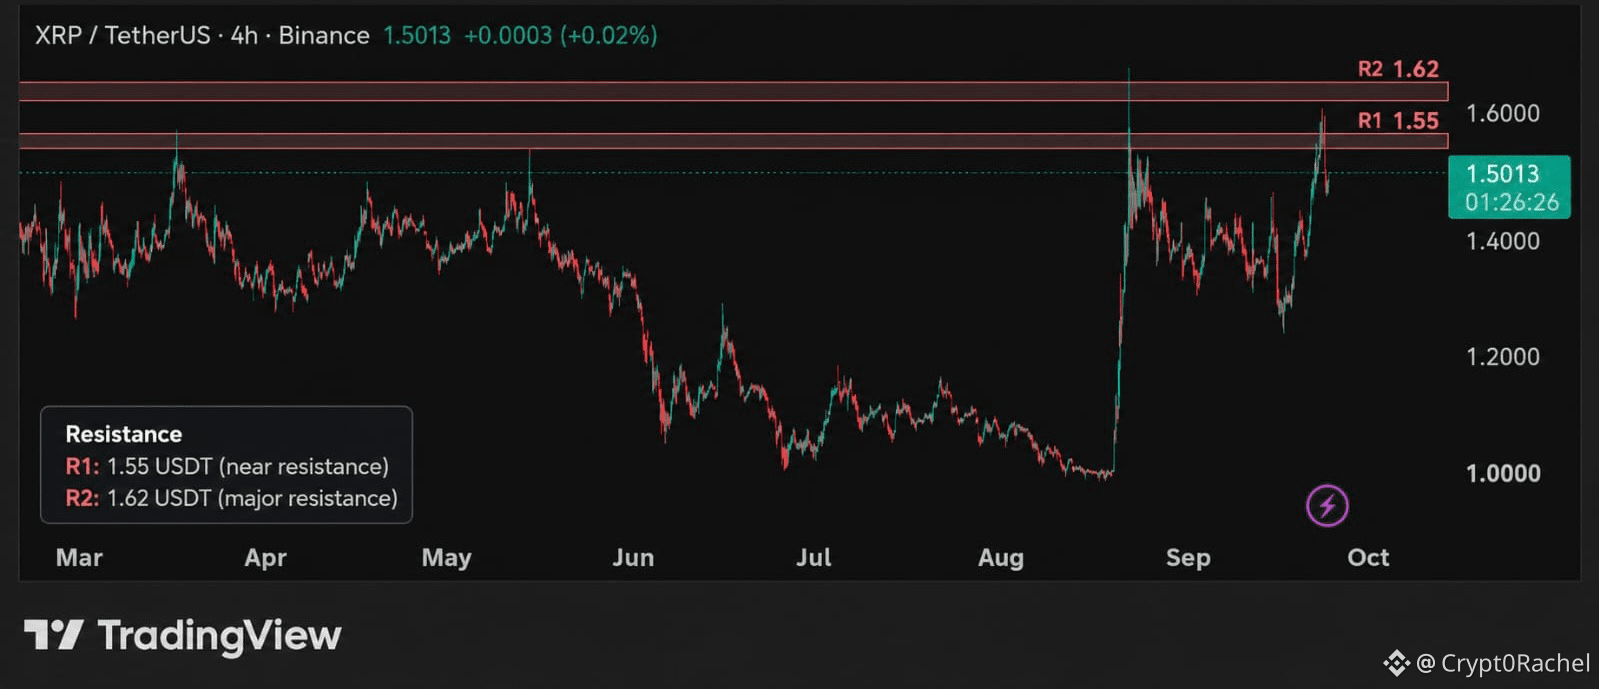
$XRP got rejected hard around $1.70 and the pullback is doing exactly what I wanted to see.
Now I’m watching the $1.35–$1.40 area.
If that holds, the next levels I’m looking at are:
$1.43 → $1.50 → $1.58 → $1.62
And if XRP can finally push back through $1.70 and hold it, then $1.75+ comes into play.
But honestly, I’m not interested in chasing a random green candle here.
$1.26 is still the level I care about underneath the whole setup.
Let price come to the levels.
$XRP 👀
#Write2Earn
5
5
103
·
--
Bullish
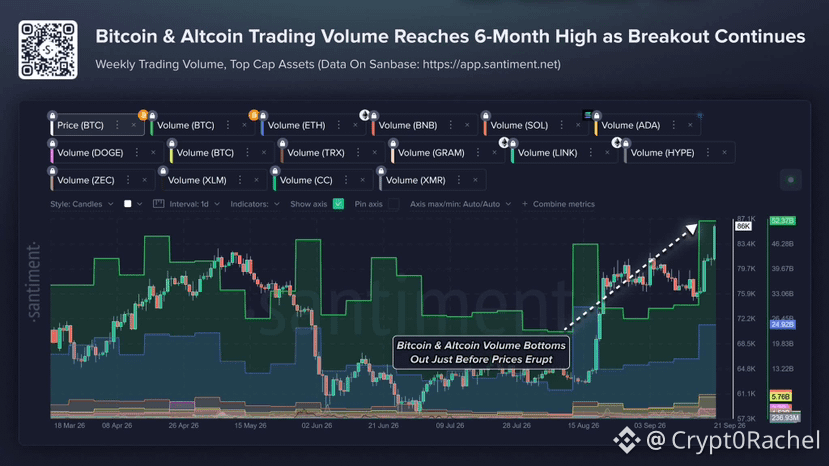
🚨 SIGNAL: Volume is waking up.
#bitcoin + altcoin trading volume just reached a 6-month high 📈
Historically, volume expansion like this can be an important signal that market participation is returning.
The chart shows volume picking up sharply as $BTC pushes higher — exactly the kind of confirmation traders want to see during a breakout.
👀 Watch:
• $BTC volume
• Altcoin participation
• HYPE / SOL / ETH volume
• Whether elevated volume sustains
If volume keeps expanding, the next phase could get interesting. 🔥
Not financial advice. DYOR.
#Write2Earn #Write2Earn!
1
89
·
--
Bullish
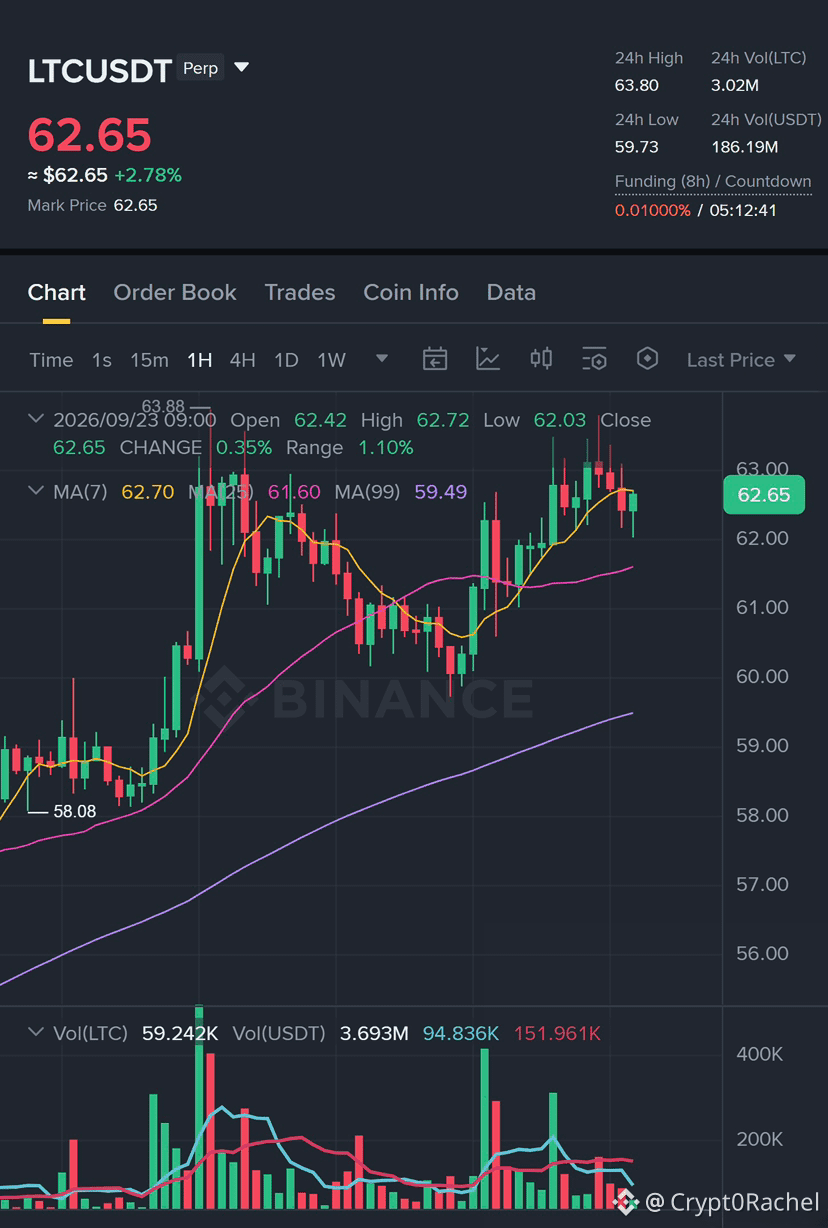
$LTC Long 10x | Active entry zone, with stop logic clearly outlined.
LTC is at a critical demand zone, and the upcoming reaction is crucial. This is a live position from a strategic area, where buyers must take charge.
Trade Plan:
- Entry: 62.53000 – 62.75000
- TP1: 63.41000 (R:R 1:0.8)
- TP2: 63.92000 (R:R 1:1.3)
- TP3: 64.68000 (R:R 1:2.0)
- SL: 61.62000
Why this setup?
- The long setup holds on 4h, with price maintaining 62.53000–62.75000 while the daily analysis remains within the range.
- 15m RSI at 50 indicates potential for buyers to push higher, provided they defend the level.
- Volume is at 0.05x, with 746.94000 traded against 14.70K anticipated, showing solid participation in this move.
Trade here 👇 and are you ready to act on a demand hold, or will you wait for momentum to reclaim?
EDUCATIONAL INFORMATION ONLY. NO ADVICE, OFFER, SOLICITATION, OR RECOMMENDATION. YOUR MOVE, YOUR RISK.
1
95
·
--
Bullish
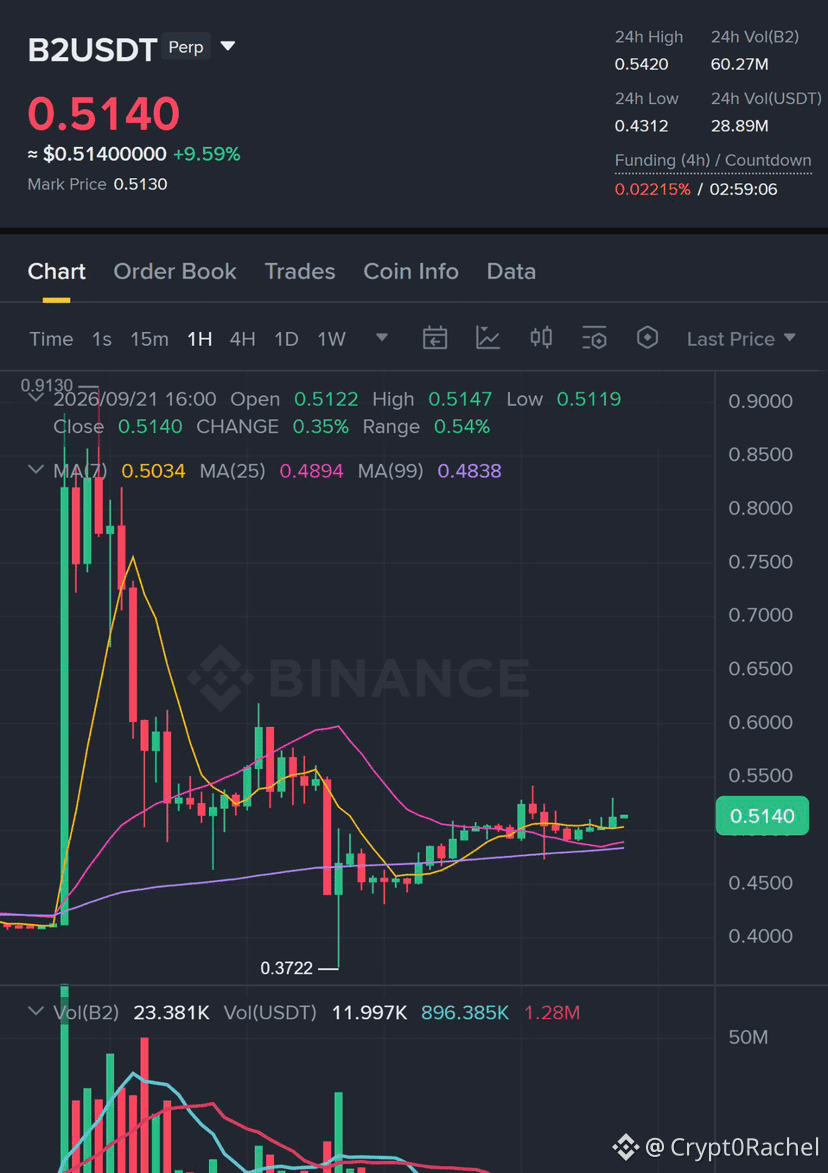
$B2 Long 10x | Demand is active, now buyers need to deliver.
B2 has hit the target zone where I favor controlled risk instead of chasing late. I entered the long with a clear invalidation, making the level crucial beyond mere opinions.
Trade Plan:
- Entry: 0.51030 – 0.51530
- TP1: 0.53090 (R:R 1:0.8)
- TP2: 0.54290 (R:R 1:1.2)
- TP3: 0.56100 (R:R 1:2.0)
- SL: 0.48870
Why this setup?
- The setup remains intact due to the 4h structure aligning with the range-bound 1D context at this designated zone.
- RSI15 at 55 indicates neutral momentum, allowing for potential upside; I want buyers to capitalize on that space, not just graze it.
- Current volume stands at 3.98x, with 18.88K traded against 4.75K anticipated, signaling genuine buy-side engagement.
Trade here 👇 and what's your move: dive in early at this zone, or wait for a safer confirmation?
EDUCATIONAL INFORMATION ONLY. NO ADVICE, OFFER, SOLICITATION, OR RECOMMENDATION. YOUR MOVE, YOUR RISK.
#Wrire2Earns
1
110
·
--
Bullish
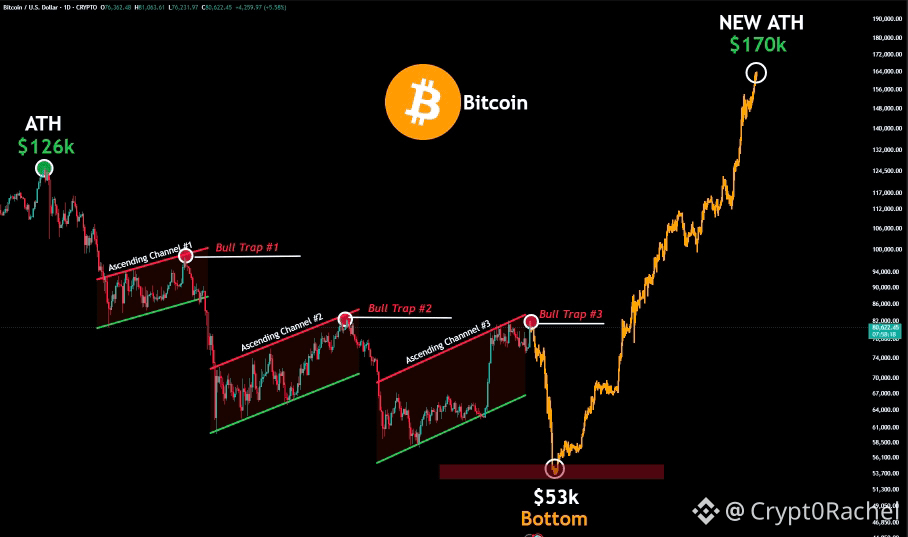
🚨 99% OF TRADERS WILL GET TRAPPED IN THIS BITCOIN PUMP.
I called the $80K–$81K relief rally 4 days ago. Now look where $BTC is.
Bitcoin is repeating the exact same structure again.
$81K → $73K → $70K → $65K → $53K → New bull Run
Most traders will see this pump and turn bullish.
I've seen this setup before.
Save this chart and check back later.
#Write2Earn
1
125
·
--
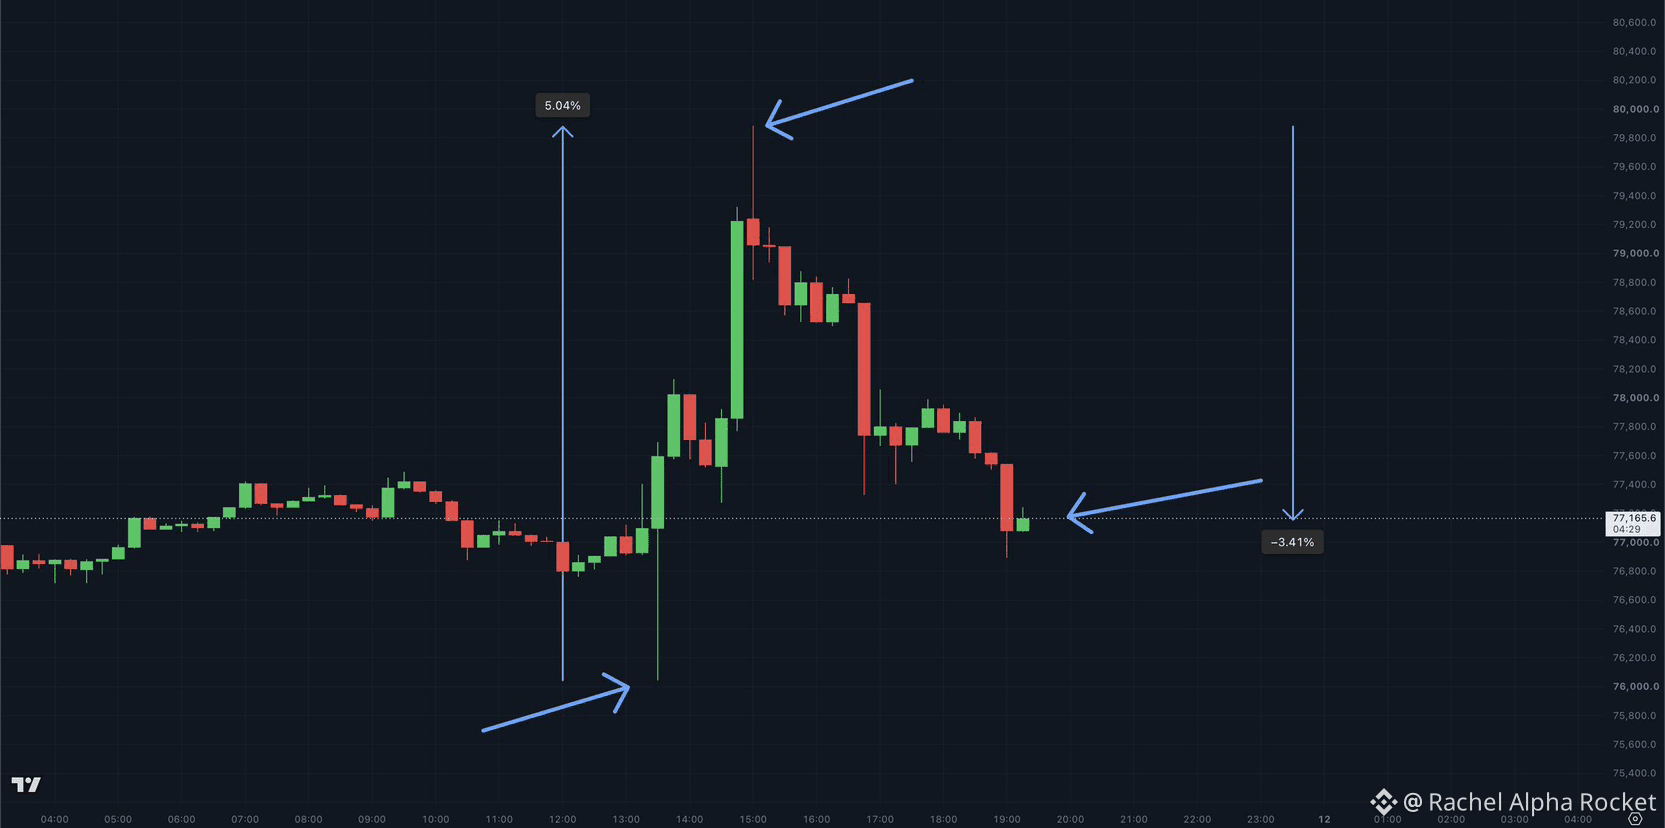
$BTC has basically given back the entire post-CPI pump.
It first dropped to $76K, then bounced nearly 5% toward $80K.
Now it’s down around 3.4% from that local high.
$80K is still the level Bitcoin needs to reclaim convincingly.
#Wrire2Earns #Write2Earn #Write2Earrn
$BTC has basically given back the entire post-CPI pump.
It first dropped to $76K, then bounced nearly 5% toward $80K.
Now it’s down around 3.4% from that local high.
$80K is still the level Bitcoin needs to reclaim convincingly.
#Wrire2Earns #Write2Earn #Write2Earrn
It first dropped to $76K, then bounced nearly 5% toward $80K.
Now it’s down around 3.4% from that local high.
$80K is still the level Bitcoin needs to reclaim convincingly.
#Wrire2Earns #Write2Earn #Write2Earrn
115
·
--
Bullish
🚨
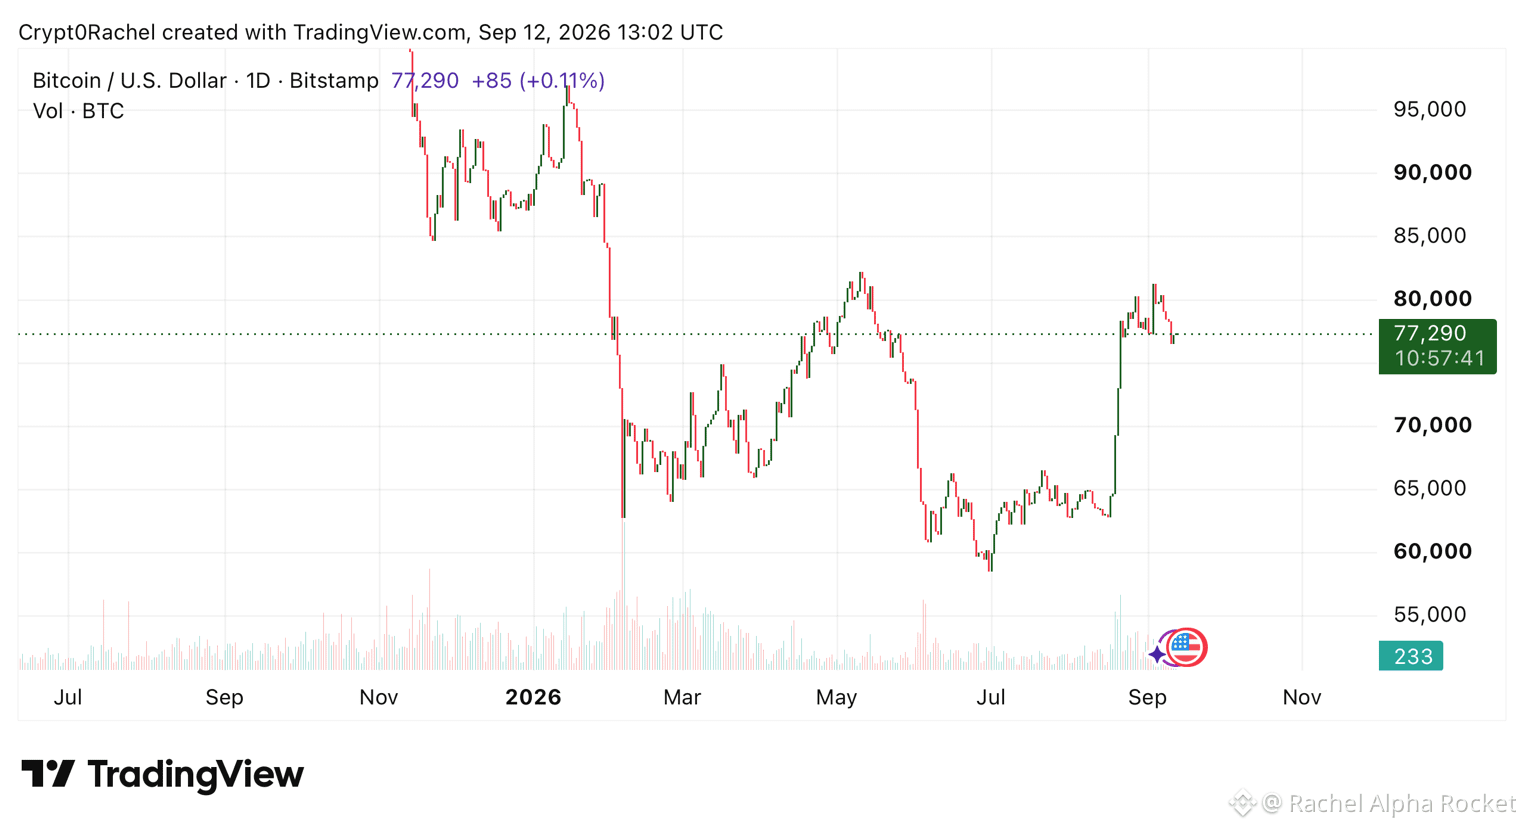
$BTC is trading around $77.3K after a strong recovery from the $60K area.
📈 Bullish setup:
→ Reclaim $80K–$82K = potential move toward $85K–$90K
→ Hold $75K–$77K = structure remains constructive
⚠️ Bearish risk:
→ Lose $75K → $72K could come into play
→ Below $70K would weaken the current recovery
My focus: $80K is the key breakout zone. 👀
Not financial advice. DYOR.
#bitcoin #BTC #Write2Earn #Write2Earn!
1
132
·
--
Bullish
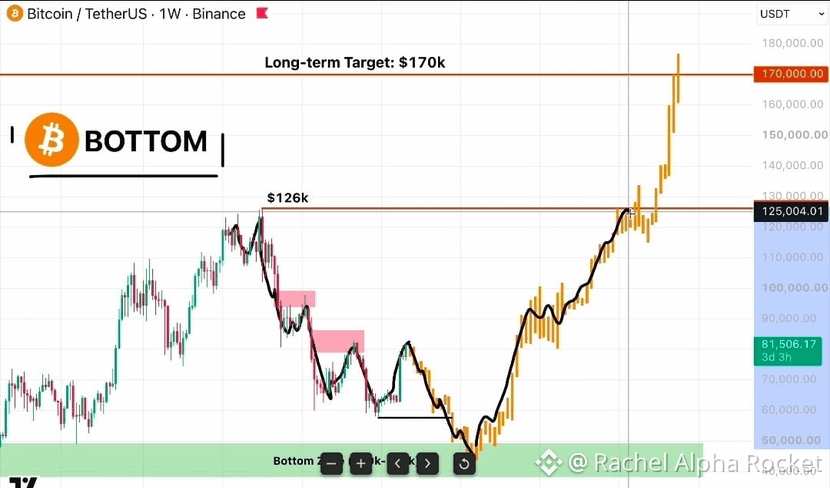
🚨 $BTC IS NEARING ITS FINAL BULL TRAP
While retail thinks bottom is already in, market may be setting up one final trap
Don’t become exit liquidity
Here’s my roadmap:
$82K → $85K (Bull Trap) → $42K-$48K (Bottom) → $126K → $170K
Final cycle bottom expected around Sep-Oct 2026
IMPORTANT:
I called $BTC’s $126K peak + $98K → $60K & $83K → $57K flushes early
Same setup is loading again - most will catch it too late
Turn notifs on - don’t be late for my next major market call
$BTC
🚨 $BTC IS NEARING ITS FINAL BULL TRAP
While retail thinks bottom is already in, market may be setting up one final trap
Don’t become exit liquidity
Here’s my roadmap:
$82K → $85K (Bull Trap) → $42K-$48K (Bottom) → $126K → $170K
Final cycle bottom expected around Sep-Oct 2026
IMPORTANT:
I called $BTC ’s $126K peak + $98K → $60K & $83K → $57K flushes early
Same setup is loading again - most will catch it too late
Turn notifs on - don’t be late for my next major market call
$BTC
120
·
--
Bullish
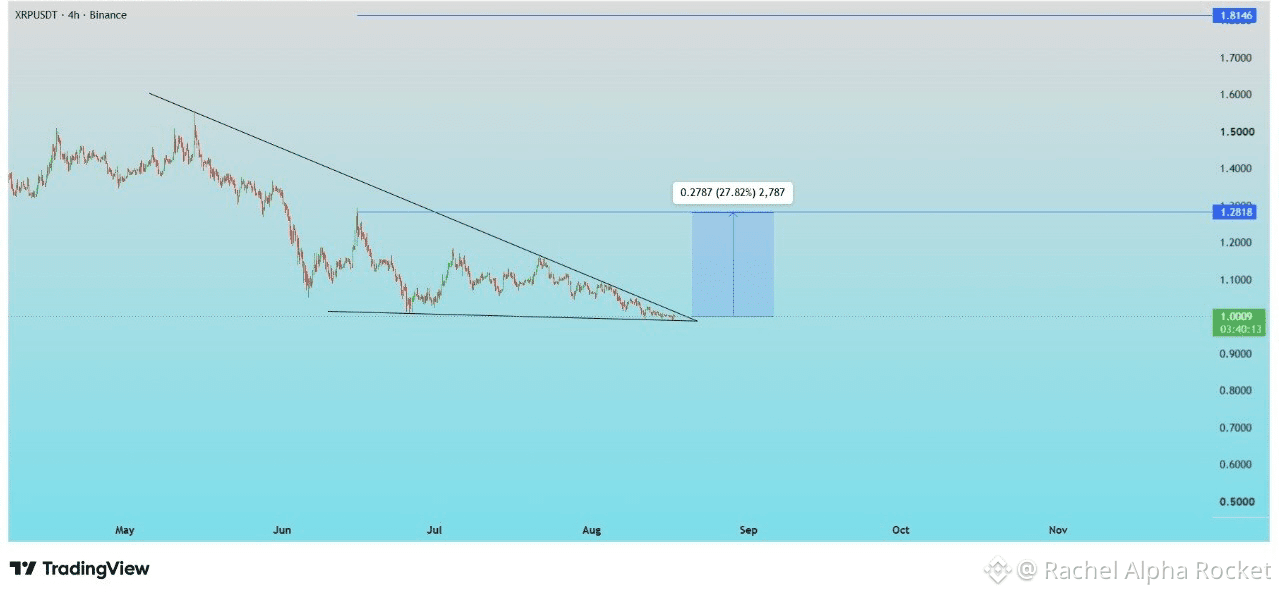
$XRP looks like it’s approaching a key decision point on the 4H. 👀
Price is compressing between a descending trendline and the ~$1.00 support area.
A clean breakout could put $1.28 in focus, with the chart showing a potential move of around 27%.
Not a prediction—just a setup worth watching. 📊
#xrp #XRPArmy
Price is compressing between a descending trendline and the ~$1.00 support area.
A clean breakout could put $1.28 in focus, with the chart showing a potential move of around 27%.
Not a prediction—just a setup worth watching. 📊
#xrp #XRPArmy
3
171
·
--
🚨 BREAKING: 🇺🇸 US CPI comes in at 3.4%, exactly matching expectations.
📉 Inflation hits its lowest level in 4 months.
The pressure is cooling… now all eyes are on the Fed. 👀🔥
Please follow me guys
🚨 BREAKING: 🇺🇸 US CPI comes in at 3.4%, exactly matching expectations.
📉 Inflation hits its lowest level in 4 months.
The pressure is cooling… now all eyes are on the Fed. 👀🔥
Please follow me guys
📉 Inflation hits its lowest level in 4 months.
The pressure is cooling… now all eyes are on the Fed. 👀🔥
Please follow me guys

1
112
·
--
Bullish
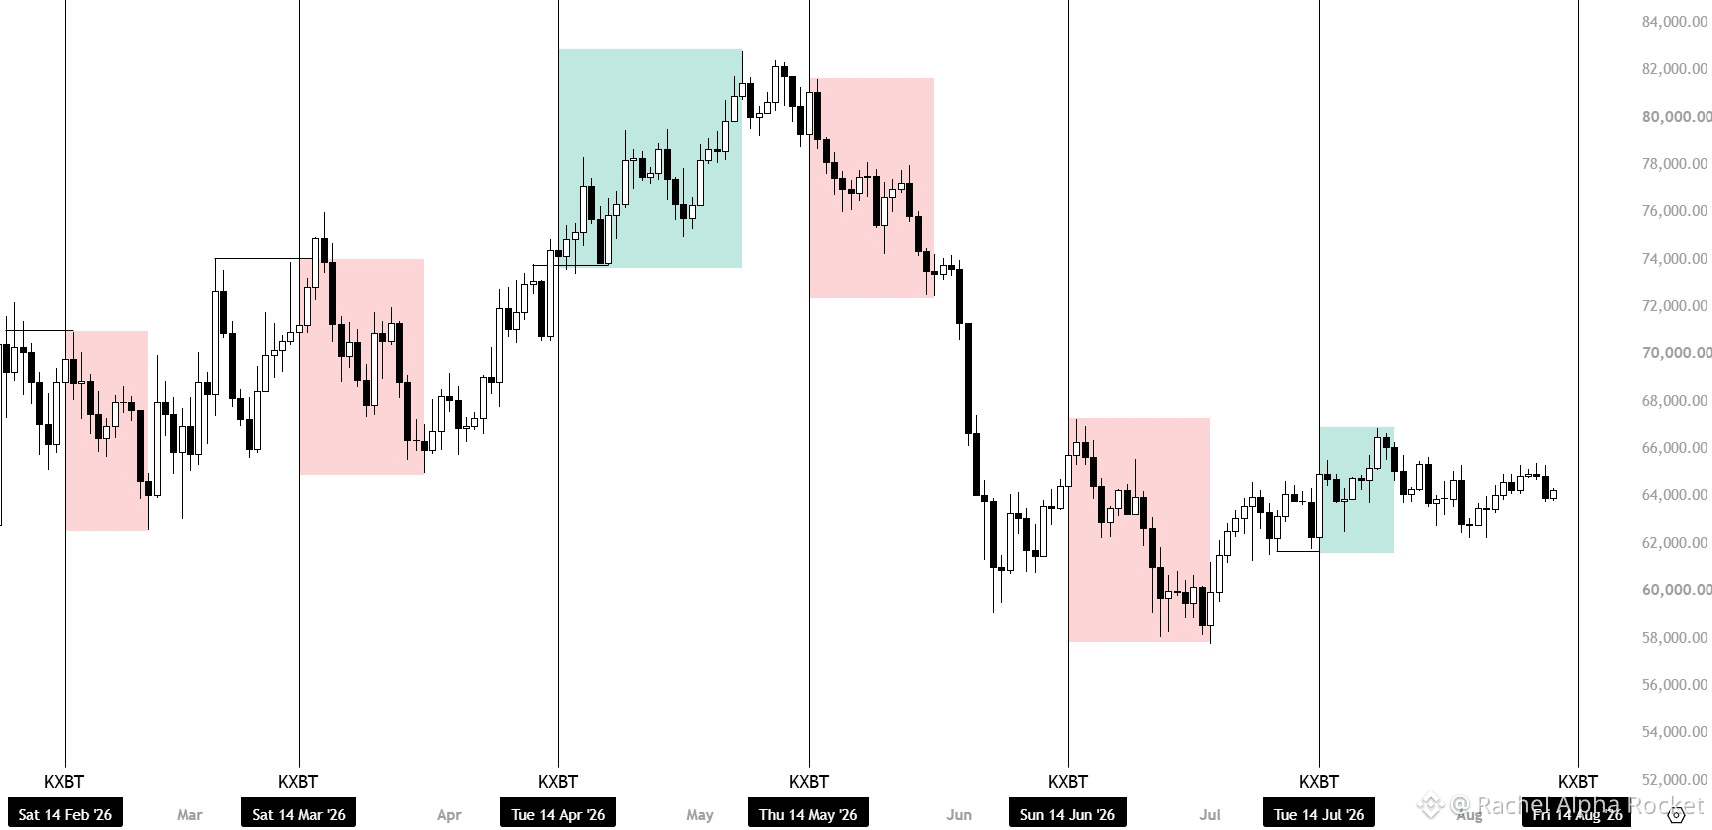
$BTC is showing a clear cycle of expansion → correction → consolidation.
The current range around $62K–$67K is the key zone to watch. A clean breakout above resistance could open the door for the next leg higher, while losing support would keep BTC range-bou
{spot}(BTCUSDT)
$BTC is showing a clear cycle of expansion → correction → consolidation.
The current range around $62K–$67K is the key zone to watch. A clean breakout above resistance could open the door for the next leg higher, while losing support would keep BTC range-bou
The current range around $62K–$67K is the key zone to watch. A clean breakout above resistance could open the door for the next leg higher, while losing support would keep BTC range-bou
1
114
·
--
🔥
🔥


X mucaN
·
--
My friend wants to buy $BTC worth $5,000 below $60,000 and $ETH worth $5,000 below $1,700, and he is afraid, and I just told him a simple truth!
Get in class, let us discuss
There are only a few #altcoins in this market that I will tell you can survive the next 5 years, which will be intense. Bitcoin and Ethereum are part of them, and even if Bitcoin goes below $40,000 and you bought at $60,000, you just need to be patient for real, you will surely make money, we will see Bitcoin trading at $200,000, the only thing is that we don’t know when. And don’t forget that there are only 21M Bitcoin, very soon, everyone on earth will want to own a piece of Bitcoin, and by that time, $200,000 per bitcoin will be nothing compared to the current price.
If you are buying Bitcoin below $65,000, you are doing the right thing and you will be profitable.
1
124
·
--
Bullish
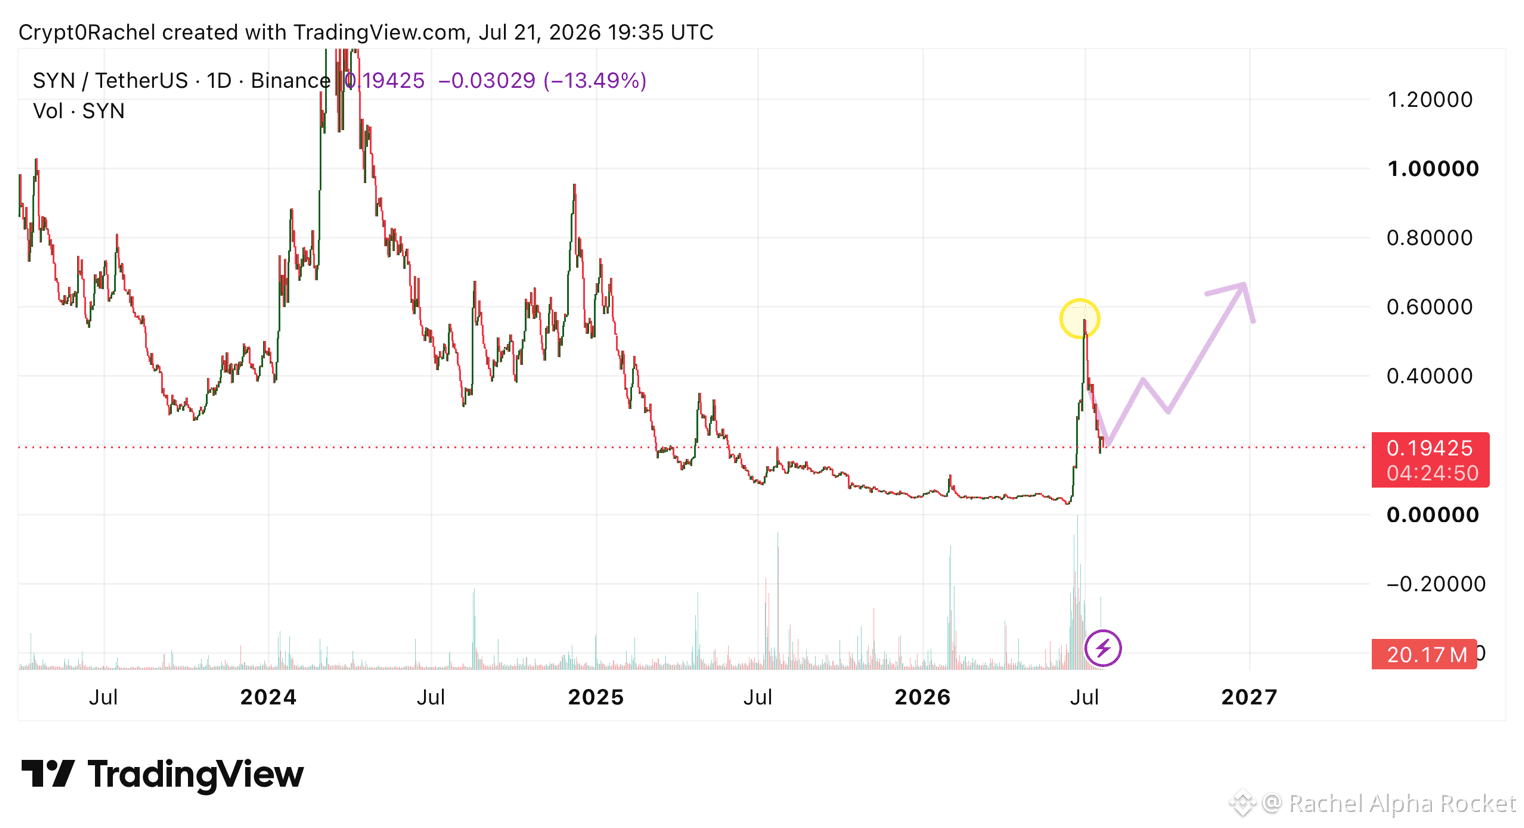
$SYN is showing exactly what you want to see after a major breakout.
A sharp impulse move followed by a healthy cooldown often resets momentum and shakes out weak hands.
If this support holds, a move back toward $0.40 could open the door for a test of the $0.60 region.
I’m viewing this as consolidation, not the end of the trend. The risk/reward continues to look attractive for patient investors.
Bullish on $SYN 🚀
1
196
·
--
Bullish
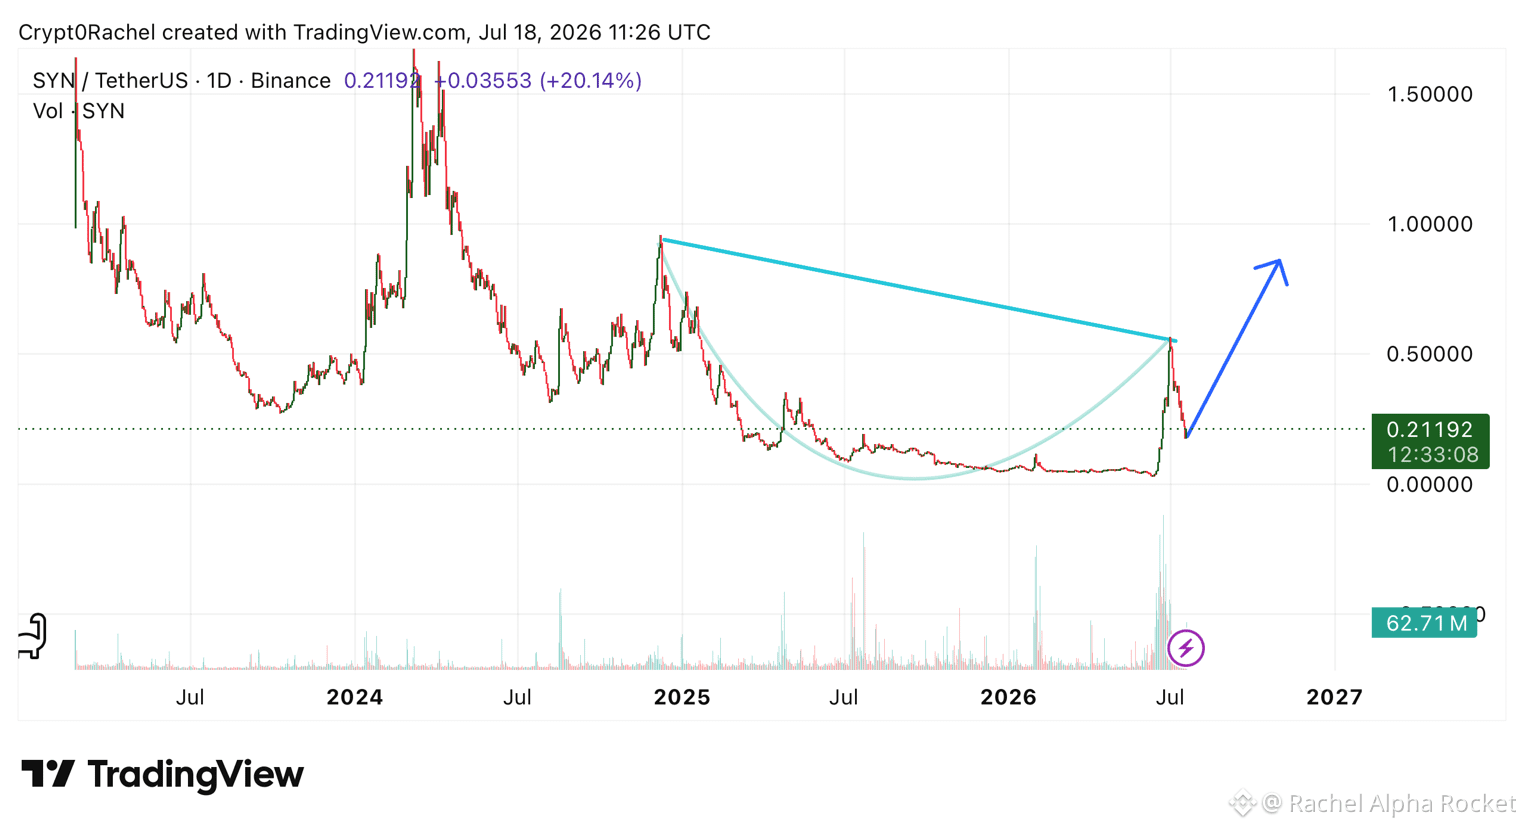
$SYN looks ready for its next major move. 👀
Massive breakout ✅
Healthy retest ✅
Higher lows loading ✅
This is exactly how strong trends reset before continuation. If momentum returns, I wouldn’t be surprised to see $SYN make a run toward new local highs.
$SYN Summer is just getting started.
#writetoearn
Massive breakout ✅
Healthy retest ✅
Higher lows loading ✅
This is exactly how strong trends reset before continuation. If momentum returns, I wouldn’t be surprised to see $SYN make a run toward new local highs.
$SYN Summer is just getting started.
#writetoearn
3
232
·
--
Bullish
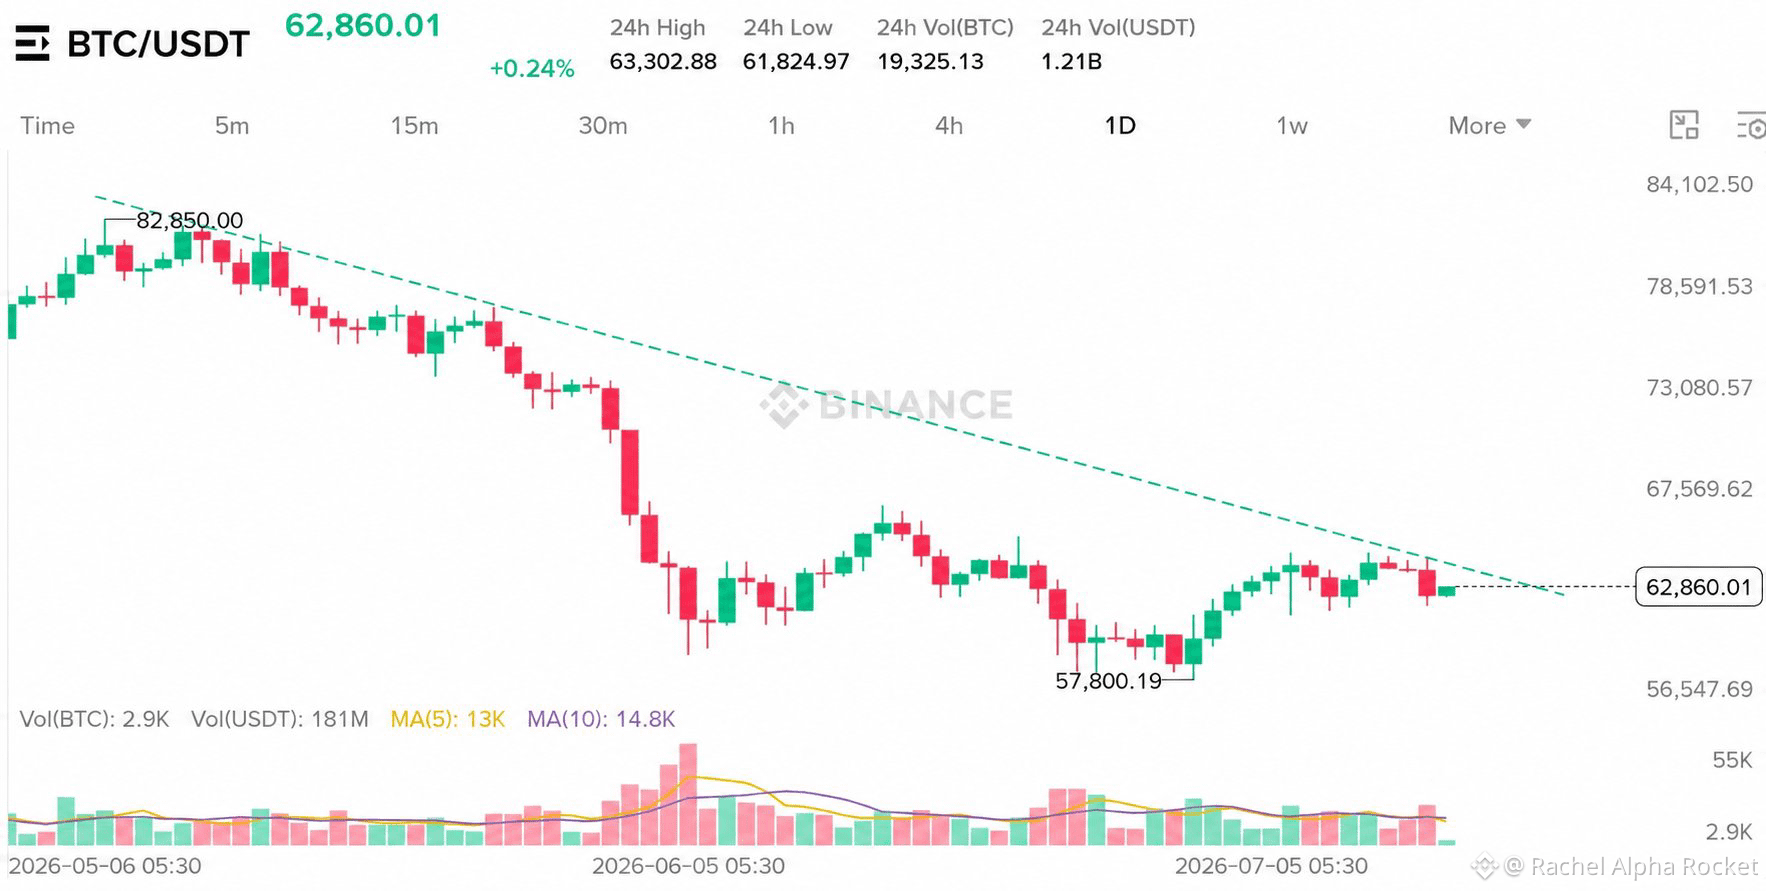
BTC is approaching a major decision point. 👀
Price continues to respect the descending trendline that has capped every relief rally since the local high around $82.8K.
Bulls need a decisive breakout and daily close above this trendline to shift momentum and open the door for a stronger recovery.
Until then, this remains a market to trade with patience rather than emotion. A rejection here could send BTC back to retest lower support, while a confirmed breakout may mark the start of the next leg higher.
Keep this trendline on your watchlist. It could define Bitcoin’s next major move.
#BTC #bitcoin #BinanceSquare
1
145
·
--
I was on the sidelines, but you made a compelling case to jump right into the Newton ecosystem. Great post!
I was on the sidelines, but you made a compelling case to jump right into the Newton ecosystem. Great post!
165
·
--
Guardrails reduce the blast radius when unexpected behavior occurs.
Guardrails reduce the blast radius when unexpected behavior occurs.
1
125
Log in to explore more content
Join global crypto users on Binance Square
⚡️ Get latest and useful information about crypto.
💬 Trusted by the world’s largest crypto exchange.
👍 Discover real insights from verified creators.
Email / Phone number
Trending Topics
UniswapA16zSeekDeFiExemptionFromIllinoisCryptoTax
38,832 views
896 Discussing
#CryptoTax 🚨 CRYPTO MARKET & REGULATORY UPDATE #HKDollarStablecoinHKDAPToLaunchOnSolana
#uniswapa16zseekdefiexemptionfromillinoiscryptotax UNISWAP, a16z & DeFi Education Fund Challenge Illinois Crypto Tax Rules
October 30, 2026 | Market Volatility & Industry Developments
📊 1. MARKET SNAPSHOT
Crypto markets are showing mixed signals, with selected assets posting sharp gains while several major cryptocurrencies remain under pressure.
📈 Top reported gainers
SOPH: +60.81% — $0.00238
BEAMX: +37.94% — $0.004701
SKDDB: +16.81% — $9.38
📉 Notable reported losers
INTWUSDT: −61.09% — $6.72
AKEUSDT: −31.47% — $0.013989
SNXXUSDT: −30.71% — $6.43
🔎 Major crypto assets under pressure
DOGE: −5.06%
PEPE: −4.91%
SUI: −4.83%
NEAR: −3.28%
XRP: −3.13%
Uniswap Labs, Andreessen Horowitz (a16z), and the DeFi Education Fund (DEF) are pushing for exemptions from Illinois’
#Uniswap #a16z #DeFi #CryptoRegulation #Illinois # #Web3 #BinanceSquare
#HKDollarStablecoinHKDAPToLaunchOnSolana #HKDAP #Stablecoin #CryptoNews #Blockchain #DeFi #DigitalPayments
⚖️ 3. UNISWAP, a16z & ILLINOIS CRYPTO TAX RULES
Uniswap Labs, Andreessen Horowitz (a16z), and the DeFi Education Fund are associated with efforts to seek exemptions proposed Illinois crypto tax requirements.
The debate highlights a key question: How should tax-reporting obligations apply to decentralized that may not operate like traditional financial intermediaries?
The outcome could influence DeFi compliance, developer obligations, and the future regulatory environment.
#BinanceSquare #CryptoNews #HKDAP #Stablecoin #Uniswap #a16z #DeFi #CryptoTax
CHASEPA SULUXù
·2 Likes
·404 views
HKDollarStablecoinHKDAPToLaunchOnSolana
27,915 views
579 Discussing
$1.5BInLeveragedCryptoBetsLiquidated
57,424 views
270 Discussing