
火星Trader
430 Posts

火星Trader
Report
Block User
美股交易分享
26 Following
710 Followers
383 Liked
Posts
All
Quotes
Live
·
--
Reading the Fed minutes in the early hours: How many others were behind the two rate-hike votes?
People in the community are discussing whether the Fed will raise rates by 50 basis points. The minutes being released at 3 a.m. tomorrow are from the meeting held in late October. At that meeting, the committee voted 10–2 to keep rates at 3.75% to 4%, with both dissenting voters arguing for a 25-basis-point hike.
What’s worth looking for in the minutes is how widespread support was for further tightening. If they only clarify the reasons behind the two dissenting votes, there won’t be much new information. If more participants also favored raising rates if inflation proved persistent, then the divisions over the December decision will be worth revisiting.
The core CPI released after the meeting rose 0.3% month over month in October, the same as in the previous two months. This data came out only after that meeting. When the December decision is announced, we’ll see whether the data released since the meeting changed the committee’s thinking.
#美联储 #FOMC
Reading the Fed minutes in the early hours: How many others were behind the two rate-hike votes?
People in the community are discussing whether the Fed will raise rates by 50 basis points. The minutes being released at 3 a.m. tomorrow are from the meeting held in late October. At that meeting, the committee voted 10–2 to keep rates at 3.75% to 4%, with both dissenting voters arguing for a 25-basis-point hike.
What’s worth looking for in the minutes is how widespread support was for further tightening. If they only clarify the reasons behind the two dissenting votes, there won’t be much new information. If more participants also favored raising rates if inflation proved persistent, then the divisions over the December decision will be worth revisiting.
The core CPI released after the meeting rose 0.3% month over month in October, the same as in the previous two months. This data came out only after that meeting. When the December decision is announced, we’ll see whether the data released since the meeting changed the committee’s thinking.
#美联储 #FOMC
People in the community are discussing whether the Fed will raise rates by 50 basis points. The minutes being released at 3 a.m. tomorrow are from the meeting held in late October. At that meeting, the committee voted 10–2 to keep rates at 3.75% to 4%, with both dissenting voters arguing for a 25-basis-point hike.
What’s worth looking for in the minutes is how widespread support was for further tightening. If they only clarify the reasons behind the two dissenting votes, there won’t be much new information. If more participants also favored raising rates if inflation proved persistent, then the divisions over the December decision will be worth revisiting.
The core CPI released after the meeting rose 0.3% month over month in October, the same as in the previous two months. This data came out only after that meeting. When the December decision is announced, we’ll see whether the data released since the meeting changed the committee’s thinking.
#美联储 #FOMC

85
·
--
Verified
Can an on-chain subscription to Anthropic break even if it rises 5% on listing?
Anthropic (ANT) has yet to list, and its prospectus gives an indicative price range of $70 to $78. Binance Wallet will open token subscriptions at 2 p.m. today, with the same indicative price range of $70 to $78, plus a 5% service fee charged by the partner.
With the 5% fee added to the allocation price, a price of 78 USDC means a cost of 81.90 USDC. Assuming 1 USDC is roughly equal to $1, even if the stock rises 5% on its first day, the on-chain token would only reach its theoretical break-even point. That assumes the token can actually be sold at the same price as the stock once it is distributed.
The easiest thing to overlook here is timing. The announcement says token distribution will take place no earlier than two hours after the Nasdaq opens, but the exact timing has not yet been confirmed. How long the opening premium lasts remains to be seen once the token becomes tradable. Only then can you compare the price you can actually get for the token with your total cost, including fees, and work out whether the trade makes sense.
#美股 #Anthropic
Can an on-chain subscription to Anthropic break even if it rises 5% on listing?
Anthropic (ANT) has yet to list, and its prospectus gives an indicative price range of $70 to $78. Binance Wallet will open token subscriptions at 2 p.m. today, with the same indicative price range of $70 to $78, plus a 5% service fee charged by the partner.
With the 5% fee added to the allocation price, a price of 78 USDC means a cost of 81.90 USDC. Assuming 1 USDC is roughly equal to $1, even if the stock rises 5% on its first day, the on-chain token would only reach its theoretical break-even point. That assumes the token can actually be sold at the same price as the stock once it is distributed.
The easiest thing to overlook here is timing. The announcement says token distribution will take place no earlier than two hours after the Nasdaq opens, but the exact timing has not yet been confirmed. How long the opening premium lasts remains to be seen once the token becomes tradable. Only then can you compare the price you can actually get for the token with your total cost, including fees, and work out whether the trade makes sense.
#美股 #Anthropic
Anthropic (ANT) has yet to list, and its prospectus gives an indicative price range of $70 to $78. Binance Wallet will open token subscriptions at 2 p.m. today, with the same indicative price range of $70 to $78, plus a 5% service fee charged by the partner.
With the 5% fee added to the allocation price, a price of 78 USDC means a cost of 81.90 USDC. Assuming 1 USDC is roughly equal to $1, even if the stock rises 5% on its first day, the on-chain token would only reach its theoretical break-even point. That assumes the token can actually be sold at the same price as the stock once it is distributed.
The easiest thing to overlook here is timing. The announcement says token distribution will take place no earlier than two hours after the Nasdaq opens, but the exact timing has not yet been confirmed. How long the opening premium lasts remains to be seen once the token becomes tradable. Only then can you compare the price you can actually get for the token with your total cost, including fees, and work out whether the trade makes sense.
#美股 #Anthropic

1
1.5k
·
--
ICE Invests in Trade[XYZ] as Perpetual Futures Start Competing for Traditional Market Customers
NYSE parent ICE is preparing to bring a Hyperliquid-based perpetual futures market into the U.S. regulatory framework.
In an agreement announced yesterday, ICE will make a strategic minority investment in Trade[XYZ]. The two sides plan to build a standalone retail market and clearing structure. Regulatory approval is still required, and trading has not officially opened.
The most interesting thing about this partnership is the change in customers. More than 99% of ICE’s current participants are institutions, while the proposed new market is explicitly aimed at retail customers. Trade[XYZ]’s existing experience with on-chain products could be combined with ICE’s market operations, clearing, and traditional broker channels. Planned distribution also includes the joint venture between ICE and OKX.
If perpetual futures can reach stock, commodity, and foreign exchange traders through these channels, the competitive landscape will broaden. The customers they are seeking aren’t just people switching between crypto platforms to trade.
However, ICE is investing in Trade[XYZ], and the announcement did not disclose the investment amount. There is still a long way to go before this investment can be counted as future revenue for HYPE. The agreement does not confirm whether the proposed market will be approved, how much trading it will actually generate, or how that trading would translate into token value.
I’d rather see this as a step toward taking the product to a larger market. The direction is clear, but the business still needs to be built.
ICE Invests in Trade[XYZ] as Perpetual Futures Start Competing for Traditional Market Customers
NYSE parent ICE is preparing to bring a Hyperliquid-based perpetual futures market into the U.S. regulatory framework.
In an agreement announced yesterday, ICE will make a strategic minority investment in Trade[XYZ]. The two sides plan to build a standalone retail market and clearing structure. Regulatory approval is still required, and trading has not officially opened.
The most interesting thing about this partnership is the change in customers. More than 99% of ICE’s current participants are institutions, while the proposed new market is explicitly aimed at retail customers. Trade[XYZ]’s existing experience with on-chain products could be combined with ICE’s market operations, clearing, and traditional broker channels. Planned distribution also includes the joint venture between ICE and OKX.
If perpetual futures can reach stock, commodity, and foreign exchange traders through these channels, the competitive landscape will broaden. The customers they are seeking aren’t just people switching between crypto platforms to trade.
However, ICE is investing in Trade[XYZ], and the announcement did not disclose the investment amount. There is still a long way to go before this investment can be counted as future revenue for HYPE. The agreement does not confirm whether the proposed market will be approved, how much trading it will actually generate, or how that trading would translate into token value.
I’d rather see this as a step toward taking the product to a larger market. The direction is clear, but the business still needs to be built.
NYSE parent ICE is preparing to bring a Hyperliquid-based perpetual futures market into the U.S. regulatory framework.
In an agreement announced yesterday, ICE will make a strategic minority investment in Trade[XYZ]. The two sides plan to build a standalone retail market and clearing structure. Regulatory approval is still required, and trading has not officially opened.
The most interesting thing about this partnership is the change in customers. More than 99% of ICE’s current participants are institutions, while the proposed new market is explicitly aimed at retail customers. Trade[XYZ]’s existing experience with on-chain products could be combined with ICE’s market operations, clearing, and traditional broker channels. Planned distribution also includes the joint venture between ICE and OKX.
If perpetual futures can reach stock, commodity, and foreign exchange traders through these channels, the competitive landscape will broaden. The customers they are seeking aren’t just people switching between crypto platforms to trade.
However, ICE is investing in Trade[XYZ], and the announcement did not disclose the investment amount. There is still a long way to go before this investment can be counted as future revenue for HYPE. The agreement does not confirm whether the proposed market will be approved, how much trading it will actually generate, or how that trading would translate into token value.
I’d rather see this as a step toward taking the product to a larger market. The direction is clear, but the business still needs to be built.

HYPE-1.30%
ICEUS-0.44%
2
135
·
--
SanDisk is set to grow again next quarter, and high margins aren’t going away yet
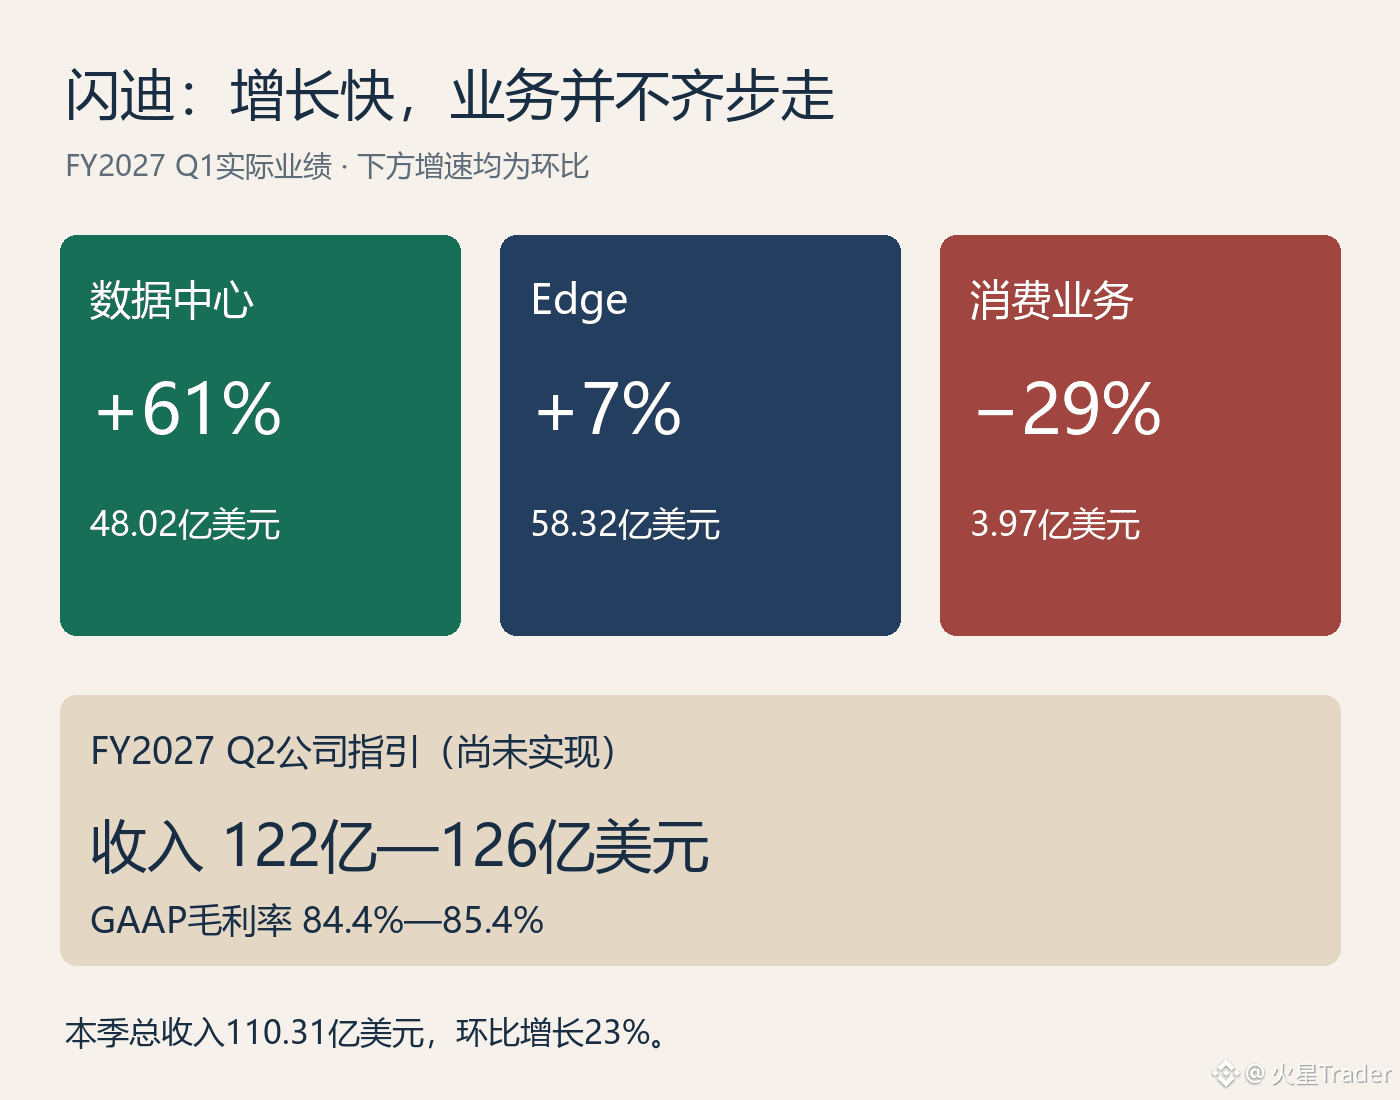
In SanDisk’s earnings report, consumer revenue fell 29% quarter over quarter, but it wasn’t enough to slow the company’s overall growth.
The reason is straightforward: consumer revenue was just $397 million this quarter, while data center revenue had already reached $4.802 billion, up 61% quarter over quarter. Company-wide revenue was $11.031 billion, up 23% from the previous quarter. Focusing only on the decline in consumer revenue means missing the business that’s really driving the results.
The company guided to revenue of $12.2 billion to $12.6 billion next quarter, with a GAAP gross margin of 84.4% to 85.4%. Gross margin was 85% this quarter, and the company did not signal that its high margins are about to fade.
That leaves me still broadly positive on SanDisk’s operating performance. Data center growth has reached scale, and next quarter’s revenue guidance points higher still. Weakness in consumer demand is real, but it’s not yet enough to conclude that SanDisk’s growth is about to turn around.
There was one dip in cash flow: operating cash flow was $6.363 billion this quarter, down from $7.126 billion last quarter. This change needs to be explained over the next few quarters; a one-quarter decline alone isn’t enough to suggest there’s a problem with collections.
The company also announced an eight-for-one stock split, with split-adjusted trading expected to begin on the 20th of next month. A split can change the share price, but not the value of the business. The weight of this earnings report still lies in data center revenue and the high gross margin forecast for next quarter.
SanDisk is set to grow again next quarter, and high margins aren’t going away yet
In SanDisk’s earnings report, consumer revenue fell 29% quarter over quarter, but it wasn’t enough to slow the company’s overall growth.
The reason is straightforward: consumer revenue was just $397 million this quarter, while data center revenue had already reached $4.802 billion, up 61% quarter over quarter. Company-wide revenue was $11.031 billion, up 23% from the previous quarter. Focusing only on the decline in consumer revenue means missing the business that’s really driving the results.
The company guided to revenue of $12.2 billion to $12.6 billion next quarter, with a GAAP gross margin of 84.4% to 85.4%. Gross margin was 85% this quarter, and the company did not signal that its high margins are about to fade.
That leaves me still broadly positive on SanDisk’s operating performance. Data center growth has reached scale, and next quarter’s revenue guidance points higher still. Weakness in consumer demand is real, but it’s not yet enough to conclude that SanDisk’s growth is about to turn around.
There was one dip in cash flow: operating cash flow was $6.363 billion this quarter, down from $7.126 billion last quarter. This change needs to be explained over the next few quarters; a one-quarter decline alone isn’t enough to suggest there’s a problem with collections.
The company also announced an eight-for-one stock split, with split-adjusted trading expected to begin on the 20th of next month. A split can change the share price, but not the value of the business. The weight of this earnings report still lies in data center revenue and the high gross margin forecast for next quarter.
In SanDisk’s earnings report, consumer revenue fell 29% quarter over quarter, but it wasn’t enough to slow the company’s overall growth.
The reason is straightforward: consumer revenue was just $397 million this quarter, while data center revenue had already reached $4.802 billion, up 61% quarter over quarter. Company-wide revenue was $11.031 billion, up 23% from the previous quarter. Focusing only on the decline in consumer revenue means missing the business that’s really driving the results.
The company guided to revenue of $12.2 billion to $12.6 billion next quarter, with a GAAP gross margin of 84.4% to 85.4%. Gross margin was 85% this quarter, and the company did not signal that its high margins are about to fade.
That leaves me still broadly positive on SanDisk’s operating performance. Data center growth has reached scale, and next quarter’s revenue guidance points higher still. Weakness in consumer demand is real, but it’s not yet enough to conclude that SanDisk’s growth is about to turn around.
There was one dip in cash flow: operating cash flow was $6.363 billion this quarter, down from $7.126 billion last quarter. This change needs to be explained over the next few quarters; a one-quarter decline alone isn’t enough to suggest there’s a problem with collections.
The company also announced an eight-for-one stock split, with split-adjusted trading expected to begin on the 20th of next month. A split can change the share price, but not the value of the business. The weight of this earnings report still lies in data center revenue and the high gross margin forecast for next quarter.
164
·
--
Data center revenue surged, but Intel gave weaker guidance for next quarter
The hardest part to digest in Intel’s earnings report, released early this morning, was its guidance for next quarter.
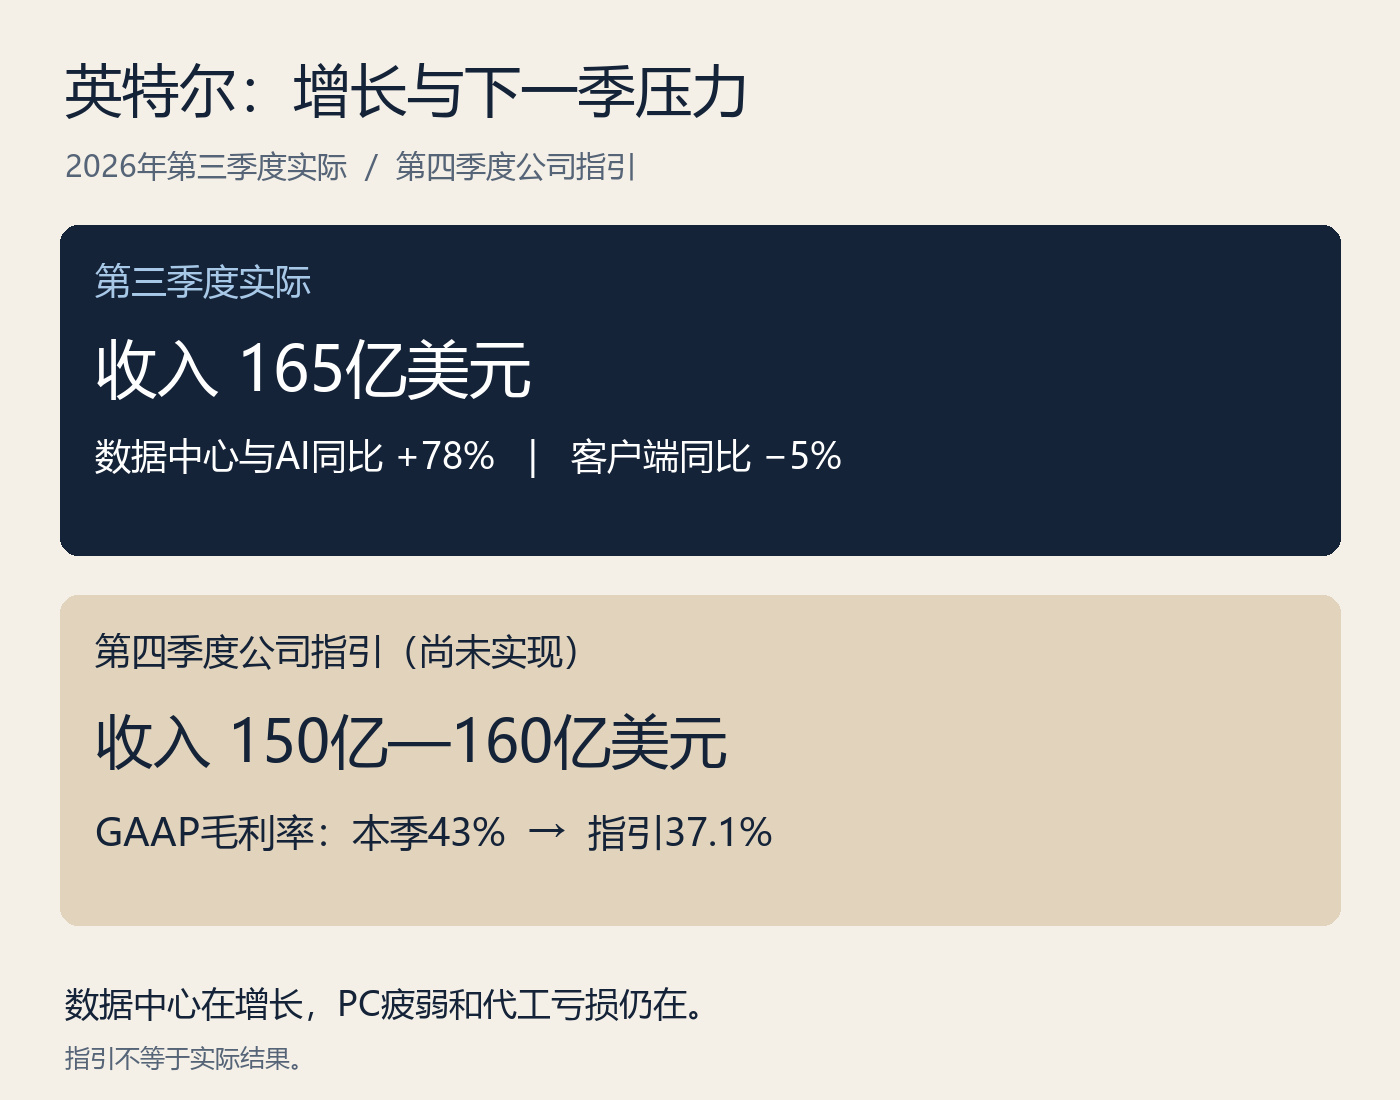
Revenue from Data Center and AI rose 78% year over year, while total company revenue grew 21% this quarter. But for the fourth quarter, the company expects revenue of just $15 billion to $16 billion—below even the high end of this quarter’s $16.5 billion. It expects a GAAP gross margin of 37.1%, down from 43% this quarter.
Why did the company give a weaker outlook even as revenue from Data Center and AI surged?
The PC business has yet to recover. Revenue from Client Computing and Physical AI fell 5% year over year, and management expects the PC slowdown to continue at least through the first half of next year. The foundry business is still consuming cash, too, with an operating loss of about $1.85 billion this quarter.
Growth in Data Center and AI is already showing up in the results, but it’s not enough to get Intel out of the woods. Server supply needs to increase, the PC market needs demand to recover, and the foundry business needs continued investment. A 78% growth rate alone can’t solve all of these challenges.
This guidance makes me more cautious about the pace of Intel’s recovery. The company’s outlook for next quarter puts both revenue and gross margin below this quarter’s levels. Management’s comments about demand for Xeon are worth taking seriously, but it’s still too early to extrapolate from this quarter’s growth rate to the company’s overall earnings.
Data center revenue surged, but Intel gave weaker guidance for next quarter
The hardest part to digest in Intel’s earnings report, released early this morning, was its guidance for next quarter.
Revenue from Data Center and AI rose 78% year over year, while total company revenue grew 21% this quarter. But for the fourth quarter, the company expects revenue of just $15 billion to $16 billion—below even the high end of this quarter’s $16.5 billion. It expects a GAAP gross margin of 37.1%, down from 43% this quarter.
Why did the company give a weaker outlook even as revenue from Data Center and AI surged?
The PC business has yet to recover. Revenue from Client Computing and Physical AI fell 5% year over year, and management expects the PC slowdown to continue at least through the first half of next year. The foundry business is still consuming cash, too, with an operating loss of about $1.85 billion this quarter.
Growth in Data Center and AI is already showing up in the results, but it’s not enough to get Intel out of the woods. Server supply needs to increase, the PC market needs demand to recover, and the foundry business needs continued investment. A 78% growth rate alone can’t solve all of these challenges.
This guidance makes me more cautious about the pace of Intel’s recovery. The company’s outlook for next quarter puts both revenue and gross margin below this quarter’s levels. Management’s comments about demand for Xeon are worth taking seriously, but it’s still too early to extrapolate from this quarter’s growth rate to the company’s overall earnings.
The hardest part to digest in Intel’s earnings report, released early this morning, was its guidance for next quarter.
Revenue from Data Center and AI rose 78% year over year, while total company revenue grew 21% this quarter. But for the fourth quarter, the company expects revenue of just $15 billion to $16 billion—below even the high end of this quarter’s $16.5 billion. It expects a GAAP gross margin of 37.1%, down from 43% this quarter.
Why did the company give a weaker outlook even as revenue from Data Center and AI surged?
The PC business has yet to recover. Revenue from Client Computing and Physical AI fell 5% year over year, and management expects the PC slowdown to continue at least through the first half of next year. The foundry business is still consuming cash, too, with an operating loss of about $1.85 billion this quarter.
Growth in Data Center and AI is already showing up in the results, but it’s not enough to get Intel out of the woods. Server supply needs to increase, the PC market needs demand to recover, and the foundry business needs continued investment. A 78% growth rate alone can’t solve all of these challenges.
This guidance makes me more cautious about the pace of Intel’s recovery. The company’s outlook for next quarter puts both revenue and gross margin below this quarter’s levels. Management’s comments about demand for Xeon are worth taking seriously, but it’s still too early to extrapolate from this quarter’s growth rate to the company’s overall earnings.
191
·
--
Verified
This growth at Caterpillar cannot be attributed only to power-generation equipment
Caterpillar’s earnings report today is worth shifting our gaze a little beyond power-generation equipment. Electricity demand is an important clue, but the valuation implications are different when multiple businesses improve at the same time versus when a single business is doing the lifting.
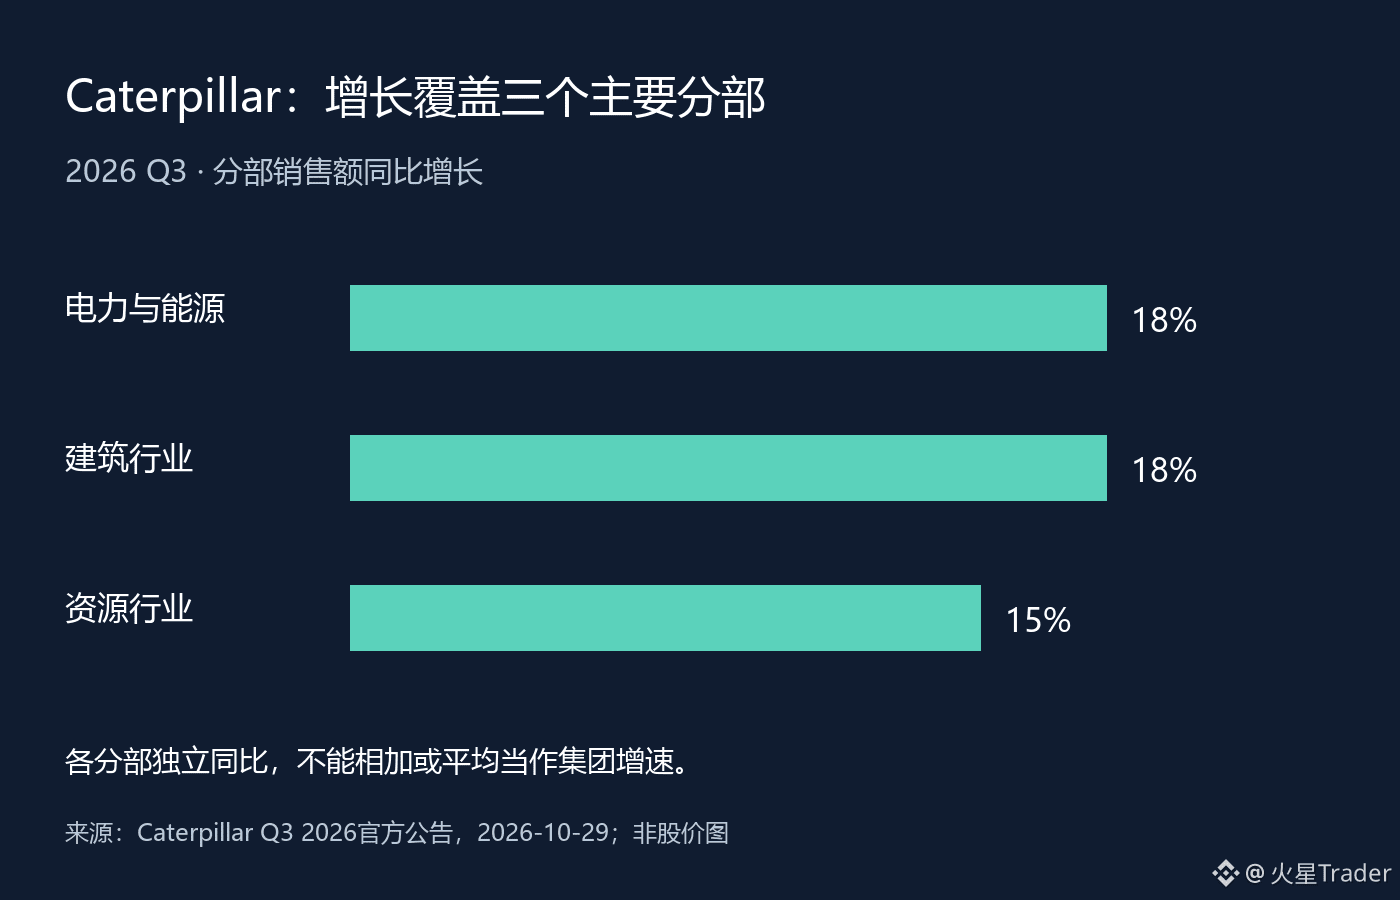
In the third quarter of 2026, sales in the Power & Energy segment rose 18% year over year, Construction Industries also rose 18%, and Resource Industries rose 15%. The company also disclosed that overall sales growth was mainly driven by increased equipment sales to end users. At least from this announcement, the breadth of growth extended beyond a single power-related segment.
But the percentages for the three segments cannot be added directly or simply averaged to replace the group’s growth rate. Segment sizes differ, and internal sales also involve consolidation offsets; the chart compares each segment’s year-over-year change, not the contribution of each to company-wide growth. Likewise, improved equipment deliveries do not mean the same pace can be maintained every quarter going forward.
I am more inclined to see this as evidence of broad demand, and then to ask about sustainability. Construction equipment, resource equipment, and power and energy equipment all face different customer budgets and purchasing cycles. If we use only one popular narrative to explain all orders, we may overlook a market that has already weakened, or mistake concentrated project deliveries for stable expansion.
For a company like this, sales and subsequent orders need to be viewed together. Strong orders mean customers intend to buy; smooth deliveries gradually turn that into revenue; collections and profits keeping up further reflect the quality of growth. No one link can automatically be replaced by another metric. Right now, I would not draw the conclusion of a full global industrial-cycle reversal based on just one quarter.
What is most worth verifying next is whether the three major segments can continue to be supported by broad demand, and whether sales growth can leave profits after cost changes. If only one segment remains strong while the other two begin to soften, the concentration of growth needs to be reassessed; if breadth continues and turns into cash, there is a stronger case for improving the judgment on sustainability.
The data are for the third quarter of 2026; the announcement was on 2026-10-29 and verified that day. The chart is an original rendering of official year-over-year segment data, not an order or stock price chart.
Source: https://investors.caterpillar.com/news/news-details/2026/Caterpillar-Reports-Third-Quarter-2026-Results/default.aspx
This growth at Caterpillar cannot be attributed only to power-generation equipment
Caterpillar’s earnings report today is worth shifting our gaze a little beyond power-generation equipment. Electricity demand is an important clue, but the valuation implications are different when multiple businesses improve at the same time versus when a single business is doing the lifting.
In the third quarter of 2026, sales in the Power & Energy segment rose 18% year over year, Construction Industries also rose 18%, and Resource Industries rose 15%. The company also disclosed that overall sales growth was mainly driven by increased equipment sales to end users. At least from this announcement, the breadth of growth extended beyond a single power-related segment.
But the percentages for the three segments cannot be added directly or simply averaged to replace the group’s growth rate. Segment sizes differ, and internal sales also involve consolidation offsets; the chart compares each segment’s year-over-year change, not the contribution of each to company-wide growth. Likewise, improved equipment deliveries do not mean the same pace can be maintained every quarter going forward.
I am more inclined to see this as evidence of broad demand, and then to ask about sustainability. Construction equipment, resource equipment, and power and energy equipment all face different customer budgets and purchasing cycles. If we use only one popular narrative to explain all orders, we may overlook a market that has already weakened, or mistake concentrated project deliveries for stable expansion.
For a company like this, sales and subsequent orders need to be viewed together. Strong orders mean customers intend to buy; smooth deliveries gradually turn that into revenue; collections and profits keeping up further reflect the quality of growth. No one link can automatically be replaced by another metric. Right now, I would not draw the conclusion of a full global industrial-cycle reversal based on just one quarter.
What is most worth verifying next is whether the three major segments can continue to be supported by broad demand, and whether sales growth can leave profits after cost changes. If only one segment remains strong while the other two begin to soften, the concentration of growth needs to be reassessed; if breadth continues and turns into cash, there is a stronger case for improving the judgment on sustainability.
The data are for the third quarter of 2026; the announcement was on 2026-10-29 and verified that day. The chart is an original rendering of official year-over-year segment data, not an order or stock price chart.
Source: https://investors.caterpillar.com/news/news-details/2026/Caterpillar-Reports-Third-Quarter-2026-Results/default.aspx
Caterpillar’s earnings report today is worth shifting our gaze a little beyond power-generation equipment. Electricity demand is an important clue, but the valuation implications are different when multiple businesses improve at the same time versus when a single business is doing the lifting.
In the third quarter of 2026, sales in the Power & Energy segment rose 18% year over year, Construction Industries also rose 18%, and Resource Industries rose 15%. The company also disclosed that overall sales growth was mainly driven by increased equipment sales to end users. At least from this announcement, the breadth of growth extended beyond a single power-related segment.
But the percentages for the three segments cannot be added directly or simply averaged to replace the group’s growth rate. Segment sizes differ, and internal sales also involve consolidation offsets; the chart compares each segment’s year-over-year change, not the contribution of each to company-wide growth. Likewise, improved equipment deliveries do not mean the same pace can be maintained every quarter going forward.
I am more inclined to see this as evidence of broad demand, and then to ask about sustainability. Construction equipment, resource equipment, and power and energy equipment all face different customer budgets and purchasing cycles. If we use only one popular narrative to explain all orders, we may overlook a market that has already weakened, or mistake concentrated project deliveries for stable expansion.
For a company like this, sales and subsequent orders need to be viewed together. Strong orders mean customers intend to buy; smooth deliveries gradually turn that into revenue; collections and profits keeping up further reflect the quality of growth. No one link can automatically be replaced by another metric. Right now, I would not draw the conclusion of a full global industrial-cycle reversal based on just one quarter.
What is most worth verifying next is whether the three major segments can continue to be supported by broad demand, and whether sales growth can leave profits after cost changes. If only one segment remains strong while the other two begin to soften, the concentration of growth needs to be reassessed; if breadth continues and turns into cash, there is a stronger case for improving the judgment on sustainability.
The data are for the third quarter of 2026; the announcement was on 2026-10-29 and verified that day. The chart is an original rendering of official year-over-year segment data, not an order or stock price chart.
Source: https://investors.caterpillar.com/news/news-details/2026/Caterpillar-Reports-Third-Quarter-2026-Results/default.aspx
81
·
--
UPS Revenue Rebounds; For Its Parcel Business, Start by Asking How Much Each Package Is Worth
Looking at UPS’s earnings report, I wouldn’t immediately equate the revenue rebound with a broad-based strengthening in logistics demand. Changes in revenue per package may explain this improvement better than total revenue—and deserve a closer look.
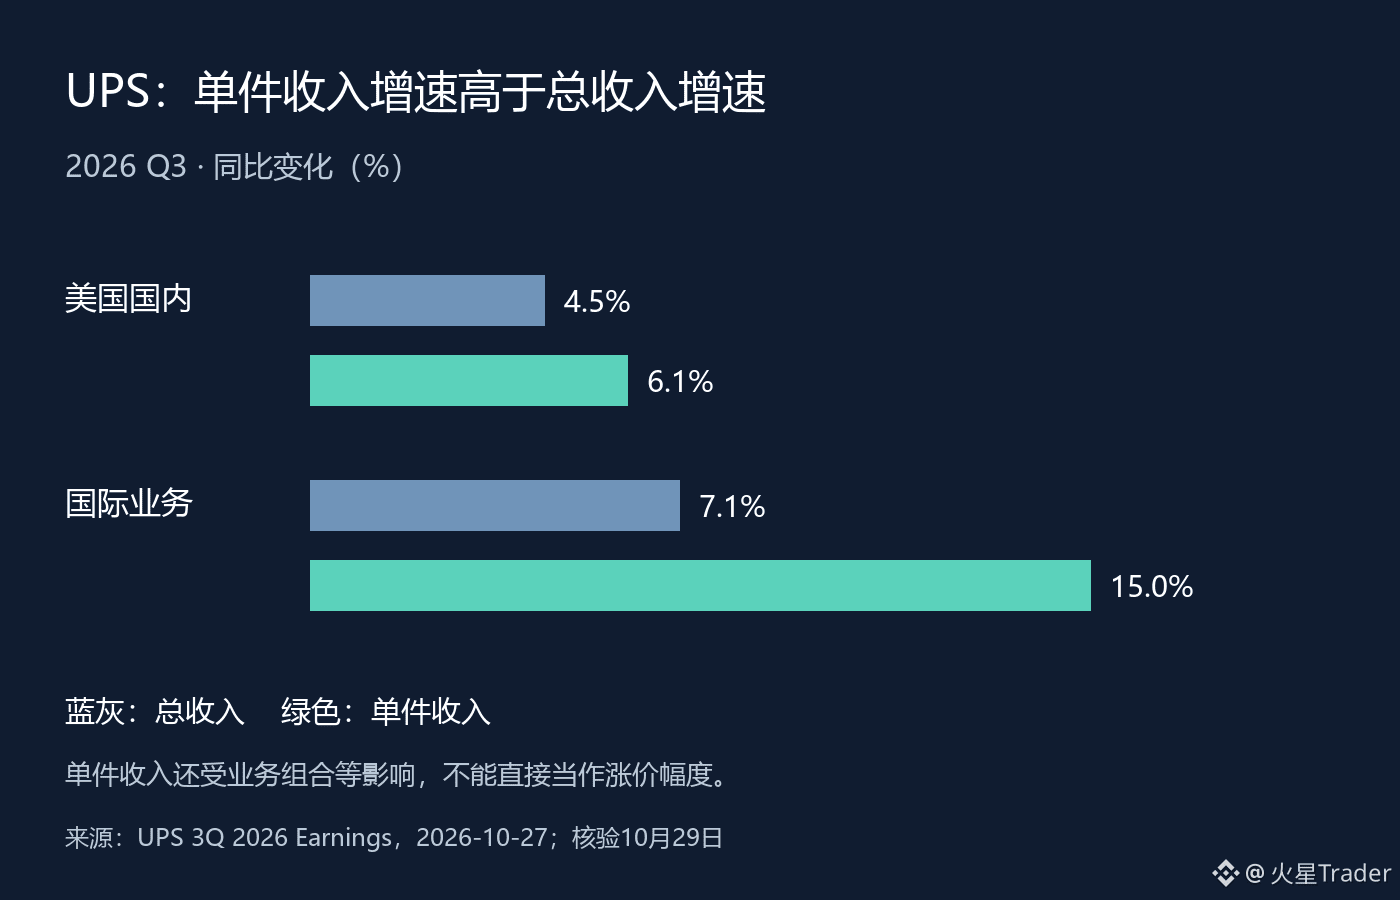
The third-quarter results released on October 27 showed that U.S. domestic revenue grew 4.5% year over year, while revenue per package rose 6.1%; international revenue grew 7.1%, while revenue per package increased 15.0%. In both segments, revenue per package grew faster than total revenue. At a minimum, that’s a reminder that improving revenue doesn’t mean package volume grew at the same pace.
But revenue per package can’t simply be called the “price increase.” Product mix, shipping routes, customer mix, and surcharges can all affect average revenue per package. Looking at a single average figure doesn’t tell us whether prices rose for comparable services or whether higher-value business made up a larger share. Nor can we simply subtract the two growth rates and treat the result as the company’s reported change in average daily package volume; the number of operating days and the scope of the business metrics need to be checked.
What matters more to me is whether this shift in mix can translate into lasting profit. Adjusted operating margin this quarter was 7.0% for the U.S. domestic business and 14.9% for the international business. That doesn’t mean the international business is inherently a better bet. The networks, service mix, and cost structures differ, so revenue growth shouldn’t be assumed to produce the same profit leverage across all segments.
Logistics networks face a practical constraint: increasing value per package while maintaining network density requires balancing both. Optimizing the customer mix may improve revenue quality, but if volumes fall too far, fixed costs may become harder to spread. So rising revenue per package is a useful signal, but on its own, it doesn’t prove that the entire network’s efficiency is improving on a sustained basis.
As the year-end peak season approaches, I’ll be watching package volume, revenue per package, and operating margin together. If revenue per package remains resilient while network costs are effectively absorbed, the revenue recovery will be higher quality. If volume stays under pressure and margins fail to follow, we’ll need to reassess how long this growth can last. For now, this is an assessment of the business mix—not confirmation of a broad-based recovery in U.S. consumption.
Data are for the third quarter of 2026; results announced on 2026-10-27 and verified on October 29, Beijing time. The chart is an original rendering of official year-over-year data; revenue per package is not a pure pricing measure.
Source: https://investors.ups.com/news-events/press-releases/detail/2172/ups-releases-3q-2026-earnings
UPS Revenue Rebounds; For Its Parcel Business, Start by Asking How Much Each Package Is Worth
Looking at UPS’s earnings report, I wouldn’t immediately equate the revenue rebound with a broad-based strengthening in logistics demand. Changes in revenue per package may explain this improvement better than total revenue—and deserve a closer look.
The third-quarter results released on October 27 showed that U.S. domestic revenue grew 4.5% year over year, while revenue per package rose 6.1%; international revenue grew 7.1%, while revenue per package increased 15.0%. In both segments, revenue per package grew faster than total revenue. At a minimum, that’s a reminder that improving revenue doesn’t mean package volume grew at the same pace.
But revenue per package can’t simply be called the “price increase.” Product mix, shipping routes, customer mix, and surcharges can all affect average revenue per package. Looking at a single average figure doesn’t tell us whether prices rose for comparable services or whether higher-value business made up a larger share. Nor can we simply subtract the two growth rates and treat the result as the company’s reported change in average daily package volume; the number of operating days and the scope of the business metrics need to be checked.
What matters more to me is whether this shift in mix can translate into lasting profit. Adjusted operating margin this quarter was 7.0% for the U.S. domestic business and 14.9% for the international business. That doesn’t mean the international business is inherently a better bet. The networks, service mix, and cost structures differ, so revenue growth shouldn’t be assumed to produce the same profit leverage across all segments.
Logistics networks face a practical constraint: increasing value per package while maintaining network density requires balancing both. Optimizing the customer mix may improve revenue quality, but if volumes fall too far, fixed costs may become harder to spread. So rising revenue per package is a useful signal, but on its own, it doesn’t prove that the entire network’s efficiency is improving on a sustained basis.
As the year-end peak season approaches, I’ll be watching package volume, revenue per package, and operating margin together. If revenue per package remains resilient while network costs are effectively absorbed, the revenue recovery will be higher quality. If volume stays under pressure and margins fail to follow, we’ll need to reassess how long this growth can last. For now, this is an assessment of the business mix—not confirmation of a broad-based recovery in U.S. consumption.
Data are for the third quarter of 2026; results announced on 2026-10-27 and verified on October 29, Beijing time. The chart is an original rendering of official year-over-year data; revenue per package is not a pure pricing measure.
Source: https://investors.ups.com/news-events/press-releases/detail/2172/ups-releases-3q-2026-earnings
Looking at UPS’s earnings report, I wouldn’t immediately equate the revenue rebound with a broad-based strengthening in logistics demand. Changes in revenue per package may explain this improvement better than total revenue—and deserve a closer look.
The third-quarter results released on October 27 showed that U.S. domestic revenue grew 4.5% year over year, while revenue per package rose 6.1%; international revenue grew 7.1%, while revenue per package increased 15.0%. In both segments, revenue per package grew faster than total revenue. At a minimum, that’s a reminder that improving revenue doesn’t mean package volume grew at the same pace.
But revenue per package can’t simply be called the “price increase.” Product mix, shipping routes, customer mix, and surcharges can all affect average revenue per package. Looking at a single average figure doesn’t tell us whether prices rose for comparable services or whether higher-value business made up a larger share. Nor can we simply subtract the two growth rates and treat the result as the company’s reported change in average daily package volume; the number of operating days and the scope of the business metrics need to be checked.
What matters more to me is whether this shift in mix can translate into lasting profit. Adjusted operating margin this quarter was 7.0% for the U.S. domestic business and 14.9% for the international business. That doesn’t mean the international business is inherently a better bet. The networks, service mix, and cost structures differ, so revenue growth shouldn’t be assumed to produce the same profit leverage across all segments.
Logistics networks face a practical constraint: increasing value per package while maintaining network density requires balancing both. Optimizing the customer mix may improve revenue quality, but if volumes fall too far, fixed costs may become harder to spread. So rising revenue per package is a useful signal, but on its own, it doesn’t prove that the entire network’s efficiency is improving on a sustained basis.
As the year-end peak season approaches, I’ll be watching package volume, revenue per package, and operating margin together. If revenue per package remains resilient while network costs are effectively absorbed, the revenue recovery will be higher quality. If volume stays under pressure and margins fail to follow, we’ll need to reassess how long this growth can last. For now, this is an assessment of the business mix—not confirmation of a broad-based recovery in U.S. consumption.
Data are for the third quarter of 2026; results announced on 2026-10-27 and verified on October 29, Beijing time. The chart is an original rendering of official year-over-year data; revenue per package is not a pure pricing measure.
Source: https://investors.ups.com/news-events/press-releases/detail/2172/ups-releases-3q-2026-earnings
UPSUS+1.14%
58
·
--
Oracle has laid out a cash flow timeline; the transition period is what really matters
At Oracle’s investor day, I was most interested in how it plans to get through the peak in capital expenditures. Long-term revenue targets can be ambitious, but the funding gap between building projects and collecting cash determines how long shareholders have to wait—and what that waiting costs them.
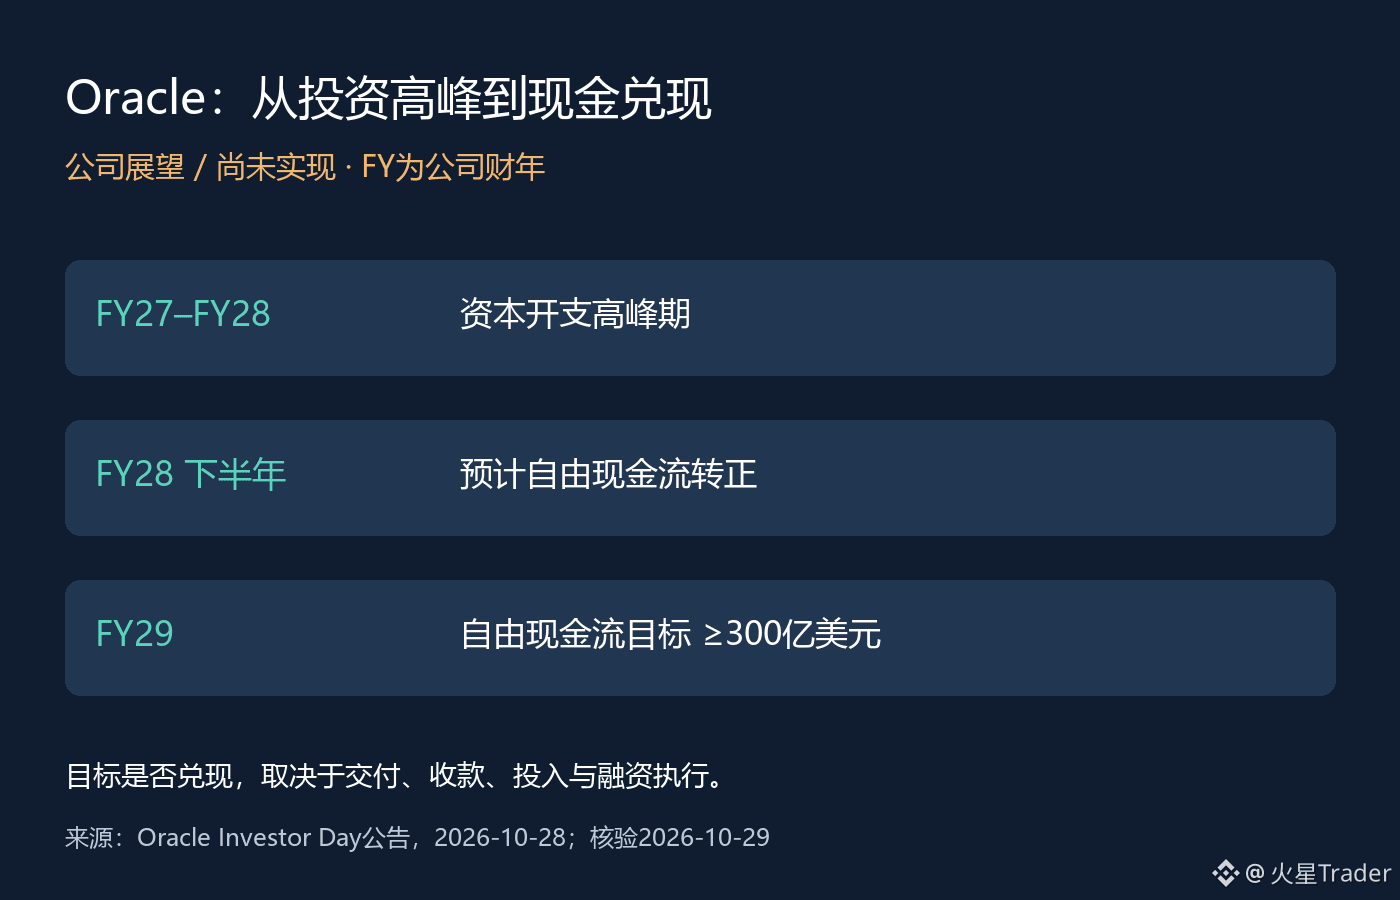
The official announcement on October 28 laid out a clear path: capital expenditures are expected to peak in FY27–FY28, free cash flow is expected to turn positive in the second half of FY28, and the FY29 free cash flow target is at least $30 billion. The company also expects to fund growth with its own resources starting in FY29. These are management’s outlooks, not financial results already achieved.
The company also said it intends to limit additional capital market financing before FY30 to $20 billion, split equally between equity and total debt. There are two easy-to-miss caveats: this excludes refinancing of existing debt, and it is in addition to the $20 billion ATM equity financing completed in the first quarter of FY27. “An additional $20 billion” should not be taken to mean that the entire expansion cycle will require only $20 billion.
My takeaway is that this timeline shifts the discussion from “How large is AI demand?” to “Who pays first?” The company lists supplier financing, customer-provided hardware, and customer prepayments as ways to reduce upfront cash needs. But changing when payments are made does not mean the equipment and funding come at no cost; the impact of each arrangement on debt, future obligations, and profits needs to be checked individually.
The main risk for shareholders is treating a future return to positive cash flow as if the company were already funding itself today. As long as construction spending comes before customer payments, delivery delays or changes in customer payment timing could alter financing needs during the transition. On the other hand, if prepayments and deliveries proceed as planned, the cash strain could be less severe than capital expenditure figures alone suggest. Both scenarios need to be tested against future disclosures.
I’ll be tracking three things: whether capital expenditures peak as planned, whether operating cash flow keeps pace, and whether additional financing stays within the limits the company has set. If the return to positive free cash flow is pushed back or financing grows, the cost of this growth path will need to be reassessed. If the plan is delivered, the long-term targets can gradually become verifiable operating capabilities.
Source: Oracle’s October 28, 2026 Investor Day announcement, verified on October 29 Beijing time. The accompanying image summarizes the company’s outlook and does not represent cash flow already achieved; FY refers to the company’s fiscal year.
https://investor.oracle.com/investor-news/news-details/2026/Oracle-Investor-Day-2026-Accelerating-Value-Creation/default.aspx
Oracle has laid out a cash flow timeline; the transition period is what really matters
At Oracle’s investor day, I was most interested in how it plans to get through the peak in capital expenditures. Long-term revenue targets can be ambitious, but the funding gap between building projects and collecting cash determines how long shareholders have to wait—and what that waiting costs them.
The official announcement on October 28 laid out a clear path: capital expenditures are expected to peak in FY27–FY28, free cash flow is expected to turn positive in the second half of FY28, and the FY29 free cash flow target is at least $30 billion. The company also expects to fund growth with its own resources starting in FY29. These are management’s outlooks, not financial results already achieved.
The company also said it intends to limit additional capital market financing before FY30 to $20 billion, split equally between equity and total debt. There are two easy-to-miss caveats: this excludes refinancing of existing debt, and it is in addition to the $20 billion ATM equity financing completed in the first quarter of FY27. “An additional $20 billion” should not be taken to mean that the entire expansion cycle will require only $20 billion.
My takeaway is that this timeline shifts the discussion from “How large is AI demand?” to “Who pays first?” The company lists supplier financing, customer-provided hardware, and customer prepayments as ways to reduce upfront cash needs. But changing when payments are made does not mean the equipment and funding come at no cost; the impact of each arrangement on debt, future obligations, and profits needs to be checked individually.
The main risk for shareholders is treating a future return to positive cash flow as if the company were already funding itself today. As long as construction spending comes before customer payments, delivery delays or changes in customer payment timing could alter financing needs during the transition. On the other hand, if prepayments and deliveries proceed as planned, the cash strain could be less severe than capital expenditure figures alone suggest. Both scenarios need to be tested against future disclosures.
I’ll be tracking three things: whether capital expenditures peak as planned, whether operating cash flow keeps pace, and whether additional financing stays within the limits the company has set. If the return to positive free cash flow is pushed back or financing grows, the cost of this growth path will need to be reassessed. If the plan is delivered, the long-term targets can gradually become verifiable operating capabilities.
Source: Oracle’s October 28, 2026 Investor Day announcement, verified on October 29 Beijing time. The accompanying image summarizes the company’s outlook and does not represent cash flow already achieved; FY refers to the company’s fiscal year.
https://investor.oracle.com/investor-news/news-details/2026/Oracle-Investor-Day-2026-Accelerating-Value-Creation/default.aspx
At Oracle’s investor day, I was most interested in how it plans to get through the peak in capital expenditures. Long-term revenue targets can be ambitious, but the funding gap between building projects and collecting cash determines how long shareholders have to wait—and what that waiting costs them.
The official announcement on October 28 laid out a clear path: capital expenditures are expected to peak in FY27–FY28, free cash flow is expected to turn positive in the second half of FY28, and the FY29 free cash flow target is at least $30 billion. The company also expects to fund growth with its own resources starting in FY29. These are management’s outlooks, not financial results already achieved.
The company also said it intends to limit additional capital market financing before FY30 to $20 billion, split equally between equity and total debt. There are two easy-to-miss caveats: this excludes refinancing of existing debt, and it is in addition to the $20 billion ATM equity financing completed in the first quarter of FY27. “An additional $20 billion” should not be taken to mean that the entire expansion cycle will require only $20 billion.
My takeaway is that this timeline shifts the discussion from “How large is AI demand?” to “Who pays first?” The company lists supplier financing, customer-provided hardware, and customer prepayments as ways to reduce upfront cash needs. But changing when payments are made does not mean the equipment and funding come at no cost; the impact of each arrangement on debt, future obligations, and profits needs to be checked individually.
The main risk for shareholders is treating a future return to positive cash flow as if the company were already funding itself today. As long as construction spending comes before customer payments, delivery delays or changes in customer payment timing could alter financing needs during the transition. On the other hand, if prepayments and deliveries proceed as planned, the cash strain could be less severe than capital expenditure figures alone suggest. Both scenarios need to be tested against future disclosures.
I’ll be tracking three things: whether capital expenditures peak as planned, whether operating cash flow keeps pace, and whether additional financing stays within the limits the company has set. If the return to positive free cash flow is pushed back or financing grows, the cost of this growth path will need to be reassessed. If the plan is delivered, the long-term targets can gradually become verifiable operating capabilities.
Source: Oracle’s October 28, 2026 Investor Day announcement, verified on October 29 Beijing time. The accompanying image summarizes the company’s outlook and does not represent cash flow already achieved; FY refers to the company’s fiscal year.
https://investor.oracle.com/investor-news/news-details/2026/Oracle-Investor-Day-2026-Accelerating-Value-Creation/default.aspx
79
·
--
Google Cloud revenue doubled—but first, let’s clarify what it sold
Google Cloud’s growth was strong this time, but I’d first look at the revenue mix. Cloud services and hardware system deliveries are not equally predictable sources of revenue for the next quarter.
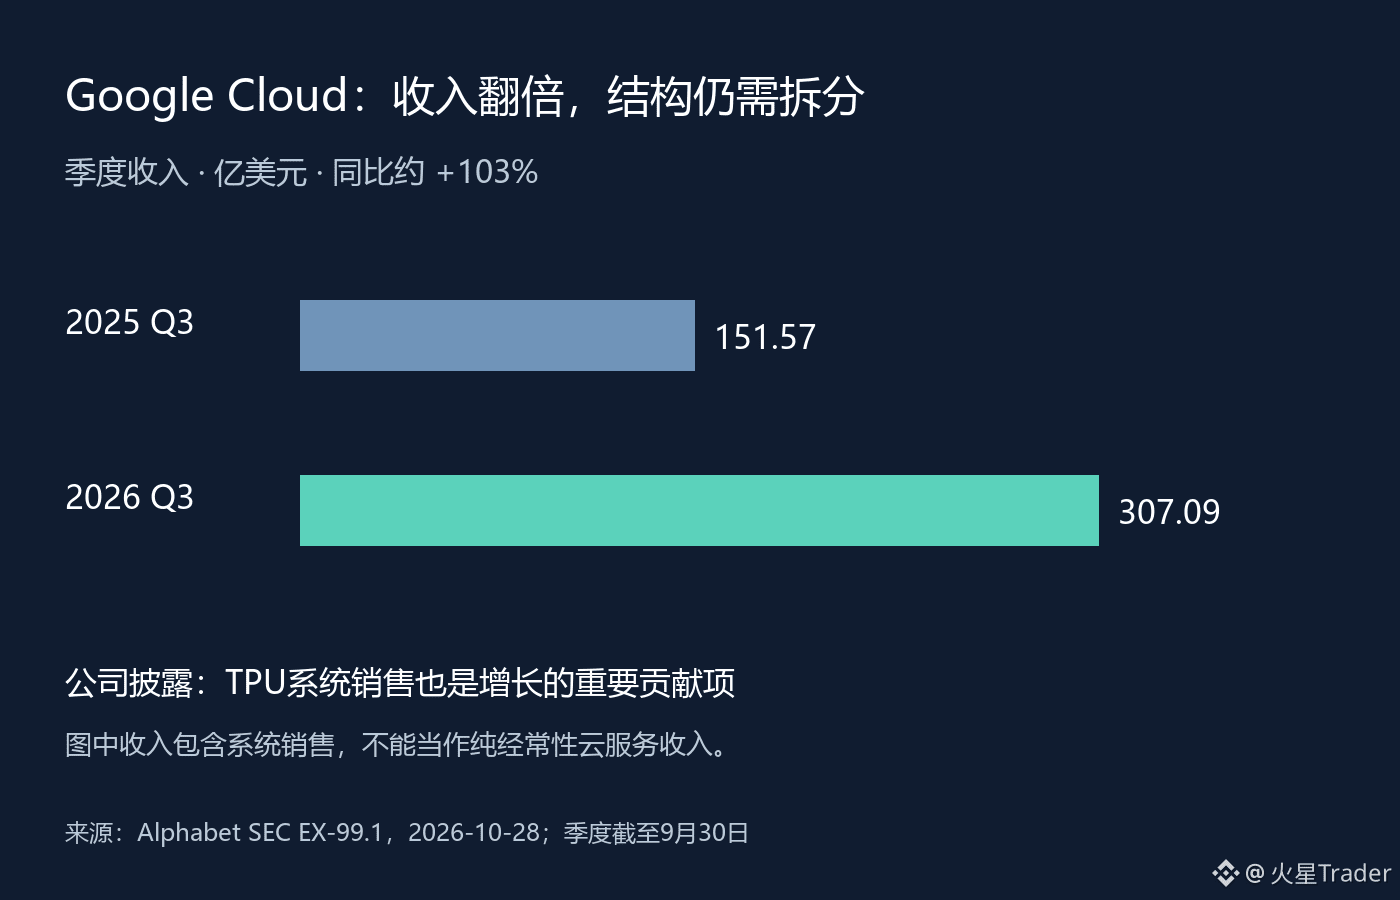
In its third-quarter earnings release published on October 28, Alphabet reported that Google Cloud revenue rose from $15.157 billion in the same period last year to $30.709 billion, up about 103% year over year. The company also explicitly said that sales of TPU systems were a significant contributor to revenue growth, alongside growth in enterprise AI infrastructure, AI solutions, and core GCP services.
That means interpreting the 103% figure as a doubling in ongoing cloud usage across all customers would overlook an important variable. System sales can generate real revenue and help build customer relationships, but the timing of revenue recognition may depend on delivery schedules. Recurring service usage, by contrast, depends more on continued consumption and renewals. Both types of business can be valuable, but their growth should not be extrapolated in the same way without first separating them.
The release does not provide enough detail for me to isolate TPU system sales and calculate a so-called “pure cloud services growth rate.” So I can’t make up a figure excluding hardware, nor can I claim that hardware accounted for all of this quarter’s strong growth. What we can confirm is that the company disclosed several sources of growth; their relative contributions still need to be verified.
In my view, the most important thing to watch next is whether this revenue mix translates into sustained demand. After a large-scale delivery, will customers continue buying services? Will their computing usage continue? Can growth hold up in the coming quarters? These signals are more useful for assessing long-term revenue quality than a single quarter’s doubling. If hardware deliveries fluctuate significantly, changes in quarterly growth do not necessarily mean customer demand has suddenly shifted.
For valuation, the key question is not just how much revenue was added this quarter, but how much of it can recur and how much additional investment will be needed to make it recur. In the next earnings release and management commentary, I’ll be looking closely at the contribution from TPU system sales, trends in service usage, and the related profit performance. First understand where the growth came from; then consider how long it can last.
Data as of 2026-09-30; earnings release dated 2026-10-28, verified on October 29 Beijing time. Chart originally created from earnings data; it includes system sales and should not be treated as purely recurring revenue.
Source: https://www.sec.gov/Archives/edgar/data/1652044/000165204426000080/googexhibit991q32026.htm
Google Cloud revenue doubled—but first, let’s clarify what it sold
Google Cloud’s growth was strong this time, but I’d first look at the revenue mix. Cloud services and hardware system deliveries are not equally predictable sources of revenue for the next quarter.
In its third-quarter earnings release published on October 28, Alphabet reported that Google Cloud revenue rose from $15.157 billion in the same period last year to $30.709 billion, up about 103% year over year. The company also explicitly said that sales of TPU systems were a significant contributor to revenue growth, alongside growth in enterprise AI infrastructure, AI solutions, and core GCP services.
That means interpreting the 103% figure as a doubling in ongoing cloud usage across all customers would overlook an important variable. System sales can generate real revenue and help build customer relationships, but the timing of revenue recognition may depend on delivery schedules. Recurring service usage, by contrast, depends more on continued consumption and renewals. Both types of business can be valuable, but their growth should not be extrapolated in the same way without first separating them.
The release does not provide enough detail for me to isolate TPU system sales and calculate a so-called “pure cloud services growth rate.” So I can’t make up a figure excluding hardware, nor can I claim that hardware accounted for all of this quarter’s strong growth. What we can confirm is that the company disclosed several sources of growth; their relative contributions still need to be verified.
In my view, the most important thing to watch next is whether this revenue mix translates into sustained demand. After a large-scale delivery, will customers continue buying services? Will their computing usage continue? Can growth hold up in the coming quarters? These signals are more useful for assessing long-term revenue quality than a single quarter’s doubling. If hardware deliveries fluctuate significantly, changes in quarterly growth do not necessarily mean customer demand has suddenly shifted.
For valuation, the key question is not just how much revenue was added this quarter, but how much of it can recur and how much additional investment will be needed to make it recur. In the next earnings release and management commentary, I’ll be looking closely at the contribution from TPU system sales, trends in service usage, and the related profit performance. First understand where the growth came from; then consider how long it can last.
Data as of 2026-09-30; earnings release dated 2026-10-28, verified on October 29 Beijing time. Chart originally created from earnings data; it includes system sales and should not be treated as purely recurring revenue.
Source: https://www.sec.gov/Archives/edgar/data/1652044/000165204426000080/googexhibit991q32026.htm
Google Cloud’s growth was strong this time, but I’d first look at the revenue mix. Cloud services and hardware system deliveries are not equally predictable sources of revenue for the next quarter.
In its third-quarter earnings release published on October 28, Alphabet reported that Google Cloud revenue rose from $15.157 billion in the same period last year to $30.709 billion, up about 103% year over year. The company also explicitly said that sales of TPU systems were a significant contributor to revenue growth, alongside growth in enterprise AI infrastructure, AI solutions, and core GCP services.
That means interpreting the 103% figure as a doubling in ongoing cloud usage across all customers would overlook an important variable. System sales can generate real revenue and help build customer relationships, but the timing of revenue recognition may depend on delivery schedules. Recurring service usage, by contrast, depends more on continued consumption and renewals. Both types of business can be valuable, but their growth should not be extrapolated in the same way without first separating them.
The release does not provide enough detail for me to isolate TPU system sales and calculate a so-called “pure cloud services growth rate.” So I can’t make up a figure excluding hardware, nor can I claim that hardware accounted for all of this quarter’s strong growth. What we can confirm is that the company disclosed several sources of growth; their relative contributions still need to be verified.
In my view, the most important thing to watch next is whether this revenue mix translates into sustained demand. After a large-scale delivery, will customers continue buying services? Will their computing usage continue? Can growth hold up in the coming quarters? These signals are more useful for assessing long-term revenue quality than a single quarter’s doubling. If hardware deliveries fluctuate significantly, changes in quarterly growth do not necessarily mean customer demand has suddenly shifted.
For valuation, the key question is not just how much revenue was added this quarter, but how much of it can recur and how much additional investment will be needed to make it recur. In the next earnings release and management commentary, I’ll be looking closely at the contribution from TPU system sales, trends in service usage, and the related profit performance. First understand where the growth came from; then consider how long it can last.
Data as of 2026-09-30; earnings release dated 2026-10-28, verified on October 29 Beijing time. Chart originally created from earnings data; it includes system sales and should not be treated as purely recurring revenue.
Source: https://www.sec.gov/Archives/edgar/data/1652044/000165204426000080/googexhibit991q32026.htm
GOOGUS+0.81%
GOOGLB+0.31%
55
·
--
Microsoft’s profit grew 32%—why was the adjusted growth rate only 18%?
The easiest thing to misread in Microsoft’s latest earnings report is its profit growth. Both 32% and 18% come from the company’s announcement, but when assessing the growth trend, you can’t simply choose the more flattering figure and extrapolate from it.
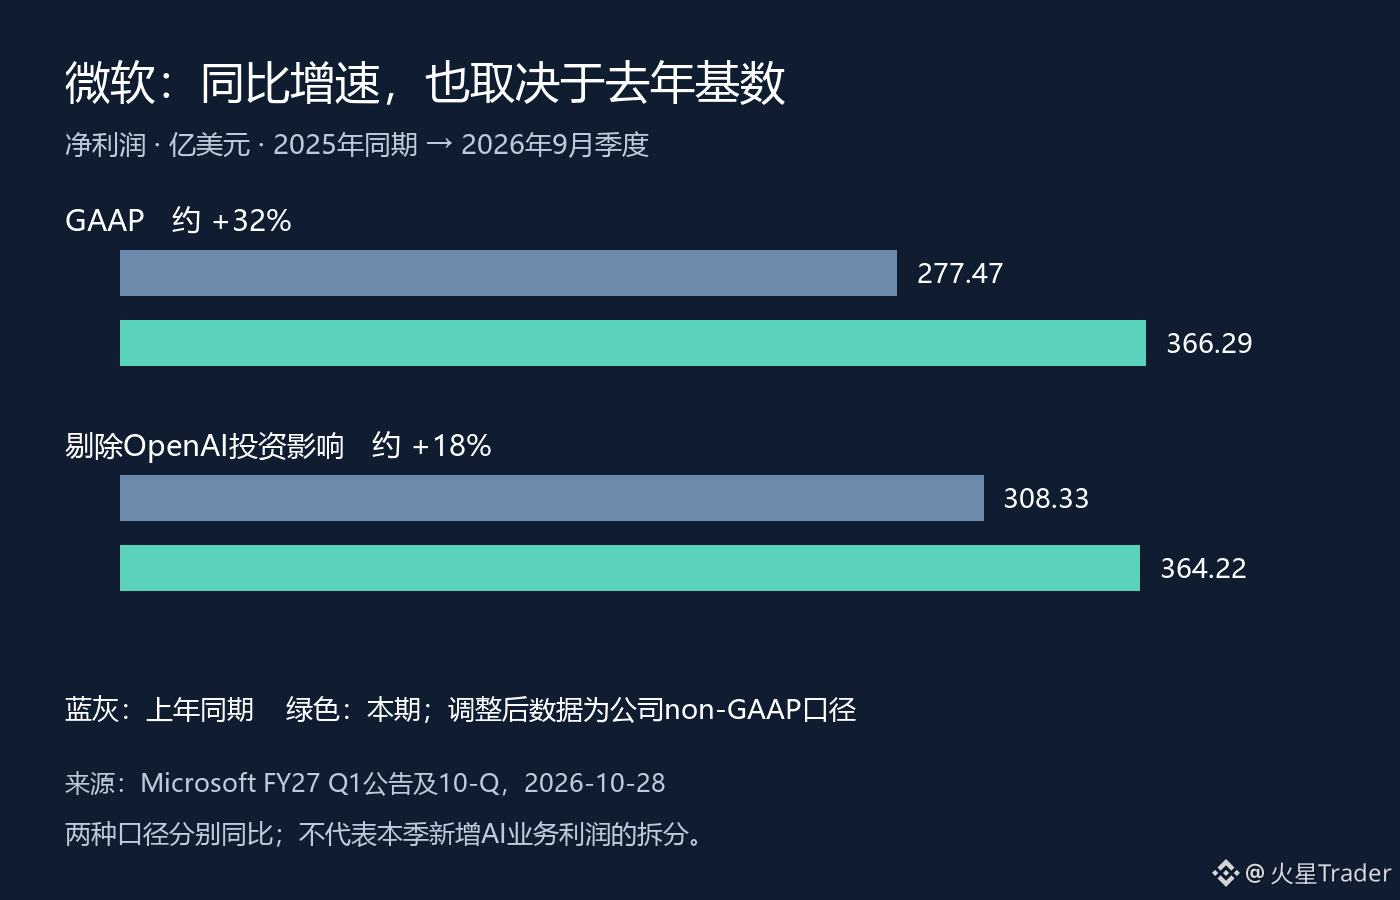
For the first quarter of FY2027, ended September 30, Microsoft reported GAAP net income of $36.629 billion, up from $27.747 billion in the same period last year. Excluding the impact of its OpenAI investment, adjusted net income was $36.422 billion, compared with $30.833 billion a year earlier. Those figures represent year-over-year growth of approximately 32% and 18%, respectively.
The two measures differed by just $207 million this quarter, yet their growth rates differed by 14 percentage points. The key is last year’s comparison base. Subtracting the reported figures, last year’s GAAP net income was $3.086 billion lower than adjusted net income. Starting from a lower base makes this year’s growth look more pronounced. The entire gap between the growth rates cannot be explained as a sudden surge in AI-related profit this quarter.
That doesn’t mean Microsoft’s business isn’t growing. Revenue rose 19% year over year, and operating income increased 21%. My reading is that the business is indeed expanding, but the impact of investment accounting and operating performance should be assessed separately. Gains on OpenAI-related investments are not direct evidence that customers are paying for cloud services.
When reading AI earnings reports, it’s especially important to resist this leap: going straight from rising net income to concluding that investments in computing capacity have fully proved their returns. The income statement, cash flows, and capital investments have different timelines for translating into results, and one quarter’s profit growth cannot answer every question. Conversely, the lower adjusted growth rate alone doesn’t prove that demand is weakening.
Next, I’ll look at operating income, operating cash flow, and capital expenditures together, then check what the company says about future demand and supply. There will be stronger grounds for discussing the quality of returns on AI investment only when profit growth consistently converts into cash and the returns on new investment become clearer. For now, understanding the year-over-year comparison base is more useful than using 32% to value the future.
Data as of 2026-09-30; earnings announcement dated 2026-10-28, verified on October 29 Beijing time. The accompanying illustration is an original rendering of earnings data, not a stock-price chart.
Source: https://www.microsoft.com/en-us/Investor/earnings/FY-2027-Q1/press-release-webcast
https://www.sec.gov/Archives/edgar/data/789019/000119312526436133/msft-20260930.htm
Microsoft’s profit grew 32%—why was the adjusted growth rate only 18%?
The easiest thing to misread in Microsoft’s latest earnings report is its profit growth. Both 32% and 18% come from the company’s announcement, but when assessing the growth trend, you can’t simply choose the more flattering figure and extrapolate from it.
For the first quarter of FY2027, ended September 30, Microsoft reported GAAP net income of $36.629 billion, up from $27.747 billion in the same period last year. Excluding the impact of its OpenAI investment, adjusted net income was $36.422 billion, compared with $30.833 billion a year earlier. Those figures represent year-over-year growth of approximately 32% and 18%, respectively.
The two measures differed by just $207 million this quarter, yet their growth rates differed by 14 percentage points. The key is last year’s comparison base. Subtracting the reported figures, last year’s GAAP net income was $3.086 billion lower than adjusted net income. Starting from a lower base makes this year’s growth look more pronounced. The entire gap between the growth rates cannot be explained as a sudden surge in AI-related profit this quarter.
That doesn’t mean Microsoft’s business isn’t growing. Revenue rose 19% year over year, and operating income increased 21%. My reading is that the business is indeed expanding, but the impact of investment accounting and operating performance should be assessed separately. Gains on OpenAI-related investments are not direct evidence that customers are paying for cloud services.
When reading AI earnings reports, it’s especially important to resist this leap: going straight from rising net income to concluding that investments in computing capacity have fully proved their returns. The income statement, cash flows, and capital investments have different timelines for translating into results, and one quarter’s profit growth cannot answer every question. Conversely, the lower adjusted growth rate alone doesn’t prove that demand is weakening.
Next, I’ll look at operating income, operating cash flow, and capital expenditures together, then check what the company says about future demand and supply. There will be stronger grounds for discussing the quality of returns on AI investment only when profit growth consistently converts into cash and the returns on new investment become clearer. For now, understanding the year-over-year comparison base is more useful than using 32% to value the future.
Data as of 2026-09-30; earnings announcement dated 2026-10-28, verified on October 29 Beijing time. The accompanying illustration is an original rendering of earnings data, not a stock-price chart.
Source: https://www.microsoft.com/en-us/Investor/earnings/FY-2027-Q1/press-release-webcast
https://www.sec.gov/Archives/edgar/data/789019/000119312526436133/msft-20260930.htm
The easiest thing to misread in Microsoft’s latest earnings report is its profit growth. Both 32% and 18% come from the company’s announcement, but when assessing the growth trend, you can’t simply choose the more flattering figure and extrapolate from it.
For the first quarter of FY2027, ended September 30, Microsoft reported GAAP net income of $36.629 billion, up from $27.747 billion in the same period last year. Excluding the impact of its OpenAI investment, adjusted net income was $36.422 billion, compared with $30.833 billion a year earlier. Those figures represent year-over-year growth of approximately 32% and 18%, respectively.
The two measures differed by just $207 million this quarter, yet their growth rates differed by 14 percentage points. The key is last year’s comparison base. Subtracting the reported figures, last year’s GAAP net income was $3.086 billion lower than adjusted net income. Starting from a lower base makes this year’s growth look more pronounced. The entire gap between the growth rates cannot be explained as a sudden surge in AI-related profit this quarter.
That doesn’t mean Microsoft’s business isn’t growing. Revenue rose 19% year over year, and operating income increased 21%. My reading is that the business is indeed expanding, but the impact of investment accounting and operating performance should be assessed separately. Gains on OpenAI-related investments are not direct evidence that customers are paying for cloud services.
When reading AI earnings reports, it’s especially important to resist this leap: going straight from rising net income to concluding that investments in computing capacity have fully proved their returns. The income statement, cash flows, and capital investments have different timelines for translating into results, and one quarter’s profit growth cannot answer every question. Conversely, the lower adjusted growth rate alone doesn’t prove that demand is weakening.
Next, I’ll look at operating income, operating cash flow, and capital expenditures together, then check what the company says about future demand and supply. There will be stronger grounds for discussing the quality of returns on AI investment only when profit growth consistently converts into cash and the returns on new investment become clearer. For now, understanding the year-over-year comparison base is more useful than using 32% to value the future.
Data as of 2026-09-30; earnings announcement dated 2026-10-28, verified on October 29 Beijing time. The accompanying illustration is an original rendering of earnings data, not a stock-price chart.
Source: https://www.microsoft.com/en-us/Investor/earnings/FY-2027-Q1/press-release-webcast
https://www.sec.gov/Archives/edgar/data/789019/000119312526436133/msft-20260930.htm
69
·
--
Visa’s New Earnings Report: Client Incentives Are Growing Faster, So Look Beyond the Headline Growth
When I review Visa’s new earnings report, I start with client incentives. Payment networks benefit from scale, but how much of their revenue growth they retain also depends on the cost of maintaining client relationships.
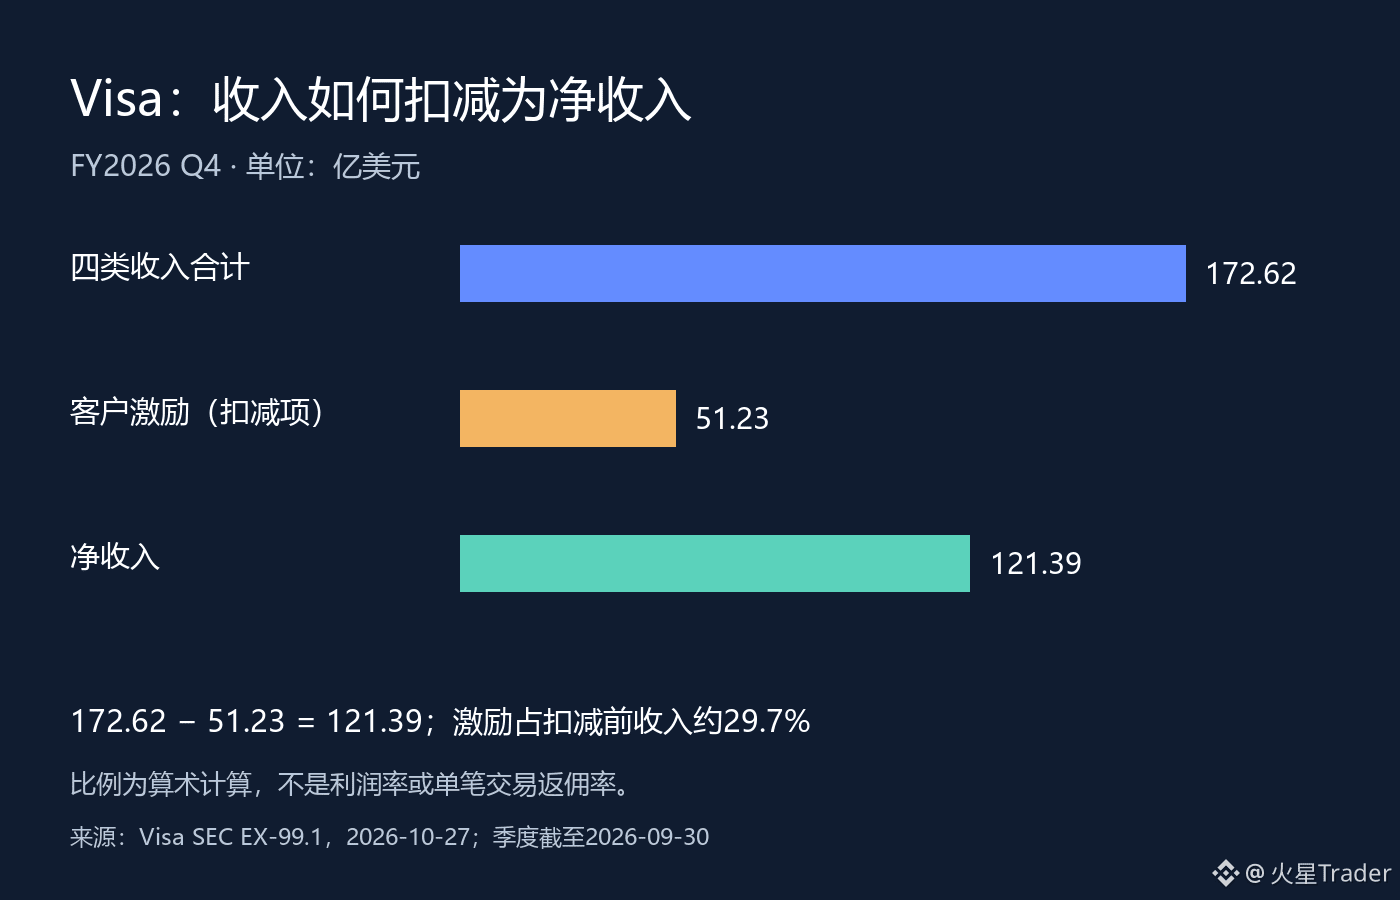
For the fourth quarter of FY2026, announced on October 27, net revenue was $12.139 billion, up 13% year over year; client incentives were $5.123 billion, up 21%. The latter is deducted from revenue, so it should not be treated as an ordinary operating expense and subtracted from net revenue a second time.
Adding up the four revenue categories in the announcement gives $17.262 billion before incentives, with client incentives accounting for about 29.7%. This is an arithmetic ratio based on disclosed figures—not the company’s profit margin, much less the rebate rate on each card transaction. Its significance is that it reminds us to watch whether revenue retained on the platform improves in step with business growth.
But we should not jump to the opposite conclusion and assume that faster-growing incentives mean competition is worsening. Contract terms, client mix, and business growth could all affect this figure; the quarterly aggregate alone is not enough to distinguish their respective contributions. Translating a single accounting line directly into a collapsing competitive moat would be just as hasty.
My view is that growth in scale still has value, but when valuing future growth, client incentives need to be considered alongside it. If, in future periods, growth in revenue before incentives translates more smoothly into net revenue, that would give us stronger grounds for judging the quality of growth. If incentives continue to grow faster, we need to look more closely at contracts and business mix rather than focusing only on the excitement around transaction volume.
For the next earnings report, I’ll be tracking incentives as a share of revenue before incentives, net revenue growth, and management’s explanation of client contracts. This article discusses operating data only; I have not verified the current share price or market consensus expectations, and I am not using it to estimate how much the stock should rise today.
Data as of September 30, 2026; announcement dated October 27, 2026; this round of verification conducted on October 28. The chart is an original illustration based on publicly available earnings data.
Source: https://www.sec.gov/Archives/edgar/data/1403161/000140316126000126/q42026earningsrelease.htm
Visa’s New Earnings Report: Client Incentives Are Growing Faster, So Look Beyond the Headline Growth
When I review Visa’s new earnings report, I start with client incentives. Payment networks benefit from scale, but how much of their revenue growth they retain also depends on the cost of maintaining client relationships.
For the fourth quarter of FY2026, announced on October 27, net revenue was $12.139 billion, up 13% year over year; client incentives were $5.123 billion, up 21%. The latter is deducted from revenue, so it should not be treated as an ordinary operating expense and subtracted from net revenue a second time.
Adding up the four revenue categories in the announcement gives $17.262 billion before incentives, with client incentives accounting for about 29.7%. This is an arithmetic ratio based on disclosed figures—not the company’s profit margin, much less the rebate rate on each card transaction. Its significance is that it reminds us to watch whether revenue retained on the platform improves in step with business growth.
But we should not jump to the opposite conclusion and assume that faster-growing incentives mean competition is worsening. Contract terms, client mix, and business growth could all affect this figure; the quarterly aggregate alone is not enough to distinguish their respective contributions. Translating a single accounting line directly into a collapsing competitive moat would be just as hasty.
My view is that growth in scale still has value, but when valuing future growth, client incentives need to be considered alongside it. If, in future periods, growth in revenue before incentives translates more smoothly into net revenue, that would give us stronger grounds for judging the quality of growth. If incentives continue to grow faster, we need to look more closely at contracts and business mix rather than focusing only on the excitement around transaction volume.
For the next earnings report, I’ll be tracking incentives as a share of revenue before incentives, net revenue growth, and management’s explanation of client contracts. This article discusses operating data only; I have not verified the current share price or market consensus expectations, and I am not using it to estimate how much the stock should rise today.
Data as of September 30, 2026; announcement dated October 27, 2026; this round of verification conducted on October 28. The chart is an original illustration based on publicly available earnings data.
Source: https://www.sec.gov/Archives/edgar/data/1403161/000140316126000126/q42026earningsrelease.htm
When I review Visa’s new earnings report, I start with client incentives. Payment networks benefit from scale, but how much of their revenue growth they retain also depends on the cost of maintaining client relationships.
For the fourth quarter of FY2026, announced on October 27, net revenue was $12.139 billion, up 13% year over year; client incentives were $5.123 billion, up 21%. The latter is deducted from revenue, so it should not be treated as an ordinary operating expense and subtracted from net revenue a second time.
Adding up the four revenue categories in the announcement gives $17.262 billion before incentives, with client incentives accounting for about 29.7%. This is an arithmetic ratio based on disclosed figures—not the company’s profit margin, much less the rebate rate on each card transaction. Its significance is that it reminds us to watch whether revenue retained on the platform improves in step with business growth.
But we should not jump to the opposite conclusion and assume that faster-growing incentives mean competition is worsening. Contract terms, client mix, and business growth could all affect this figure; the quarterly aggregate alone is not enough to distinguish their respective contributions. Translating a single accounting line directly into a collapsing competitive moat would be just as hasty.
My view is that growth in scale still has value, but when valuing future growth, client incentives need to be considered alongside it. If, in future periods, growth in revenue before incentives translates more smoothly into net revenue, that would give us stronger grounds for judging the quality of growth. If incentives continue to grow faster, we need to look more closely at contracts and business mix rather than focusing only on the excitement around transaction volume.
For the next earnings report, I’ll be tracking incentives as a share of revenue before incentives, net revenue growth, and management’s explanation of client contracts. This article discusses operating data only; I have not verified the current share price or market consensus expectations, and I am not using it to estimate how much the stock should rise today.
Data as of September 30, 2026; announcement dated October 27, 2026; this round of verification conducted on October 28. The chart is an original illustration based on publicly available earnings data.
Source: https://www.sec.gov/Archives/edgar/data/1403161/000140316126000126/q42026earningsrelease.htm
23
·
--
NXP lands Volkswagen partnership—don’t mistake platform qualification for order value
The significance of this new NXPI news is that NXP has been selected for a key component in future vehicle architectures—not that the announcement has already specified how much revenue it will generate. On October 26, Volkswagen and NXP announced a strategic partnership under which the S32K5 microcontroller will become a shared building block for future zonal software-defined vehicle architectures. The direction is worth watching, but we shouldn’t fill in the financial figures ourselves.
The announcement links this architecture to RV Tech, the joint venture between Rivian and Volkswagen, and aims to support applications across brands and vehicle models. In my view, what makes this attractive for a chipmaker is the potential for platform reuse: if the same technological foundation can be deployed across multiple models, R&D and validation investments could serve a larger production base. This is an assessment of commercial potential, not confirmation of vehicle sales or supply revenue.
But “across brands” does not mean that all of Volkswagen’s existing vehicles are already equipped with the same chip, let alone that the chip value per vehicle is certain to increase. The scope of future adoption, the number of chips per vehicle, pricing, and production ramp-up all need to be assessed separately. Without those inputs, multiplying Volkswagen’s annual sales by an imagined chip price to arrive at a supposed order value has no evidentiary basis.
Another point that can be easy to confuse is treating the entire shift to software-defined vehicles as a move to high-compute chips. The announcement specifically discusses microcontrollers related to zonal control, as well as capabilities such as real-time computing and software updates. These can be different components within the same vehicle architecture as centralized computing; this partnership cannot be described as NXP winning all of the computing chips in the entire vehicle.
For now, I view this as a positive signal for long-term design wins, but in the short term we still need to look at the earnings report. The company is scheduled to release Q3 results after the US market closes on October 27, which is early morning on October 28 Beijing time. Q3 results have not yet been released, and the partnership announcement cannot substitute for actual automotive revenue, inventory, or guidance for the next quarter. Even if management discusses the partnership, we should distinguish qualitative commentary from quantifiable contributions.
The most valuable updates to watch for are a clearer scope of adoption, confirmation of production progress, and verifiable evidence of related revenue. If there is only a partnership headline without progress toward implementation, expectations should not be repeatedly revised upward. If platform reuse genuinely expands, the long-term thesis will gradually gain support from financial data. For now, confirm the design position—don’t prematurely turn possibilities that may take years to materialize into this quarter’s profit.
Sources: NXP partnership announcement, 2026-10-26; earnings schedule announcement, 2026-10-06; verified 2026-10-27. The accompanying image illustrates the relationship described in the announcement; it is not a diagram of actual vehicle wiring or chip counts.
https://www.nxp.com/company/about-nxp/newsroom/NW-VOLKSWAGEN-STRENGTHENS-PARTNERSHIP-NXP
https://www.nxp.com/company/about-nxp/newsroom/NW-NXP-ANNOUNCES-CONFERENCE-CALL-3Q-2026
NXP lands Volkswagen partnership—don’t mistake platform qualification for order value
The significance of this new NXPI news is that NXP has been selected for a key component in future vehicle architectures—not that the announcement has already specified how much revenue it will generate. On October 26, Volkswagen and NXP announced a strategic partnership under which the S32K5 microcontroller will become a shared building block for future zonal software-defined vehicle architectures. The direction is worth watching, but we shouldn’t fill in the financial figures ourselves.
The announcement links this architecture to RV Tech, the joint venture between Rivian and Volkswagen, and aims to support applications across brands and vehicle models. In my view, what makes this attractive for a chipmaker is the potential for platform reuse: if the same technological foundation can be deployed across multiple models, R&D and validation investments could serve a larger production base. This is an assessment of commercial potential, not confirmation of vehicle sales or supply revenue.
But “across brands” does not mean that all of Volkswagen’s existing vehicles are already equipped with the same chip, let alone that the chip value per vehicle is certain to increase. The scope of future adoption, the number of chips per vehicle, pricing, and production ramp-up all need to be assessed separately. Without those inputs, multiplying Volkswagen’s annual sales by an imagined chip price to arrive at a supposed order value has no evidentiary basis.
Another point that can be easy to confuse is treating the entire shift to software-defined vehicles as a move to high-compute chips. The announcement specifically discusses microcontrollers related to zonal control, as well as capabilities such as real-time computing and software updates. These can be different components within the same vehicle architecture as centralized computing; this partnership cannot be described as NXP winning all of the computing chips in the entire vehicle.
For now, I view this as a positive signal for long-term design wins, but in the short term we still need to look at the earnings report. The company is scheduled to release Q3 results after the US market closes on October 27, which is early morning on October 28 Beijing time. Q3 results have not yet been released, and the partnership announcement cannot substitute for actual automotive revenue, inventory, or guidance for the next quarter. Even if management discusses the partnership, we should distinguish qualitative commentary from quantifiable contributions.
The most valuable updates to watch for are a clearer scope of adoption, confirmation of production progress, and verifiable evidence of related revenue. If there is only a partnership headline without progress toward implementation, expectations should not be repeatedly revised upward. If platform reuse genuinely expands, the long-term thesis will gradually gain support from financial data. For now, confirm the design position—don’t prematurely turn possibilities that may take years to materialize into this quarter’s profit.
Sources: NXP partnership announcement, 2026-10-26; earnings schedule announcement, 2026-10-06; verified 2026-10-27. The accompanying image illustrates the relationship described in the announcement; it is not a diagram of actual vehicle wiring or chip counts.
https://www.nxp.com/company/about-nxp/newsroom/NW-VOLKSWAGEN-STRENGTHENS-PARTNERSHIP-NXP
https://www.nxp.com/company/about-nxp/newsroom/NW-NXP-ANNOUNCES-CONFERENCE-CALL-3Q-2026
The significance of this new NXPI news is that NXP has been selected for a key component in future vehicle architectures—not that the announcement has already specified how much revenue it will generate. On October 26, Volkswagen and NXP announced a strategic partnership under which the S32K5 microcontroller will become a shared building block for future zonal software-defined vehicle architectures. The direction is worth watching, but we shouldn’t fill in the financial figures ourselves.
The announcement links this architecture to RV Tech, the joint venture between Rivian and Volkswagen, and aims to support applications across brands and vehicle models. In my view, what makes this attractive for a chipmaker is the potential for platform reuse: if the same technological foundation can be deployed across multiple models, R&D and validation investments could serve a larger production base. This is an assessment of commercial potential, not confirmation of vehicle sales or supply revenue.
But “across brands” does not mean that all of Volkswagen’s existing vehicles are already equipped with the same chip, let alone that the chip value per vehicle is certain to increase. The scope of future adoption, the number of chips per vehicle, pricing, and production ramp-up all need to be assessed separately. Without those inputs, multiplying Volkswagen’s annual sales by an imagined chip price to arrive at a supposed order value has no evidentiary basis.
Another point that can be easy to confuse is treating the entire shift to software-defined vehicles as a move to high-compute chips. The announcement specifically discusses microcontrollers related to zonal control, as well as capabilities such as real-time computing and software updates. These can be different components within the same vehicle architecture as centralized computing; this partnership cannot be described as NXP winning all of the computing chips in the entire vehicle.
For now, I view this as a positive signal for long-term design wins, but in the short term we still need to look at the earnings report. The company is scheduled to release Q3 results after the US market closes on October 27, which is early morning on October 28 Beijing time. Q3 results have not yet been released, and the partnership announcement cannot substitute for actual automotive revenue, inventory, or guidance for the next quarter. Even if management discusses the partnership, we should distinguish qualitative commentary from quantifiable contributions.
The most valuable updates to watch for are a clearer scope of adoption, confirmation of production progress, and verifiable evidence of related revenue. If there is only a partnership headline without progress toward implementation, expectations should not be repeatedly revised upward. If platform reuse genuinely expands, the long-term thesis will gradually gain support from financial data. For now, confirm the design position—don’t prematurely turn possibilities that may take years to materialize into this quarter’s profit.
Sources: NXP partnership announcement, 2026-10-26; earnings schedule announcement, 2026-10-06; verified 2026-10-27. The accompanying image illustrates the relationship described in the announcement; it is not a diagram of actual vehicle wiring or chip counts.
https://www.nxp.com/company/about-nxp/newsroom/NW-VOLKSWAGEN-STRENGTHENS-PARTNERSHIP-NXP
https://www.nxp.com/company/about-nxp/newsroom/NW-NXP-ANNOUNCES-CONFERENCE-CALL-3Q-2026
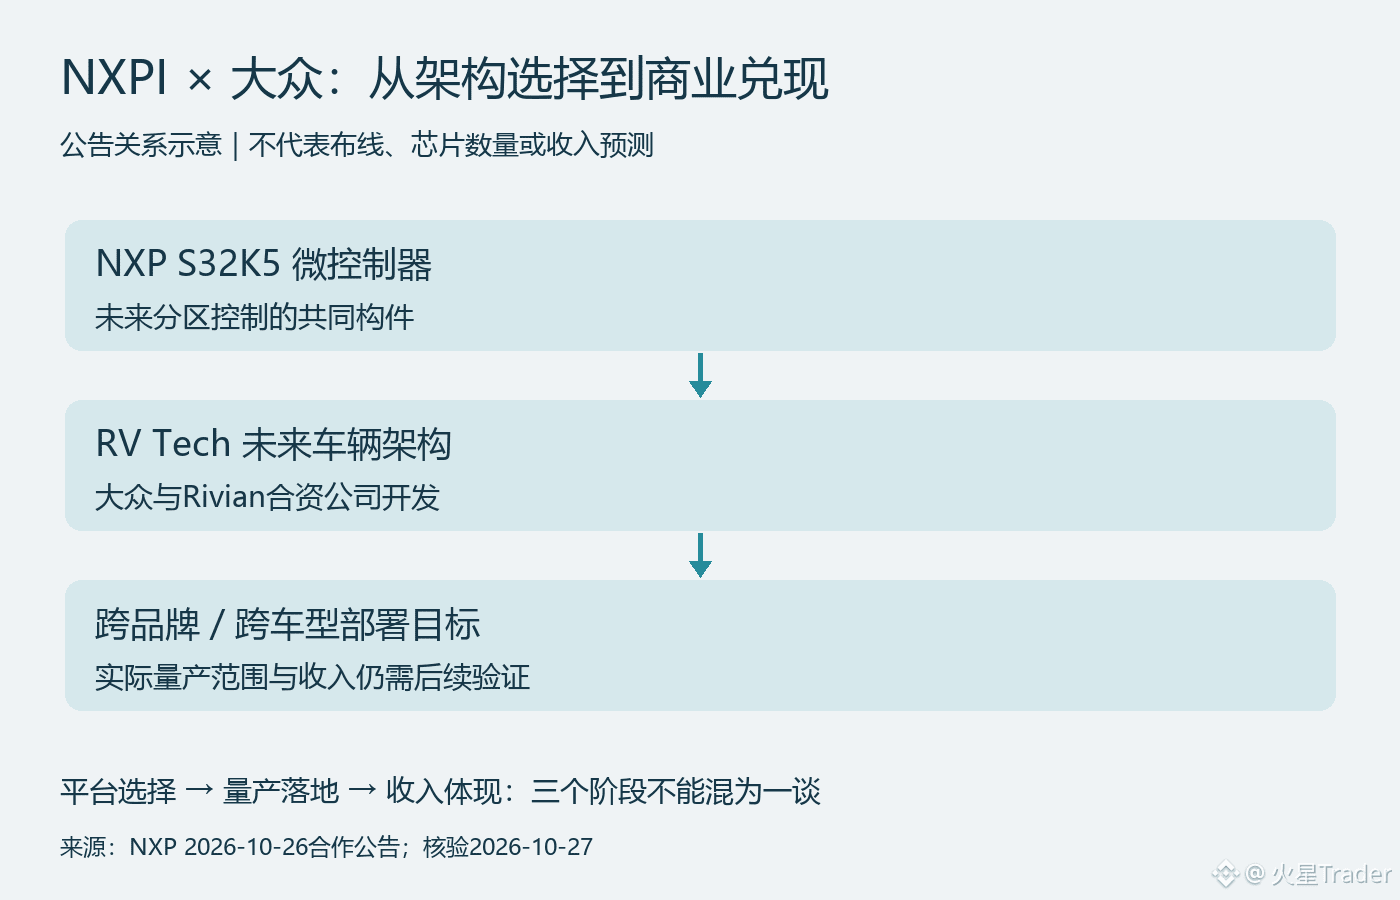
101
·
--
Lockheed Martin’s orders hit a record high, but cash realization cannot be judged by the headline alone
Lockheed Martin’s (LMT) orders are strong, but orders, revenue, and cash are three different report cards. Seeing $292 billion in backlog and immediately treating it as a profit guarantee skips the most important part: how these projects are produced, delivered, and then turned back into cash.
In the Q3 report released on October 22, sales were $20.7 billion, up 11% year over year; net profit was $1.8 billion, up 14%. At the same time, operating cash flow fell from $3.7 billion a year earlier to $3.4 billion, and free cash flow fell from $3.3 billion to $3.0 billion. These figures all come from the same release: profit growth and a decline in cash flow for the quarter are not contradictory, and you cannot pick one side and declare the business has clearly improved or worsened across the board.
The weight of orders also needs to be broken down. Quarter-end backlog was $292 billion, of which $52.5 billion was related to the PAC-3 MSE interceptor multiyear contract. Multiyear contracts increase visibility into future business, but they do not all turn into revenue in the quarter they are signed, and they certainly do not mean the same amount of cash has already arrived. Dividing total backlog by one quarter’s revenue and then treating the result as guaranteed growth over the next few years ignores both execution cycles and project structure.
My view is that orders solve only part of the question of whether there is work to do; realization still depends on whether the work can be completed on cost and on schedule. Capacity ramp-up, supplier deliveries, and milestone-based collections all affect the conversion pace. This is an explanation of the analytical framework, not a claim that the company had a specific delivery failure this quarter; a year-over-year decline in cash flow alone cannot accurately identify the cause.
Likewise, free cash flow of $3.0 billion is still positive, so the decline should not be described as a cash crunch. A more useful observation is whether deliveries and cash in the next few quarters can move along with revenue, rather than demanding that every quarter’s cash growth rate perfectly match profit.
I would place the next round of verification on order conversion, project profitability, and cash realization. If orders keep rising but conversion is slow and cost pressure widens, then the assessment of order quality should be downgraded. If deliveries and cash catch up, then the growth is more solid. The long-term narrative for defense demand can hold, but it cannot replace a line-by-line check of a company’s operating results, nor can it automatically justify chasing the stock at current levels.
Source: Lockheed Martin 2026 Q3, quarter ended September 27; announced October 22, verified October 26. The cash flow figure in the chart refers to the quarter, while orders refer to the ending backlog; the two were not mixed into the same basis.
https://investors.lockheedmartin.com/news-releases/news-release-details/lockheed-martin-reports-third-quarter-2026-financial-results
https://www.sec.gov/Archives/edgar/data/936468/000162828026066780/ex991q32026.htm
Lockheed Martin’s orders hit a record high, but cash realization cannot be judged by the headline alone
Lockheed Martin’s (LMT) orders are strong, but orders, revenue, and cash are three different report cards. Seeing $292 billion in backlog and immediately treating it as a profit guarantee skips the most important part: how these projects are produced, delivered, and then turned back into cash.
In the Q3 report released on October 22, sales were $20.7 billion, up 11% year over year; net profit was $1.8 billion, up 14%. At the same time, operating cash flow fell from $3.7 billion a year earlier to $3.4 billion, and free cash flow fell from $3.3 billion to $3.0 billion. These figures all come from the same release: profit growth and a decline in cash flow for the quarter are not contradictory, and you cannot pick one side and declare the business has clearly improved or worsened across the board.
The weight of orders also needs to be broken down. Quarter-end backlog was $292 billion, of which $52.5 billion was related to the PAC-3 MSE interceptor multiyear contract. Multiyear contracts increase visibility into future business, but they do not all turn into revenue in the quarter they are signed, and they certainly do not mean the same amount of cash has already arrived. Dividing total backlog by one quarter’s revenue and then treating the result as guaranteed growth over the next few years ignores both execution cycles and project structure.
My view is that orders solve only part of the question of whether there is work to do; realization still depends on whether the work can be completed on cost and on schedule. Capacity ramp-up, supplier deliveries, and milestone-based collections all affect the conversion pace. This is an explanation of the analytical framework, not a claim that the company had a specific delivery failure this quarter; a year-over-year decline in cash flow alone cannot accurately identify the cause.
Likewise, free cash flow of $3.0 billion is still positive, so the decline should not be described as a cash crunch. A more useful observation is whether deliveries and cash in the next few quarters can move along with revenue, rather than demanding that every quarter’s cash growth rate perfectly match profit.
I would place the next round of verification on order conversion, project profitability, and cash realization. If orders keep rising but conversion is slow and cost pressure widens, then the assessment of order quality should be downgraded. If deliveries and cash catch up, then the growth is more solid. The long-term narrative for defense demand can hold, but it cannot replace a line-by-line check of a company’s operating results, nor can it automatically justify chasing the stock at current levels.
Source: Lockheed Martin 2026 Q3, quarter ended September 27; announced October 22, verified October 26. The cash flow figure in the chart refers to the quarter, while orders refer to the ending backlog; the two were not mixed into the same basis.
https://investors.lockheedmartin.com/news-releases/news-release-details/lockheed-martin-reports-third-quarter-2026-financial-results
https://www.sec.gov/Archives/edgar/data/936468/000162828026066780/ex991q32026.htm
Lockheed Martin’s (LMT) orders are strong, but orders, revenue, and cash are three different report cards. Seeing $292 billion in backlog and immediately treating it as a profit guarantee skips the most important part: how these projects are produced, delivered, and then turned back into cash.
In the Q3 report released on October 22, sales were $20.7 billion, up 11% year over year; net profit was $1.8 billion, up 14%. At the same time, operating cash flow fell from $3.7 billion a year earlier to $3.4 billion, and free cash flow fell from $3.3 billion to $3.0 billion. These figures all come from the same release: profit growth and a decline in cash flow for the quarter are not contradictory, and you cannot pick one side and declare the business has clearly improved or worsened across the board.
The weight of orders also needs to be broken down. Quarter-end backlog was $292 billion, of which $52.5 billion was related to the PAC-3 MSE interceptor multiyear contract. Multiyear contracts increase visibility into future business, but they do not all turn into revenue in the quarter they are signed, and they certainly do not mean the same amount of cash has already arrived. Dividing total backlog by one quarter’s revenue and then treating the result as guaranteed growth over the next few years ignores both execution cycles and project structure.
My view is that orders solve only part of the question of whether there is work to do; realization still depends on whether the work can be completed on cost and on schedule. Capacity ramp-up, supplier deliveries, and milestone-based collections all affect the conversion pace. This is an explanation of the analytical framework, not a claim that the company had a specific delivery failure this quarter; a year-over-year decline in cash flow alone cannot accurately identify the cause.
Likewise, free cash flow of $3.0 billion is still positive, so the decline should not be described as a cash crunch. A more useful observation is whether deliveries and cash in the next few quarters can move along with revenue, rather than demanding that every quarter’s cash growth rate perfectly match profit.
I would place the next round of verification on order conversion, project profitability, and cash realization. If orders keep rising but conversion is slow and cost pressure widens, then the assessment of order quality should be downgraded. If deliveries and cash catch up, then the growth is more solid. The long-term narrative for defense demand can hold, but it cannot replace a line-by-line check of a company’s operating results, nor can it automatically justify chasing the stock at current levels.
Source: Lockheed Martin 2026 Q3, quarter ended September 27; announced October 22, verified October 26. The cash flow figure in the chart refers to the quarter, while orders refer to the ending backlog; the two were not mixed into the same basis.
https://investors.lockheedmartin.com/news-releases/news-release-details/lockheed-martin-reports-third-quarter-2026-financial-results
https://www.sec.gov/Archives/edgar/data/936468/000162828026066780/ex991q32026.htm
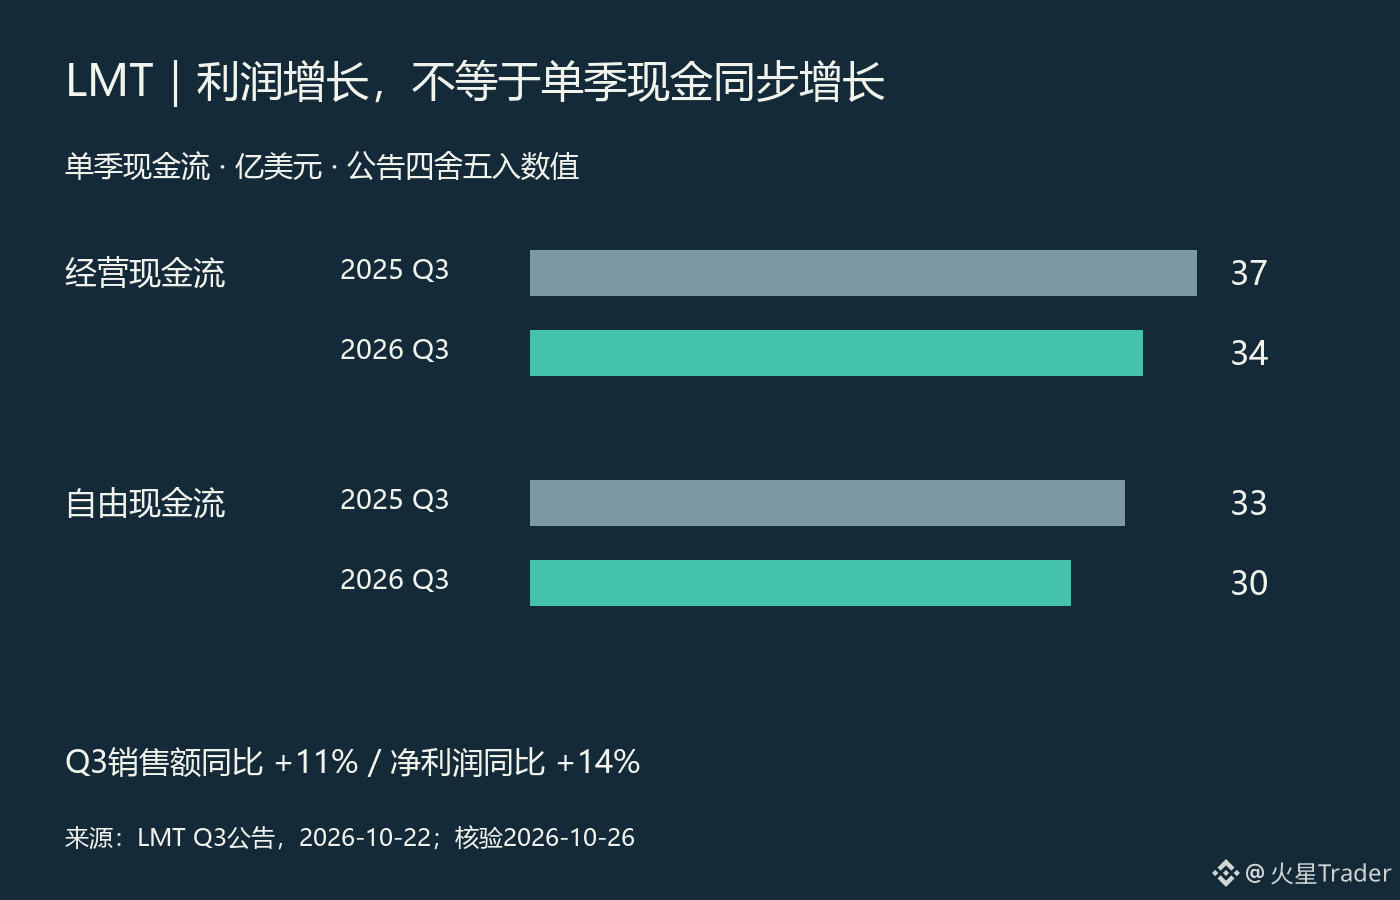
36
·
--
CME trading volume hits a record—don’t overlook how much revenue each contract brings in
When markets are volatile, does the exchange automatically make more money? The direction may be right, but there’s a step missing: revenue from additional trading depends on the fees per contract and the product mix. CME’s Q3 earnings report is a good way to clarify this point.
The company announced on October 21 that average daily volume in Q3 was 29.4 million contracts, a third-quarter record and up about 16% year over year. Revenue per contract (RPC) averaged $0.679, compared with $0.702 in the same period last year. Based on these two reported figures, RPC declined about 3.3% year over year. Trading can become more active while revenue per contract falls; both can happen at once, so you can’t draw a conclusion by focusing on just one of those numbers.
RPC is an average based on the actual trading mix. It does not mean the exchange lowered its listed fees across all products. Different contracts, customer types, and discount structures can all affect the average. Without a more detailed breakdown, we can’t attribute the entire decline in the average to competitive price cuts, nor assume that new trading is as valuable as existing trading.
Here’s a rough illustration looking only at volume and price: multiply the 16% increase in volume by the change in RPC: 1.16 × 0.679 ÷ 0.702, which comes to about 1.122, or an increase of roughly 12.2%. This is not a company revenue forecast or an exact reconstruction of reported revenue growth. Average daily volume also needs to be considered alongside the number of trading days, and other revenue cannot be included in this calculation. It simply shows that 16% volume growth does not automatically mean a 16% increase in trading-fee revenue.
There’s another, separate revenue stream: market data revenue reached $243 million in the quarter, up 20% year over year. This adds another dimension to the analysis, but it doesn’t justify treating the entire company as subscription software. Trading and clearing still depend on market activity, while the data business should be assessed separately for its sources of growth and how sustainable they are.
What matters more to me is how much revenue future trading growth will generate. If volume remains strong and RPC stabilizes, volume growth is more likely to translate into revenue. If volume growth slows while RPC continues to fall, “benefiting from volatility” alone won’t be enough. This is a discussion of the company’s operations; it doesn’t mean the stock must rise whenever the broader market falls. Valuation and expectations already priced in are separate questions.
Sources: CME Q3 2026; announcement dated 2026-10-21; verified 2026-10-26. RPC and average daily volume are quarterly figures; 12.2% is a simplified example in this article, not company guidance.
https://www.sec.gov/Archives/edgar/data/1156375/000115637526000065/exhibit9919302026.htm
https://investor.cmegroup.com/static-files/24c9441a-4542-4f83-803a-46fa149de4fb
https://investor.cmegroup.com/static-files/e9660b69-0368-4b23-b2ba-8a0dfb6abc57
CME trading volume hits a record—don’t overlook how much revenue each contract brings in
When markets are volatile, does the exchange automatically make more money? The direction may be right, but there’s a step missing: revenue from additional trading depends on the fees per contract and the product mix. CME’s Q3 earnings report is a good way to clarify this point.
The company announced on October 21 that average daily volume in Q3 was 29.4 million contracts, a third-quarter record and up about 16% year over year. Revenue per contract (RPC) averaged $0.679, compared with $0.702 in the same period last year. Based on these two reported figures, RPC declined about 3.3% year over year. Trading can become more active while revenue per contract falls; both can happen at once, so you can’t draw a conclusion by focusing on just one of those numbers.
RPC is an average based on the actual trading mix. It does not mean the exchange lowered its listed fees across all products. Different contracts, customer types, and discount structures can all affect the average. Without a more detailed breakdown, we can’t attribute the entire decline in the average to competitive price cuts, nor assume that new trading is as valuable as existing trading.
Here’s a rough illustration looking only at volume and price: multiply the 16% increase in volume by the change in RPC: 1.16 × 0.679 ÷ 0.702, which comes to about 1.122, or an increase of roughly 12.2%. This is not a company revenue forecast or an exact reconstruction of reported revenue growth. Average daily volume also needs to be considered alongside the number of trading days, and other revenue cannot be included in this calculation. It simply shows that 16% volume growth does not automatically mean a 16% increase in trading-fee revenue.
There’s another, separate revenue stream: market data revenue reached $243 million in the quarter, up 20% year over year. This adds another dimension to the analysis, but it doesn’t justify treating the entire company as subscription software. Trading and clearing still depend on market activity, while the data business should be assessed separately for its sources of growth and how sustainable they are.
What matters more to me is how much revenue future trading growth will generate. If volume remains strong and RPC stabilizes, volume growth is more likely to translate into revenue. If volume growth slows while RPC continues to fall, “benefiting from volatility” alone won’t be enough. This is a discussion of the company’s operations; it doesn’t mean the stock must rise whenever the broader market falls. Valuation and expectations already priced in are separate questions.
Sources: CME Q3 2026; announcement dated 2026-10-21; verified 2026-10-26. RPC and average daily volume are quarterly figures; 12.2% is a simplified example in this article, not company guidance.
https://www.sec.gov/Archives/edgar/data/1156375/000115637526000065/exhibit9919302026.htm
https://investor.cmegroup.com/static-files/24c9441a-4542-4f83-803a-46fa149de4fb
https://investor.cmegroup.com/static-files/e9660b69-0368-4b23-b2ba-8a0dfb6abc57
When markets are volatile, does the exchange automatically make more money? The direction may be right, but there’s a step missing: revenue from additional trading depends on the fees per contract and the product mix. CME’s Q3 earnings report is a good way to clarify this point.
The company announced on October 21 that average daily volume in Q3 was 29.4 million contracts, a third-quarter record and up about 16% year over year. Revenue per contract (RPC) averaged $0.679, compared with $0.702 in the same period last year. Based on these two reported figures, RPC declined about 3.3% year over year. Trading can become more active while revenue per contract falls; both can happen at once, so you can’t draw a conclusion by focusing on just one of those numbers.
RPC is an average based on the actual trading mix. It does not mean the exchange lowered its listed fees across all products. Different contracts, customer types, and discount structures can all affect the average. Without a more detailed breakdown, we can’t attribute the entire decline in the average to competitive price cuts, nor assume that new trading is as valuable as existing trading.
Here’s a rough illustration looking only at volume and price: multiply the 16% increase in volume by the change in RPC: 1.16 × 0.679 ÷ 0.702, which comes to about 1.122, or an increase of roughly 12.2%. This is not a company revenue forecast or an exact reconstruction of reported revenue growth. Average daily volume also needs to be considered alongside the number of trading days, and other revenue cannot be included in this calculation. It simply shows that 16% volume growth does not automatically mean a 16% increase in trading-fee revenue.
There’s another, separate revenue stream: market data revenue reached $243 million in the quarter, up 20% year over year. This adds another dimension to the analysis, but it doesn’t justify treating the entire company as subscription software. Trading and clearing still depend on market activity, while the data business should be assessed separately for its sources of growth and how sustainable they are.
What matters more to me is how much revenue future trading growth will generate. If volume remains strong and RPC stabilizes, volume growth is more likely to translate into revenue. If volume growth slows while RPC continues to fall, “benefiting from volatility” alone won’t be enough. This is a discussion of the company’s operations; it doesn’t mean the stock must rise whenever the broader market falls. Valuation and expectations already priced in are separate questions.
Sources: CME Q3 2026; announcement dated 2026-10-21; verified 2026-10-26. RPC and average daily volume are quarterly figures; 12.2% is a simplified example in this article, not company guidance.
https://www.sec.gov/Archives/edgar/data/1156375/000115637526000065/exhibit9919302026.htm
https://investor.cmegroup.com/static-files/24c9441a-4542-4f83-803a-46fa149de4fb
https://investor.cmegroup.com/static-files/e9660b69-0368-4b23-b2ba-8a0dfb6abc57
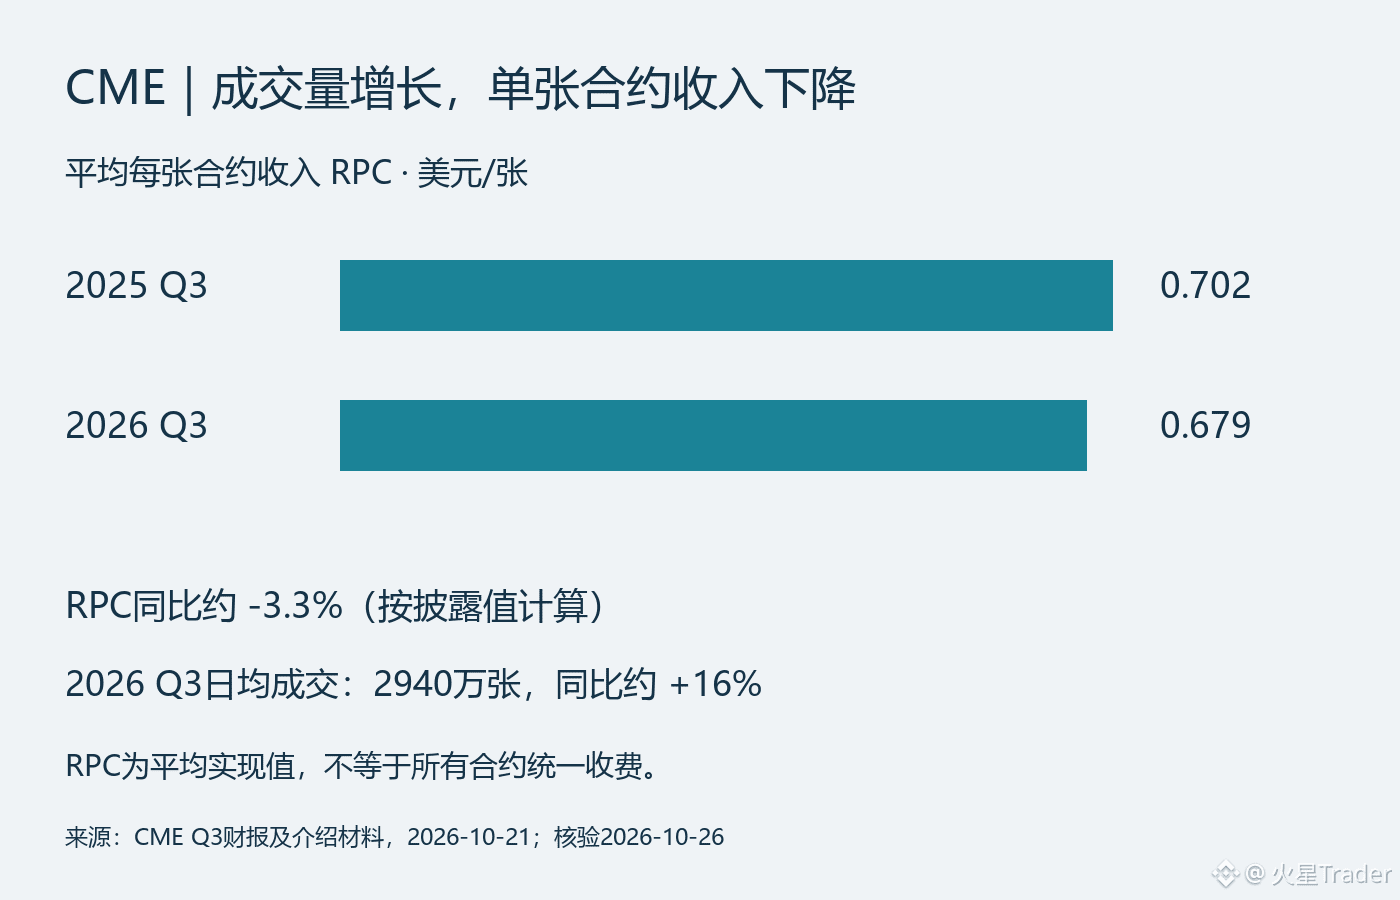
44
·
--
It’s not enough to ask how many surgical robots are sold; we also need to see how much hospitals use them
When I look at Intuitive Surgical (ISRG), I care more about whether procedure volumes can keep pace with the expansion of its installed base. Getting a device into a hospital is only the starting point of the commercial cycle; whether it continues to be used is what matters for subsequent instrument, accessory, and leasing revenue. Q3 growth was supported by underlying activity, but new placements shouldn’t be treated as one-off sales that generate immediate cash receipts.
On October 20, the company reported that for the quarter ended September 30, global da Vinci procedure volume grew about 14% year over year, Ion procedure volume grew about 31%, and the two combined grew about 15%. You can’t simply average 14% and 31%: the platforms differ in scale, so the combined growth rate has its own weighting. In line with this, instruments and accessories revenue rose 18% to $1.8 billion, showing that revenue growth isn’t coming from systems alone.
The company placed 546 da Vinci systems during the quarter, 291 of which were under operating leases; of those leased systems, 160 were usage-based. These figures are nested, not three mutually exclusive groups of machines. Since more than half of placements were operating leases, estimating quarterly system revenue by multiplying 546 by an assumed unit price would get the revenue recognition method wrong.
My take is that leasing adds an extra layer of “usage” between system placement and revenue realization. For usage-based systems, how frequently hospitals actually use them is especially worth tracking. But quarterly procedure totals and the installed base at quarter-end alone aren’t enough to calculate the utilization rate of the same cohort of systems precisely; we would also need to account for new versus existing systems, placement timing, and differences between platforms.
This is also why I’m reluctant to characterize the company solely by its robotics theme. Ongoing procedure demand supports instrument consumption, which is a strength of the business model. If system placements expand rapidly in the future but procedure and instrument growth fail to keep up, we’ll need to check whether the devices are truly entering routine use. Conversely, a fluctuation in system placements in a given quarter doesn’t necessarily mean demand has suddenly weakened, as long as usage and subsequent revenue remain steady.
In the next update, I’ll look at placements, procedure volume, and instrument revenue together, and use the leasing mix to help explain changes. The current data supports business expansion, but it isn’t enough on its own to answer whether the valuation is attractive—and sales growth certainly doesn’t mean the share price must rise.
Sources: Intuitive Q3 2026, quarter ended September 30, announced October 20; verified October 26. The accompanying chart shows the mix of placements during the quarter, not the revenue mix.
https://www.sec.gov/Archives/edgar/data/1035267/000103526726000067/q326ex-991earningsrelease.htm
It’s not enough to ask how many surgical robots are sold; we also need to see how much hospitals use them
When I look at Intuitive Surgical (ISRG), I care more about whether procedure volumes can keep pace with the expansion of its installed base. Getting a device into a hospital is only the starting point of the commercial cycle; whether it continues to be used is what matters for subsequent instrument, accessory, and leasing revenue. Q3 growth was supported by underlying activity, but new placements shouldn’t be treated as one-off sales that generate immediate cash receipts.
On October 20, the company reported that for the quarter ended September 30, global da Vinci procedure volume grew about 14% year over year, Ion procedure volume grew about 31%, and the two combined grew about 15%. You can’t simply average 14% and 31%: the platforms differ in scale, so the combined growth rate has its own weighting. In line with this, instruments and accessories revenue rose 18% to $1.8 billion, showing that revenue growth isn’t coming from systems alone.
The company placed 546 da Vinci systems during the quarter, 291 of which were under operating leases; of those leased systems, 160 were usage-based. These figures are nested, not three mutually exclusive groups of machines. Since more than half of placements were operating leases, estimating quarterly system revenue by multiplying 546 by an assumed unit price would get the revenue recognition method wrong.
My take is that leasing adds an extra layer of “usage” between system placement and revenue realization. For usage-based systems, how frequently hospitals actually use them is especially worth tracking. But quarterly procedure totals and the installed base at quarter-end alone aren’t enough to calculate the utilization rate of the same cohort of systems precisely; we would also need to account for new versus existing systems, placement timing, and differences between platforms.
This is also why I’m reluctant to characterize the company solely by its robotics theme. Ongoing procedure demand supports instrument consumption, which is a strength of the business model. If system placements expand rapidly in the future but procedure and instrument growth fail to keep up, we’ll need to check whether the devices are truly entering routine use. Conversely, a fluctuation in system placements in a given quarter doesn’t necessarily mean demand has suddenly weakened, as long as usage and subsequent revenue remain steady.
In the next update, I’ll look at placements, procedure volume, and instrument revenue together, and use the leasing mix to help explain changes. The current data supports business expansion, but it isn’t enough on its own to answer whether the valuation is attractive—and sales growth certainly doesn’t mean the share price must rise.
Sources: Intuitive Q3 2026, quarter ended September 30, announced October 20; verified October 26. The accompanying chart shows the mix of placements during the quarter, not the revenue mix.
https://www.sec.gov/Archives/edgar/data/1035267/000103526726000067/q326ex-991earningsrelease.htm
When I look at Intuitive Surgical (ISRG), I care more about whether procedure volumes can keep pace with the expansion of its installed base. Getting a device into a hospital is only the starting point of the commercial cycle; whether it continues to be used is what matters for subsequent instrument, accessory, and leasing revenue. Q3 growth was supported by underlying activity, but new placements shouldn’t be treated as one-off sales that generate immediate cash receipts.
On October 20, the company reported that for the quarter ended September 30, global da Vinci procedure volume grew about 14% year over year, Ion procedure volume grew about 31%, and the two combined grew about 15%. You can’t simply average 14% and 31%: the platforms differ in scale, so the combined growth rate has its own weighting. In line with this, instruments and accessories revenue rose 18% to $1.8 billion, showing that revenue growth isn’t coming from systems alone.
The company placed 546 da Vinci systems during the quarter, 291 of which were under operating leases; of those leased systems, 160 were usage-based. These figures are nested, not three mutually exclusive groups of machines. Since more than half of placements were operating leases, estimating quarterly system revenue by multiplying 546 by an assumed unit price would get the revenue recognition method wrong.
My take is that leasing adds an extra layer of “usage” between system placement and revenue realization. For usage-based systems, how frequently hospitals actually use them is especially worth tracking. But quarterly procedure totals and the installed base at quarter-end alone aren’t enough to calculate the utilization rate of the same cohort of systems precisely; we would also need to account for new versus existing systems, placement timing, and differences between platforms.
This is also why I’m reluctant to characterize the company solely by its robotics theme. Ongoing procedure demand supports instrument consumption, which is a strength of the business model. If system placements expand rapidly in the future but procedure and instrument growth fail to keep up, we’ll need to check whether the devices are truly entering routine use. Conversely, a fluctuation in system placements in a given quarter doesn’t necessarily mean demand has suddenly weakened, as long as usage and subsequent revenue remain steady.
In the next update, I’ll look at placements, procedure volume, and instrument revenue together, and use the leasing mix to help explain changes. The current data supports business expansion, but it isn’t enough on its own to answer whether the valuation is attractive—and sales growth certainly doesn’t mean the share price must rise.
Sources: Intuitive Q3 2026, quarter ended September 30, announced October 20; verified October 26. The accompanying chart shows the mix of placements during the quarter, not the revenue mix.
https://www.sec.gov/Archives/edgar/data/1035267/000103526726000067/q326ex-991earningsrelease.htm
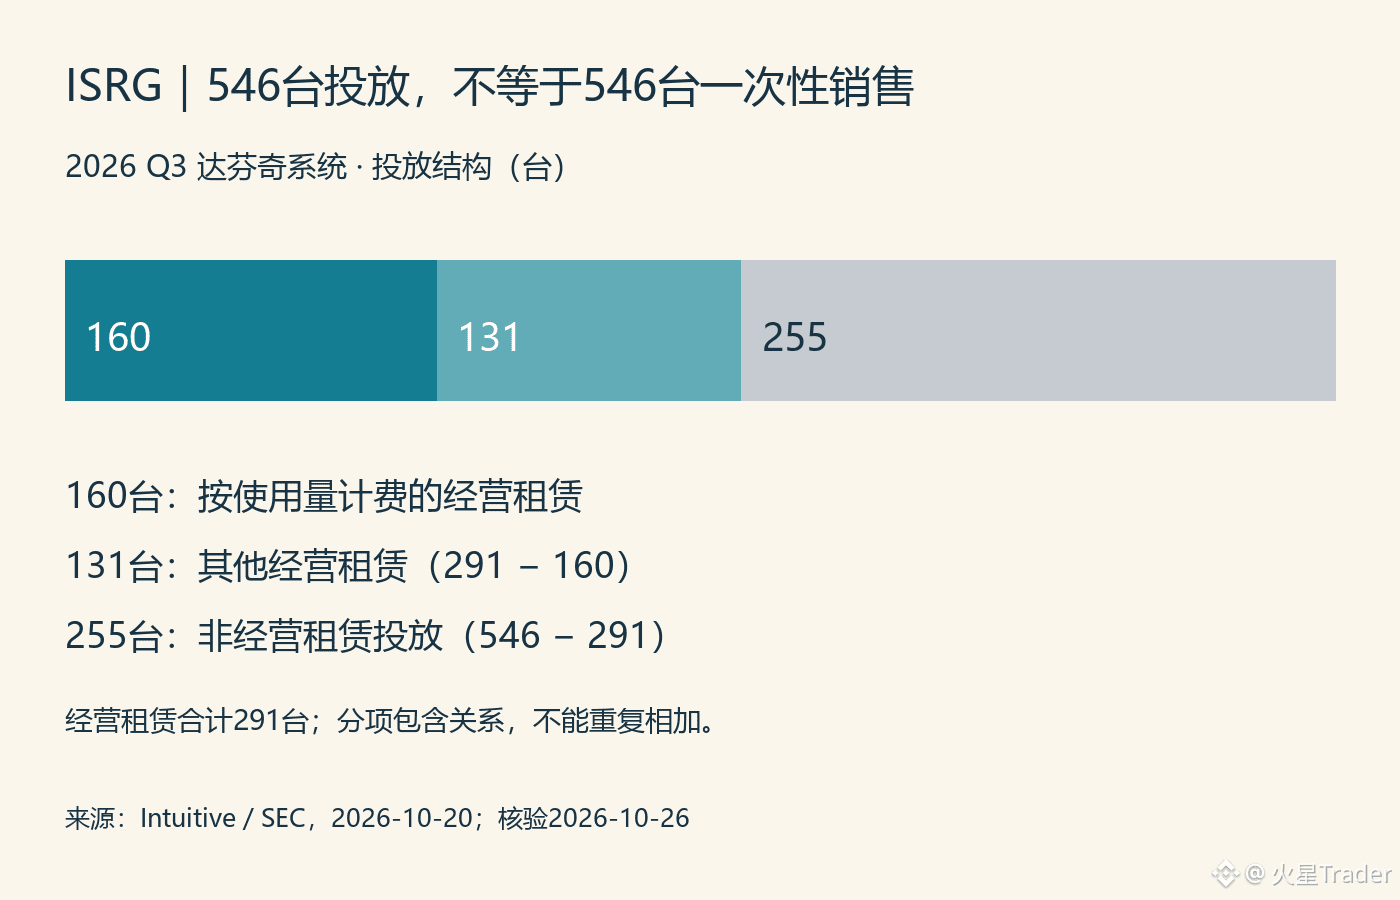
1
69
·
--
IBM’s Earnings Report: Don’t Focus Only on the Words “Software Growth”
IBM’s Q3 showed improvement, but not every business is moving upward together. What matters more to me is that software is driving growth, while consulting has yet to show a clear pickup; and improved profitability does not mean gross margin has strengthened. Separating these two points makes it easier to see where the company’s earnings are coming from right now.
In the quarterly results announced on October 21, total revenue was $17.1 billion, up 5% year over year, or 6% at constant currency. Software revenue grew 8%, consulting was flat, and infrastructure grew 4%; the latter three figures are all on a reported basis. Results also varied within software: Data grew 19%, while Automation declined 3%. The headline figure for “software growth” masks two very different business conditions.
My view is that it is more appropriate, for now, to see IBM’s growth as reflecting a divergence in its business mix—not as proof of a broad recovery in corporate technology budgets. Stronger software sales do not necessarily mean customers are also increasing spending on implementation, transformation, and consulting; of course, these segment growth rates alone are not enough to conclude that customers are cutting budgets either. To confirm that demand is broadening, we will need to see consulting revenue continue to catch up in subsequent quarters, rather than relying only on management’s technology narrative.
There is also a contrast in profitability. On an operating, non-GAAP basis, pretax margin rose to 19.3%, improving 0.7 percentage points year over year; yet gross margin on the same basis fell 0.2 percentage points to 58.5%. So the improvement in pretax margin cannot be directly taken to mean that the company has gained greater pricing power for its products. Expense efficiency, business mix, and adjusting items all need to be examined separately; don’t conflate margins at different levels. The operating measure also does not replace GAAP results.
Cash flow provides another source of support: the company raised its full-year free cash flow outlook to an increase of more than $1 billion year over year, while maintaining its expectation for full-year revenue growth of 4% to 5% at constant currency. This looks more like an improvement in expected cash realization than a broad increase in the company’s full-year revenue target.
For now, I’m inclined to acknowledge the improvement, but not extrapolate it into a broad-based acceleration. Next quarter, I’ll be watching three things: whether consulting catches up with software, whether the weaker areas within software narrow the gap, and whether gross margin stabilizes. If the only improvement is in expense efficiency, the growth story will need more evidence; if demand broadens and earnings quality improves alongside it, the outlook would merit an upgrade. This is an operating performance analysis and should not be taken as a claim that the current valuation is cheap or that the share price is bound to rise.
Source: IBM Q3 2026, quarter ended September 30; results announced October 21; verified October 26. All percentages are year over year, with the basis specified where relevant.
https://newsroom.ibm.com/2026-10-21-IBM-RELEASES-THIRD-QUARTER-RESULTS
IBM’s Earnings Report: Don’t Focus Only on the Words “Software Growth”
IBM’s Q3 showed improvement, but not every business is moving upward together. What matters more to me is that software is driving growth, while consulting has yet to show a clear pickup; and improved profitability does not mean gross margin has strengthened. Separating these two points makes it easier to see where the company’s earnings are coming from right now.
In the quarterly results announced on October 21, total revenue was $17.1 billion, up 5% year over year, or 6% at constant currency. Software revenue grew 8%, consulting was flat, and infrastructure grew 4%; the latter three figures are all on a reported basis. Results also varied within software: Data grew 19%, while Automation declined 3%. The headline figure for “software growth” masks two very different business conditions.
My view is that it is more appropriate, for now, to see IBM’s growth as reflecting a divergence in its business mix—not as proof of a broad recovery in corporate technology budgets. Stronger software sales do not necessarily mean customers are also increasing spending on implementation, transformation, and consulting; of course, these segment growth rates alone are not enough to conclude that customers are cutting budgets either. To confirm that demand is broadening, we will need to see consulting revenue continue to catch up in subsequent quarters, rather than relying only on management’s technology narrative.
There is also a contrast in profitability. On an operating, non-GAAP basis, pretax margin rose to 19.3%, improving 0.7 percentage points year over year; yet gross margin on the same basis fell 0.2 percentage points to 58.5%. So the improvement in pretax margin cannot be directly taken to mean that the company has gained greater pricing power for its products. Expense efficiency, business mix, and adjusting items all need to be examined separately; don’t conflate margins at different levels. The operating measure also does not replace GAAP results.
Cash flow provides another source of support: the company raised its full-year free cash flow outlook to an increase of more than $1 billion year over year, while maintaining its expectation for full-year revenue growth of 4% to 5% at constant currency. This looks more like an improvement in expected cash realization than a broad increase in the company’s full-year revenue target.
For now, I’m inclined to acknowledge the improvement, but not extrapolate it into a broad-based acceleration. Next quarter, I’ll be watching three things: whether consulting catches up with software, whether the weaker areas within software narrow the gap, and whether gross margin stabilizes. If the only improvement is in expense efficiency, the growth story will need more evidence; if demand broadens and earnings quality improves alongside it, the outlook would merit an upgrade. This is an operating performance analysis and should not be taken as a claim that the current valuation is cheap or that the share price is bound to rise.
Source: IBM Q3 2026, quarter ended September 30; results announced October 21; verified October 26. All percentages are year over year, with the basis specified where relevant.
https://newsroom.ibm.com/2026-10-21-IBM-RELEASES-THIRD-QUARTER-RESULTS
IBM’s Q3 showed improvement, but not every business is moving upward together. What matters more to me is that software is driving growth, while consulting has yet to show a clear pickup; and improved profitability does not mean gross margin has strengthened. Separating these two points makes it easier to see where the company’s earnings are coming from right now.
In the quarterly results announced on October 21, total revenue was $17.1 billion, up 5% year over year, or 6% at constant currency. Software revenue grew 8%, consulting was flat, and infrastructure grew 4%; the latter three figures are all on a reported basis. Results also varied within software: Data grew 19%, while Automation declined 3%. The headline figure for “software growth” masks two very different business conditions.
My view is that it is more appropriate, for now, to see IBM’s growth as reflecting a divergence in its business mix—not as proof of a broad recovery in corporate technology budgets. Stronger software sales do not necessarily mean customers are also increasing spending on implementation, transformation, and consulting; of course, these segment growth rates alone are not enough to conclude that customers are cutting budgets either. To confirm that demand is broadening, we will need to see consulting revenue continue to catch up in subsequent quarters, rather than relying only on management’s technology narrative.
There is also a contrast in profitability. On an operating, non-GAAP basis, pretax margin rose to 19.3%, improving 0.7 percentage points year over year; yet gross margin on the same basis fell 0.2 percentage points to 58.5%. So the improvement in pretax margin cannot be directly taken to mean that the company has gained greater pricing power for its products. Expense efficiency, business mix, and adjusting items all need to be examined separately; don’t conflate margins at different levels. The operating measure also does not replace GAAP results.
Cash flow provides another source of support: the company raised its full-year free cash flow outlook to an increase of more than $1 billion year over year, while maintaining its expectation for full-year revenue growth of 4% to 5% at constant currency. This looks more like an improvement in expected cash realization than a broad increase in the company’s full-year revenue target.
For now, I’m inclined to acknowledge the improvement, but not extrapolate it into a broad-based acceleration. Next quarter, I’ll be watching three things: whether consulting catches up with software, whether the weaker areas within software narrow the gap, and whether gross margin stabilizes. If the only improvement is in expense efficiency, the growth story will need more evidence; if demand broadens and earnings quality improves alongside it, the outlook would merit an upgrade. This is an operating performance analysis and should not be taken as a claim that the current valuation is cheap or that the share price is bound to rise.
Source: IBM Q3 2026, quarter ended September 30; results announced October 21; verified October 26. All percentages are year over year, with the basis specified where relevant.
https://newsroom.ibm.com/2026-10-21-IBM-RELEASES-THIRD-QUARTER-RESULTS
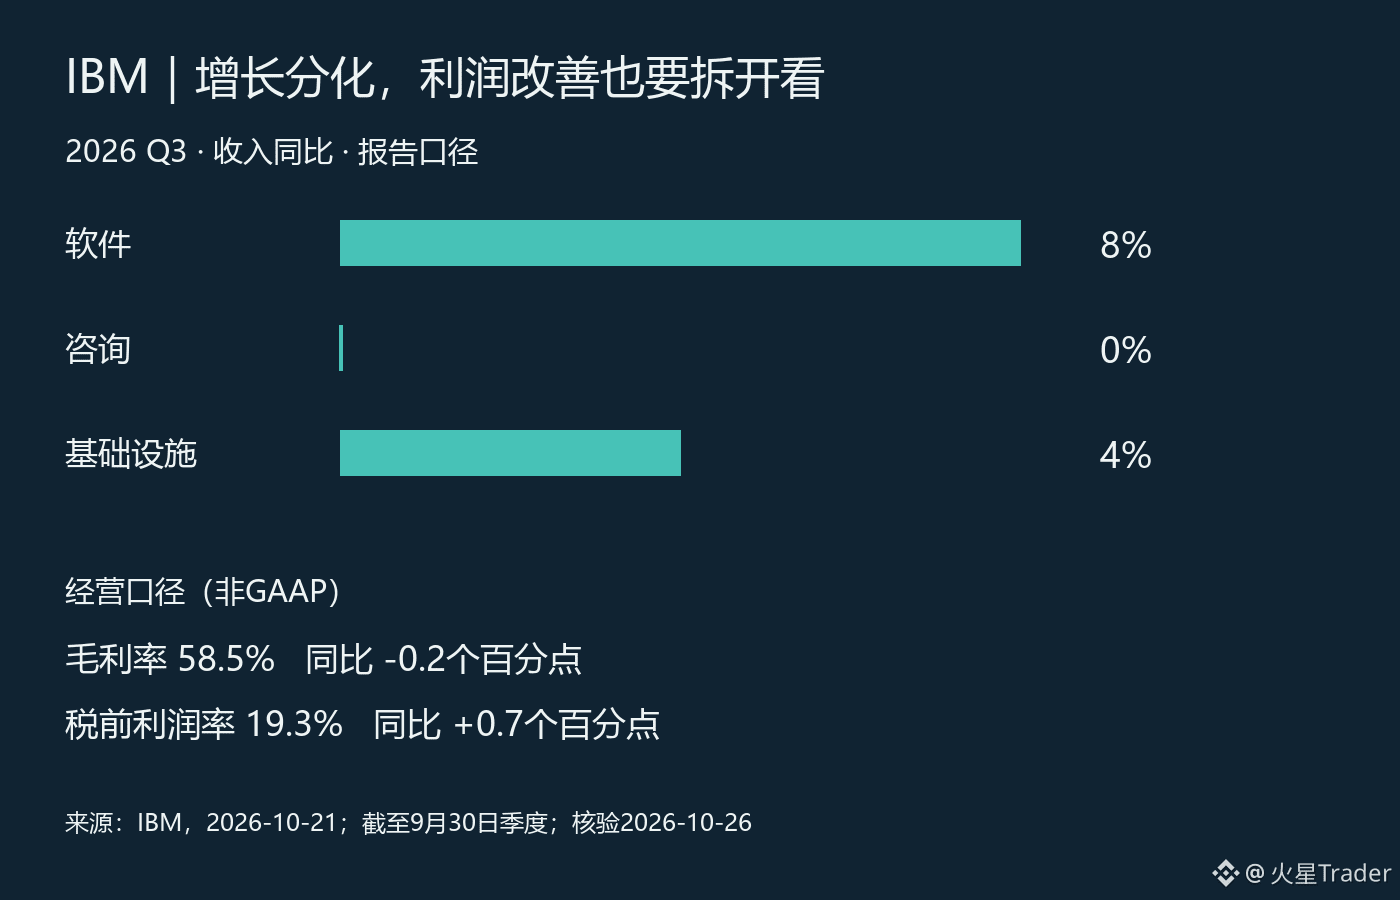
74
·
--
Coca-Cola Q2: Sales Growth, but Asia’s Price/Mix Still a Drag
As of October 25, Coca-Cola’s latest quarterly report is not Q3, but Q2, which was announced on July 28; Q3 is due before the opening of the U.S. stock market on October 27. Right now, the key thing to watch is not the “defensive stock” label, but whether sales growth can translate into more balanced revenue quality.
The disclosed Q2 data show that global unit case volume rose 5% year over year in Q2, net revenue increased 7% to $13.4 billion, and organic revenue grew 6%; price/mix contributed 2%, while concentrate sales contributed 4%. Comparable EPS was $0.97, up 11% year over year; comparable operating margin was 35.6%, versus 34.7% a year earlier. The company said it gained value share in the overall nonalcoholic ready-to-drink beverage category during the quarter.
Regional data showed a clear contrast: Asia Pacific unit case volume grew 8%, but price/mix fell 9%. The company explained this was mainly due to unfavorable mix and affordability actions, and it lost value share in India; North America volume rose 3% and price/mix increased 4%, while Latin America also posted 3% growth in both. This shows that growth is not only about how many cases are sold, but also what products, what markets, and what price points they are sold at. In Asia, a more affordable mix was used to drive volume; in the short term this can help preserve consumer reach, but it may also dilute revenue per case. This is an interpretation of the regional data, not a profit forecast given by the company.
My view is that Q2 shows the brand, distribution, and new products still have the ability to drive volume, but the room for “price-led growth” is uneven. The company said innovation contributed to volume growth and that comparable margin expansion was helped by organic growth, lower expenses, and currency tailwinds; at the same time, higher input costs and increased marketing spending remained offsetting factors. So the quarter’s margin improvement should not be simply extrapolated into continued expansion.
The October 27 Q3 update will be the next checkpoint: whether global volume keeps growing, whether Asia’s price/mix negative narrows, and whether the company revises its full-year outlook again. If volume remains strong but pricing deteriorates, the market will need to decide whether this is just a temporary affordability strategy or a weakening growth structure; before the results are released, Q3 figures remain unknown.
Source: quarterly period ending 2026-07-03, announced 2026-07-28; verified 2026-10-25. Price/mix is not the same as pure price increases.
https://www.coca-colacompany.com/media-center/coca-cola-reports-second-quarter-2026-results
https://investors.coca-colacompany.com/news-events/press-releases/detail/1173/the-coca-cola-company-announces-timing-of-third-quarter-2026-earnings-release
Coca-Cola Q2: Sales Growth, but Asia’s Price/Mix Still a Drag
As of October 25, Coca-Cola’s latest quarterly report is not Q3, but Q2, which was announced on July 28; Q3 is due before the opening of the U.S. stock market on October 27. Right now, the key thing to watch is not the “defensive stock” label, but whether sales growth can translate into more balanced revenue quality.
The disclosed Q2 data show that global unit case volume rose 5% year over year in Q2, net revenue increased 7% to $13.4 billion, and organic revenue grew 6%; price/mix contributed 2%, while concentrate sales contributed 4%. Comparable EPS was $0.97, up 11% year over year; comparable operating margin was 35.6%, versus 34.7% a year earlier. The company said it gained value share in the overall nonalcoholic ready-to-drink beverage category during the quarter.
Regional data showed a clear contrast: Asia Pacific unit case volume grew 8%, but price/mix fell 9%. The company explained this was mainly due to unfavorable mix and affordability actions, and it lost value share in India; North America volume rose 3% and price/mix increased 4%, while Latin America also posted 3% growth in both. This shows that growth is not only about how many cases are sold, but also what products, what markets, and what price points they are sold at. In Asia, a more affordable mix was used to drive volume; in the short term this can help preserve consumer reach, but it may also dilute revenue per case. This is an interpretation of the regional data, not a profit forecast given by the company.
My view is that Q2 shows the brand, distribution, and new products still have the ability to drive volume, but the room for “price-led growth” is uneven. The company said innovation contributed to volume growth and that comparable margin expansion was helped by organic growth, lower expenses, and currency tailwinds; at the same time, higher input costs and increased marketing spending remained offsetting factors. So the quarter’s margin improvement should not be simply extrapolated into continued expansion.
The October 27 Q3 update will be the next checkpoint: whether global volume keeps growing, whether Asia’s price/mix negative narrows, and whether the company revises its full-year outlook again. If volume remains strong but pricing deteriorates, the market will need to decide whether this is just a temporary affordability strategy or a weakening growth structure; before the results are released, Q3 figures remain unknown.
Source: quarterly period ending 2026-07-03, announced 2026-07-28; verified 2026-10-25. Price/mix is not the same as pure price increases.
https://www.coca-colacompany.com/media-center/coca-cola-reports-second-quarter-2026-results
https://investors.coca-colacompany.com/news-events/press-releases/detail/1173/the-coca-cola-company-announces-timing-of-third-quarter-2026-earnings-release
As of October 25, Coca-Cola’s latest quarterly report is not Q3, but Q2, which was announced on July 28; Q3 is due before the opening of the U.S. stock market on October 27. Right now, the key thing to watch is not the “defensive stock” label, but whether sales growth can translate into more balanced revenue quality.
The disclosed Q2 data show that global unit case volume rose 5% year over year in Q2, net revenue increased 7% to $13.4 billion, and organic revenue grew 6%; price/mix contributed 2%, while concentrate sales contributed 4%. Comparable EPS was $0.97, up 11% year over year; comparable operating margin was 35.6%, versus 34.7% a year earlier. The company said it gained value share in the overall nonalcoholic ready-to-drink beverage category during the quarter.
Regional data showed a clear contrast: Asia Pacific unit case volume grew 8%, but price/mix fell 9%. The company explained this was mainly due to unfavorable mix and affordability actions, and it lost value share in India; North America volume rose 3% and price/mix increased 4%, while Latin America also posted 3% growth in both. This shows that growth is not only about how many cases are sold, but also what products, what markets, and what price points they are sold at. In Asia, a more affordable mix was used to drive volume; in the short term this can help preserve consumer reach, but it may also dilute revenue per case. This is an interpretation of the regional data, not a profit forecast given by the company.
My view is that Q2 shows the brand, distribution, and new products still have the ability to drive volume, but the room for “price-led growth” is uneven. The company said innovation contributed to volume growth and that comparable margin expansion was helped by organic growth, lower expenses, and currency tailwinds; at the same time, higher input costs and increased marketing spending remained offsetting factors. So the quarter’s margin improvement should not be simply extrapolated into continued expansion.
The October 27 Q3 update will be the next checkpoint: whether global volume keeps growing, whether Asia’s price/mix negative narrows, and whether the company revises its full-year outlook again. If volume remains strong but pricing deteriorates, the market will need to decide whether this is just a temporary affordability strategy or a weakening growth structure; before the results are released, Q3 figures remain unknown.
Source: quarterly period ending 2026-07-03, announced 2026-07-28; verified 2026-10-25. Price/mix is not the same as pure price increases.
https://www.coca-colacompany.com/media-center/coca-cola-reports-second-quarter-2026-results
https://investors.coca-colacompany.com/news-events/press-releases/detail/1173/the-coca-cola-company-announces-timing-of-third-quarter-2026-earnings-release
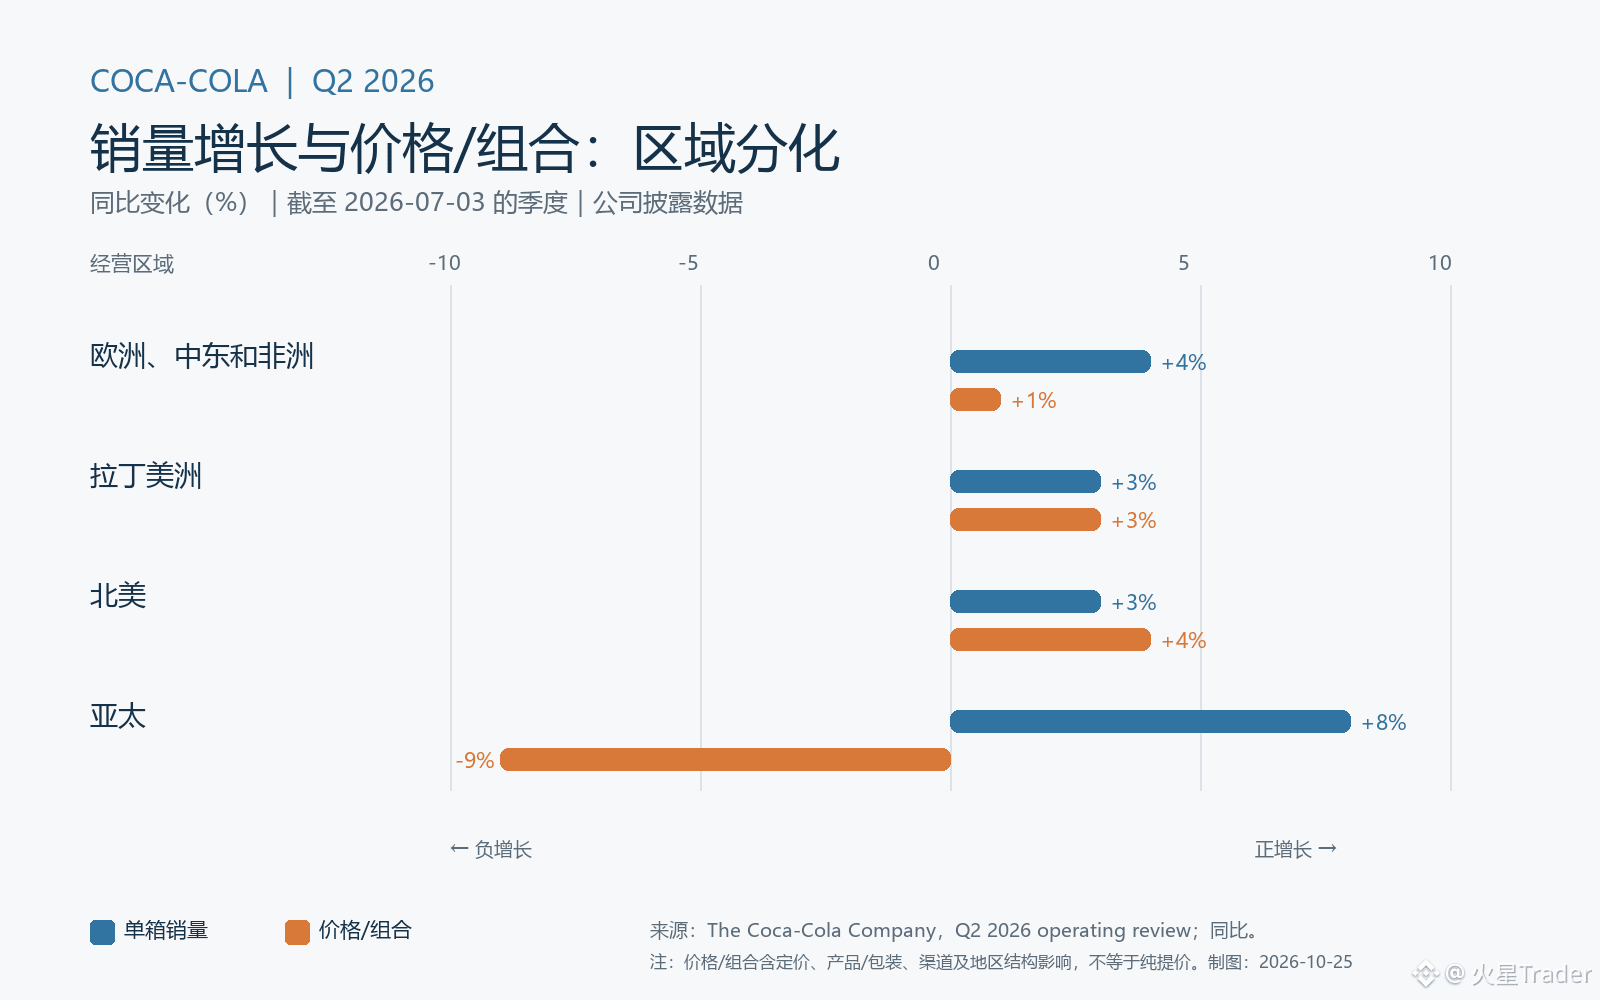
151
·
--
Apple earnings review: $2.02 EPS, first break out that $0.11
Before looking at Apple's next earnings report, I prefer to strip out the comparison base from the prior quarter first. Profit growth is a real reported result, but if it includes the help of specific items, simply copying the growth rate can easily mix improvements from different sources.
This review is of the third quarter of fiscal 2026, released on July 30 and ended June 27, not the newly announced results. Apple disclosed diluted EPS of $2.02 at the time, up 29% year over year, including a favorable impact of $0.11 per share from tariff refunds. The company's gross margin was 50.1%, also including about a 2 percentage point favorable impact from tariff refunds.
Using a simple subtraction on the disclosed figures, $2.02 minus $0.11 equals $1.91. This $1.91 is only an arithmetic figure to help understand the impact of that item; it is not another full adjusted earnings metric officially disclosed by the company, and it cannot be used directly to calculate year-over-year growth either: last year's basis, changes in share count, and other items have not been adjusted together.
This is also the step most often skipped in a review. Seeing EPS growth of 29% should not be attributed entirely to product sales or operating efficiency; seeing the refund contribution should not, in turn, negate the quarter's overall operating growth. In the same announcement, Apple disclosed revenue of $109.4 billion, up 16% year over year. Revenue and EPS each convey different information, and they should be explained by separating operating changes, cost effects, and per-share basis rather than using one figure to replace the entire judgment.
Gross margin is the same. An impact of about 2 percentage points refers to margin percentage points, not multiplying 50.1% by 2. Confusing the units may seem like a small calculation issue, but it can end up leading to a completely different assessment of profitability. Even if you roughly remove this impact, you still cannot conclude that the remaining gross margin is a level that can be maintained every quarter in the future.
For upcoming earnings reports, I will focus on whether similar favorable items continue to appear, how the product and services mix changes, and how management explains cost pressures. If new profit performance is mainly supported by operating factors rather than improvements driven by specific items, the judgment on sustainability should differ. As for whether refunds can be repeated and how large they may be in the future, this historical announcement does not provide an answer that can be directly extrapolated.
My conclusion is that good earnings analysis is not just about confirming growth in the numbers, but also about explaining where that growth came from. First keep the reported figure, then separately identify recognizable items, and finally wait for subsequent operating data to test sustainability. This article is a historical earnings review and does not include the current stock price, valuation conclusions, or unpublished earnings forecasts.
Source: Apple's Q3 FY2026 announcement, released 2026-07-30, covering results through 2026-06-27; verified on 2026-10-25. The chart is drawn using disclosed values; $1.91 is an arithmetic breakdown, not the official adjusted EPS.
Source: https://images.apple.com/newsroom/2026/07/apple-reports-third-quarter-results/
Apple earnings review: $2.02 EPS, first break out that $0.11
Before looking at Apple's next earnings report, I prefer to strip out the comparison base from the prior quarter first. Profit growth is a real reported result, but if it includes the help of specific items, simply copying the growth rate can easily mix improvements from different sources.
This review is of the third quarter of fiscal 2026, released on July 30 and ended June 27, not the newly announced results. Apple disclosed diluted EPS of $2.02 at the time, up 29% year over year, including a favorable impact of $0.11 per share from tariff refunds. The company's gross margin was 50.1%, also including about a 2 percentage point favorable impact from tariff refunds.
Using a simple subtraction on the disclosed figures, $2.02 minus $0.11 equals $1.91. This $1.91 is only an arithmetic figure to help understand the impact of that item; it is not another full adjusted earnings metric officially disclosed by the company, and it cannot be used directly to calculate year-over-year growth either: last year's basis, changes in share count, and other items have not been adjusted together.
This is also the step most often skipped in a review. Seeing EPS growth of 29% should not be attributed entirely to product sales or operating efficiency; seeing the refund contribution should not, in turn, negate the quarter's overall operating growth. In the same announcement, Apple disclosed revenue of $109.4 billion, up 16% year over year. Revenue and EPS each convey different information, and they should be explained by separating operating changes, cost effects, and per-share basis rather than using one figure to replace the entire judgment.
Gross margin is the same. An impact of about 2 percentage points refers to margin percentage points, not multiplying 50.1% by 2. Confusing the units may seem like a small calculation issue, but it can end up leading to a completely different assessment of profitability. Even if you roughly remove this impact, you still cannot conclude that the remaining gross margin is a level that can be maintained every quarter in the future.
For upcoming earnings reports, I will focus on whether similar favorable items continue to appear, how the product and services mix changes, and how management explains cost pressures. If new profit performance is mainly supported by operating factors rather than improvements driven by specific items, the judgment on sustainability should differ. As for whether refunds can be repeated and how large they may be in the future, this historical announcement does not provide an answer that can be directly extrapolated.
My conclusion is that good earnings analysis is not just about confirming growth in the numbers, but also about explaining where that growth came from. First keep the reported figure, then separately identify recognizable items, and finally wait for subsequent operating data to test sustainability. This article is a historical earnings review and does not include the current stock price, valuation conclusions, or unpublished earnings forecasts.
Source: Apple's Q3 FY2026 announcement, released 2026-07-30, covering results through 2026-06-27; verified on 2026-10-25. The chart is drawn using disclosed values; $1.91 is an arithmetic breakdown, not the official adjusted EPS.
Source: https://images.apple.com/newsroom/2026/07/apple-reports-third-quarter-results/
Before looking at Apple's next earnings report, I prefer to strip out the comparison base from the prior quarter first. Profit growth is a real reported result, but if it includes the help of specific items, simply copying the growth rate can easily mix improvements from different sources.
This review is of the third quarter of fiscal 2026, released on July 30 and ended June 27, not the newly announced results. Apple disclosed diluted EPS of $2.02 at the time, up 29% year over year, including a favorable impact of $0.11 per share from tariff refunds. The company's gross margin was 50.1%, also including about a 2 percentage point favorable impact from tariff refunds.
Using a simple subtraction on the disclosed figures, $2.02 minus $0.11 equals $1.91. This $1.91 is only an arithmetic figure to help understand the impact of that item; it is not another full adjusted earnings metric officially disclosed by the company, and it cannot be used directly to calculate year-over-year growth either: last year's basis, changes in share count, and other items have not been adjusted together.
This is also the step most often skipped in a review. Seeing EPS growth of 29% should not be attributed entirely to product sales or operating efficiency; seeing the refund contribution should not, in turn, negate the quarter's overall operating growth. In the same announcement, Apple disclosed revenue of $109.4 billion, up 16% year over year. Revenue and EPS each convey different information, and they should be explained by separating operating changes, cost effects, and per-share basis rather than using one figure to replace the entire judgment.
Gross margin is the same. An impact of about 2 percentage points refers to margin percentage points, not multiplying 50.1% by 2. Confusing the units may seem like a small calculation issue, but it can end up leading to a completely different assessment of profitability. Even if you roughly remove this impact, you still cannot conclude that the remaining gross margin is a level that can be maintained every quarter in the future.
For upcoming earnings reports, I will focus on whether similar favorable items continue to appear, how the product and services mix changes, and how management explains cost pressures. If new profit performance is mainly supported by operating factors rather than improvements driven by specific items, the judgment on sustainability should differ. As for whether refunds can be repeated and how large they may be in the future, this historical announcement does not provide an answer that can be directly extrapolated.
My conclusion is that good earnings analysis is not just about confirming growth in the numbers, but also about explaining where that growth came from. First keep the reported figure, then separately identify recognizable items, and finally wait for subsequent operating data to test sustainability. This article is a historical earnings review and does not include the current stock price, valuation conclusions, or unpublished earnings forecasts.
Source: Apple's Q3 FY2026 announcement, released 2026-07-30, covering results through 2026-06-27; verified on 2026-10-25. The chart is drawn using disclosed values; $1.91 is an arithmetic breakdown, not the official adjusted EPS.
Source: https://images.apple.com/newsroom/2026/07/apple-reports-third-quarter-results/
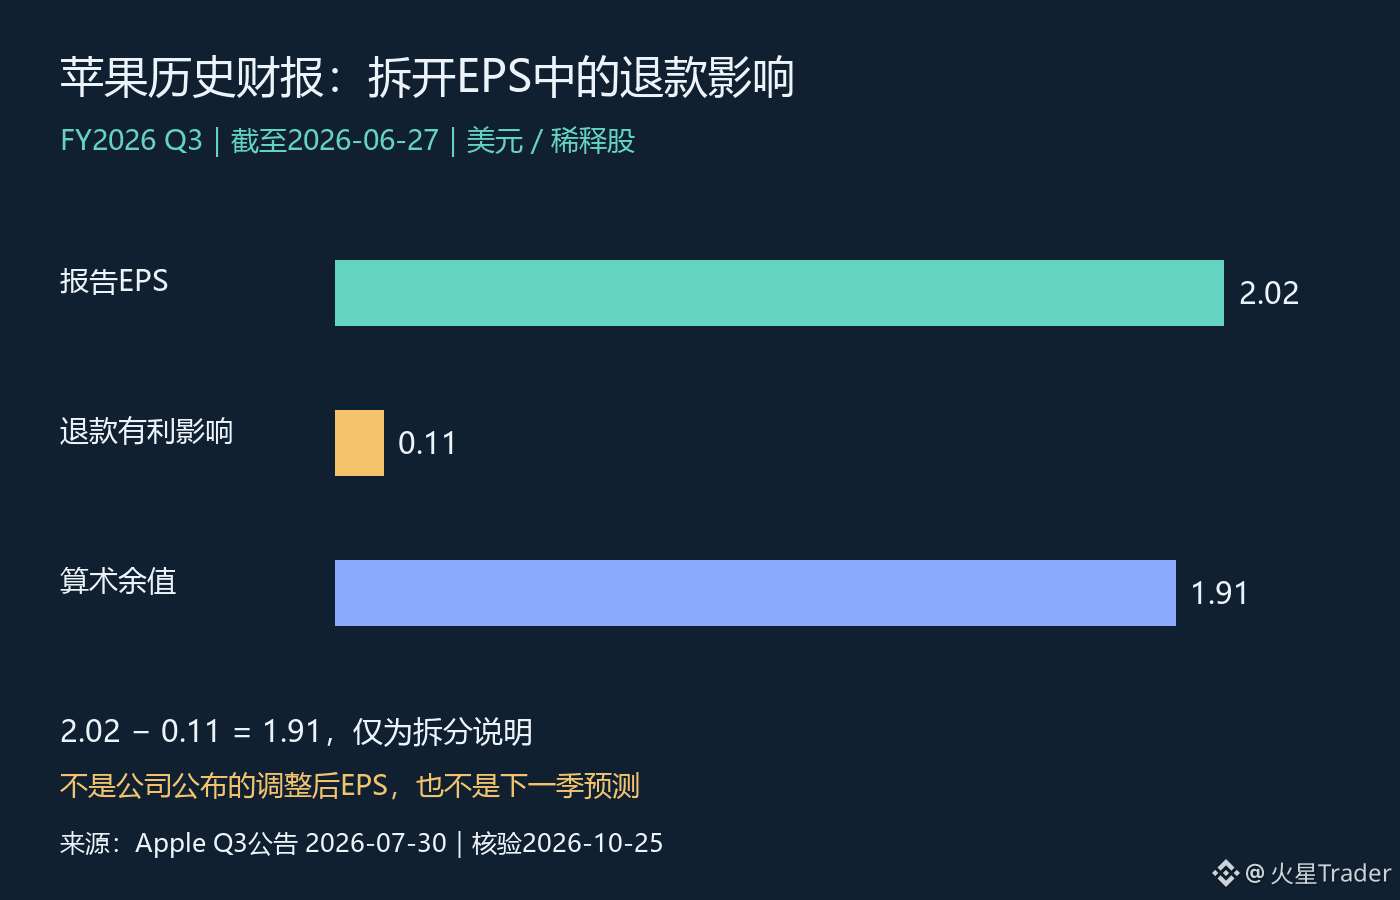
85
·
--
Microsoft’s earnings report next week: Increased AI investment does not directly prove demand is materializing
When I look at Microsoft’s AI story, I’m more interested in confirming how investment turns into customer spending than in focusing solely on the scale of that investment. Spending on infrastructure can show that the company is preparing supply; customers’ willingness to keep using and paying for it is the validation on the other side. There is a time lag between the two, as well as execution risk.
Microsoft announced on October 7 that it will report its first-quarter fiscal 2027 results after the market closes on Wednesday, October 28, U.S. local time. The conference call is scheduled for 14:30 Pacific Time. With daylight saving time in effect, that is 05:30 on October 29 Beijing time. What we can confirm now is the schedule; we cannot fill in growth rates, capital expenditures, or management guidance for an earnings report that has not yet been released.
This time, I’ll narrow the focus to the “investment–usage–returns” chain. First is the supply side: Are the new investments still in the procurement or construction phase, or have they already been put into service? If capacity is not yet online, current spending and current-period revenue cannot be mechanically matched. Increased investment alone proves neither insufficient demand nor successful commercialization; it needs to be assessed alongside the company’s disclosures on deployment timelines.
Next is the demand side. We need to verify actual revenue and management’s explanations of customer usage, rather than treating all contracts, orders, or future commitments as current revenue. If the company discloses relevant metrics, we should first examine their definitions, reporting periods, and basis of comparison before discussing changes. A business commitment spanning multiple years and a service already delivered in a single quarter cannot be measured on the same scale.
Only then comes the question of returns. Even if usage grows, the profits shareholders retain may not increase at the same pace if the costs of providing the service rise alongside it. Infrastructure depreciation, operating costs, and utilization need to be considered together with revenue. This is an analytical framework, not a claim that Microsoft has seen a particular change in costs or utilization this quarter.
In particular, avoid two conclusions drawn too quickly: seeing investment rise and deciding that AI demand has already expanded without limit; or seeing substantial cash spending and deciding that long-term returns are bound to fail. Investment and returns often span multiple periods. The real question is whether subsequent data can gradually narrow this time lag—not whether one quarter’s figures can deliver a verdict on the entire cycle.
The same applies to valuing MSFT. There is still a gap between operating growth and whether the stock is attractive: the market’s existing expectations and the price investors pay. This article has not verified the current valuation or consensus expectations, so I won’t call the stock “undervalued” or say it is “certain to beat expectations.” After the results are released, first check the evidence that demand is materializing, then examine explanations of costs and investment, and finally assess whether the forward outlook is internally consistent. Only when these pieces fit together can AI investment be more meaningfully evaluated as a source of commercial returns.
Sources: Microsoft’s official earnings announcement (2026-10-07), verified on 2026-10-24. Other than the schedule, the article presents analysis that remains to be verified; it contains no unreleased results or real-time market data. The accompanying image is illustrative.
Source: https://news.microsoft.com/source/2026/10/07/microsoft-announces-quarterly-earnings-release-date-69/
Microsoft’s earnings report next week: Increased AI investment does not directly prove demand is materializing
When I look at Microsoft’s AI story, I’m more interested in confirming how investment turns into customer spending than in focusing solely on the scale of that investment. Spending on infrastructure can show that the company is preparing supply; customers’ willingness to keep using and paying for it is the validation on the other side. There is a time lag between the two, as well as execution risk.
Microsoft announced on October 7 that it will report its first-quarter fiscal 2027 results after the market closes on Wednesday, October 28, U.S. local time. The conference call is scheduled for 14:30 Pacific Time. With daylight saving time in effect, that is 05:30 on October 29 Beijing time. What we can confirm now is the schedule; we cannot fill in growth rates, capital expenditures, or management guidance for an earnings report that has not yet been released.
This time, I’ll narrow the focus to the “investment–usage–returns” chain. First is the supply side: Are the new investments still in the procurement or construction phase, or have they already been put into service? If capacity is not yet online, current spending and current-period revenue cannot be mechanically matched. Increased investment alone proves neither insufficient demand nor successful commercialization; it needs to be assessed alongside the company’s disclosures on deployment timelines.
Next is the demand side. We need to verify actual revenue and management’s explanations of customer usage, rather than treating all contracts, orders, or future commitments as current revenue. If the company discloses relevant metrics, we should first examine their definitions, reporting periods, and basis of comparison before discussing changes. A business commitment spanning multiple years and a service already delivered in a single quarter cannot be measured on the same scale.
Only then comes the question of returns. Even if usage grows, the profits shareholders retain may not increase at the same pace if the costs of providing the service rise alongside it. Infrastructure depreciation, operating costs, and utilization need to be considered together with revenue. This is an analytical framework, not a claim that Microsoft has seen a particular change in costs or utilization this quarter.
In particular, avoid two conclusions drawn too quickly: seeing investment rise and deciding that AI demand has already expanded without limit; or seeing substantial cash spending and deciding that long-term returns are bound to fail. Investment and returns often span multiple periods. The real question is whether subsequent data can gradually narrow this time lag—not whether one quarter’s figures can deliver a verdict on the entire cycle.
The same applies to valuing MSFT. There is still a gap between operating growth and whether the stock is attractive: the market’s existing expectations and the price investors pay. This article has not verified the current valuation or consensus expectations, so I won’t call the stock “undervalued” or say it is “certain to beat expectations.” After the results are released, first check the evidence that demand is materializing, then examine explanations of costs and investment, and finally assess whether the forward outlook is internally consistent. Only when these pieces fit together can AI investment be more meaningfully evaluated as a source of commercial returns.
Sources: Microsoft’s official earnings announcement (2026-10-07), verified on 2026-10-24. Other than the schedule, the article presents analysis that remains to be verified; it contains no unreleased results or real-time market data. The accompanying image is illustrative.
Source: https://news.microsoft.com/source/2026/10/07/microsoft-announces-quarterly-earnings-release-date-69/
When I look at Microsoft’s AI story, I’m more interested in confirming how investment turns into customer spending than in focusing solely on the scale of that investment. Spending on infrastructure can show that the company is preparing supply; customers’ willingness to keep using and paying for it is the validation on the other side. There is a time lag between the two, as well as execution risk.
Microsoft announced on October 7 that it will report its first-quarter fiscal 2027 results after the market closes on Wednesday, October 28, U.S. local time. The conference call is scheduled for 14:30 Pacific Time. With daylight saving time in effect, that is 05:30 on October 29 Beijing time. What we can confirm now is the schedule; we cannot fill in growth rates, capital expenditures, or management guidance for an earnings report that has not yet been released.
This time, I’ll narrow the focus to the “investment–usage–returns” chain. First is the supply side: Are the new investments still in the procurement or construction phase, or have they already been put into service? If capacity is not yet online, current spending and current-period revenue cannot be mechanically matched. Increased investment alone proves neither insufficient demand nor successful commercialization; it needs to be assessed alongside the company’s disclosures on deployment timelines.
Next is the demand side. We need to verify actual revenue and management’s explanations of customer usage, rather than treating all contracts, orders, or future commitments as current revenue. If the company discloses relevant metrics, we should first examine their definitions, reporting periods, and basis of comparison before discussing changes. A business commitment spanning multiple years and a service already delivered in a single quarter cannot be measured on the same scale.
Only then comes the question of returns. Even if usage grows, the profits shareholders retain may not increase at the same pace if the costs of providing the service rise alongside it. Infrastructure depreciation, operating costs, and utilization need to be considered together with revenue. This is an analytical framework, not a claim that Microsoft has seen a particular change in costs or utilization this quarter.
In particular, avoid two conclusions drawn too quickly: seeing investment rise and deciding that AI demand has already expanded without limit; or seeing substantial cash spending and deciding that long-term returns are bound to fail. Investment and returns often span multiple periods. The real question is whether subsequent data can gradually narrow this time lag—not whether one quarter’s figures can deliver a verdict on the entire cycle.
The same applies to valuing MSFT. There is still a gap between operating growth and whether the stock is attractive: the market’s existing expectations and the price investors pay. This article has not verified the current valuation or consensus expectations, so I won’t call the stock “undervalued” or say it is “certain to beat expectations.” After the results are released, first check the evidence that demand is materializing, then examine explanations of costs and investment, and finally assess whether the forward outlook is internally consistent. Only when these pieces fit together can AI investment be more meaningfully evaluated as a source of commercial returns.
Sources: Microsoft’s official earnings announcement (2026-10-07), verified on 2026-10-24. Other than the schedule, the article presents analysis that remains to be verified; it contains no unreleased results or real-time market data. The accompanying image is illustrative.
Source: https://news.microsoft.com/source/2026/10/07/microsoft-announces-quarterly-earnings-release-date-69/

39
·
--
Nasdaq’s Earnings: Index Business Is Strong, but Don’t Treat ARR as Quarterly Revenue
You can’t analyze Nasdaq, Inc. (NDAQ) simply by applying the logic of Nasdaq index movements. It is a publicly traded company that operates financial infrastructure and related services; the index itself is a separate thing. As I review these earnings over the weekend, I’m most interested in whether growth across different businesses can reinforce one another.
In the third-quarter results announced on October 22, the company reported net revenue of about $1.5 billion, up 13% year over year; financial technology revenue of $529 million, up 16%; and index business revenue of $286 million, up 39%. The growth rates across businesses differed markedly in the same quarter, so a single overall growth rate doesn’t tell the whole story.
The 39% growth in the index business is particularly striking, but a high growth rate doesn’t mean it was the sole source of growth. Rapid growth from a smaller base contributes differently to overall revenue than steady growth from a larger business. Analysis should consider both percentages and the amounts they represent; focusing only on the highest figure can easily lead to overestimating one business’s impact on the company as a whole.
Another figure that can be easy to confuse is ARR of $3.4 billion—the annualized recurring revenue metric—which the company said grew 12% year over year, or 14% on an organic basis. It is measured over a different time period from net revenue recognized in the current quarter. And you can’t simply add $3.4 billion to $1.5 billion to create a larger “revenue” figure. I treat ARR as an additional clue to the scale of the recurring business, then look to subsequent actual revenue and cash performance to test that picture, rather than treating an annualized figure as money already received.
Organic growth and reported growth should also be considered separately. The difference between the two measures is a reminder that overall change may not come entirely from the expansion of existing businesses. To assess the quality of growth, we still need to review the company’s explanation of its adjustments; the higher figure shouldn’t automatically be treated as the more accurate one.
My takeaway is that these results provide concrete evidence of divergent growth across the businesses: the index business has notable momentum, and financial technology is growing too. But “revenue growth” still has to pass several tests before it translates into “improved shareholder returns”—costs, investment, and valuation. If maintaining growth requires a corresponding increase in expenses as revenue expands, profit realization may follow a different timeline. The case is more convincing if expansion in recurring businesses also generates stable cash flow.
Looking ahead, I’ll be watching three things: whether the index business can sustain its rapid revenue growth; whether financial technology revenue corroborates the recurring revenue metrics; and how much of the new revenue translates into profit and cash. This article does not verify the current share price or consensus expectations, so it does not conclude that NDAQ is cheap or treat it as a proxy for the direction of the Nasdaq index.
Source: Nasdaq, Inc. third-quarter 2026 earnings release, published 2026-10-22 and verified 2026-10-24. All chart figures show reported growth rates relative to the third quarter of 2025. The businesses overlap, so their figures should not be added together; the analysis is conditional.
https://ir.nasdaq.com/news-releases/news-release-details/nasdaq-reports-third-quarter-2026-results-strong-execution
Nasdaq’s Earnings: Index Business Is Strong, but Don’t Treat ARR as Quarterly Revenue
You can’t analyze Nasdaq, Inc. (NDAQ) simply by applying the logic of Nasdaq index movements. It is a publicly traded company that operates financial infrastructure and related services; the index itself is a separate thing. As I review these earnings over the weekend, I’m most interested in whether growth across different businesses can reinforce one another.
In the third-quarter results announced on October 22, the company reported net revenue of about $1.5 billion, up 13% year over year; financial technology revenue of $529 million, up 16%; and index business revenue of $286 million, up 39%. The growth rates across businesses differed markedly in the same quarter, so a single overall growth rate doesn’t tell the whole story.
The 39% growth in the index business is particularly striking, but a high growth rate doesn’t mean it was the sole source of growth. Rapid growth from a smaller base contributes differently to overall revenue than steady growth from a larger business. Analysis should consider both percentages and the amounts they represent; focusing only on the highest figure can easily lead to overestimating one business’s impact on the company as a whole.
Another figure that can be easy to confuse is ARR of $3.4 billion—the annualized recurring revenue metric—which the company said grew 12% year over year, or 14% on an organic basis. It is measured over a different time period from net revenue recognized in the current quarter. And you can’t simply add $3.4 billion to $1.5 billion to create a larger “revenue” figure. I treat ARR as an additional clue to the scale of the recurring business, then look to subsequent actual revenue and cash performance to test that picture, rather than treating an annualized figure as money already received.
Organic growth and reported growth should also be considered separately. The difference between the two measures is a reminder that overall change may not come entirely from the expansion of existing businesses. To assess the quality of growth, we still need to review the company’s explanation of its adjustments; the higher figure shouldn’t automatically be treated as the more accurate one.
My takeaway is that these results provide concrete evidence of divergent growth across the businesses: the index business has notable momentum, and financial technology is growing too. But “revenue growth” still has to pass several tests before it translates into “improved shareholder returns”—costs, investment, and valuation. If maintaining growth requires a corresponding increase in expenses as revenue expands, profit realization may follow a different timeline. The case is more convincing if expansion in recurring businesses also generates stable cash flow.
Looking ahead, I’ll be watching three things: whether the index business can sustain its rapid revenue growth; whether financial technology revenue corroborates the recurring revenue metrics; and how much of the new revenue translates into profit and cash. This article does not verify the current share price or consensus expectations, so it does not conclude that NDAQ is cheap or treat it as a proxy for the direction of the Nasdaq index.
Source: Nasdaq, Inc. third-quarter 2026 earnings release, published 2026-10-22 and verified 2026-10-24. All chart figures show reported growth rates relative to the third quarter of 2025. The businesses overlap, so their figures should not be added together; the analysis is conditional.
https://ir.nasdaq.com/news-releases/news-release-details/nasdaq-reports-third-quarter-2026-results-strong-execution
You can’t analyze Nasdaq, Inc. (NDAQ) simply by applying the logic of Nasdaq index movements. It is a publicly traded company that operates financial infrastructure and related services; the index itself is a separate thing. As I review these earnings over the weekend, I’m most interested in whether growth across different businesses can reinforce one another.
In the third-quarter results announced on October 22, the company reported net revenue of about $1.5 billion, up 13% year over year; financial technology revenue of $529 million, up 16%; and index business revenue of $286 million, up 39%. The growth rates across businesses differed markedly in the same quarter, so a single overall growth rate doesn’t tell the whole story.
The 39% growth in the index business is particularly striking, but a high growth rate doesn’t mean it was the sole source of growth. Rapid growth from a smaller base contributes differently to overall revenue than steady growth from a larger business. Analysis should consider both percentages and the amounts they represent; focusing only on the highest figure can easily lead to overestimating one business’s impact on the company as a whole.
Another figure that can be easy to confuse is ARR of $3.4 billion—the annualized recurring revenue metric—which the company said grew 12% year over year, or 14% on an organic basis. It is measured over a different time period from net revenue recognized in the current quarter. And you can’t simply add $3.4 billion to $1.5 billion to create a larger “revenue” figure. I treat ARR as an additional clue to the scale of the recurring business, then look to subsequent actual revenue and cash performance to test that picture, rather than treating an annualized figure as money already received.
Organic growth and reported growth should also be considered separately. The difference between the two measures is a reminder that overall change may not come entirely from the expansion of existing businesses. To assess the quality of growth, we still need to review the company’s explanation of its adjustments; the higher figure shouldn’t automatically be treated as the more accurate one.
My takeaway is that these results provide concrete evidence of divergent growth across the businesses: the index business has notable momentum, and financial technology is growing too. But “revenue growth” still has to pass several tests before it translates into “improved shareholder returns”—costs, investment, and valuation. If maintaining growth requires a corresponding increase in expenses as revenue expands, profit realization may follow a different timeline. The case is more convincing if expansion in recurring businesses also generates stable cash flow.
Looking ahead, I’ll be watching three things: whether the index business can sustain its rapid revenue growth; whether financial technology revenue corroborates the recurring revenue metrics; and how much of the new revenue translates into profit and cash. This article does not verify the current share price or consensus expectations, so it does not conclude that NDAQ is cheap or treat it as a proxy for the direction of the Nasdaq index.
Source: Nasdaq, Inc. third-quarter 2026 earnings release, published 2026-10-22 and verified 2026-10-24. All chart figures show reported growth rates relative to the third quarter of 2025. The businesses overlap, so their figures should not be added together; the analysis is conditional.
https://ir.nasdaq.com/news-releases/news-release-details/nasdaq-reports-third-quarter-2026-results-strong-execution
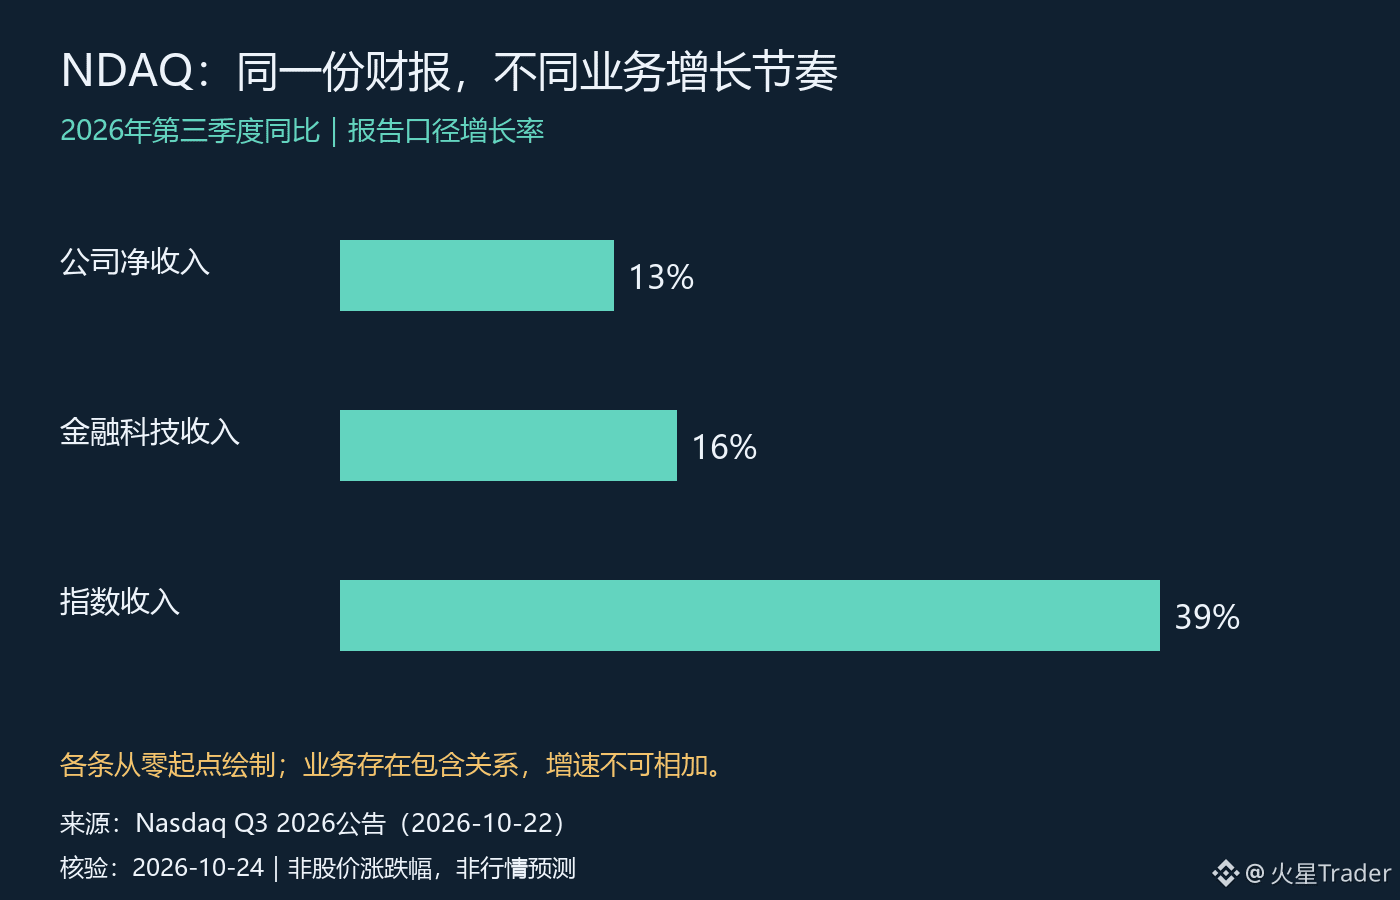
65
Log in to explore more content
Join global crypto users on Binance Square
⚡️ Get latest and useful information about crypto.
💬 Trusted by the world’s largest crypto exchange.
👍 Discover real insights from verified creators.
Email / Phone number
Trending Topics
NvidiaBeatsEstimatesWith$130BQ4Outlook
53,888 views
276 Discussing
Nvidia Beats With $115.8 Billion in Revenue, Guides to $130 Billion and Adds $150 Billion Buyback
Binance News
·73 Likes
·48.4k views
AnthropicIPOPriceCouldExceed$80
54,874 views
236 Discussing
RussiaCentralBankAddsAlfaBankToCryptoExchangeRegister
3,034 views
43 Discussing