
TEKT0NIC 1
1k Posts

TEKT0NIC 1
Report
Block User
Passionate about crypto and blockchain | Crypto Enthusiastic | Technical Analysis | Fundamental News
0 Following
8 Followers
37 Liked
Posts
·
--
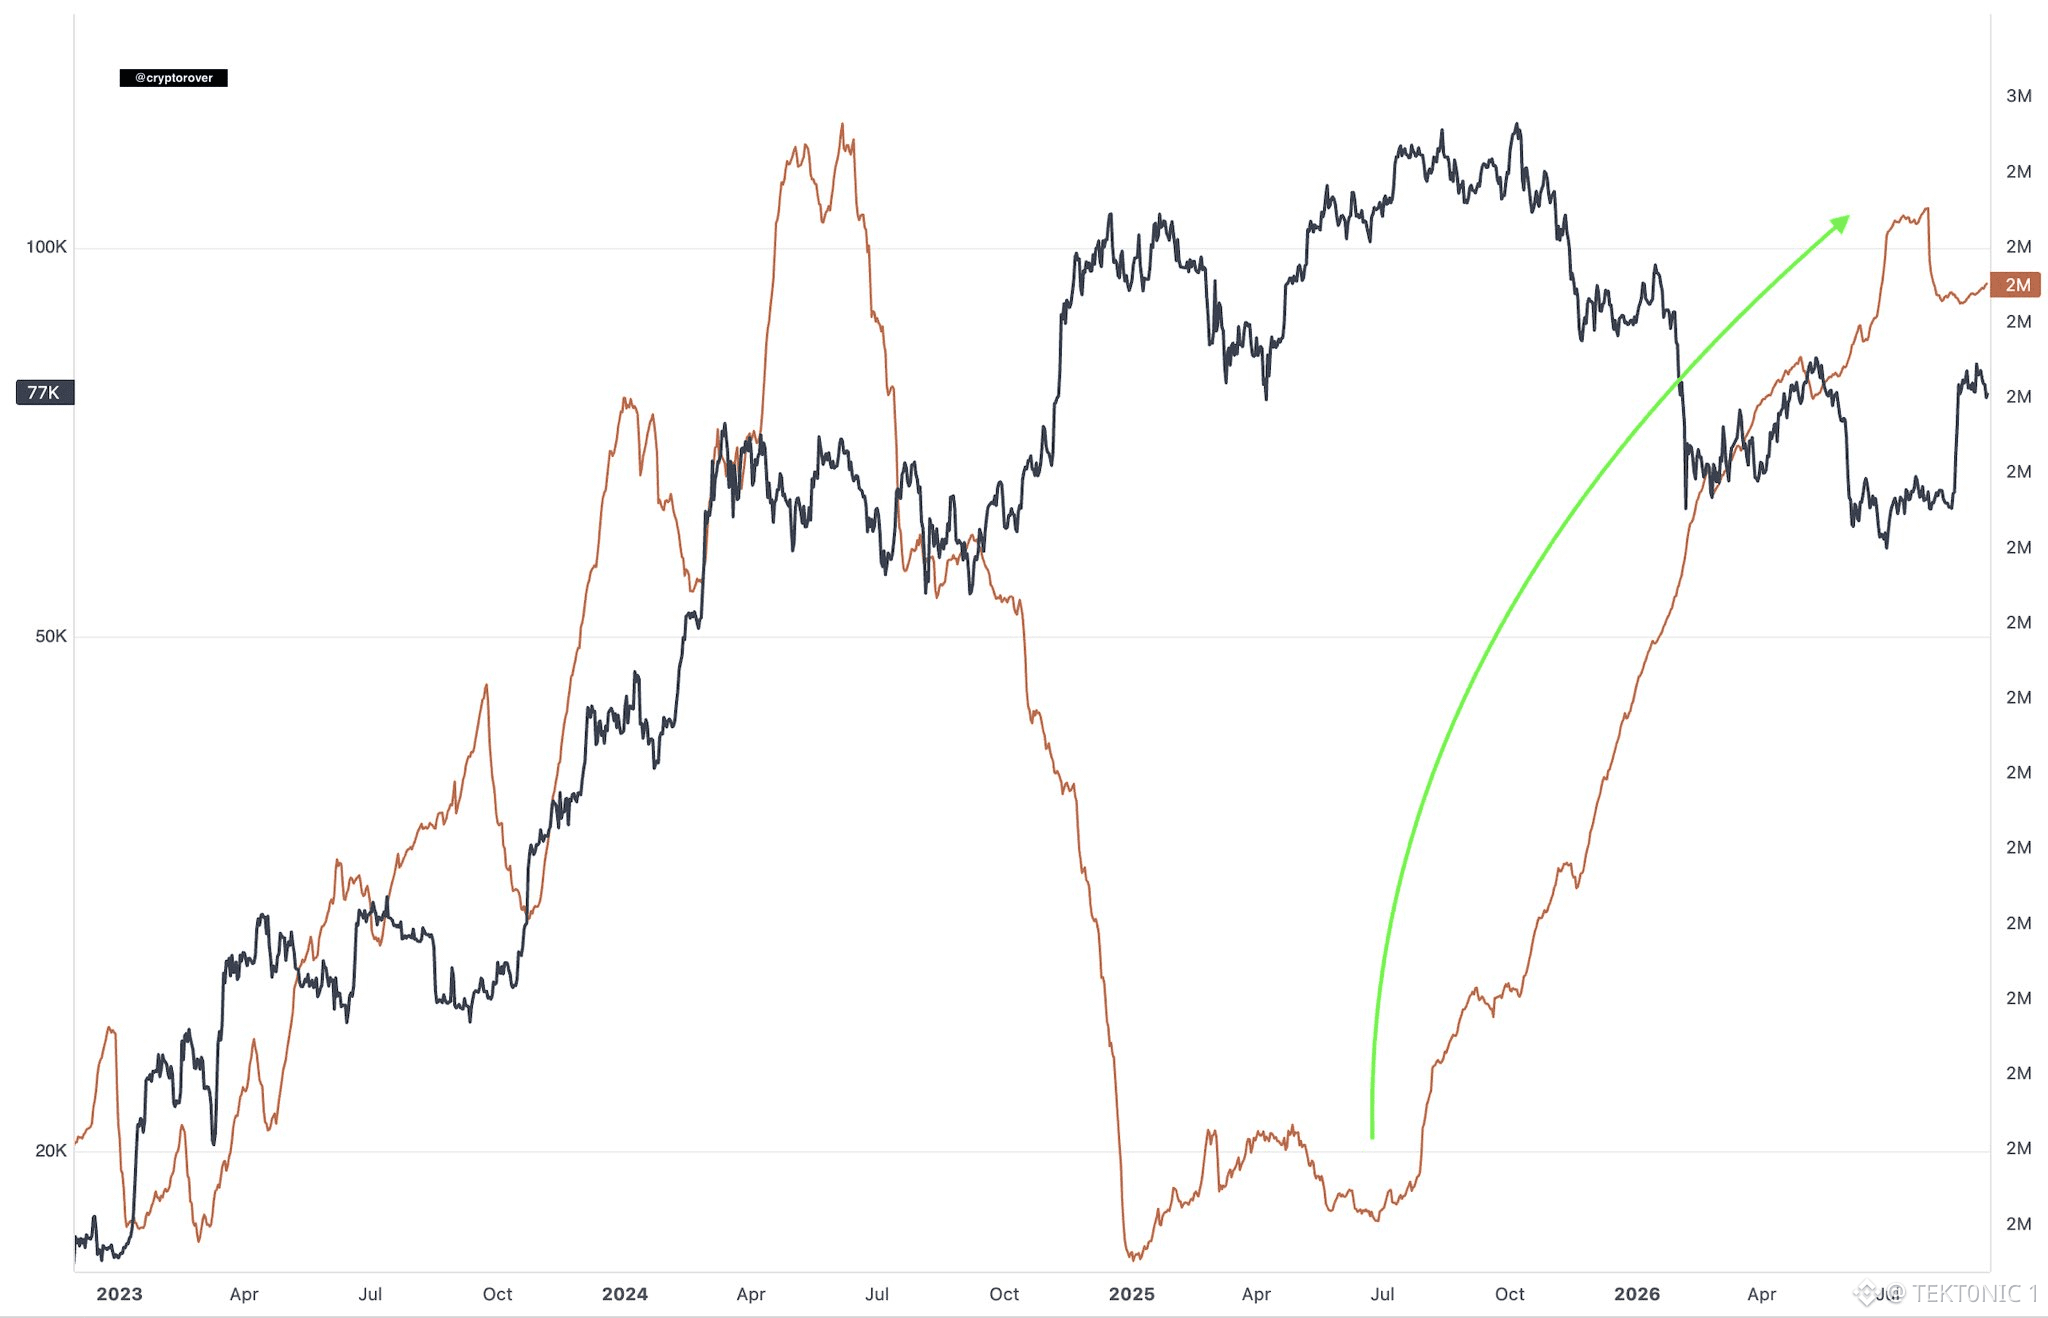
Large-Holder Bitcoin Supply Has Been Rebuilding Into the $77,000 Area The orange line on this overlay is the accumulation side of the tape. Price is the black line. According to the chart, $BTC is near $77,000. The second series — the whale/large-holder cohort on the right-hand scale — collapsed in late 2024, then turned up through 2025 and 2026 and is back near the 2 million mark. That recovery is what the green arrow is marking. Key Details: > Bitcoin price on this view: about $77,000, still below the $100,000 handle and the $126,000 high. > The orange cohort fell hard, then spent more than a year grinding higher. > The latest reading is back around 2 million on that scale. > Price and the cohort are no longer moving in lockstep: holdings rebuilt while price chopped. A rising large-holder line into a $77,000 base is constructive. It is not the same thing as a breakout. Whales can add for months and still sell into $83,000. Confirmation remains a hold of $80,000 and a close through $82,000–$83,000. Whale-Scale Bitcoin Holdings Back Near 2M While Price Sits at $77K #BTC Price Analysis# #Bitcoin Price Prediction: What is Bitcoins next move?# $ETH $BTC
Large-Holder Bitcoin Supply Has Been Rebuilding Into the $77,000 Area The orange line on this overlay is the accumulation side of the tape. Price is the black line. According to the chart, $BTC is near $77,000. The second series — the whale/large-holder cohort on the right-hand scale — collapsed in late 2024, then turned up through 2025 and 2026 and is back near the 2 million mark. That recovery is what the green arrow is marking. Key Details: > Bitcoin price on this view: about $77,000, still below the $100,000 handle and the $126,000 high. > The orange cohort fell hard, then spent more than a year grinding higher. > The latest reading is back around 2 million on that scale. > Price and the cohort are no longer moving in lockstep: holdings rebuilt while price chopped. A rising large-holder line into a $77,000 base is constructive. It is not the same thing as a breakout. Whales can add for months and still sell into $83,000. Confirmation remains a hold of $80,000 and a close through $82,000–$83,000. Whale-Scale Bitcoin Holdings Back Near 2M While Price Sits at $77K #BTC Price Analysis# #Bitcoin Price Prediction: What is Bitcoins next move?# $ETH $BTC
·
--
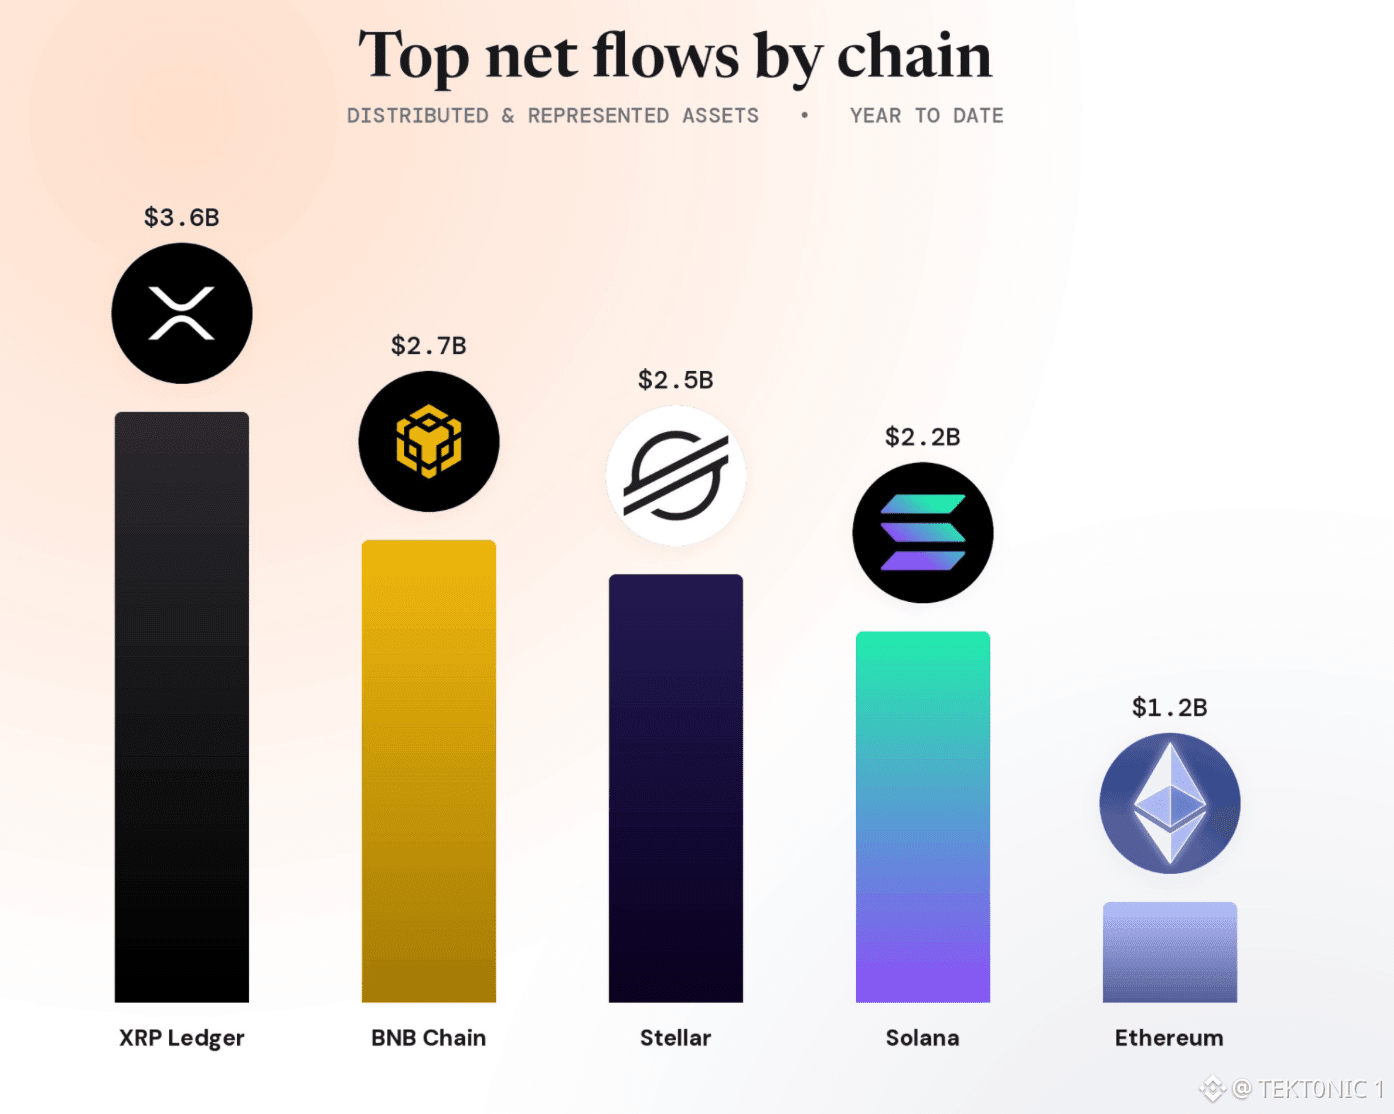
RWA capital is moving across more chains. year to date, the XRP Ledger has attracted around $3.6b in net RWA flows, leading all major chains. here’s how the top 5 look: > XRP Ledger — $3.6b > BNB Chain — $2.7b > Stellar — $2.5b > Solana — $2.2b > Ethereum — $1.2b and the growth isn’t limited to one type of asset. XRPL’s recent inflows have been driven heavily by tokenized commodities and asset-backed credit, while Stellar has crossed $3b in total RWA value with Treasuries, money-market funds, credit and gold all represented on the network. ethereum still has the largest overall RWA base, but the flow data shows capital is spreading across other ecosystems. tokenization is becoming a multi-chain market. and these numbers are starting to show it. #BTC Price Analysis# #Altcoin Season# #RWA $XRP $SOL
RWA capital is moving across more chains. year to date, the XRP Ledger has attracted around $3.6b in net RWA flows, leading all major chains. here’s how the top 5 look: > XRP Ledger — $3.6b > BNB Chain — $2.7b > Stellar — $2.5b > Solana — $2.2b > Ethereum — $1.2b and the growth isn’t limited to one type of asset. XRPL’s recent inflows have been driven heavily by tokenized commodities and asset-backed credit, while Stellar has crossed $3b in total RWA value with Treasuries, money-market funds, credit and gold all represented on the network. ethereum still has the largest overall RWA base, but the flow data shows capital is spreading across other ecosystems. tokenization is becoming a multi-chain market. and these numbers are starting to show it. #BTC Price Analysis# #Altcoin Season# #RWA $XRP $SOL
27
·
--
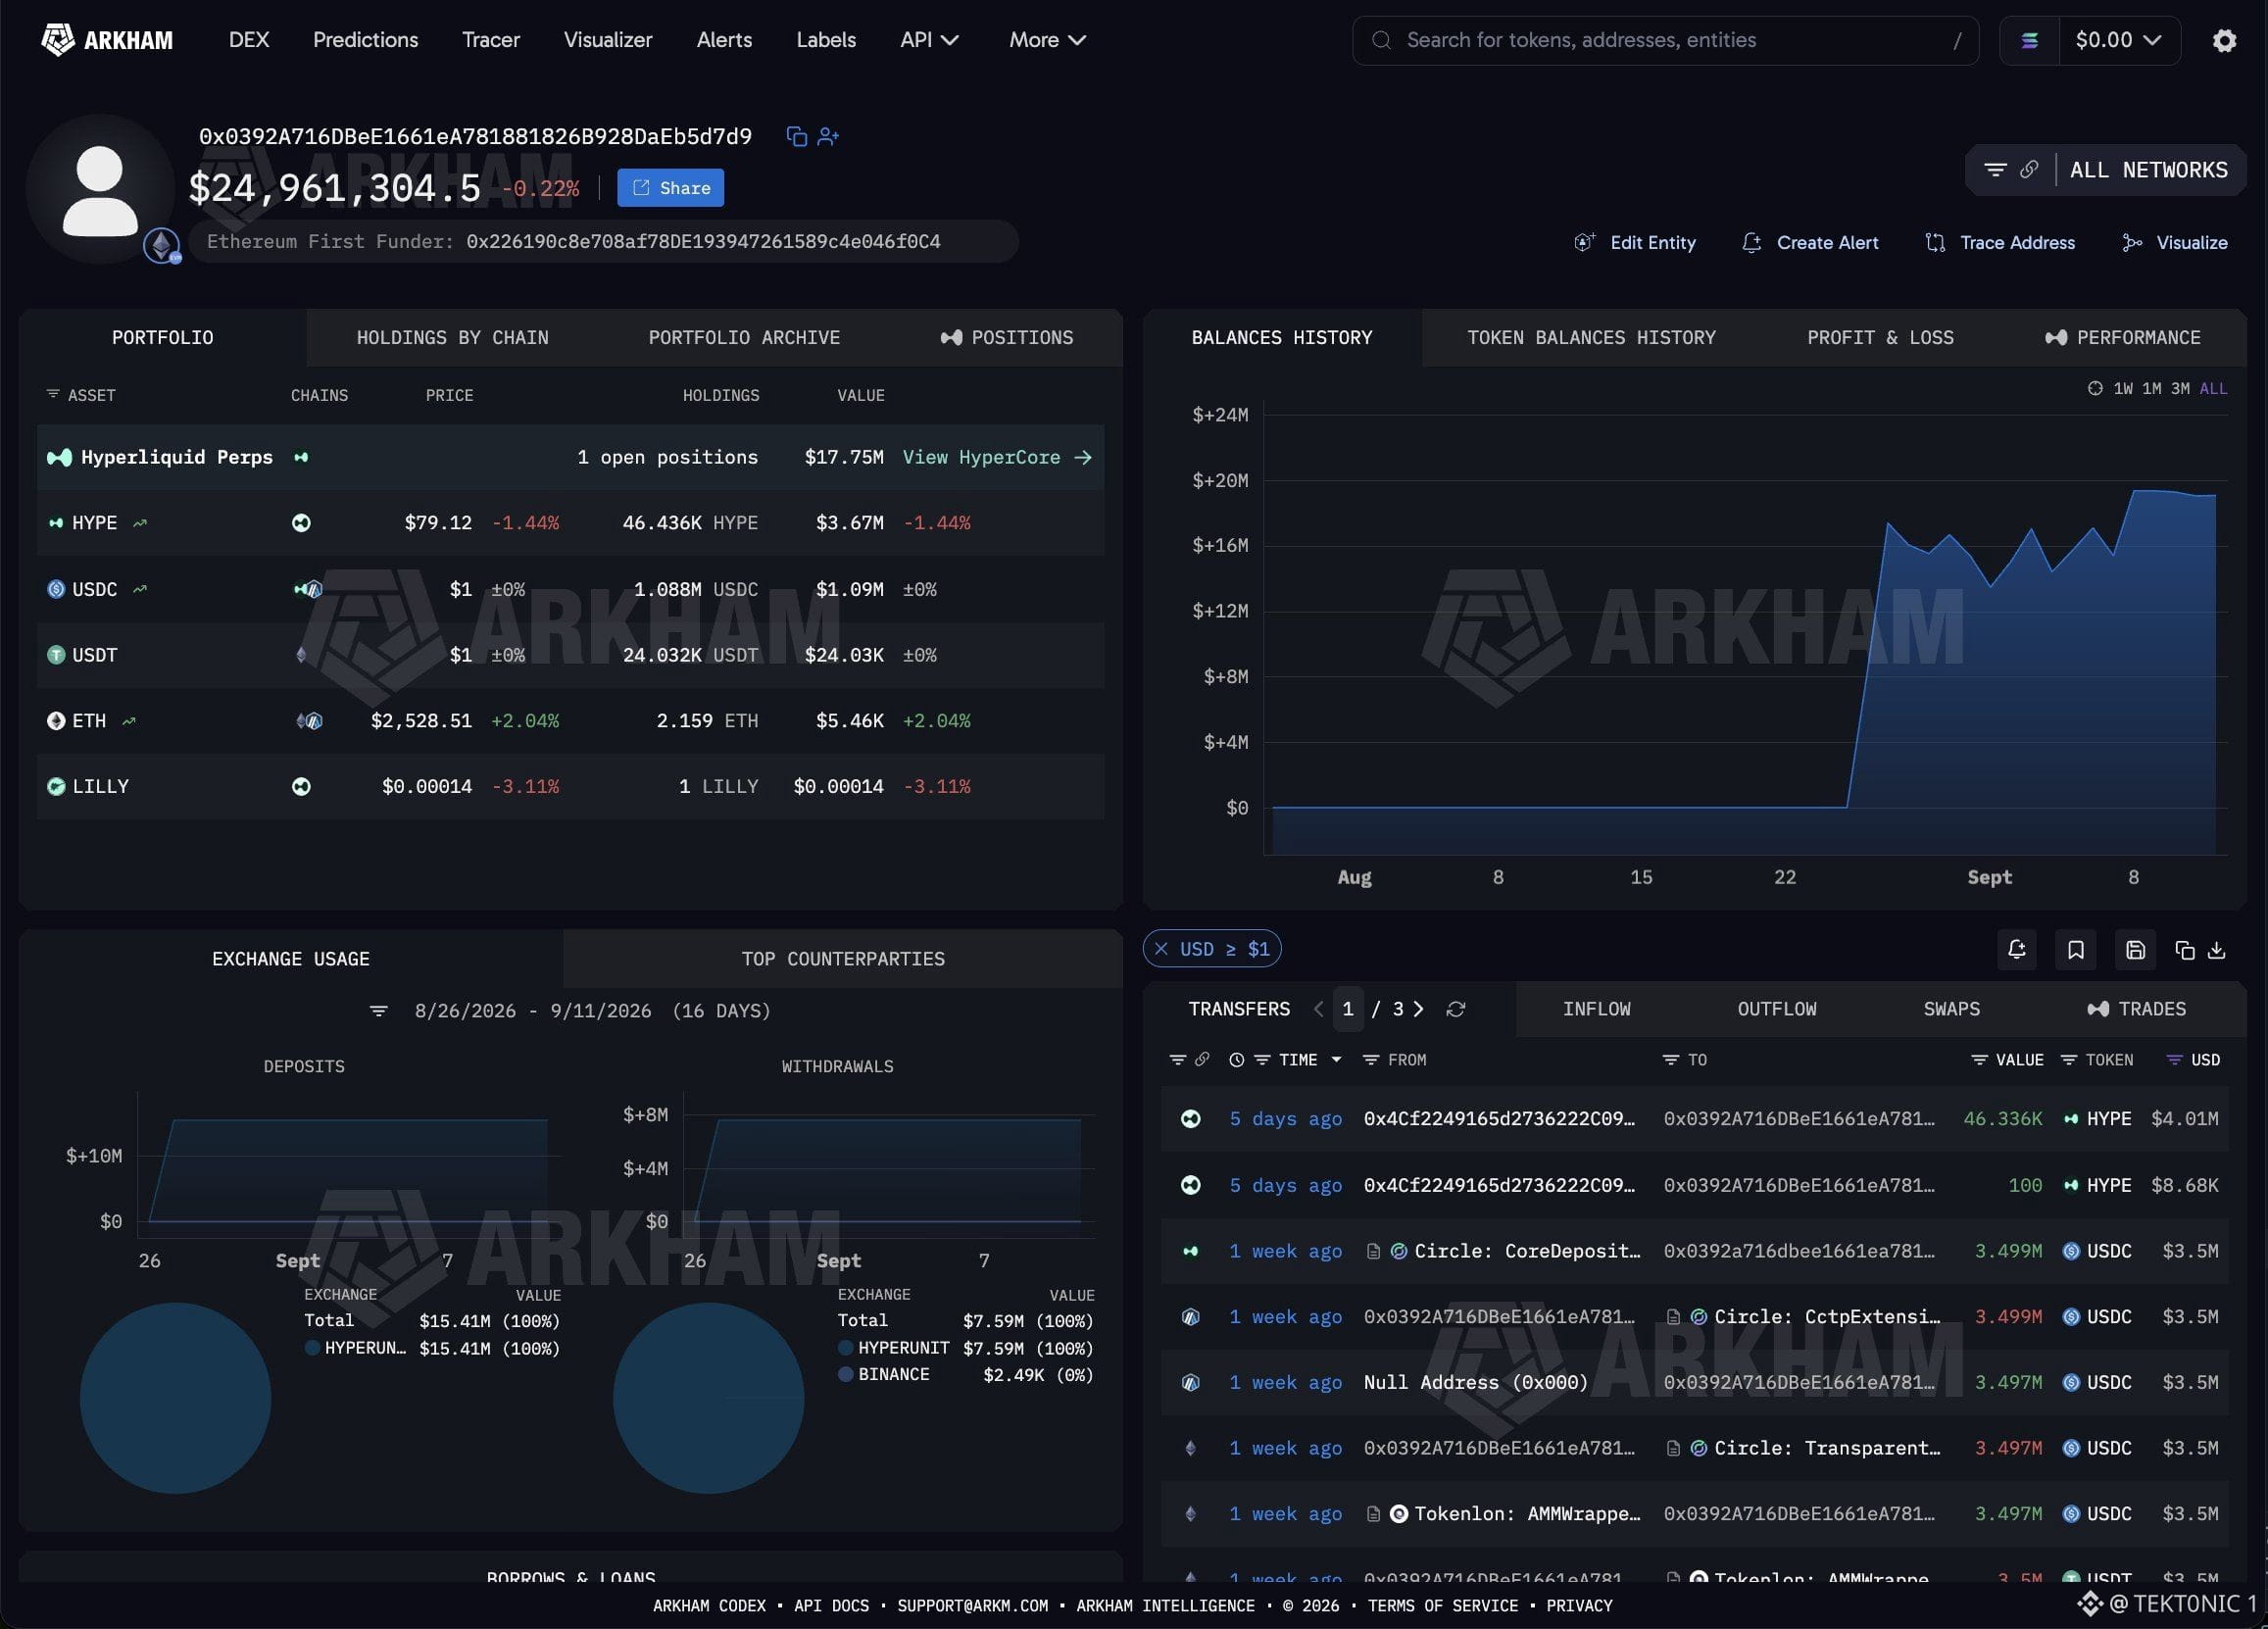
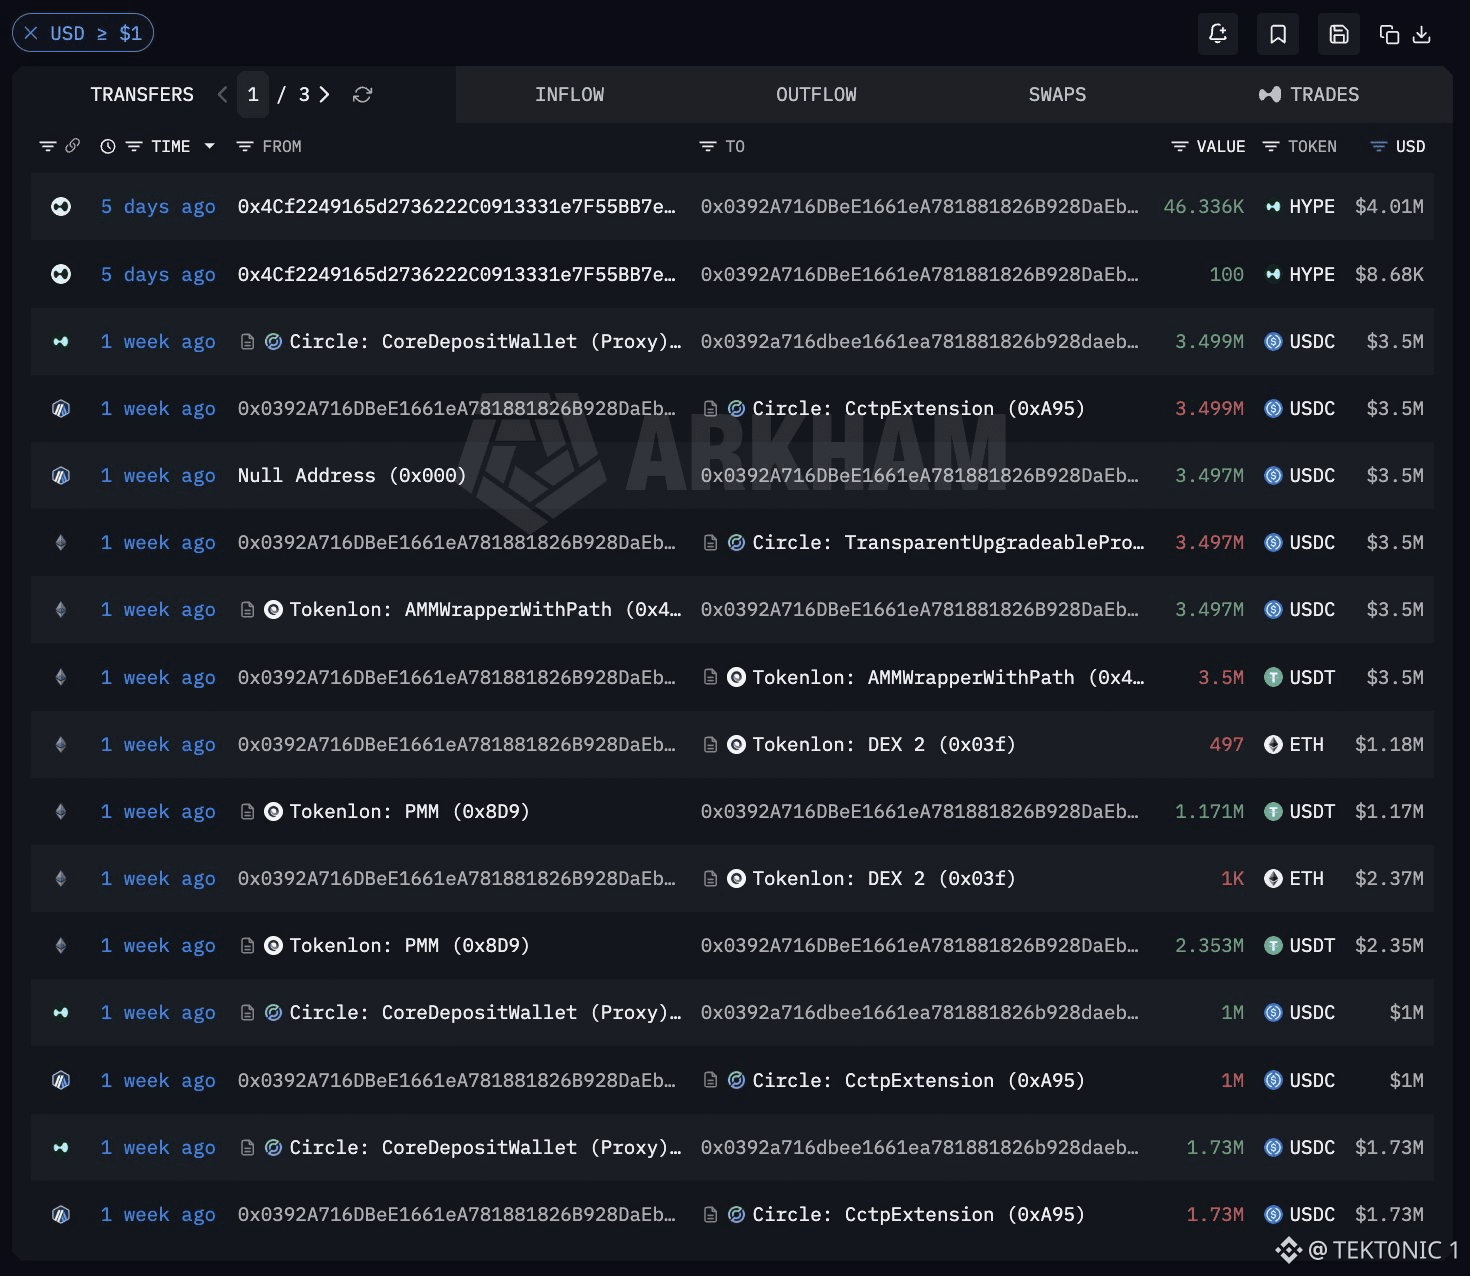
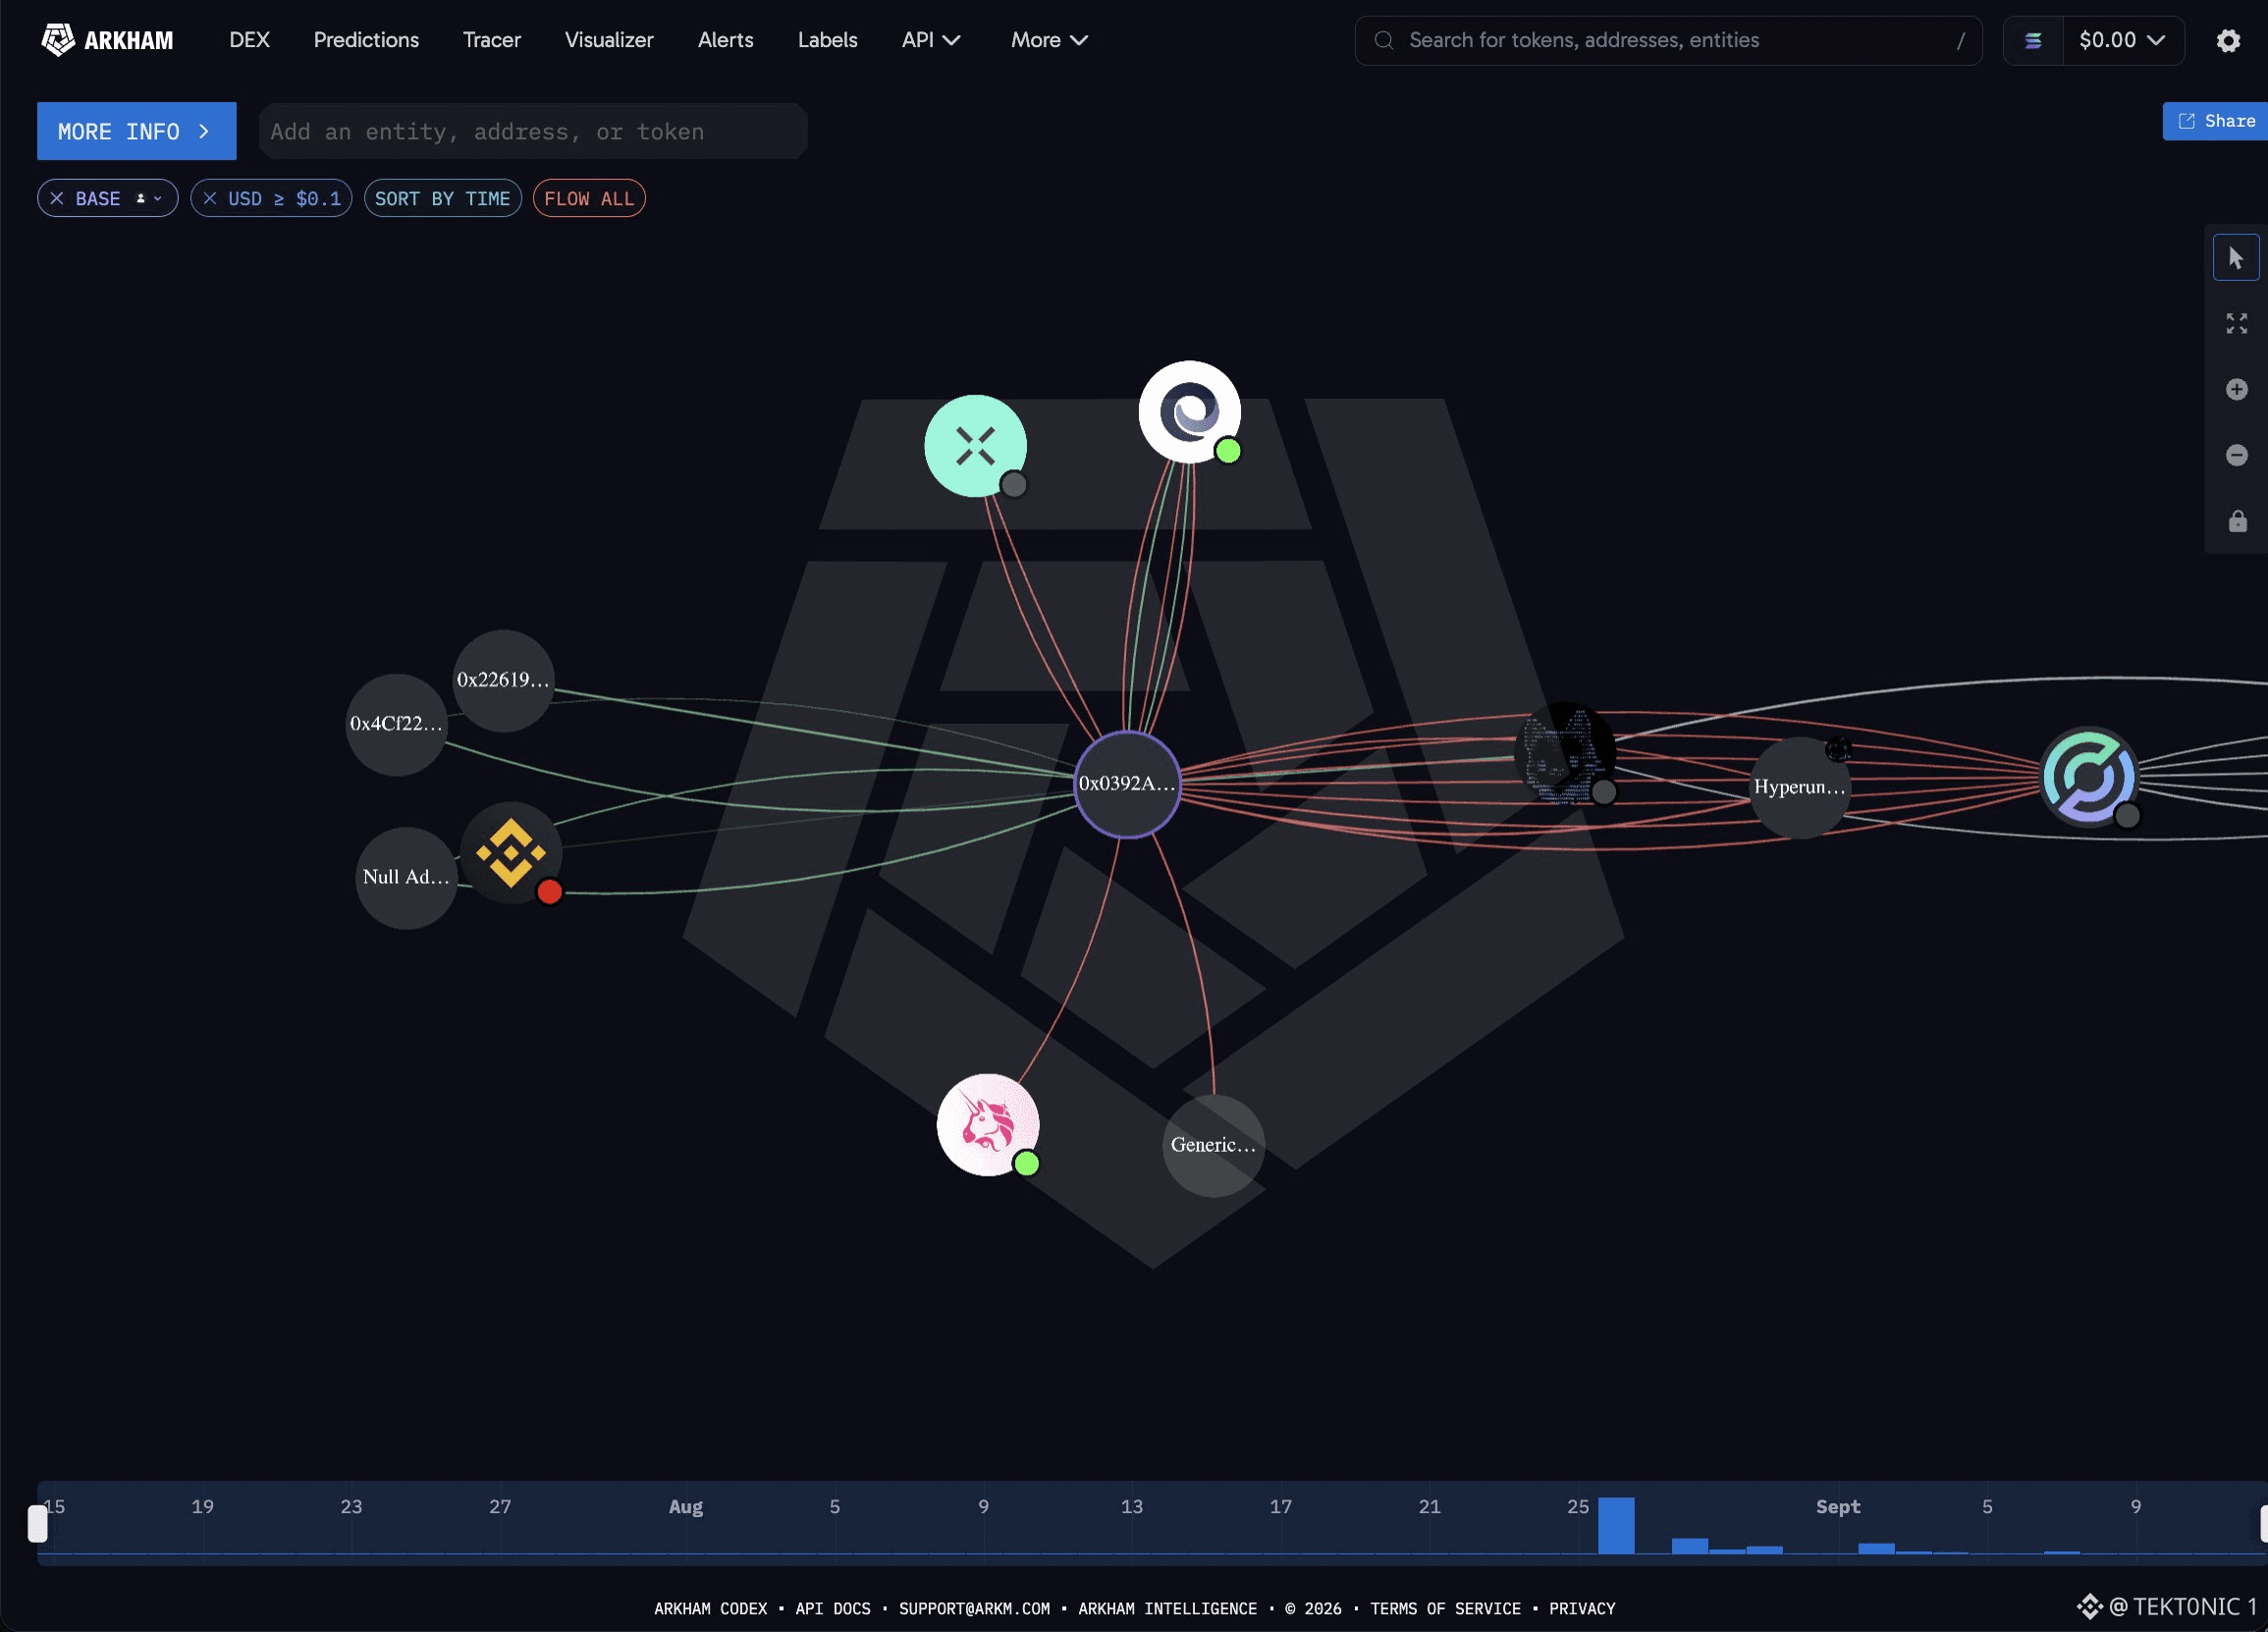
this Hyperliquid wallet is green again on a crowded ETH long. 0x039 funded a fresh address about two weeks ago. Arkham shows the book at $24.96 million now, with one perp position marked at $17.75 million plus 46,436 $HYPE . deposits over the last 16 days were $15.41 million, almost all through Hyperunit. the trade is an 8x $ETH long. entry was $2,486. notional is $114.37 million. ten days ago, when ETH printed $2,372, the account was down about $4.9 million. ETH is back through the entry. unrealized PnL is +$1.98 million. that matters because the same book that looked stopped out below $2,400 is now covering the hole without cutting the size. the catch: this is mark-to-market on 8x. a move back under $2,486 wipes the $1.98 million and puts the $4.9 million drawdown back on the screen. one wallet is not the whole bid. so the long survived the dip. it has not been reduced. $ETH still has to hold the entry for the profit to stick. #BTC Price Analysis# #HyperLiquid #Ethereum $HYPE
this Hyperliquid wallet is green again on a crowded ETH long. 0x039 funded a fresh address about two weeks ago. Arkham shows the book at $24.96 million now, with one perp position marked at $17.75 million plus 46,436 $HYPE . deposits over the last 16 days were $15.41 million, almost all through Hyperunit. the trade is an 8x $ETH long. entry was $2,486. notional is $114.37 million. ten days ago, when ETH printed $2,372, the account was down about $4.9 million. ETH is back through the entry. unrealized PnL is +$1.98 million. that matters because the same book that looked stopped out below $2,400 is now covering the hole without cutting the size. the catch: this is mark-to-market on 8x. a move back under $2,486 wipes the $1.98 million and puts the $4.9 million drawdown back on the screen. one wallet is not the whole bid. so the long survived the dip. it has not been reduced. $ETH still has to hold the entry for the profit to stick. #BTC Price Analysis# #HyperLiquid #Ethereum $HYPE
28
·
--
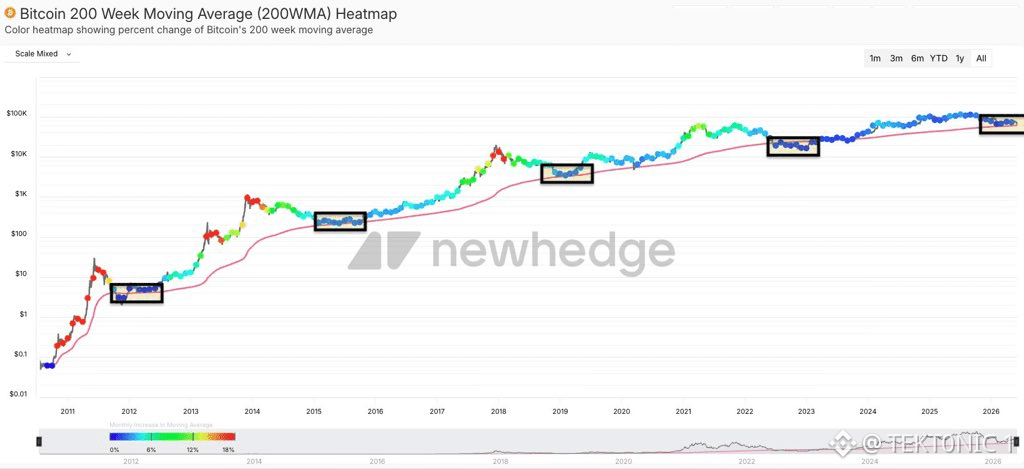
Bitcoin Is Back on Its 200-Week Average — The Line That Has Marked Prior Cycle Floors The long-term mean is holding. That is a support test, not a slogan. According to the Newhedge 200-week moving-average heatmap, $BTC is sitting on the rising 200-week line again in 2026. The same chart boxed similar tags in 2012, 2015, 2019, and 2022. Those prior touches preceded large multi-year advances. Color on the dots is the pace of change in the average itself. Key Details: > The 200-week average is the typical weekly close over about four years. It rises slowly and rarely rolls over. > Price is tagging that line again in the latest boxed zone. > Earlier boxes at the 200-week line lined up with bear-market lows, not tops. > The average is still sloping up, which means the long-term trend has not broken even after the drop from $126,000. “Never bet against the 200-week” has been a useful rule on this chart. It is not a law. The risk is a weekly close that loses the line and stays lost. The opportunity is the same one those older boxes marked: a long-term mean that has so far absorbed every major drawdown. Bitcoin Tagging the 200-Week Average Again — Same Zone That Marked 2015, 2019, and 2022 Lows #BTC Price Analysis# #Bitcoin Price Prediction: What is Bitcoins next move?# $BTC $ETH
Bitcoin Is Back on Its 200-Week Average — The Line That Has Marked Prior Cycle Floors The long-term mean is holding. That is a support test, not a slogan. According to the Newhedge 200-week moving-average heatmap, $BTC is sitting on the rising 200-week line again in 2026. The same chart boxed similar tags in 2012, 2015, 2019, and 2022. Those prior touches preceded large multi-year advances. Color on the dots is the pace of change in the average itself. Key Details: > The 200-week average is the typical weekly close over about four years. It rises slowly and rarely rolls over. > Price is tagging that line again in the latest boxed zone. > Earlier boxes at the 200-week line lined up with bear-market lows, not tops. > The average is still sloping up, which means the long-term trend has not broken even after the drop from $126,000. “Never bet against the 200-week” has been a useful rule on this chart. It is not a law. The risk is a weekly close that loses the line and stays lost. The opportunity is the same one those older boxes marked: a long-term mean that has so far absorbed every major drawdown. Bitcoin Tagging the 200-Week Average Again — Same Zone That Marked 2015, 2019, and 2022 Lows #BTC Price Analysis# #Bitcoin Price Prediction: What is Bitcoins next move?# $BTC $ETH
36
·
--
the Houthis now sit on the rock that splits Bab el-Mandeb. Perim Island, also called Mayun, fell after Yemeni government forces pulled off. Mocha and Dhubab went in the same two-day push. Perim divides the strait into its two shipping lanes, which is why the island matters more than another coastal town. Q2 flows through Bab el-Mandeb averaged 8.1 million barrels a day, per the EIA, about 8% of global supply. that volume had already jumped after Hormuz tightened and more Gulf crude was sent to Yanbu for the Red Sea route. Kpler had crossings drop from 30 to 15 on Friday. Hormuz traffic is already crushed. the Saudi East-West line that exists to bypass it was hit and shut in the same window. Brent has been trading above $100. two oil chokepoints are now under pressure at once. cargo that leaves one gate still has to clear the other. the catch: seizing Perim is not the same as closing the strait. ships are still moving, just fewer of them. the price is pricing disruption risk, not a confirmed zero-flow print. #BTC Price Analysis# #Bitcoin Price Prediction: What is Bitcoins next move?# $BTC $SOL
the Houthis now sit on the rock that splits Bab el-Mandeb. Perim Island, also called Mayun, fell after Yemeni government forces pulled off. Mocha and Dhubab went in the same two-day push. Perim divides the strait into its two shipping lanes, which is why the island matters more than another coastal town. Q2 flows through Bab el-Mandeb averaged 8.1 million barrels a day, per the EIA, about 8% of global supply. that volume had already jumped after Hormuz tightened and more Gulf crude was sent to Yanbu for the Red Sea route. Kpler had crossings drop from 30 to 15 on Friday. Hormuz traffic is already crushed. the Saudi East-West line that exists to bypass it was hit and shut in the same window. Brent has been trading above $100. two oil chokepoints are now under pressure at once. cargo that leaves one gate still has to clear the other. the catch: seizing Perim is not the same as closing the strait. ships are still moving, just fewer of them. the price is pricing disruption risk, not a confirmed zero-flow print. #BTC Price Analysis# #Bitcoin Price Prediction: What is Bitcoins next move?# $BTC $SOL

43
·
--
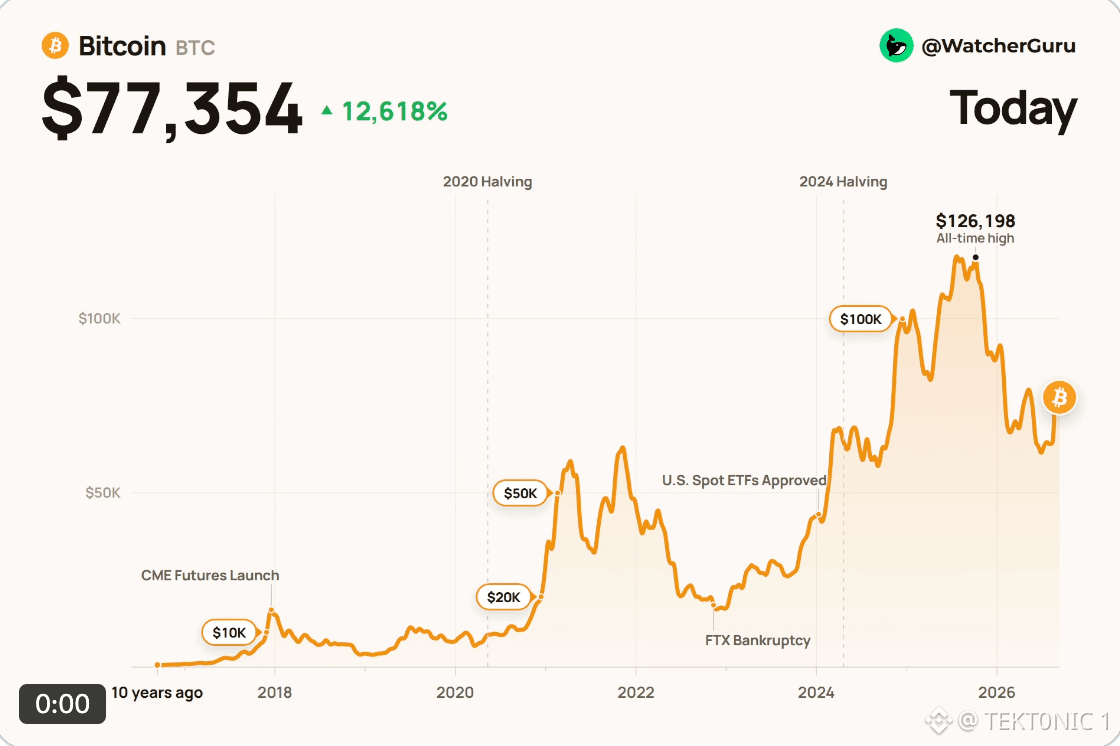
Bitcoin Is $77,354 Today. Ten Years Ago It Was $608. The long chart still does the work the daily range hides. According to the 10-year view, $BTC is $77,354, up about 12,618% from $608 a decade ago. The path in between includes the CME futures launch, two halvings, FTX, U.S. spot ETF approval, a $126,198 all-time high, and the 2026 drawdown back toward the high $70,000s. Key Details: > Today: $77,354. > Ten years ago: about $608. > Gain over that stretch: about +12,618%, or roughly 127 times. > Cycle high on this chart: $126,198. Current price is still well below that peak. A 127× decade is the savings-rate argument. It does not tell you what next week’s Fed meeting does to $80,000. The honest split is: long-term holders are still up multiples from 2016. Traders working the 2025 high are still underwater. Bitcoin: $608 a Decade Ago, $77,354 Today, Still Below the $126,198 High #BTC Price Analysis# #Bitcoin Price Prediction: What is Bitcoins next move?# $BTC $XRP
Bitcoin Is $77,354 Today. Ten Years Ago It Was $608. The long chart still does the work the daily range hides. According to the 10-year view, $BTC is $77,354, up about 12,618% from $608 a decade ago. The path in between includes the CME futures launch, two halvings, FTX, U.S. spot ETF approval, a $126,198 all-time high, and the 2026 drawdown back toward the high $70,000s. Key Details: > Today: $77,354. > Ten years ago: about $608. > Gain over that stretch: about +12,618%, or roughly 127 times. > Cycle high on this chart: $126,198. Current price is still well below that peak. A 127× decade is the savings-rate argument. It does not tell you what next week’s Fed meeting does to $80,000. The honest split is: long-term holders are still up multiples from 2016. Traders working the 2025 high are still underwater. Bitcoin: $608 a Decade Ago, $77,354 Today, Still Below the $126,198 High #BTC Price Analysis# #Bitcoin Price Prediction: What is Bitcoins next move?# $BTC $XRP
49
·
--
Grayscale turned an old Zcash trust into a listed product — and the asset line jumped. ZCSH started trading on NYSE Arca on August 25 as a spot grantor trust. it holds ZEC at Coinbase Custody, tracks the CoinDesk Zcash benchmark, and takes a 2.50% sponsor fee. about 559,000 ZEC were in the fund on the September 10 print. since listing the product has taken in about $179 million over 11 sessions. AUM is now above $700 million. that growth rate puts it in the top 1% of nearly 4,000 ETPs. $ZEC itself is up 59% over the same window. some of the first bid was close to home. DCG International, inside the same group as the sponsor, was reported as a large early buyer. price appreciation plus creations will both lift AUM, so the rank is a mix of flows and a running coin. the catch: a 2.50% fee and an 11-day sample are not a cycle. bitcoin ETPs still dwarf this book. if $ZEC gives back the 59%, the AUM print comes with it. so the listing found demand. the next test is whether creations continue when the token stops running. #BTC Price Analysis# #Bitcoin Price Prediction: What is Bitcoins next move?# $BTC
Grayscale turned an old Zcash trust into a listed product — and the asset line jumped. ZCSH started trading on NYSE Arca on August 25 as a spot grantor trust. it holds ZEC at Coinbase Custody, tracks the CoinDesk Zcash benchmark, and takes a 2.50% sponsor fee. about 559,000 ZEC were in the fund on the September 10 print. since listing the product has taken in about $179 million over 11 sessions. AUM is now above $700 million. that growth rate puts it in the top 1% of nearly 4,000 ETPs. $ZEC itself is up 59% over the same window. some of the first bid was close to home. DCG International, inside the same group as the sponsor, was reported as a large early buyer. price appreciation plus creations will both lift AUM, so the rank is a mix of flows and a running coin. the catch: a 2.50% fee and an 11-day sample are not a cycle. bitcoin ETPs still dwarf this book. if $ZEC gives back the 59%, the AUM print comes with it. so the listing found demand. the next test is whether creations continue when the token stops running. #BTC Price Analysis# #Bitcoin Price Prediction: What is Bitcoins next move?# $BTC

12
·
--
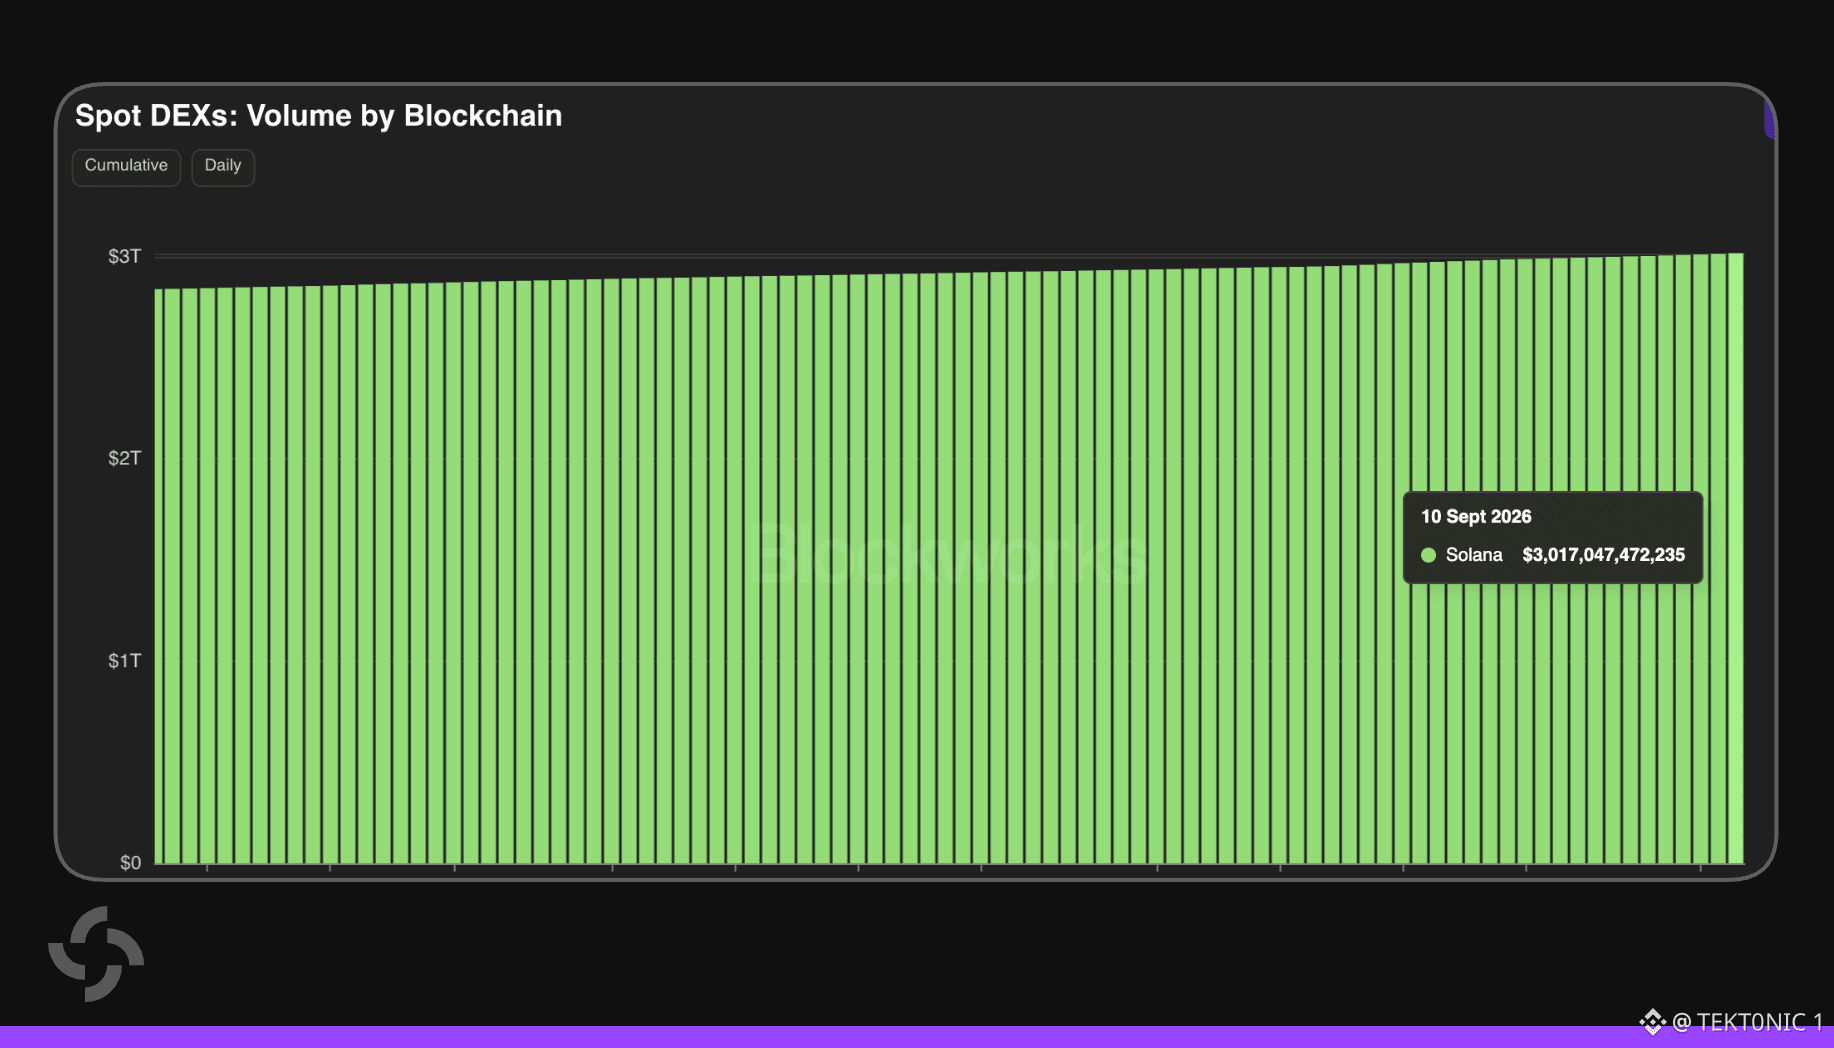
Solana’s Cumulative DEX Volume Has Cleared $3 Trillion That is lifetime spot DEX trading on the chain, not a one-day print. According to Blockworks data as of September 10, 2026, Solana’s cumulative spot DEX volume stands at $3.017 trillion. The cumulative series has been grinding higher in a near-straight line as daily flow keeps adding to the total. Key Details: > Cumulative Solana spot DEX volume: $3.017 trillion. > Date on the print: September 10, 2026. > This is all-time volume added together, so it rises even on quiet days. > DEX volume counts trades. It does not equal unique users or net new capital. $3 trillion is a scale number. It says Solana has been the default cheap venue for on-chain spot for a long time. It does not, by itself, say the next month will be stronger than the last. Watch daily volume and app revenue if you want to know whether the engine is still accelerating. Solana DEX Volume: $3.02 Trillion Cumulative as of Sept. 10 #BTC Price Analysis# #Bitcoin Price Prediction: What is Bitcoins next move?# $BTC $SOL #Bullish
Solana’s Cumulative DEX Volume Has Cleared $3 Trillion That is lifetime spot DEX trading on the chain, not a one-day print. According to Blockworks data as of September 10, 2026, Solana’s cumulative spot DEX volume stands at $3.017 trillion. The cumulative series has been grinding higher in a near-straight line as daily flow keeps adding to the total. Key Details: > Cumulative Solana spot DEX volume: $3.017 trillion. > Date on the print: September 10, 2026. > This is all-time volume added together, so it rises even on quiet days. > DEX volume counts trades. It does not equal unique users or net new capital. $3 trillion is a scale number. It says Solana has been the default cheap venue for on-chain spot for a long time. It does not, by itself, say the next month will be stronger than the last. Watch daily volume and app revenue if you want to know whether the engine is still accelerating. Solana DEX Volume: $3.02 Trillion Cumulative as of Sept. 10 #BTC Price Analysis# #Bitcoin Price Prediction: What is Bitcoins next move?# $BTC $SOL #Bullish
·
--
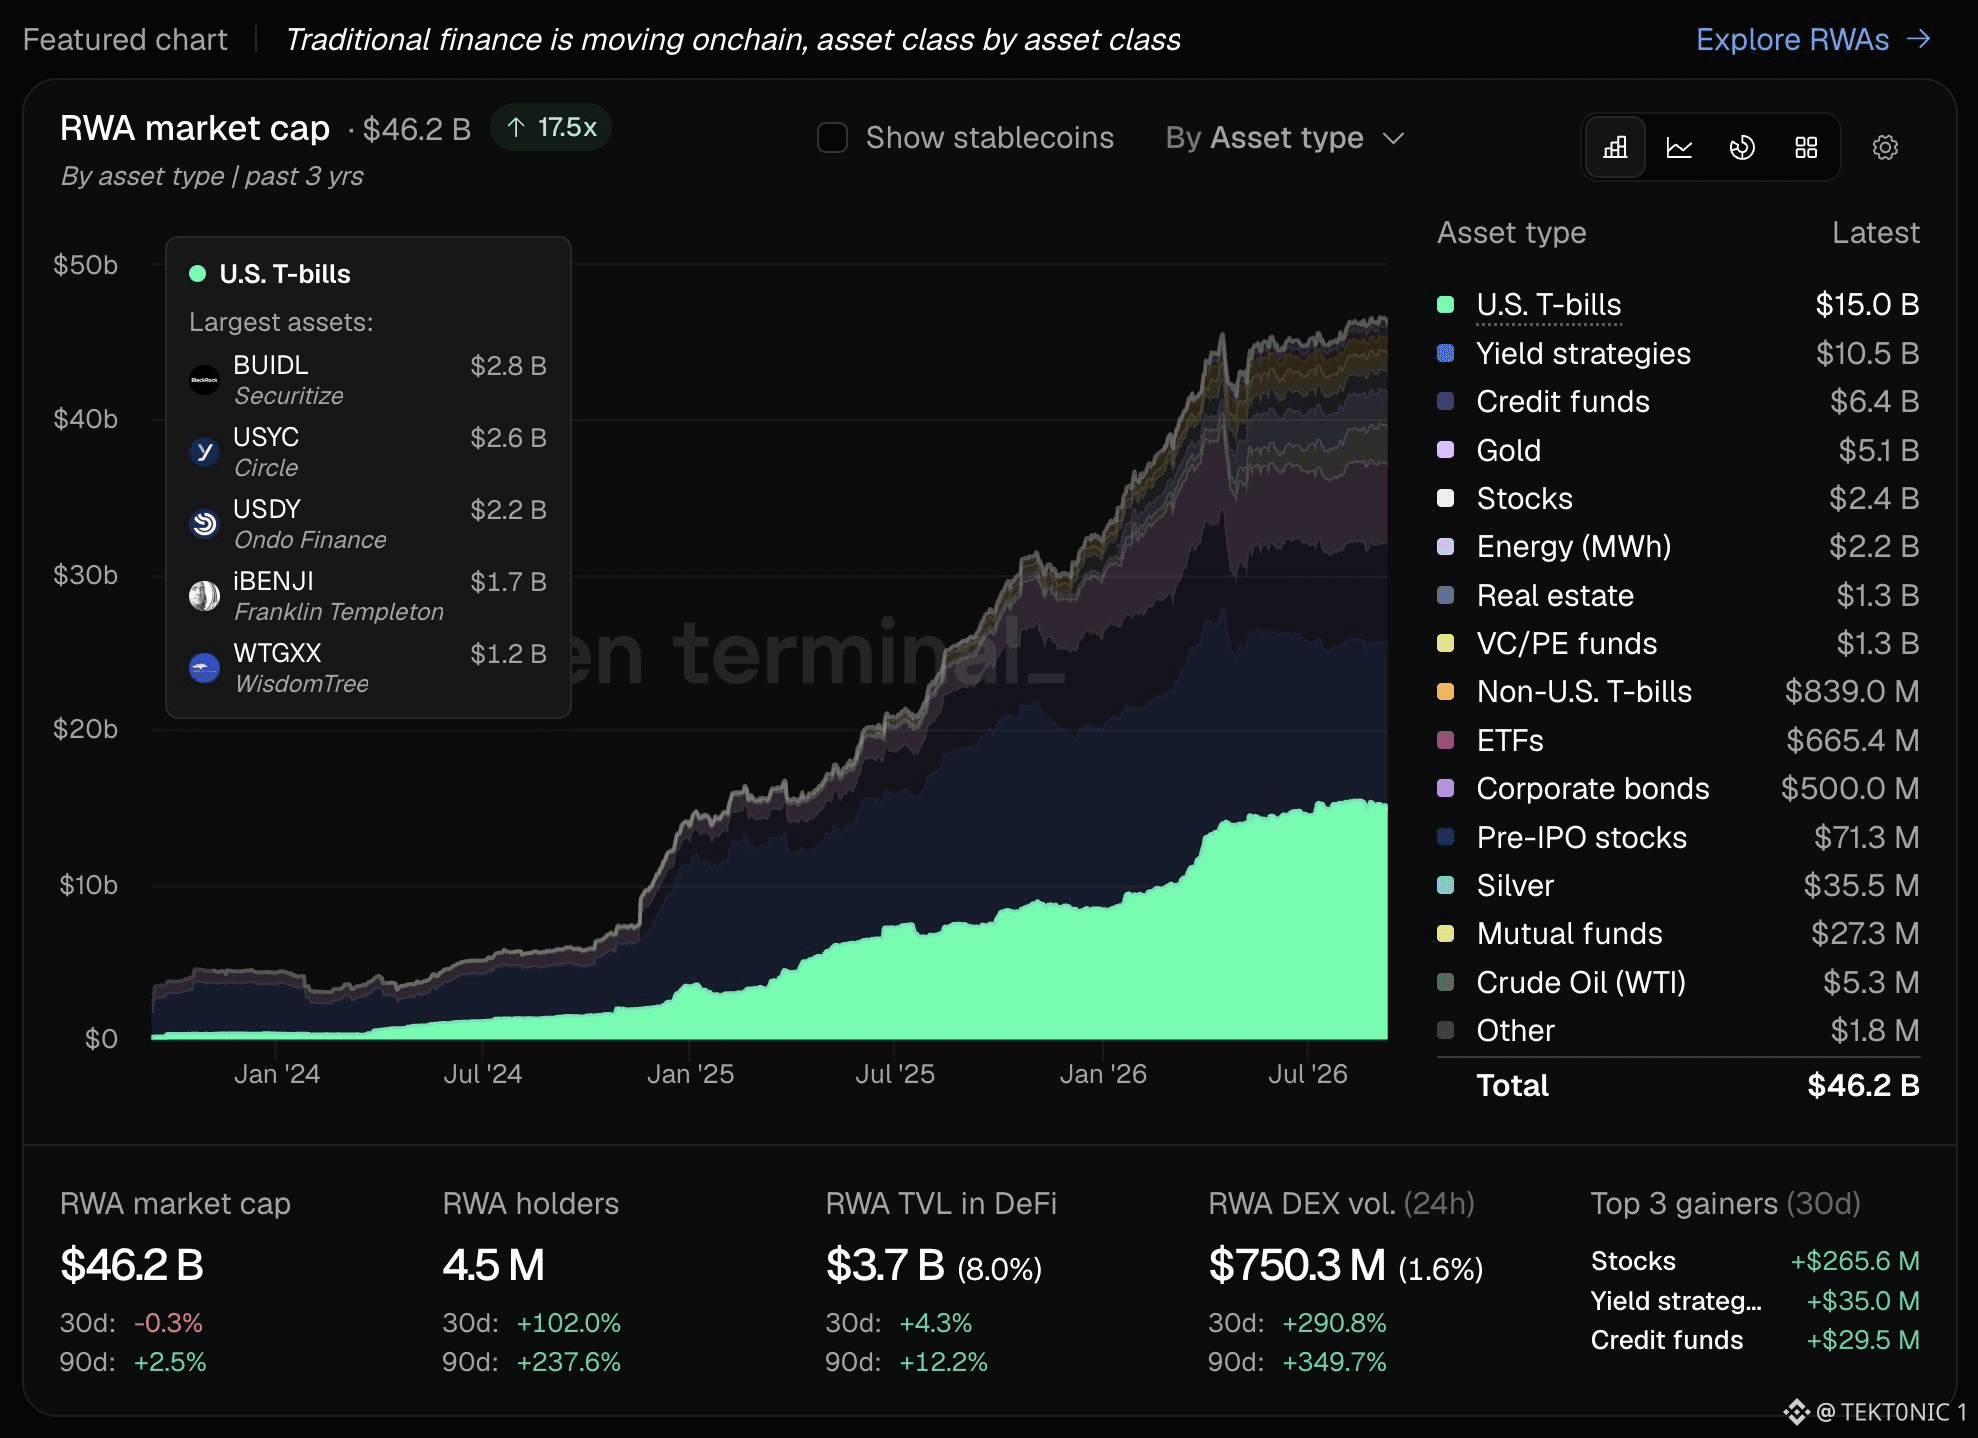
onchain RWAs just printed $46.2 billion. Token Terminal has the market at 17.5x over three years, with stablecoins switched off. U.S. T-bills remain the largest sleeve at $15.0 billion. that is not the whole book. yield strategies are $10.5B, credit funds $6.4B, gold $5.1B, stocks $2.4B and energy $2.2B. five funds dominate the T-bill sleeve. BUIDL is $2.8B, Circle’s USYC $2.6B, Ondo’s USDY $2.2B, Franklin’s iBENJI $1.7B and WisdomTree’s WTGXX $1.2B. together they hold $10.5 billion, or 70% of tokenized T-bills. holders are now 4.5 million, up 102% over 30 days and 238% over 90 days. 24-hour RWA DEX volume is $750 million. stocks led the last 30 days, adding $266 million. most of this growth is issuance. tradfi paper is being tokenized and marked onchain. DeFi use is still light: only $3.7 billion, or 8% of the stack, is deployed in protocols. the market is real. it is also tight. T-bills lead, five funds control that sleeve, and the rest of RWAs are still smaller. #BTC Price Analysis# #Bitcoin Price Prediction: What is Bitcoins next move?# #RWA $BTC $XRP
onchain RWAs just printed $46.2 billion. Token Terminal has the market at 17.5x over three years, with stablecoins switched off. U.S. T-bills remain the largest sleeve at $15.0 billion. that is not the whole book. yield strategies are $10.5B, credit funds $6.4B, gold $5.1B, stocks $2.4B and energy $2.2B. five funds dominate the T-bill sleeve. BUIDL is $2.8B, Circle’s USYC $2.6B, Ondo’s USDY $2.2B, Franklin’s iBENJI $1.7B and WisdomTree’s WTGXX $1.2B. together they hold $10.5 billion, or 70% of tokenized T-bills. holders are now 4.5 million, up 102% over 30 days and 238% over 90 days. 24-hour RWA DEX volume is $750 million. stocks led the last 30 days, adding $266 million. most of this growth is issuance. tradfi paper is being tokenized and marked onchain. DeFi use is still light: only $3.7 billion, or 8% of the stack, is deployed in protocols. the market is real. it is also tight. T-bills lead, five funds control that sleeve, and the rest of RWAs are still smaller. #BTC Price Analysis# #Bitcoin Price Prediction: What is Bitcoins next move?# #RWA $BTC $XRP
19
·
--
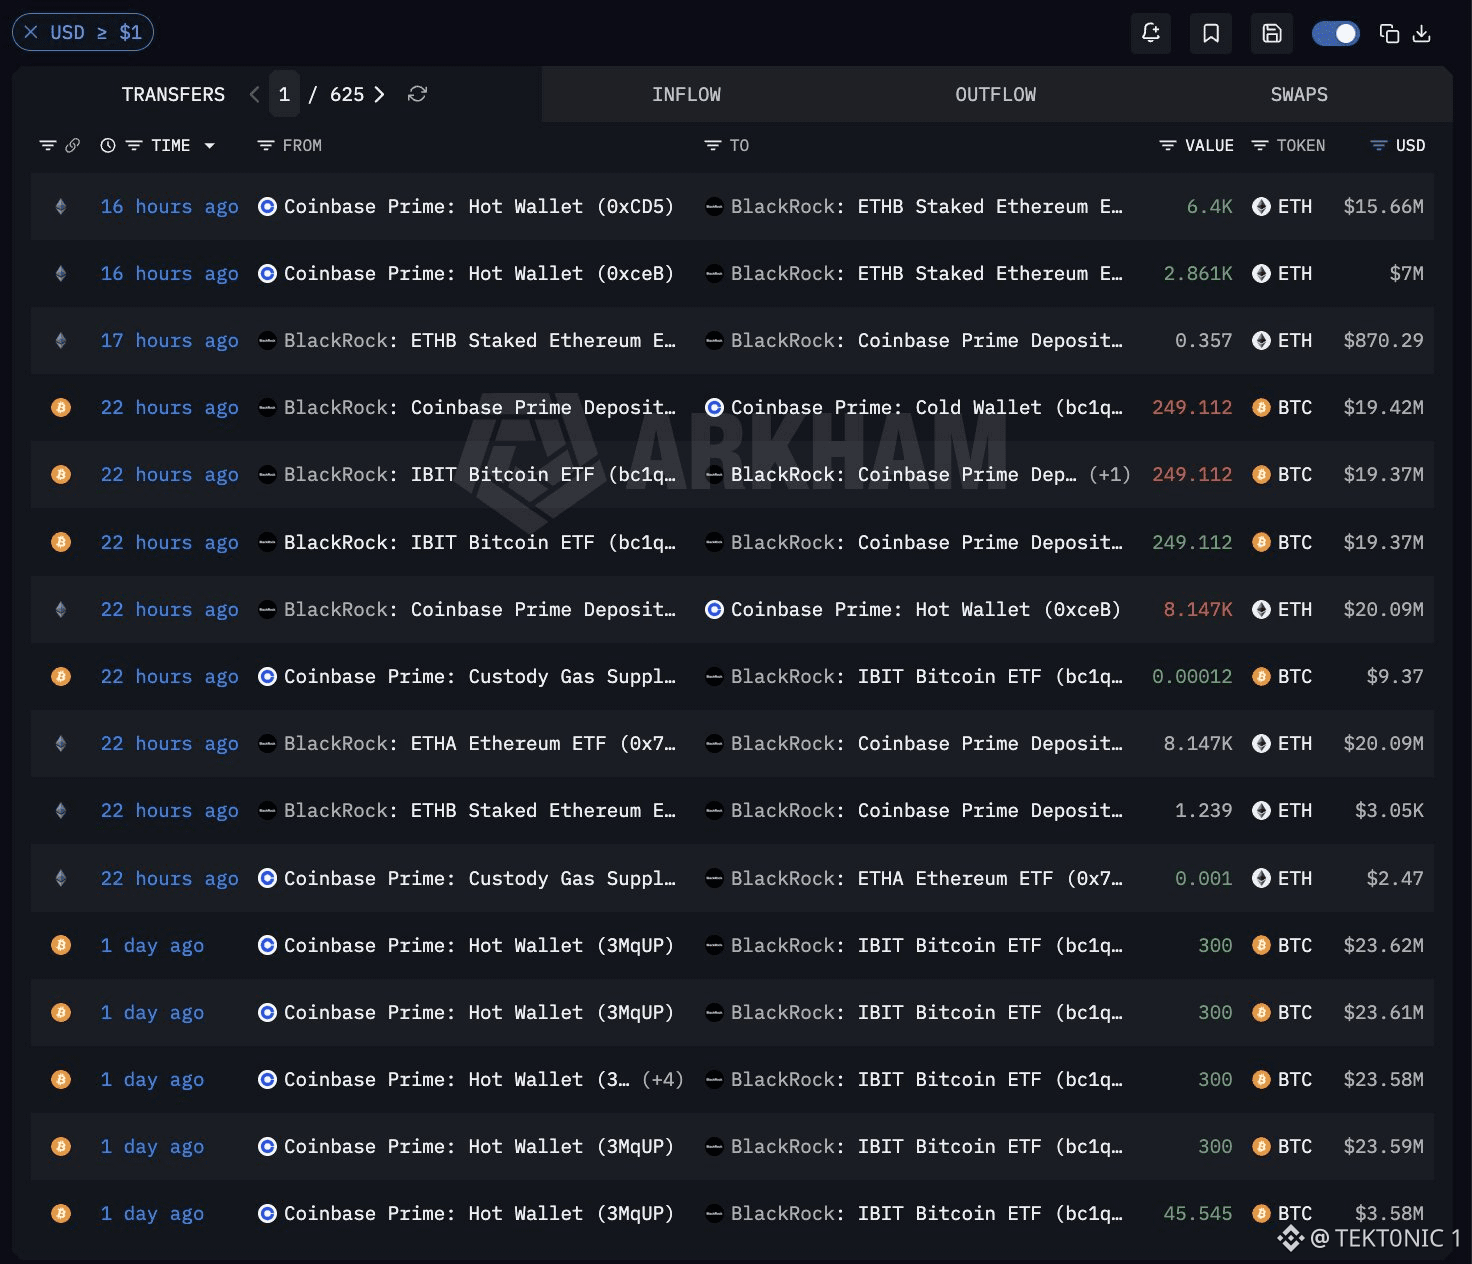
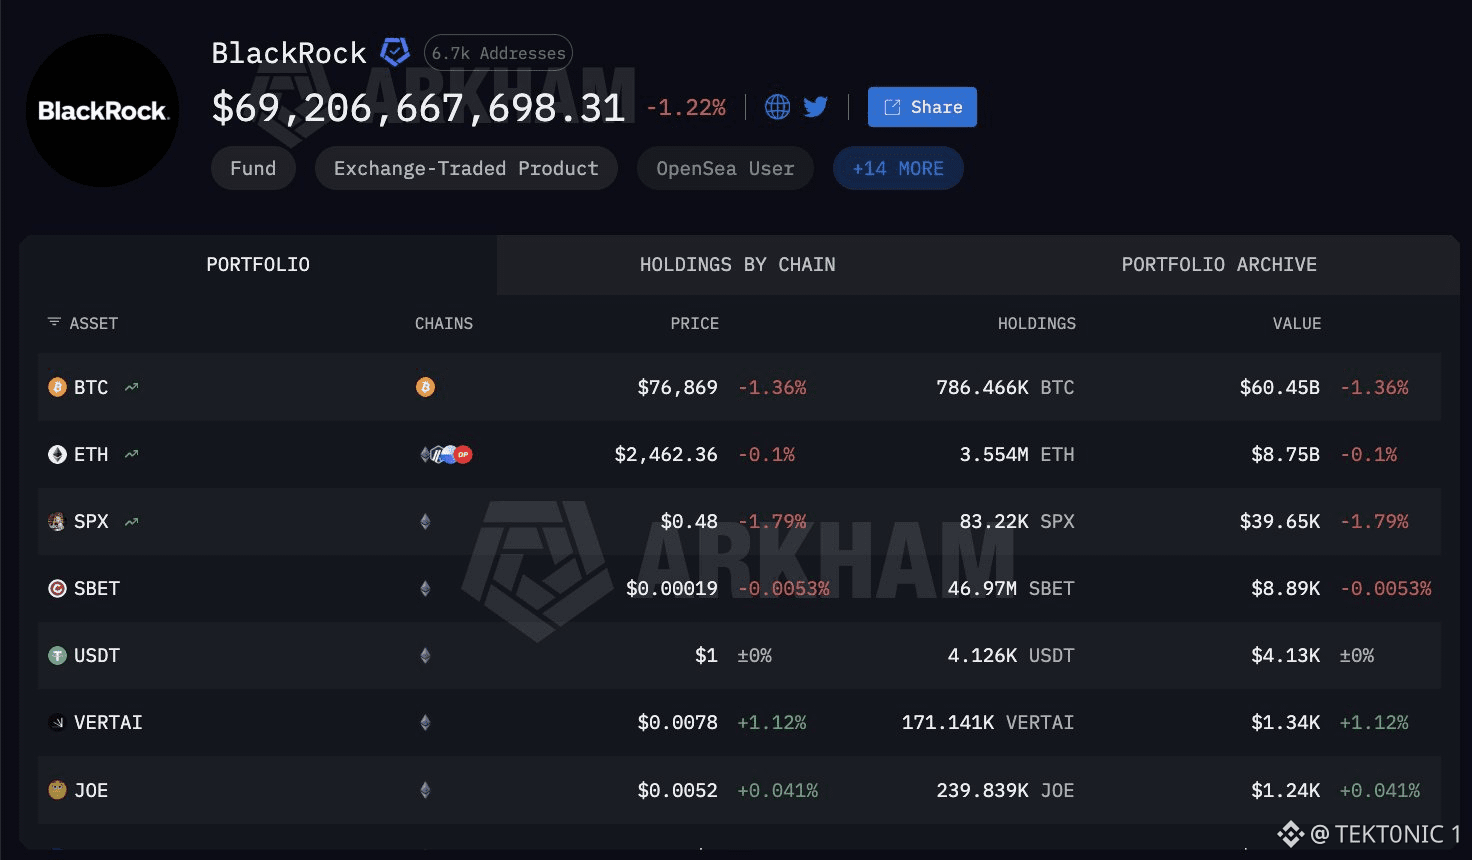
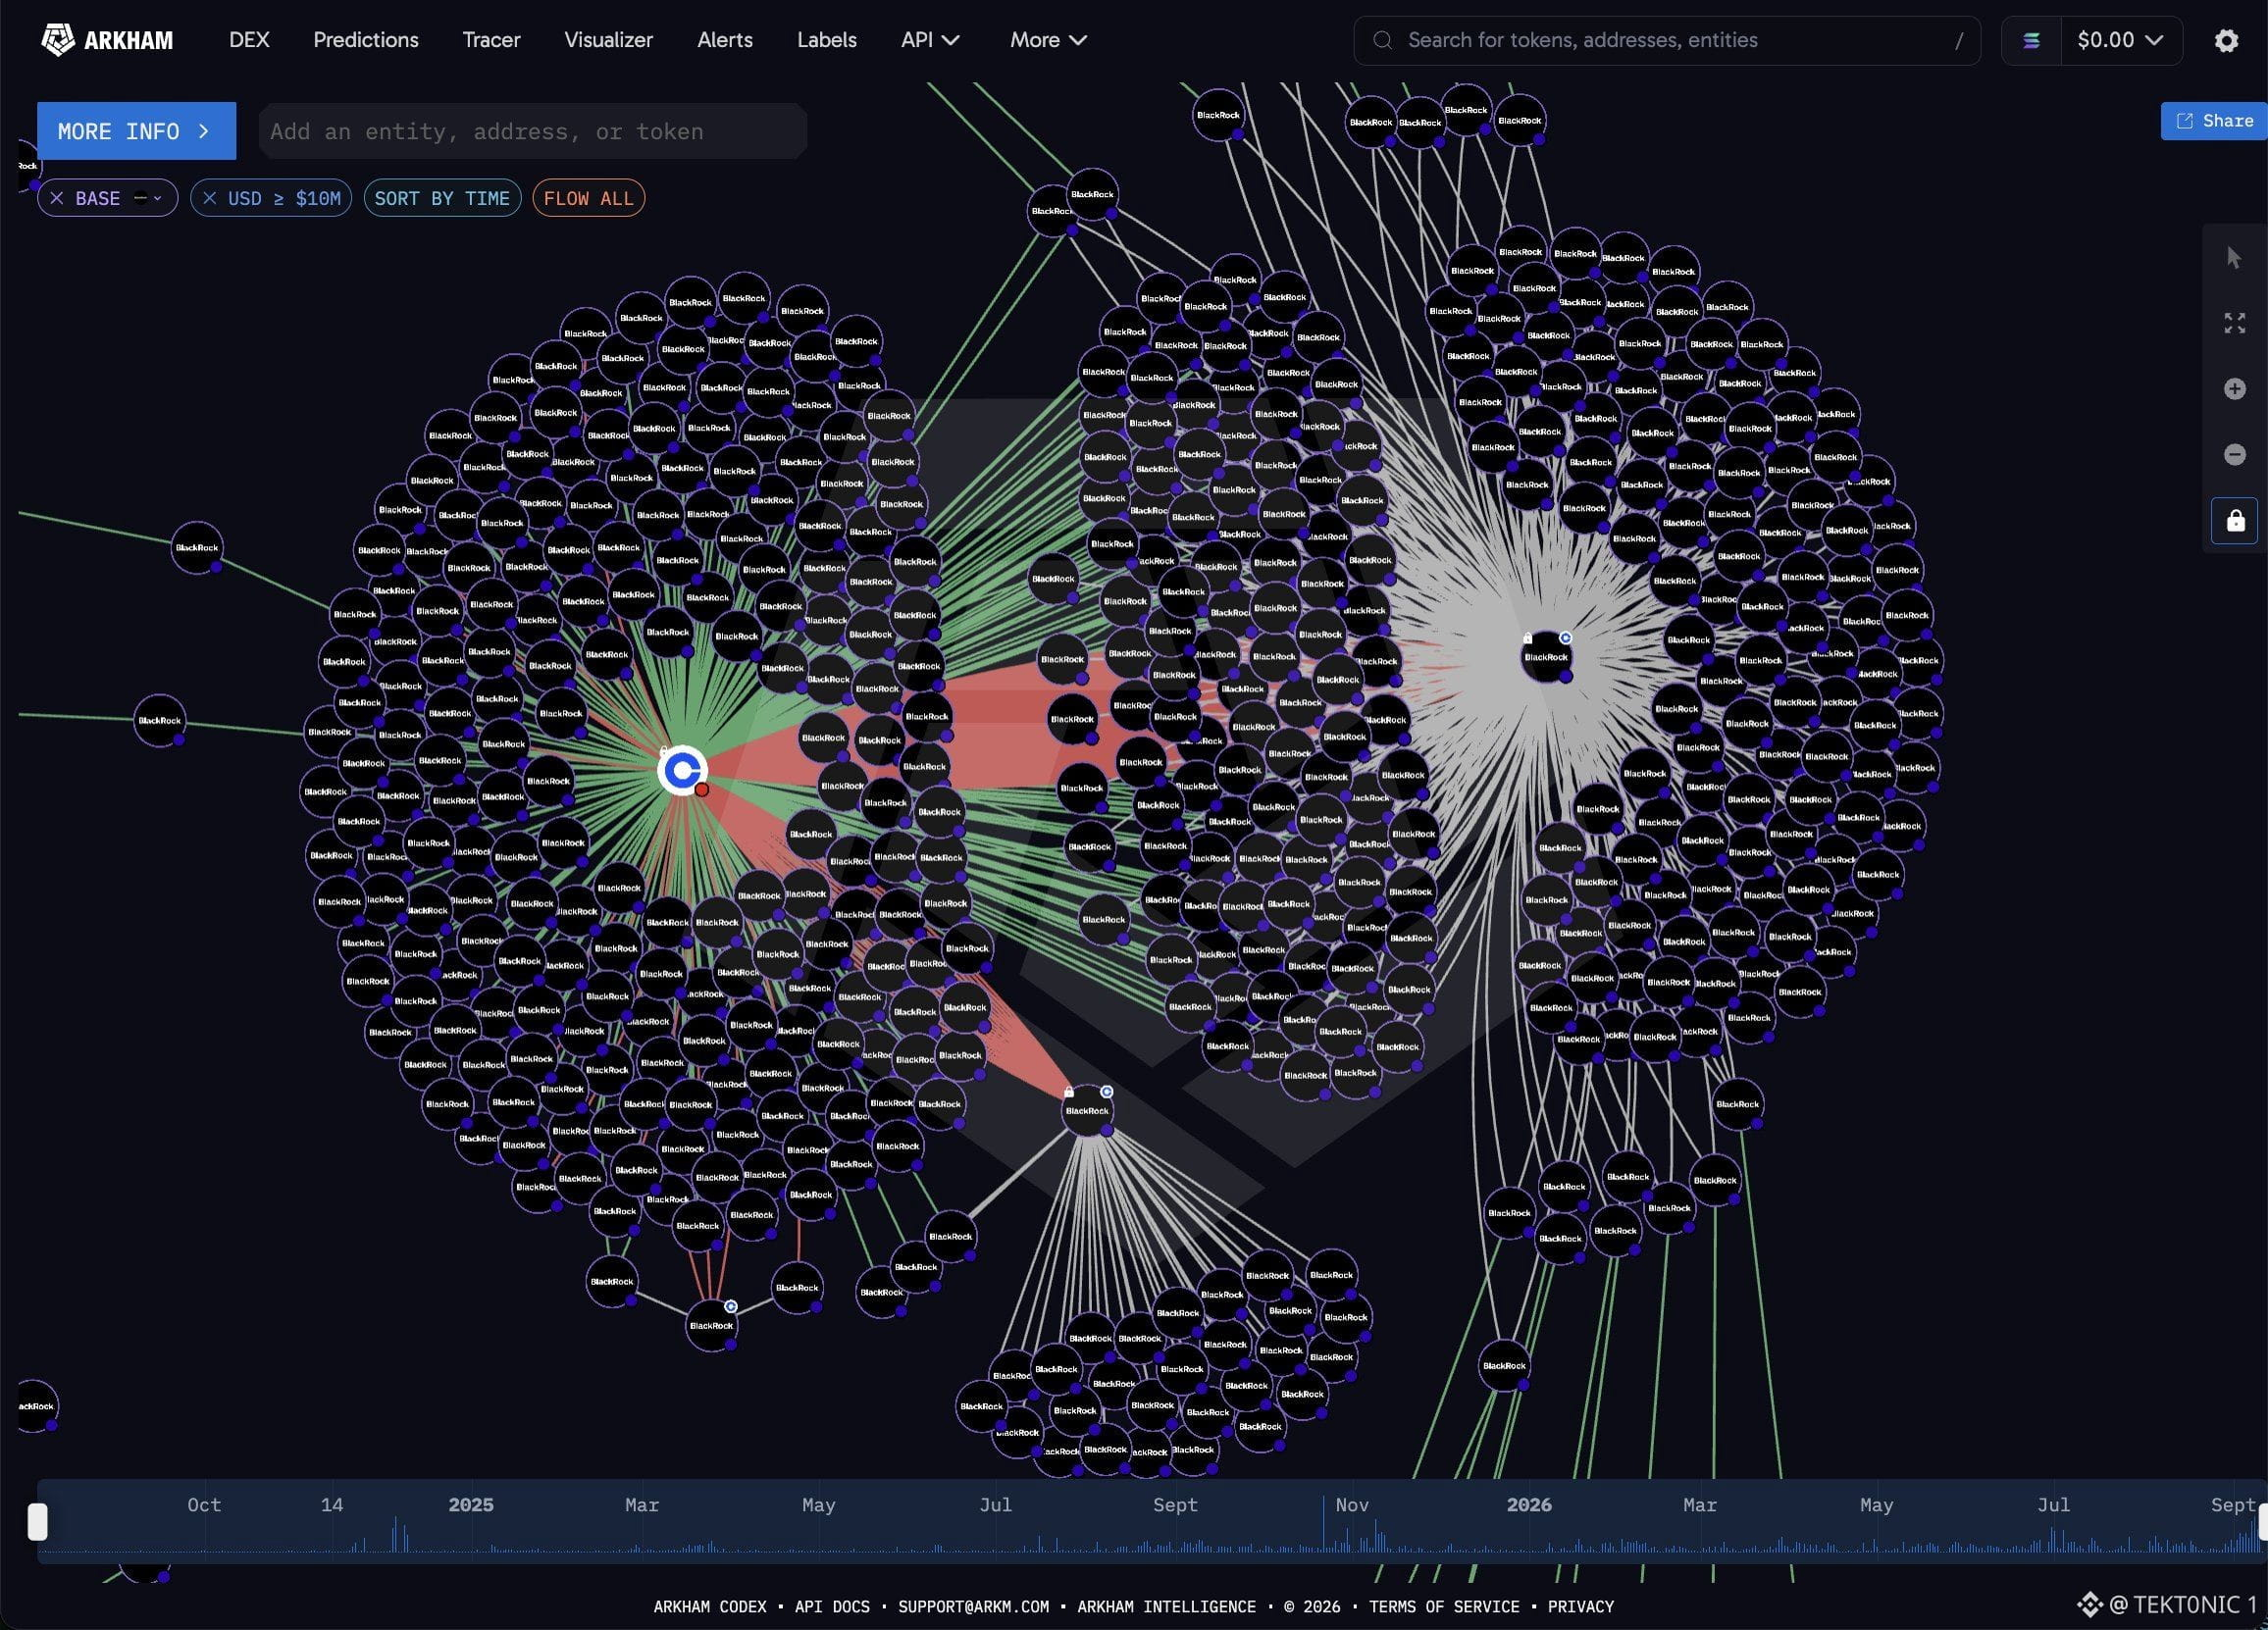
BlackRock’s ETHB Has Taken In $251 Million of Ether in 20 Straight Days One Ether product is buying. The others on the same day were not. According to the latest flow print, BlackRock’s ETHB bought $13.9 million of $ETH yesterday. Sister fund ETHA and Fidelity’s FETH both posted outflows. Over the last 20 trading days ETHB has added $251.4 million of Ether and has not recorded a single outflow day. Key Details: > ETHB yesterday: +$13.9 million. > ETHB over 20 sessions: +$251.4 million, no down days. > ETHA and FETH: outflows on the same day ETHB was green. > This is client demand into one BlackRock Ether share class, not a firm-wide call to sell Bitcoin. Twenty green days in one $ETH product is a real bid. It is not proof Wall Street has rotated out of Bitcoin. IBIT was still taking in hundreds of millions of $BTC earlier this month. The cleaner read is that ETH exposure is being added through ETHB while other Ether funds stay mixed. BlackRock ETHB: +$13.9M Yesterday, +$251M Over 20 Days, Zero Outflow Sessions Do you read a 20-day ETHB streak as Ether catching a bid, or as one share class filling while ETHA and FETH leak? #BTC Price Analysis# #Bitcoin Price Prediction: What is Bitcoins next move?# #Ethereum $BTC
BlackRock’s ETHB Has Taken In $251 Million of Ether in 20 Straight Days One Ether product is buying. The others on the same day were not. According to the latest flow print, BlackRock’s ETHB bought $13.9 million of $ETH yesterday. Sister fund ETHA and Fidelity’s FETH both posted outflows. Over the last 20 trading days ETHB has added $251.4 million of Ether and has not recorded a single outflow day. Key Details: > ETHB yesterday: +$13.9 million. > ETHB over 20 sessions: +$251.4 million, no down days. > ETHA and FETH: outflows on the same day ETHB was green. > This is client demand into one BlackRock Ether share class, not a firm-wide call to sell Bitcoin. Twenty green days in one $ETH product is a real bid. It is not proof Wall Street has rotated out of Bitcoin. IBIT was still taking in hundreds of millions of $BTC earlier this month. The cleaner read is that ETH exposure is being added through ETHB while other Ether funds stay mixed. BlackRock ETHB: +$13.9M Yesterday, +$251M Over 20 Days, Zero Outflow Sessions Do you read a 20-day ETHB streak as Ether catching a bid, or as one share class filling while ETHA and FETH leak? #BTC Price Analysis# #Bitcoin Price Prediction: What is Bitcoins next move?# #Ethereum $BTC
·
--
About $1.5 Billion of Tokenized Assets Are Now Posted as Lending Collateral A wallet balance only shows the fund is held. Collateral shows it is being used. According to the latest lending-market tally, roughly $1.5 billion of tokenized real-world assets is working as collateral today — posted into protocols so someone can borrow against it. The Spiko EU T-bill example on Morpho is a small piece of that: collateral supplied has climbed above $2 million, with debt borrowed tracking just under that line since the April ramp. Key Details: > Tokenized assets used as lending collateral: about $1.5 billion. > Holding a tokenized fund in a wallet is custody. Posting it on Morpho or another market is financing. > Spiko EU T-bills on Morpho: collateral above $2 million, borrow a step below, flat since July. > The gap between the red and blue lines is unused collateral — supply that is posted but not fully drawn. $1.5 billion is still small next to crypto-native collateral. It is the first clean signal that tokenized T-bills and similar paper are leaving the “just sitting there” bucket. Watch whether that $1.5 billion figure keeps rising, not only whether more funds get issued. $1.5B Tokenized Assets Live as Lending Collateral — Spiko T-Bills on Morpho Above $2M #BTC Price Analysis# #Bitcoin Price Prediction: What is Bitcoins next move?# $BTC $XRP
About $1.5 Billion of Tokenized Assets Are Now Posted as Lending Collateral A wallet balance only shows the fund is held. Collateral shows it is being used. According to the latest lending-market tally, roughly $1.5 billion of tokenized real-world assets is working as collateral today — posted into protocols so someone can borrow against it. The Spiko EU T-bill example on Morpho is a small piece of that: collateral supplied has climbed above $2 million, with debt borrowed tracking just under that line since the April ramp. Key Details: > Tokenized assets used as lending collateral: about $1.5 billion. > Holding a tokenized fund in a wallet is custody. Posting it on Morpho or another market is financing. > Spiko EU T-bills on Morpho: collateral above $2 million, borrow a step below, flat since July. > The gap between the red and blue lines is unused collateral — supply that is posted but not fully drawn. $1.5 billion is still small next to crypto-native collateral. It is the first clean signal that tokenized T-bills and similar paper are leaving the “just sitting there” bucket. Watch whether that $1.5 billion figure keeps rising, not only whether more funds get issued. $1.5B Tokenized Assets Live as Lending Collateral — Spiko T-Bills on Morpho Above $2M #BTC Price Analysis# #Bitcoin Price Prediction: What is Bitcoins next move?# $BTC $XRP

·
--
Binance just saw a hard $ETH bid. On the 5-minute ETHUSDT chart, price ran from $2,433 to $2,666. It is now holding around $2,603. Binance USDT cumulative volume delta printed +74.25 million into that spike. That is aggressive market buying on the main pair. The session low was $2,433. The high was $2,666. Price is already back above $2,550. A weekly close over $2,550 is the level being watched for a run toward $3,000. That matters because CVD rising with price means the lift was bought, not just a thin squeeze with no flow. The catch: $3,000 is a target, not a fill. Other $ETH pairs on the same window were mixed, including a −16.58 million print. One strong Binance impulse can fade before the weekly candle closes. So the bid showed up. The weekly close still has to hold. #BTC Price Analysis# #Bitcoin Price Prediction: What is Bitcoins next move?# $BTC
Binance just saw a hard $ETH bid. On the 5-minute ETHUSDT chart, price ran from $2,433 to $2,666. It is now holding around $2,603. Binance USDT cumulative volume delta printed +74.25 million into that spike. That is aggressive market buying on the main pair. The session low was $2,433. The high was $2,666. Price is already back above $2,550. A weekly close over $2,550 is the level being watched for a run toward $3,000. That matters because CVD rising with price means the lift was bought, not just a thin squeeze with no flow. The catch: $3,000 is a target, not a fill. Other $ETH pairs on the same window were mixed, including a −16.58 million print. One strong Binance impulse can fade before the weekly candle closes. So the bid showed up. The weekly close still has to hold. #BTC Price Analysis# #Bitcoin Price Prediction: What is Bitcoins next move?# $BTC

·
--
Kalshi Puts a 41% Chance on $HYPE Finishing 2026 at $100 or Higher The crowd’s base case is still a four-digit year-end. It is not a lock. According to Kalshi’s “HYPE price at the end of the year?” market, “$100 or above” is the leading bucket at 41%. HYPE is trading near $80, so that contract is asking whether it can add about 25% and hold it into December. The next listed bands are $85–$89 at 14%, $45–$49 at 12%, and $50–$54 at 10%. Key Details: > Year-end $100 or above: 41%. > $85–$89: 14%. > $45–$49: 12%. > $50–$54: 10%. Spot is near $80, so $100 is the nearest round-number target above the market. 41% is the most popular outcome on this board, not a majority. Add the mid-80s bucket and you get a decent cluster above today’s price. The lower bands show a real minority still pricing a fade back into the $45–$55 zone. CryptoRank’s new Prediction section now tracks these kinds of target probabilities in one place. $HYPE Year-End: 41% Odds of $100+, With $80 Spot #Bitcoin Price Prediction: What is Bitcoins next move?# #BTC Price Analysis# $BTC
Kalshi Puts a 41% Chance on $HYPE Finishing 2026 at $100 or Higher The crowd’s base case is still a four-digit year-end. It is not a lock. According to Kalshi’s “HYPE price at the end of the year?” market, “$100 or above” is the leading bucket at 41%. HYPE is trading near $80, so that contract is asking whether it can add about 25% and hold it into December. The next listed bands are $85–$89 at 14%, $45–$49 at 12%, and $50–$54 at 10%. Key Details: > Year-end $100 or above: 41%. > $85–$89: 14%. > $45–$49: 12%. > $50–$54: 10%. Spot is near $80, so $100 is the nearest round-number target above the market. 41% is the most popular outcome on this board, not a majority. Add the mid-80s bucket and you get a decent cluster above today’s price. The lower bands show a real minority still pricing a fade back into the $45–$55 zone. CryptoRank’s new Prediction section now tracks these kinds of target probabilities in one place. $HYPE Year-End: 41% Odds of $100+, With $80 Spot #Bitcoin Price Prediction: What is Bitcoins next move?# #BTC Price Analysis# $BTC

1
·
--
Markets Now Treat a September Hike as the Base Case Fed funds futures have shifted from a live debate to a hike-led path. As of September 10 the strip priced a 69.7% chance of a 25 bp move at the September 16 meeting, taking the implied rate to 3.804% from a 3.63% effective rate. The October 28 meeting added another 34.3% chance of a further hike, lifting the implied rate to 3.890%. By December the curve was already pointing to about 1.7 hikes and an implied rate near 4.05%. That was before today’s CPI. Core rose 0.3% month-over-month versus a 0.2% consensus. After the print, futures and FedWatch moved the September hike odds into the mid-80s to around 90%, with two hikes more fully priced by year-end. The nuance is the starting point. Policy has been on hold near 3.75% all year. The market is no longer pricing a one-and-done debate. It is pricing a tightening path into 2027, with implied overnight rates rising toward the mid-4s. A 70% hike odds print was the warning. The hot core reading is what turned it into the working assumption. #BTC Price Analysis# #Bitcoin Price Prediction: What is Bitcoins next move?# $BTC $XRP
Markets Now Treat a September Hike as the Base Case Fed funds futures have shifted from a live debate to a hike-led path. As of September 10 the strip priced a 69.7% chance of a 25 bp move at the September 16 meeting, taking the implied rate to 3.804% from a 3.63% effective rate. The October 28 meeting added another 34.3% chance of a further hike, lifting the implied rate to 3.890%. By December the curve was already pointing to about 1.7 hikes and an implied rate near 4.05%. That was before today’s CPI. Core rose 0.3% month-over-month versus a 0.2% consensus. After the print, futures and FedWatch moved the September hike odds into the mid-80s to around 90%, with two hikes more fully priced by year-end. The nuance is the starting point. Policy has been on hold near 3.75% all year. The market is no longer pricing a one-and-done debate. It is pricing a tightening path into 2027, with implied overnight rates rising toward the mid-4s. A 70% hike odds print was the warning. The hot core reading is what turned it into the working assumption. #BTC Price Analysis# #Bitcoin Price Prediction: What is Bitcoins next move?# $BTC $XRP

·
--
UniCredit Weighs Crypto Custody and Brokerage Italy’s second-largest bank is looking at building the pipes to hold and trade digital assets, not just wrap them in a structured note. Bloomberg reported on September 11 that UniCredit is evaluating technology partners for custody and brokerage infrastructure. Talks are early. No final decision has been made. The work under review also includes tokenized investment products, fixed-income securities, stablecoin use, and client crypto exposure. That would be a step beyond what the bank has already done. It has sold professional clients a product linked to BlackRock’s IBIT, issued Italy’s first tokenized minibond on a public blockchain, joined the Qivalis group working on a euro stablecoin, and this week took a minority stake in German platform VC Trade. The move fits a wider European bank shift under MiCA. Custody and brokerage matter more than another one-off tokenized bond, because they are how client assets actually sit on the balance sheet of a large lender. This is still a review, not a launch. The signal is that a major Italian bank is now shopping for the infrastructure, not dismissing the category. #BTC Price Analysis# #Bitcoin Price Prediction: What is Bitcoins next move?# $BTC $XRP
UniCredit Weighs Crypto Custody and Brokerage Italy’s second-largest bank is looking at building the pipes to hold and trade digital assets, not just wrap them in a structured note. Bloomberg reported on September 11 that UniCredit is evaluating technology partners for custody and brokerage infrastructure. Talks are early. No final decision has been made. The work under review also includes tokenized investment products, fixed-income securities, stablecoin use, and client crypto exposure. That would be a step beyond what the bank has already done. It has sold professional clients a product linked to BlackRock’s IBIT, issued Italy’s first tokenized minibond on a public blockchain, joined the Qivalis group working on a euro stablecoin, and this week took a minority stake in German platform VC Trade. The move fits a wider European bank shift under MiCA. Custody and brokerage matter more than another one-off tokenized bond, because they are how client assets actually sit on the balance sheet of a large lender. This is still a review, not a launch. The signal is that a major Italian bank is now shopping for the infrastructure, not dismissing the category. #BTC Price Analysis# #Bitcoin Price Prediction: What is Bitcoins next move?# $BTC $XRP

·
--
Long-Term Holder Losses Can Last a Year A first print of holder stress is not the same as a finished bottom. Glassnode’s LTH-SOPR chart shows older coins can be spent at a loss for a long time. The 2014–15 bear kept that condition in place for 402 days, with the metric falling to 0.50, or about a 50% average loss. The 2018–19 bear lasted 328 days and bottomed near 0.48, or about a 52% loss. March 2020 was short: 50 days, down to 0.80, or about a 20% loss. In July 2022 the same metric was at 0.67. Long-term holders moving coins were locking in an average 33% loss after only 51 days in that zone. Glassnode still warned that prices could fall further. They did. Cryptoquant_com’s long-term versus short-term comparison needs the same caution. Being less profitable than another cohort does not automatically mean you are realizing a loss. Relative underperformance can persist while the broader reset is unfinished. That still leaves a case to accumulate. It does not create a reason to rush. Prior cycles needed time in loss, not just the first reading of it. #BTC Price Analysis# #Bitcoin Price Prediction: What is Bitcoins next move?# $BTC $XRP
Long-Term Holder Losses Can Last a Year A first print of holder stress is not the same as a finished bottom. Glassnode’s LTH-SOPR chart shows older coins can be spent at a loss for a long time. The 2014–15 bear kept that condition in place for 402 days, with the metric falling to 0.50, or about a 50% average loss. The 2018–19 bear lasted 328 days and bottomed near 0.48, or about a 52% loss. March 2020 was short: 50 days, down to 0.80, or about a 20% loss. In July 2022 the same metric was at 0.67. Long-term holders moving coins were locking in an average 33% loss after only 51 days in that zone. Glassnode still warned that prices could fall further. They did. Cryptoquant_com’s long-term versus short-term comparison needs the same caution. Being less profitable than another cohort does not automatically mean you are realizing a loss. Relative underperformance can persist while the broader reset is unfinished. That still leaves a case to accumulate. It does not create a reason to rush. Prior cycles needed time in loss, not just the first reading of it. #BTC Price Analysis# #Bitcoin Price Prediction: What is Bitcoins next move?# $BTC $XRP

·
--
Metaplanet Cuts Executive Options After Shareholder Pushback Japan’s largest public Bitcoin treasury just reduced the size of management’s claim. According to the company’s September 11 notice, the board revised the Series 10 stock acquisition rights. The conversion ratio was reset and about 41% of the related potential shares were cancelled, wiping out more than $220 million of warrant value. CEO Simon Gerovich had already exercised rights that delivered about 64 million shares. Remaining unvested options now unlock in 2029, 2030, and 2031. Key Details: > CEO already took about 64 million shares from the Series 10 exercise. > Options cut: the pool was reduced, cancelling over $220 million of warrant value and about 41% of related shares. > Conversion reset to 410 shares per right, the pre-offering level. > Unvested remainder vests in tranches from 2029 through 2031. > A planned employee incentive pool attached to this structure was cancelled. The backlash was about dilution: the option formula had grown with every share issued to buy Bitcoin, swelling management’s claim. Cutting the pool raises Bitcoin per fully diluted share. It does not undo the shares already issued to the CEO. Governance is now part of the Metaplanet trade, not just the BTC stack. Metaplanet: 105M-Scale Option Cut, $220M Wiped, CEO’s 64M Shares Already Out #BTC Price Analysis# #Bitcoin Price Prediction: What is Bitcoins next move?# $BTC $SOL
Metaplanet Cuts Executive Options After Shareholder Pushback Japan’s largest public Bitcoin treasury just reduced the size of management’s claim. According to the company’s September 11 notice, the board revised the Series 10 stock acquisition rights. The conversion ratio was reset and about 41% of the related potential shares were cancelled, wiping out more than $220 million of warrant value. CEO Simon Gerovich had already exercised rights that delivered about 64 million shares. Remaining unvested options now unlock in 2029, 2030, and 2031. Key Details: > CEO already took about 64 million shares from the Series 10 exercise. > Options cut: the pool was reduced, cancelling over $220 million of warrant value and about 41% of related shares. > Conversion reset to 410 shares per right, the pre-offering level. > Unvested remainder vests in tranches from 2029 through 2031. > A planned employee incentive pool attached to this structure was cancelled. The backlash was about dilution: the option formula had grown with every share issued to buy Bitcoin, swelling management’s claim. Cutting the pool raises Bitcoin per fully diluted share. It does not undo the shares already issued to the CEO. Governance is now part of the Metaplanet trade, not just the BTC stack. Metaplanet: 105M-Scale Option Cut, $220M Wiped, CEO’s 64M Shares Already Out #BTC Price Analysis# #Bitcoin Price Prediction: What is Bitcoins next move?# $BTC $SOL

·
--
Bitcoin Reclaimed $78,000 and Ether Took Back $2,500 The CPI print was in line. The bounce was not small. According to the session charts, $BTC ran from a wick near $76,100 back through $78,000, up about 1% on the day. $ETH dropped toward $2,435, then reclaimed $2,500 and last printed near $2,510, up about 3%. Key Details: > Bitcoin: about $78,000, +$750 / +0.97% on the session after a fast dip. > Ethereum: about $2,510, +$74 / +3.03%, back above $2,500. > Context: Friday CPI at 3.4%, matching forecasts, after Thursday’s 5.4% PPI. > Ether is outrunning Bitcoin on the day, which fits the recent dip in BTC dominance. In-line CPI took the worst hike scare off the tape for an afternoon. $78,000 is still below the $80,000–$83,000 shelf that matters on the weekly. $2,500 Ether is a round-number reclaim, not a new trend by itself. Next week’s Fed meeting is still the event that decides whether this bounce holds. Bitcoin $78,000 and Ether $2,500 After In-Line CPI Do you buy this reclaim into the Fed meeting, or fade it until $80,000 and $2,550 actually hold? #BTC Price Analysis# #Bitcoin Price Prediction: What is Bitcoins next move?# $BTC $ETH
Bitcoin Reclaimed $78,000 and Ether Took Back $2,500 The CPI print was in line. The bounce was not small. According to the session charts, $BTC ran from a wick near $76,100 back through $78,000, up about 1% on the day. $ETH dropped toward $2,435, then reclaimed $2,500 and last printed near $2,510, up about 3%. Key Details: > Bitcoin: about $78,000, +$750 / +0.97% on the session after a fast dip. > Ethereum: about $2,510, +$74 / +3.03%, back above $2,500. > Context: Friday CPI at 3.4%, matching forecasts, after Thursday’s 5.4% PPI. > Ether is outrunning Bitcoin on the day, which fits the recent dip in BTC dominance. In-line CPI took the worst hike scare off the tape for an afternoon. $78,000 is still below the $80,000–$83,000 shelf that matters on the weekly. $2,500 Ether is a round-number reclaim, not a new trend by itself. Next week’s Fed meeting is still the event that decides whether this bounce holds. Bitcoin $78,000 and Ether $2,500 After In-Line CPI Do you buy this reclaim into the Fed meeting, or fade it until $80,000 and $2,550 actually hold? #BTC Price Analysis# #Bitcoin Price Prediction: What is Bitcoins next move?# $BTC $ETH

26
·
--
Test a Transfer Before You Move Large Amounts A small test send is the simplest way to avoid a permanent loss. Send one rupee or one dollar first. Confirm it lands on the right address, the right network, and the right asset. That check takes about thirty seconds. It is the difference between a cheap mistake and a full-balance error. Most large wallet losses do not come from market moves. They come from a wrong chain, a mistyped address, or a destination that was never verified. The test is how you catch that before the real amount leaves. The amount itself is trivial. The signal is the confirmation. If you are using a hardware wallet, match the receive address on the device screen, not only in the app. Then send the rest. A small test is still the highest-leverage habit in crypto operations. #BTC Price Analysis# #Bitcoin Price Prediction: What is Bitcoins next move?# $BTC $XRP
Test a Transfer Before You Move Large Amounts A small test send is the simplest way to avoid a permanent loss. Send one rupee or one dollar first. Confirm it lands on the right address, the right network, and the right asset. That check takes about thirty seconds. It is the difference between a cheap mistake and a full-balance error. Most large wallet losses do not come from market moves. They come from a wrong chain, a mistyped address, or a destination that was never verified. The test is how you catch that before the real amount leaves. The amount itself is trivial. The signal is the confirmation. If you are using a hardware wallet, match the receive address on the device screen, not only in the app. Then send the rest. A small test is still the highest-leverage habit in crypto operations. #BTC Price Analysis# #Bitcoin Price Prediction: What is Bitcoins next move?# $BTC $XRP

23
·
--
U.S. CPI Comes In at 3.4%, Right on Forecast The consumer print did not surprise. It also did not clear the hike debate. According to the latest CPI release, annual inflation printed 3.4%, matching expectations. That is an in-line number: not hot enough to force a new scare on its own, not cool enough to take a September hike off the table after this week’s 162,000 jobs report and 5.4% PPI. Key Details: > Headline CPI: 3.4% year over year, as expected. > That follows Thursday’s PPI at 5.4% year over year. > Jobs data this month was already firm at +162,000. > The Fed meeting is next week. An in-line CPI leaves the decision to the committee, not to a shock print. “Neither bearish nor bullish” is the right first read for risk assets. Bitcoin near $80,000 and gold after yesterday’s flush now trade the Fed path, not a CPI surprise. A hold would help the $83,000 test. A hike would put $80,000 back in play as resistance. CPI at 3.4%, In Line — The Print Does Not Decide the Hike. Next Week’s Fed Meeting Does. Do you treat in-line CPI as permission to buy the $80,000 dip, or do you wait for the Fed decision first? #BTC Price Analysis# #Bitcoin Price Prediction: What is Bitcoins next move?# $BTC $ETH
U.S. CPI Comes In at 3.4%, Right on Forecast The consumer print did not surprise. It also did not clear the hike debate. According to the latest CPI release, annual inflation printed 3.4%, matching expectations. That is an in-line number: not hot enough to force a new scare on its own, not cool enough to take a September hike off the table after this week’s 162,000 jobs report and 5.4% PPI. Key Details: > Headline CPI: 3.4% year over year, as expected. > That follows Thursday’s PPI at 5.4% year over year. > Jobs data this month was already firm at +162,000. > The Fed meeting is next week. An in-line CPI leaves the decision to the committee, not to a shock print. “Neither bearish nor bullish” is the right first read for risk assets. Bitcoin near $80,000 and gold after yesterday’s flush now trade the Fed path, not a CPI surprise. A hold would help the $83,000 test. A hike would put $80,000 back in play as resistance. CPI at 3.4%, In Line — The Print Does Not Decide the Hike. Next Week’s Fed Meeting Does. Do you treat in-line CPI as permission to buy the $80,000 dip, or do you wait for the Fed decision first? #BTC Price Analysis# #Bitcoin Price Prediction: What is Bitcoins next move?# $BTC $ETH

2
163
Log in to explore more content
Join global crypto users on Binance Square
⚡️ Get latest and useful information about crypto.
💬 Trusted by the world’s largest crypto exchange.
👍 Discover real insights from verified creators.
Email / Phone number
Trending Topics
ClarityActFacesProceduralVoteSept15
16,474 views
308 Discussing
#clarityactfacesproceduralvotesept15
🚨 CLARITY Act Faces Procedural Vote September 15 🚨
The Senate chamber is quiet, but the crypto market is already watching the clock. On September 15, one procedural vote could determine whether a major U.S. crypto market-structure bill gets its chance to move forward.
The CLARITY Act is not facing final passage that day. Senators are expected to vote on a motion to proceed, a critical procedural step that requires 60 votes to clear the Senate hurdle.
That distinction matters. A successful vote would not make the bill law, but it would open the door to further Senate consideration and negotiations.
The stakes are substantial because the legislation aims to establish clearer rules around digital assets and determine how responsibilities are divided between U.S. regulators.
The latest 630-page revision also adds provisions addressing certain non-decentralized trading protocols, while several political and regulatory disagreements remain unresolved.
My take: September 15 should be viewed less as a victory-or-defeat day and more as a credibility test. Clearing the procedural barrier could strengthen confidence that U.S. crypto legislation is moving toward a clearer framework. Failure could extend uncertainty.
For crypto markets, regulatory clarity can influence institutional participation, business decisions, and how investors price U.S. exposure. But expectations can move faster than legislation itself.
The real signal is not whether crypto gets clarity overnight, but whether lawmakers can finally build enough consensus to move the process forward.
Will the September 15 vote become a turning point for U.S. crypto regulation, or another delay?
Disclaimer: This article is for educational purposes only and is not financial advice. Conduct your own research and manage risk carefully.
#CryptoRegulation #Bitcoin #GrowWithSAC $SUI $NEAR $BNB
#ClarityActFacesProceduralVoteSept15
Sienna Leo-你真棒-带我走
·3 Likes
·2.7k views
US2YearYieldRisesTo4.61%
19,232 views
387 Discussing
US10YearTreasuryYieldNears5%
10,037 views
230 Discussing