

老陌
871 Posts

老陌
 Square Verified
Report
Block User
Marketing Advisor|#Airdrop|Share first-line news! #实话实说爆光内幕!
25 Following
1.2K+ Followers
841 Liked
1 Badges
Posts
All
Videos
·
--
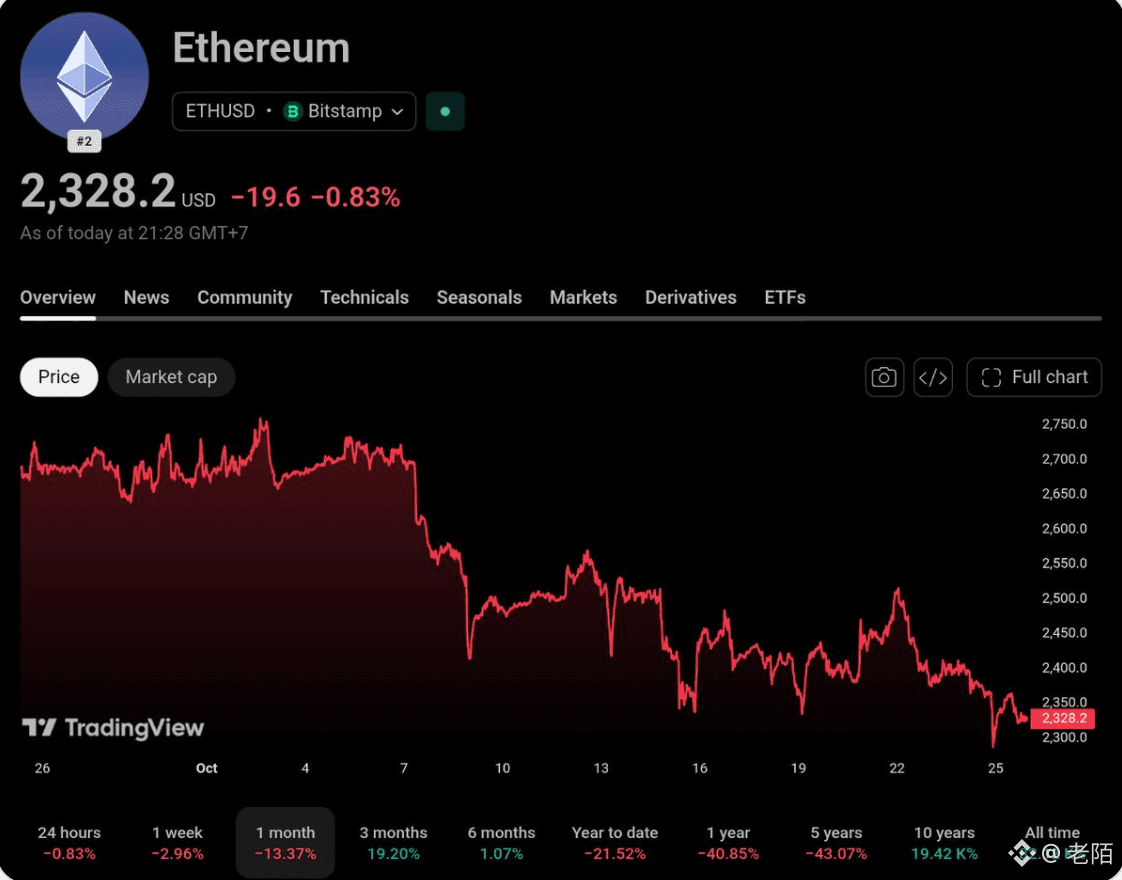
🔥 $ETH In less than three weeks, $54 billion in market capitalization evaporated—a decline of about 15%!
Analyst Darkfost believes the market flush may be nearing its end.
After a similar drop in open interest (OI) last July, ETH subsequently rose 32%.
Will history repeat itself? Worth watching, but don't treat a rebound as inevitable.$BTC
Analyst Darkfost believes the market flush may be nearing its end.
After a similar drop in open interest (OI) last July, ETH subsequently rose 32%.
Will history repeat itself? Worth watching, but don't treat a rebound as inevitable.$BTC
249
·
--
🚨 Will 2026 be the year the AI bubble bursts?
The Great Depression of 1929, the dot-com bubble of 2000—and now, AI-related stocks are highly valued as market speculation heats up.
History doesn’t simply repeat itself, but similar risk patterns are worth watching: high valuations, excessive optimism, and the belief that this time is different.
The real risk is that when expectations aren’t met, buyers suddenly disappear.
Stocks and $BTC are no different—don’t ignore risk management.
161
·
--
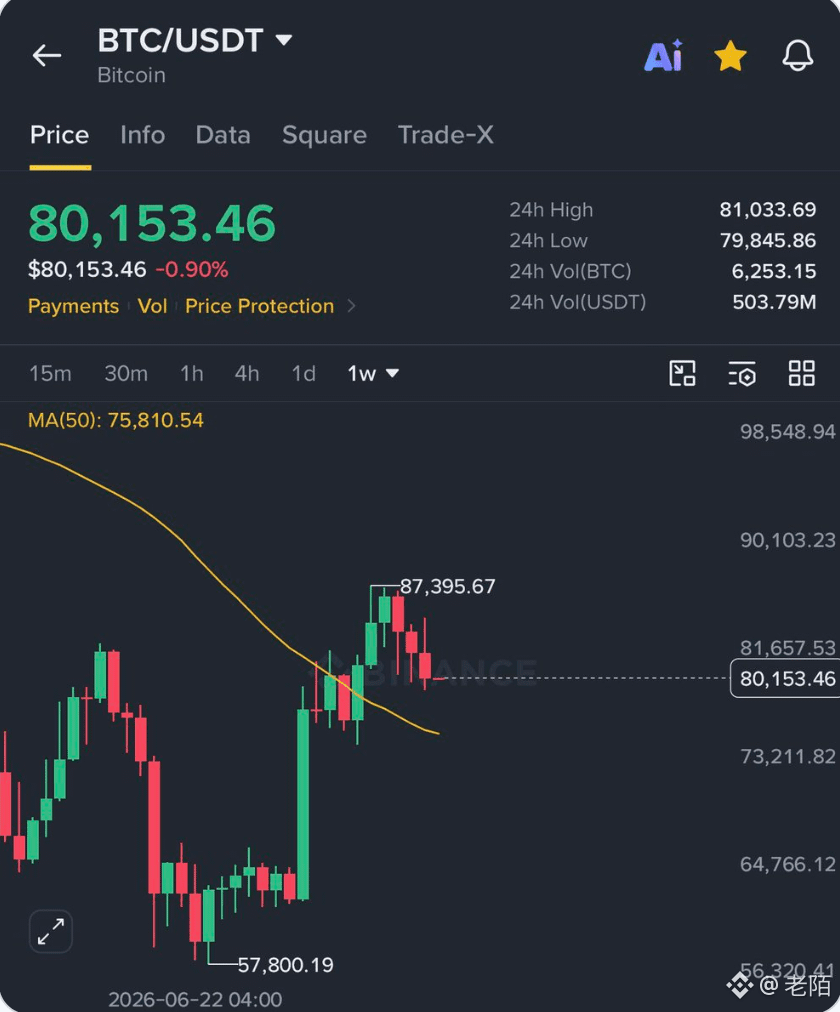
BTC closed down 2.39% this week, but still held above the 50-week moving average for the 6th consecutive week.
Despite a pullback in US stocks, BTC’s key support remains intact.
Short-term pressure doesn’t mean the trend has reversed. $BTC
BTC closed down 2.39% this week, but still held above the 50-week moving average for the 6th consecutive week.
Despite a pullback in US stocks, BTC’s key support remains intact.
Short-term pressure doesn’t mean the trend has reversed. $BTC
Despite a pullback in US stocks, BTC’s key support remains intact.
Short-term pressure doesn’t mean the trend has reversed. $BTC
171
·
--
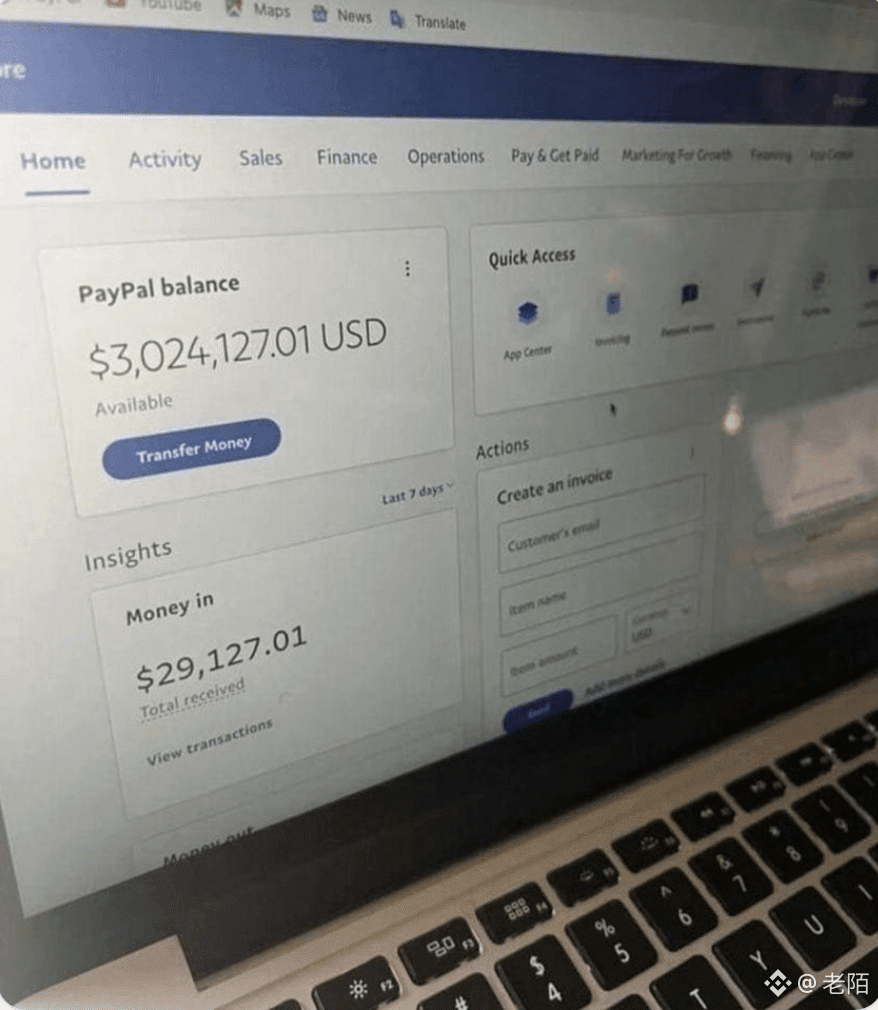
Want $30,000? 💰
Comment “YES” below, then check your DMs! 👀
Only the first 3,800 people!
Be sure to follow me first for a chance to win a prize!
$BTC
Want $30,000? 💰
Comment “YES” below, then check your DMs! 👀
Only the first 3,800 people!
Be sure to follow me first for a chance to win a prize!
$BTC
Comment “YES” below, then check your DMs! 👀
Only the first 3,800 people!
Be sure to follow me first for a chance to win a prize!
$BTC
127
·
--
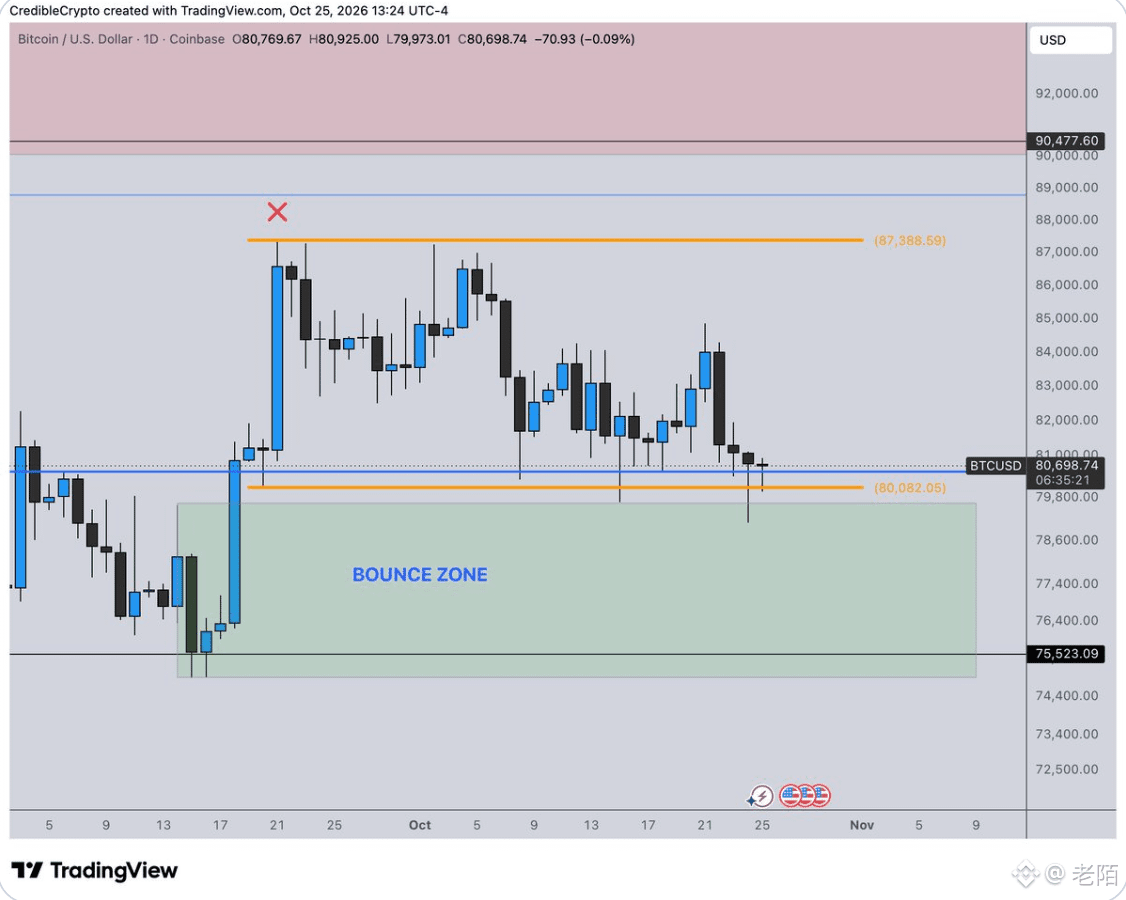
The trend for $BTC remains quite solid, with the price currently in a higher-timeframe support and demand zone.
Compared with a dip to 74K, I think the possibility of an upward move to test 87K or even higher levels is more worth watching.
The key is to see whether support holds—don't let short-term volatility shake you out too easily.
Compared with a dip to 74K, I think the possibility of an upward move to test 87K or even higher levels is more worth watching.
The key is to see whether support holds—don't let short-term volatility shake you out too easily.
234
·
--
🚨 Gold bulls, take note! $XAUUSD isn’t done yet, but we could see a drop on Monday!
🎯 Key area to watch: 3885–3875 (liquidity pool)
This range could be an important level to watch for short-term price action.
Even if gold’s overall trend remains strong, that doesn’t mean the price can’t suddenly pull back.
Remember: a bullish long-term trend doesn’t mean every price level is a good place to go long.
Watch how price reacts on Monday, and don’t blindly add to your position when volatility picks up.
The same goes for trading gold and $BTC : manage risk first, then think about profits.
247
·
--
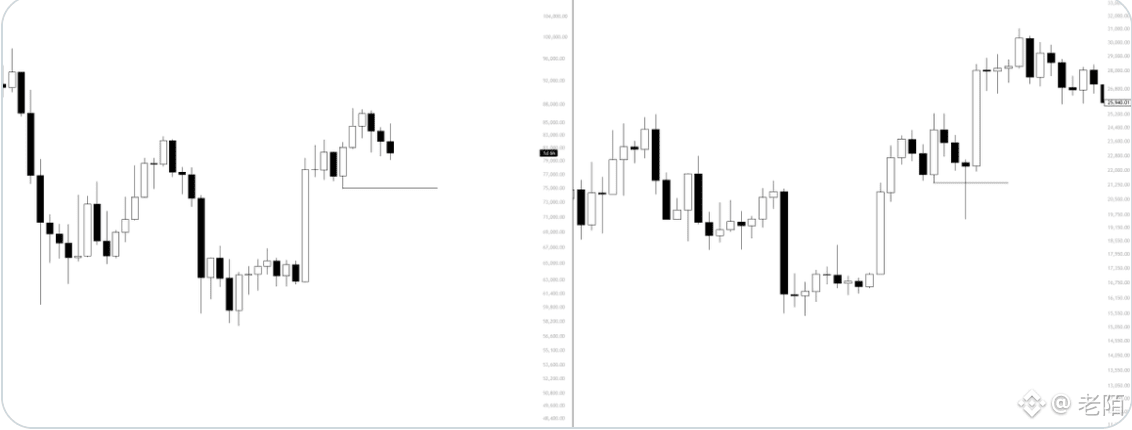
Many people are waiting for $BTC to fall back to that long lower wick at its all-time low, but they’re overlooking the macroeconomic backdrop behind that extreme drop.
At the time, the SEC sued Binance and CZ, sued Coinbase, and tried to freeze Binance US assets. The Federal Reserve also sent hawkish signals.
It was the combination of these headwinds that triggered that kind of panic selling.
Unless there’s an even bigger negative catalyst still to come, I’m not going to fixate on that wick and wait for a dip to buy. History can be a guide, but it doesn’t necessarily repeat itself.
Are fourth-quarter buyers still sitting on the sidelines? My plan is to dollar-cost average into $BTC over the next few weeks.
A current pullback of around 9% isn’t particularly steep in a bull market.
3
2
4.3k
·
--
$BTC There are over $80 million in buy orders sitting in the $78,000–$79,000 range! 👀
Yesterday, after the buy orders near $80,000 were filled, Bitcoin did see a short-term rebound.
But now the price is weakening again. The question is: spot buyers don’t seem to have really stepped in yet.
Without sustained spot buying, a large number of buy orders below doesn’t necessarily mean the price will hold.
Next, keep an eye on buying support at $78K–$79K, and watch out for the risk of another dip. 📉
530
·
--
🚨 Financial pressure on Americans is intensifying!
According to the source data, the U.S. saw nearly 470,000 bankruptcy filings in the first nine months of 2026, up 11% year over year.
Even more concerning, small business bankruptcies surged 46% in just one year!
Rising living costs, high loan interest rates, and mounting credit card debt are pushing more and more households and small businesses into financial distress.
If inflation rises again, economic pressure could intensify further.
As ordinary people’s cash flow grows increasingly tight, markets also need to watch for cooling consumer spending and spreading credit risks.
Whether it’s U.S. stocks or $BTC , the impact of the broader economy cannot be ignored. 📉


268
·
--
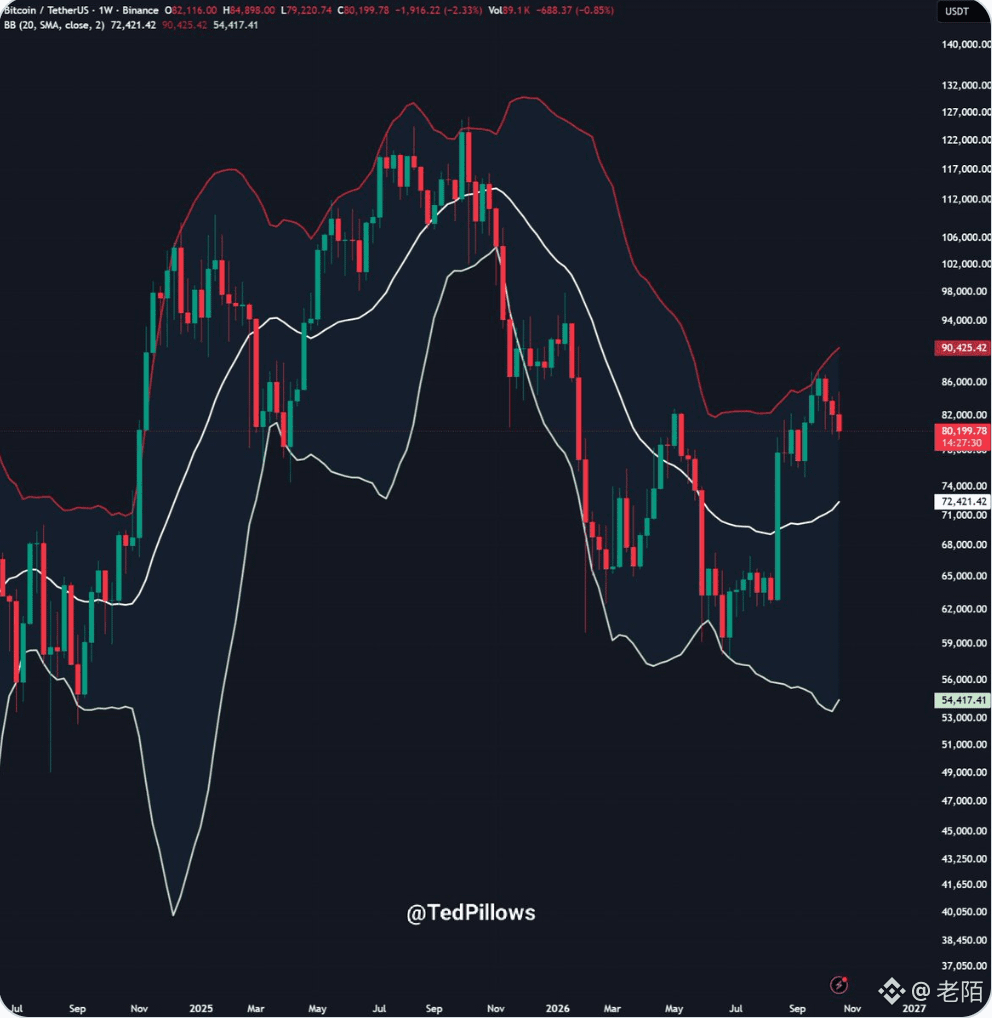
$BTC It looks like the decline may not be over yet.
The current rebound may be driven more by buying from short covering than by sustained inflows of genuine spot capital.
The key level to watch next is $80,000.
If the price decisively breaks below this level on the weekly chart, the market could face a new wave of panic selling.
Don’t be fooled by a brief rebound—true stabilization still needs to be confirmed by trading volume and spot demand.📉
1.1k
·
--
📉 $BTC may be heading toward a retest of the 200-day moving average (200MA) at $74,000!
If the price does reach this level, I’ll be paying close attention to opportunities to position in the crypto market. 👀
But remember, key support doesn’t guarantee an absolute bottom. Scaling in and managing risk are more important than going all in blindly.
If the price does reach this level, I’ll be paying close attention to opportunities to position in the crypto market. 👀
But remember, key support doesn’t guarantee an absolute bottom. Scaling in and managing risk are more important than going all in blindly.
1
262
·
--
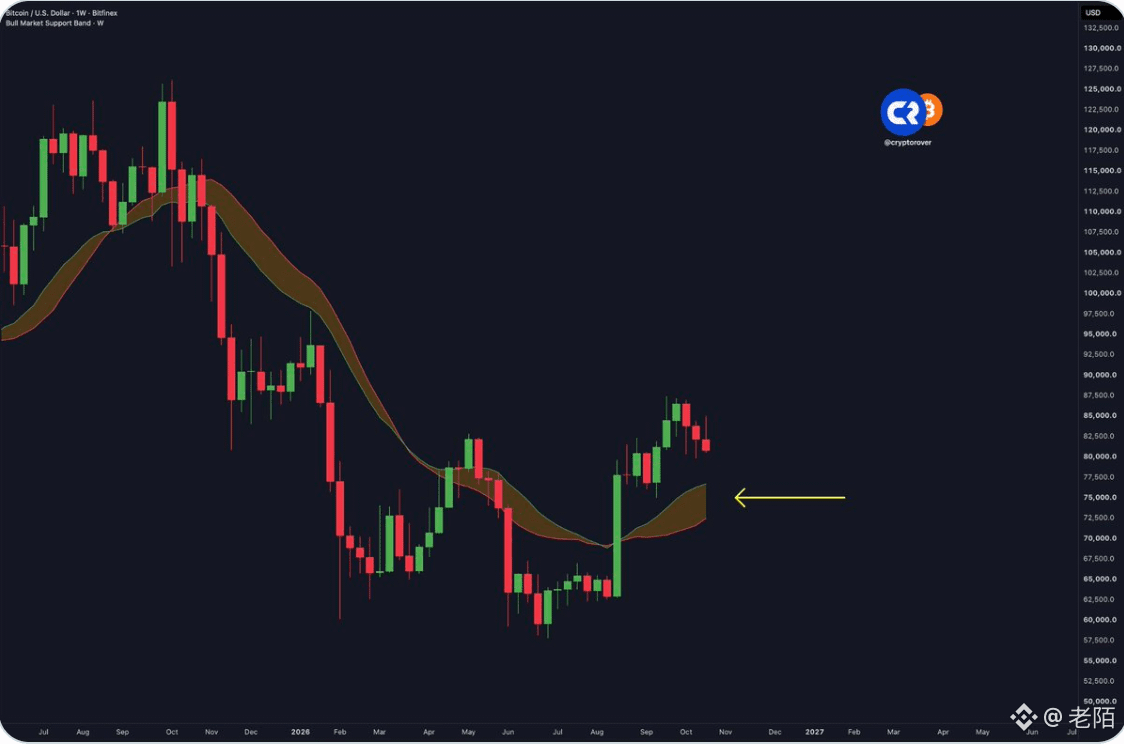
A classic pattern in Bitcoin bull markets:
When $BTC pulls back to the Bull Market Support Band, it’s often worth paying close attention!
This area may offer a good opportunity to build a position, but don’t forget to consider the trend and manage risk—don’t go all-in blindly. 📈
A classic pattern in Bitcoin bull markets:
When $BTC pulls back to the Bull Market Support Band, it’s often worth paying close attention!
This area may offer a good opportunity to build a position, but don’t forget to consider the trend and manage risk—don’t go all-in blindly. 📈
When $BTC pulls back to the Bull Market Support Band, it’s often worth paying close attention!
This area may offer a good opportunity to build a position, but don’t forget to consider the trend and manage risk—don’t go all-in blindly. 📈
193
·
--
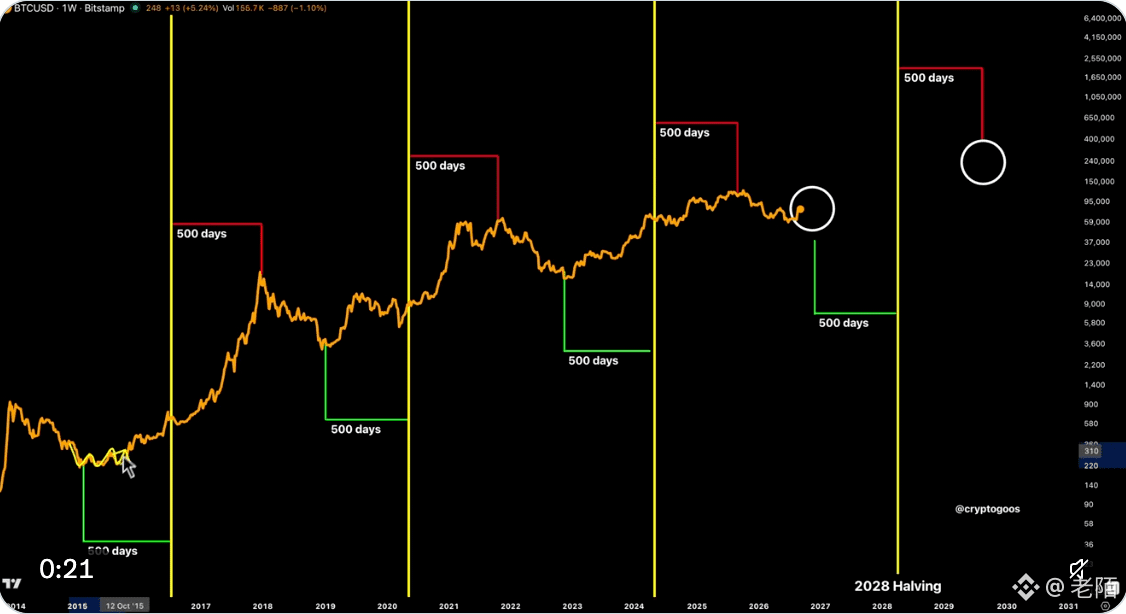
Only 545 days until the next Bitcoin halving! ⏳
A cyclical strategy that has been widely discussed in the market:
📍 500 days before the halving: start building a position $BTC
📍 500 days after the halving: consider taking profits and exiting
Historically, this approach has delivered decent returns, so many investors use the halving cycle as a reference for long-term investing.
But remember: historical patterns are no guarantee of future results. Market conditions, capital flows, and macroeconomic policies can all change how the cycle plays out.
If you’re optimistic about Bitcoin’s long-term value, consider studying the halving cycle—but don’t forget to build your position gradually and manage risk.
1
1
336
·
--
Market sentiment is starting to waver again.
More and more influential voices are growing concerned that the short-term outlook is showing cracks.
Some are choosing to sell, others are questioning their own judgment again, and bearish sentiment in the market is on the rise.
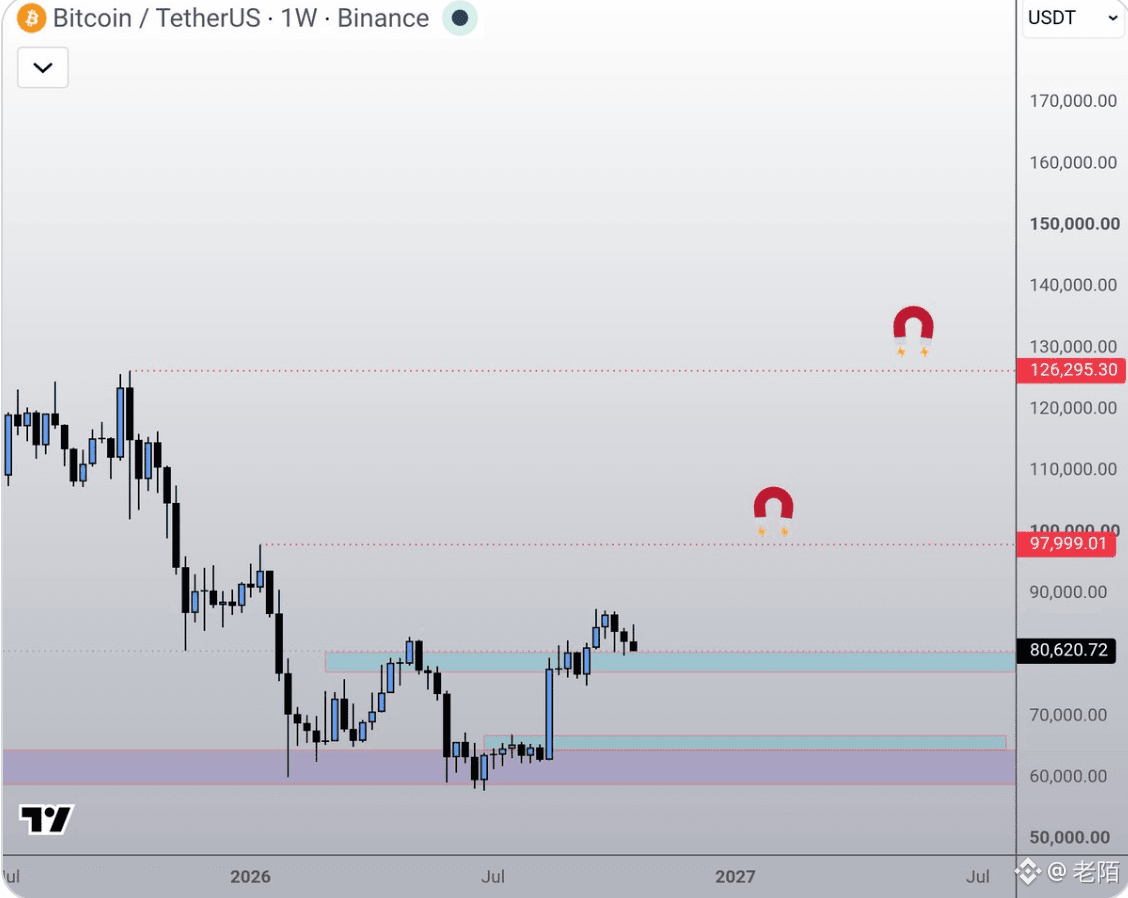
But honestly, short-term fluctuations are normal. $BTC had already risen by around $30,000 in a row, so it’s not surprising to see a pullback along the way.
Looking at the chart structure, I don’t yet see clear signs that the trend has completely broken down:
✅ Key support is still holding
✅ For the first time since the downtrend began, the price has made a higher high
✅ Bitcoin has shown some resilience despite the unstable macro environment
Of course, even a healthy uptrend can retest lower levels and form a higher low. If it gives back 30%–70% of its gains, Bitcoin could return to the $70,000–$80,000 range.
But pullbacks in a bull market don’t necessarily reach the depths everyone expects. So rather than blindly waiting for lower prices, I’m more focused on whether $BTC can continue to hold above $80,000.
The macro environment is indeed unstable, but Bitcoin has risen in these conditions, which can itself be seen as a sign of relative strength.
Short-term volatility doesn’t mean the broader trend is necessarily reversing. $BTC
187
·
--
Everything is unfolding exactly as I expected, believe it or not!
I’m still optimistic that $ETH could see a sharp surge in the near future.
Why? Because once ETH strengthens, market funds may start rotating into altcoins.
ETH’s strength is often an important signal when looking for opportunities in altcoin season.
What’s really worth watching isn’t just how much ETH rises, but whether this rally can lift the entire altcoin market.
If I spot any new trading opportunities, I’ll share them right away.
Opportunities don’t wait forever. Being prepared in advance is more important than chasing prices after a rally gets underway.$BTC
1
326
·
--
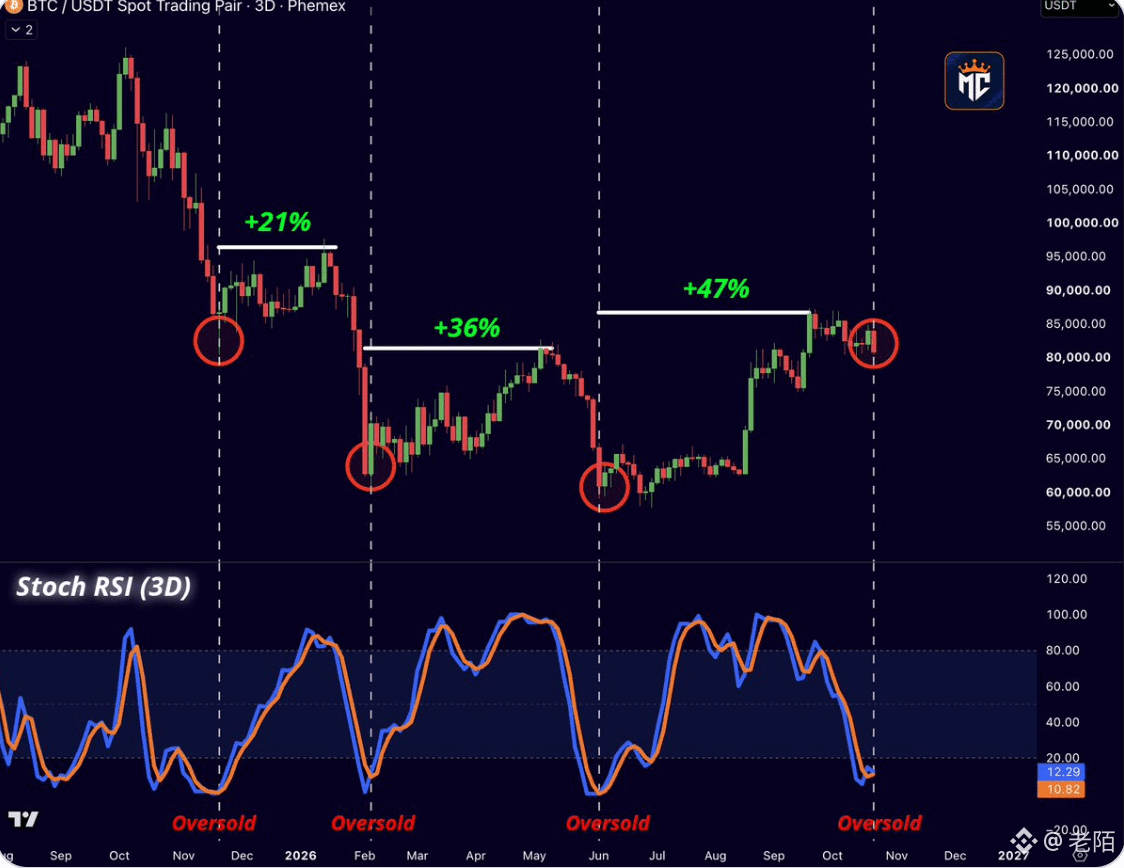
🚨 $BTC is flashing a bullish signal!
Bitcoin’s 3-day Stoch RSI (Stochastic Relative Strength Index) has formed a bullish crossover in oversold territory.
Historically, the three similar signals marked on the chart were followed by gains of 21%, 36%, and 47%, respectively.
If this crossover is confirmed and holds, BTC could be gearing up for another strong rebound.
History doesn’t guarantee a repeat, but this signal is worth keeping a close eye on!
2
1
939
·
--
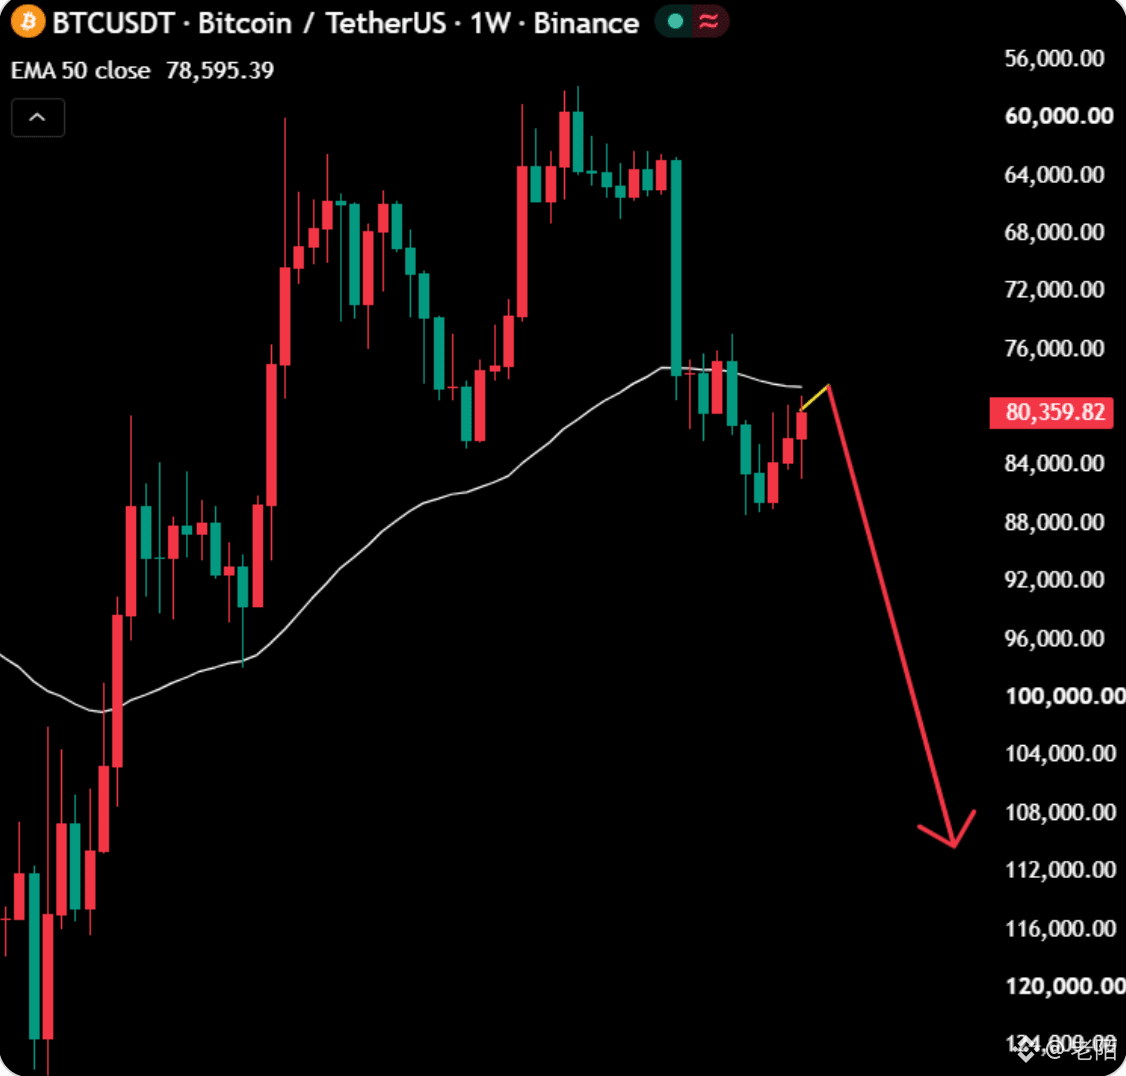
⚠️ $BTC may be brewing one last rebound!
But don't get optimistic just yet. If this is merely a bull trap, the market could plunge even more sharply after a brief spike.
The real danger isn't missing out on a rally—it's mistaking a rebound for the return of a bull market.
Keep a close eye on trading volume and key support levels!
But don't get optimistic just yet. If this is merely a bull trap, the market could plunge even more sharply after a brief spike.
The real danger isn't missing out on a rally—it's mistaking a rebound for the return of a bull market.
Keep a close eye on trading volume and key support levels!
3
2.7k
·
--
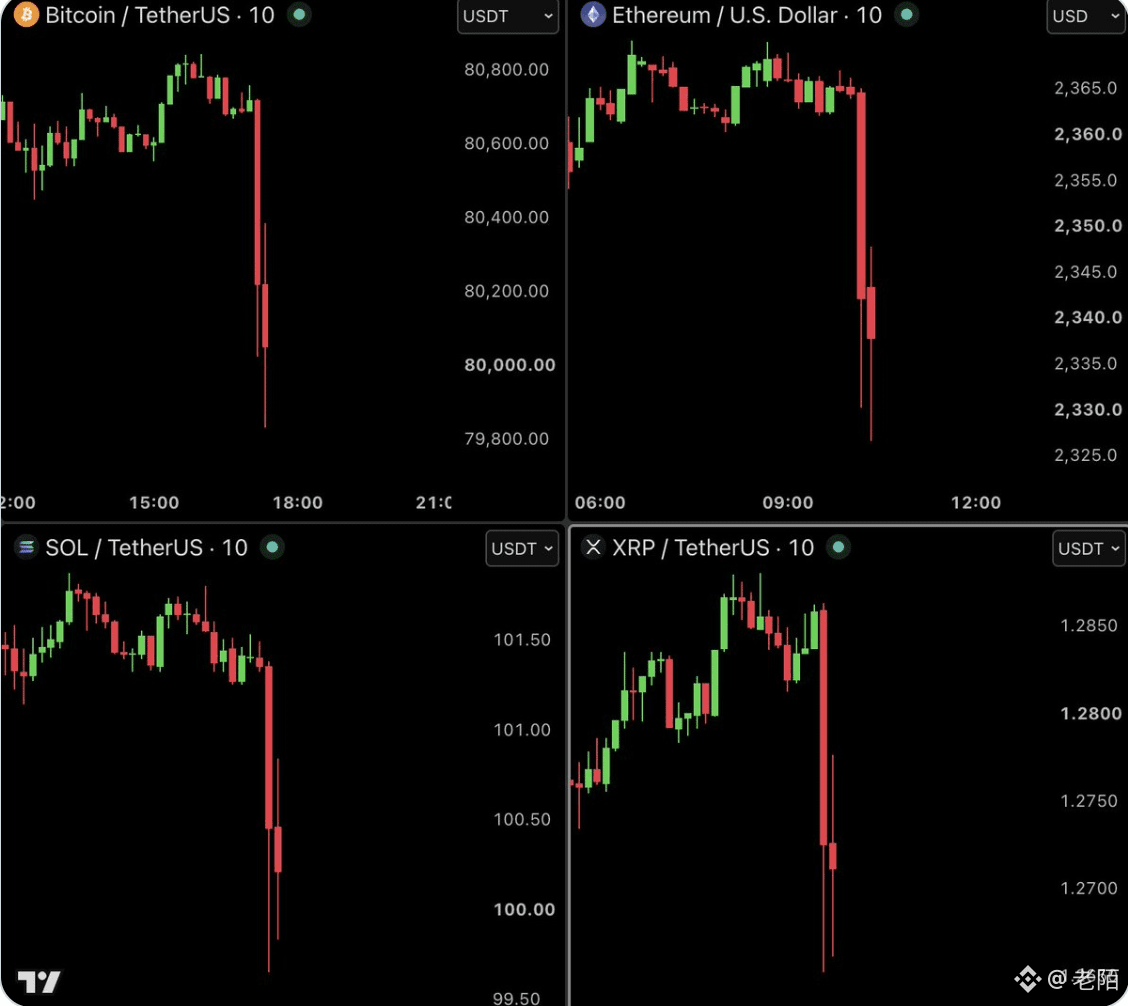
🚨 Sudden, sharp volatility in the crypto market!
$BTC fell below $80,000
$ETH fell below $2,350
$SOL fell below $100
$XRP fell below $1.30
In just 15 minutes, around $220 million in long positions were liquidated! 💥
The drop came as reports emerged that the U.S. military was ready to attack Iran, with geopolitical risks once again weighing on market sentiment.
October was supposed to bring Uptober, but the market has been brutal—it’s turned into Fucktober!
But remember: sharp volatility triggered by breaking news doesn’t mean the trend is set. Don’t rush to buy the dip, and be especially wary of cascading liquidations caused by high leverage.
Whether $BTC can reclaim $80K is definitely worth watching!
1
849
·
--
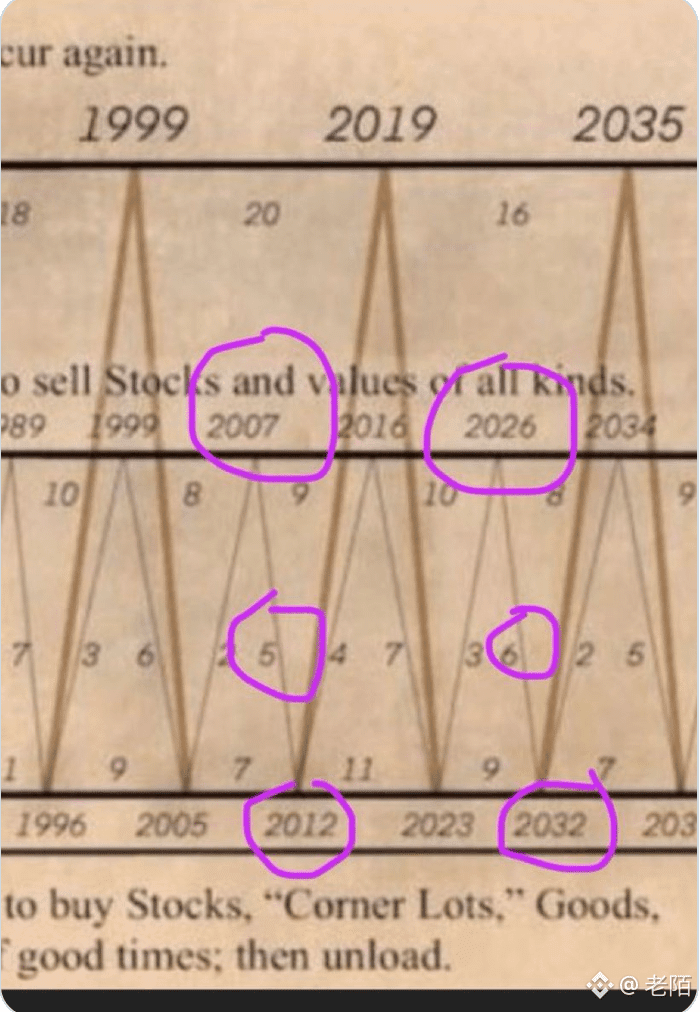
🚨 A historic market crash may be brewing…
But don’t panic just yet. What really matters isn’t guessing when a crash will happen—it’s being prepared in advance.
If the market takes a sharp downturn, it could actually give long-term investors a chance to gradually build positions in quality assets.
Cash reserves, position sizing, and patience will all become especially important.
Whether you’re investing in U.S. stocks or $BTC , don’t wait until the market plunges to start making a plan.
Real opportunities often go to those who are prepared.
3
7
13.6k
·
--
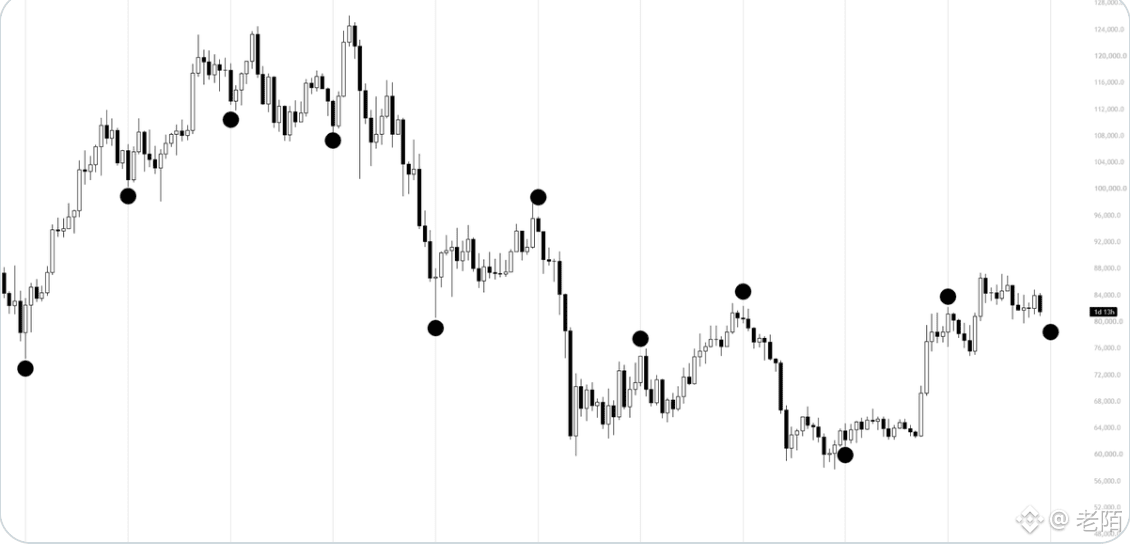
🚨 $BTC may be approaching an important cycle turning point!
One trader points out that this cyclical pattern has appeared 11 times in the price action over the past 600-plus days, and each turning point has been accompanied by a move opposite to what most of the market expected.
Bearish sentiment is still building.
If the pattern repeats this time, Bitcoin could instead rebound, potentially by at least 5%.
Of course, historical patterns don’t mean the future will necessarily repeat, and they can’t guarantee that prices will rise this time.
But when everyone is bearish, I pay special attention to whether the market moves in the opposite direction.
Over the next few days, watch closely to see whether $BTC can defy the current pessimism! 📈
1.2k
Log in to explore more content
Join global crypto users on Binance Square
⚡️ Get latest and useful information about crypto.
💬 Trusted by the world’s largest crypto exchange.
👍 Discover real insights from verified creators.
Email / Phone number