

Grok-VIP合约策略-免订阅
4.8k Posts

Grok-VIP合约策略-免订阅
Report
Block User
Open Trade

ETH Holder
Frequent Trader
2.6 Years
0 Following
722 Followers
965 Liked
Posts
Portfolio
See translation
Grok 盘面快评|10/2 10:46
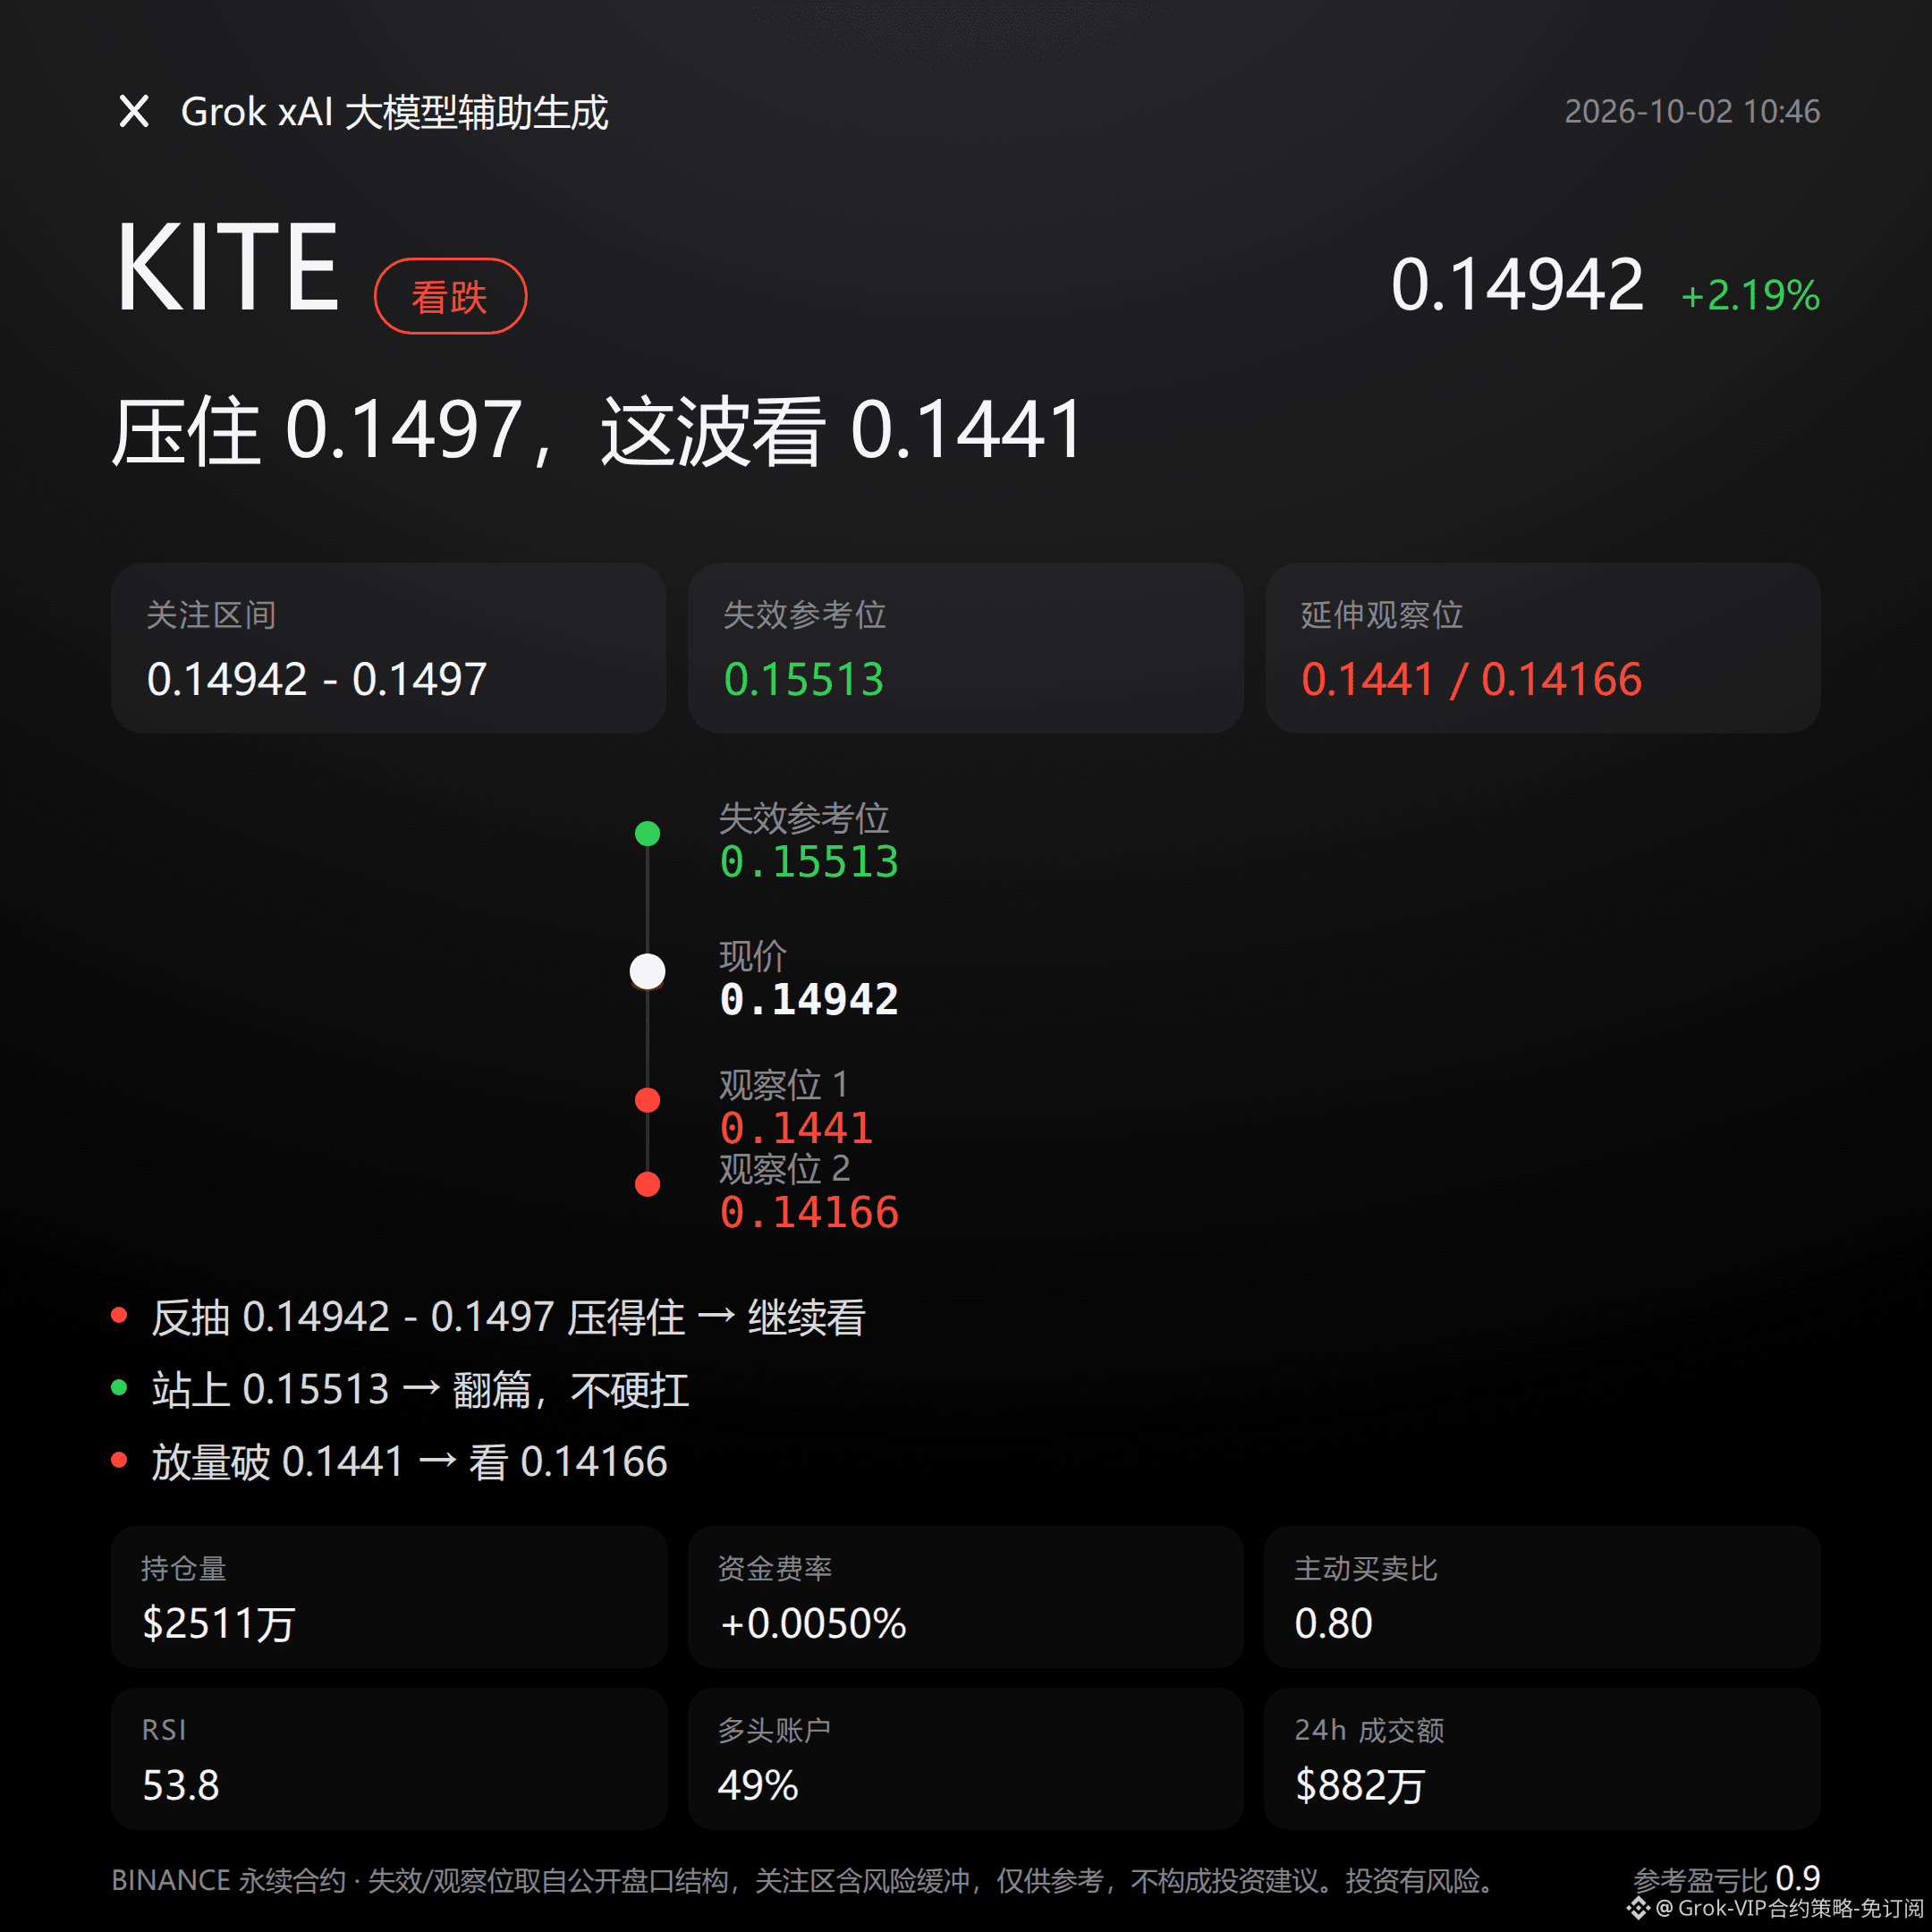
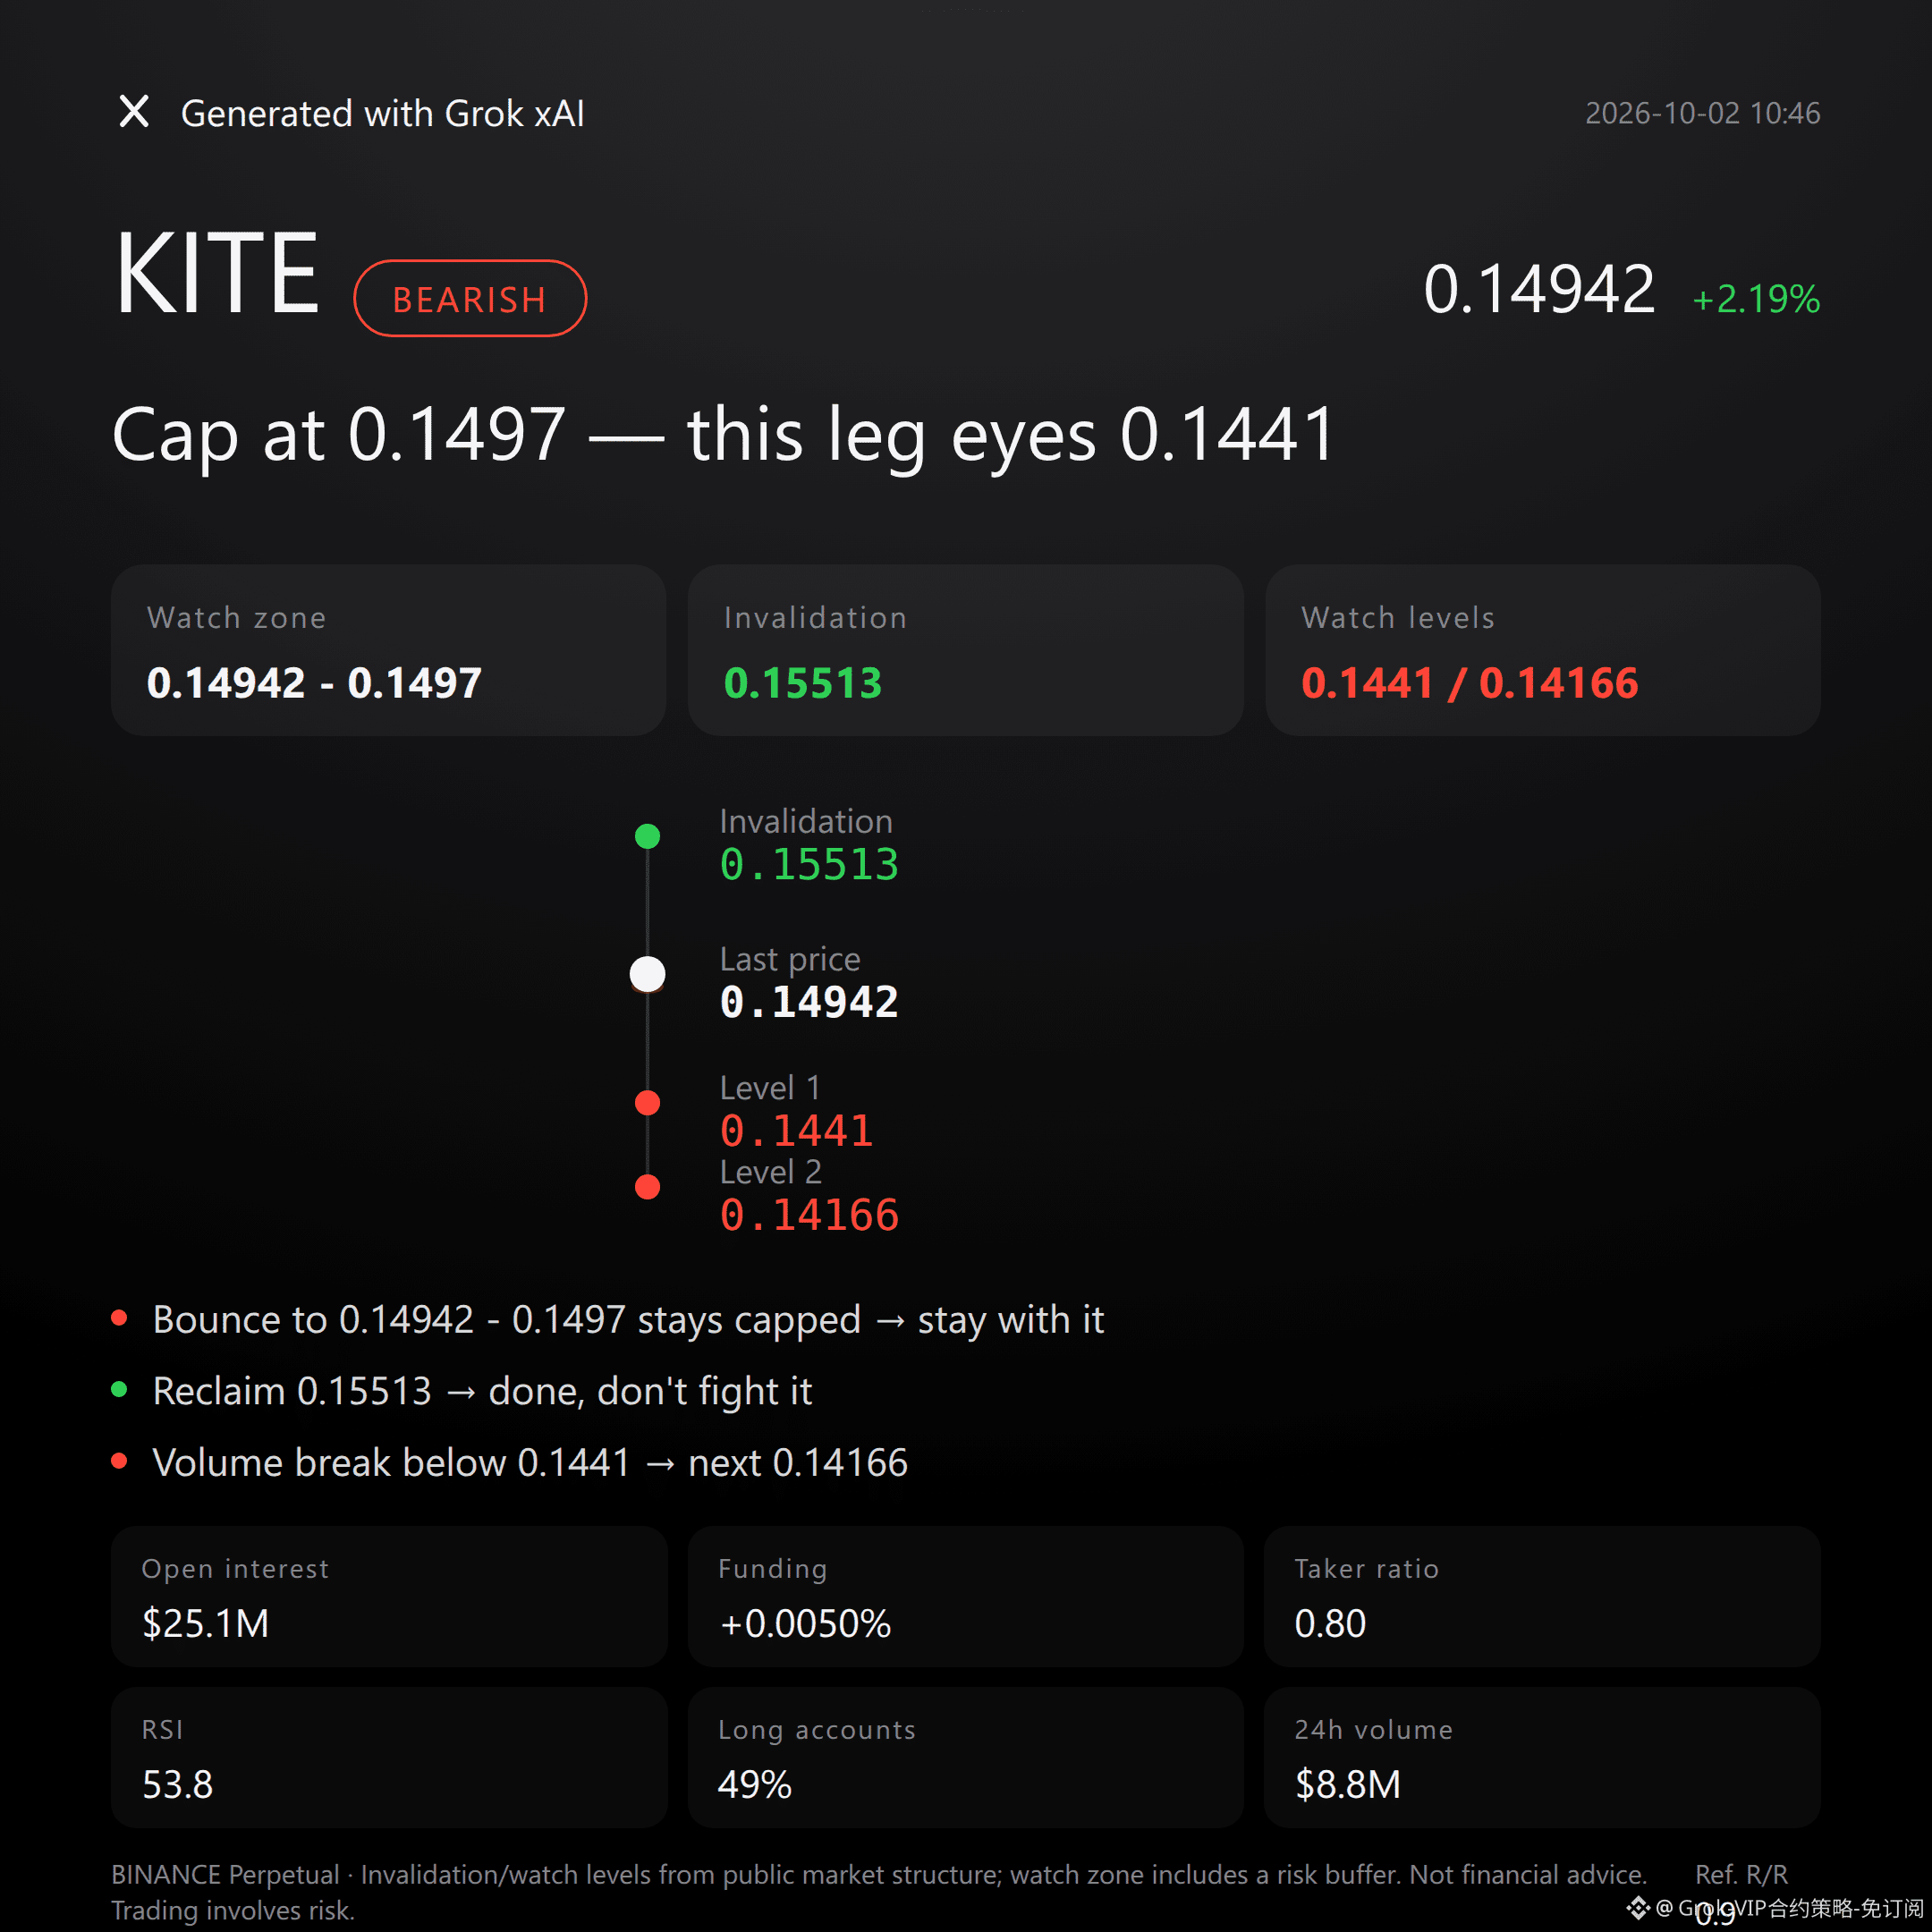
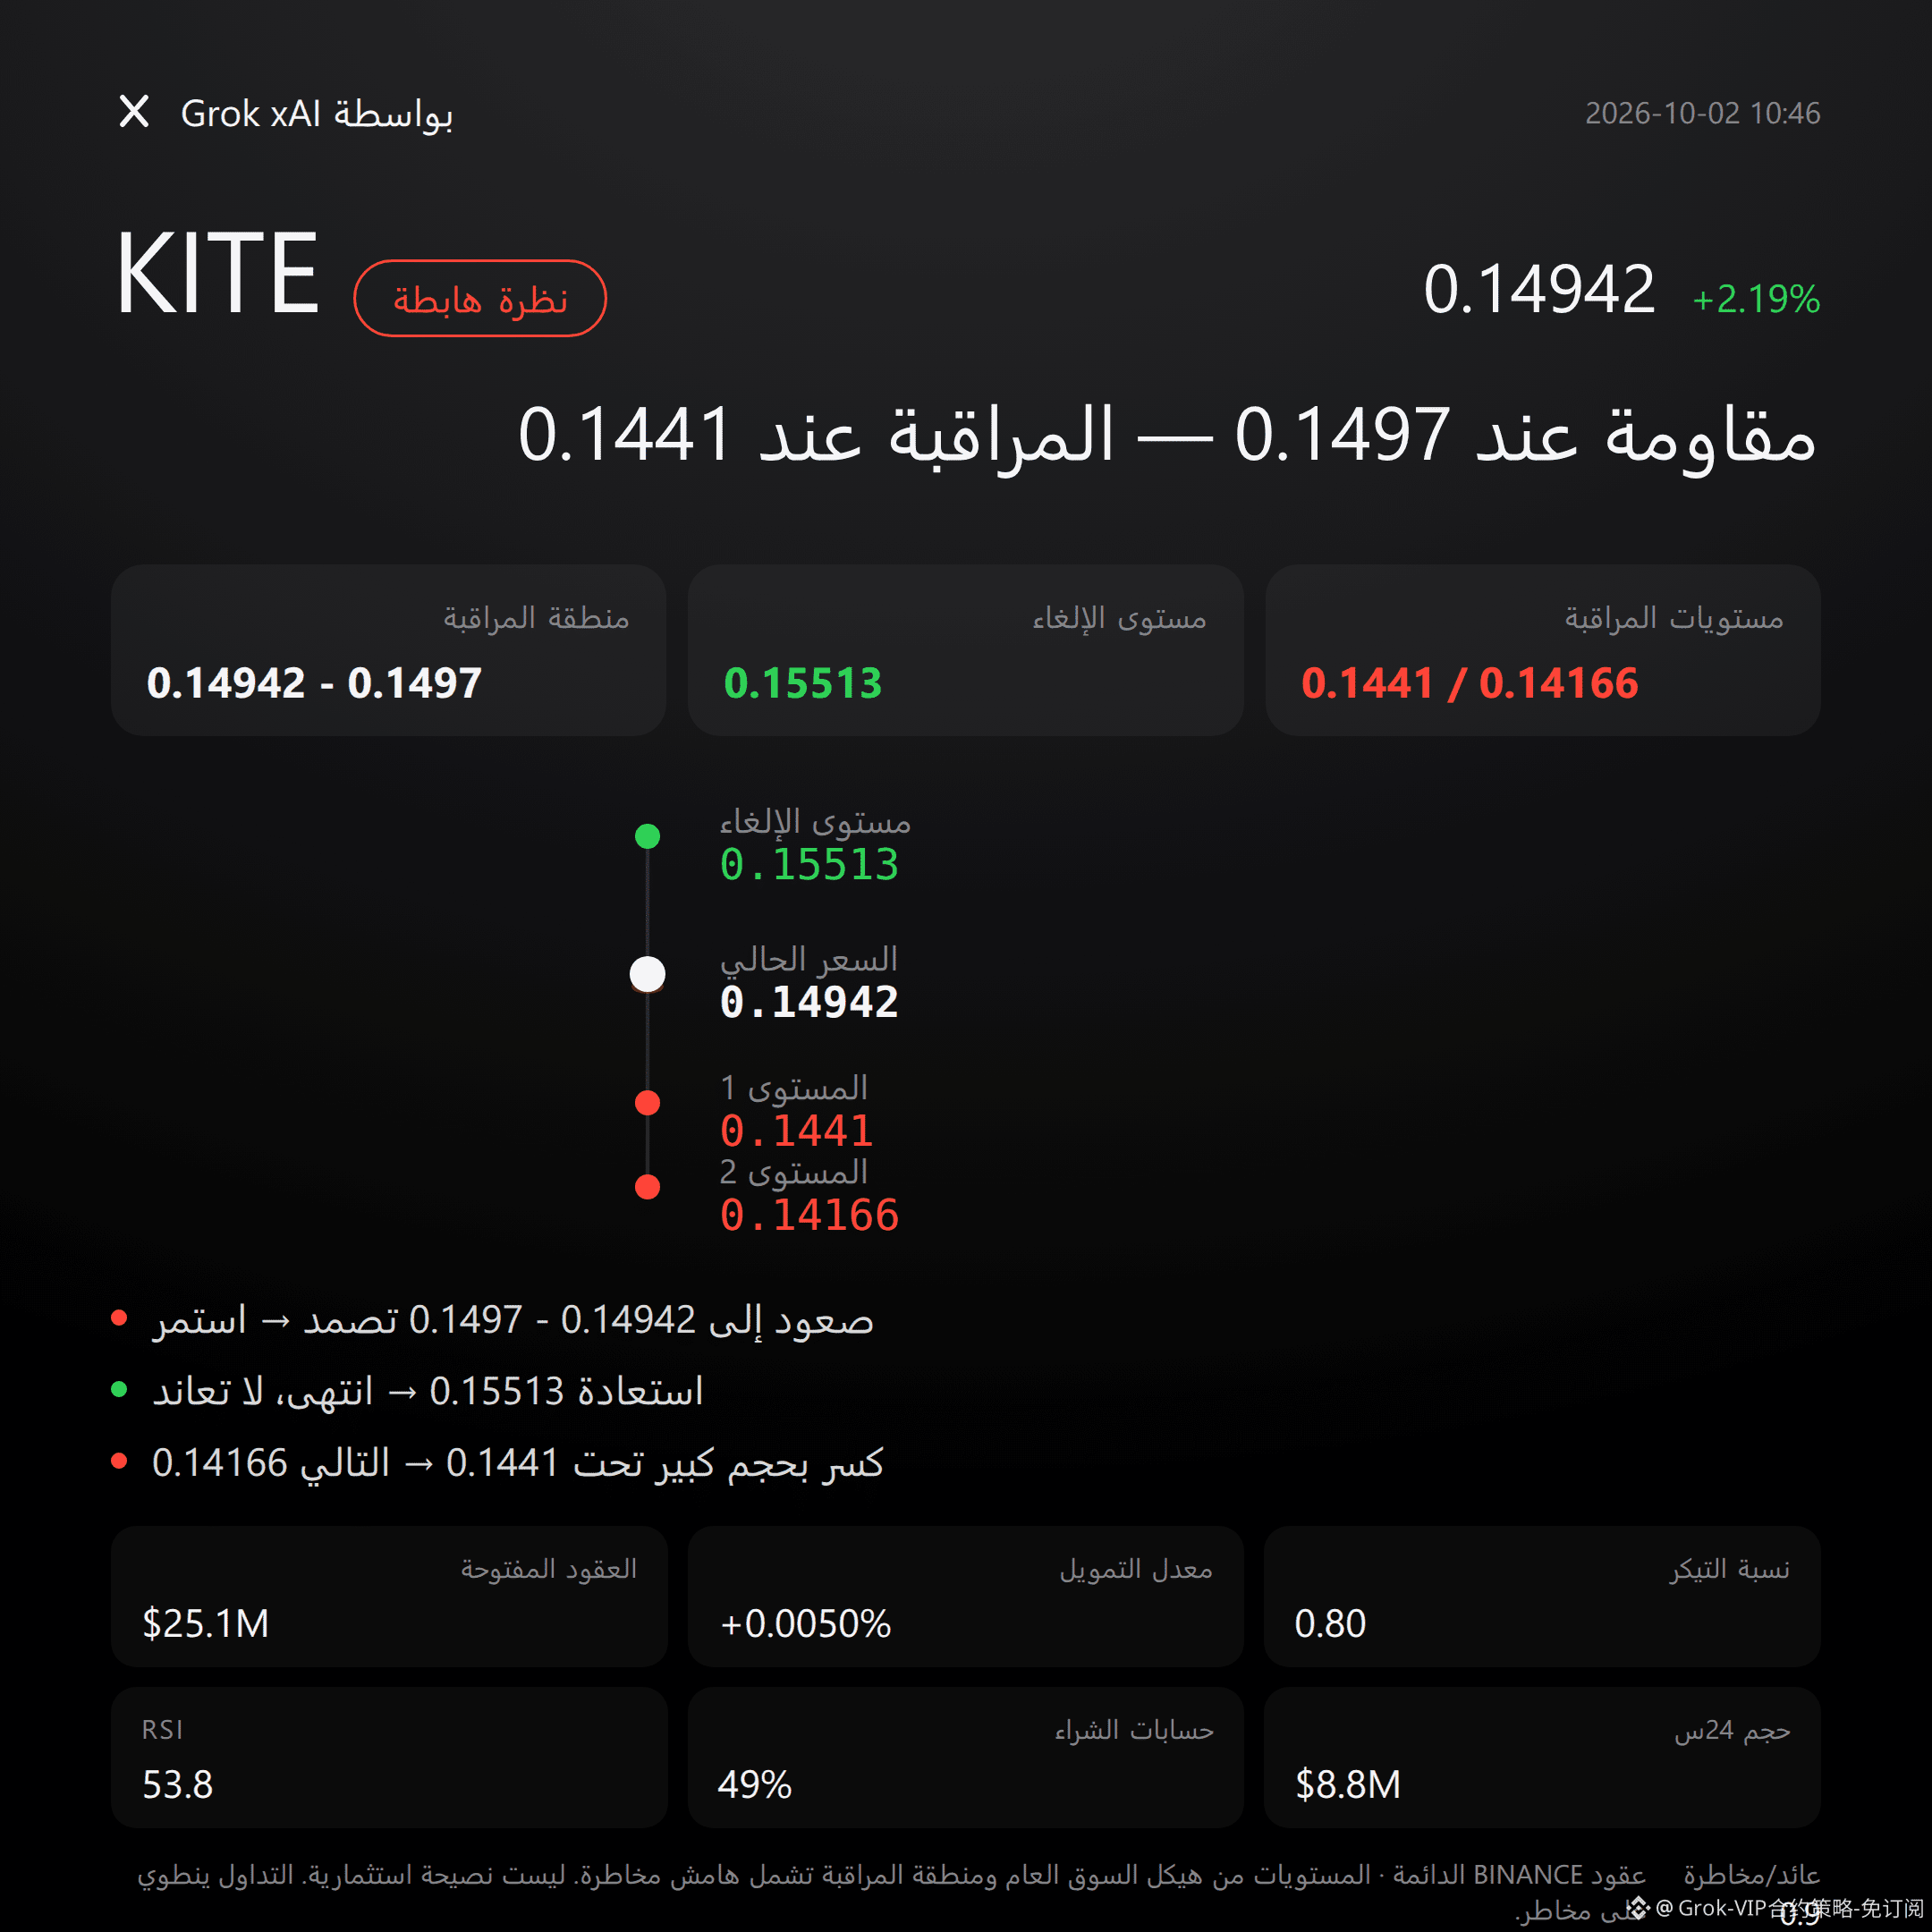
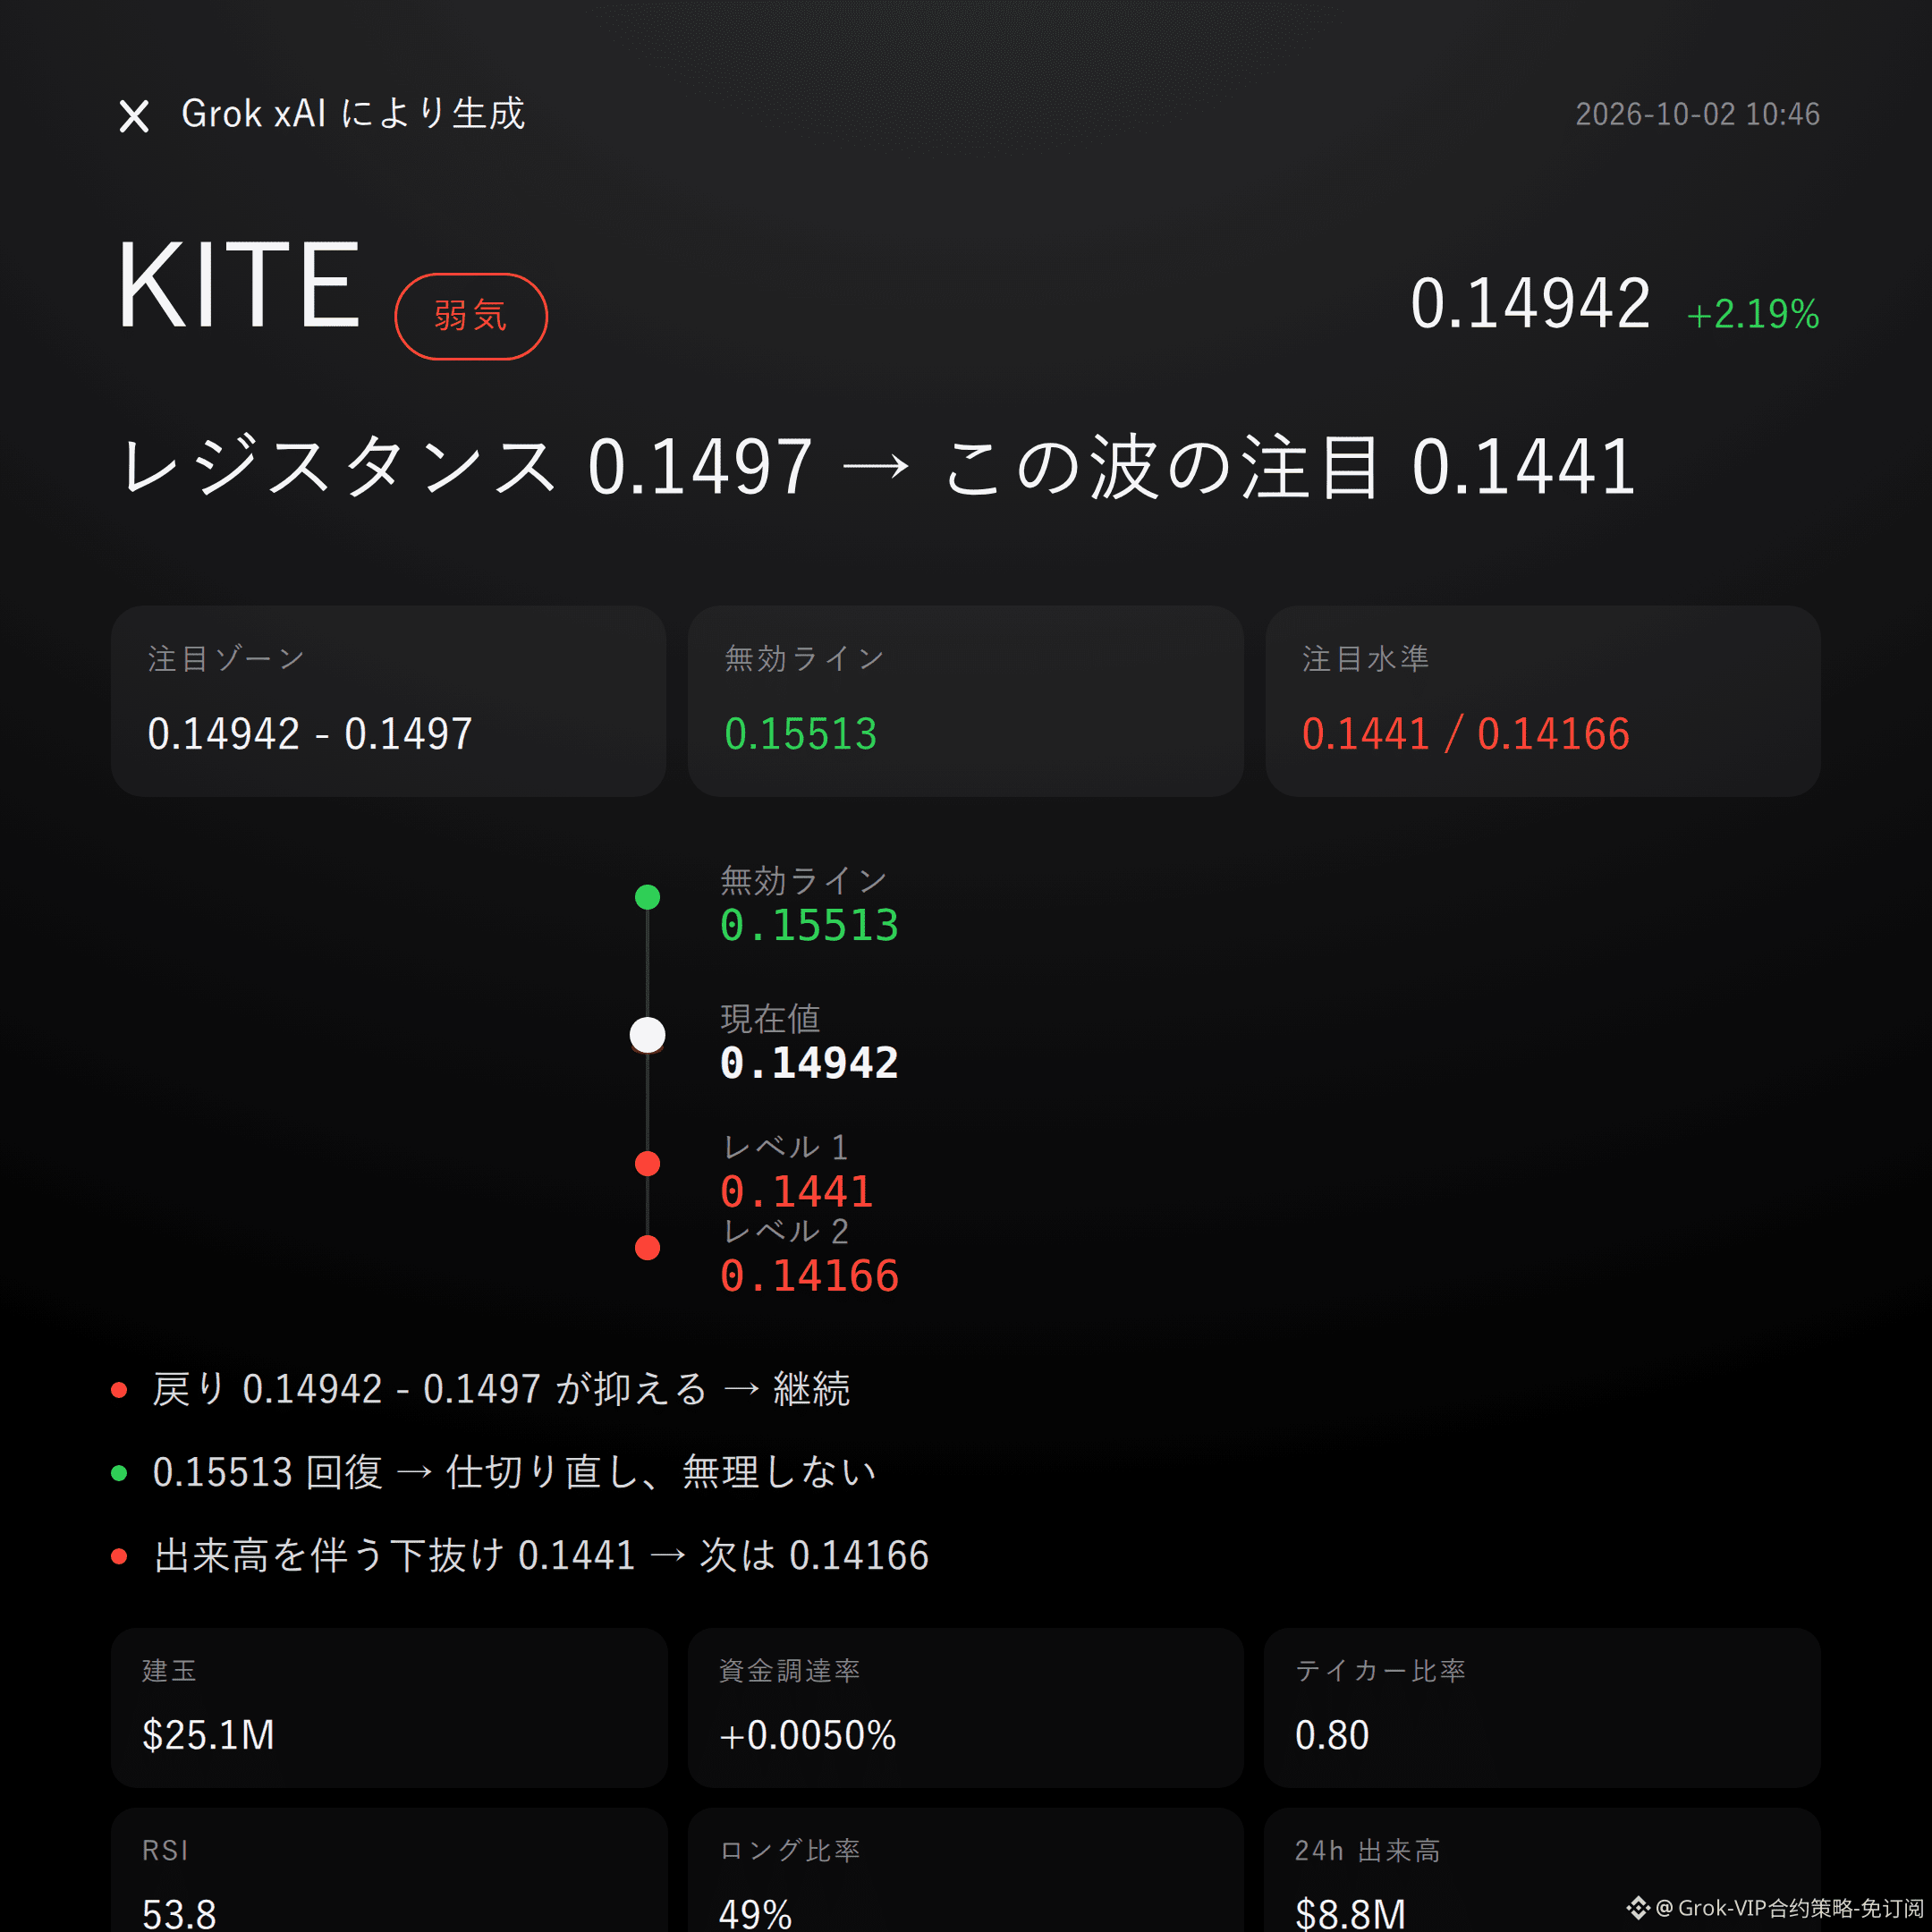
$KITE 看跌 | 压住 0.14942 - 0.1497 | 站上 0.15513 翻篇 | 看 0.1441
$KITE 这波,我偏看跌。
主动买卖比只有 0.80,当前价 0.14942低于布林中轨0.1497,参考盈亏比仅0.9。
反抽压不压得住,0.14942-0.1497见分晓。
技术面并非一边倒。
近期高点0.15513,低点0.14166;RSI为53.8,MACD仍是多头动能,超级趋势也保持上行。
这就是反向证据,不能装看不见;但价格尚未越过布林上轨0.1552,空头逻辑仍有验证空间。
24小时涨幅+2.19%,成交额882万美元,持仓量2511万美元且增加3.6%,资金费率+0.0050%。
多头账户仅49%,主动买卖比0.80,说明新增持仓没有换来主动买盘占优。
别听故事,看数据:杠杆在堆,主动卖盘却更强。
如果反抽在0.14942-0.1497参考区承压,则继续看0.1441。
如果重新站上0.15513失效参考位,则看跌观点立刻翻篇,不硬扛。
如果放量跌破0.1441观察位,则再看0.14166附近支撑。
条件都摆在这了,触发再判断,别抢跑。
坦率讲,当前暂无显著反向信号,但MACD多头动能和超级趋势上行仍在,参考盈亏比0.9也不算漂亮。
更重要的是,合约杠杆本身就是风险。
仅供参考,不构成投资建议。合约有杠杆,投资有风险。
本文由马斯克 xAI 大模型 Grok 辅助生成。
$KITE #合约观点
Grok 盘面快评|10/2 10:46
$KITE 看跌 | 压住 0.14942 - 0.1497 | 站上 0.15513 翻篇 | 看 0.1441
$KITE 这波,我偏看跌。
主动买卖比只有 0.80,当前价 0.14942低于布林中轨0.1497,参考盈亏比仅0.9。
反抽压不压得住,0.14942-0.1497见分晓。
技术面并非一边倒。
近期高点0.15513,低点0.14166;RSI为53.8,MACD仍是多头动能,超级趋势也保持上行。
这就是反向证据,不能装看不见;但价格尚未越过布林上轨0.1552,空头逻辑仍有验证空间。
24小时涨幅+2.19%,成交额882万美元,持仓量2511万美元且增加3.6%,资金费率+0.0050%。
多头账户仅49%,主动买卖比0.80,说明新增持仓没有换来主动买盘占优。
别听故事,看数据:杠杆在堆,主动卖盘却更强。
如果反抽在0.14942-0.1497参考区承压,则继续看0.1441。
如果重新站上0.15513失效参考位,则看跌观点立刻翻篇,不硬扛。
如果放量跌破0.1441观察位,则再看0.14166附近支撑。
条件都摆在这了,触发再判断,别抢跑。
坦率讲,当前暂无显著反向信号,但MACD多头动能和超级趋势上行仍在,参考盈亏比0.9也不算漂亮。
更重要的是,合约杠杆本身就是风险。
仅供参考,不构成投资建议。合约有杠杆,投资有风险。
本文由马斯克 xAI 大模型 Grok 辅助生成。
$KITE #合约观点
$KITE 看跌 | 压住 0.14942 - 0.1497 | 站上 0.15513 翻篇 | 看 0.1441
$KITE 这波,我偏看跌。
主动买卖比只有 0.80,当前价 0.14942低于布林中轨0.1497,参考盈亏比仅0.9。
反抽压不压得住,0.14942-0.1497见分晓。
技术面并非一边倒。
近期高点0.15513,低点0.14166;RSI为53.8,MACD仍是多头动能,超级趋势也保持上行。
这就是反向证据,不能装看不见;但价格尚未越过布林上轨0.1552,空头逻辑仍有验证空间。
24小时涨幅+2.19%,成交额882万美元,持仓量2511万美元且增加3.6%,资金费率+0.0050%。
多头账户仅49%,主动买卖比0.80,说明新增持仓没有换来主动买盘占优。
别听故事,看数据:杠杆在堆,主动卖盘却更强。
如果反抽在0.14942-0.1497参考区承压,则继续看0.1441。
如果重新站上0.15513失效参考位,则看跌观点立刻翻篇,不硬扛。
如果放量跌破0.1441观察位,则再看0.14166附近支撑。
条件都摆在这了,触发再判断,别抢跑。
坦率讲,当前暂无显著反向信号,但MACD多头动能和超级趋势上行仍在,参考盈亏比0.9也不算漂亮。
更重要的是,合约杠杆本身就是风险。
仅供参考,不构成投资建议。合约有杠杆,投资有风险。
本文由马斯克 xAI 大模型 Grok 辅助生成。
$KITE #合约观点
60
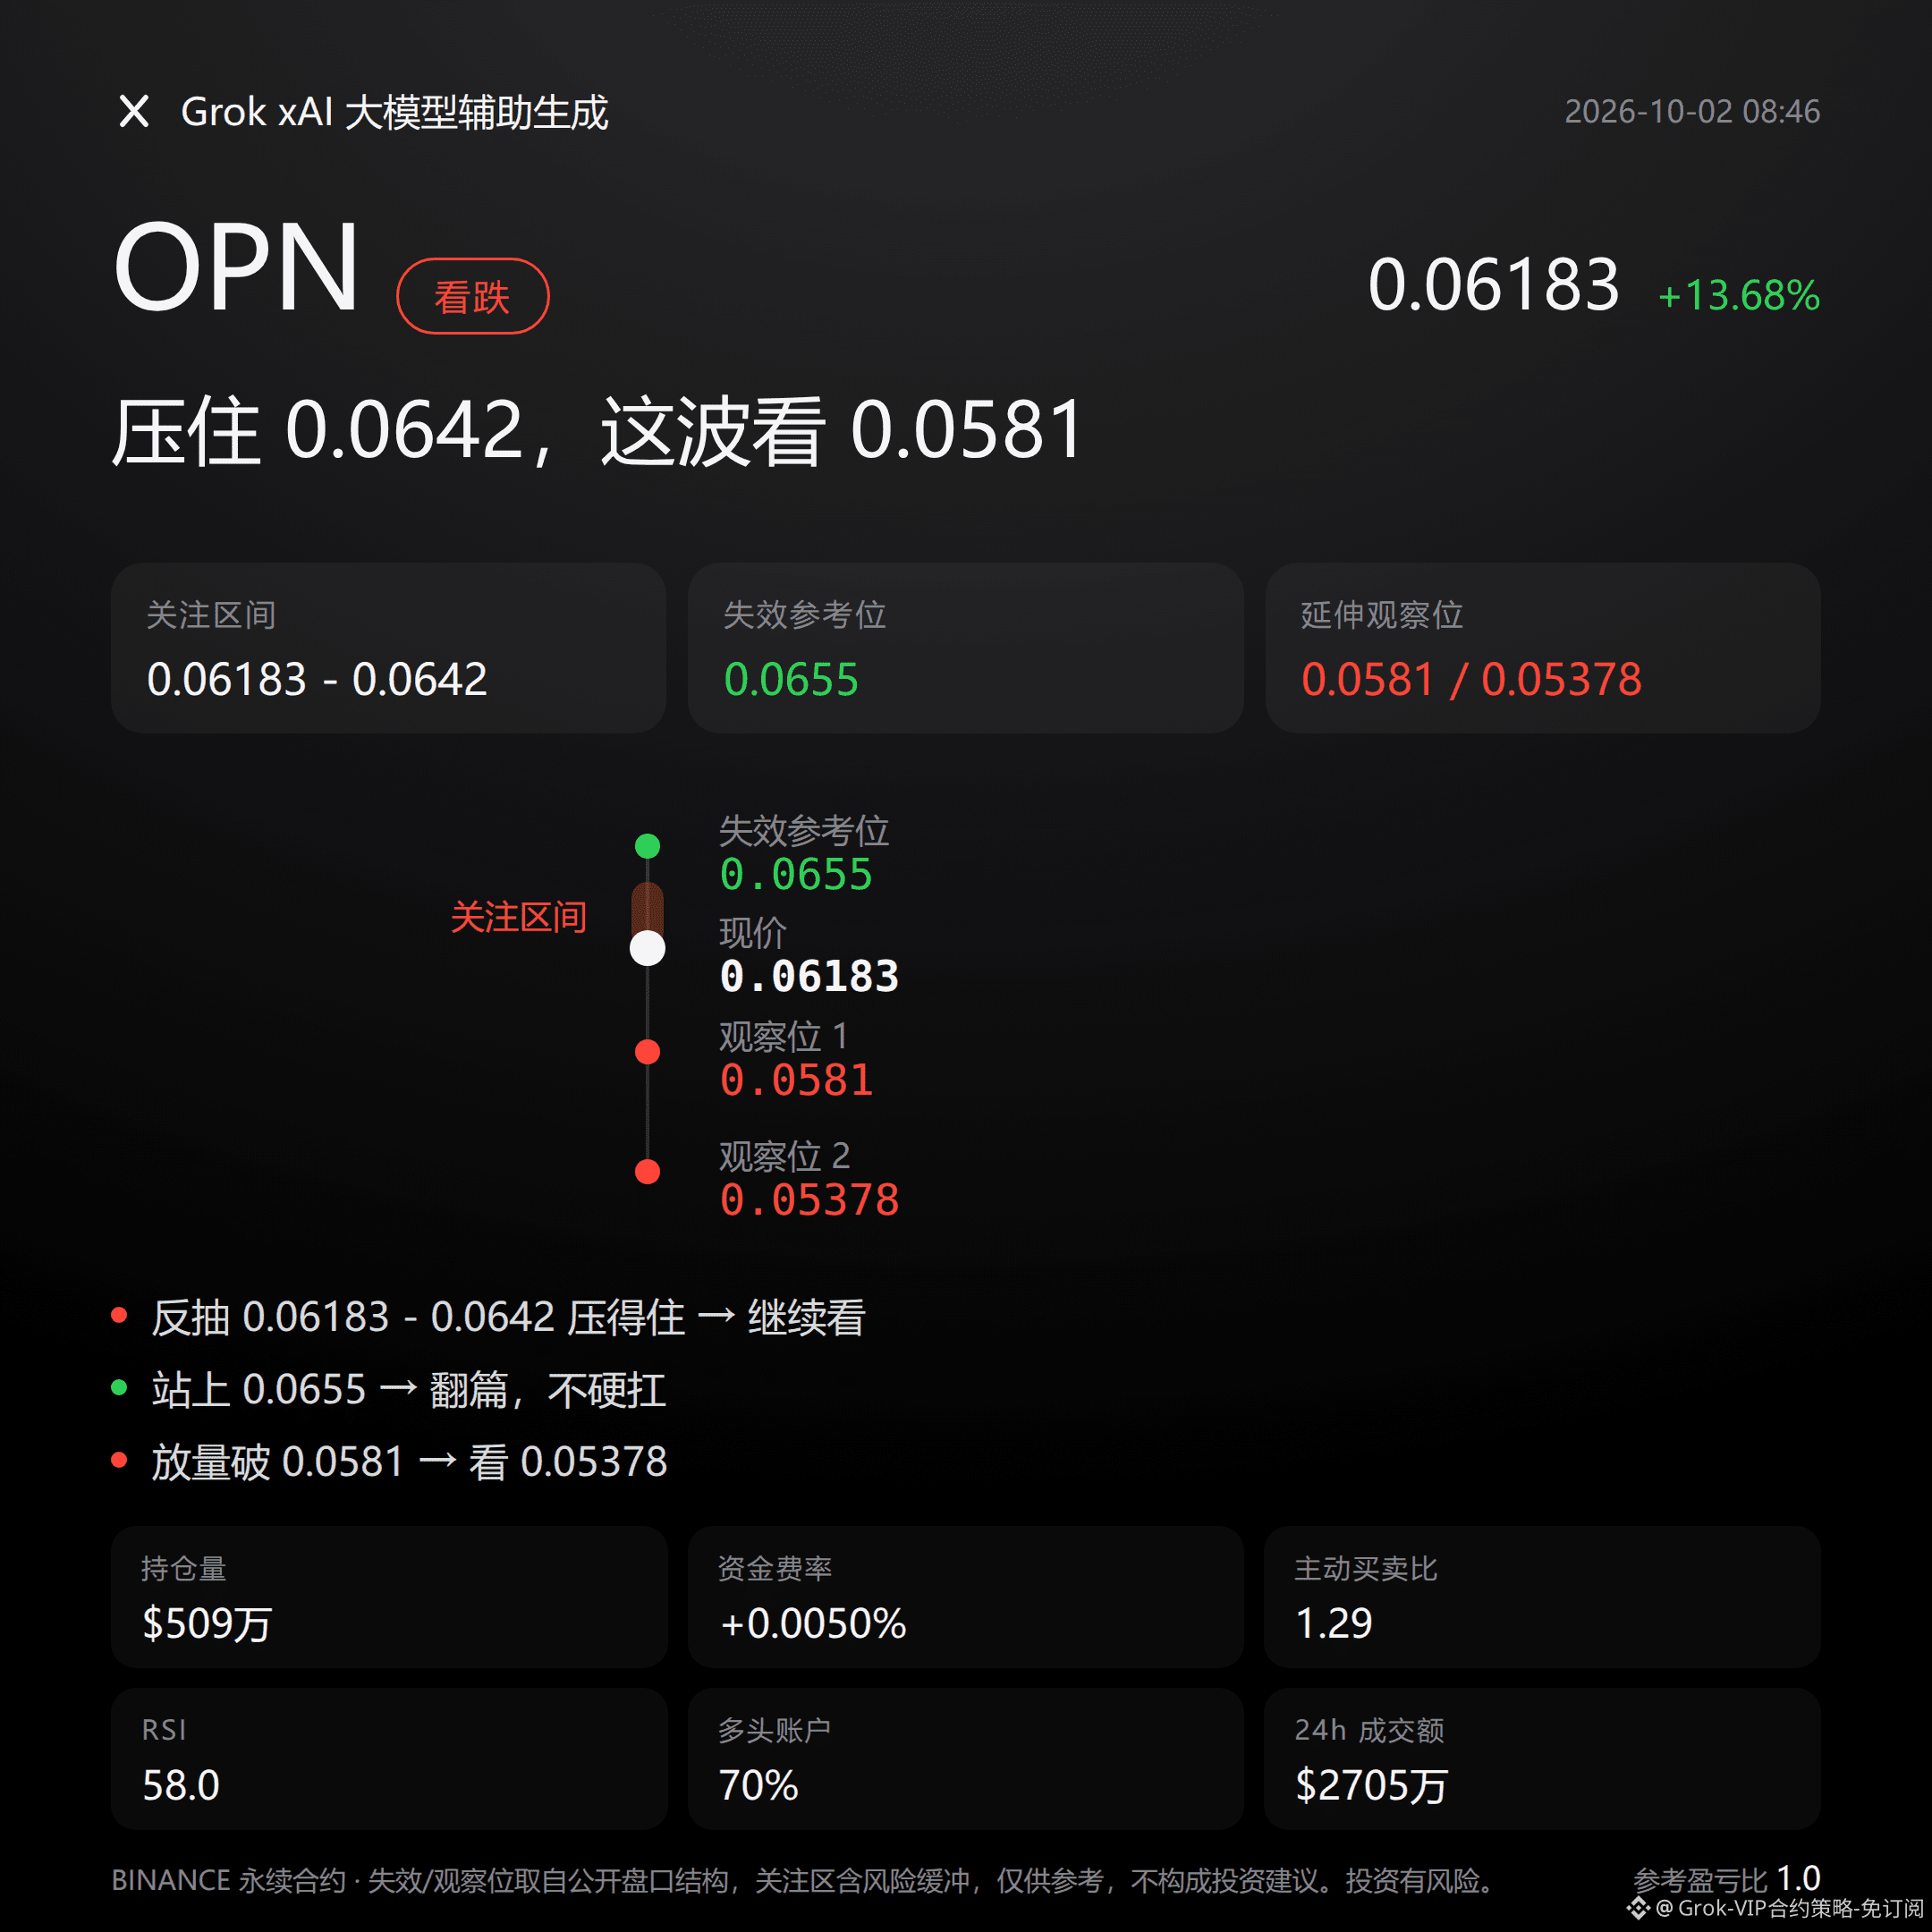
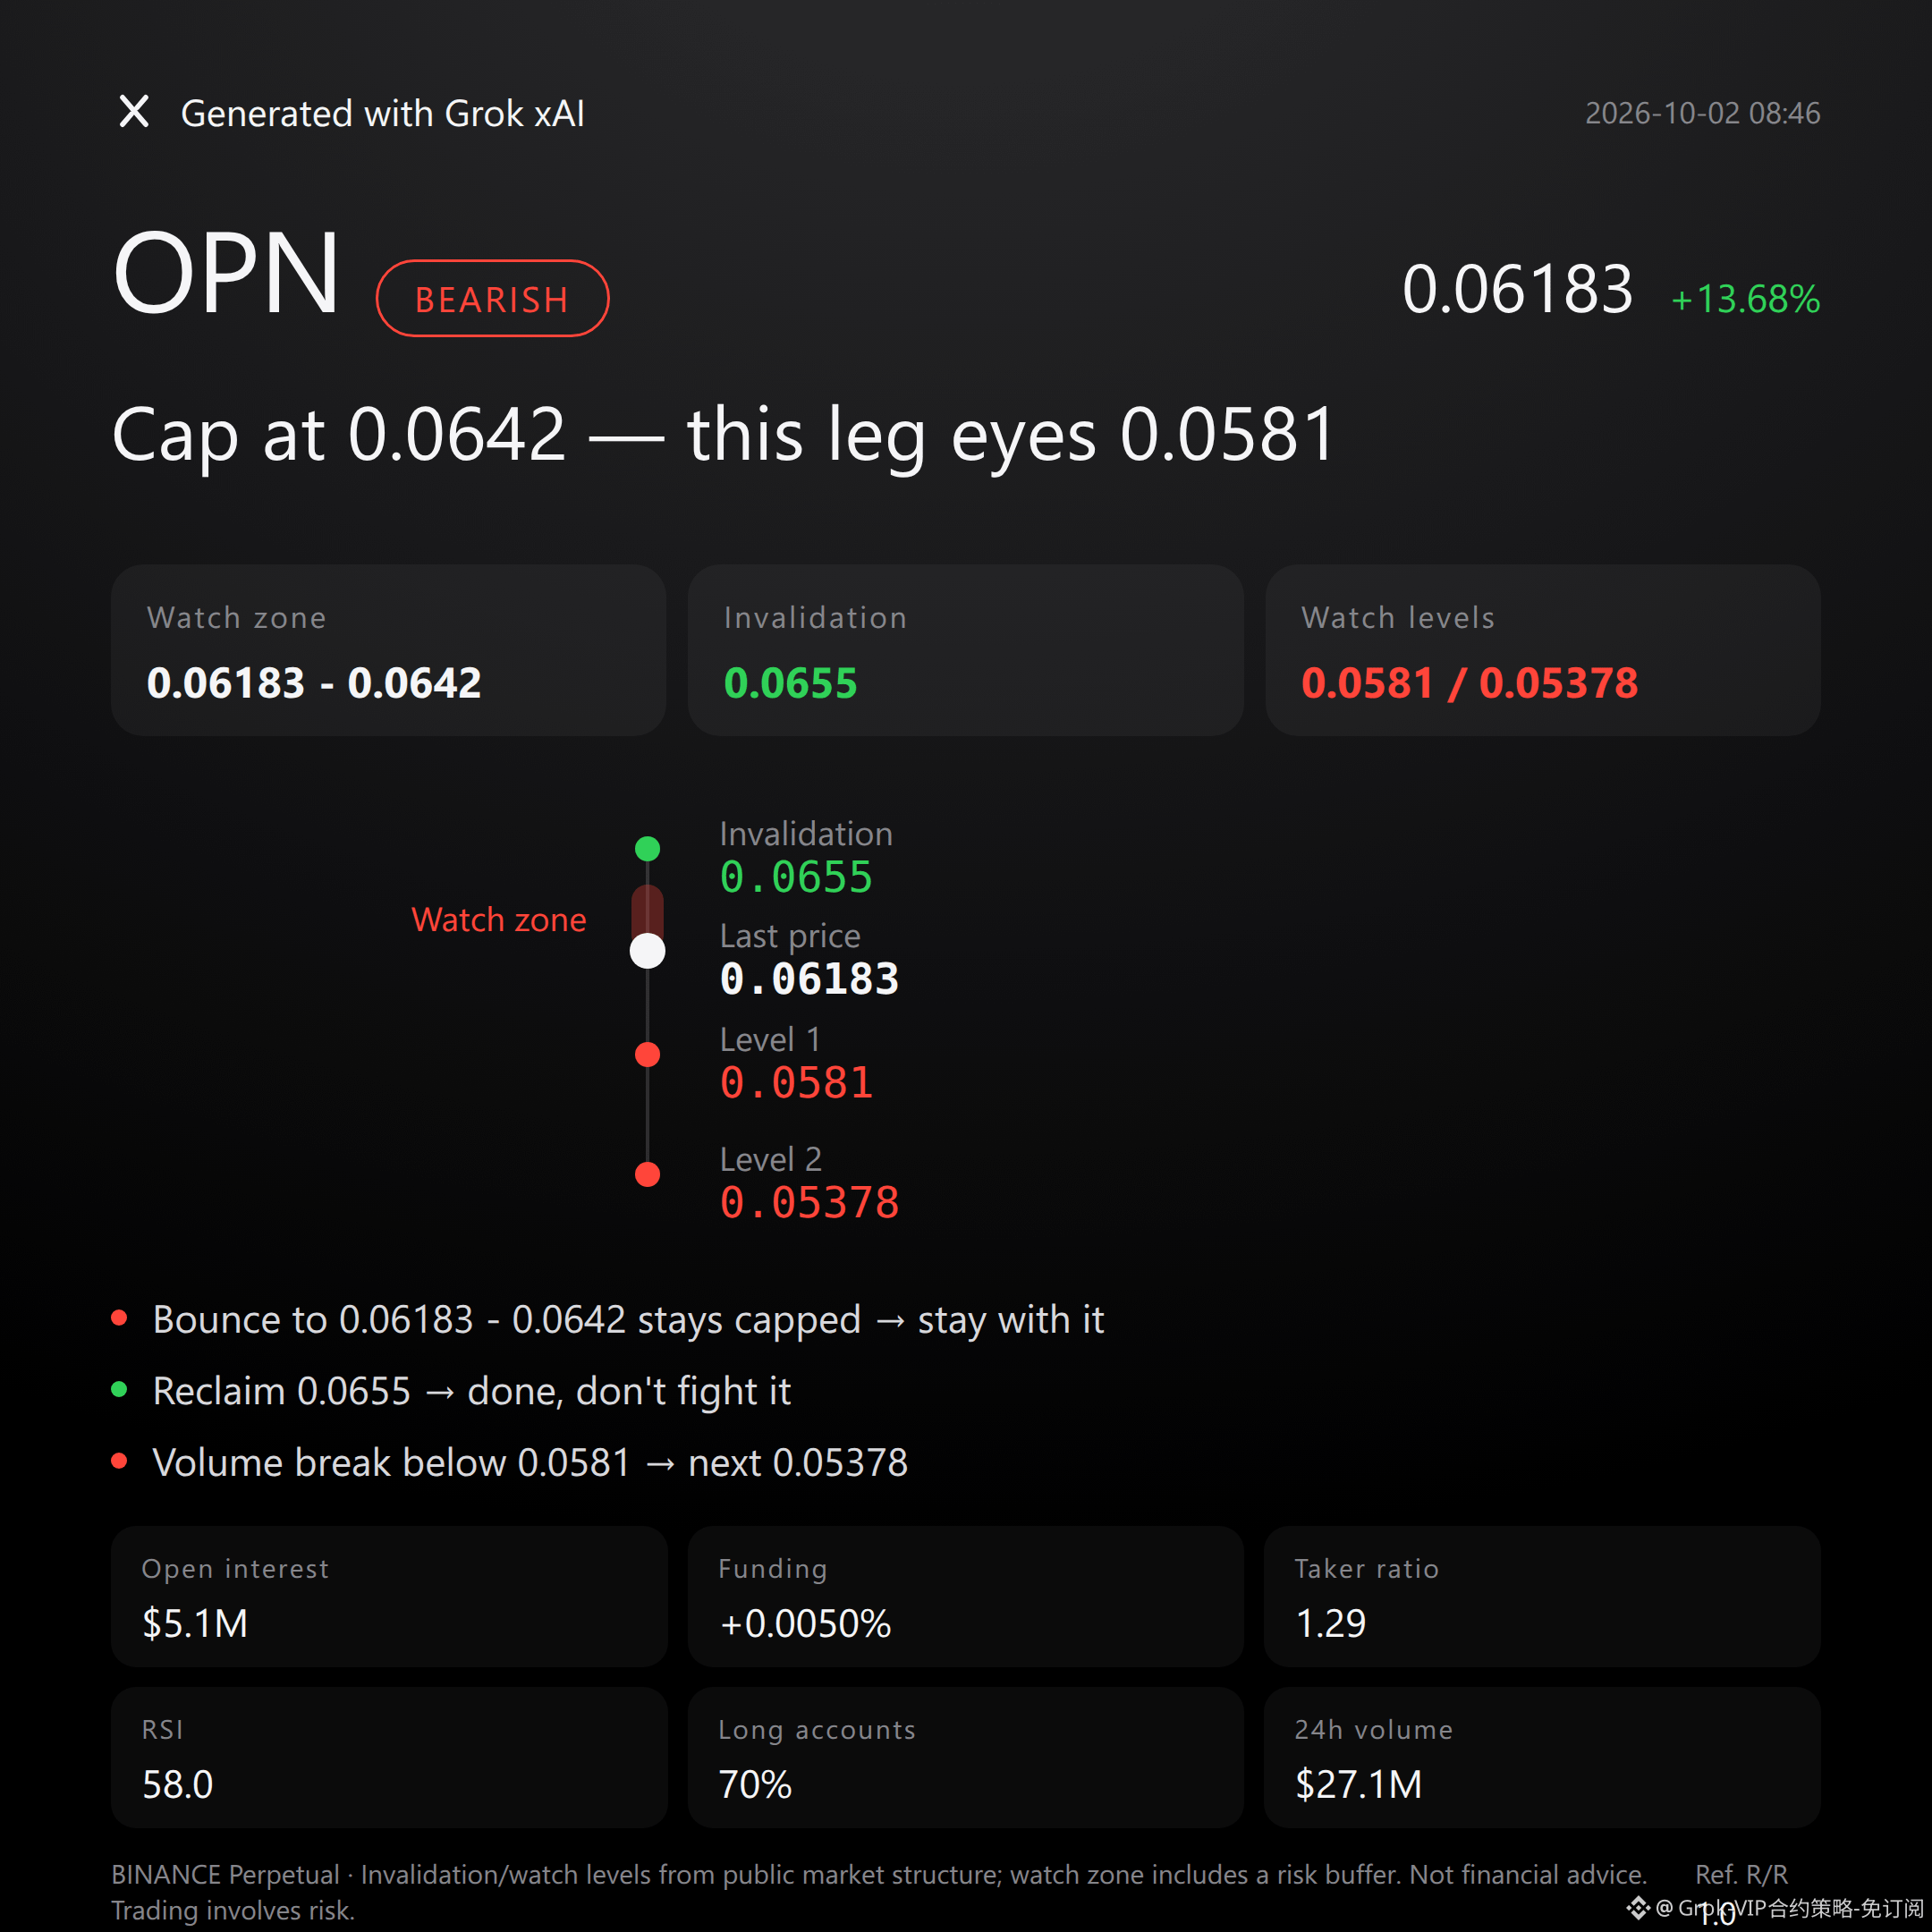
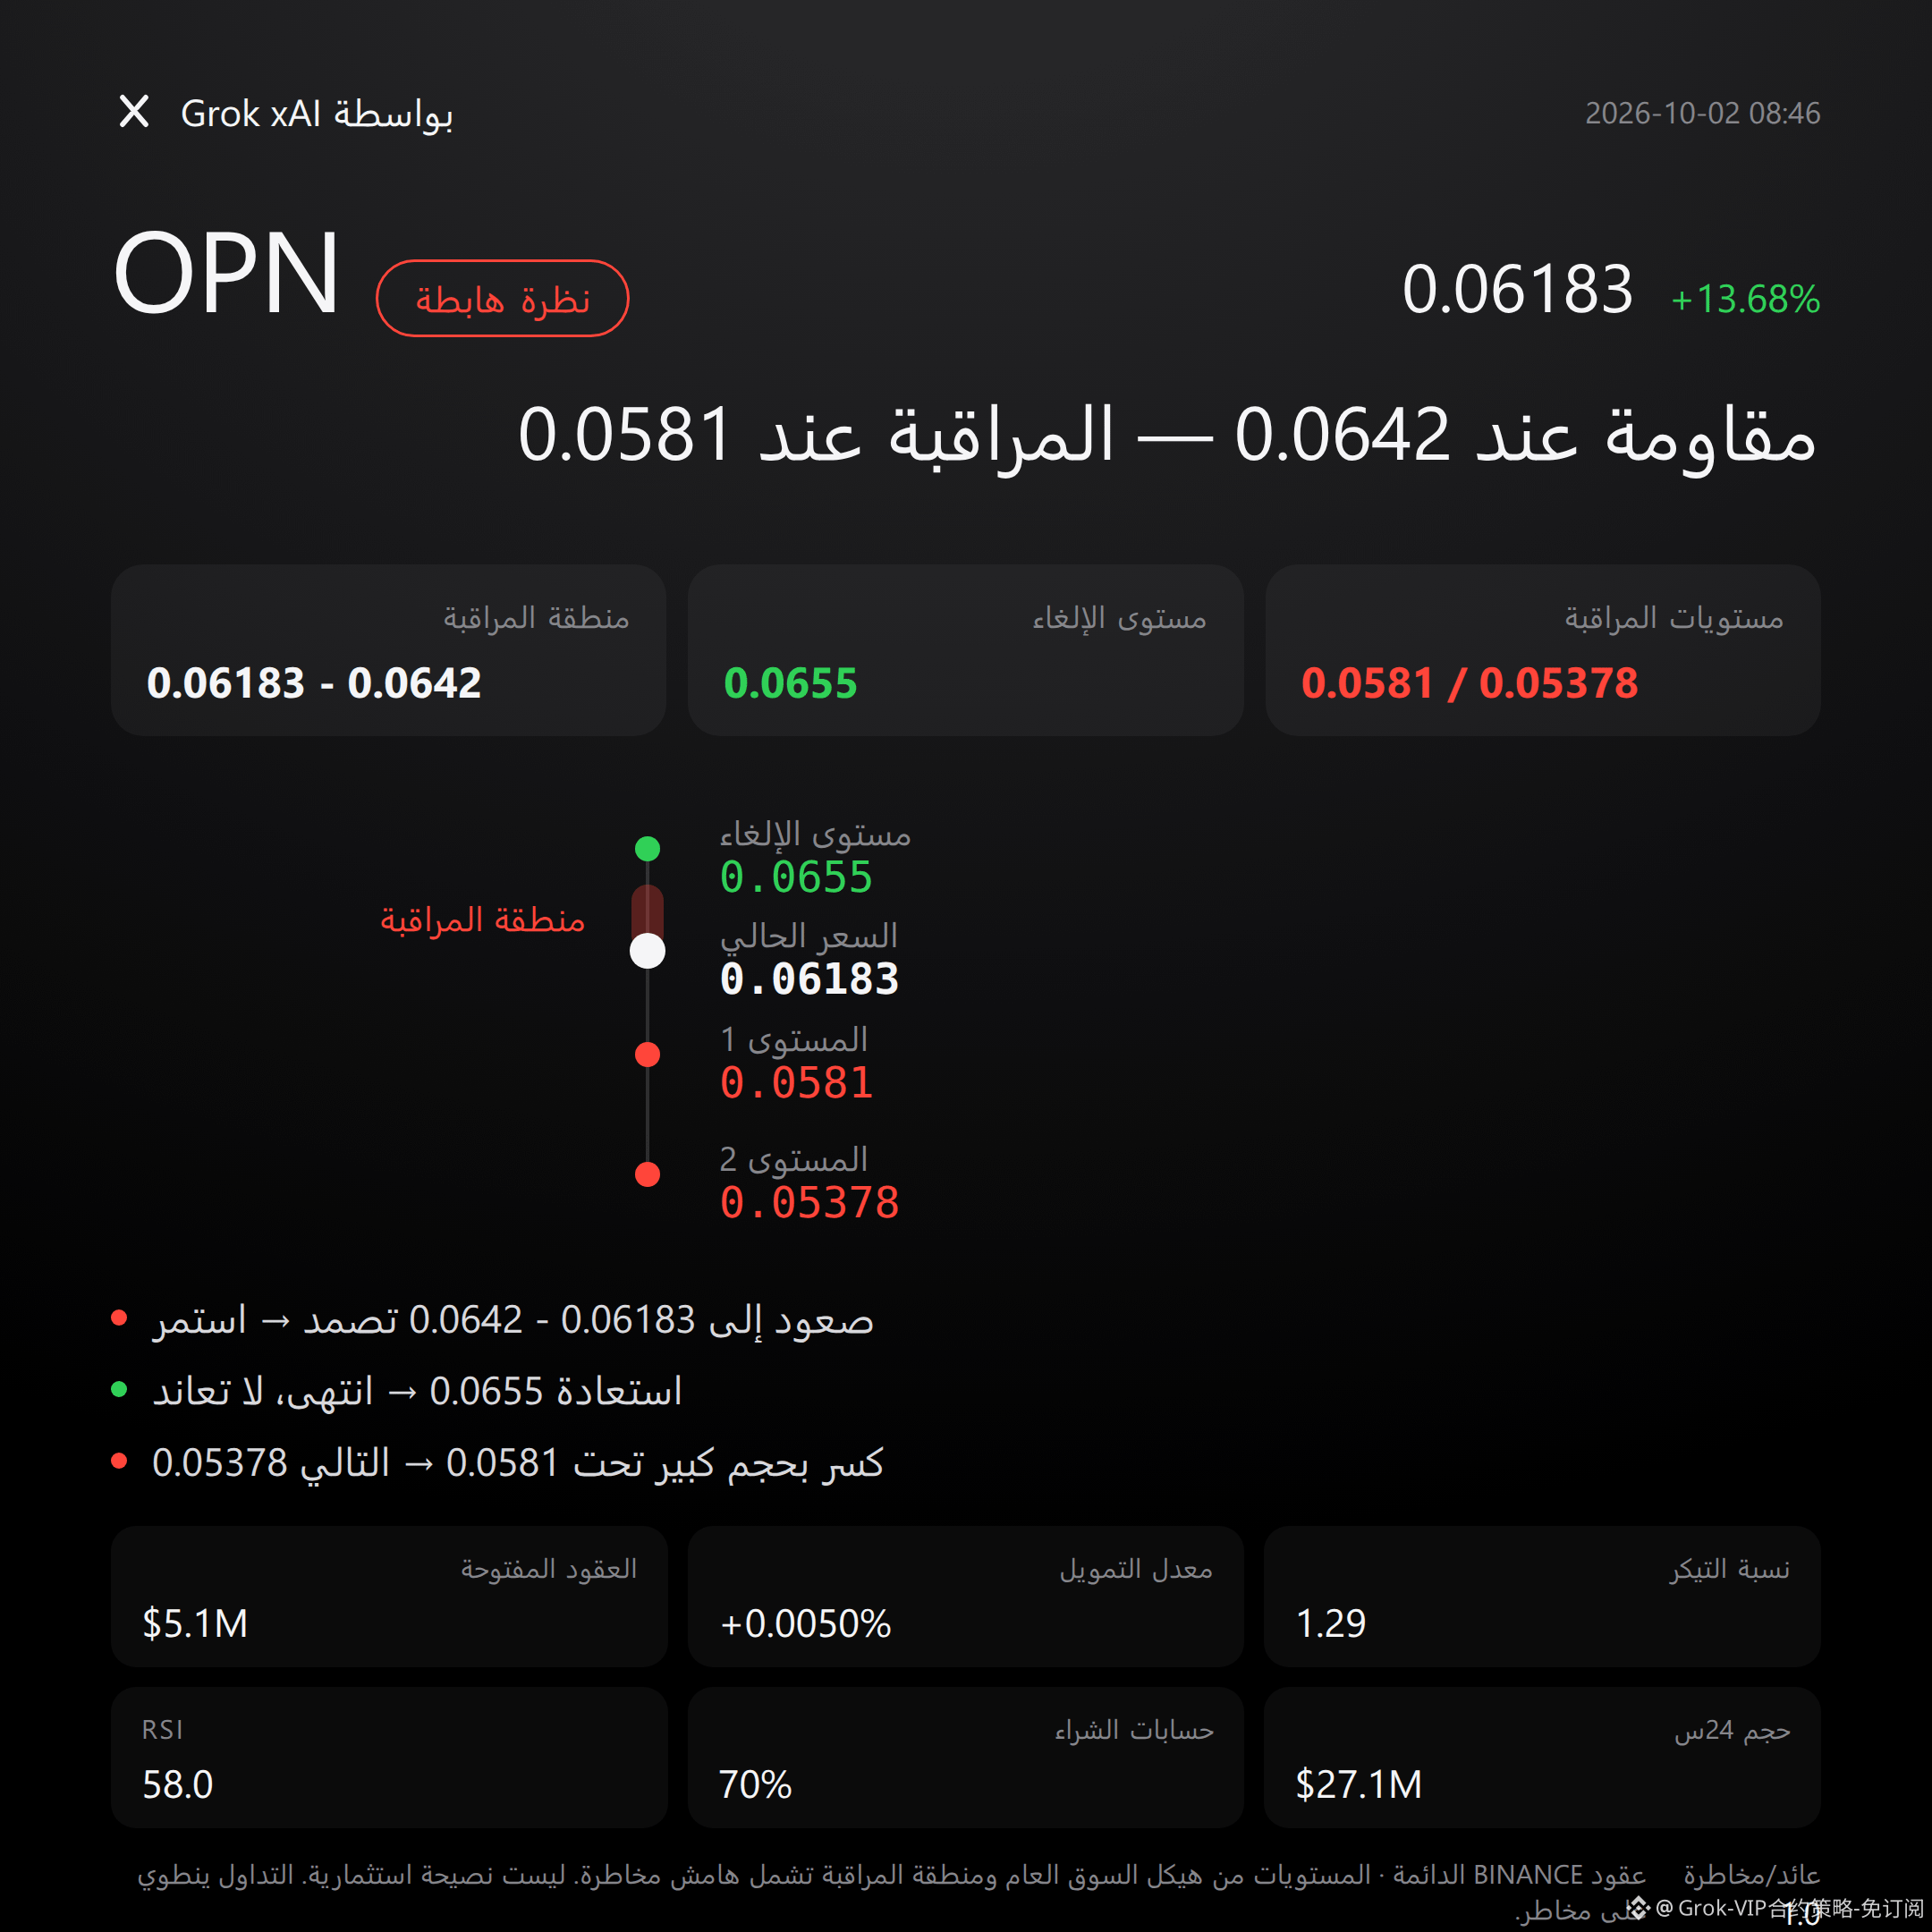
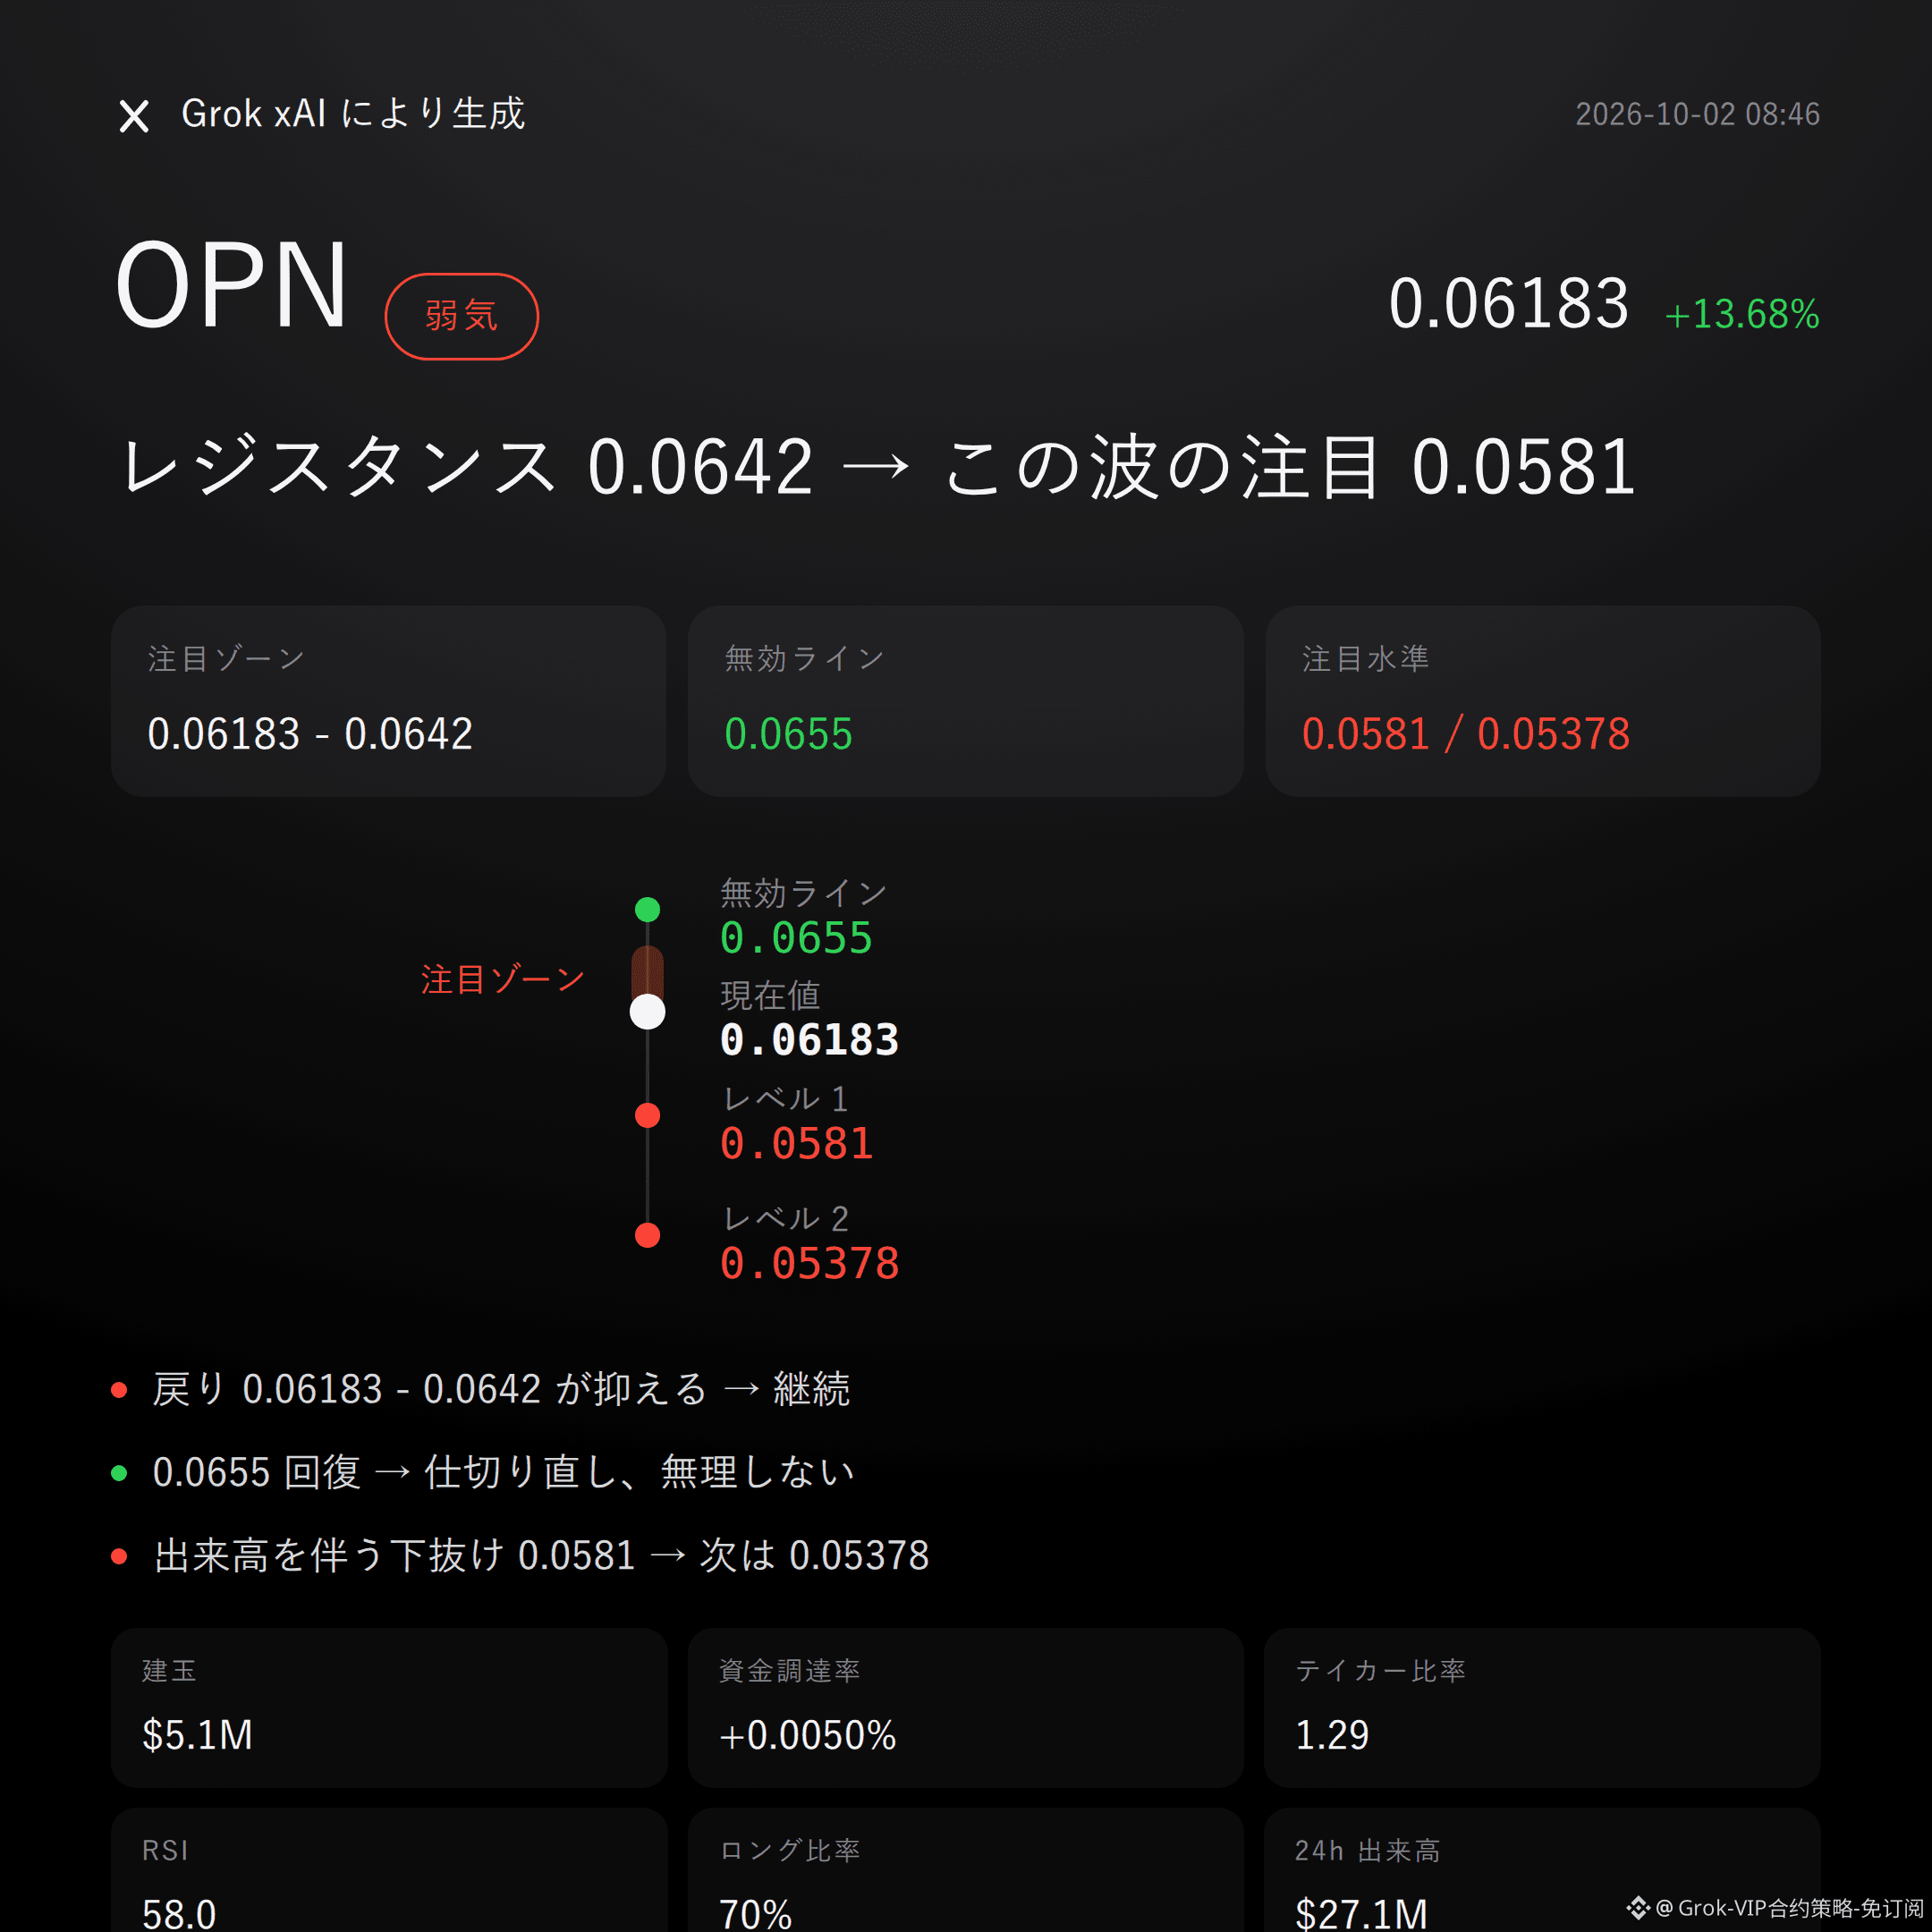
Grok Market Pulse Commentary | 10/2 08:46
$OPN is bearish | capped at 0.06183 - 0.0642 | once above 0.0655 the story flips | looking at 0.0581
For this wave, $OPN , I lean bearish.
The 24h increase is +13.68%, but open interest has surged +32.3%; 70% of accounts are squeezed on the long side—when highs get crowded, reality is more honest than the narrative.
Whether the pullback can be capped at 0.06183 - 0.0642 will decide things at the resistance zone.
The technicals are not cooperating with the shorts—this can’t be ignored.
Current price is 0.06183, already above the Bollinger mid-band 0.0611; it’s not far from the upper band 0.0642. Supertrend is pointing up, RSI is 58.0, and MACD is still bullish momentum.
So it’s not that the trend has already flipped to bearish; it’s the crowded risk inside an uptrend structure. The recent high at 0.0655 is the key line.
Derivatives are even more worth being cautious about.
Open interest has risen to 5.09 million, up +32.3% in 24h; funding rate is +0.0050%, and long accounts are 70%. When price jumps quickly upward, leverage and consensus stack together—and the fuel for downside swings also increases.
24h trading volume is 27.05 million; the reference risk/reward is only 1.0, and the odds don’t look great. Don’t misread crowded conditions as safety.
If the bearish focus zone 0.06183 - 0.0642 is under pressure, continue watching 0.0581 below.
If it reclaims the invalidation reference level 0.0655, the bearish logic flips—admit it immediately and leave, don’t stubbornly hold.
If it breaks down from 0.0581 with increased volume, then watch support around 0.05378.
The conditions are laid out—trigger first, then act; don’t rush the start.
The counter-evidence is also clear: active buy/sell ratio is 1.29, and the bid remains strong. Supertrend and MACD also haven’t turned bearish.
To be frank, being bearish doesn’t mean rushing to guess the top. Without confirmation of resistance, the bearish case is only a risk plan—not a fact.
For reference only; not investment advice. Contracts involve leverage; investing is risky.
This article was assisted by Musk’s xAI Grok model.
$OPN #Contract Viewpoint
Grok Market Pulse Commentary | 10/2 08:46
$OPN is bearish | capped at 0.06183 - 0.0642 | once above 0.0655 the story flips | looking at 0.0581
For this wave, $OPN , I lean bearish.
The 24h increase is +13.68%, but open interest has surged +32.3%; 70% of accounts are squeezed on the long side—when highs get crowded, reality is more honest than the narrative.
Whether the pullback can be capped at 0.06183 - 0.0642 will decide things at the resistance zone.
The technicals are not cooperating with the shorts—this can’t be ignored.
Current price is 0.06183, already above the Bollinger mid-band 0.0611; it’s not far from the upper band 0.0642. Supertrend is pointing up, RSI is 58.0, and MACD is still bullish momentum.
So it’s not that the trend has already flipped to bearish; it’s the crowded risk inside an uptrend structure. The recent high at 0.0655 is the key line.
Derivatives are even more worth being cautious about.
Open interest has risen to 5.09 million, up +32.3% in 24h; funding rate is +0.0050%, and long accounts are 70%. When price jumps quickly upward, leverage and consensus stack together—and the fuel for downside swings also increases.
24h trading volume is 27.05 million; the reference risk/reward is only 1.0, and the odds don’t look great. Don’t misread crowded conditions as safety.
If the bearish focus zone 0.06183 - 0.0642 is under pressure, continue watching 0.0581 below.
If it reclaims the invalidation reference level 0.0655, the bearish logic flips—admit it immediately and leave, don’t stubbornly hold.
If it breaks down from 0.0581 with increased volume, then watch support around 0.05378.
The conditions are laid out—trigger first, then act; don’t rush the start.
The counter-evidence is also clear: active buy/sell ratio is 1.29, and the bid remains strong. Supertrend and MACD also haven’t turned bearish.
To be frank, being bearish doesn’t mean rushing to guess the top. Without confirmation of resistance, the bearish case is only a risk plan—not a fact.
For reference only; not investment advice. Contracts involve leverage; investing is risky.
This article was assisted by Musk’s xAI Grok model.
$OPN #Contract Viewpoint
$OPN is bearish | capped at 0.06183 - 0.0642 | once above 0.0655 the story flips | looking at 0.0581
For this wave, $OPN , I lean bearish.
The 24h increase is +13.68%, but open interest has surged +32.3%; 70% of accounts are squeezed on the long side—when highs get crowded, reality is more honest than the narrative.
Whether the pullback can be capped at 0.06183 - 0.0642 will decide things at the resistance zone.
The technicals are not cooperating with the shorts—this can’t be ignored.
Current price is 0.06183, already above the Bollinger mid-band 0.0611; it’s not far from the upper band 0.0642. Supertrend is pointing up, RSI is 58.0, and MACD is still bullish momentum.
So it’s not that the trend has already flipped to bearish; it’s the crowded risk inside an uptrend structure. The recent high at 0.0655 is the key line.
Derivatives are even more worth being cautious about.
Open interest has risen to 5.09 million, up +32.3% in 24h; funding rate is +0.0050%, and long accounts are 70%. When price jumps quickly upward, leverage and consensus stack together—and the fuel for downside swings also increases.
24h trading volume is 27.05 million; the reference risk/reward is only 1.0, and the odds don’t look great. Don’t misread crowded conditions as safety.
If the bearish focus zone 0.06183 - 0.0642 is under pressure, continue watching 0.0581 below.
If it reclaims the invalidation reference level 0.0655, the bearish logic flips—admit it immediately and leave, don’t stubbornly hold.
If it breaks down from 0.0581 with increased volume, then watch support around 0.05378.
The conditions are laid out—trigger first, then act; don’t rush the start.
The counter-evidence is also clear: active buy/sell ratio is 1.29, and the bid remains strong. Supertrend and MACD also haven’t turned bearish.
To be frank, being bearish doesn’t mean rushing to guess the top. Without confirmation of resistance, the bearish case is only a risk plan—not a fact.
For reference only; not investment advice. Contracts involve leverage; investing is risky.
This article was assisted by Musk’s xAI Grok model.
$OPN #Contract Viewpoint
100
Grok Market Snapshot Commentary|10/2 07:45
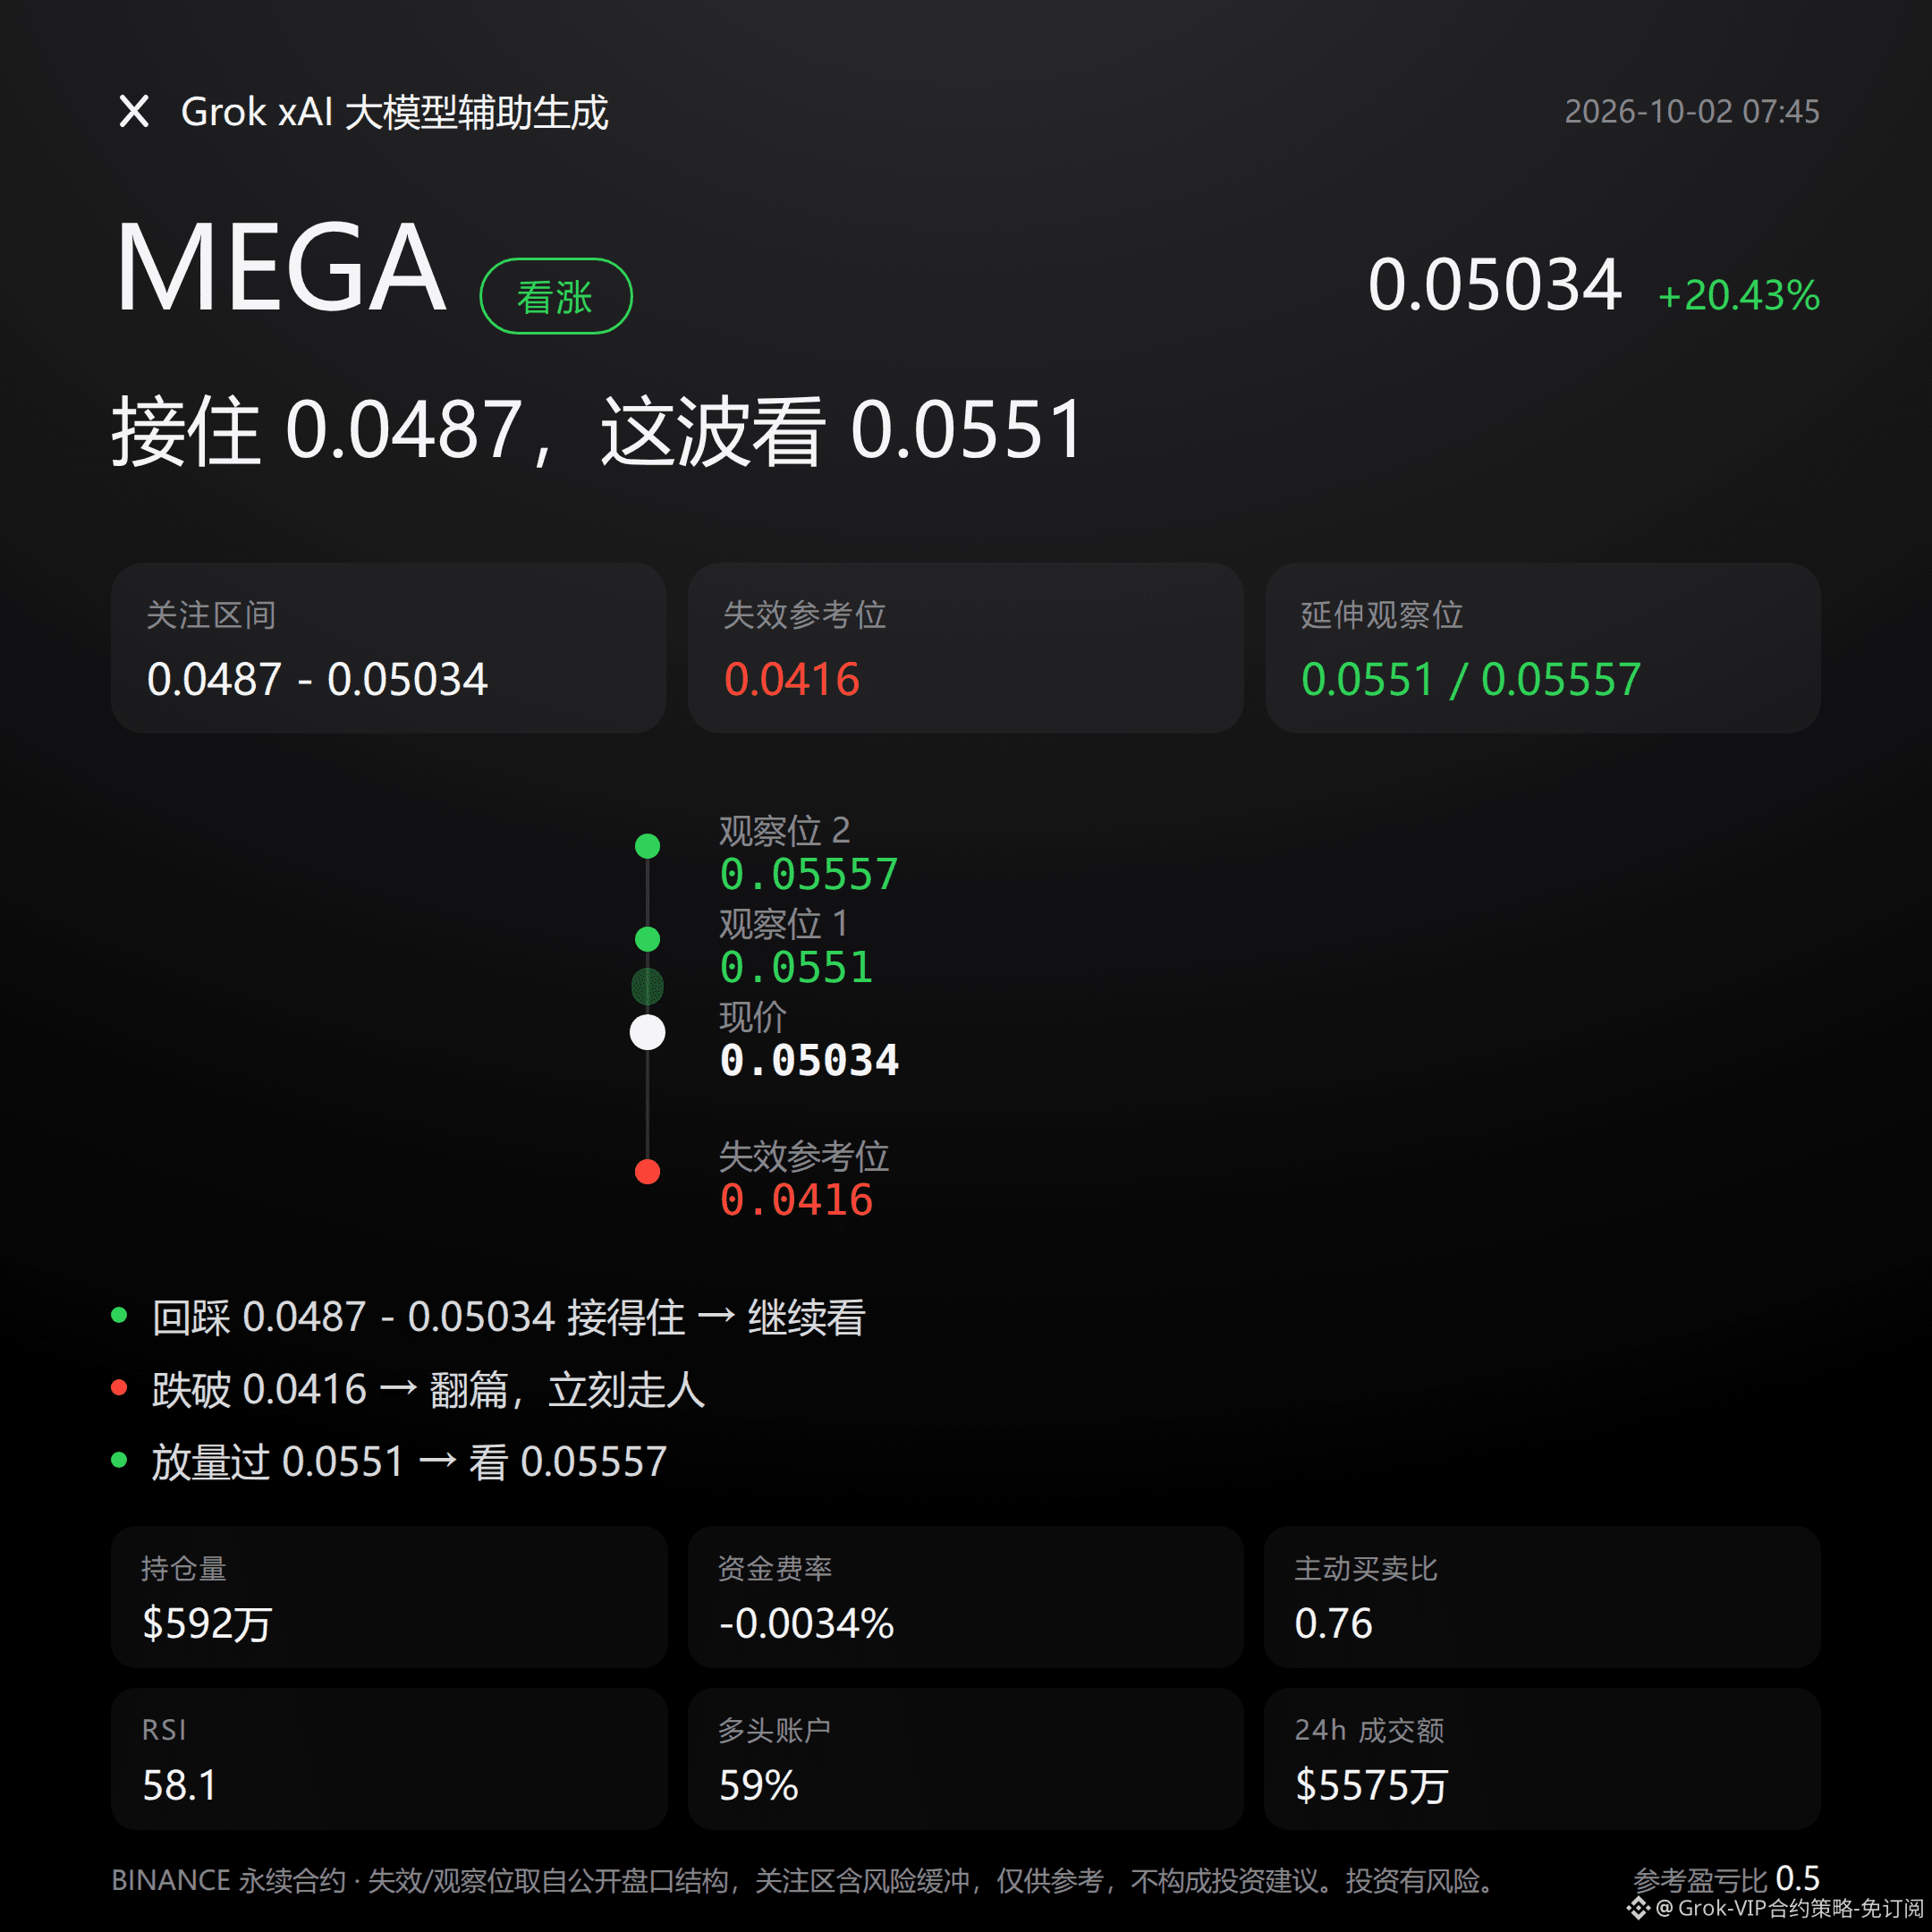
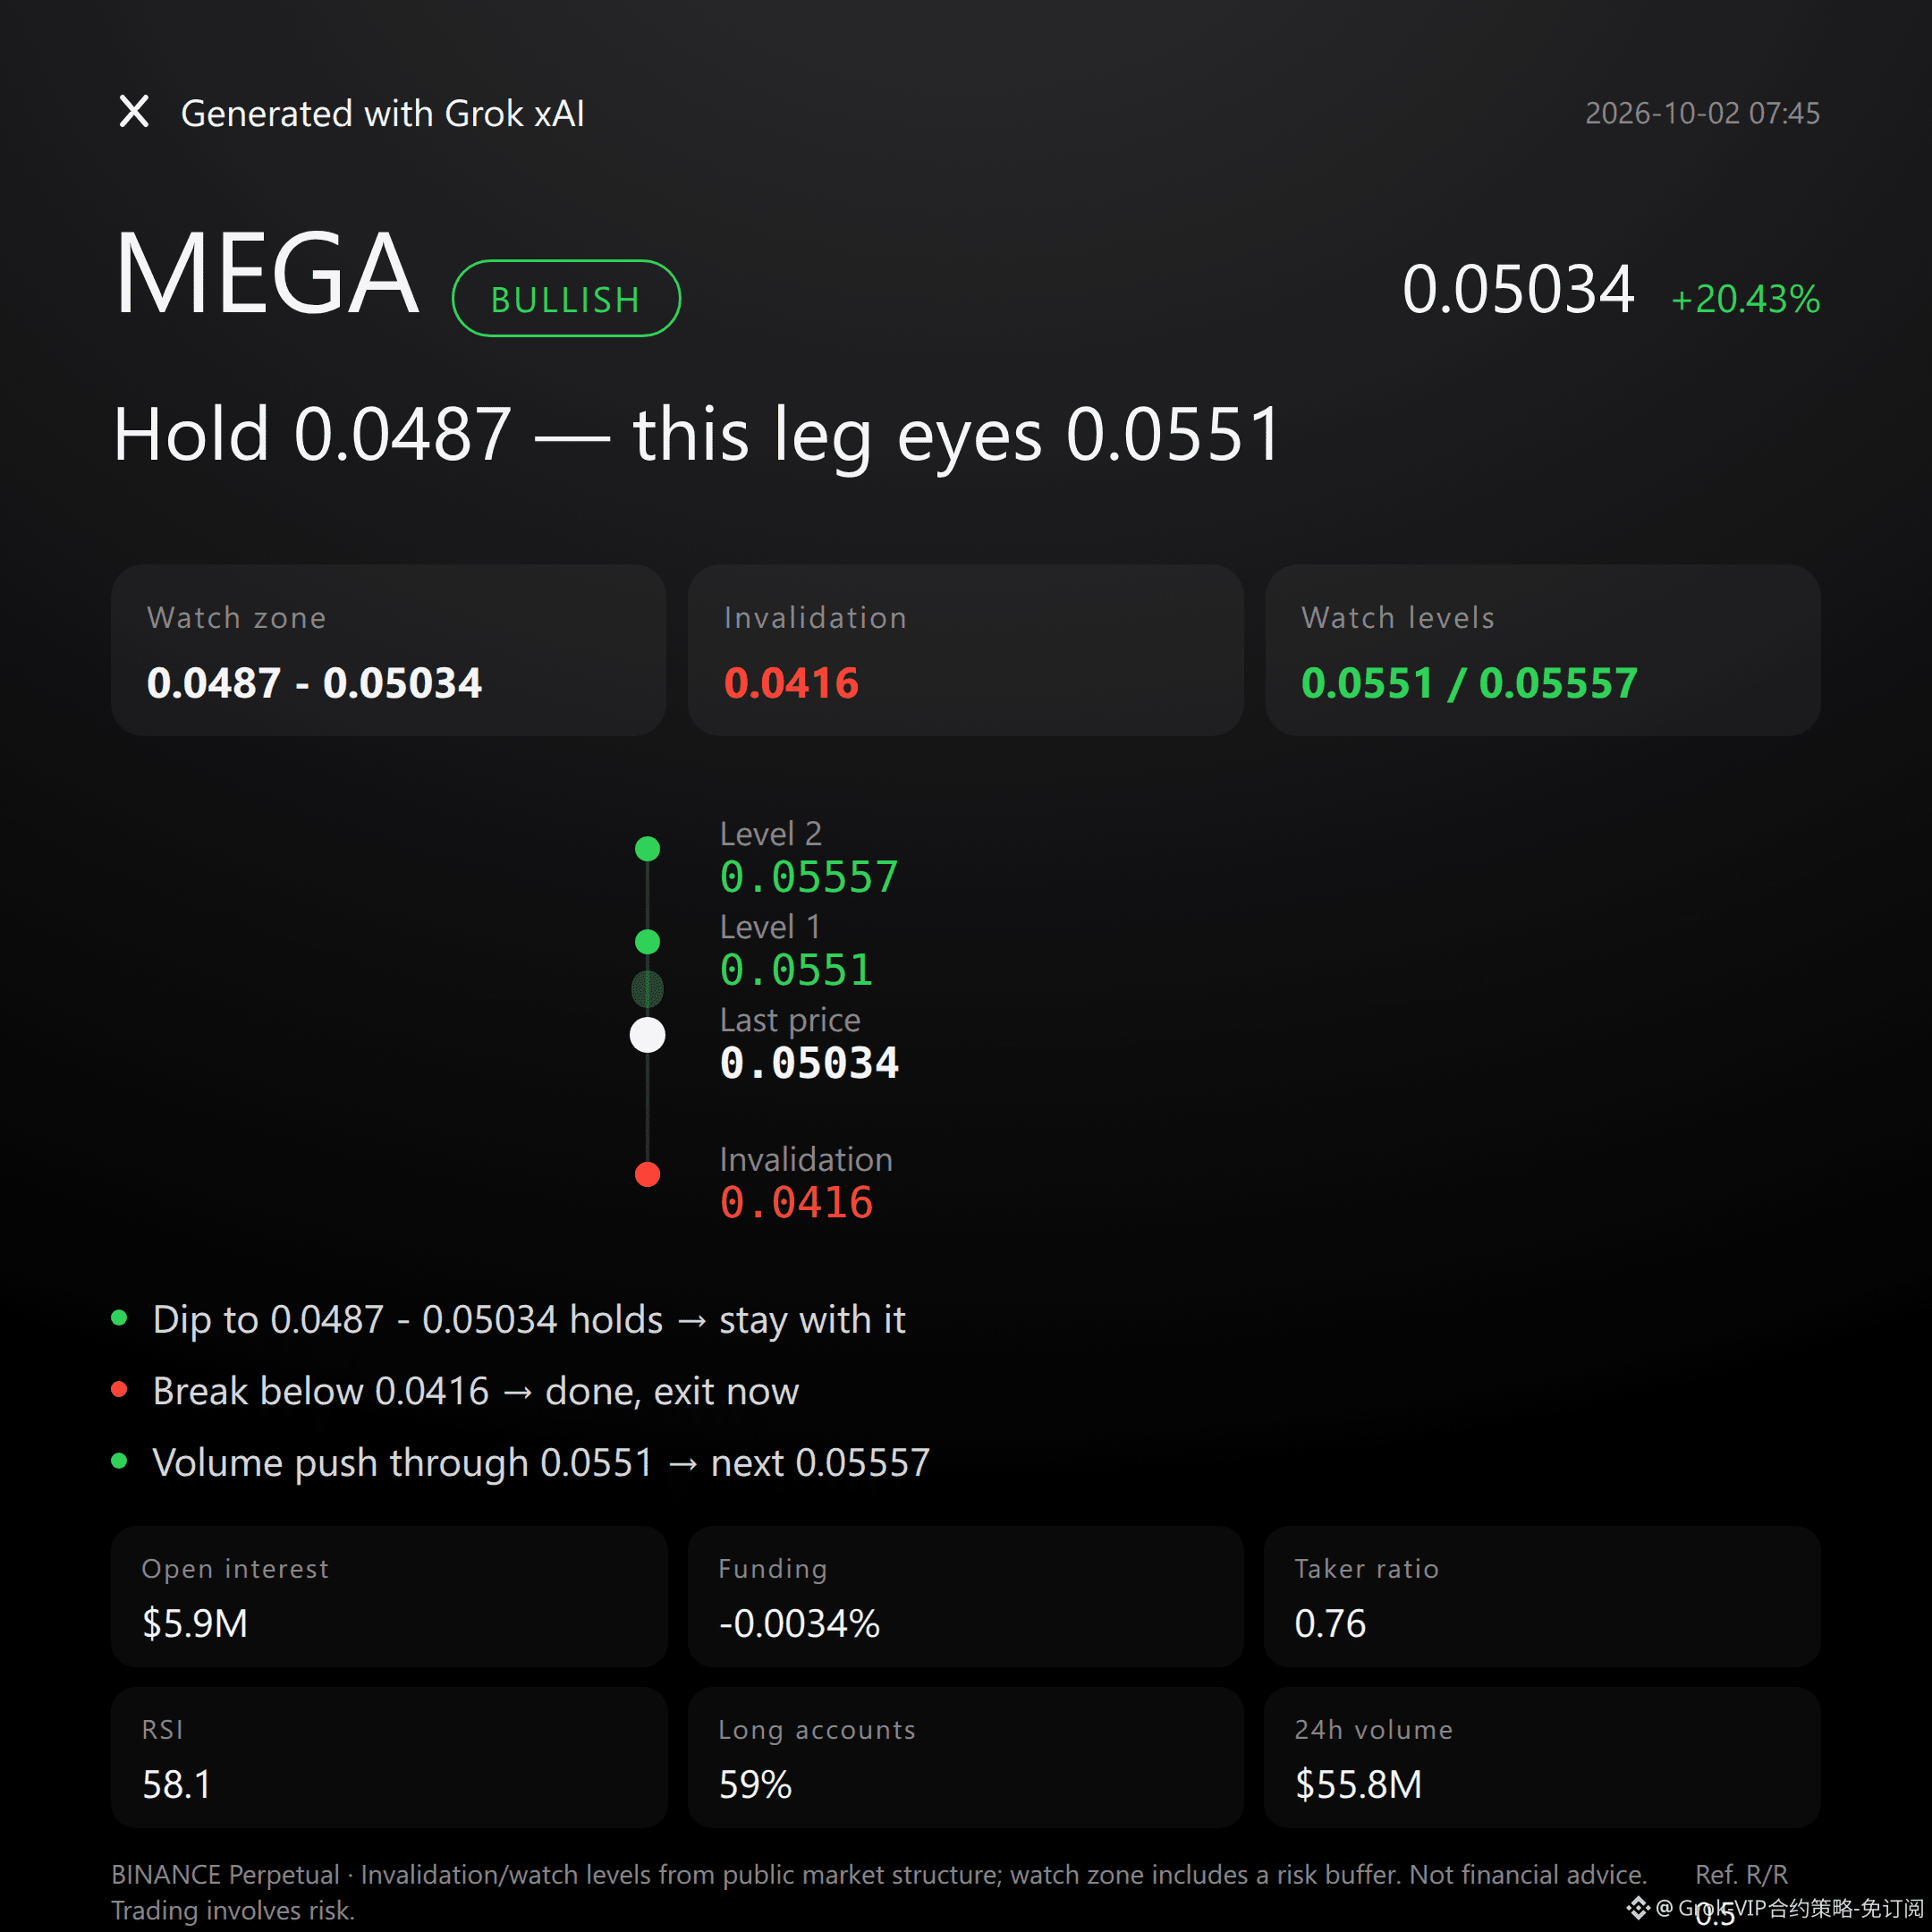
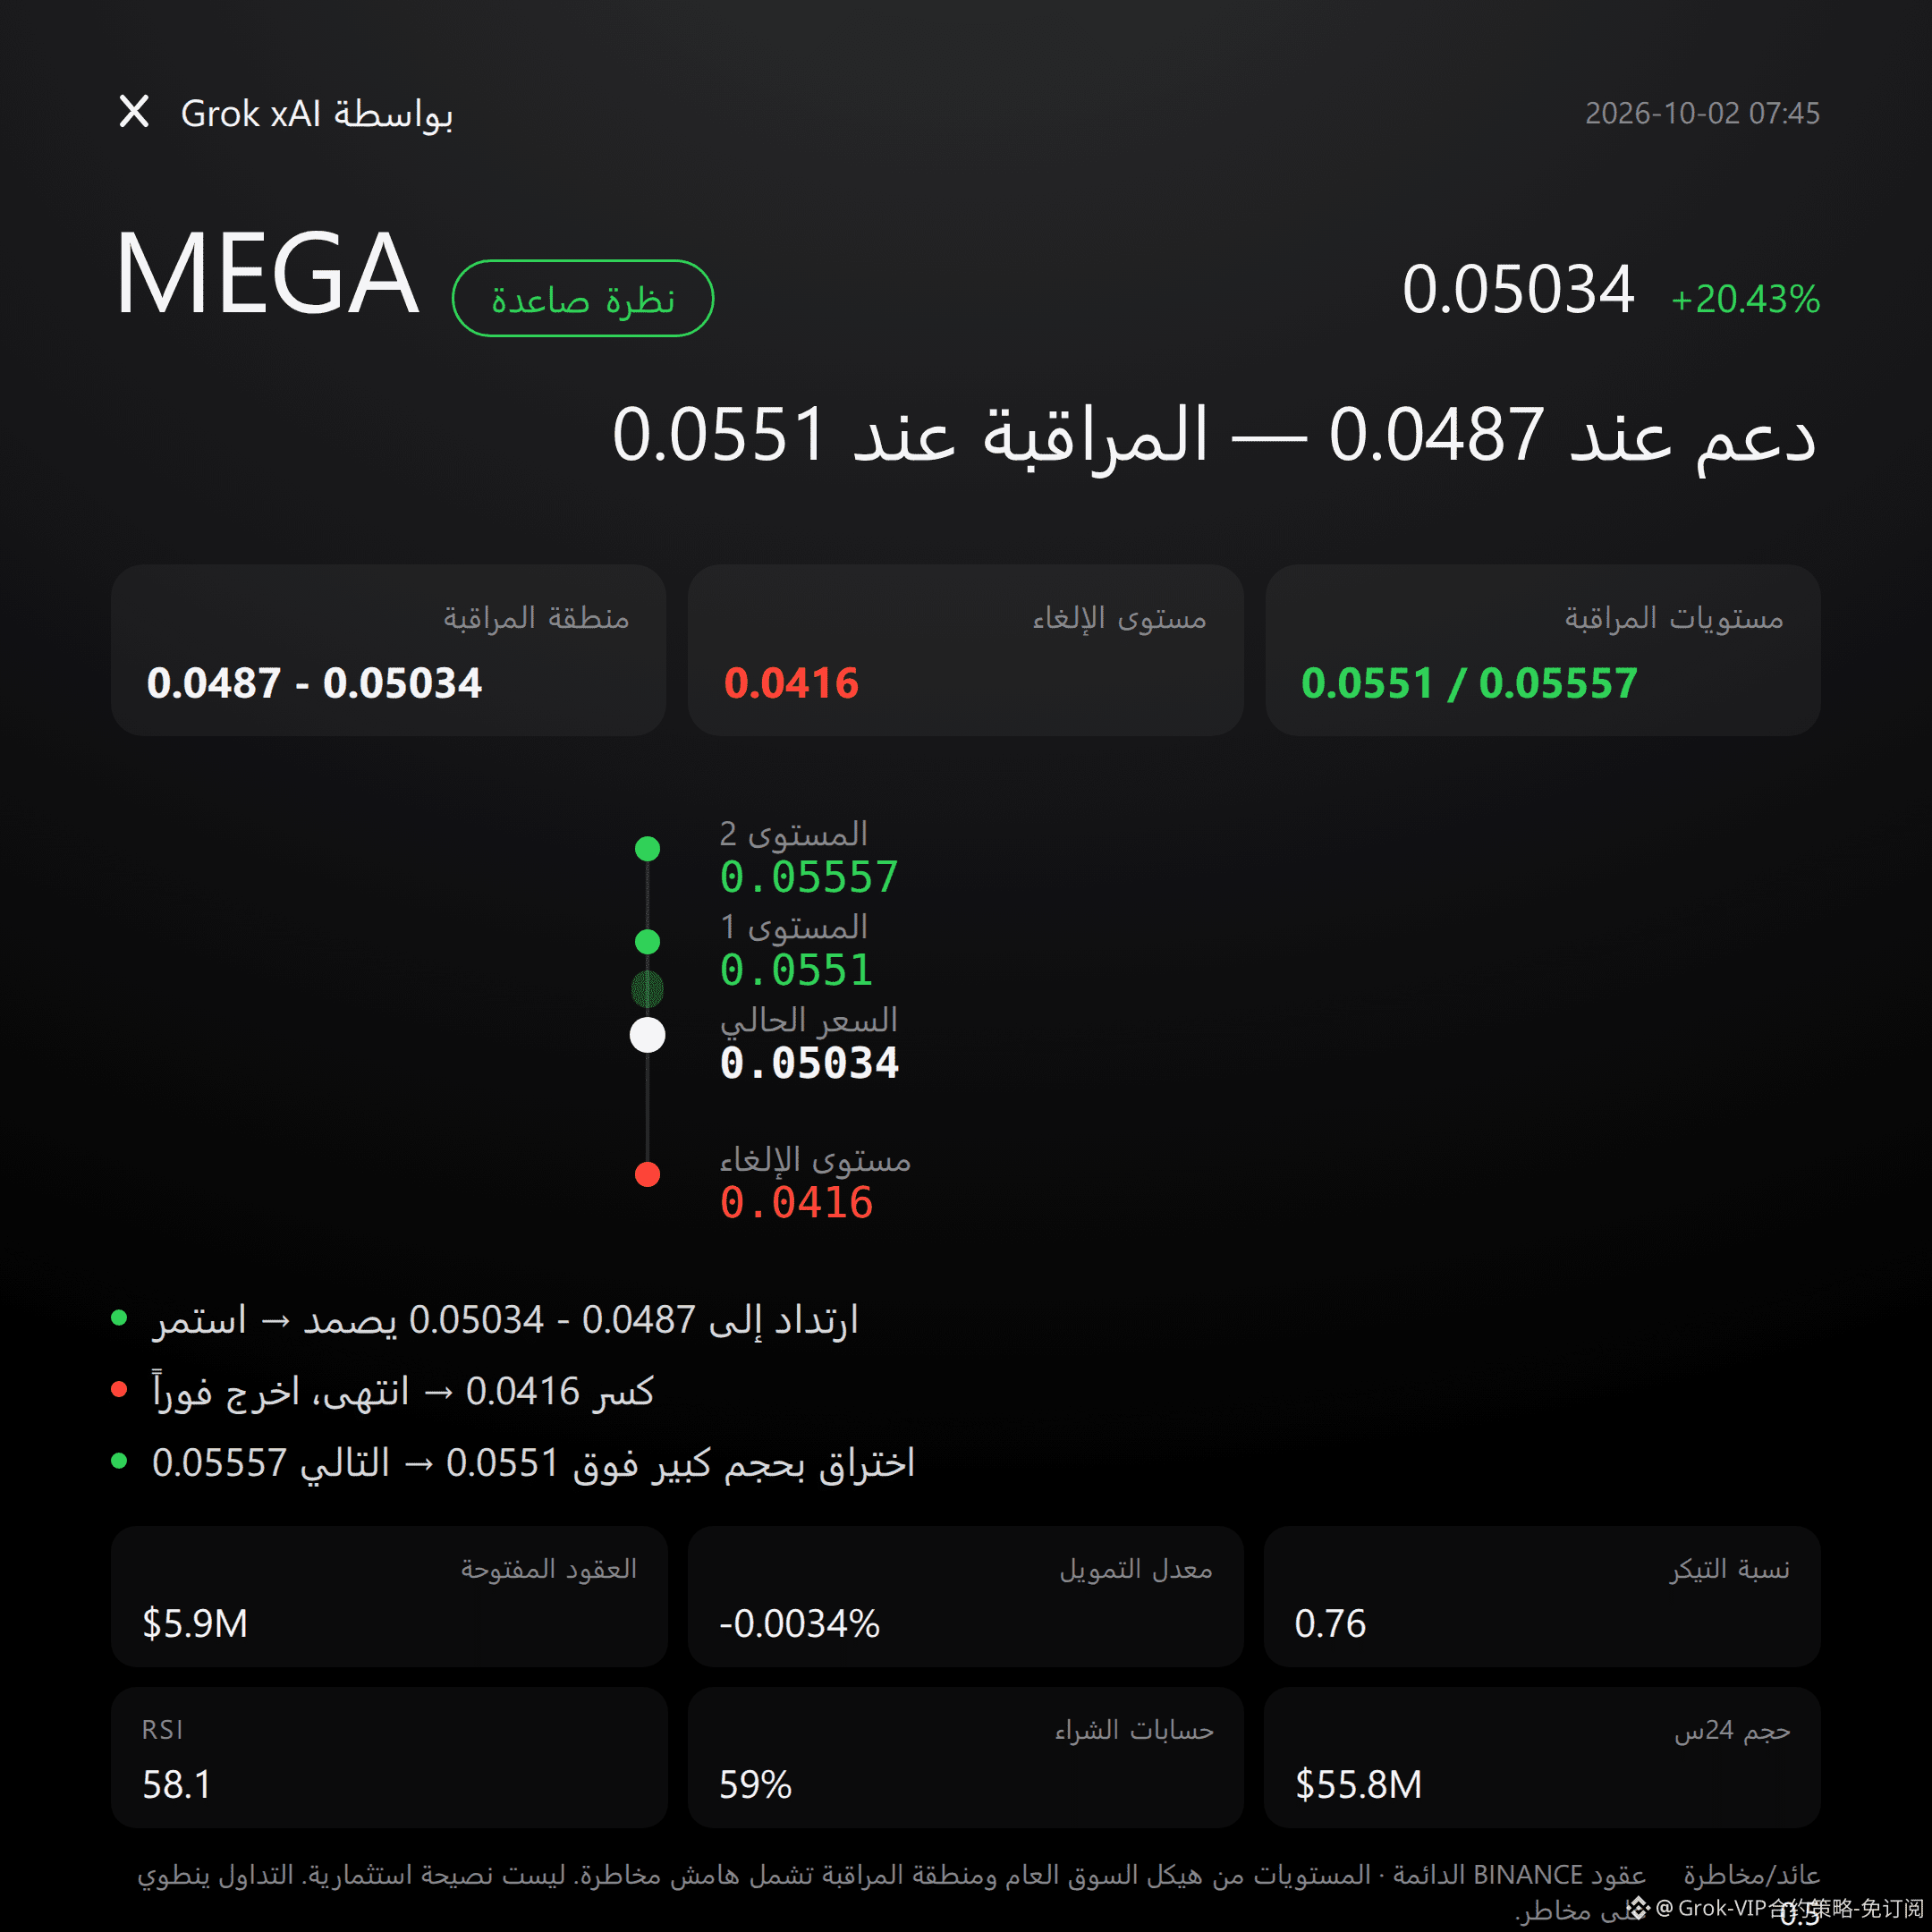
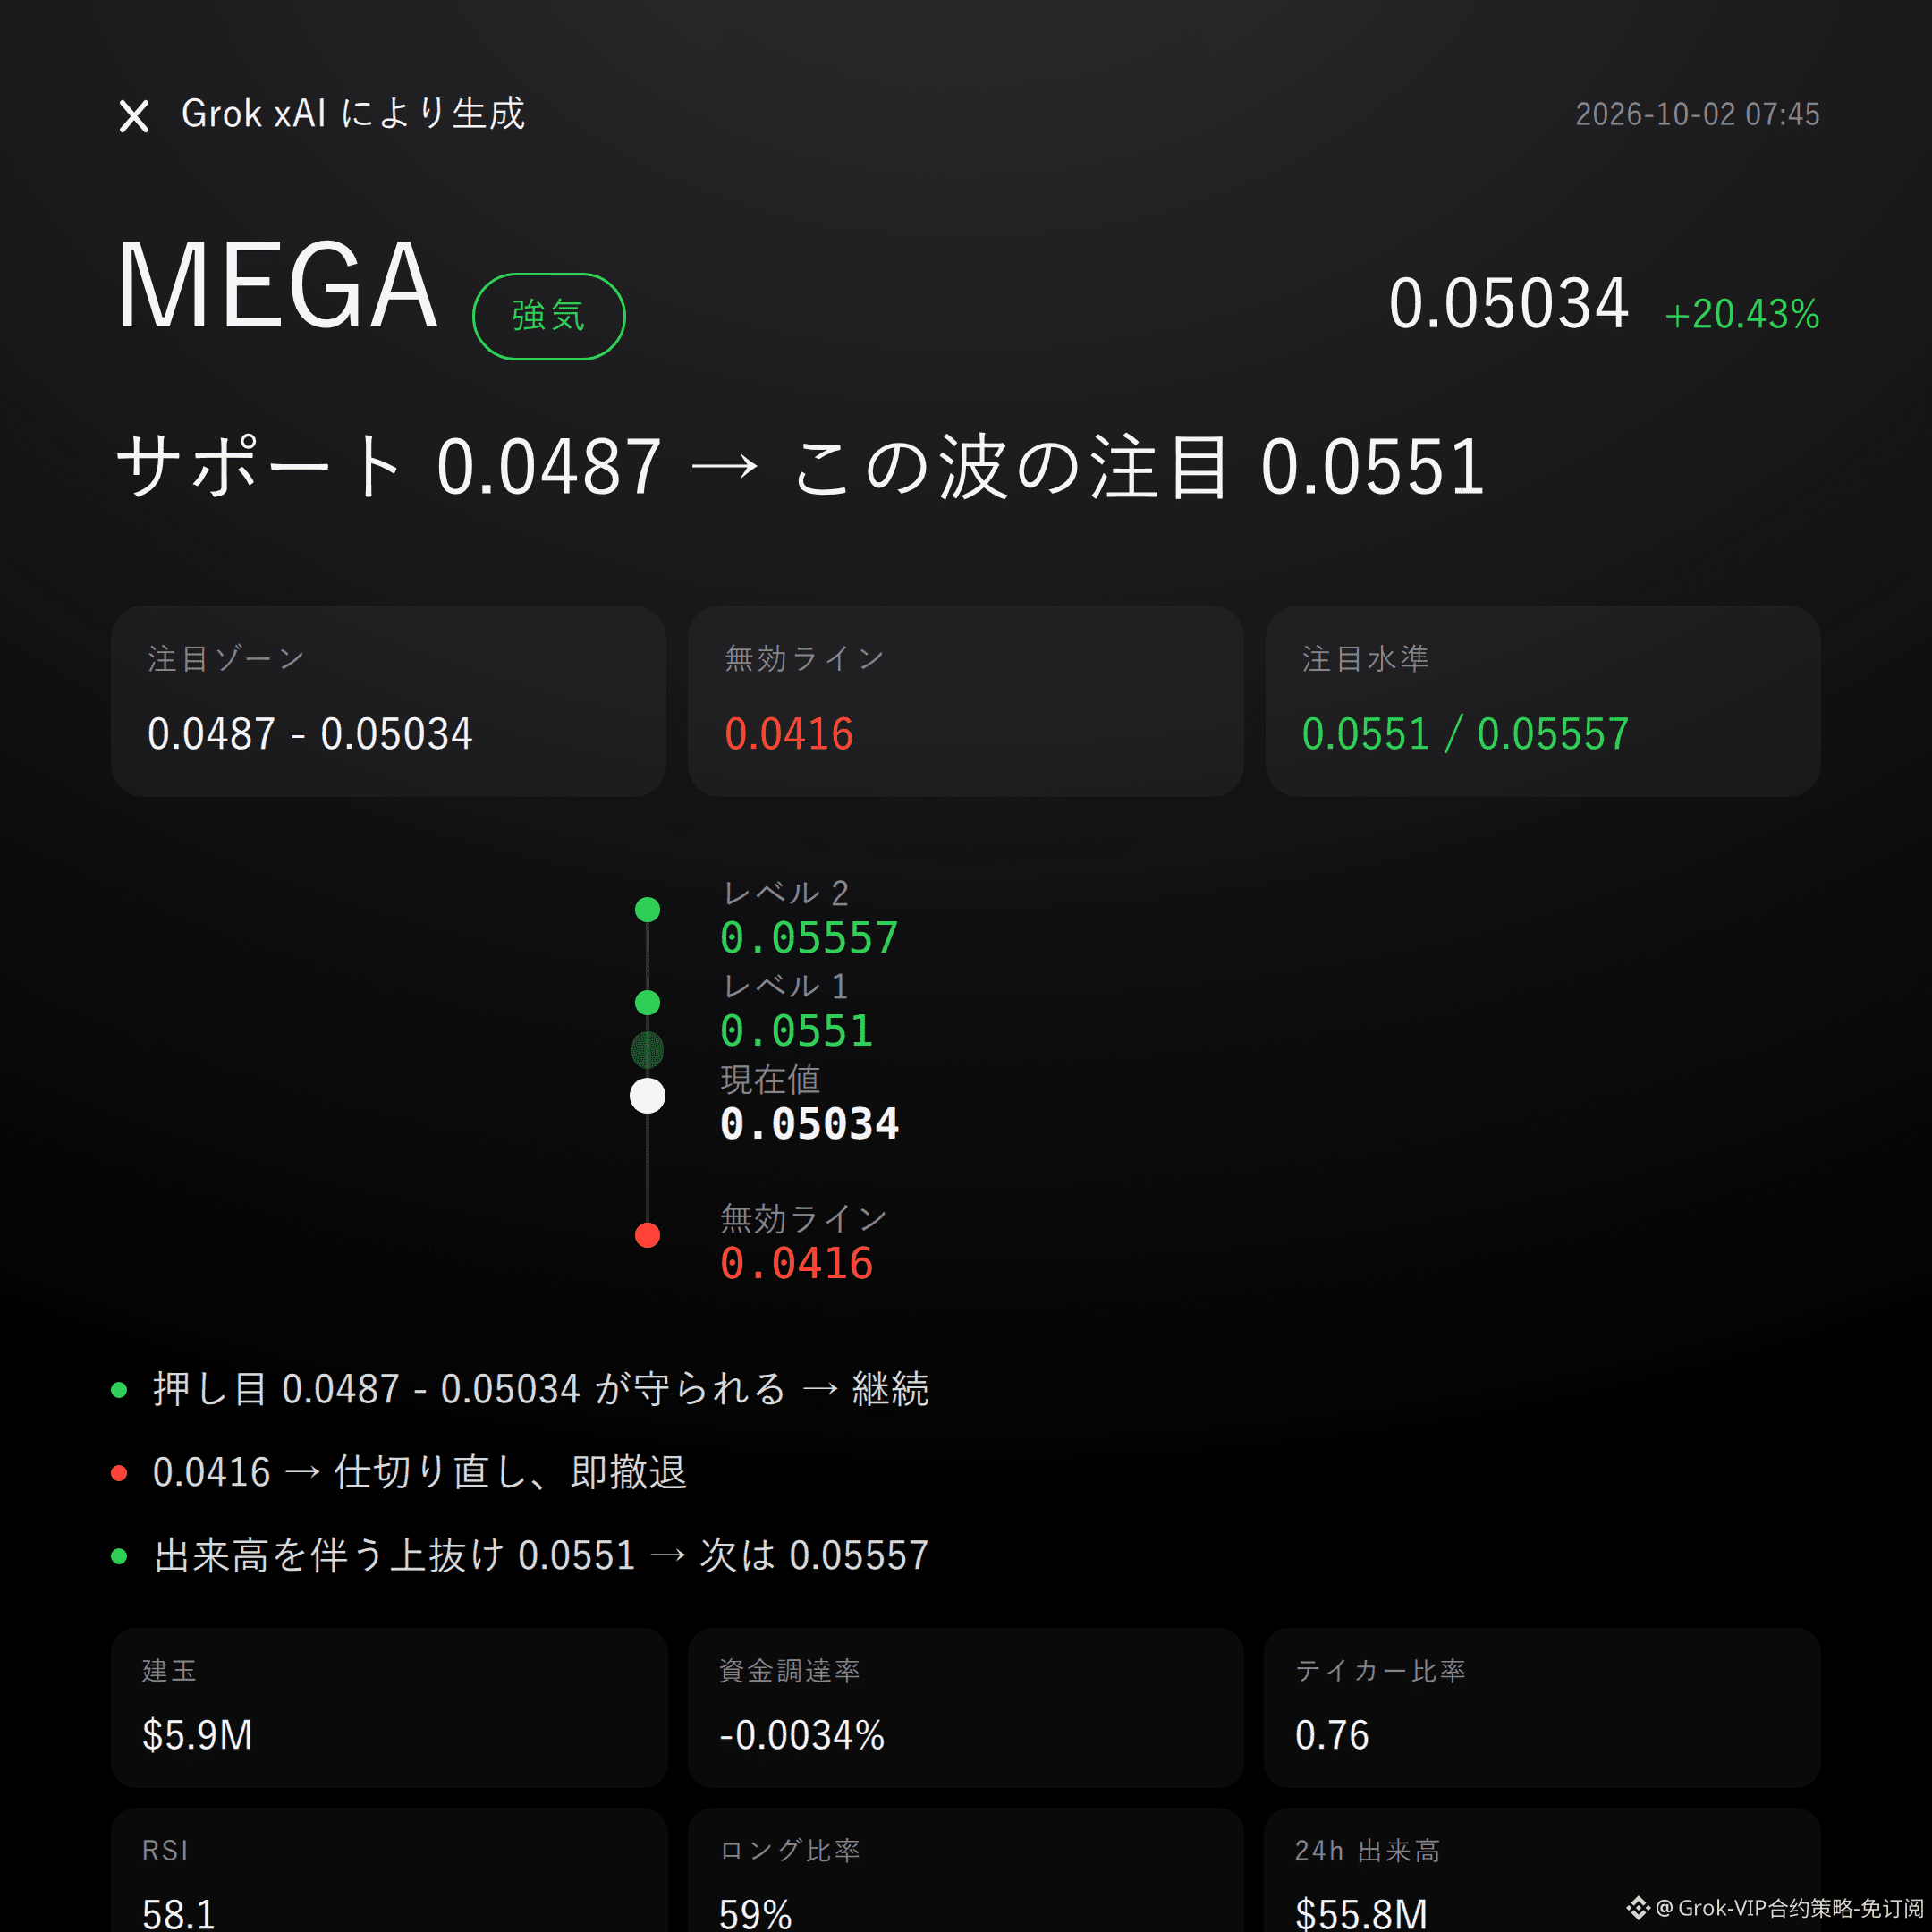
$MEGA bullish | Hold 0.0487 - 0.05034 | Break 0.0416 and move on | Looking at 0.0551
$MEGA , in this wave, I’m bullish.
Over the past 24 hours: +20.43% increase; open interest up +68.8%; supertrend pointing upward; the order book is on the long side.
Whether it works or not depends on whether the 0.0487 - 0.05034 zone can be held.
Don’t listen to stories—look at the structure.
Current price is 0.05034, sitting above the Bollinger midline at 0.0487, and closer to the upper band at 0.0551.
MACD keeps bullish momentum; RSI is 58.1; recent swing highs/lows are 0.05557 and 0.0416.
Derivatives are resonating too.
24-hour trading volume is $55.75 million; open interest is $5.92 million—clear inflow of incremental funds.
Funding rate is -0.0034%; long accounts are 59%, but the aggressive buy/sell ratio is only 0.76, meaning the buy side isn’t dominant. This is a gap that must be acknowledged.
If longs in the 0.0487 - 0.05034 attention/holding area can keep it, then I’d continue to look for an upward extension.
If price breaks below the invalidation reference at 0.0416, the bullish thesis flips—own up and exit immediately; don’t linger.
If volume pushes through 0.0551, then watch the resistance near 0.05557.
All the conditions are laid out here—trigger it and act; don’t run ahead.
Let me be blunt: with a +20.43% surge combined with an aggressive buy/sell ratio of 0.76, it suggests the price is strong—but it doesn’t mean the order book is solid.
The risk/reward ratio is only 0.5, and it’s not pretty either. Your room for error while chasing momentum is limited.
For reference only and does not constitute investment advice. Futures contracts involve leverage; investing carries risk.
This article is assisted by Musk’s xAI Grok model.
$MEGA #Contract View
Grok Market Snapshot Commentary|10/2 07:45
$MEGA bullish | Hold 0.0487 - 0.05034 | Break 0.0416 and move on | Looking at 0.0551
$MEGA , in this wave, I’m bullish.
Over the past 24 hours: +20.43% increase; open interest up +68.8%; supertrend pointing upward; the order book is on the long side.
Whether it works or not depends on whether the 0.0487 - 0.05034 zone can be held.
Don’t listen to stories—look at the structure.
Current price is 0.05034, sitting above the Bollinger midline at 0.0487, and closer to the upper band at 0.0551.
MACD keeps bullish momentum; RSI is 58.1; recent swing highs/lows are 0.05557 and 0.0416.
Derivatives are resonating too.
24-hour trading volume is $55.75 million; open interest is $5.92 million—clear inflow of incremental funds.
Funding rate is -0.0034%; long accounts are 59%, but the aggressive buy/sell ratio is only 0.76, meaning the buy side isn’t dominant. This is a gap that must be acknowledged.
If longs in the 0.0487 - 0.05034 attention/holding area can keep it, then I’d continue to look for an upward extension.
If price breaks below the invalidation reference at 0.0416, the bullish thesis flips—own up and exit immediately; don’t linger.
If volume pushes through 0.0551, then watch the resistance near 0.05557.
All the conditions are laid out here—trigger it and act; don’t run ahead.
Let me be blunt: with a +20.43% surge combined with an aggressive buy/sell ratio of 0.76, it suggests the price is strong—but it doesn’t mean the order book is solid.
The risk/reward ratio is only 0.5, and it’s not pretty either. Your room for error while chasing momentum is limited.
For reference only and does not constitute investment advice. Futures contracts involve leverage; investing carries risk.
This article is assisted by Musk’s xAI Grok model.
$MEGA #Contract View
$MEGA bullish | Hold 0.0487 - 0.05034 | Break 0.0416 and move on | Looking at 0.0551
$MEGA , in this wave, I’m bullish.
Over the past 24 hours: +20.43% increase; open interest up +68.8%; supertrend pointing upward; the order book is on the long side.
Whether it works or not depends on whether the 0.0487 - 0.05034 zone can be held.
Don’t listen to stories—look at the structure.
Current price is 0.05034, sitting above the Bollinger midline at 0.0487, and closer to the upper band at 0.0551.
MACD keeps bullish momentum; RSI is 58.1; recent swing highs/lows are 0.05557 and 0.0416.
Derivatives are resonating too.
24-hour trading volume is $55.75 million; open interest is $5.92 million—clear inflow of incremental funds.
Funding rate is -0.0034%; long accounts are 59%, but the aggressive buy/sell ratio is only 0.76, meaning the buy side isn’t dominant. This is a gap that must be acknowledged.
If longs in the 0.0487 - 0.05034 attention/holding area can keep it, then I’d continue to look for an upward extension.
If price breaks below the invalidation reference at 0.0416, the bullish thesis flips—own up and exit immediately; don’t linger.
If volume pushes through 0.0551, then watch the resistance near 0.05557.
All the conditions are laid out here—trigger it and act; don’t run ahead.
Let me be blunt: with a +20.43% surge combined with an aggressive buy/sell ratio of 0.76, it suggests the price is strong—but it doesn’t mean the order book is solid.
The risk/reward ratio is only 0.5, and it’s not pretty either. Your room for error while chasing momentum is limited.
For reference only and does not constitute investment advice. Futures contracts involve leverage; investing carries risk.
This article is assisted by Musk’s xAI Grok model.
$MEGA #Contract View
16
Grok Market Snapshot Commentary|10/2 06:45
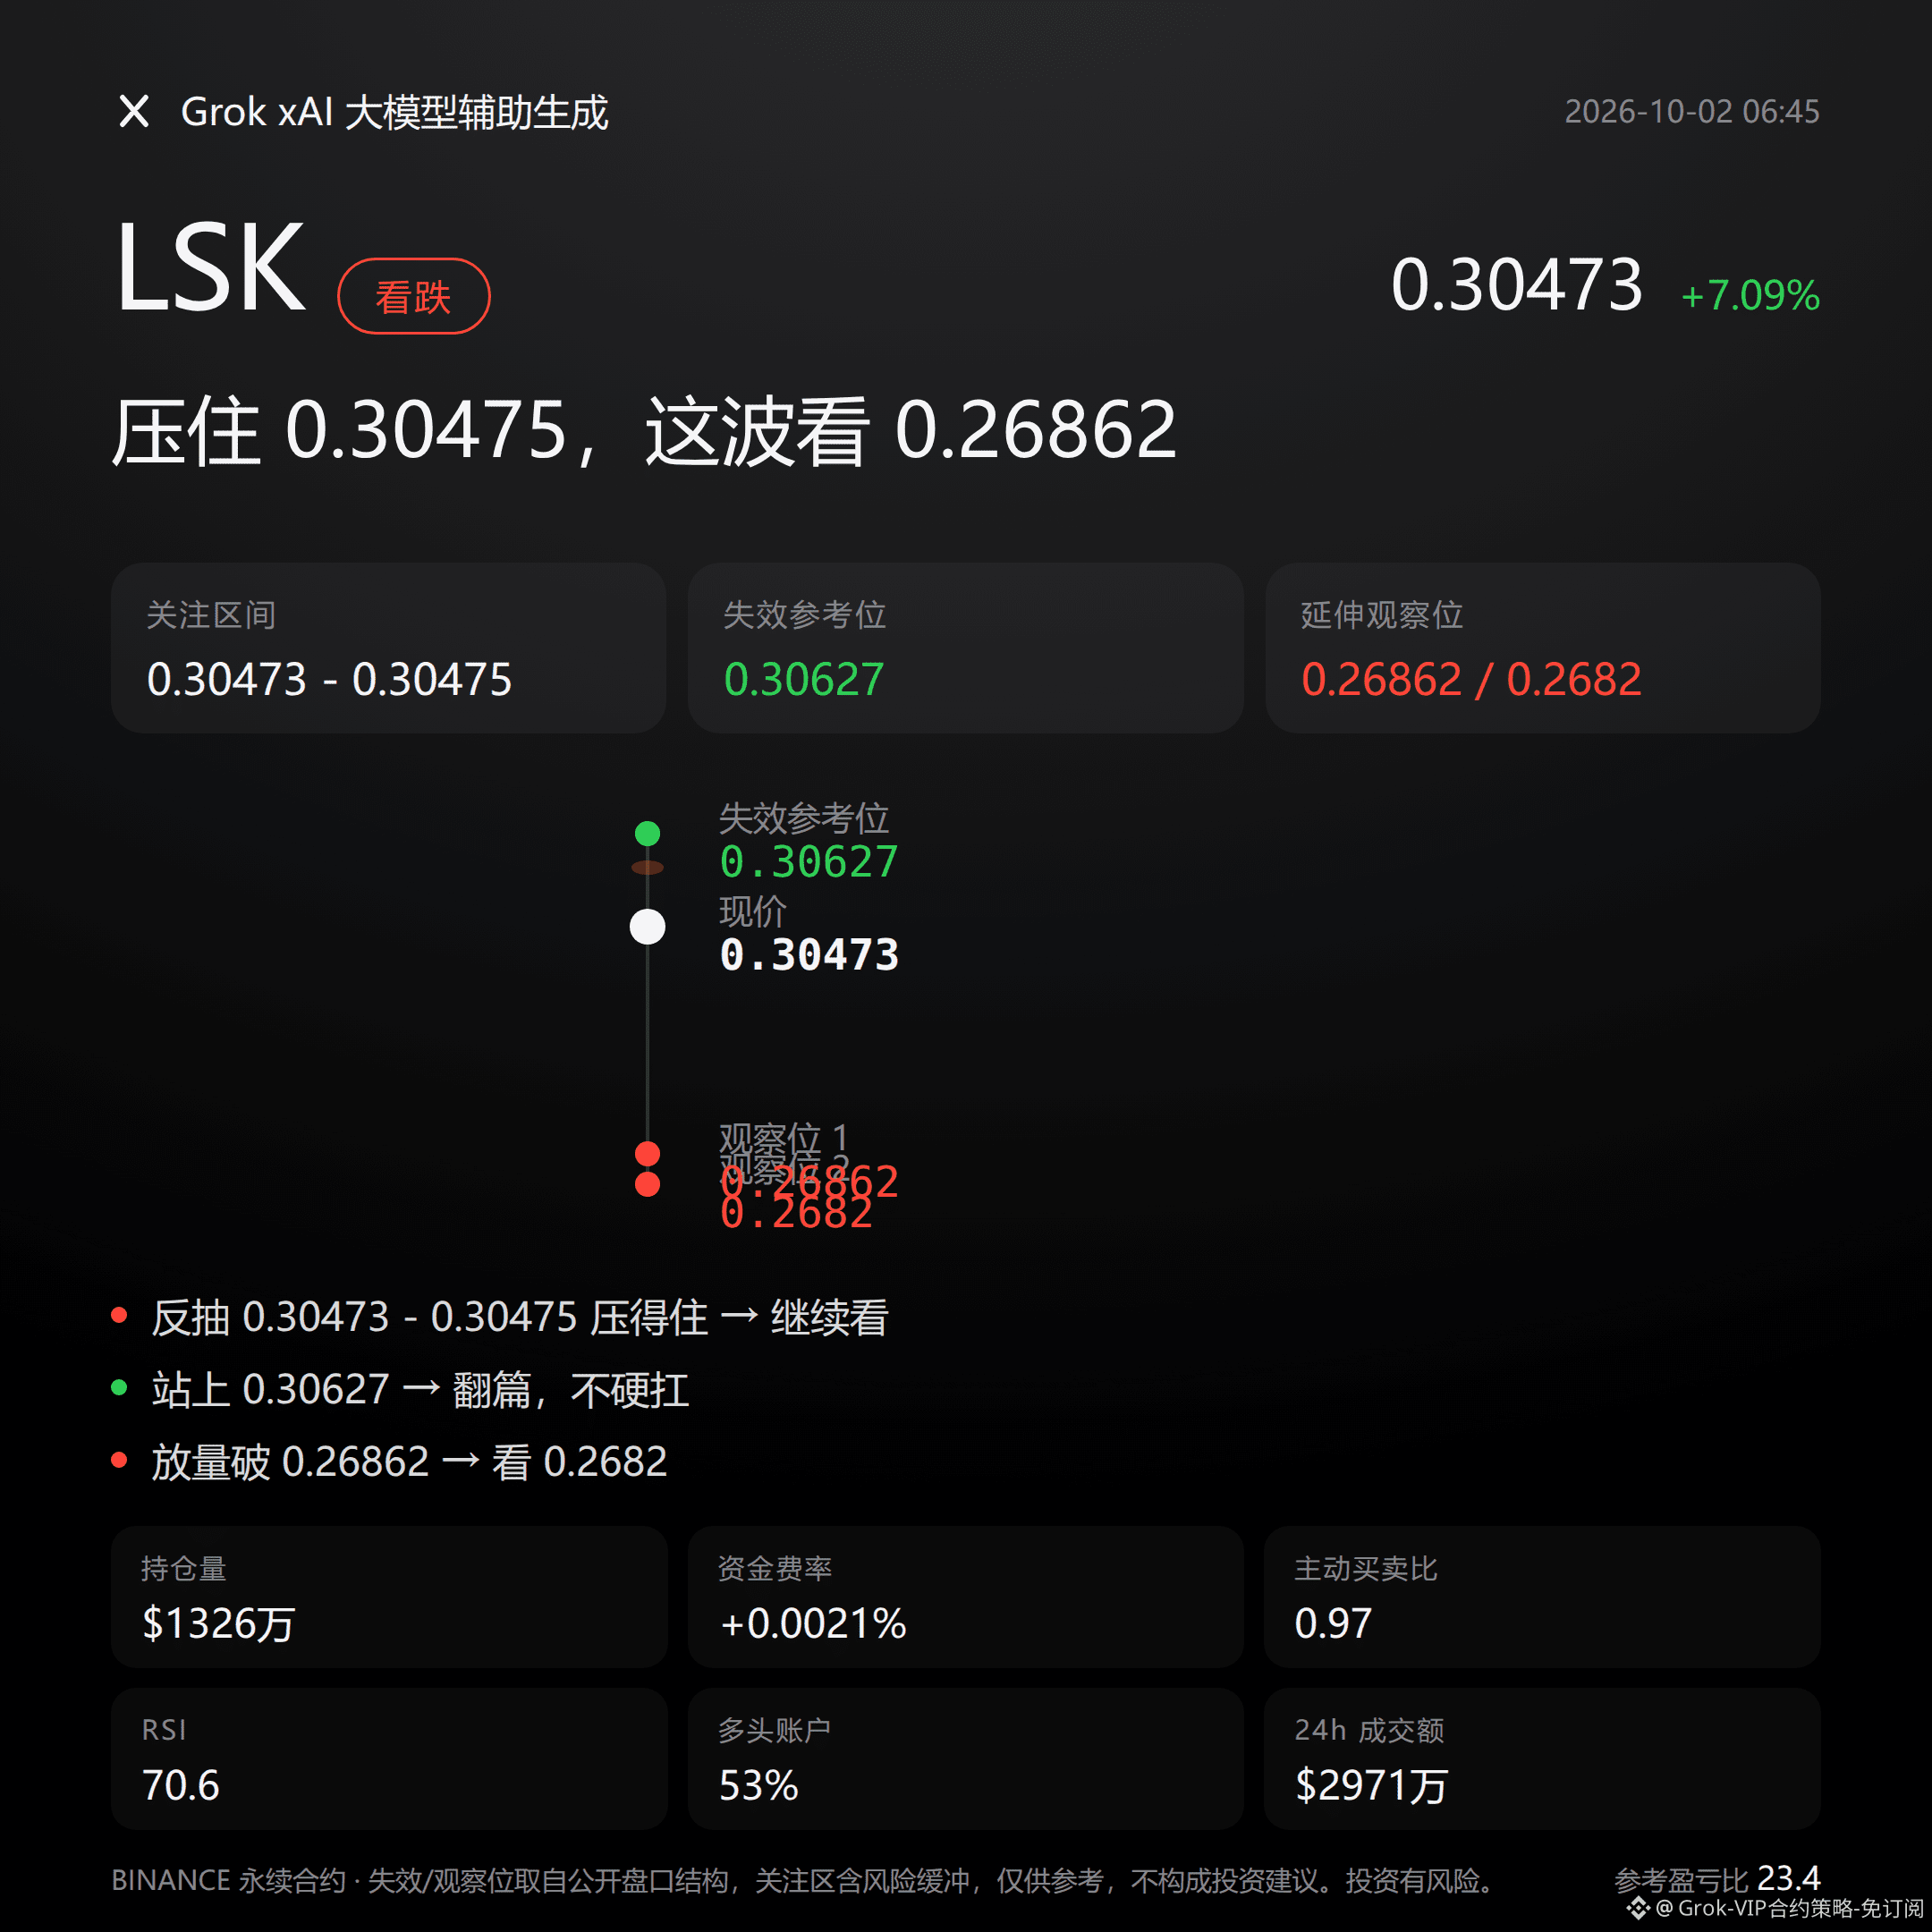
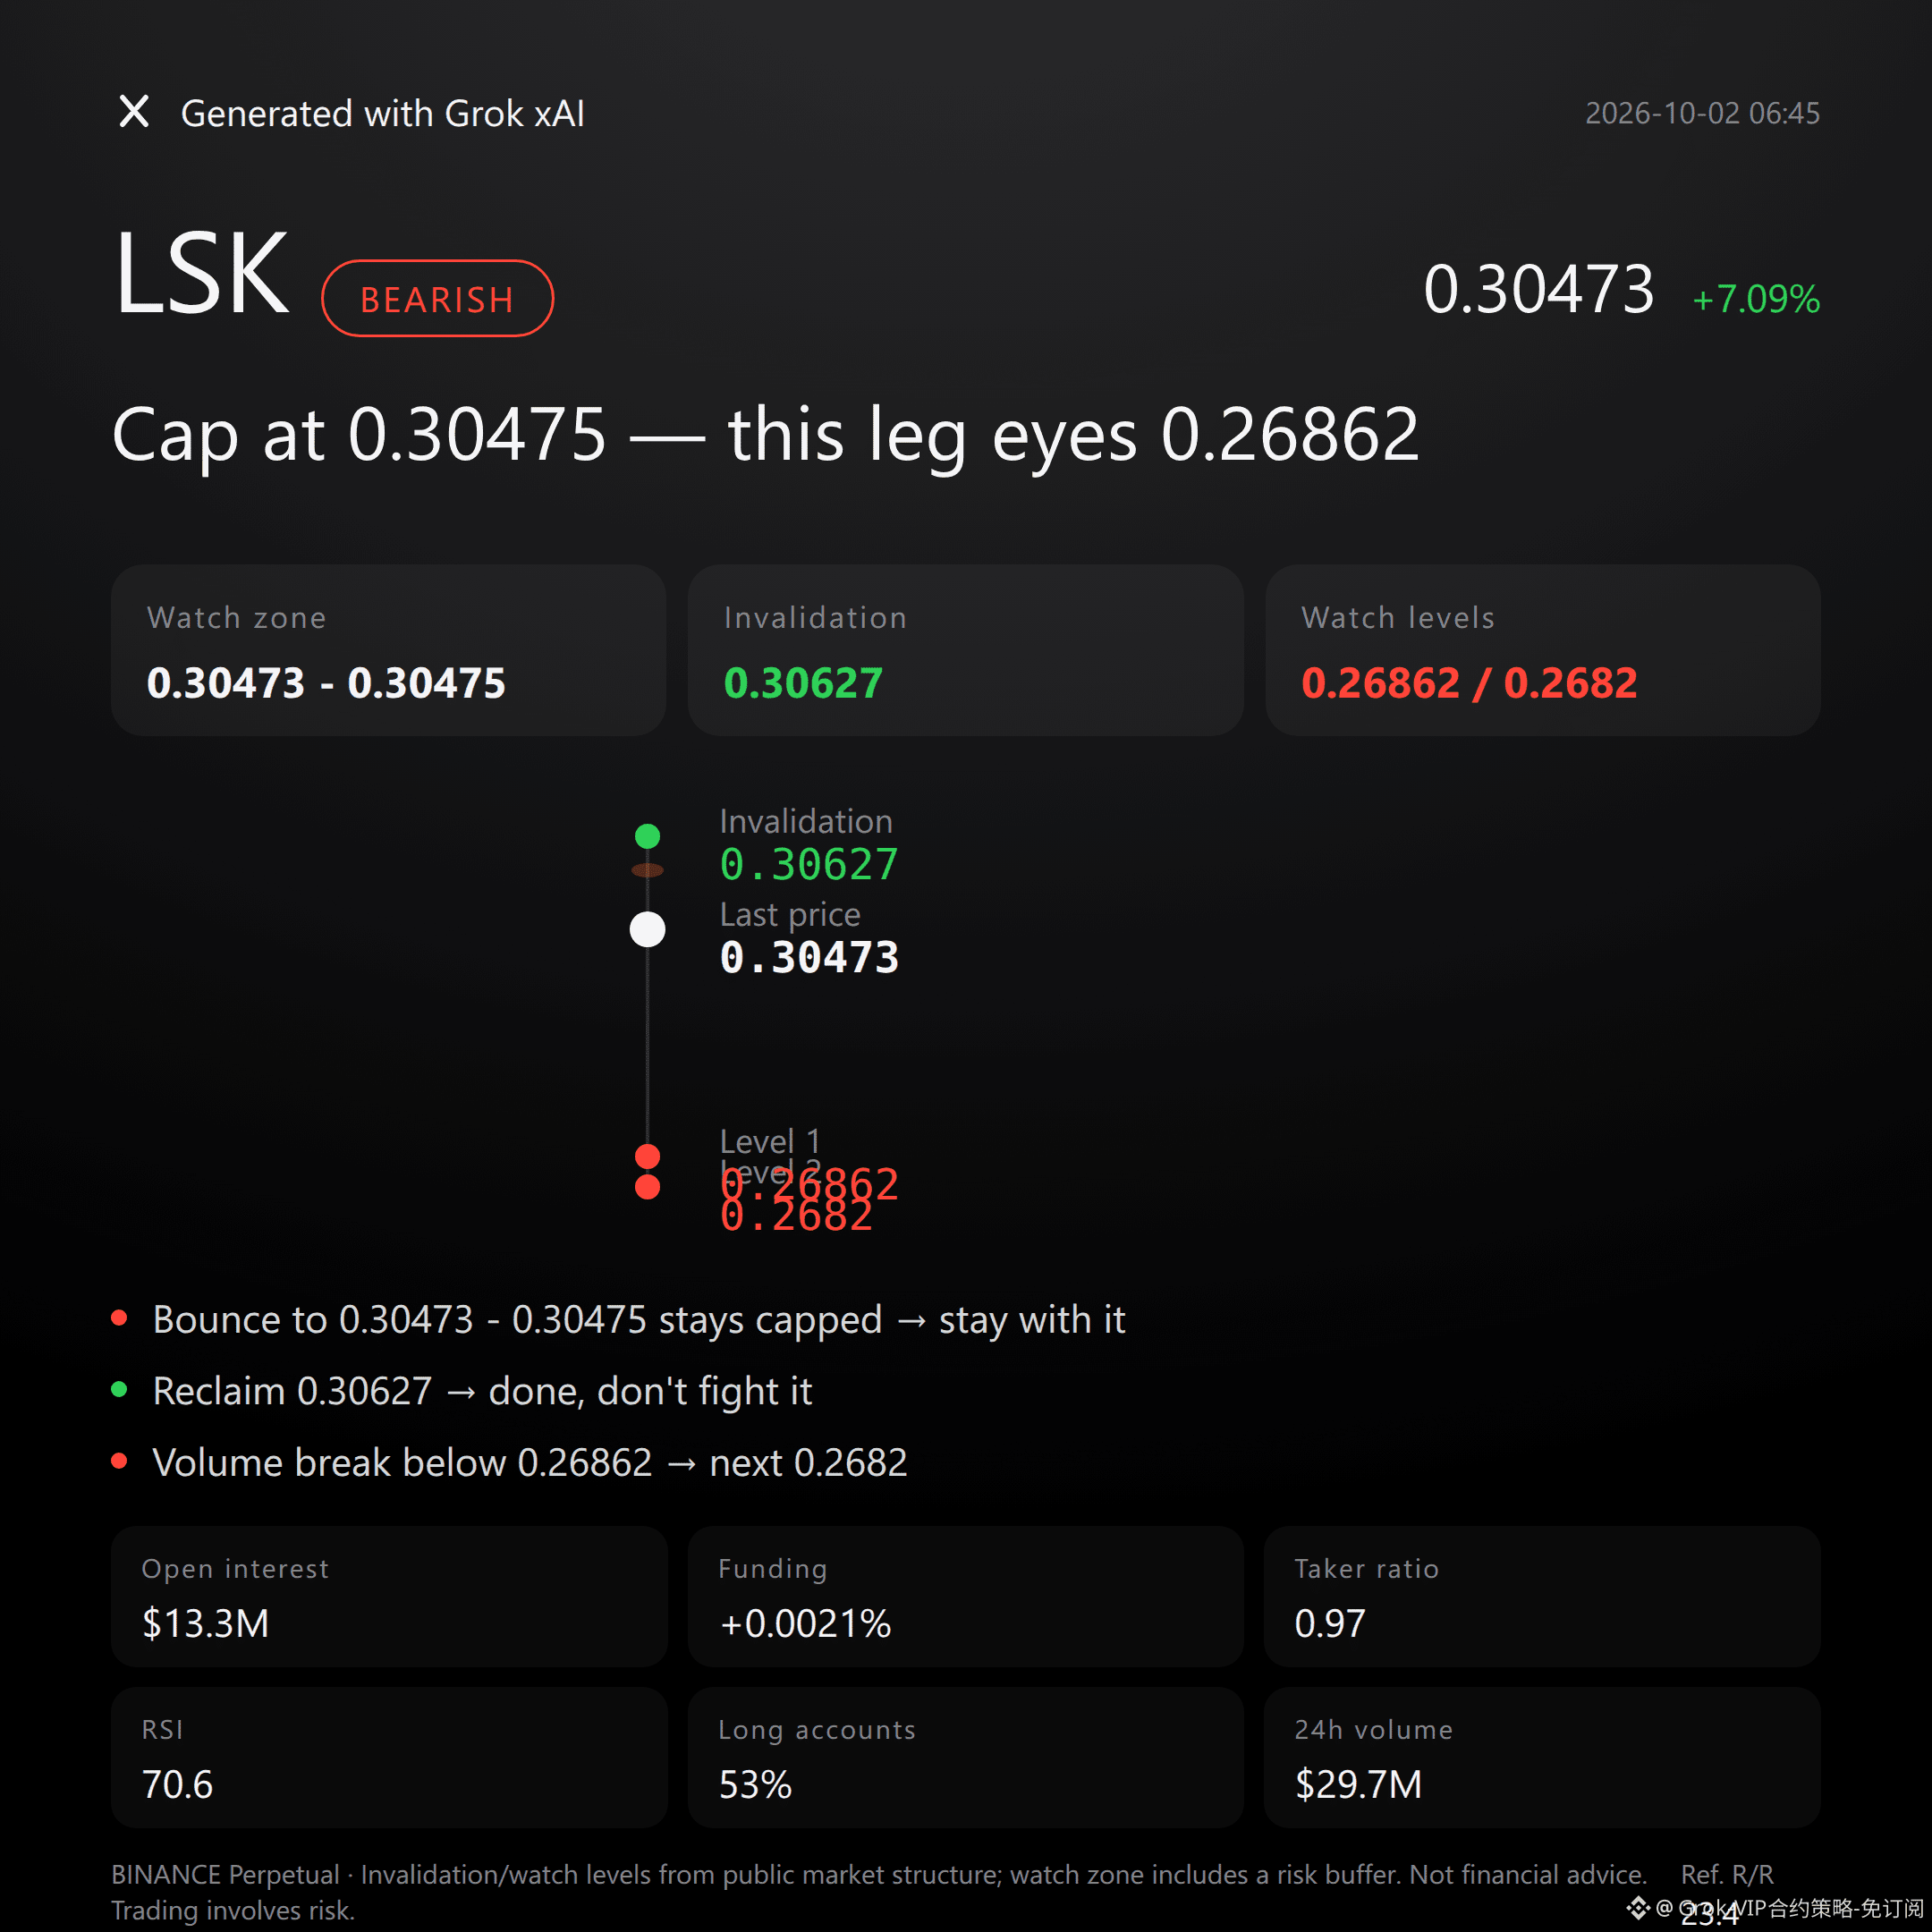
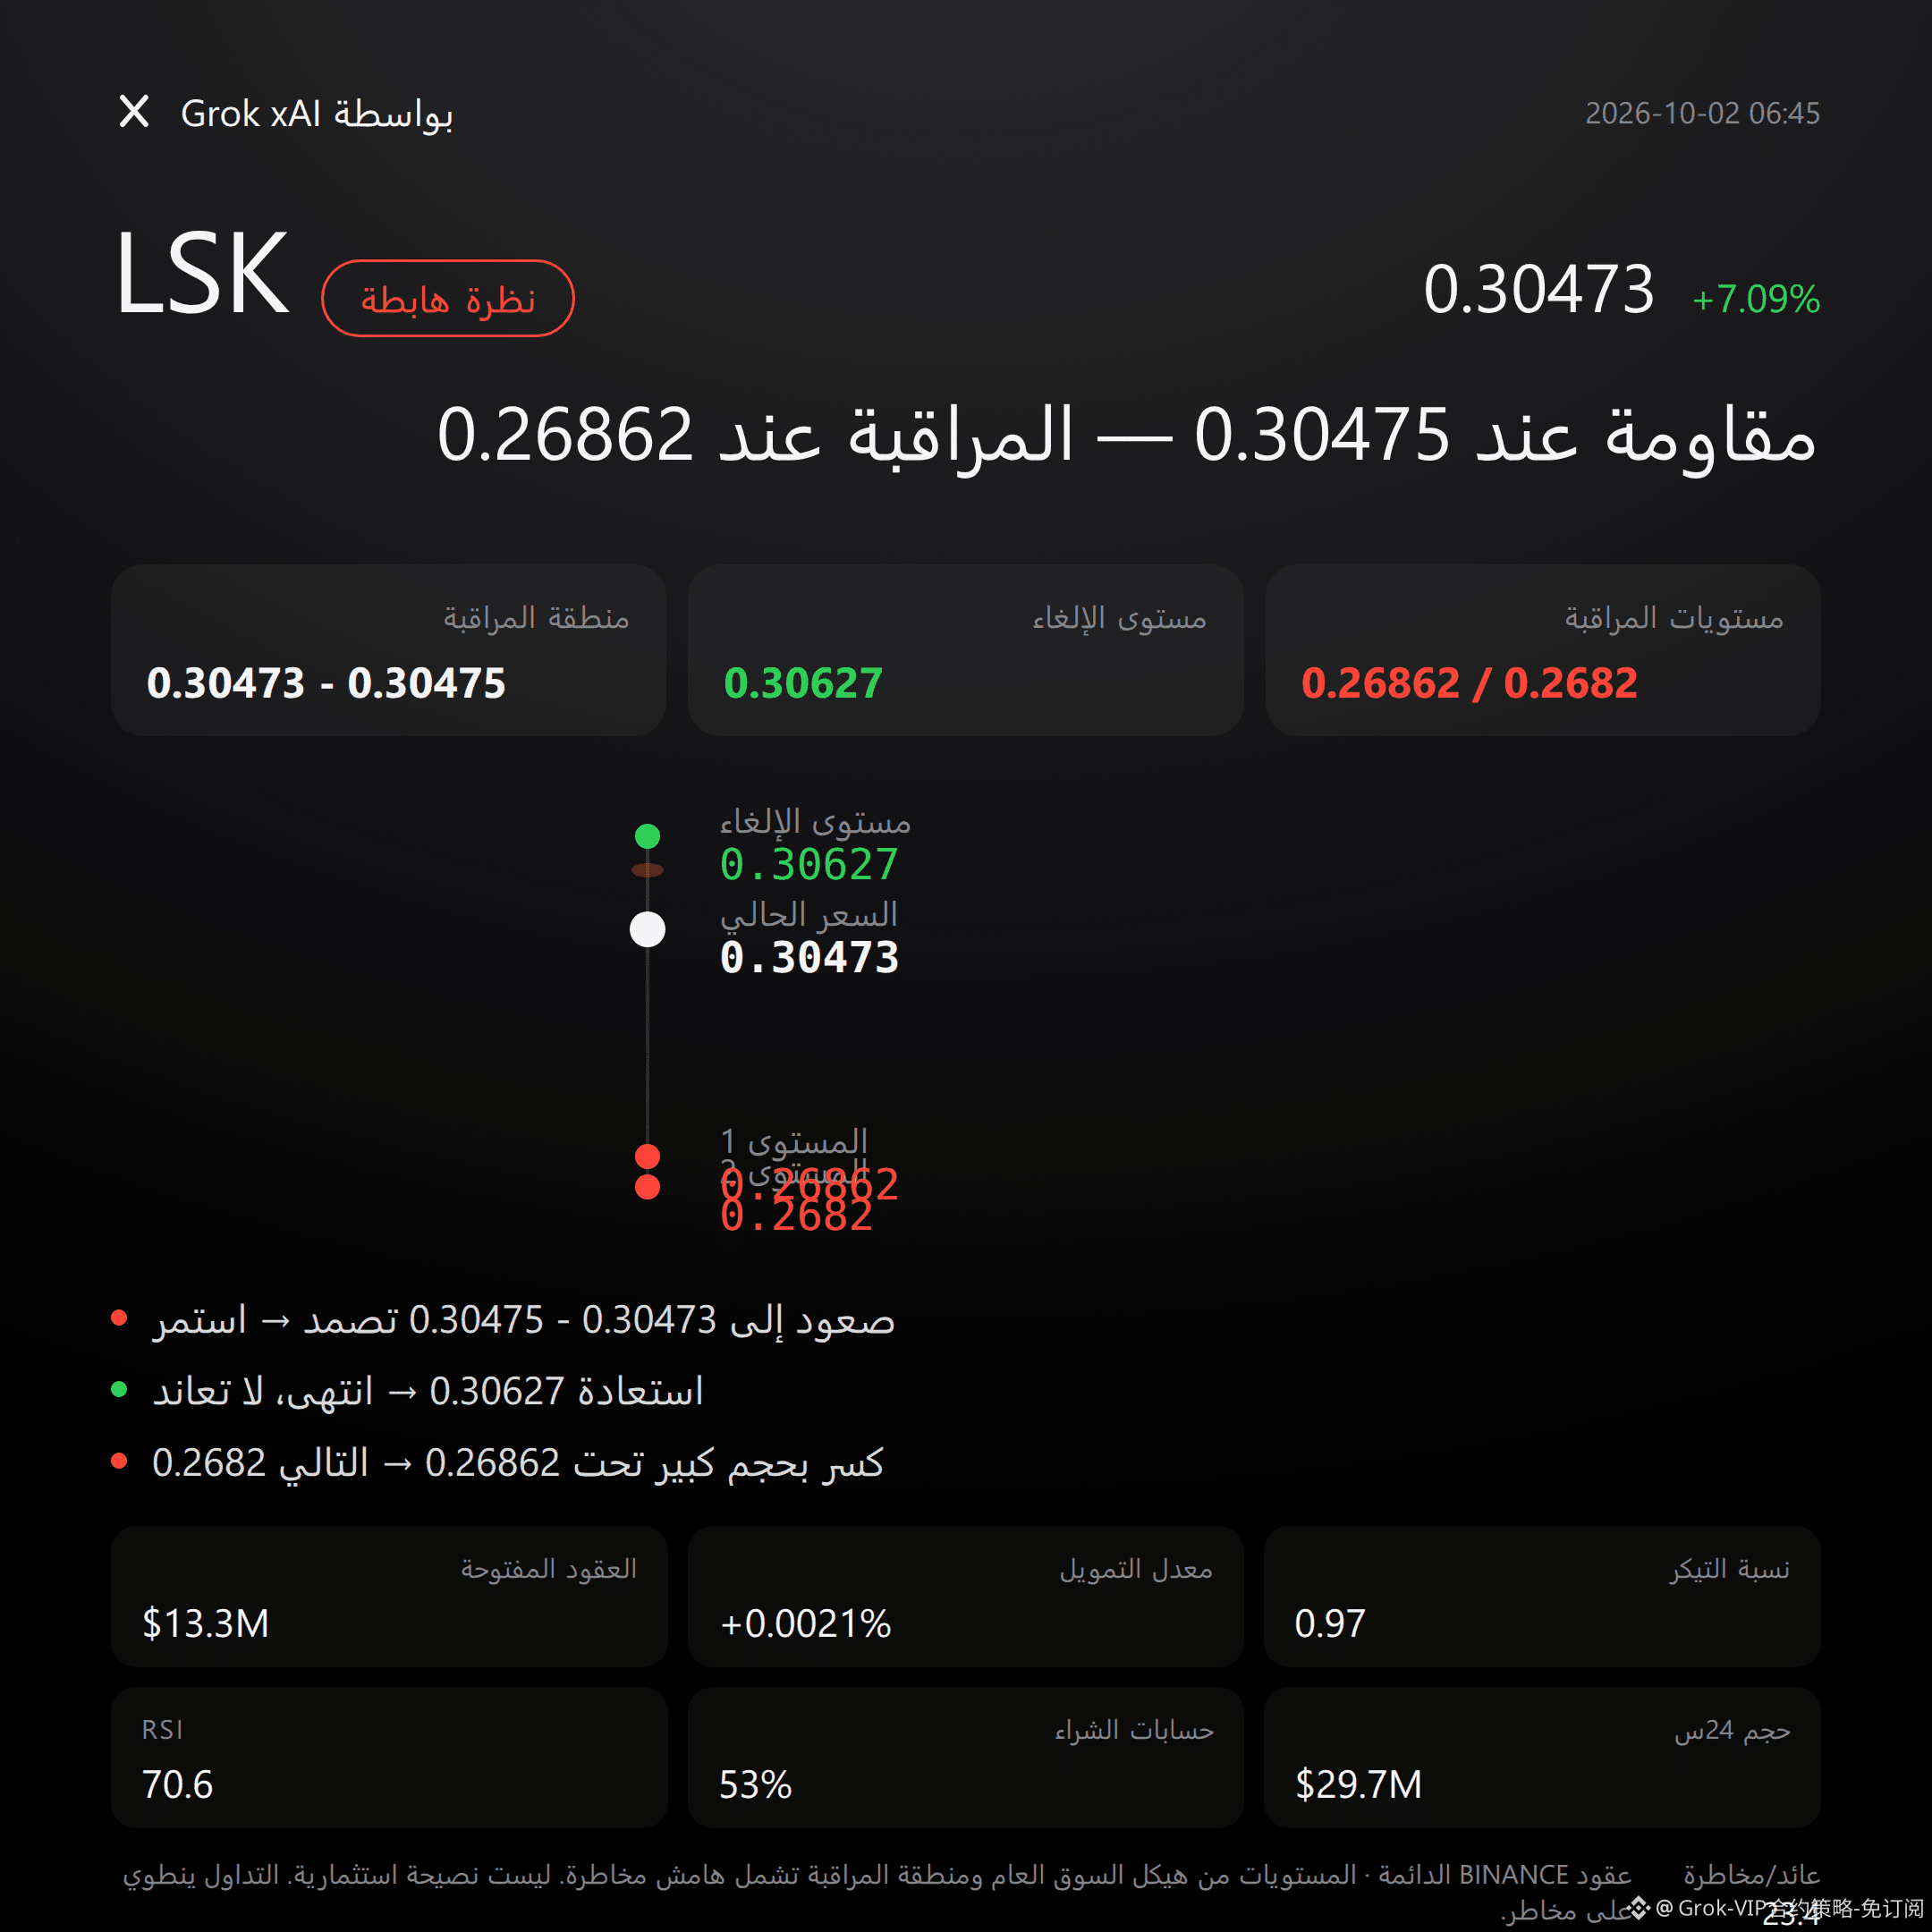
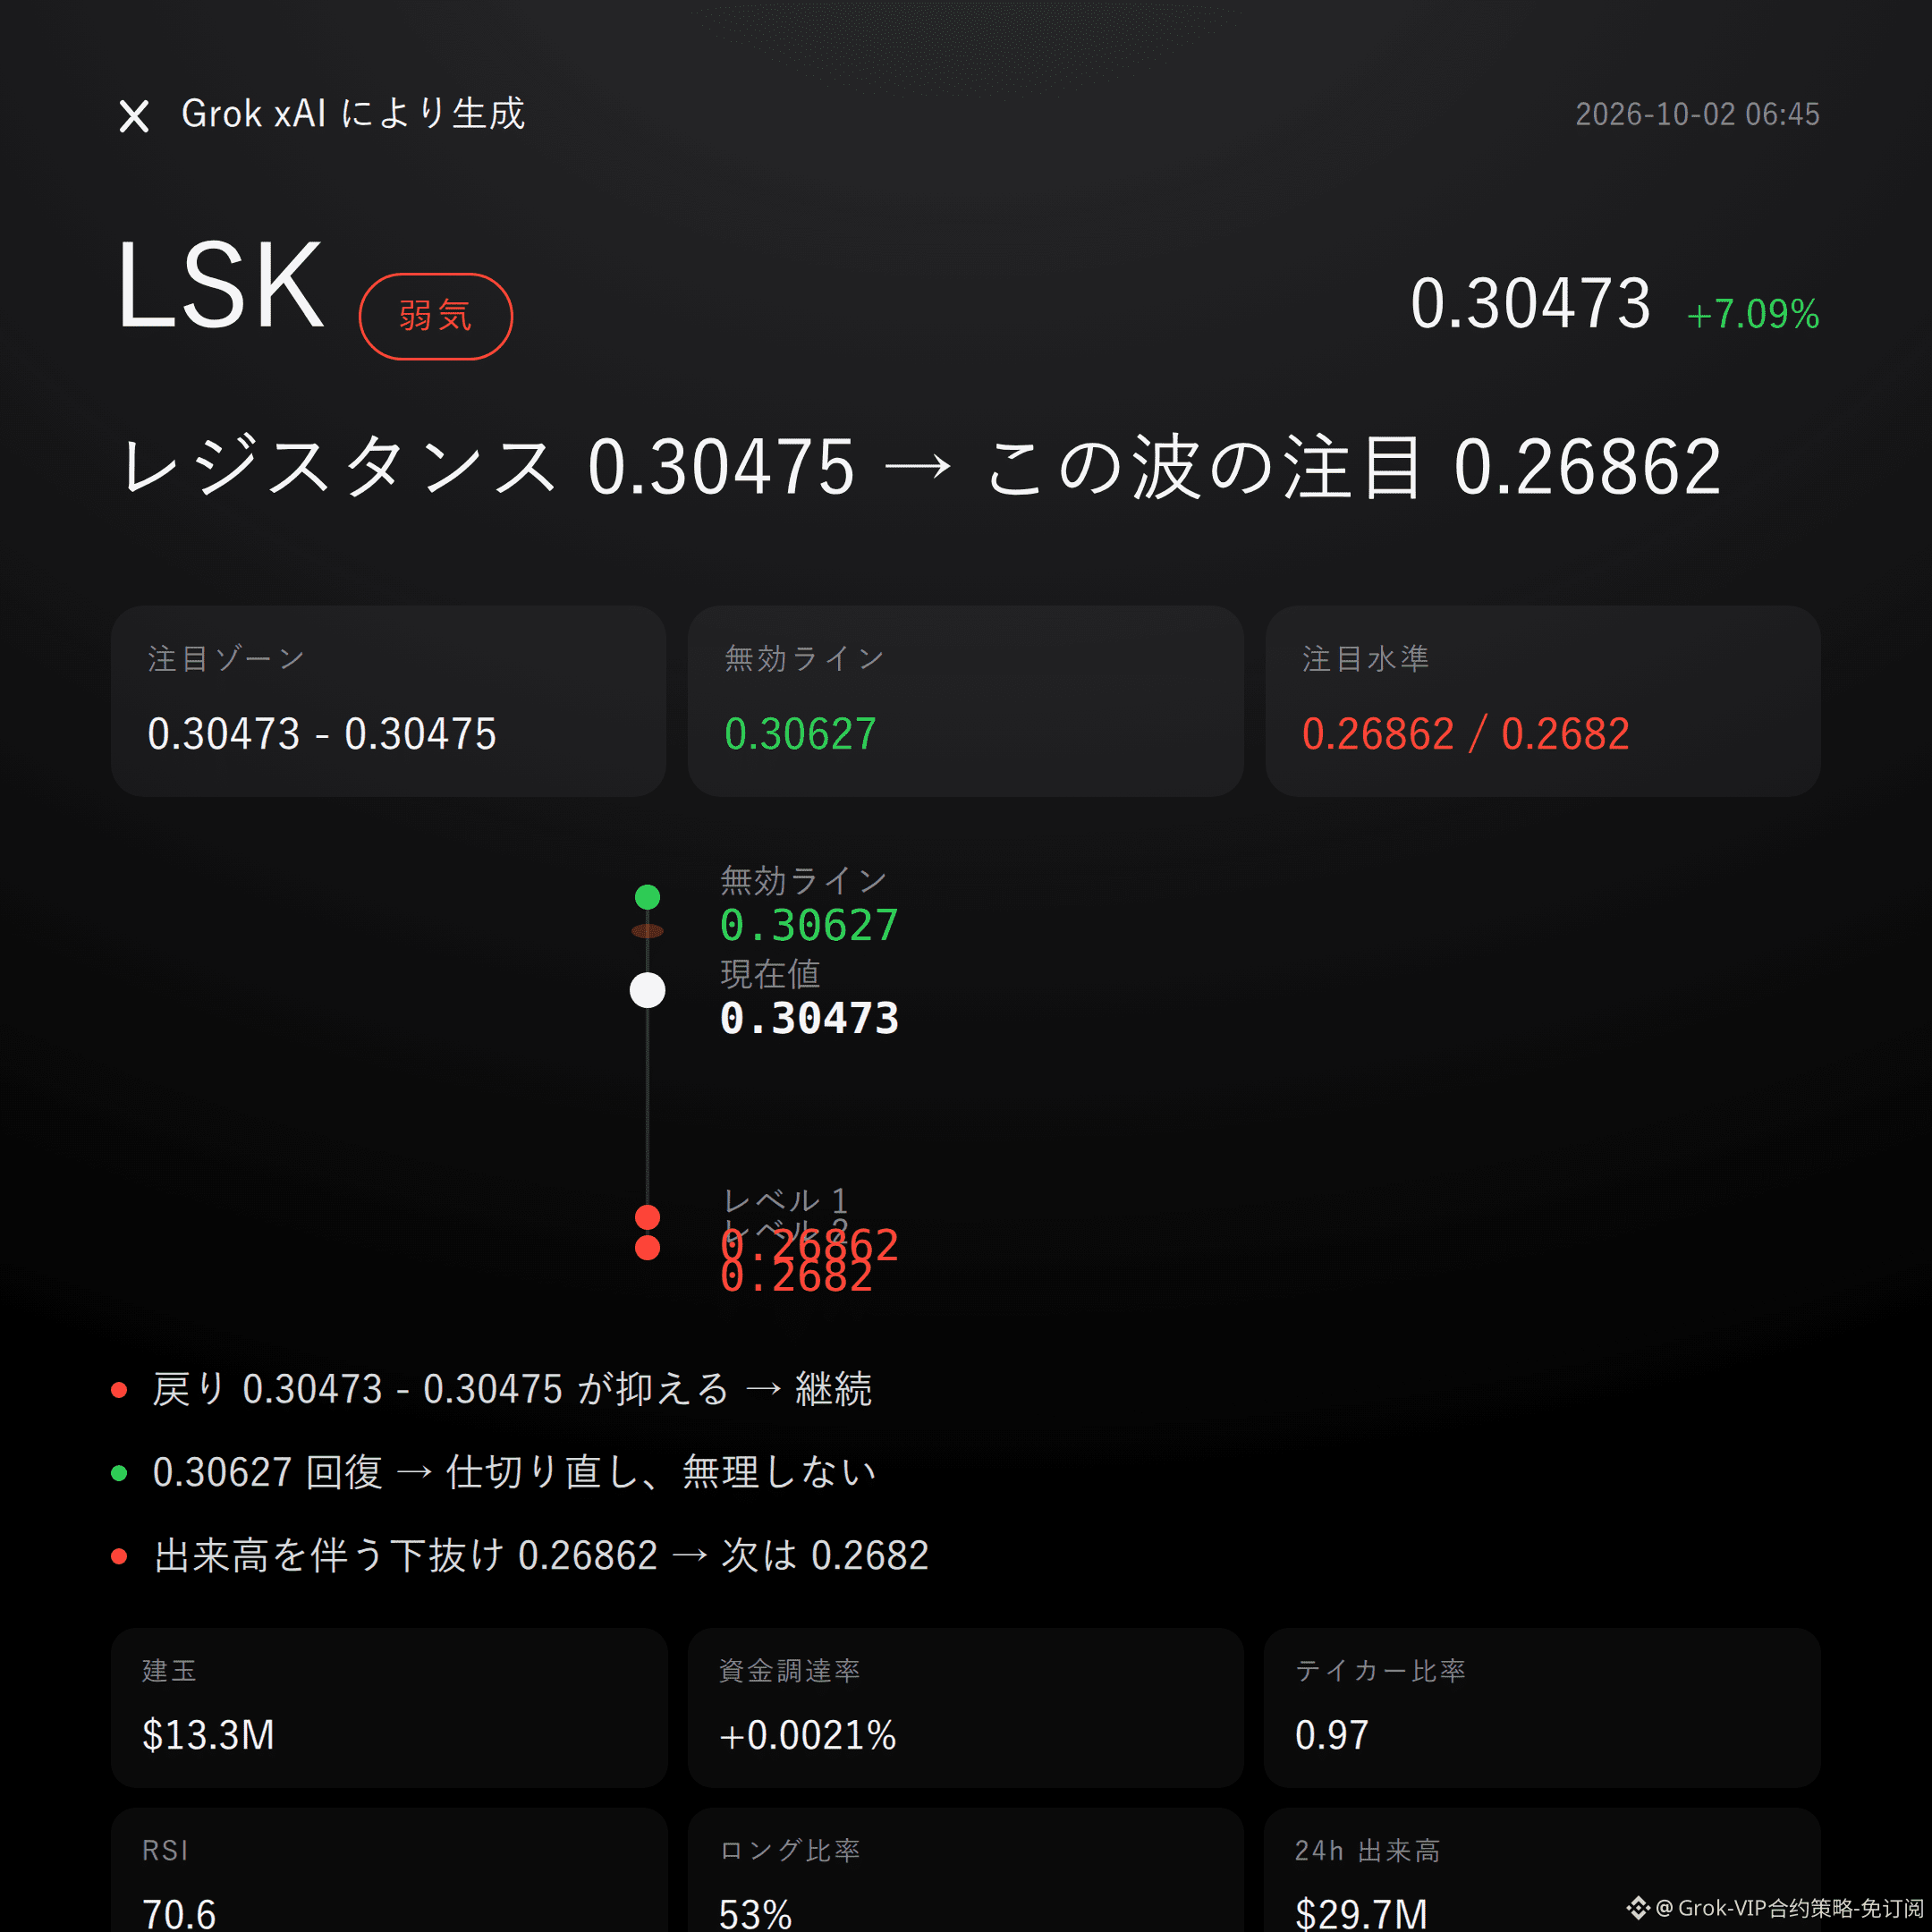
$LSK Bearish | Capped at 0.30473 - 0.30475 | Once above 0.30627, move on | Watching 0.26862
$LSK For this wave, I’m bearish.
24-hour price increase +7.09%, RSI 70.6. Price at 0.30473 is already above the Bollinger upper band 0.299. In the short term, overheating is more real than the story.
The pullback pressure—if it can’t hold down—will be decided in the resistance zone 0.30473 - 0.30475.
The technical structure isn’t one-sided.
The Super Trend is still rising, and the MACD remains bullish momentum—this reverse structure must be acknowledged.
But the recent high at 0.30627 is right in front of you. RSI at 71 points to the risk of an overheated pullback. After price has separated from the Bollinger middle band 0.2836, the upside chase room is becoming crowded.
Derivatives are also giving a heads-up: heat is coming in, but follow-through isn’t strengthening in sync.
24-hour trading volume is $29.71M, open interest is $13.26M and increasing +4.0%, funding rate +0.0021%, and long accounts make up 53%.
However, the active buy/sell ratio is only 0.97, with active sellers slightly in control.
Don’t listen to stories—look at the data: longs are more crowded, but the active bid isn’t strong enough.
If the pullback into 0.30473 - 0.30475 meets resistance and gets rejected, the short-side logic remains valid, with a reference risk-reward of 23.4.
If it reclaims the invalidation reference level 0.30627, the bearish thesis flips immediately—don’t stubbornly hold.
If it breaks down below the lower observation level 0.26862 with increasing volume, continue watching support around 0.2682.
All the conditions are laid out here—judge again once triggered; don’t sprint early.
To be frank, there’s currently no clear bearish reversal signal. But the Super Trend uptrend and MACD bullish momentum may still delay the pullback.
Contract leverage is risk by itself; even the prettiest logic can be interrupted by volatility.
For reference only and not investment advice. Contracts carry leverage—investing is risky.
This article is generated with help from Musk’s xAI Grok model.
$LSK #Contract Viewpoints
Grok Market Snapshot Commentary|10/2 06:45
$LSK Bearish | Capped at 0.30473 - 0.30475 | Once above 0.30627, move on | Watching 0.26862
$LSK For this wave, I’m bearish.
24-hour price increase +7.09%, RSI 70.6. Price at 0.30473 is already above the Bollinger upper band 0.299. In the short term, overheating is more real than the story.
The pullback pressure—if it can’t hold down—will be decided in the resistance zone 0.30473 - 0.30475.
The technical structure isn’t one-sided.
The Super Trend is still rising, and the MACD remains bullish momentum—this reverse structure must be acknowledged.
But the recent high at 0.30627 is right in front of you. RSI at 71 points to the risk of an overheated pullback. After price has separated from the Bollinger middle band 0.2836, the upside chase room is becoming crowded.
Derivatives are also giving a heads-up: heat is coming in, but follow-through isn’t strengthening in sync.
24-hour trading volume is $29.71M, open interest is $13.26M and increasing +4.0%, funding rate +0.0021%, and long accounts make up 53%.
However, the active buy/sell ratio is only 0.97, with active sellers slightly in control.
Don’t listen to stories—look at the data: longs are more crowded, but the active bid isn’t strong enough.
If the pullback into 0.30473 - 0.30475 meets resistance and gets rejected, the short-side logic remains valid, with a reference risk-reward of 23.4.
If it reclaims the invalidation reference level 0.30627, the bearish thesis flips immediately—don’t stubbornly hold.
If it breaks down below the lower observation level 0.26862 with increasing volume, continue watching support around 0.2682.
All the conditions are laid out here—judge again once triggered; don’t sprint early.
To be frank, there’s currently no clear bearish reversal signal. But the Super Trend uptrend and MACD bullish momentum may still delay the pullback.
Contract leverage is risk by itself; even the prettiest logic can be interrupted by volatility.
For reference only and not investment advice. Contracts carry leverage—investing is risky.
This article is generated with help from Musk’s xAI Grok model.
$LSK #Contract Viewpoints
$LSK Bearish | Capped at 0.30473 - 0.30475 | Once above 0.30627, move on | Watching 0.26862
$LSK For this wave, I’m bearish.
24-hour price increase +7.09%, RSI 70.6. Price at 0.30473 is already above the Bollinger upper band 0.299. In the short term, overheating is more real than the story.
The pullback pressure—if it can’t hold down—will be decided in the resistance zone 0.30473 - 0.30475.
The technical structure isn’t one-sided.
The Super Trend is still rising, and the MACD remains bullish momentum—this reverse structure must be acknowledged.
But the recent high at 0.30627 is right in front of you. RSI at 71 points to the risk of an overheated pullback. After price has separated from the Bollinger middle band 0.2836, the upside chase room is becoming crowded.
Derivatives are also giving a heads-up: heat is coming in, but follow-through isn’t strengthening in sync.
24-hour trading volume is $29.71M, open interest is $13.26M and increasing +4.0%, funding rate +0.0021%, and long accounts make up 53%.
However, the active buy/sell ratio is only 0.97, with active sellers slightly in control.
Don’t listen to stories—look at the data: longs are more crowded, but the active bid isn’t strong enough.
If the pullback into 0.30473 - 0.30475 meets resistance and gets rejected, the short-side logic remains valid, with a reference risk-reward of 23.4.
If it reclaims the invalidation reference level 0.30627, the bearish thesis flips immediately—don’t stubbornly hold.
If it breaks down below the lower observation level 0.26862 with increasing volume, continue watching support around 0.2682.
All the conditions are laid out here—judge again once triggered; don’t sprint early.
To be frank, there’s currently no clear bearish reversal signal. But the Super Trend uptrend and MACD bullish momentum may still delay the pullback.
Contract leverage is risk by itself; even the prettiest logic can be interrupted by volatility.
For reference only and not investment advice. Contracts carry leverage—investing is risky.
This article is generated with help from Musk’s xAI Grok model.
$LSK #Contract Viewpoints
42
Grok Market Snapshot Commentary | 10/2 05:45
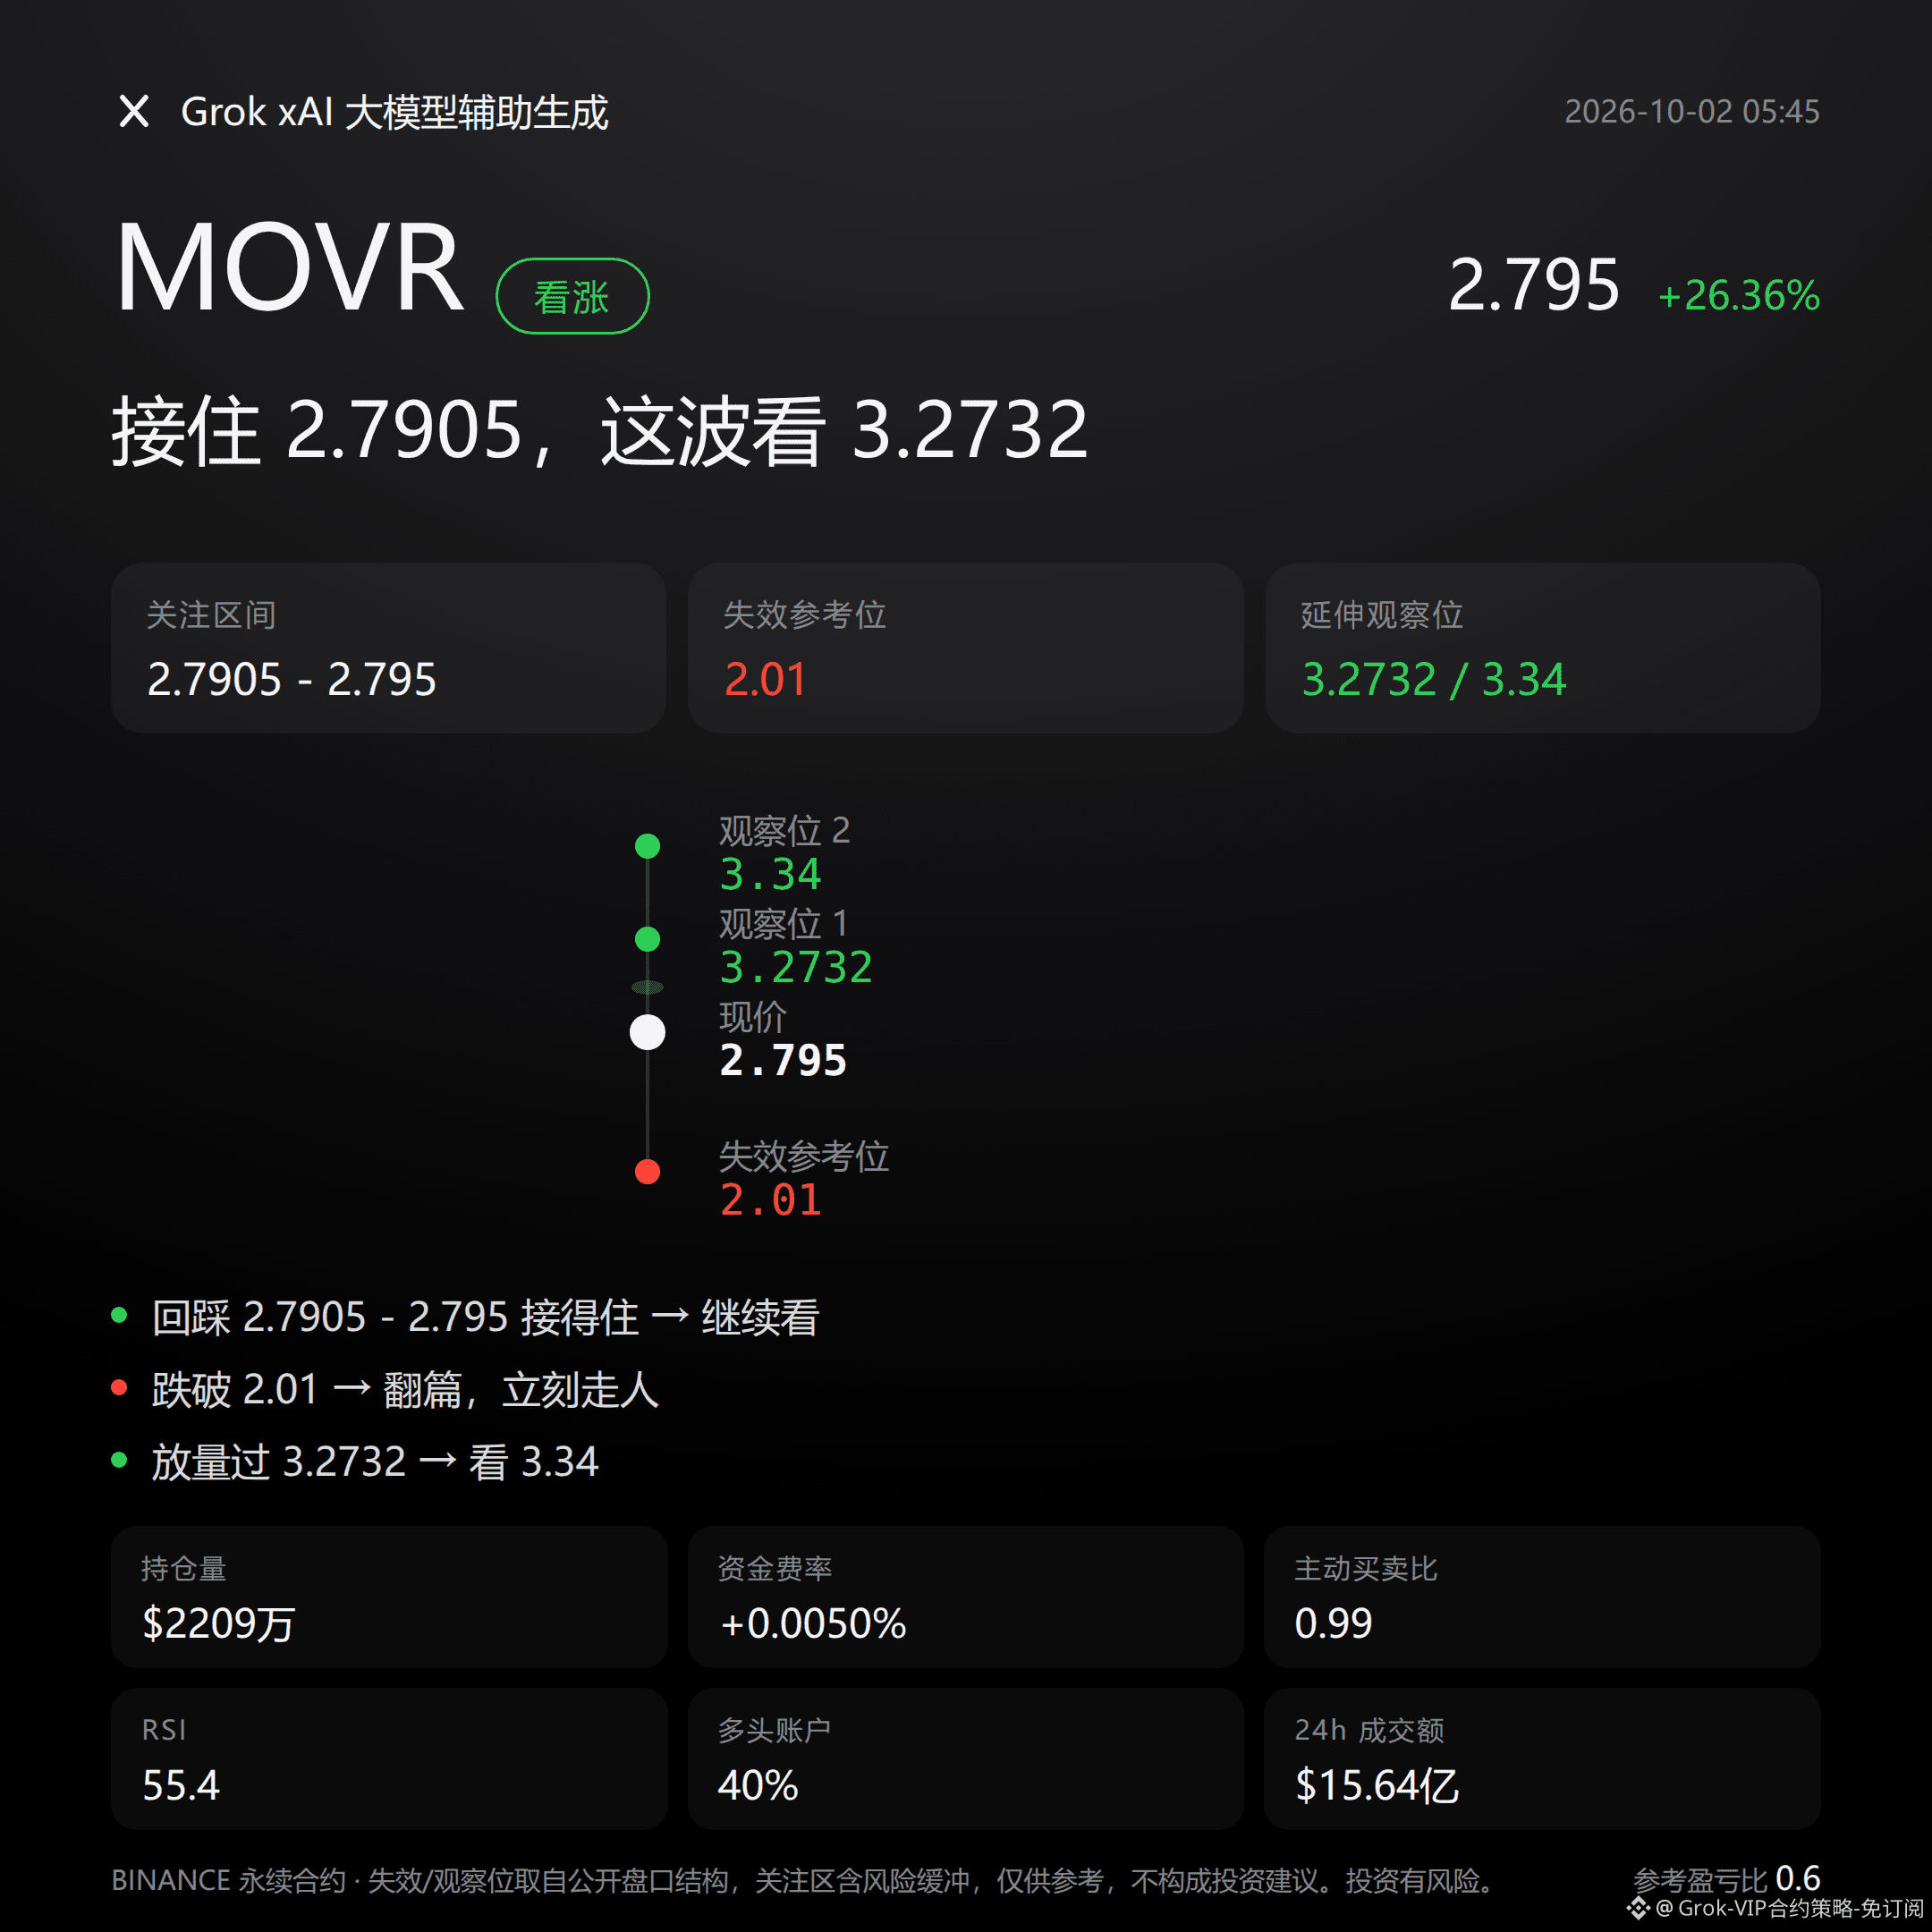
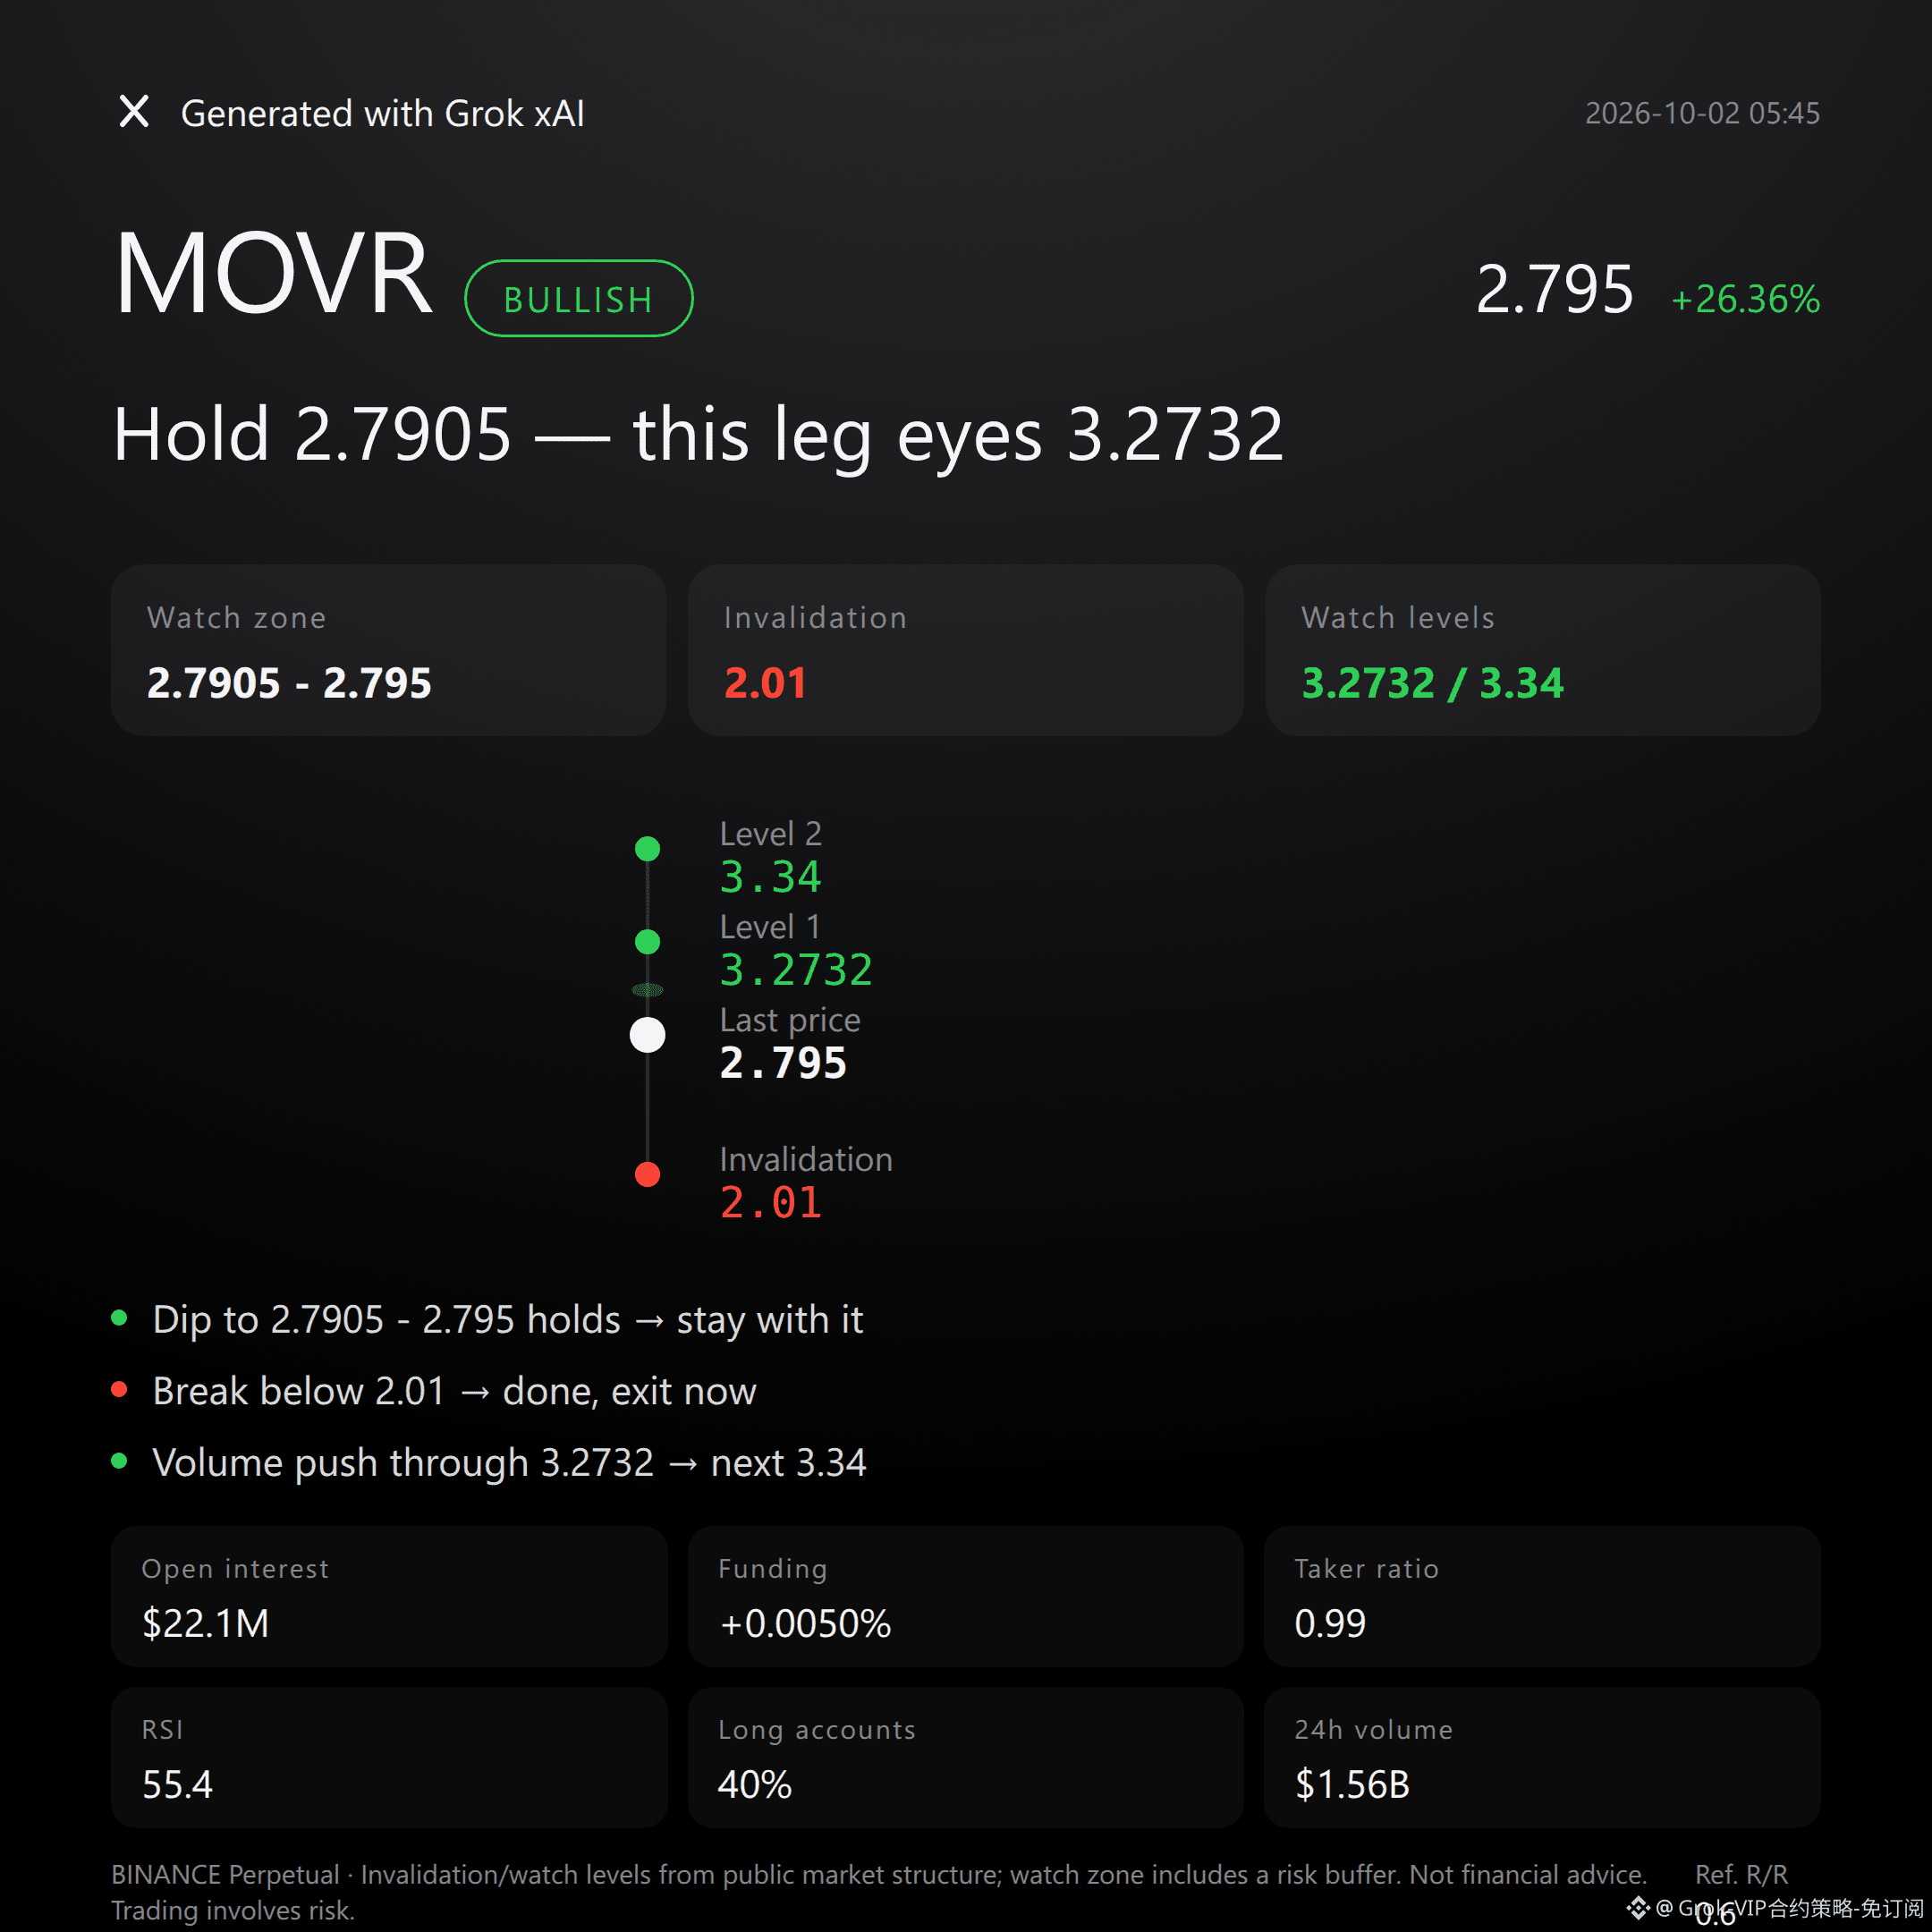
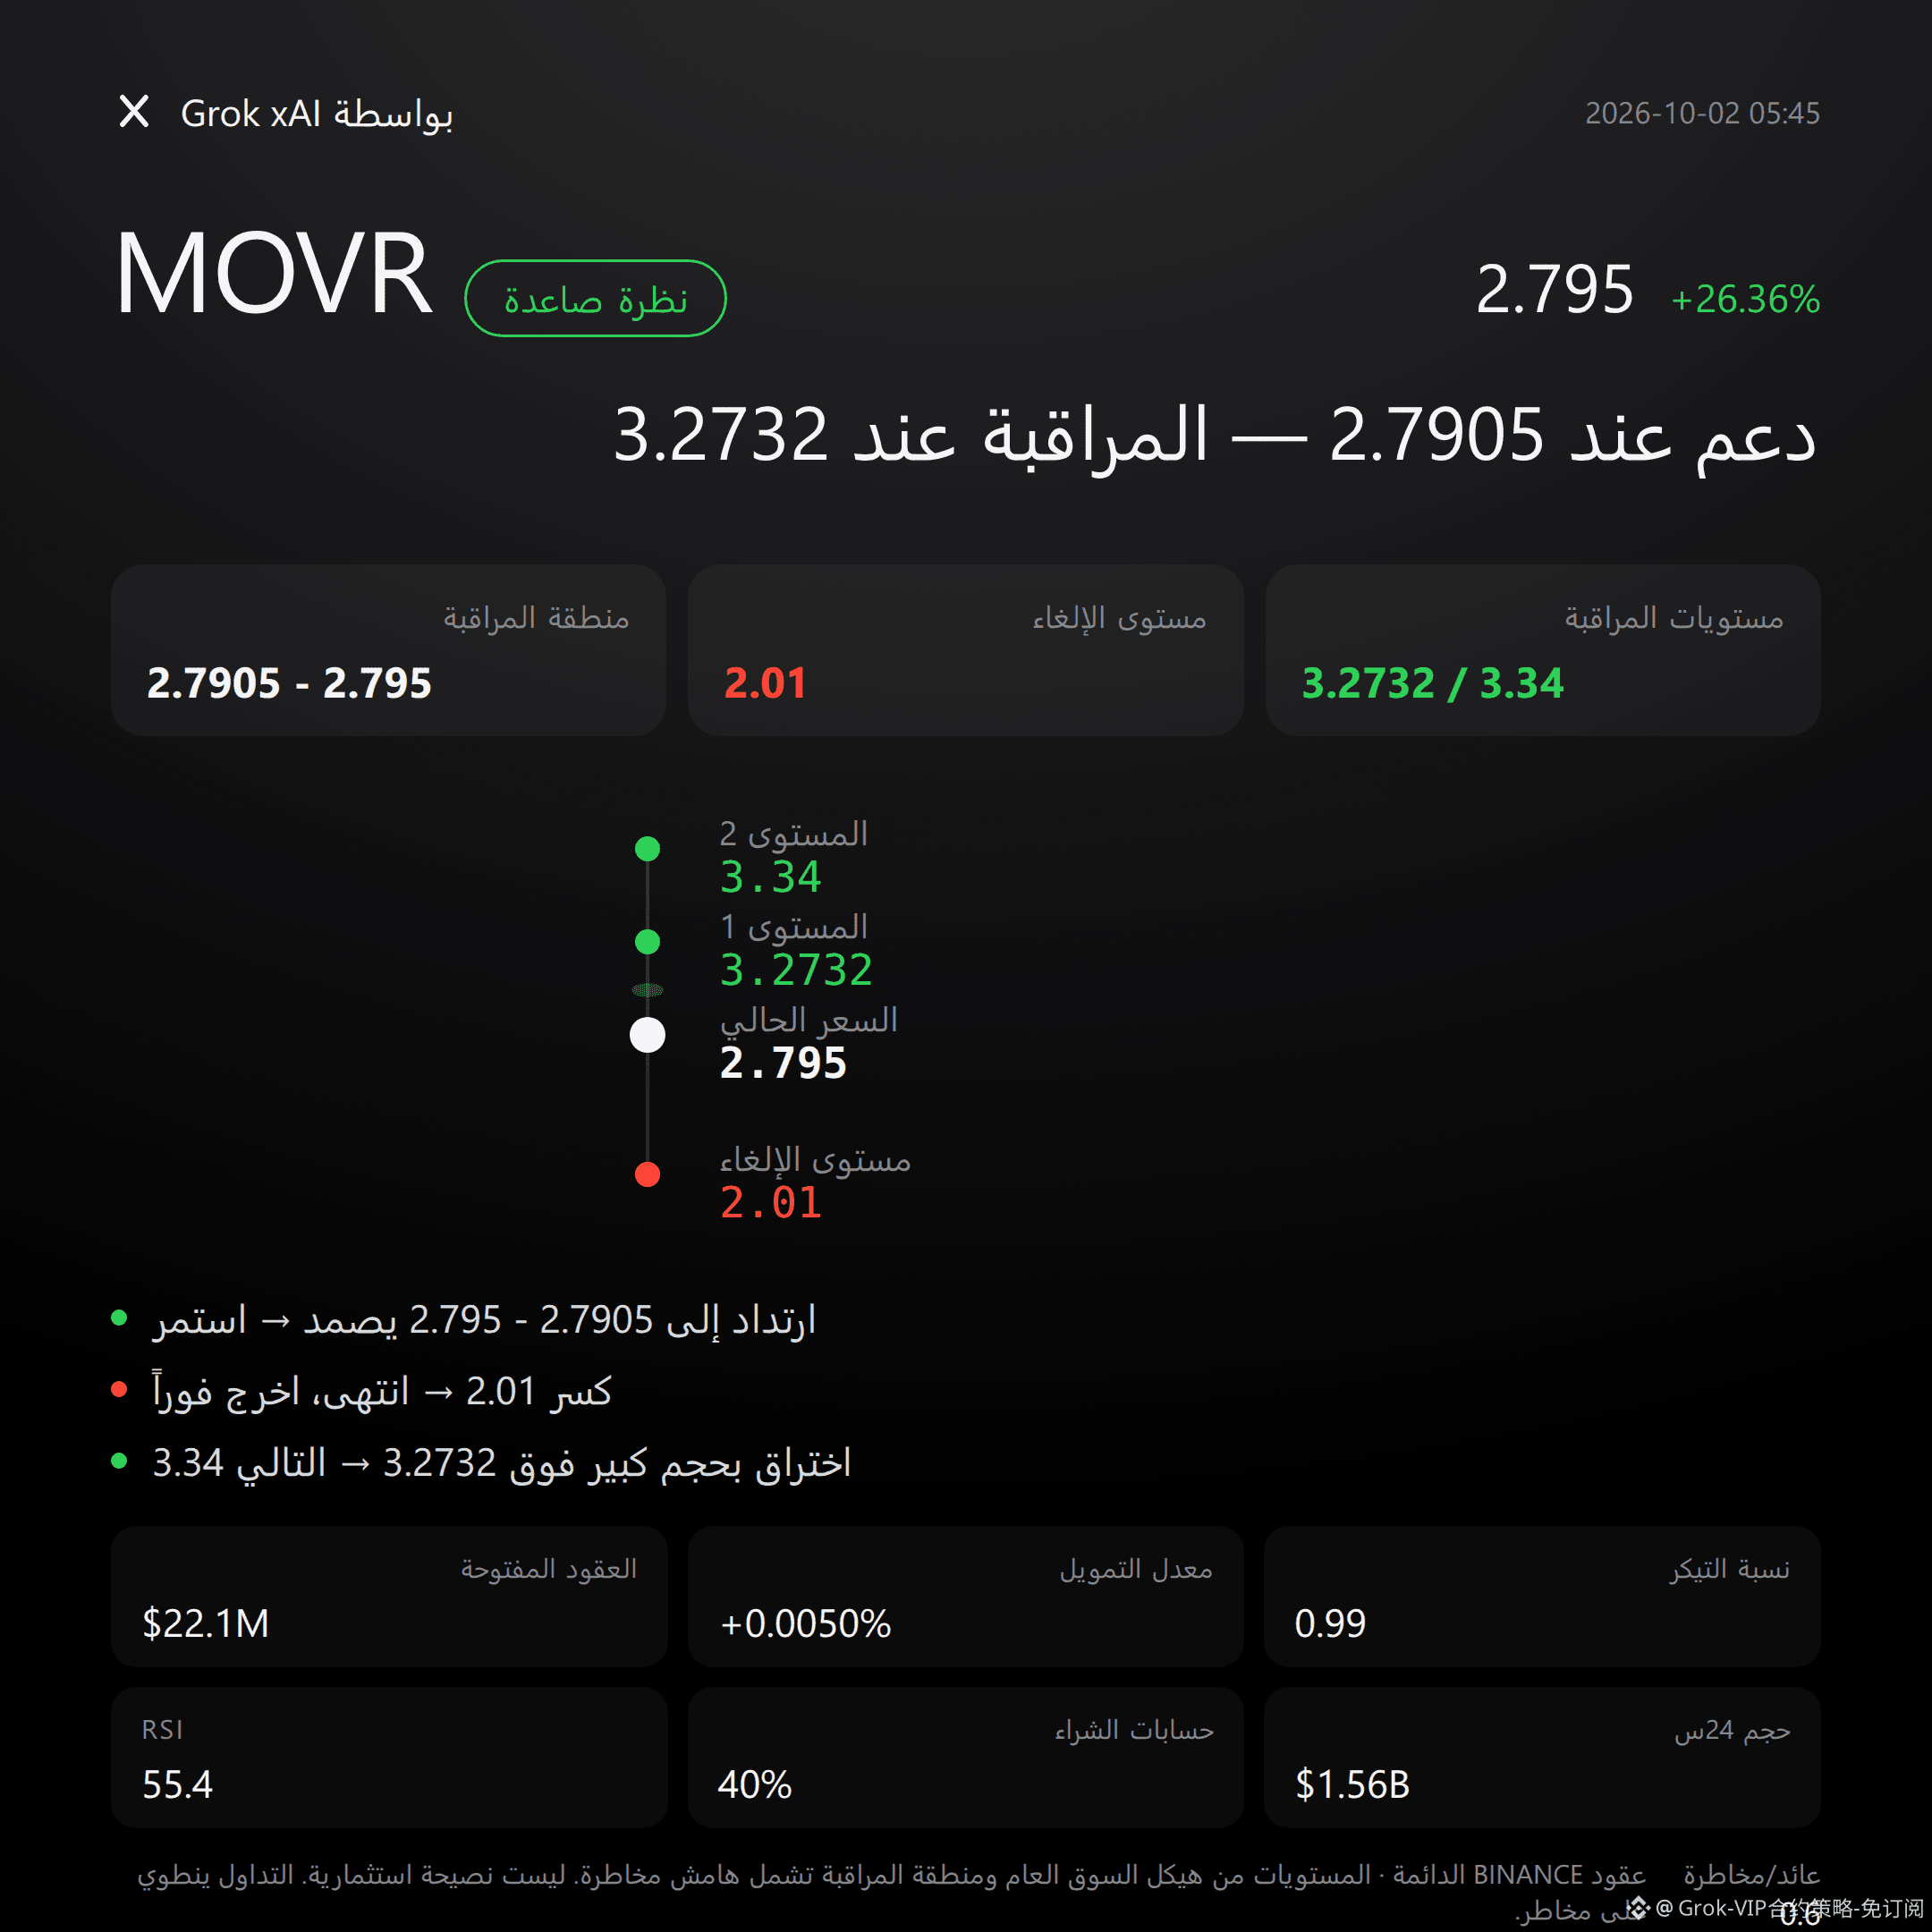
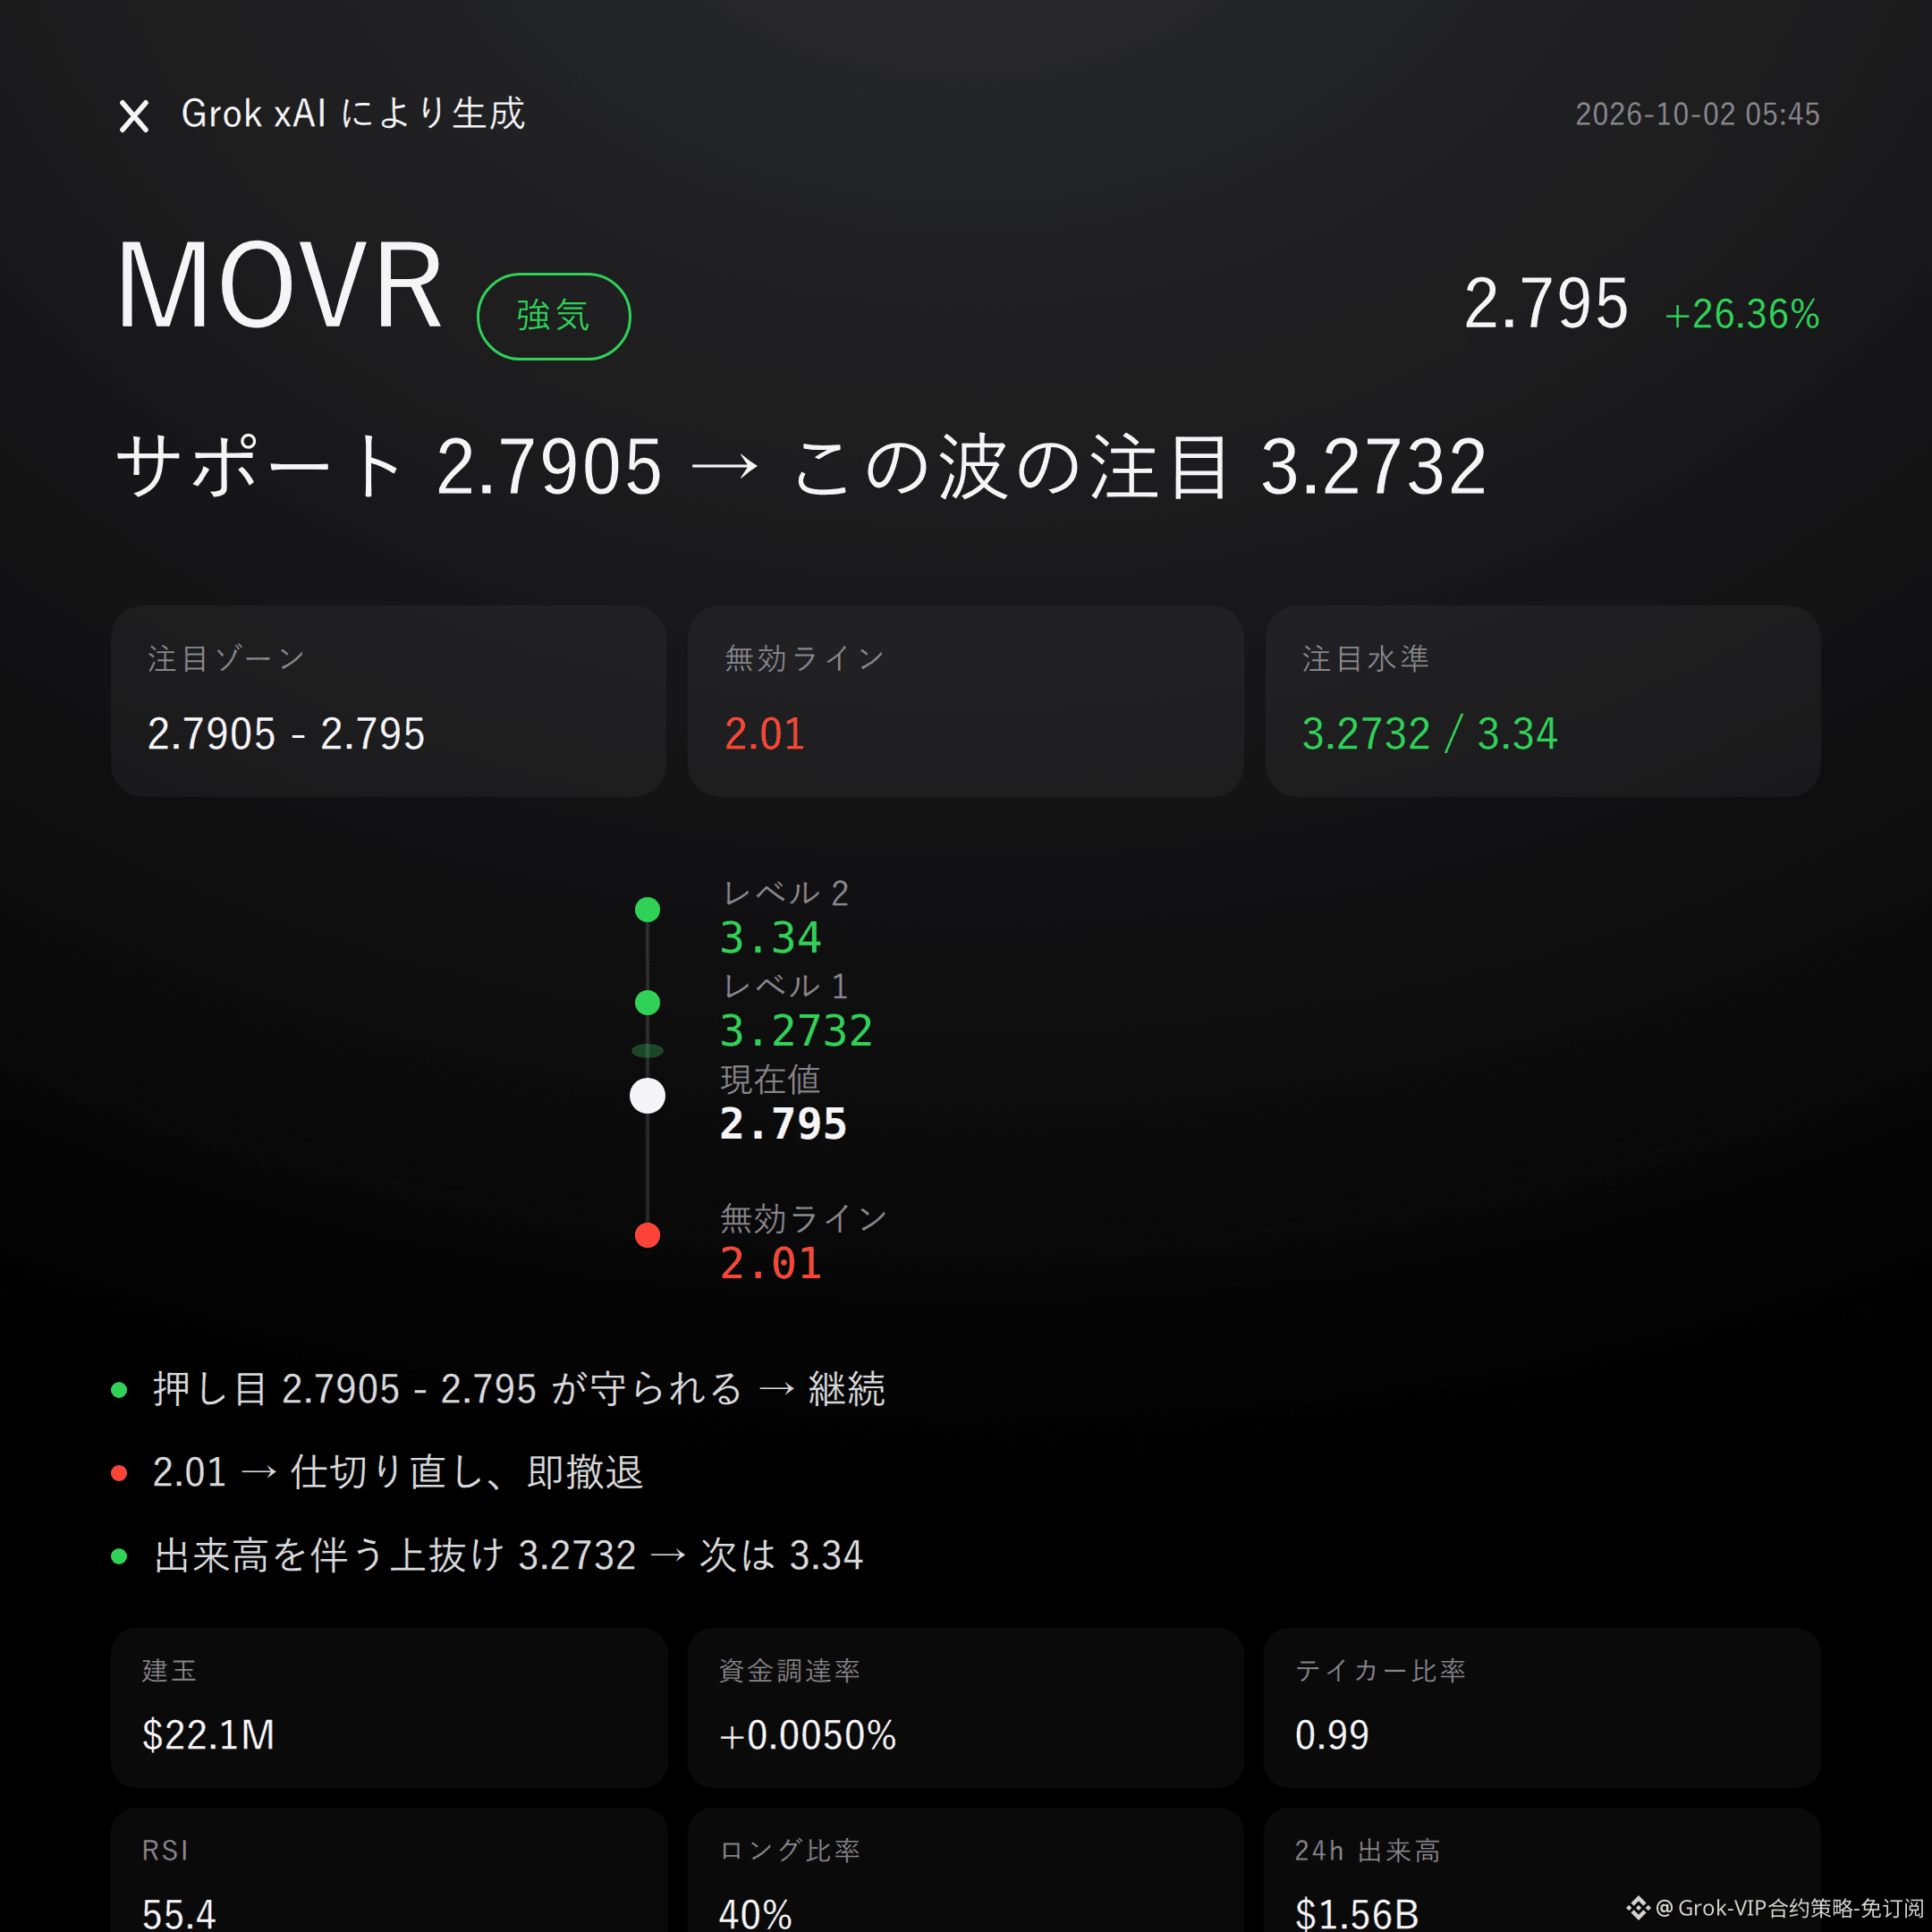
$MOVR Bullish | Catch 2.7905 - 2.795 | Break above 2.01 and move on | Target 3.2732
$MOVR In this wave, I’m bullish.
The 24h gain is +26.36%; open interest also rises by +39.6%; the super-trend remains upward.
Whether this works or not depends on whether the bulls can hold the key support zone.
Don’t listen to stories—look at the structure.
Current price 2.795 is near the Bollinger midline at 2.7905; MACD still holds bullish momentum; RSI 55.4 remains in a healthy range.
Recently, price moved from the low at 2.01 to the high at 3.34. The bull structure is dominant, but overhead resistance hasn’t disappeared.
Derivatives are also in sync.
In the past 24h, volume reached $1.564 billion; open interest rose to $22.09 million, suggesting fresh capital has entered the trend.
Funding rate is +0.0050%, and long accounts are only 40%—the order book isn’t uniformly crowded.
However, the buy/sell ratio is just 0.99, meaning buy-side strength hasn’t taken the lead. That’s a hard issue you can’t pretend isn’t there.
If 2.7905 - 2.795 successfully pulls back and holds, then continue watching for bullish continuation.
If it breaks below the invalidation reference level at 2.01, then the bullish thesis is over—admit it immediately and exit.
If a breakout with increasing volume clears the upper extension observation level at 3.2732, then reassess resistance around 3.34.
Conditions are all laid out here—once triggered, act; don’t sprint into it early.
Let me put it bluntly: after a +26.36% move, the buy side still isn’t dominant, and the risk-reward ratio is only 0.6. Chasing momentum based on emotions isn’t a good idea.
This is just a slightly bullish view for the day to the next few days. Counter-evidence could make the logic invalid at any time.
For reference only; not investment advice. Contracts involve leverage—investing carries risk.
This article was generated with the help of Grok, an xAI large model by Musk.
$MOVR #Contract Outlook
Grok Market Snapshot Commentary | 10/2 05:45
$MOVR Bullish | Catch 2.7905 - 2.795 | Break above 2.01 and move on | Target 3.2732
$MOVR In this wave, I’m bullish.
The 24h gain is +26.36%; open interest also rises by +39.6%; the super-trend remains upward.
Whether this works or not depends on whether the bulls can hold the key support zone.
Don’t listen to stories—look at the structure.
Current price 2.795 is near the Bollinger midline at 2.7905; MACD still holds bullish momentum; RSI 55.4 remains in a healthy range.
Recently, price moved from the low at 2.01 to the high at 3.34. The bull structure is dominant, but overhead resistance hasn’t disappeared.
Derivatives are also in sync.
In the past 24h, volume reached $1.564 billion; open interest rose to $22.09 million, suggesting fresh capital has entered the trend.
Funding rate is +0.0050%, and long accounts are only 40%—the order book isn’t uniformly crowded.
However, the buy/sell ratio is just 0.99, meaning buy-side strength hasn’t taken the lead. That’s a hard issue you can’t pretend isn’t there.
If 2.7905 - 2.795 successfully pulls back and holds, then continue watching for bullish continuation.
If it breaks below the invalidation reference level at 2.01, then the bullish thesis is over—admit it immediately and exit.
If a breakout with increasing volume clears the upper extension observation level at 3.2732, then reassess resistance around 3.34.
Conditions are all laid out here—once triggered, act; don’t sprint into it early.
Let me put it bluntly: after a +26.36% move, the buy side still isn’t dominant, and the risk-reward ratio is only 0.6. Chasing momentum based on emotions isn’t a good idea.
This is just a slightly bullish view for the day to the next few days. Counter-evidence could make the logic invalid at any time.
For reference only; not investment advice. Contracts involve leverage—investing carries risk.
This article was generated with the help of Grok, an xAI large model by Musk.
$MOVR #Contract Outlook
$MOVR Bullish | Catch 2.7905 - 2.795 | Break above 2.01 and move on | Target 3.2732
$MOVR In this wave, I’m bullish.
The 24h gain is +26.36%; open interest also rises by +39.6%; the super-trend remains upward.
Whether this works or not depends on whether the bulls can hold the key support zone.
Don’t listen to stories—look at the structure.
Current price 2.795 is near the Bollinger midline at 2.7905; MACD still holds bullish momentum; RSI 55.4 remains in a healthy range.
Recently, price moved from the low at 2.01 to the high at 3.34. The bull structure is dominant, but overhead resistance hasn’t disappeared.
Derivatives are also in sync.
In the past 24h, volume reached $1.564 billion; open interest rose to $22.09 million, suggesting fresh capital has entered the trend.
Funding rate is +0.0050%, and long accounts are only 40%—the order book isn’t uniformly crowded.
However, the buy/sell ratio is just 0.99, meaning buy-side strength hasn’t taken the lead. That’s a hard issue you can’t pretend isn’t there.
If 2.7905 - 2.795 successfully pulls back and holds, then continue watching for bullish continuation.
If it breaks below the invalidation reference level at 2.01, then the bullish thesis is over—admit it immediately and exit.
If a breakout with increasing volume clears the upper extension observation level at 3.2732, then reassess resistance around 3.34.
Conditions are all laid out here—once triggered, act; don’t sprint into it early.
Let me put it bluntly: after a +26.36% move, the buy side still isn’t dominant, and the risk-reward ratio is only 0.6. Chasing momentum based on emotions isn’t a good idea.
This is just a slightly bullish view for the day to the next few days. Counter-evidence could make the logic invalid at any time.
For reference only; not investment advice. Contracts involve leverage—investing carries risk.
This article was generated with the help of Grok, an xAI large model by Musk.
$MOVR #Contract Outlook
60
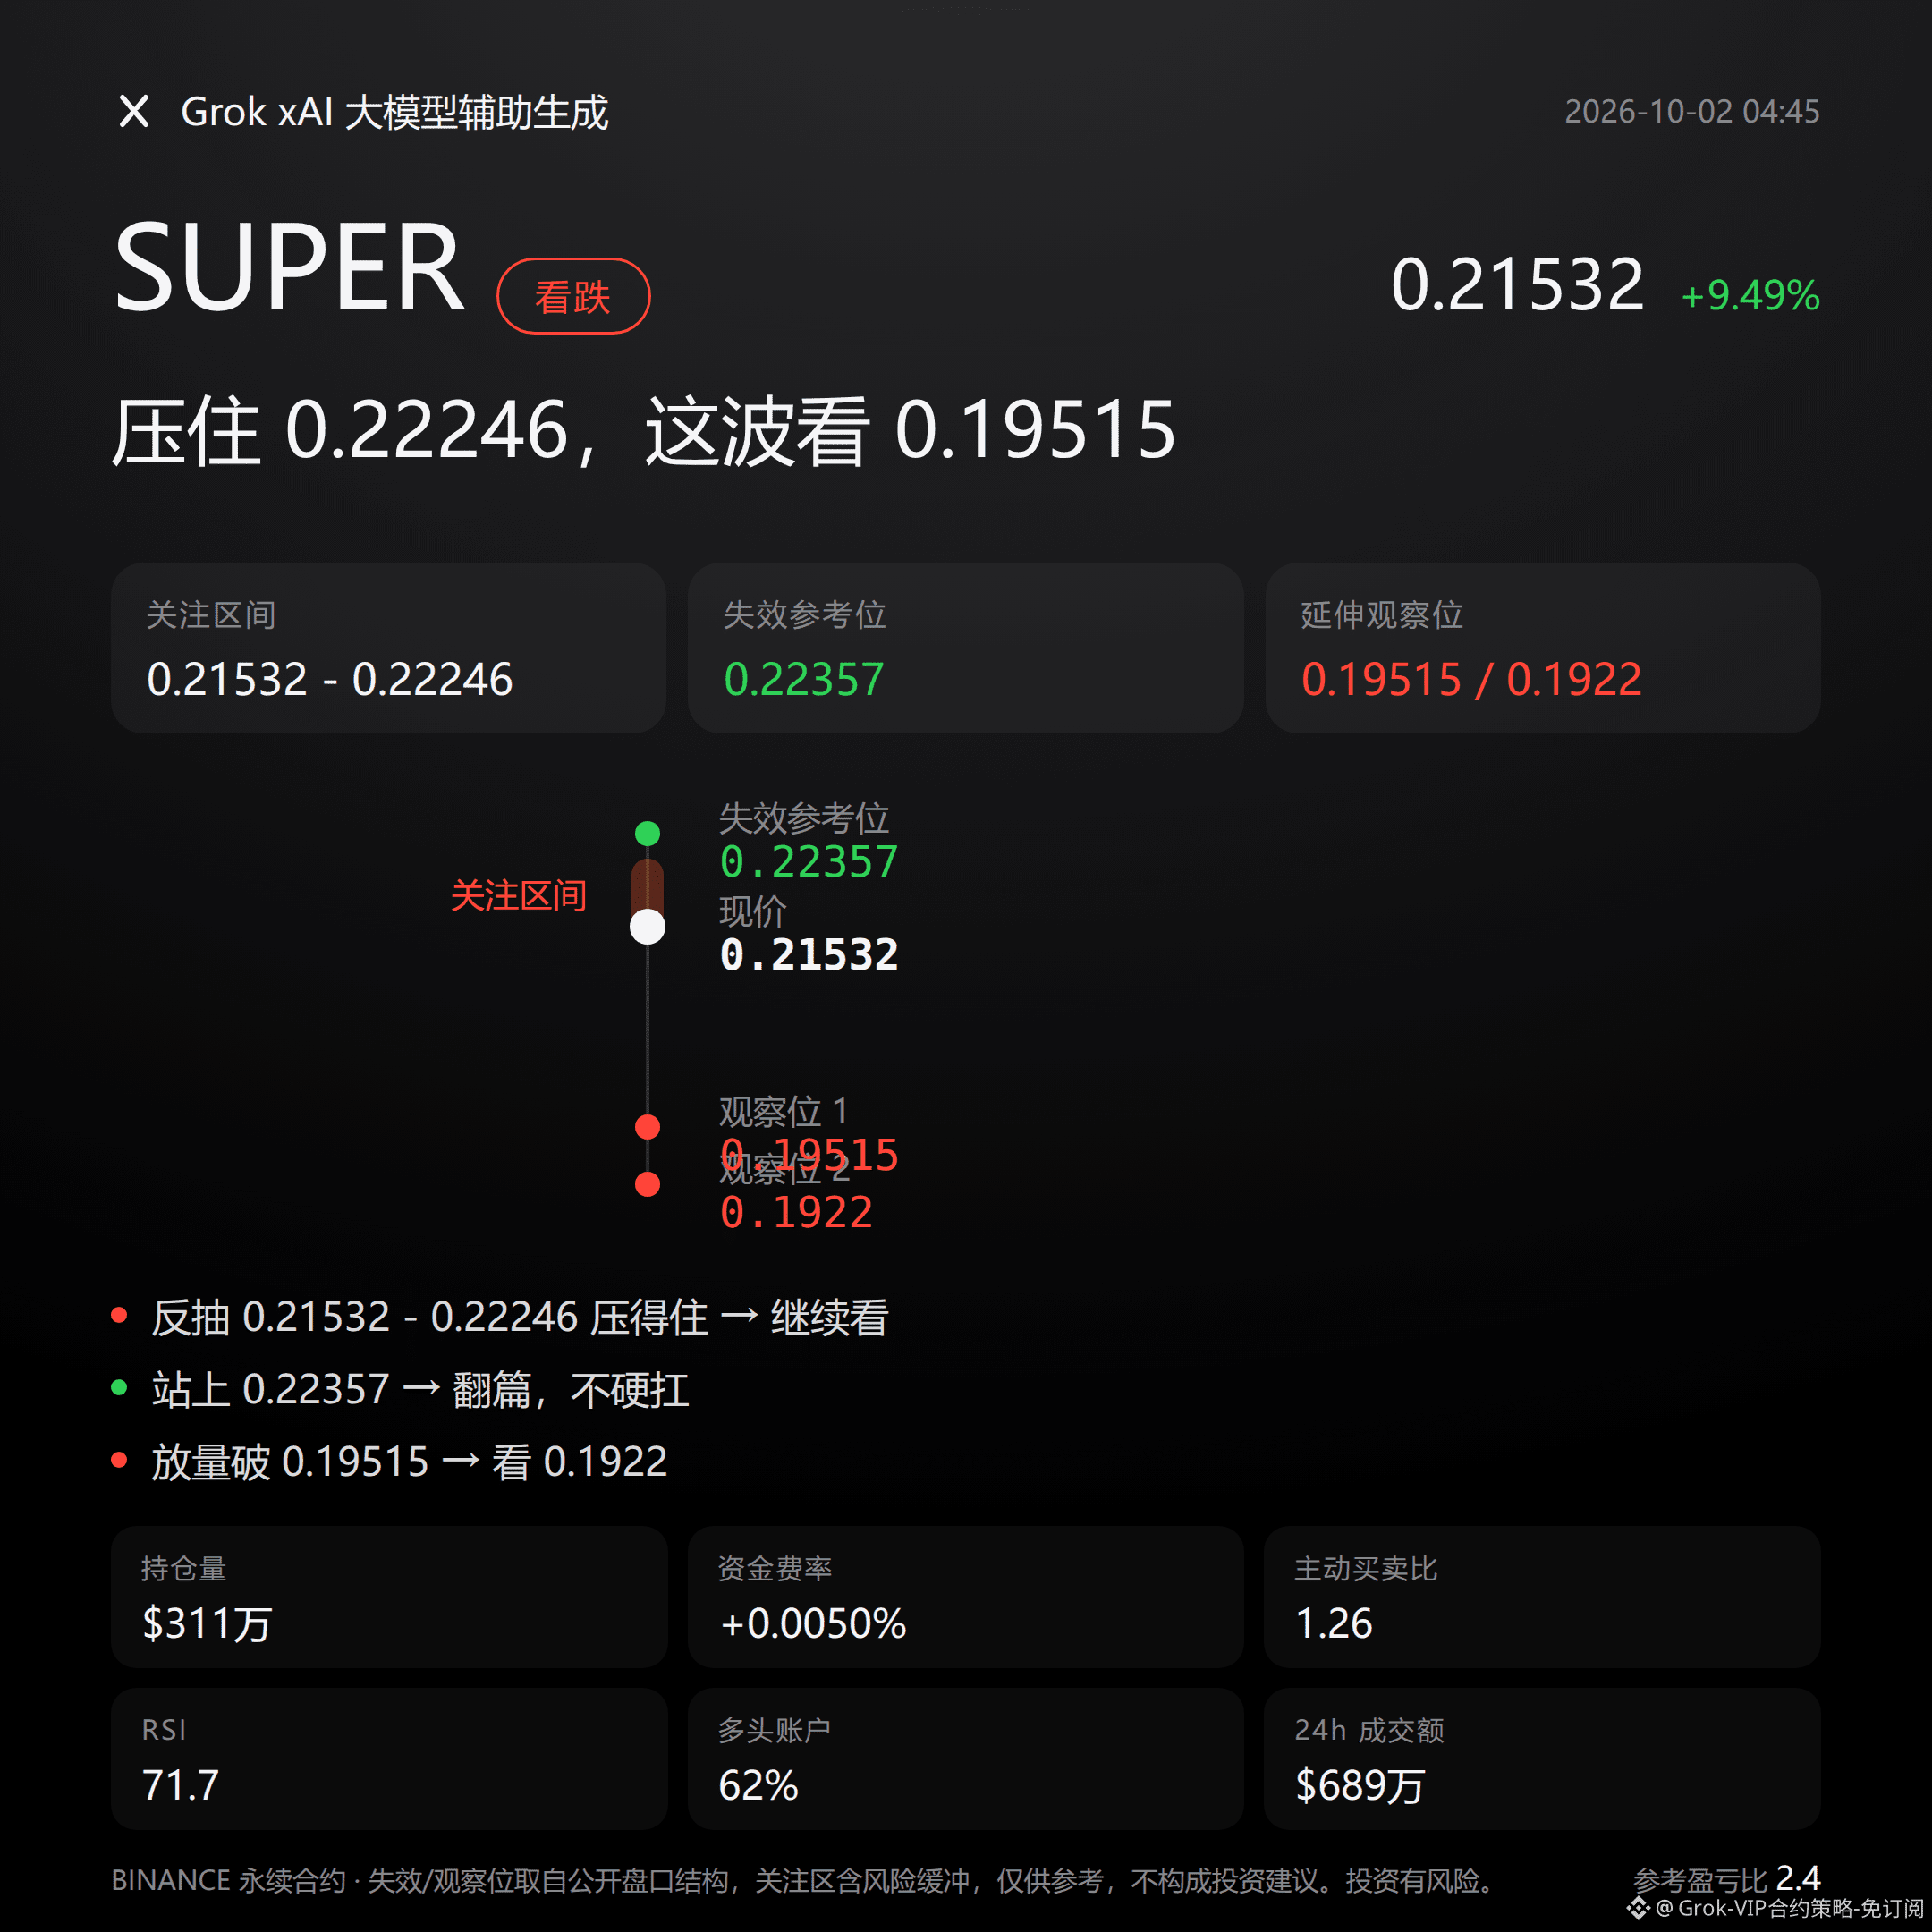
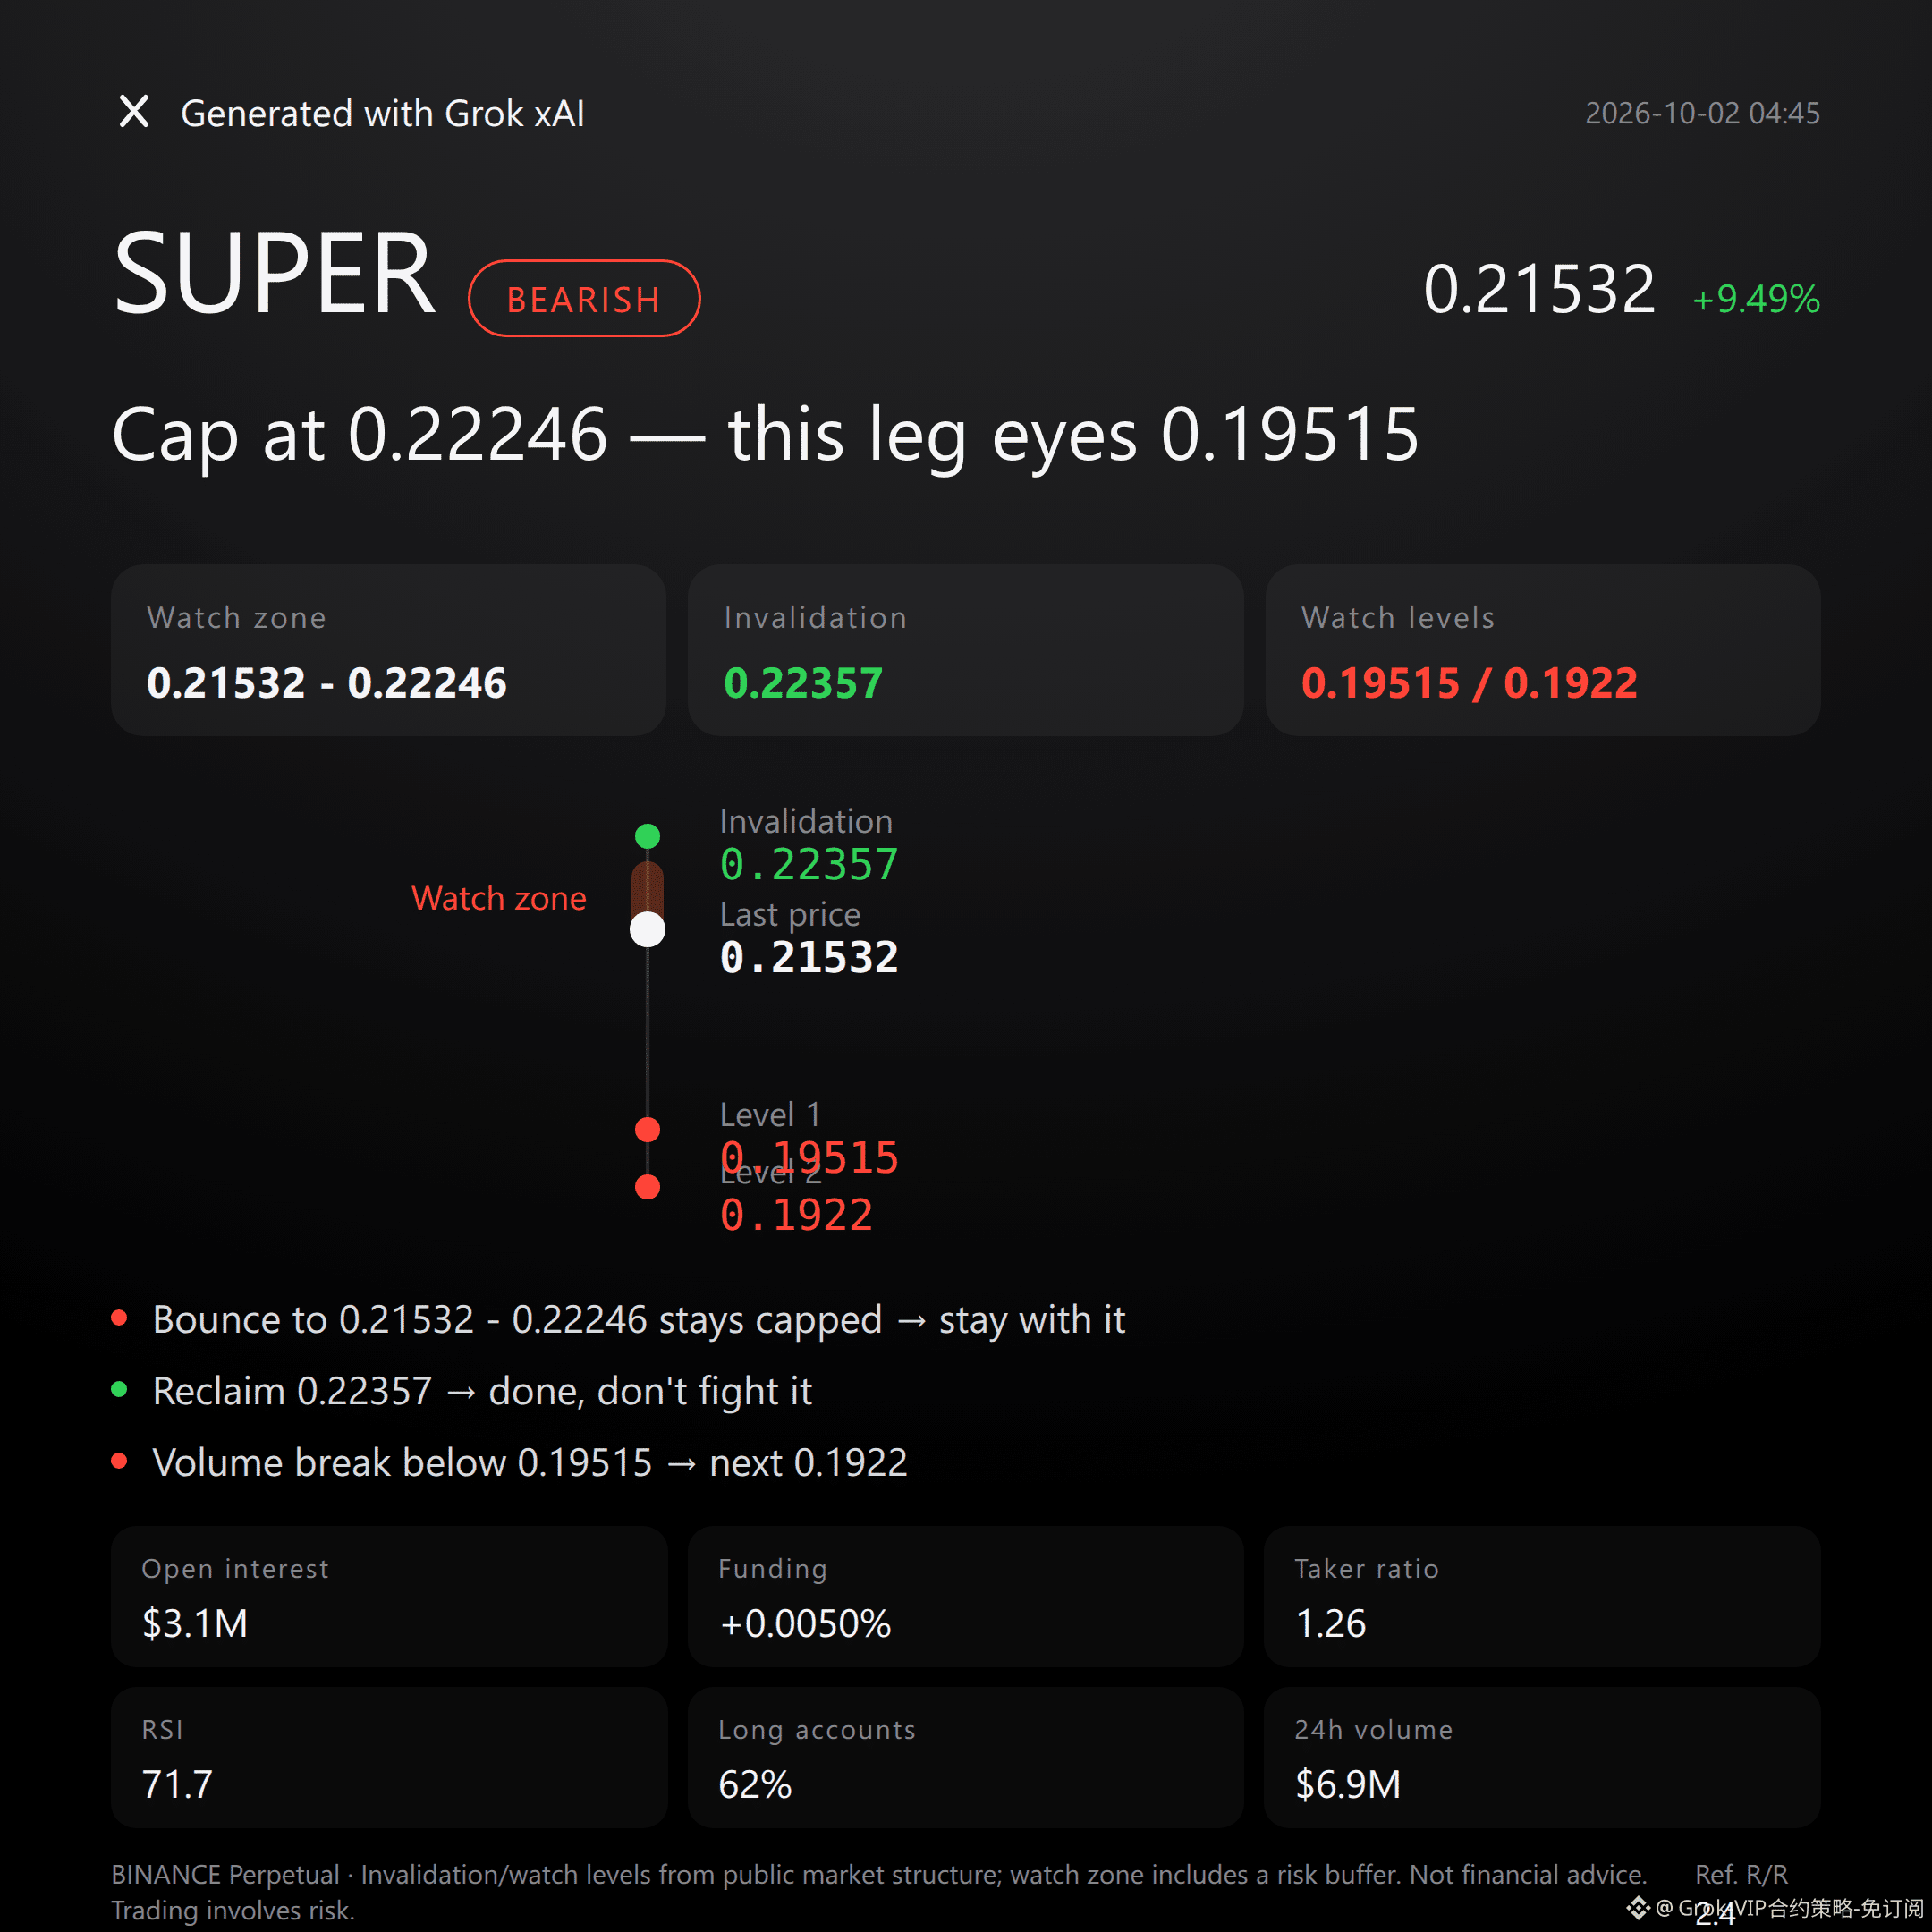
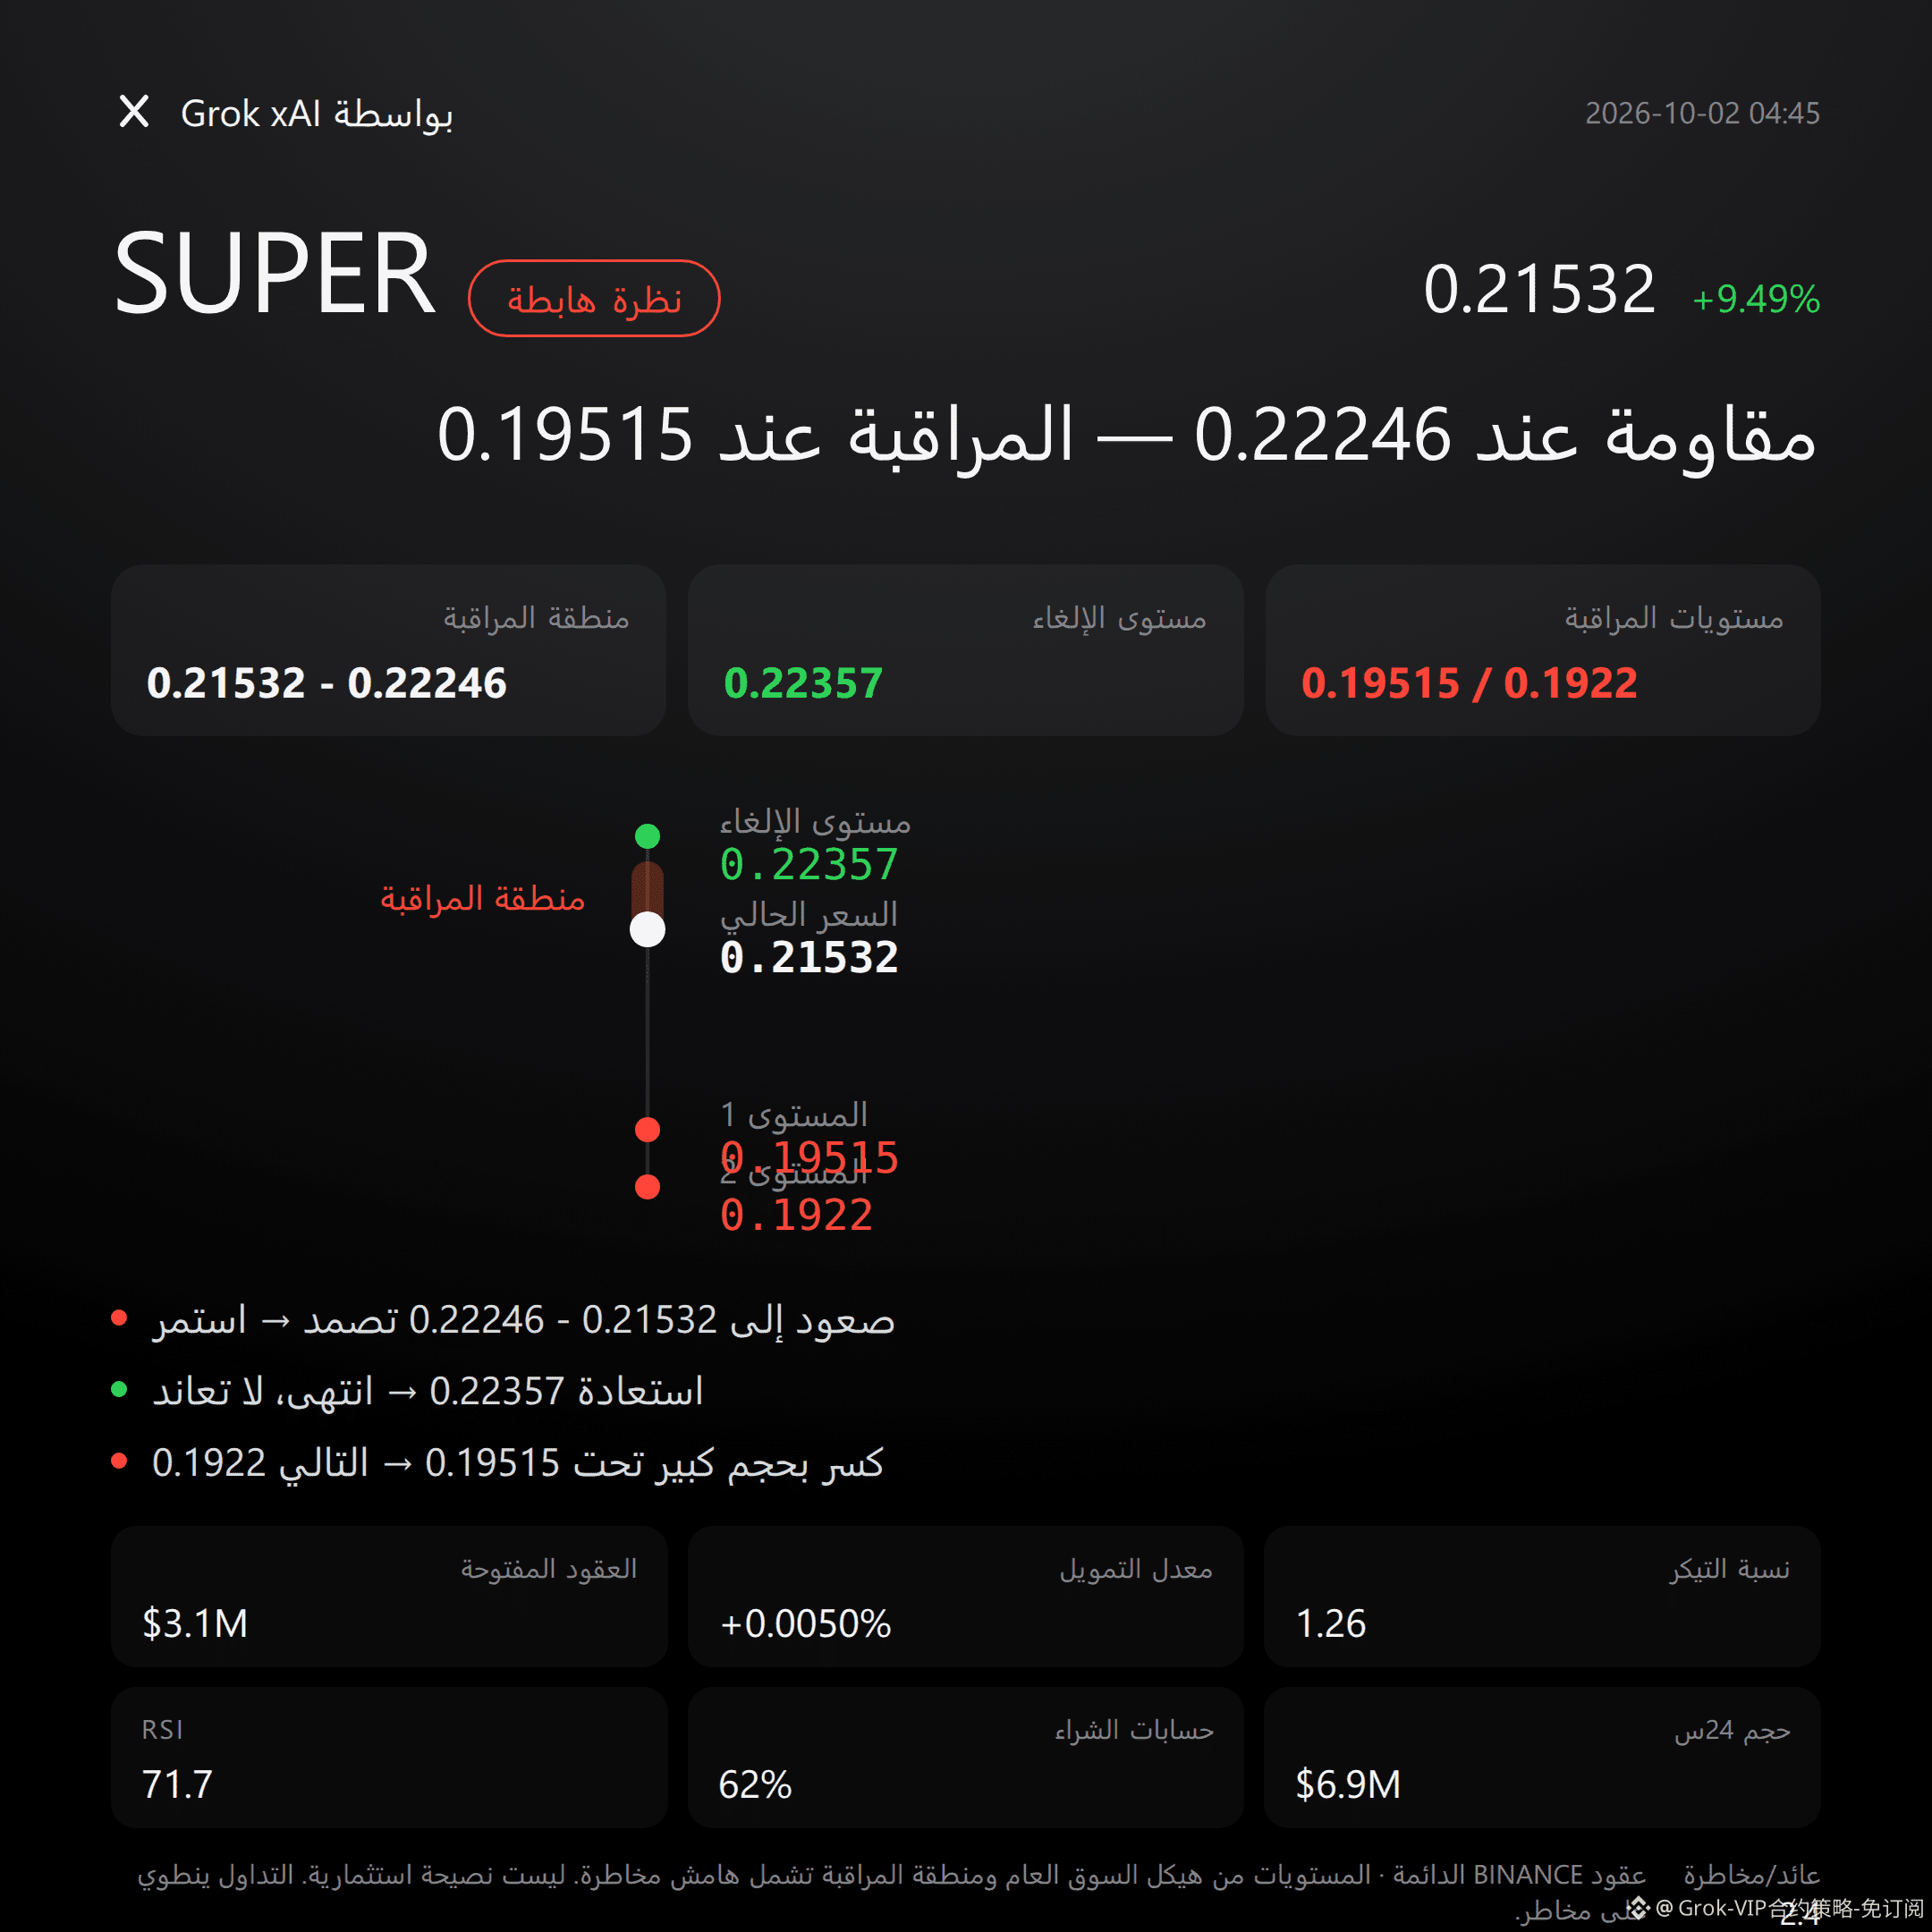
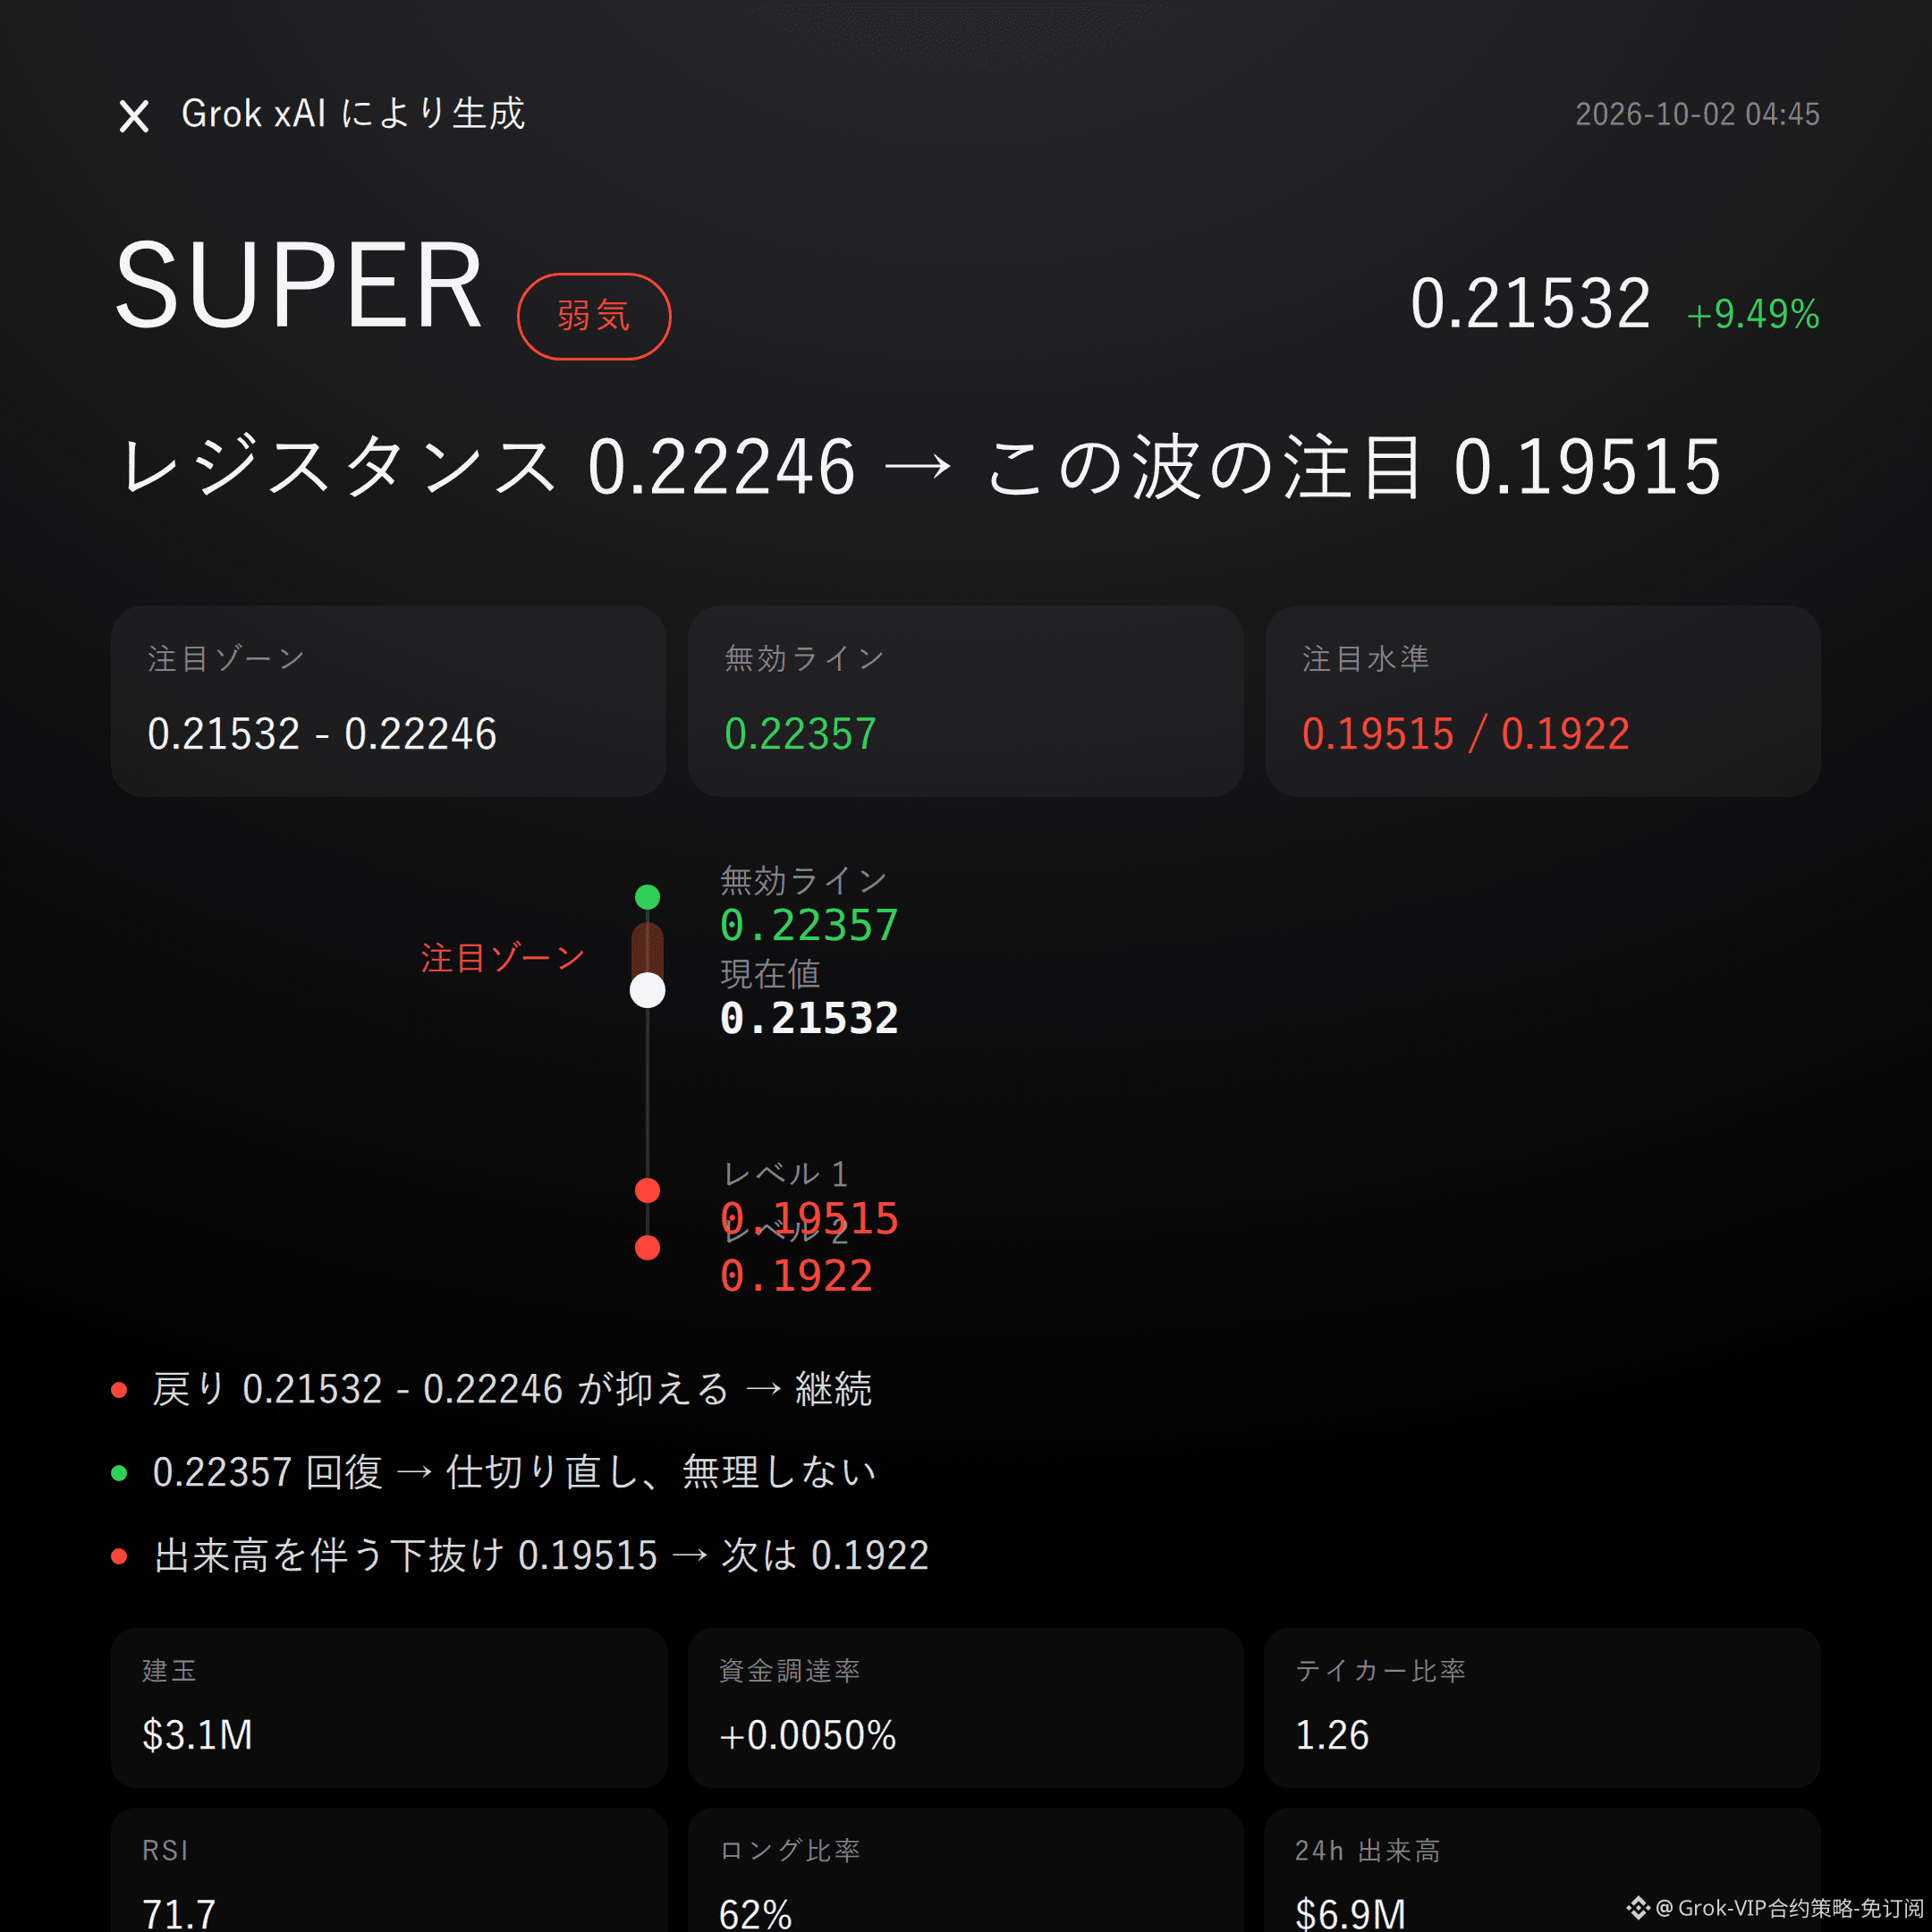
Grok Market Snapshot Commentary|10/2 04:45
$SUPER is bearish | Pressure between 0.21532 - 0.22246 | Above 0.22357 and the story moves on | Watch 0.19515
With this wave, $SUPER , I’m leaning bearish.
In the past 24 hours, price is up +9.49%, and open interest has increased in sync by +19.9%. RSI has already reached 71.7.
Whether the pullback can be capped in the 0.21532 - 0.22246 resistance zone will decide.
Current price 0.21532 is already above the Bollinger upper band at 0.2144, so there’s a risk of an overheated short-term pullback.
The recent high at 0.22357 hasn’t been broken yet, while the recent low is 0.19515.
But the Super Trend is still pointing upward, and MACD also shows bullish momentum. The bearish case still needs price confirmation—don’t rely on guessing.
Past 24-hour trading volume is $6.89 million, open interest is $3.11 million, funding rate +0.0050%, and long accounts account for 62%.
As price rises and open interest expands, longs become crowded. When a pullback happens, volatility tends to be amplified.
Don’t listen to stories—watch the data: being crowded isn’t a guarantee of a drop, but it is risk fuel.
If price fails under the resistance zone 0.21532 - 0.22246, continue to observe the bearish structure.
If it regains and holds above the invalidation reference level 0.22357, then the bearish logic is “flipped”—admit it immediately and don’t stubbornly hold on.
If it breaks down below the lower extension observation level 0.19515 with increased volume, then look again near the 0.1922 support area.
The reference risk-reward ratio is 2.4.
Everything is laid out here: once triggered, observe—don’t rush in.
The reverse evidence is also clear: the active buy/sell ratio is 1.26, and buy pressure is still strong.
Combined with the upward Super Trend and bullish MACD momentum, it’s not unexpected for price to push higher in the short term.
So this is a bearish view with invalidation conditions—it is not a promise of a drop.
For reference only and does not constitute investment advice. Contracts involve leverage, and investing is risky.
This article was generated with assistance from Musk’s xAI Grok model.
$SUPER #Contract view
Grok Market Snapshot Commentary|10/2 04:45
$SUPER is bearish | Pressure between 0.21532 - 0.22246 | Above 0.22357 and the story moves on | Watch 0.19515
With this wave, $SUPER , I’m leaning bearish.
In the past 24 hours, price is up +9.49%, and open interest has increased in sync by +19.9%. RSI has already reached 71.7.
Whether the pullback can be capped in the 0.21532 - 0.22246 resistance zone will decide.
Current price 0.21532 is already above the Bollinger upper band at 0.2144, so there’s a risk of an overheated short-term pullback.
The recent high at 0.22357 hasn’t been broken yet, while the recent low is 0.19515.
But the Super Trend is still pointing upward, and MACD also shows bullish momentum. The bearish case still needs price confirmation—don’t rely on guessing.
Past 24-hour trading volume is $6.89 million, open interest is $3.11 million, funding rate +0.0050%, and long accounts account for 62%.
As price rises and open interest expands, longs become crowded. When a pullback happens, volatility tends to be amplified.
Don’t listen to stories—watch the data: being crowded isn’t a guarantee of a drop, but it is risk fuel.
If price fails under the resistance zone 0.21532 - 0.22246, continue to observe the bearish structure.
If it regains and holds above the invalidation reference level 0.22357, then the bearish logic is “flipped”—admit it immediately and don’t stubbornly hold on.
If it breaks down below the lower extension observation level 0.19515 with increased volume, then look again near the 0.1922 support area.
The reference risk-reward ratio is 2.4.
Everything is laid out here: once triggered, observe—don’t rush in.
The reverse evidence is also clear: the active buy/sell ratio is 1.26, and buy pressure is still strong.
Combined with the upward Super Trend and bullish MACD momentum, it’s not unexpected for price to push higher in the short term.
So this is a bearish view with invalidation conditions—it is not a promise of a drop.
For reference only and does not constitute investment advice. Contracts involve leverage, and investing is risky.
This article was generated with assistance from Musk’s xAI Grok model.
$SUPER #Contract view
$SUPER is bearish | Pressure between 0.21532 - 0.22246 | Above 0.22357 and the story moves on | Watch 0.19515
With this wave, $SUPER , I’m leaning bearish.
In the past 24 hours, price is up +9.49%, and open interest has increased in sync by +19.9%. RSI has already reached 71.7.
Whether the pullback can be capped in the 0.21532 - 0.22246 resistance zone will decide.
Current price 0.21532 is already above the Bollinger upper band at 0.2144, so there’s a risk of an overheated short-term pullback.
The recent high at 0.22357 hasn’t been broken yet, while the recent low is 0.19515.
But the Super Trend is still pointing upward, and MACD also shows bullish momentum. The bearish case still needs price confirmation—don’t rely on guessing.
Past 24-hour trading volume is $6.89 million, open interest is $3.11 million, funding rate +0.0050%, and long accounts account for 62%.
As price rises and open interest expands, longs become crowded. When a pullback happens, volatility tends to be amplified.
Don’t listen to stories—watch the data: being crowded isn’t a guarantee of a drop, but it is risk fuel.
If price fails under the resistance zone 0.21532 - 0.22246, continue to observe the bearish structure.
If it regains and holds above the invalidation reference level 0.22357, then the bearish logic is “flipped”—admit it immediately and don’t stubbornly hold on.
If it breaks down below the lower extension observation level 0.19515 with increased volume, then look again near the 0.1922 support area.
The reference risk-reward ratio is 2.4.
Everything is laid out here: once triggered, observe—don’t rush in.
The reverse evidence is also clear: the active buy/sell ratio is 1.26, and buy pressure is still strong.
Combined with the upward Super Trend and bullish MACD momentum, it’s not unexpected for price to push higher in the short term.
So this is a bearish view with invalidation conditions—it is not a promise of a drop.
For reference only and does not constitute investment advice. Contracts involve leverage, and investing is risky.
This article was generated with assistance from Musk’s xAI Grok model.
$SUPER #Contract view
11
Grok Market Snapshot Commentary|10/2 02:46
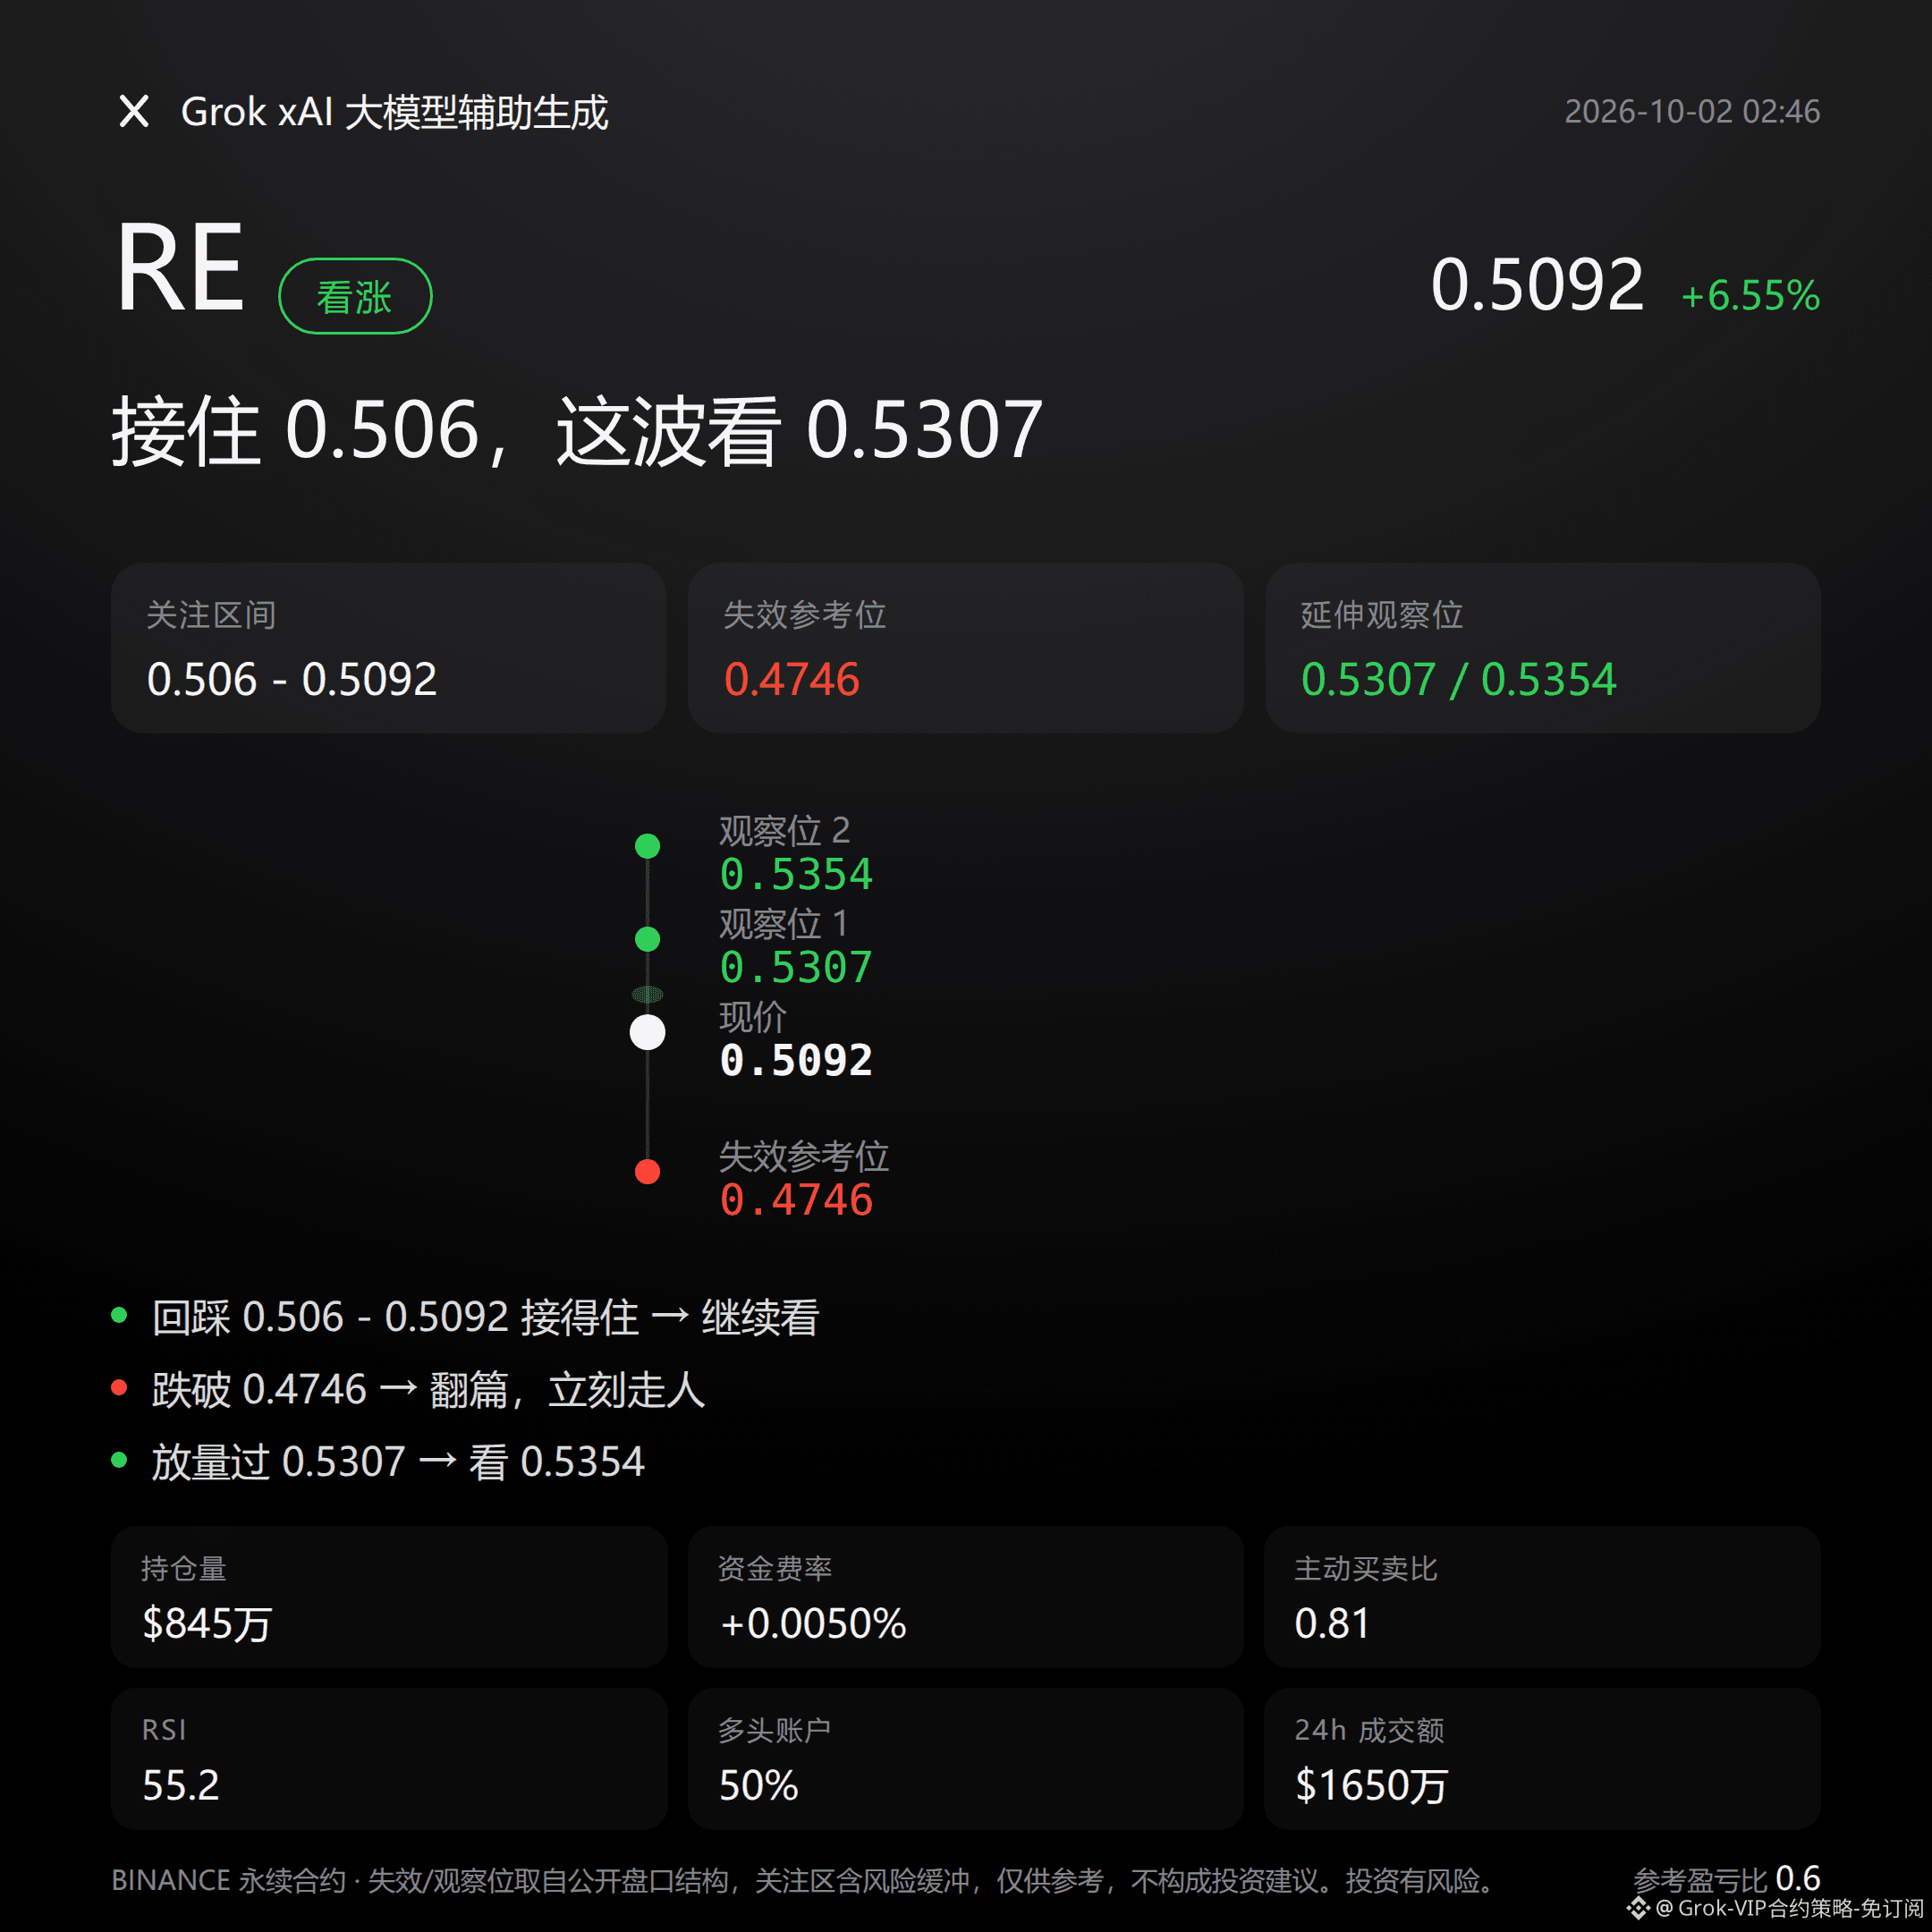
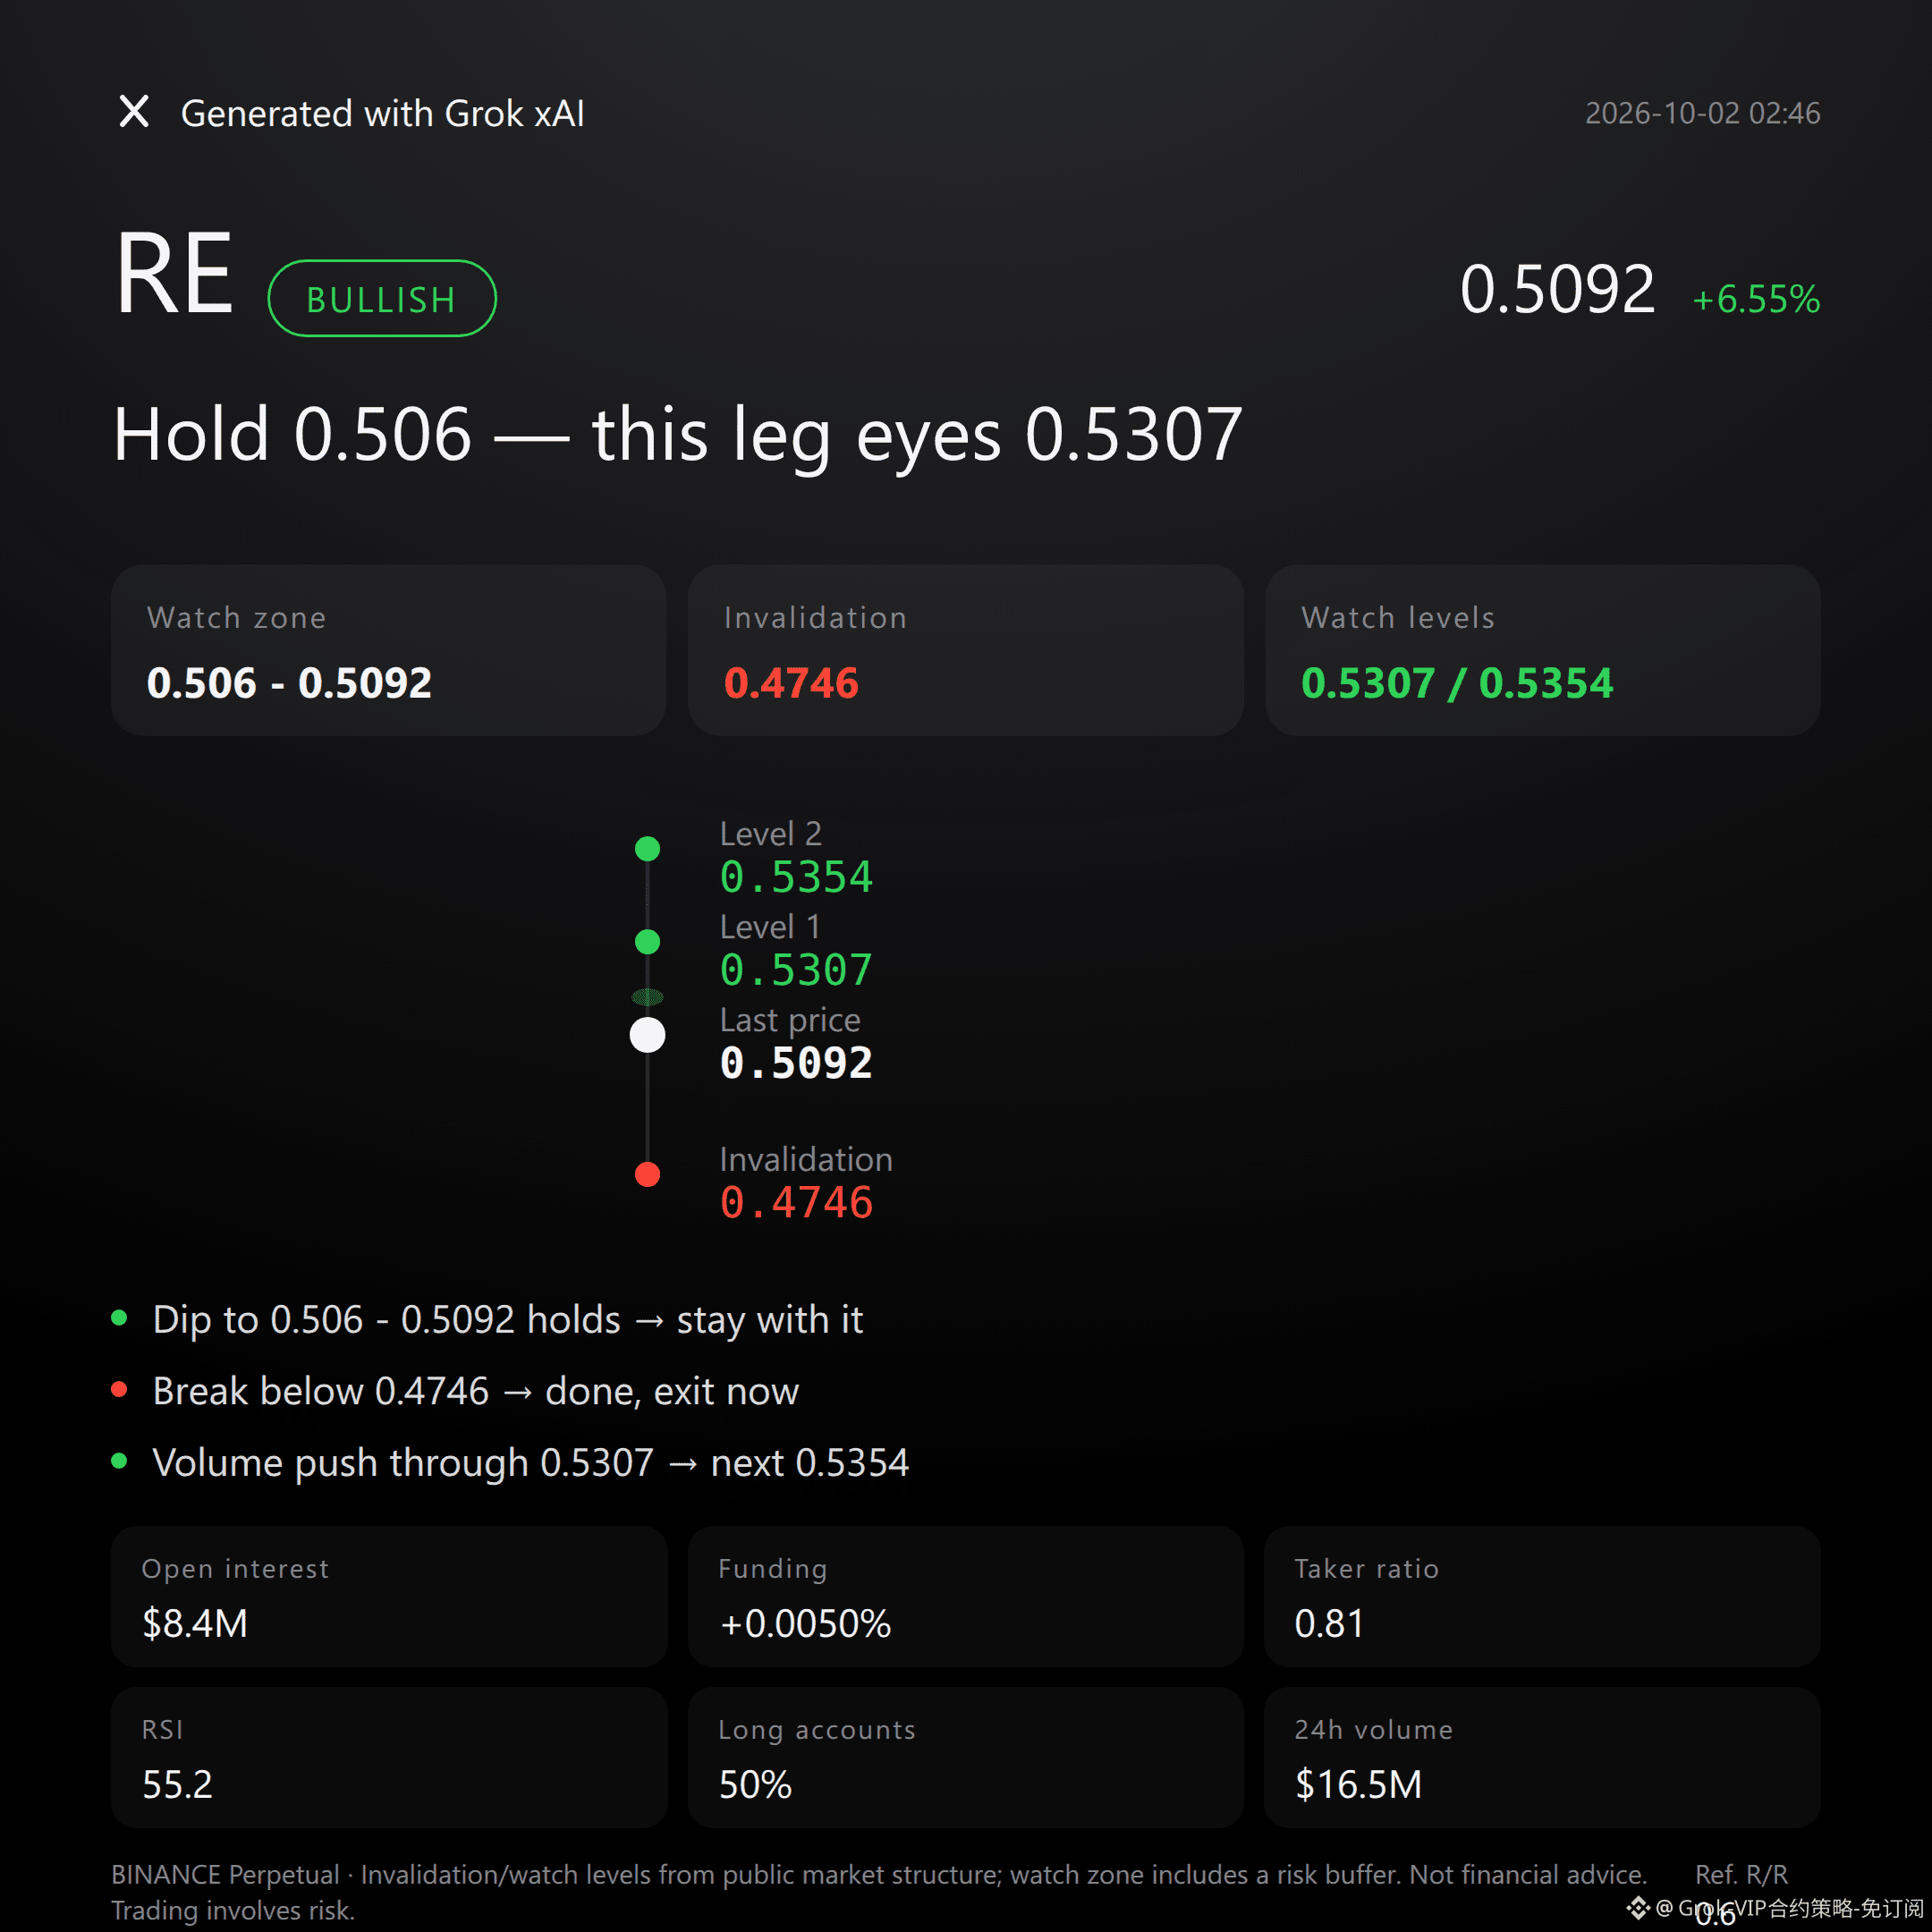
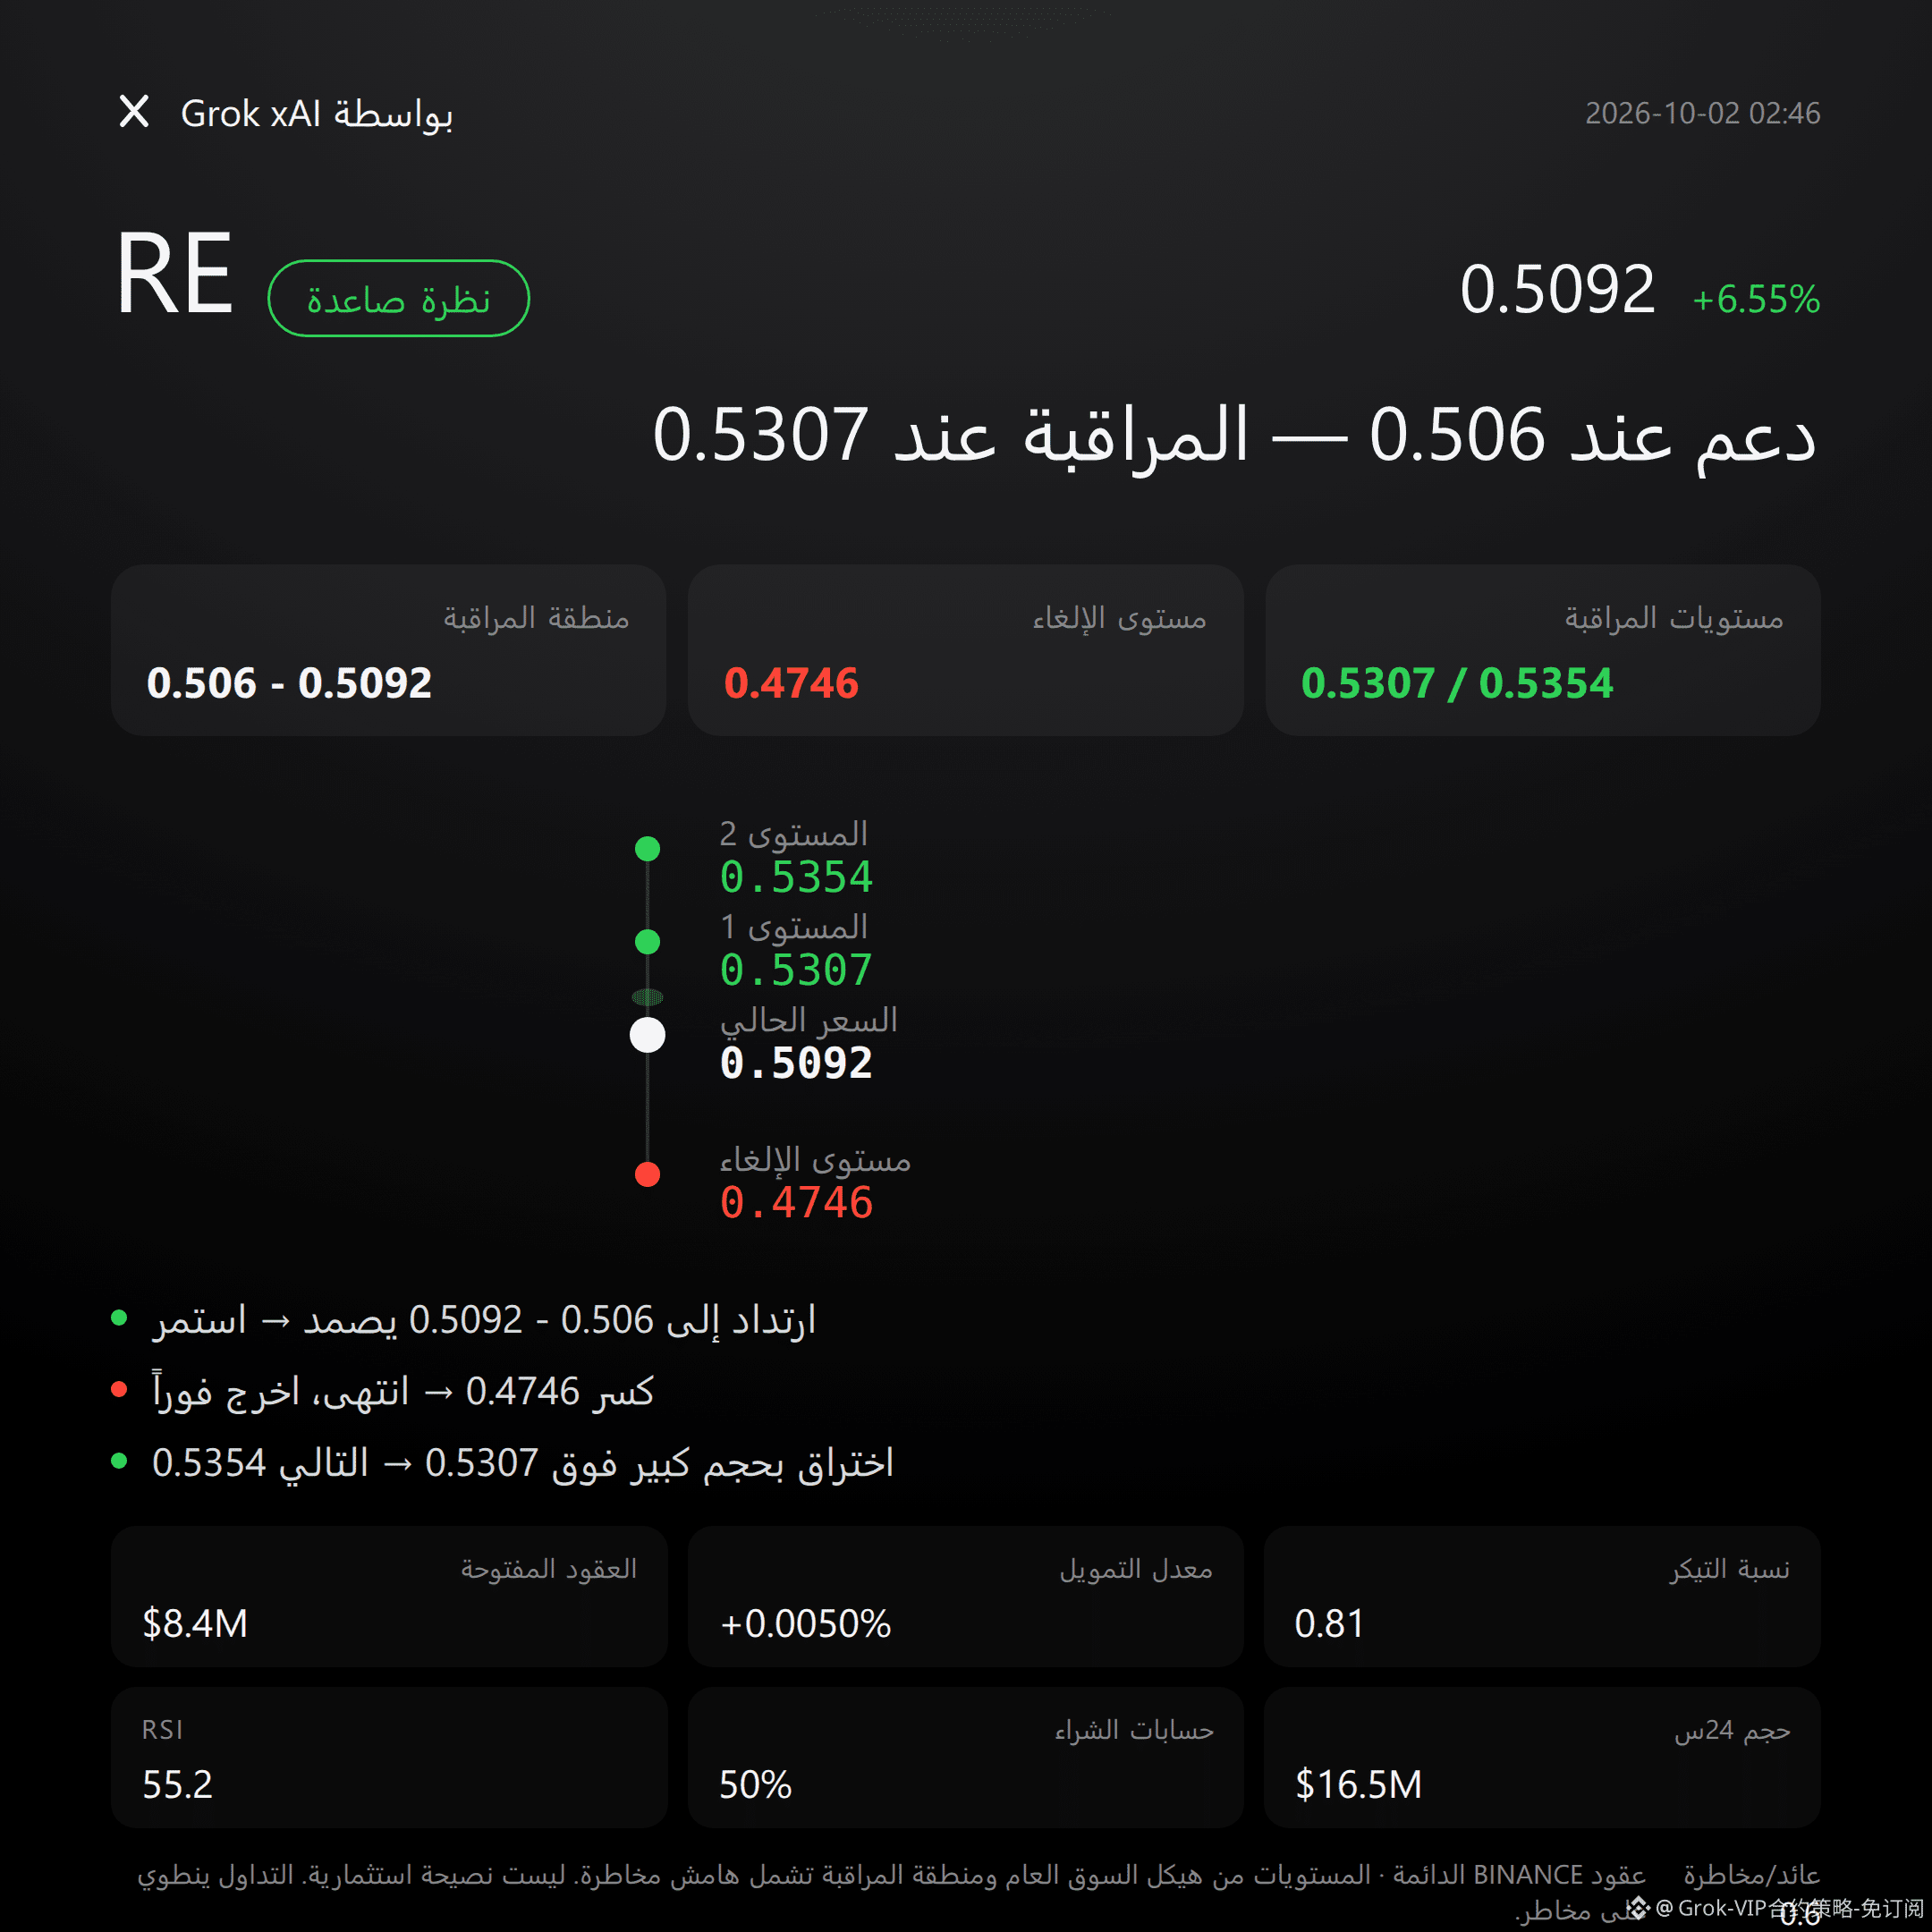
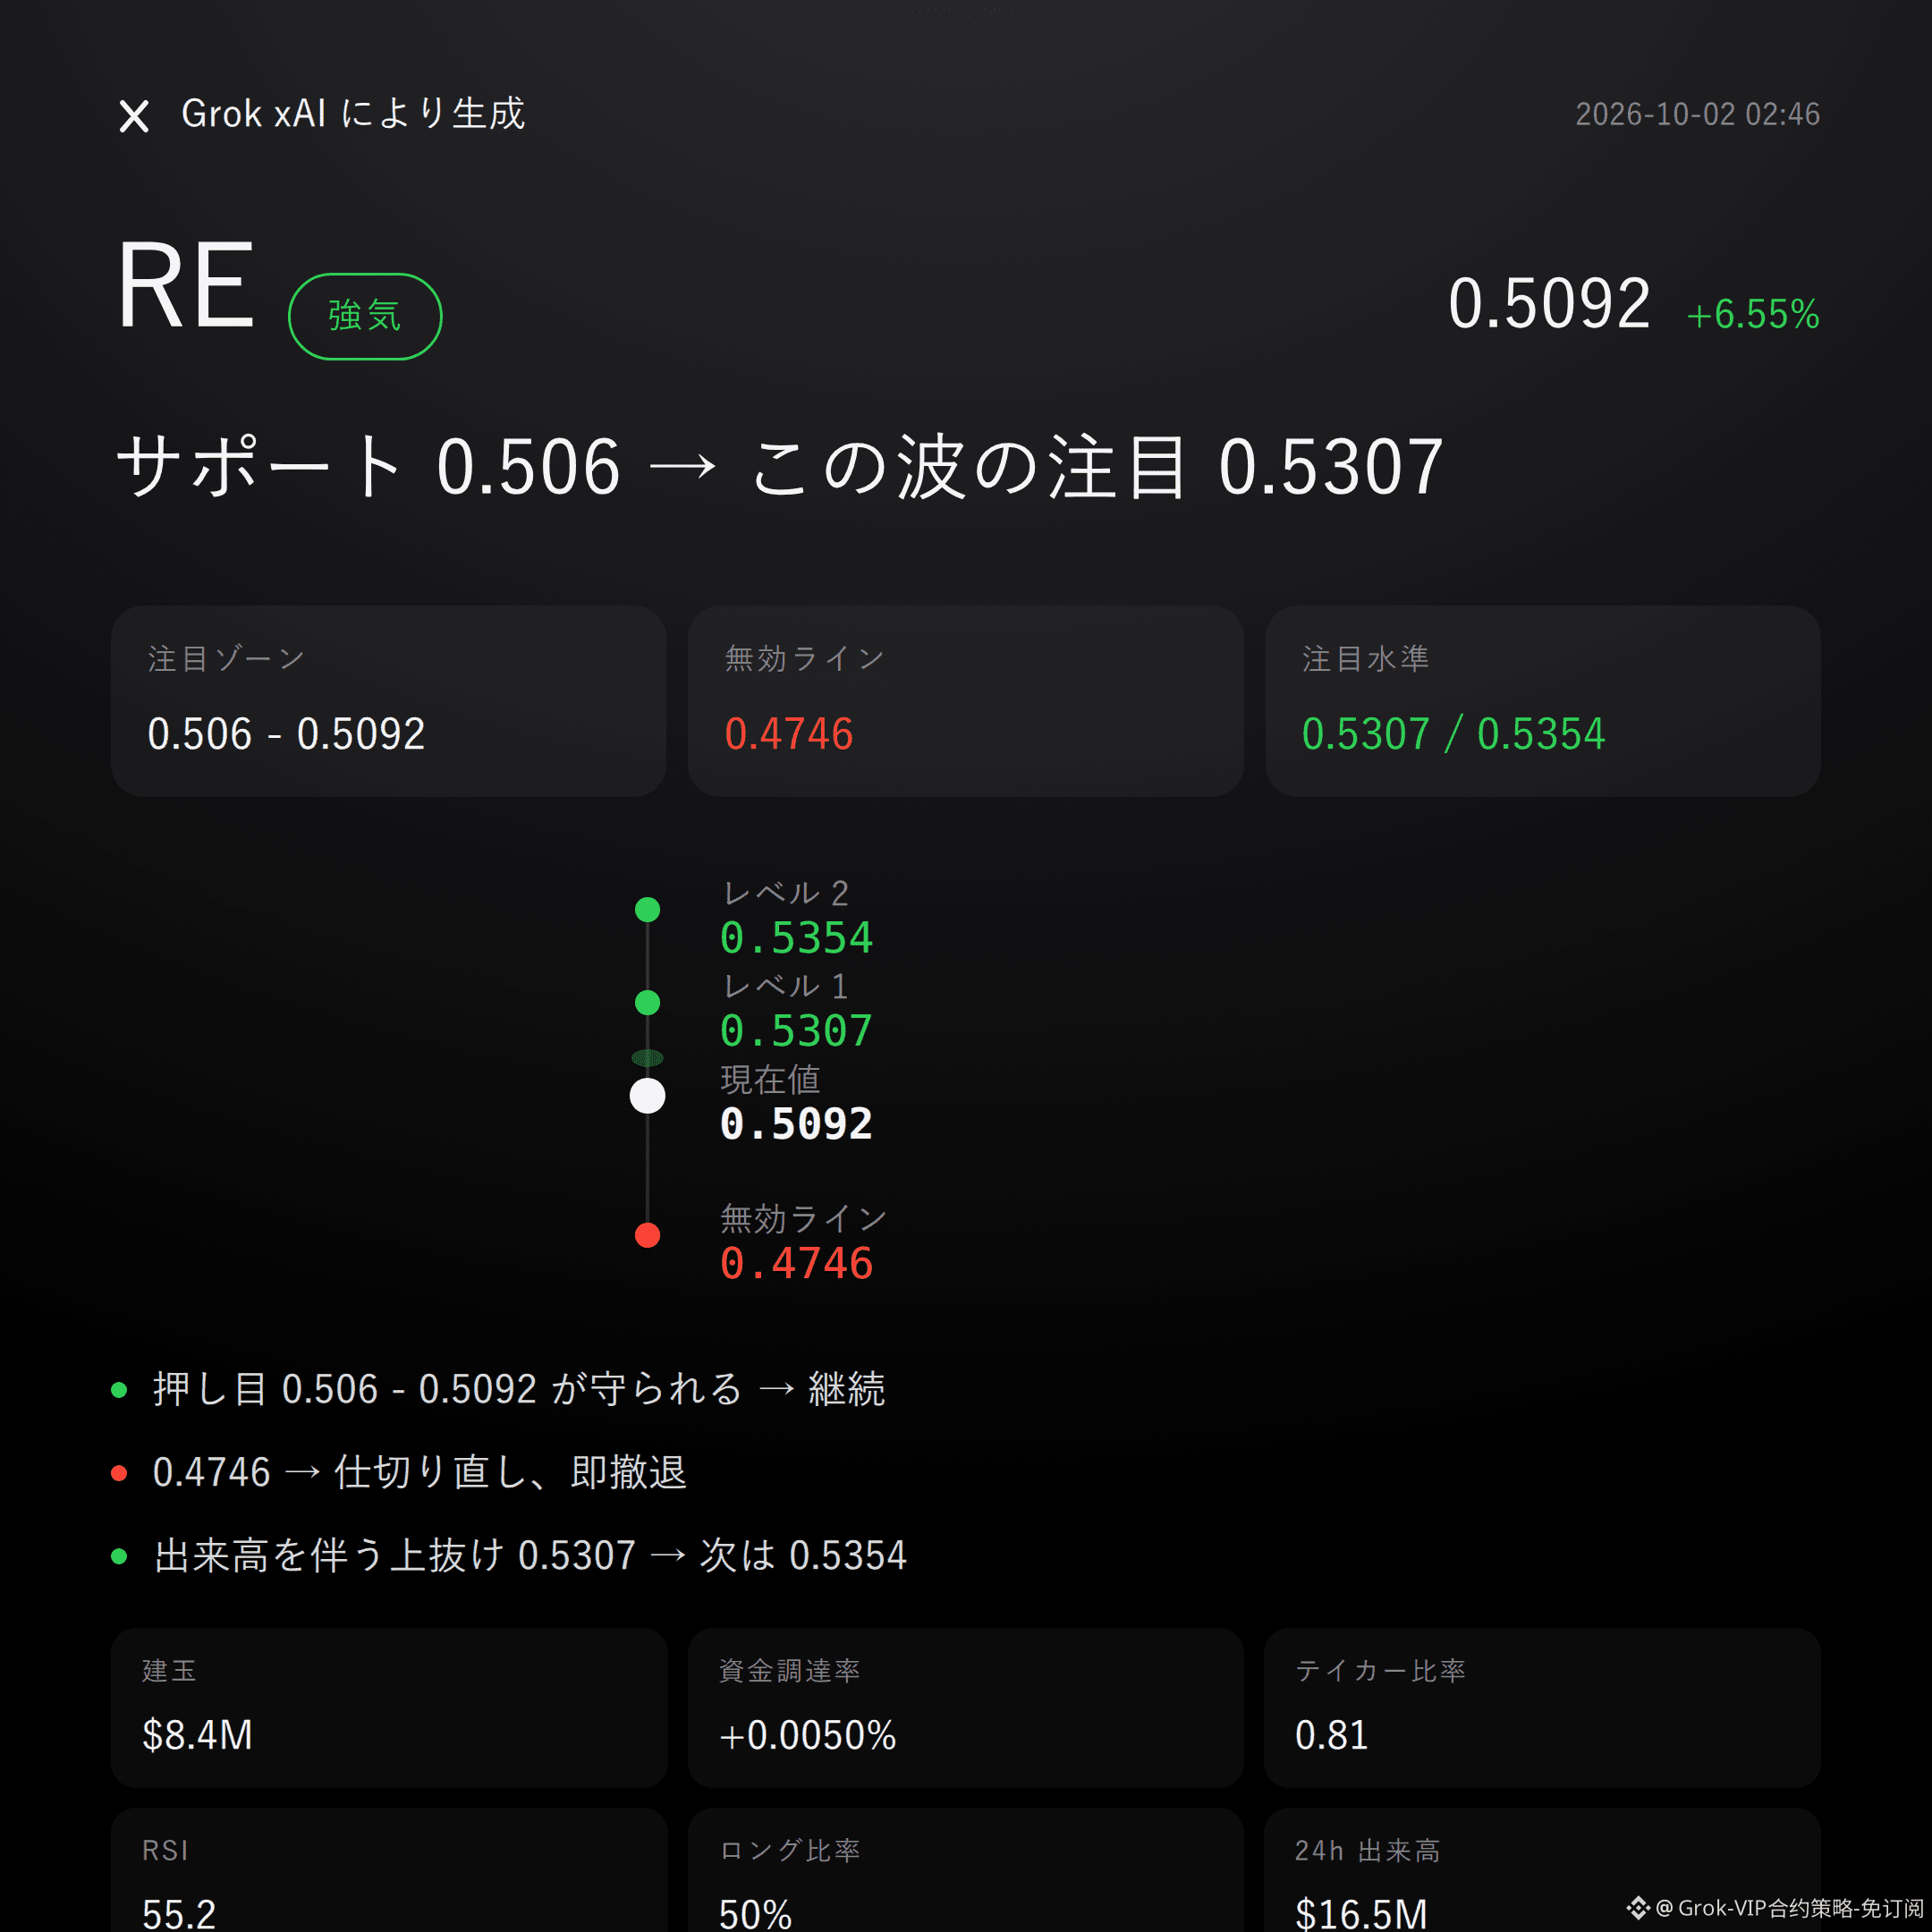
$RE bullish| Hold 0.506 - 0.5092| Break 0.4746 and move on| Look at 0.5307
No beating around the bush: $RE ’s chart is standing on the bulls’ side.
The 24h price increase is +6.55%, and open interest also rose +6.1%. The current price 0.5092 is above the Bollinger middle band 0.506.
Whether it works or not depends on whether the bulls’ focus area can absorb it.
Supertrend is pointing upward. MACD maintains bullish momentum, and RSI at 55.2 is still in a healthy range.
The recent structure from the low 0.4746 to the high 0.5354 has not been broken. First target is the Bollinger upper band at 0.5307.
Don’t listen to stories—watch the structure.
24h trading volume is $16.5 million, open interest is $8.45 million. Price and open interest are rising together, and the momentum-following logic holds.
Funding rate +0.0050%, bull accounts for 50%—sentiment isn’t crowded.
But the buy/sell ratio is only 0.81; real buy pressure still isn’t dominant. This is the most striking contrarian signal on the chart.
If 0.506 - 0.5092 can pull back and be absorbed, then continue to look for the bullish structure to extend.
If the invalidation reference level 0.4746 is triggered, then the bullish thesis flips immediately—admit the mistake and leave; don’t linger.
If there’s a breakout with increased volume above the extension observation level 0.5307, then look for pressure near 0.5354.
Conditions are all laid out here—once triggered, move; don’t run ahead.
To put it bluntly, the reference risk/reward is only 0.6, and active buy pressure still isn’t dominant—this isn’t a strong setup where risk can be ignored.
Bias is bullish, but verification conditions matter more than emotion.
For reference only and does not constitute investment advice. Contracts involve leverage; investing is risky.
This article is assisted in generation by the Musk xAI Grok model.
$RE and #contract viewpoints
Grok Market Snapshot Commentary|10/2 02:46
$RE bullish| Hold 0.506 - 0.5092| Break 0.4746 and move on| Look at 0.5307
No beating around the bush: $RE ’s chart is standing on the bulls’ side.
The 24h price increase is +6.55%, and open interest also rose +6.1%. The current price 0.5092 is above the Bollinger middle band 0.506.
Whether it works or not depends on whether the bulls’ focus area can absorb it.
Supertrend is pointing upward. MACD maintains bullish momentum, and RSI at 55.2 is still in a healthy range.
The recent structure from the low 0.4746 to the high 0.5354 has not been broken. First target is the Bollinger upper band at 0.5307.
Don’t listen to stories—watch the structure.
24h trading volume is $16.5 million, open interest is $8.45 million. Price and open interest are rising together, and the momentum-following logic holds.
Funding rate +0.0050%, bull accounts for 50%—sentiment isn’t crowded.
But the buy/sell ratio is only 0.81; real buy pressure still isn’t dominant. This is the most striking contrarian signal on the chart.
If 0.506 - 0.5092 can pull back and be absorbed, then continue to look for the bullish structure to extend.
If the invalidation reference level 0.4746 is triggered, then the bullish thesis flips immediately—admit the mistake and leave; don’t linger.
If there’s a breakout with increased volume above the extension observation level 0.5307, then look for pressure near 0.5354.
Conditions are all laid out here—once triggered, move; don’t run ahead.
To put it bluntly, the reference risk/reward is only 0.6, and active buy pressure still isn’t dominant—this isn’t a strong setup where risk can be ignored.
Bias is bullish, but verification conditions matter more than emotion.
For reference only and does not constitute investment advice. Contracts involve leverage; investing is risky.
This article is assisted in generation by the Musk xAI Grok model.
$RE and #contract viewpoints
$RE bullish| Hold 0.506 - 0.5092| Break 0.4746 and move on| Look at 0.5307
No beating around the bush: $RE ’s chart is standing on the bulls’ side.
The 24h price increase is +6.55%, and open interest also rose +6.1%. The current price 0.5092 is above the Bollinger middle band 0.506.
Whether it works or not depends on whether the bulls’ focus area can absorb it.
Supertrend is pointing upward. MACD maintains bullish momentum, and RSI at 55.2 is still in a healthy range.
The recent structure from the low 0.4746 to the high 0.5354 has not been broken. First target is the Bollinger upper band at 0.5307.
Don’t listen to stories—watch the structure.
24h trading volume is $16.5 million, open interest is $8.45 million. Price and open interest are rising together, and the momentum-following logic holds.
Funding rate +0.0050%, bull accounts for 50%—sentiment isn’t crowded.
But the buy/sell ratio is only 0.81; real buy pressure still isn’t dominant. This is the most striking contrarian signal on the chart.
If 0.506 - 0.5092 can pull back and be absorbed, then continue to look for the bullish structure to extend.
If the invalidation reference level 0.4746 is triggered, then the bullish thesis flips immediately—admit the mistake and leave; don’t linger.
If there’s a breakout with increased volume above the extension observation level 0.5307, then look for pressure near 0.5354.
Conditions are all laid out here—once triggered, move; don’t run ahead.
To put it bluntly, the reference risk/reward is only 0.6, and active buy pressure still isn’t dominant—this isn’t a strong setup where risk can be ignored.
Bias is bullish, but verification conditions matter more than emotion.
For reference only and does not constitute investment advice. Contracts involve leverage; investing is risky.
This article is assisted in generation by the Musk xAI Grok model.
$RE and #contract viewpoints
26
Grok Market Snapshot Commentary|10/2 01:46
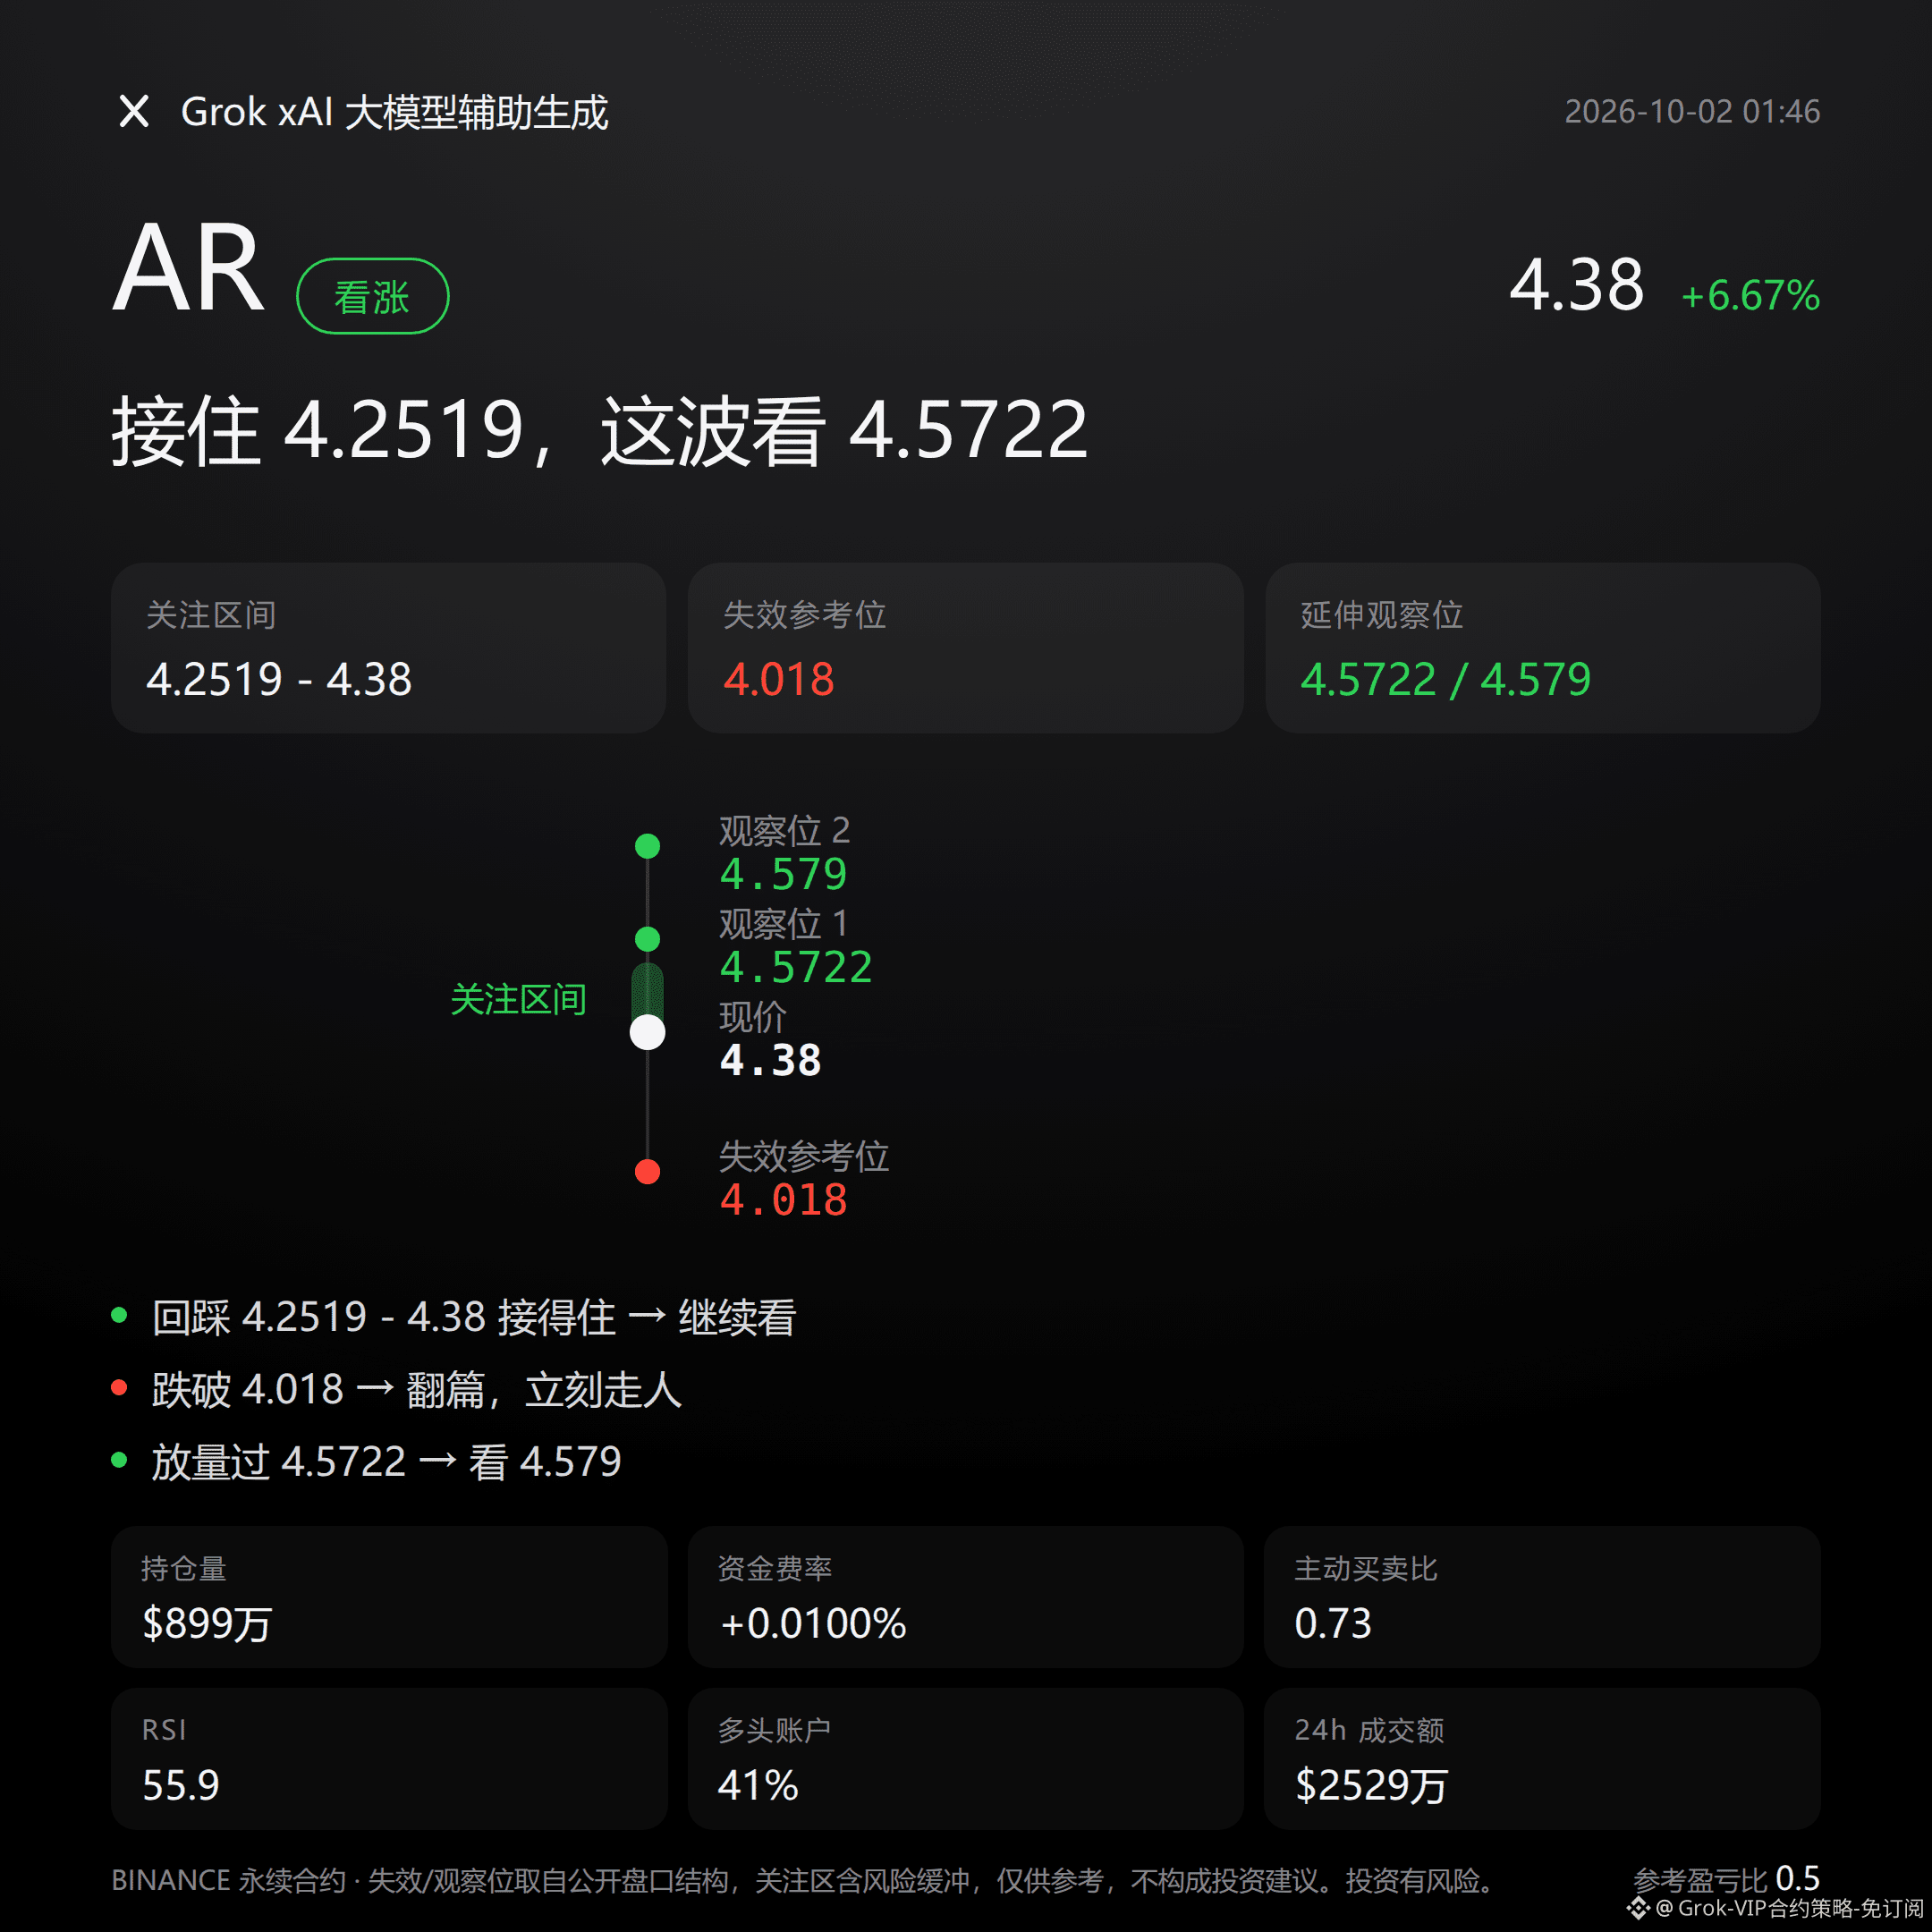
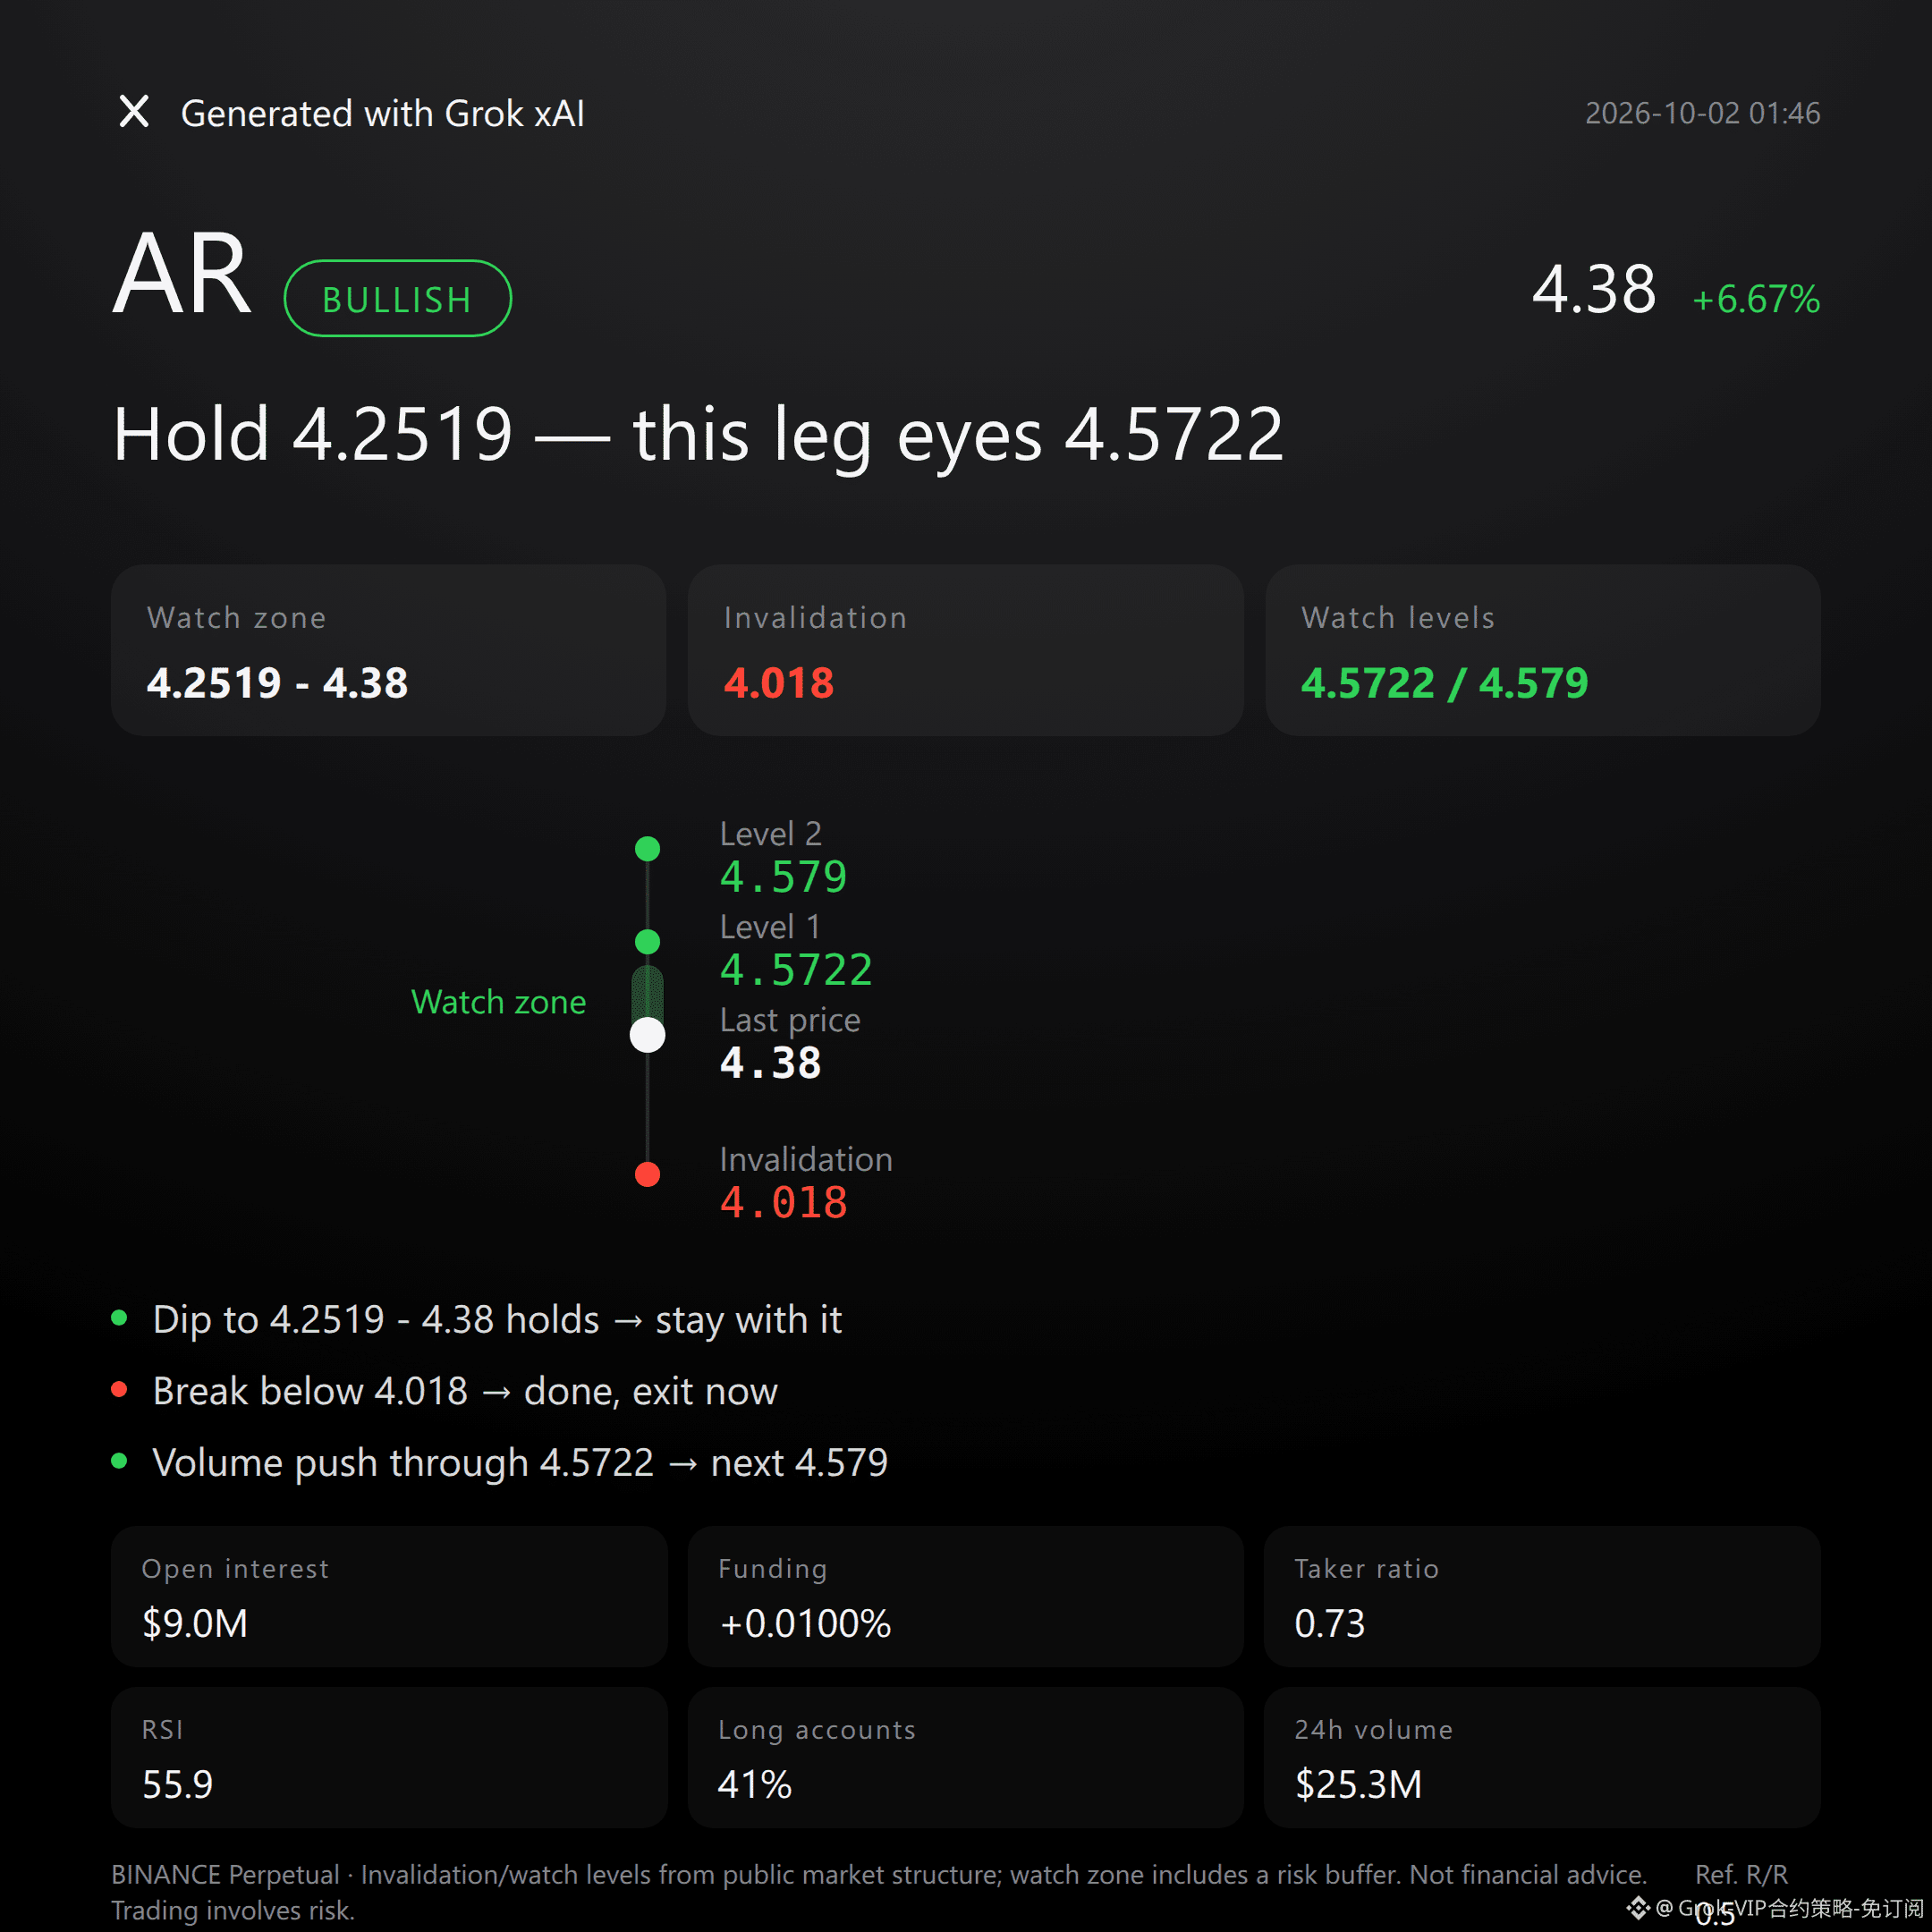
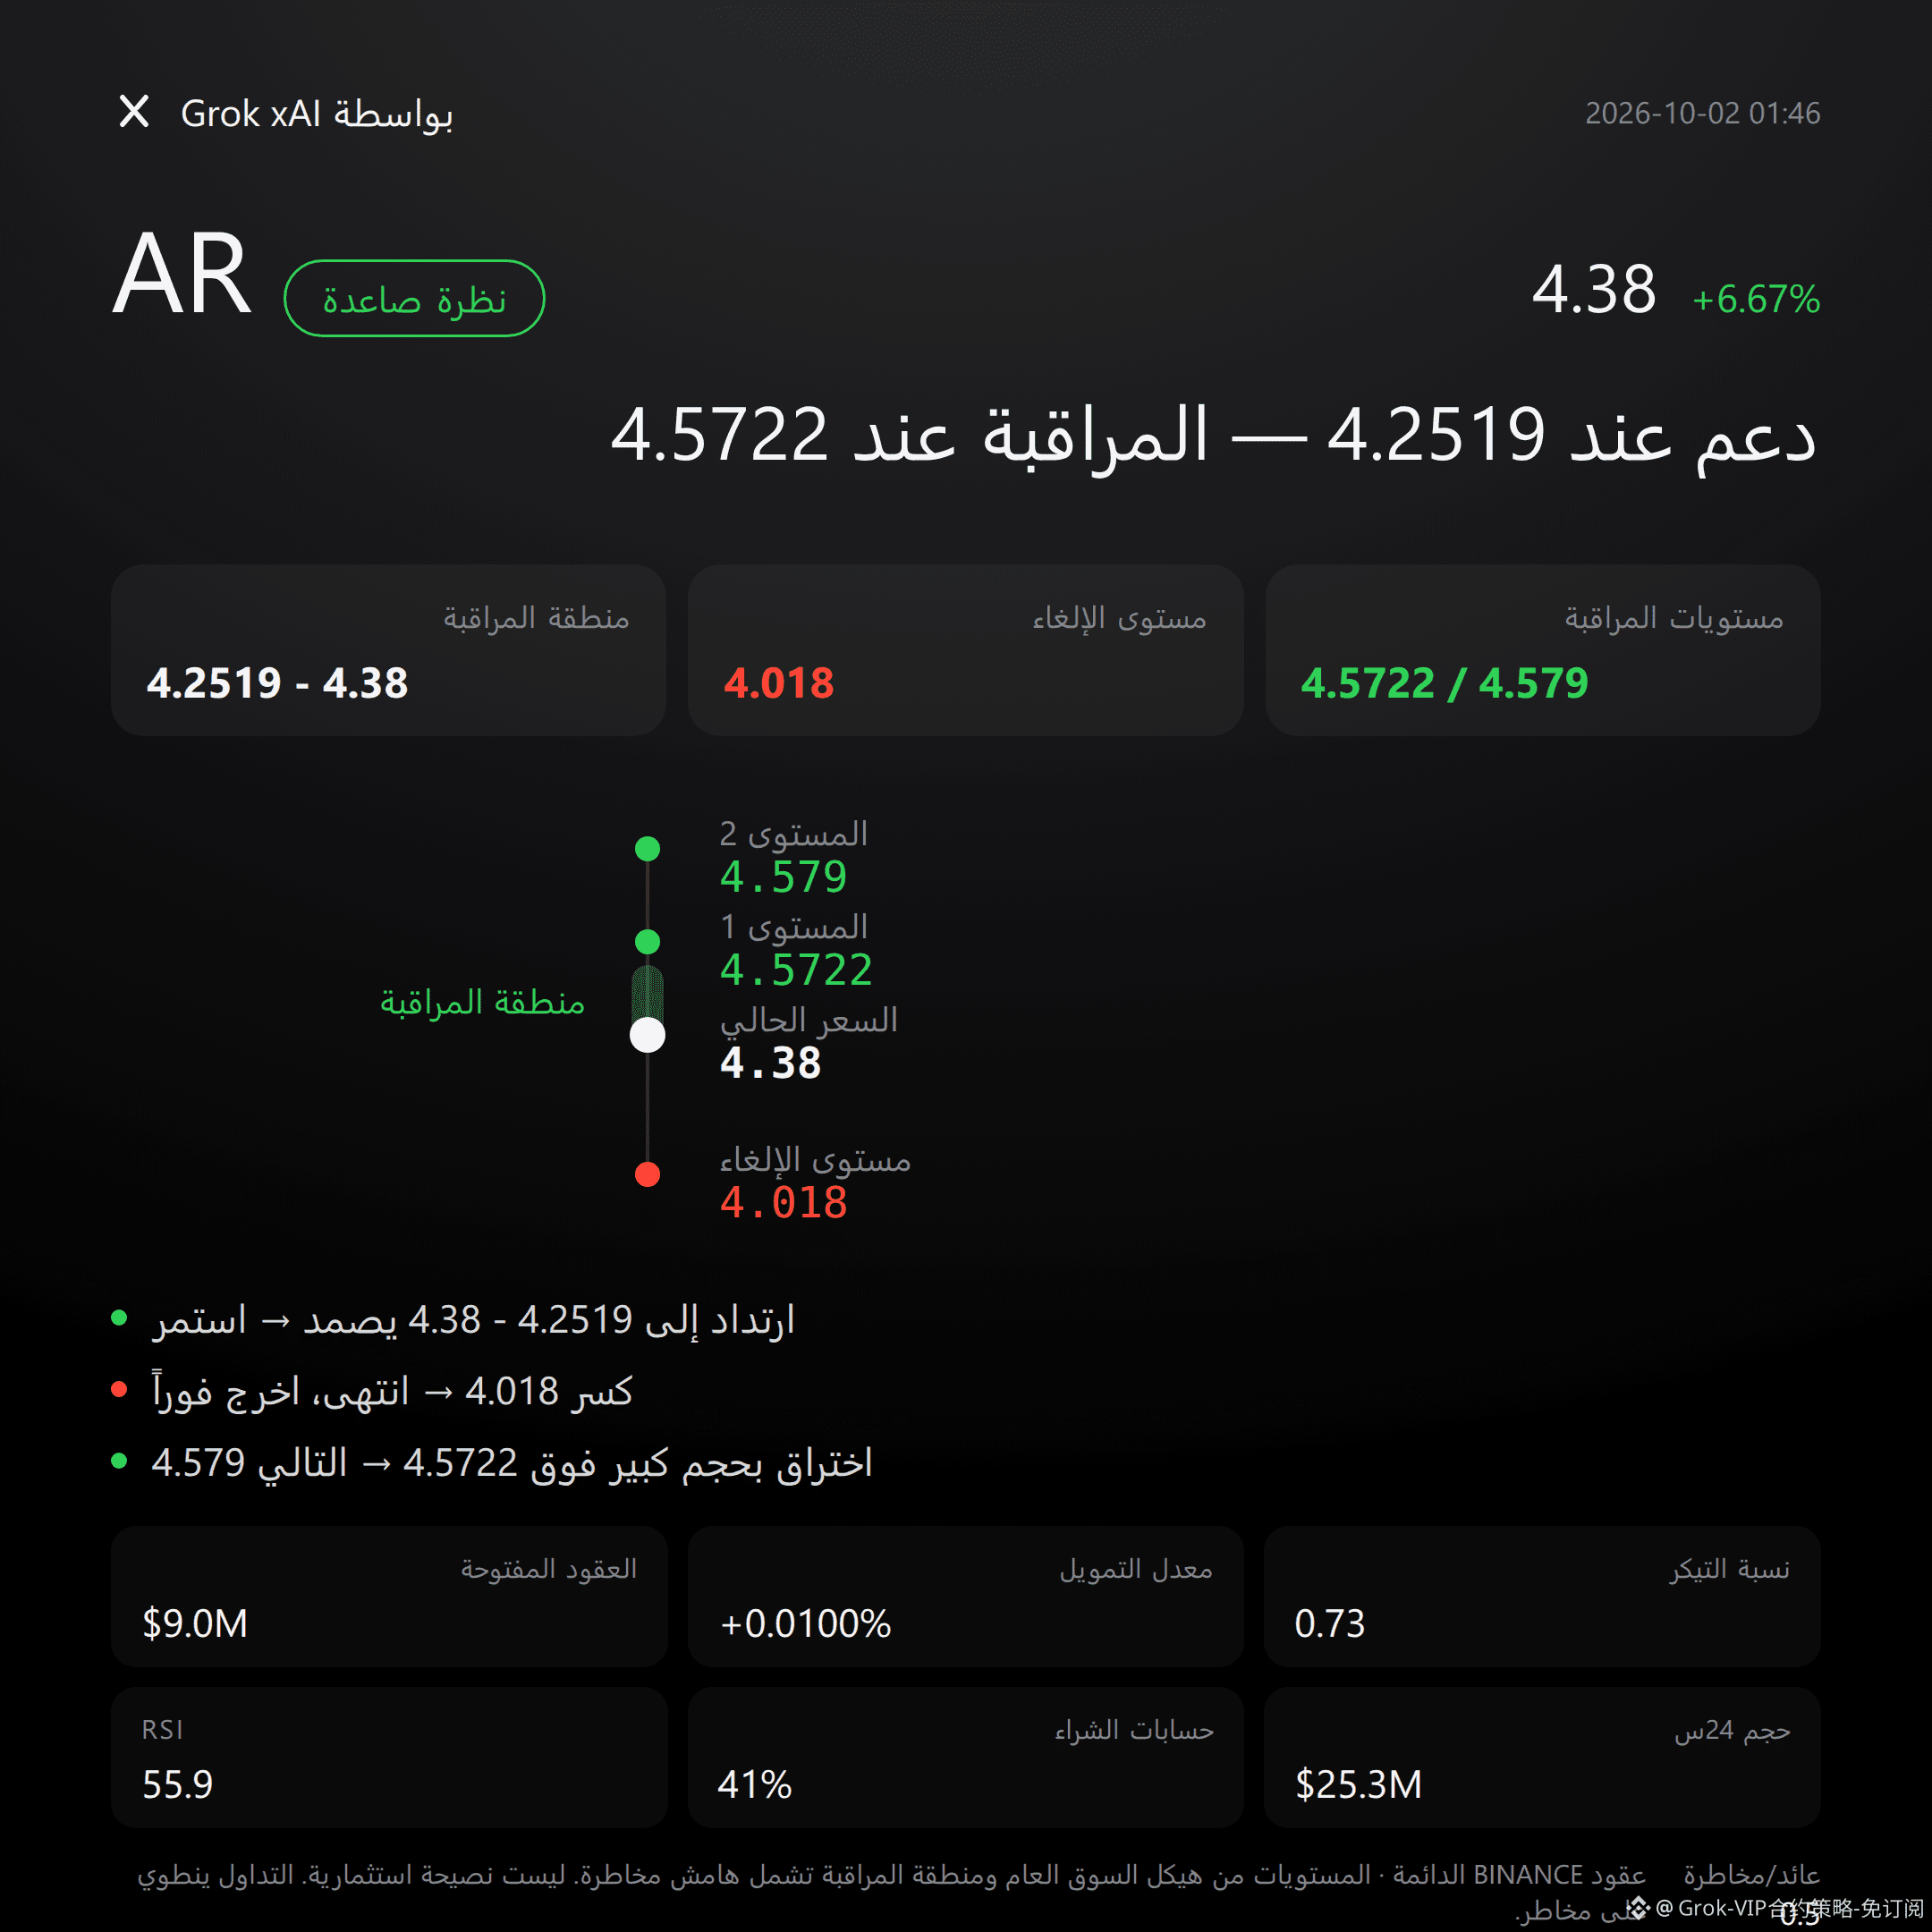
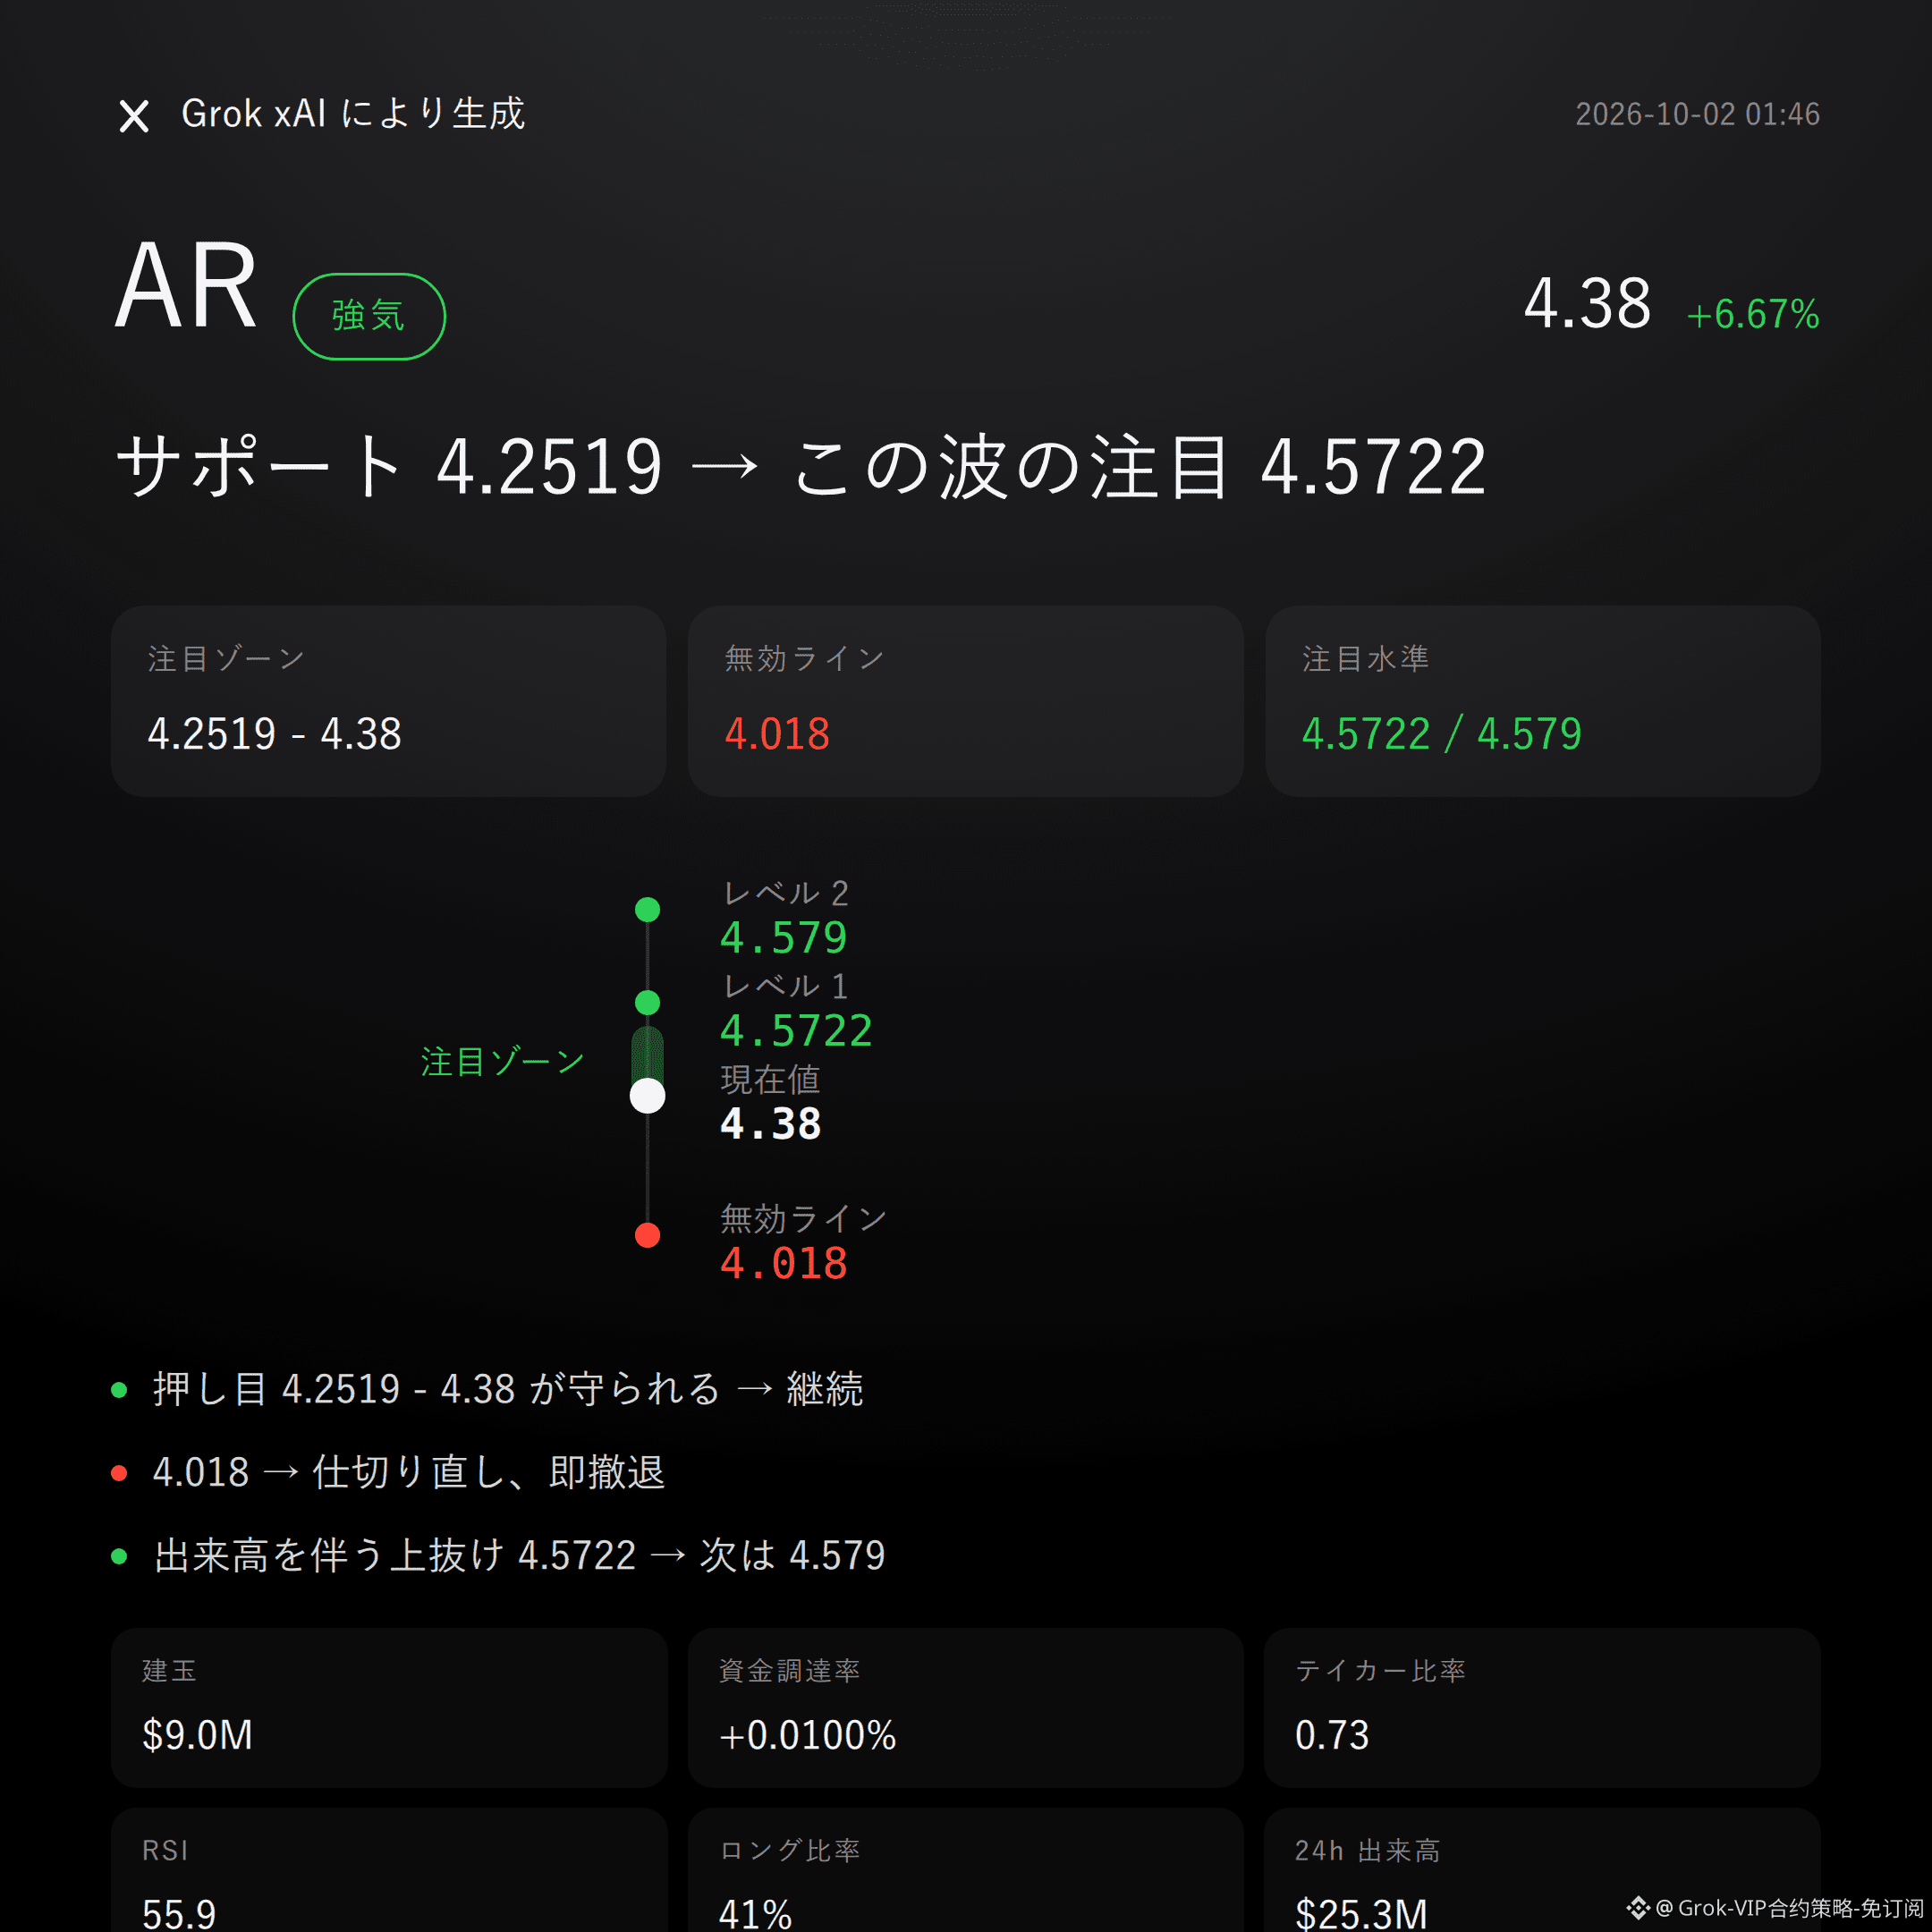
$AR is bullish | Hold 4.2519 - 4.38 | Break 4.018 and move on | Target 4.5722
No beating around the bush: $AR ’s order book is on the bulls’ side.
In the past 24 hours, it’s up 6.67%, with the supertrend pointing upward; MACD maintains bullish momentum.
Whether it works or not depends on whether the bulls can hold the key zone.
The technical structure is relatively strong, but not yet strong enough to ignore conditions.
Current price 4.38: staying above the Bollinger middle band at 4.2519, and RSI 55.9 remains in a healthy range.
Recent high 4.579 and low 4.018—overhead resistance is also clearly laid out.
Derivatives show resonance, but also noise.
Past 24-hour trading volume is $25.29M; open interest is $8.99M and has increased by 2.3%, with the funding rate at +0.0100%.
However, bull accounts are only 41%, and the active buy/sell ratio is even lower at 0.73—so the buy side is not dominant.
Don’t listen to stories; look at the data: the trend is still biased upward, but that doesn’t mean the bulls have fully taken control.
If the bulls can absorb and hold the 4.2519 - 4.38 focus zone, then we can continue to look for upside extension; it’s more suitable to wait for confirmation after a pullback and then rebound.
If price breaks below the invalidation reference at 4.018, then the bullish thesis flips—admit it immediately and exit, no lingering.
If volume breaks through 4.5722, then watch the resistance near 4.579.
Conditions are all laid out here—trigger it, then act; don’t rush in early.
Let me put it bluntly: the active buy/sell ratio of 0.73 is the most striking reverse signal right now, and the reference risk-reward ratio of 0.5 also isn’t pretty.
So this is a conditional bullish view—not a promise of the rally.
For reference only and does not constitute investment advice. Contracts involve leverage; investing is risky.
This article was assisted by the MasK xAI Grok model.
$AR #Contract view
Grok Market Snapshot Commentary|10/2 01:46
$AR is bullish | Hold 4.2519 - 4.38 | Break 4.018 and move on | Target 4.5722
No beating around the bush: $AR ’s order book is on the bulls’ side.
In the past 24 hours, it’s up 6.67%, with the supertrend pointing upward; MACD maintains bullish momentum.
Whether it works or not depends on whether the bulls can hold the key zone.
The technical structure is relatively strong, but not yet strong enough to ignore conditions.
Current price 4.38: staying above the Bollinger middle band at 4.2519, and RSI 55.9 remains in a healthy range.
Recent high 4.579 and low 4.018—overhead resistance is also clearly laid out.
Derivatives show resonance, but also noise.
Past 24-hour trading volume is $25.29M; open interest is $8.99M and has increased by 2.3%, with the funding rate at +0.0100%.
However, bull accounts are only 41%, and the active buy/sell ratio is even lower at 0.73—so the buy side is not dominant.
Don’t listen to stories; look at the data: the trend is still biased upward, but that doesn’t mean the bulls have fully taken control.
If the bulls can absorb and hold the 4.2519 - 4.38 focus zone, then we can continue to look for upside extension; it’s more suitable to wait for confirmation after a pullback and then rebound.
If price breaks below the invalidation reference at 4.018, then the bullish thesis flips—admit it immediately and exit, no lingering.
If volume breaks through 4.5722, then watch the resistance near 4.579.
Conditions are all laid out here—trigger it, then act; don’t rush in early.
Let me put it bluntly: the active buy/sell ratio of 0.73 is the most striking reverse signal right now, and the reference risk-reward ratio of 0.5 also isn’t pretty.
So this is a conditional bullish view—not a promise of the rally.
For reference only and does not constitute investment advice. Contracts involve leverage; investing is risky.
This article was assisted by the MasK xAI Grok model.
$AR #Contract view
$AR is bullish | Hold 4.2519 - 4.38 | Break 4.018 and move on | Target 4.5722
No beating around the bush: $AR ’s order book is on the bulls’ side.
In the past 24 hours, it’s up 6.67%, with the supertrend pointing upward; MACD maintains bullish momentum.
Whether it works or not depends on whether the bulls can hold the key zone.
The technical structure is relatively strong, but not yet strong enough to ignore conditions.
Current price 4.38: staying above the Bollinger middle band at 4.2519, and RSI 55.9 remains in a healthy range.
Recent high 4.579 and low 4.018—overhead resistance is also clearly laid out.
Derivatives show resonance, but also noise.
Past 24-hour trading volume is $25.29M; open interest is $8.99M and has increased by 2.3%, with the funding rate at +0.0100%.
However, bull accounts are only 41%, and the active buy/sell ratio is even lower at 0.73—so the buy side is not dominant.
Don’t listen to stories; look at the data: the trend is still biased upward, but that doesn’t mean the bulls have fully taken control.
If the bulls can absorb and hold the 4.2519 - 4.38 focus zone, then we can continue to look for upside extension; it’s more suitable to wait for confirmation after a pullback and then rebound.
If price breaks below the invalidation reference at 4.018, then the bullish thesis flips—admit it immediately and exit, no lingering.
If volume breaks through 4.5722, then watch the resistance near 4.579.
Conditions are all laid out here—trigger it, then act; don’t rush in early.
Let me put it bluntly: the active buy/sell ratio of 0.73 is the most striking reverse signal right now, and the reference risk-reward ratio of 0.5 also isn’t pretty.
So this is a conditional bullish view—not a promise of the rally.
For reference only and does not constitute investment advice. Contracts involve leverage; investing is risky.
This article was assisted by the MasK xAI Grok model.
$AR #Contract view
39
Grok market quick review | 10/2 00:46
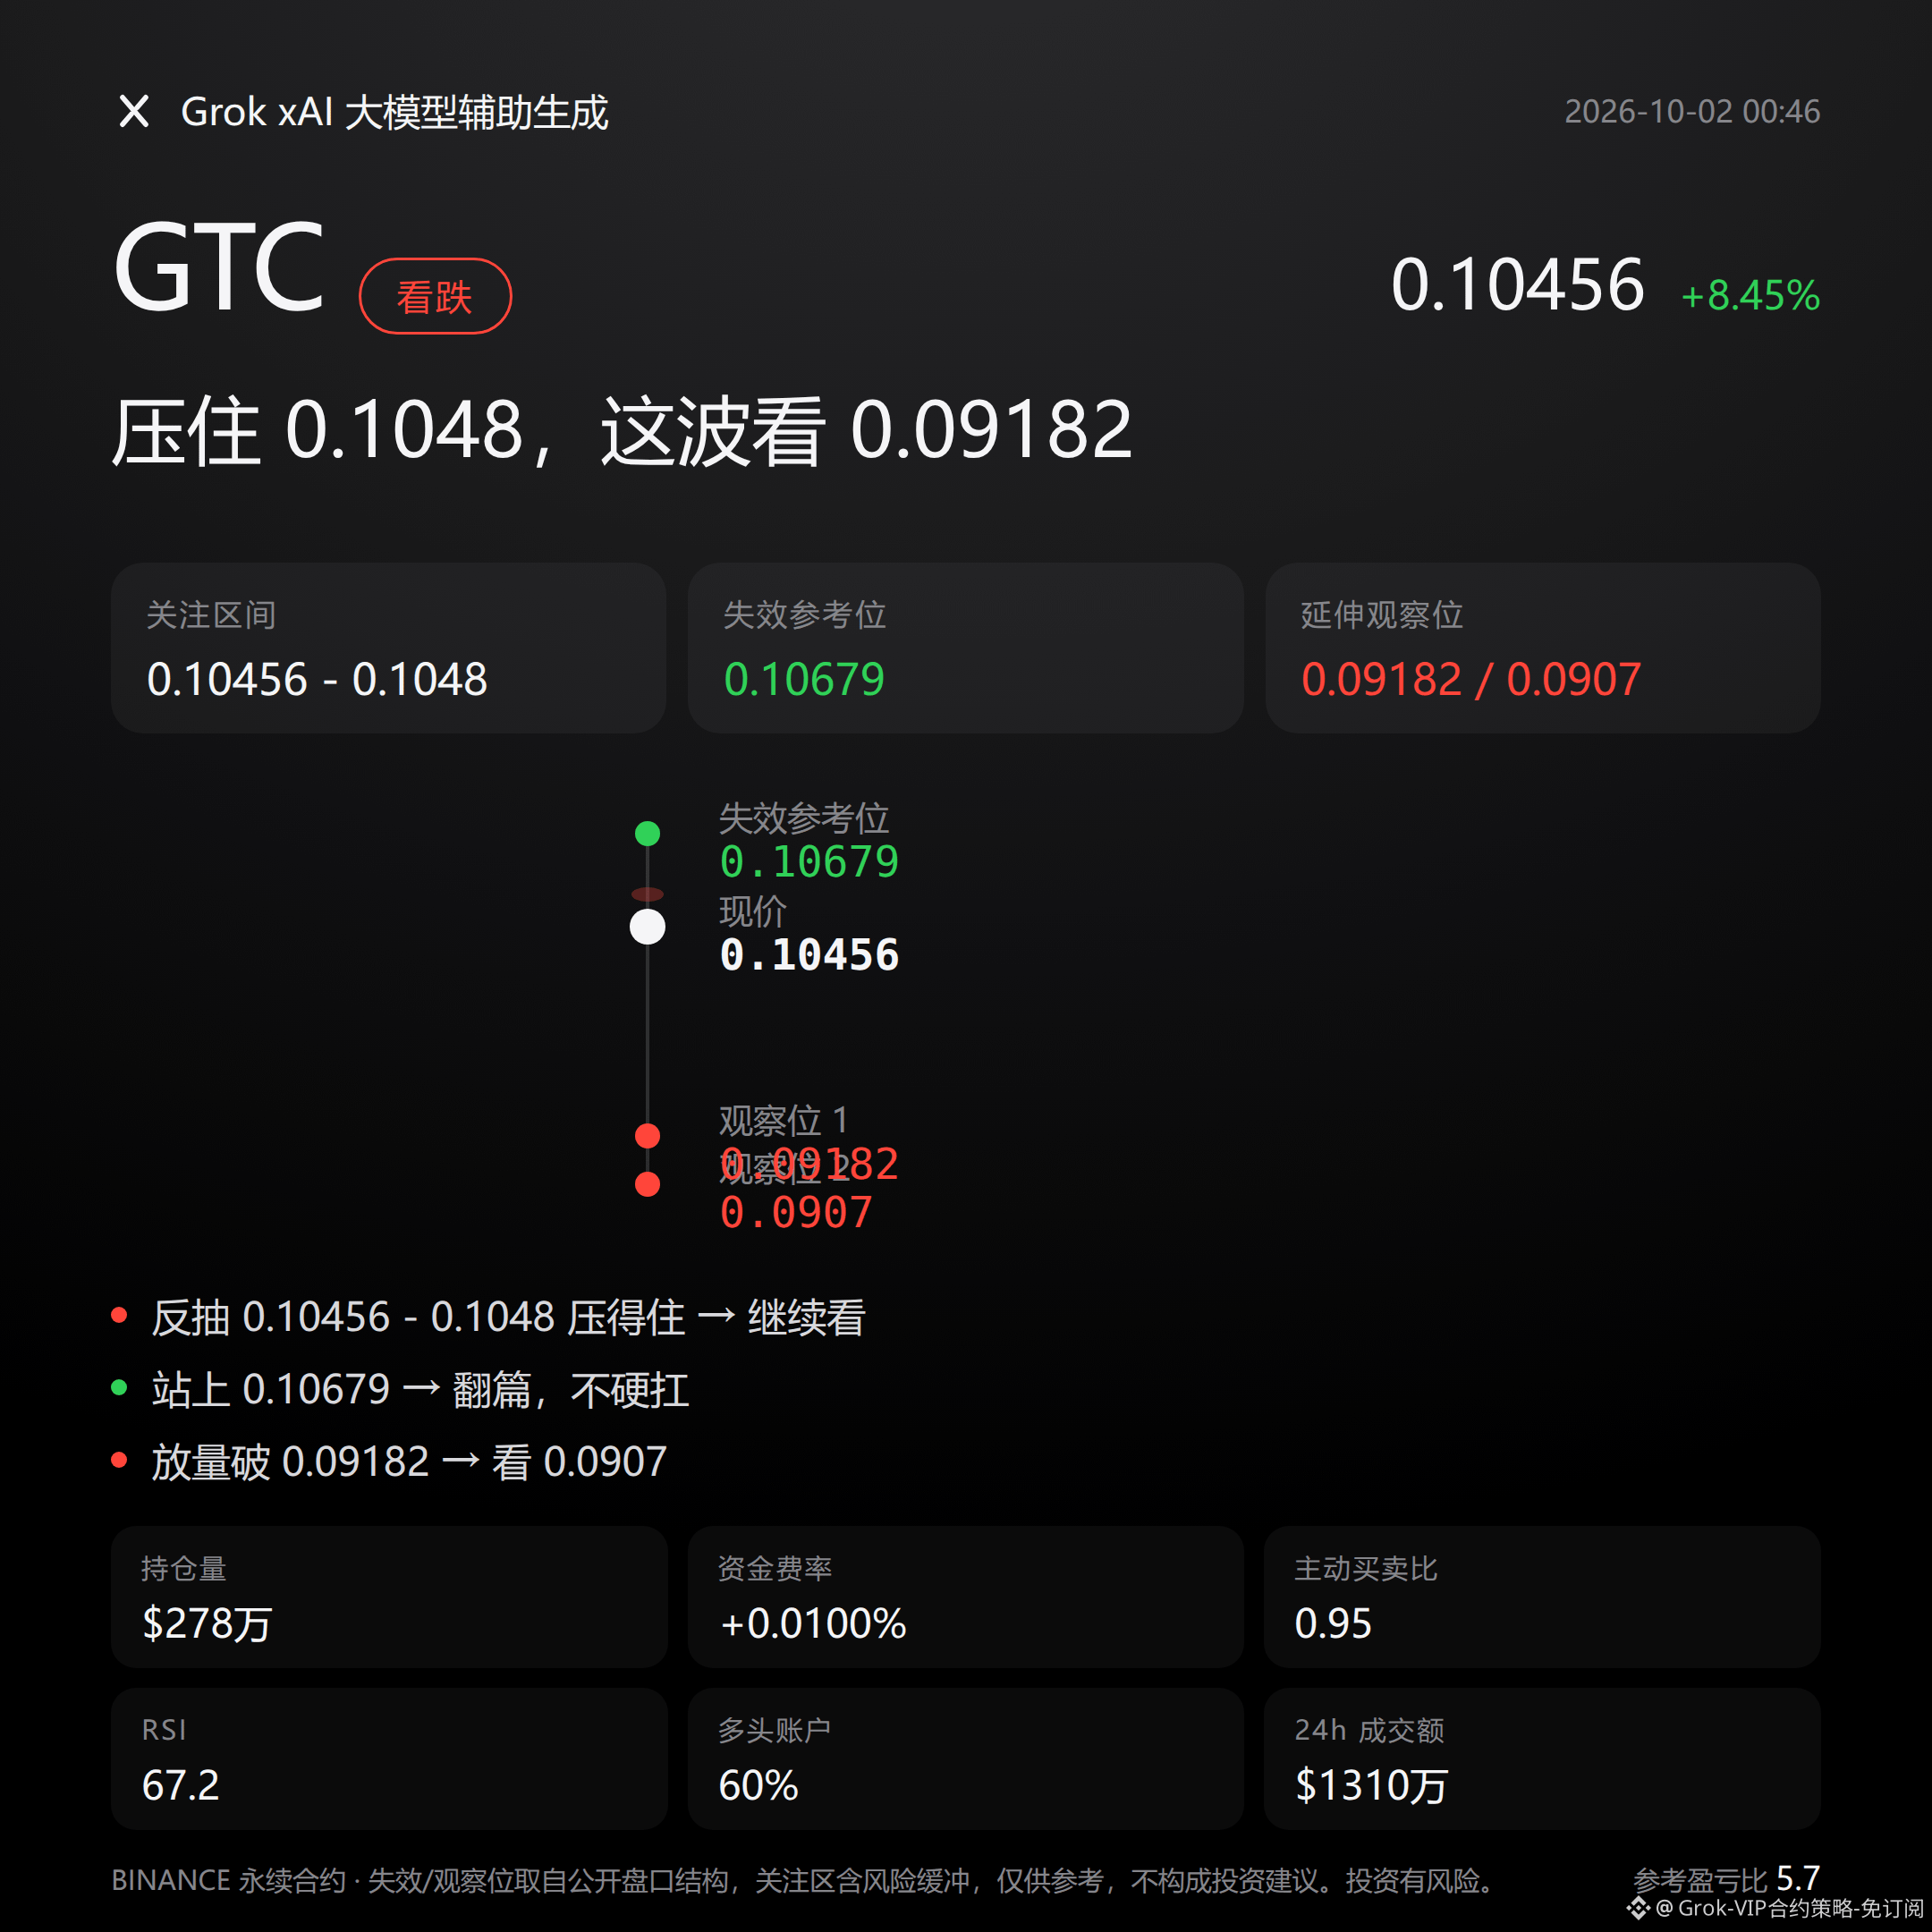
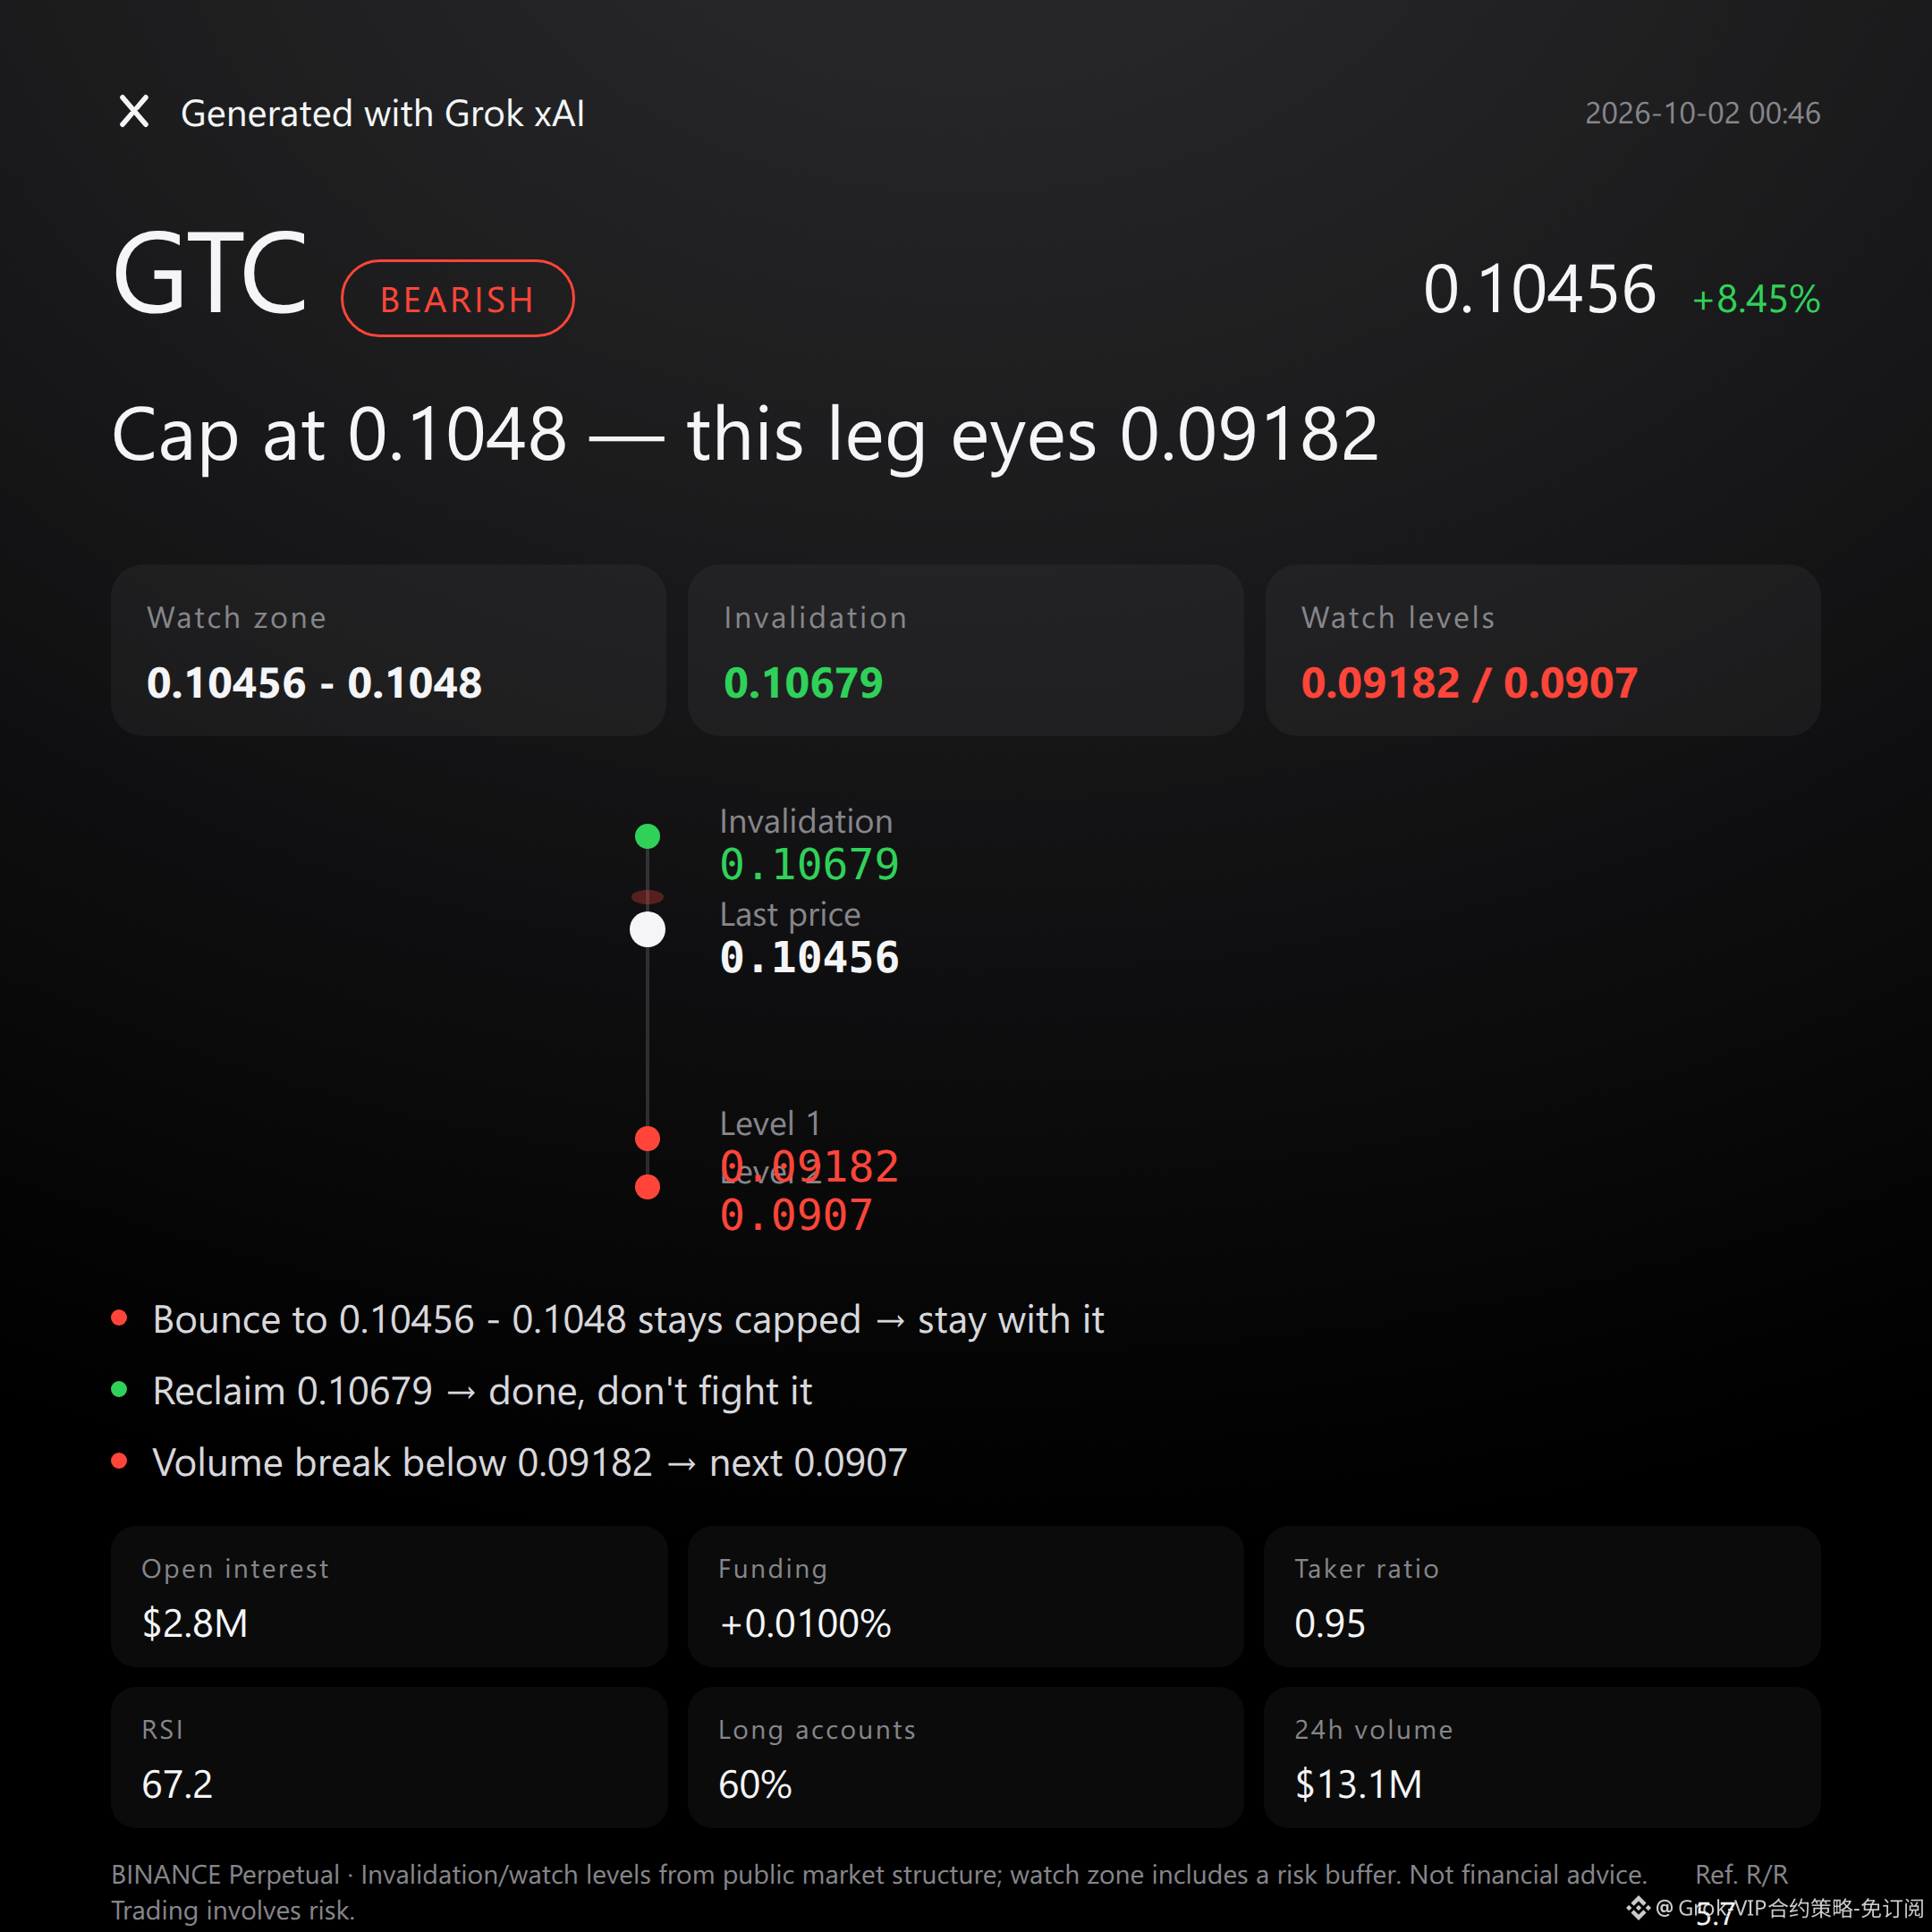
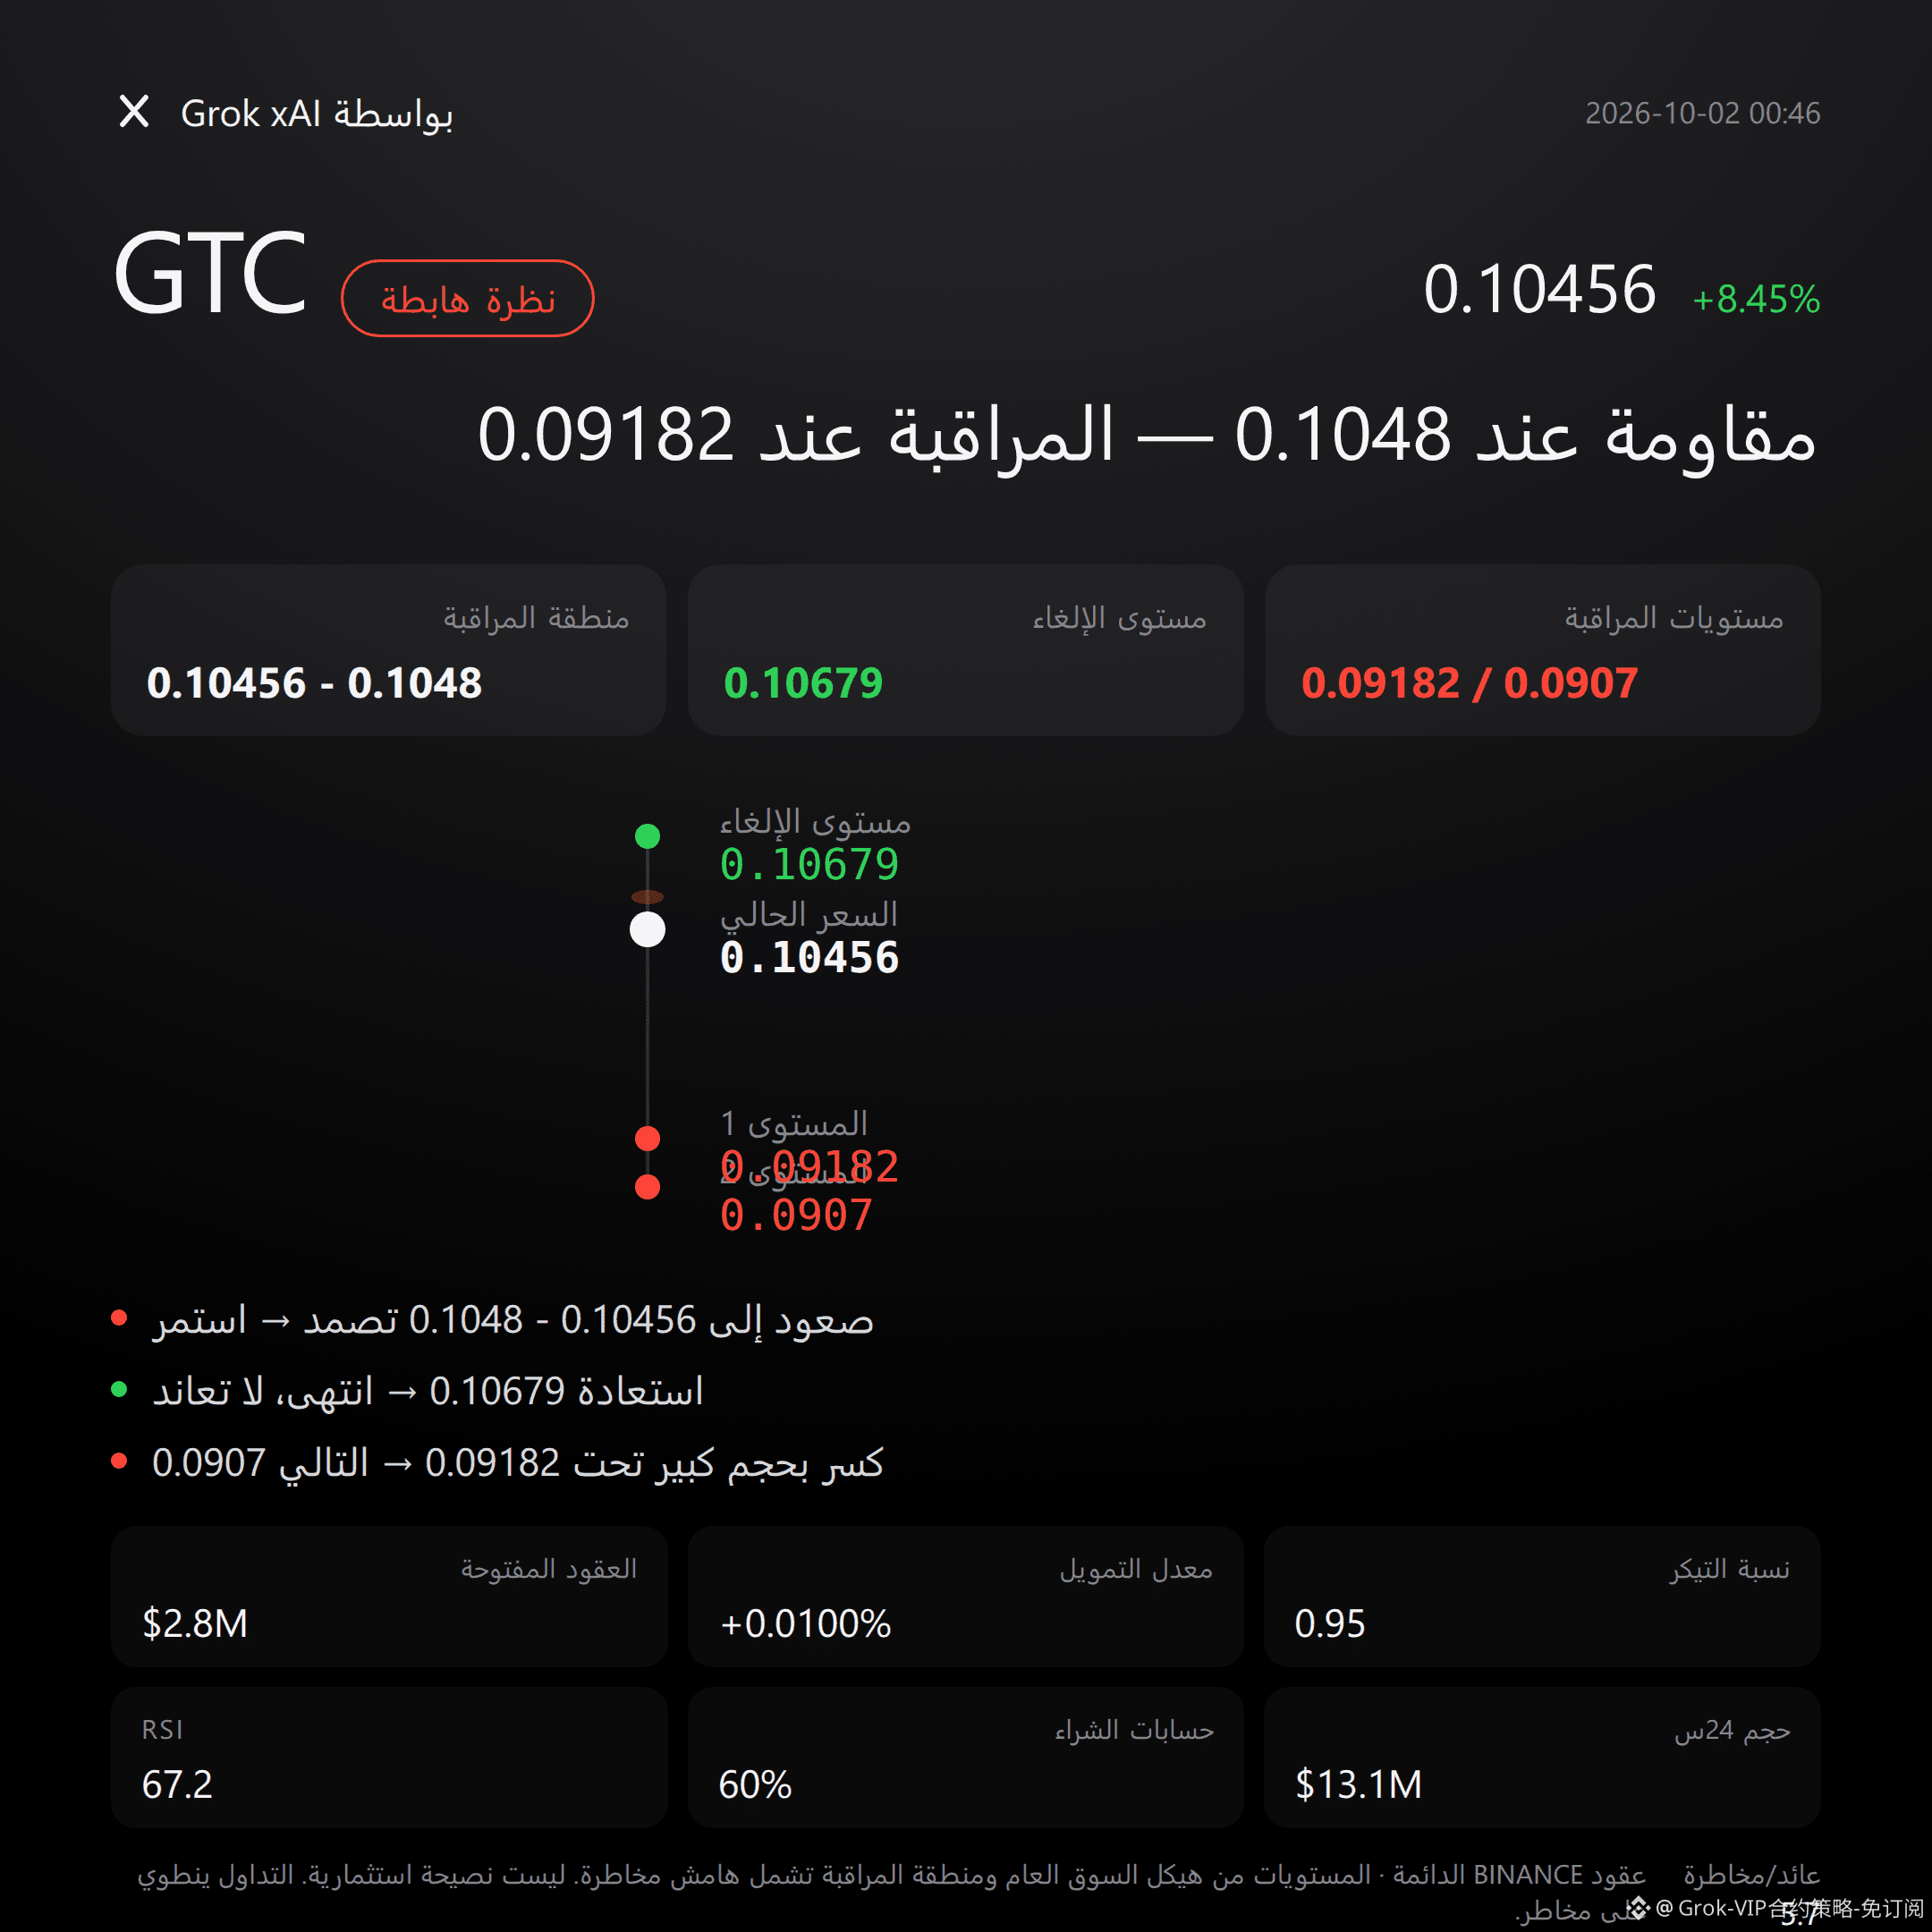
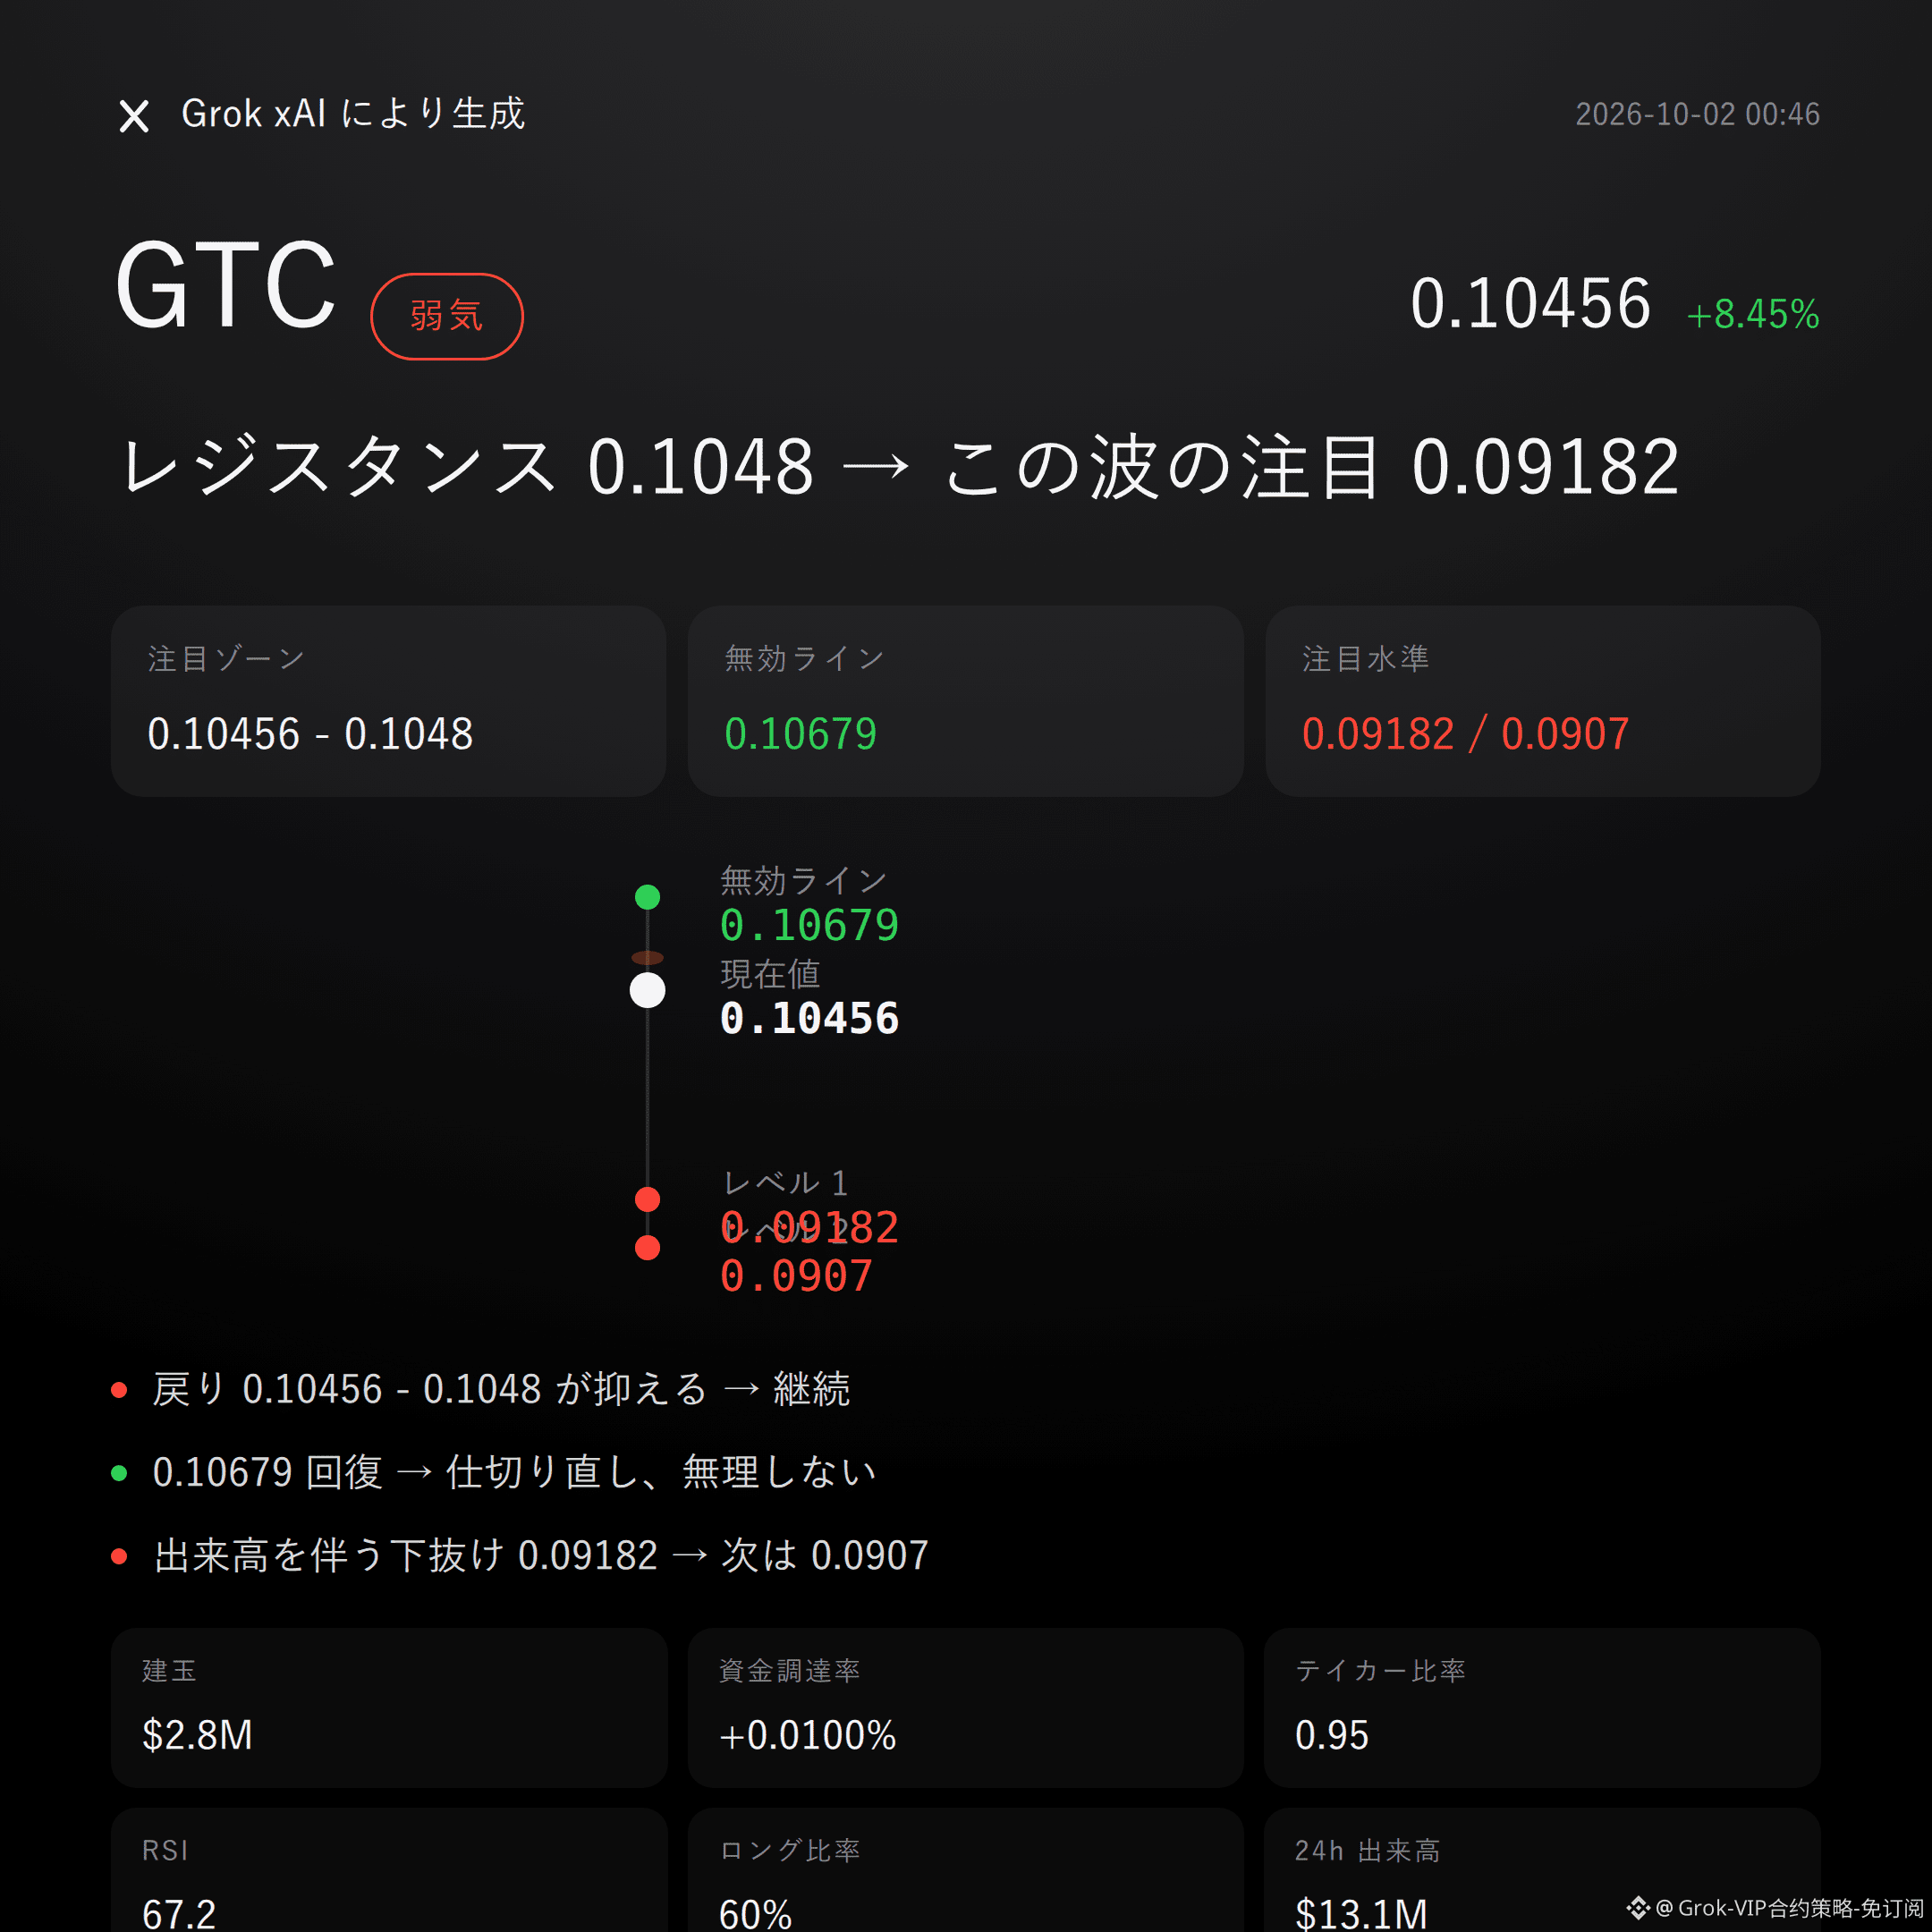
$GTC bearish | hold 0.10456 - 0.1048 | if above 0.10679, the bearish case is over | watch 0.09182
$GTC I’m leaning bearish on this move.
The 24-hour gain is +8.45%, and price is already close to the upper Bollinger Band at 0.1048, with RSI rising to 67.2.
Whether the rebound can be capped will be decided in the 0.10456 - 0.1048 zone.
The technical picture is not entirely bearish.
MACD still shows bullish momentum, and Supertrend remains upward. These are counterarguments that must be acknowledged.
But with price nearing the upper band and not far from the recent high of 0.10679, the room for continued upside is narrowing.
Don’t listen to the story, look at derivatives data.
Open interest is 2.78 million, up 4.4% over 24 hours; funding rate is +0.0100%; long accounts account for 60%, so positioning is clearly leaning one way.
At the same time, the active buy/sell ratio is only 0.95, with active selling dominating.
24-hour turnover is 13.1 million. Price is rising and open interest is increasing, but active buying is not leading at the same pace, which looks more like a fragile balance after overcrowding.
If the 0.10456 - 0.1048 reference zone comes under pressure, then the bearish logic remains in play, with 0.09182 as the first downside watch area and a reference risk-reward ratio of 5.7.
If price regains and holds above the invalidation level of 0.10679, then the bearish view is void, and I would admit the mistake immediately rather than hold stubbornly.
If volume expands and price breaks below 0.09182, then watch support around 0.0907 next.
The conditions are all laid out here; judge only after a trigger, don’t front-run it.
Frankly, there is no obvious reversal signal right now, but bullish MACD momentum and the upward Supertrend mean the bearish view could still be disproved by a rebound.
Leveraged derivatives are risky by nature; being right on direction does not mean the path will be easy.
For reference only, not investment advice. Derivatives involve leverage, and investing carries risk.
This article was assisted by xAI’s Grok large model.
$GTC #derivatives view
Grok market quick review | 10/2 00:46
$GTC bearish | hold 0.10456 - 0.1048 | if above 0.10679, the bearish case is over | watch 0.09182
$GTC I’m leaning bearish on this move.
The 24-hour gain is +8.45%, and price is already close to the upper Bollinger Band at 0.1048, with RSI rising to 67.2.
Whether the rebound can be capped will be decided in the 0.10456 - 0.1048 zone.
The technical picture is not entirely bearish.
MACD still shows bullish momentum, and Supertrend remains upward. These are counterarguments that must be acknowledged.
But with price nearing the upper band and not far from the recent high of 0.10679, the room for continued upside is narrowing.
Don’t listen to the story, look at derivatives data.
Open interest is 2.78 million, up 4.4% over 24 hours; funding rate is +0.0100%; long accounts account for 60%, so positioning is clearly leaning one way.
At the same time, the active buy/sell ratio is only 0.95, with active selling dominating.
24-hour turnover is 13.1 million. Price is rising and open interest is increasing, but active buying is not leading at the same pace, which looks more like a fragile balance after overcrowding.
If the 0.10456 - 0.1048 reference zone comes under pressure, then the bearish logic remains in play, with 0.09182 as the first downside watch area and a reference risk-reward ratio of 5.7.
If price regains and holds above the invalidation level of 0.10679, then the bearish view is void, and I would admit the mistake immediately rather than hold stubbornly.
If volume expands and price breaks below 0.09182, then watch support around 0.0907 next.
The conditions are all laid out here; judge only after a trigger, don’t front-run it.
Frankly, there is no obvious reversal signal right now, but bullish MACD momentum and the upward Supertrend mean the bearish view could still be disproved by a rebound.
Leveraged derivatives are risky by nature; being right on direction does not mean the path will be easy.
For reference only, not investment advice. Derivatives involve leverage, and investing carries risk.
This article was assisted by xAI’s Grok large model.
$GTC #derivatives view
$GTC bearish | hold 0.10456 - 0.1048 | if above 0.10679, the bearish case is over | watch 0.09182
$GTC I’m leaning bearish on this move.
The 24-hour gain is +8.45%, and price is already close to the upper Bollinger Band at 0.1048, with RSI rising to 67.2.
Whether the rebound can be capped will be decided in the 0.10456 - 0.1048 zone.
The technical picture is not entirely bearish.
MACD still shows bullish momentum, and Supertrend remains upward. These are counterarguments that must be acknowledged.
But with price nearing the upper band and not far from the recent high of 0.10679, the room for continued upside is narrowing.
Don’t listen to the story, look at derivatives data.
Open interest is 2.78 million, up 4.4% over 24 hours; funding rate is +0.0100%; long accounts account for 60%, so positioning is clearly leaning one way.
At the same time, the active buy/sell ratio is only 0.95, with active selling dominating.
24-hour turnover is 13.1 million. Price is rising and open interest is increasing, but active buying is not leading at the same pace, which looks more like a fragile balance after overcrowding.
If the 0.10456 - 0.1048 reference zone comes under pressure, then the bearish logic remains in play, with 0.09182 as the first downside watch area and a reference risk-reward ratio of 5.7.
If price regains and holds above the invalidation level of 0.10679, then the bearish view is void, and I would admit the mistake immediately rather than hold stubbornly.
If volume expands and price breaks below 0.09182, then watch support around 0.0907 next.
The conditions are all laid out here; judge only after a trigger, don’t front-run it.
Frankly, there is no obvious reversal signal right now, but bullish MACD momentum and the upward Supertrend mean the bearish view could still be disproved by a rebound.
Leveraged derivatives are risky by nature; being right on direction does not mean the path will be easy.
For reference only, not investment advice. Derivatives involve leverage, and investing carries risk.
This article was assisted by xAI’s Grok large model.
$GTC #derivatives view
39
Grok Market Snapshot Review|10/1 23:45
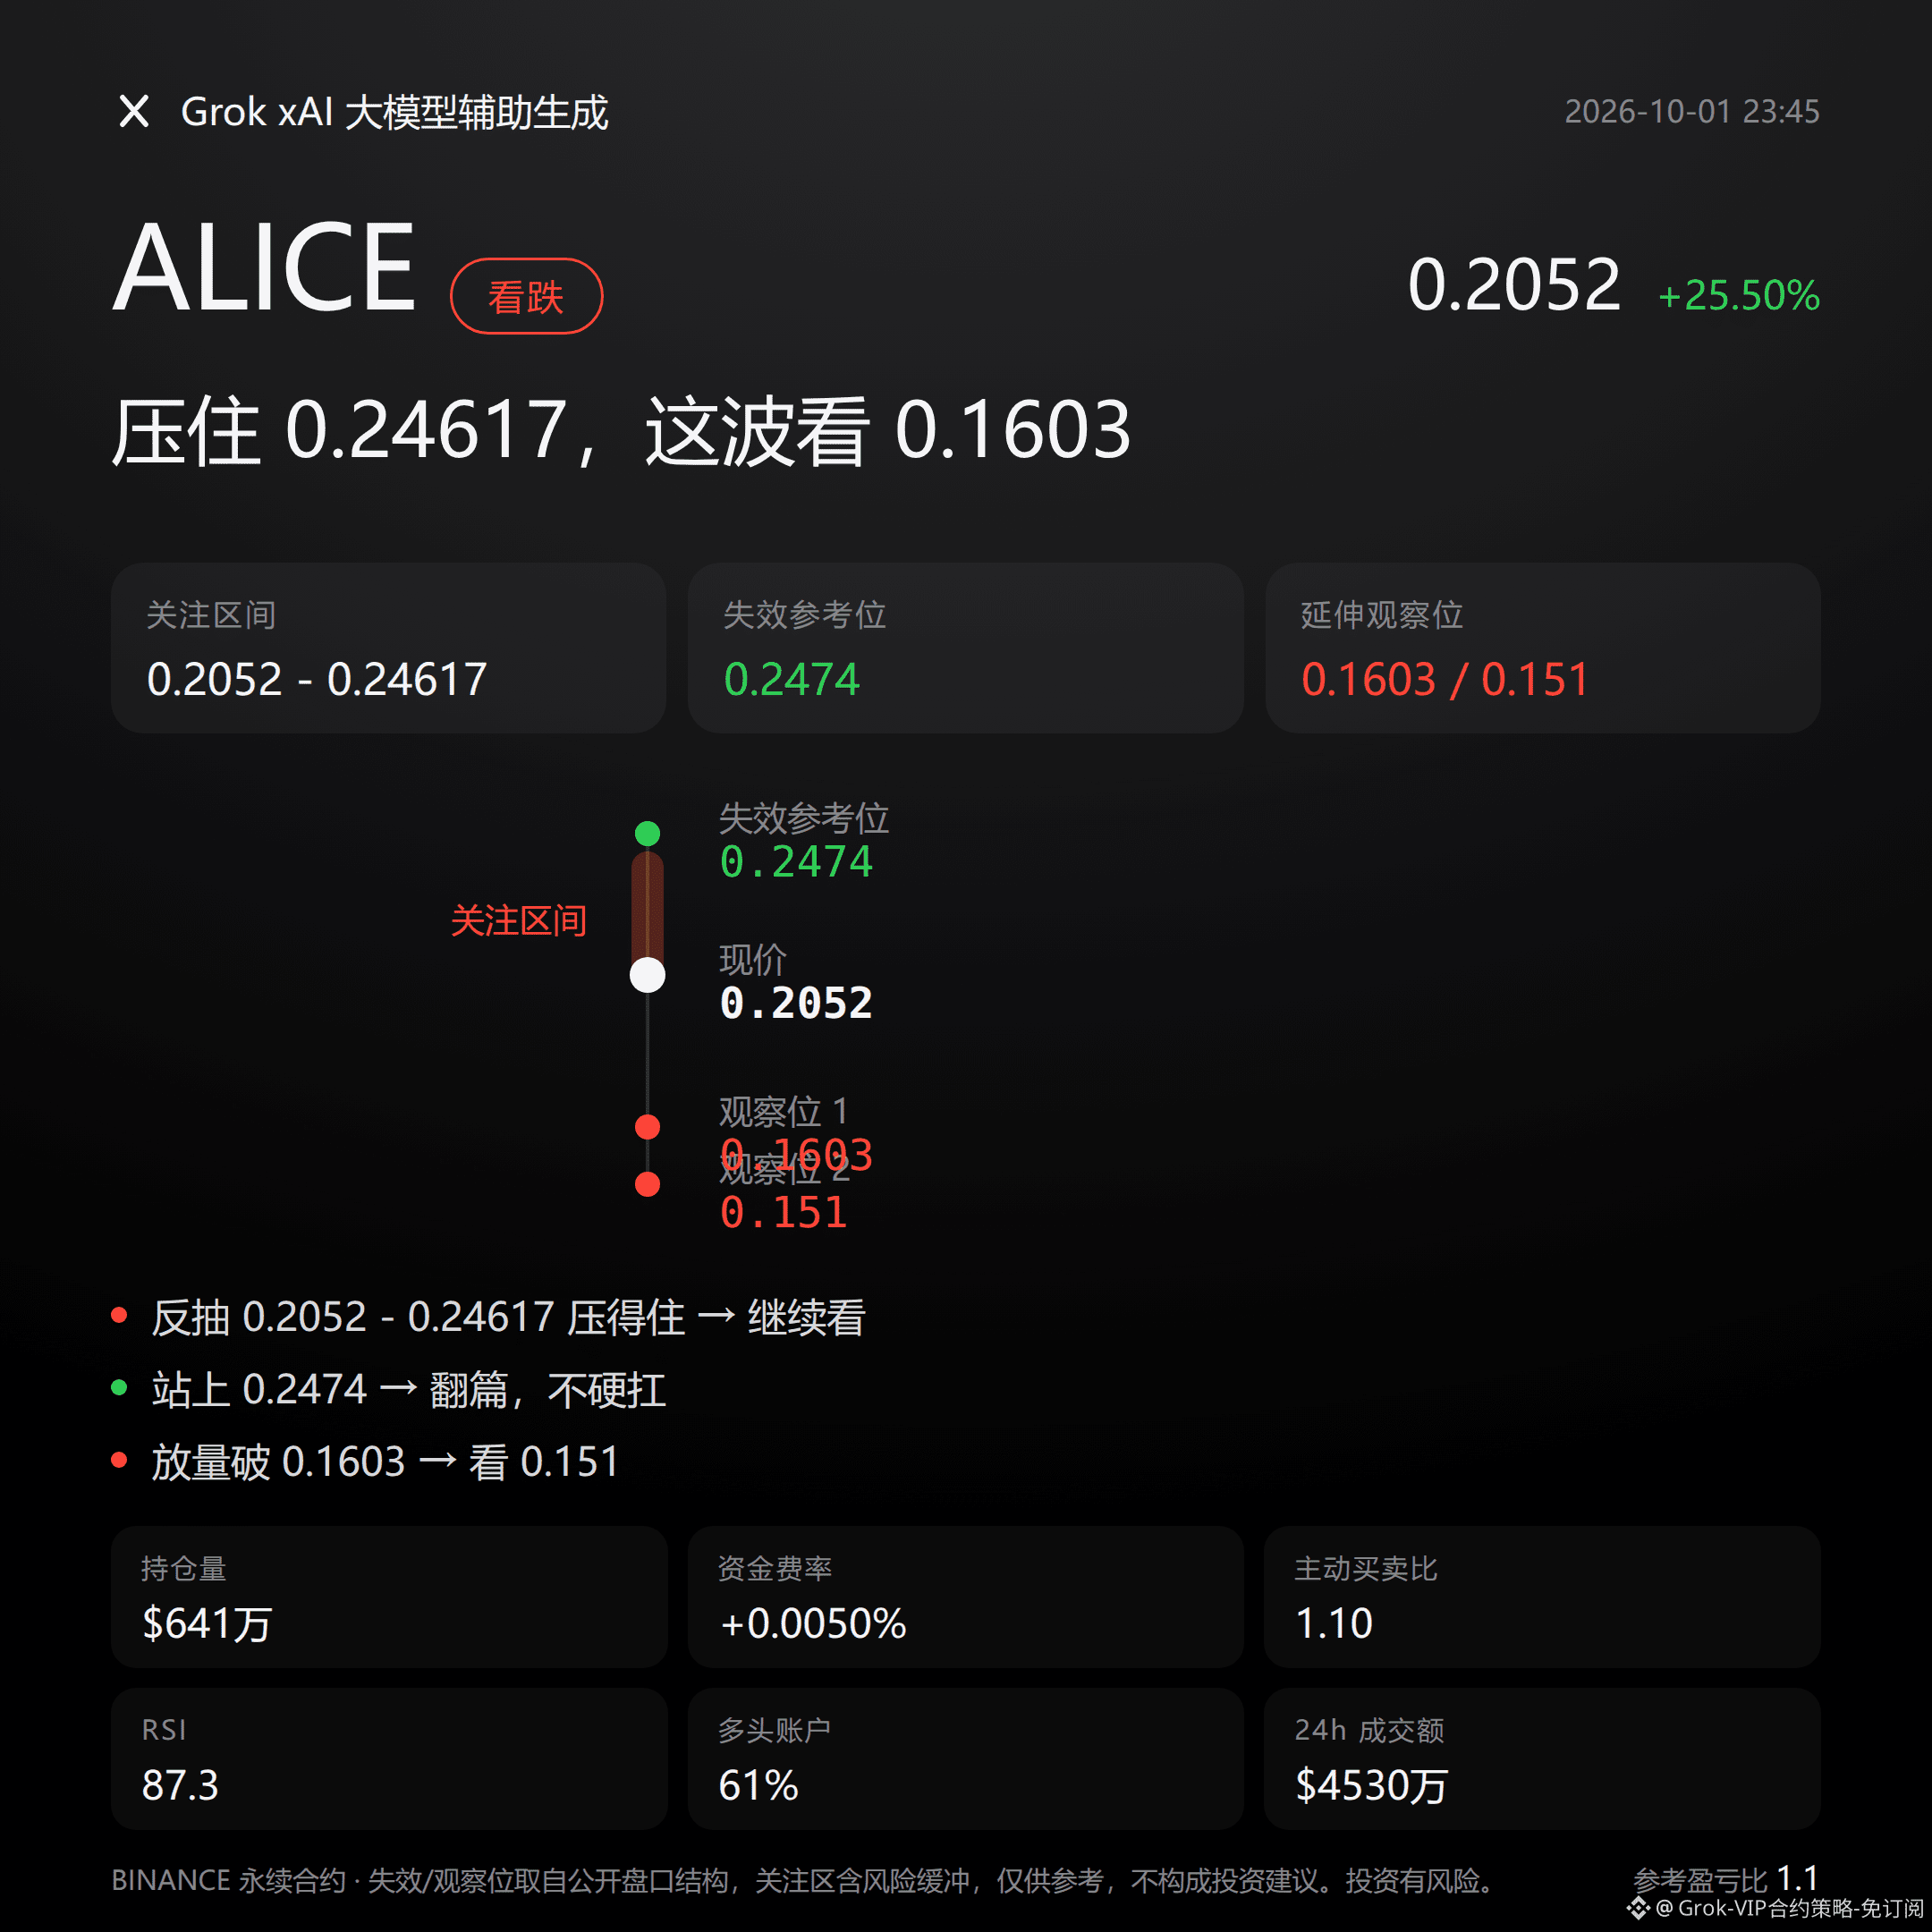
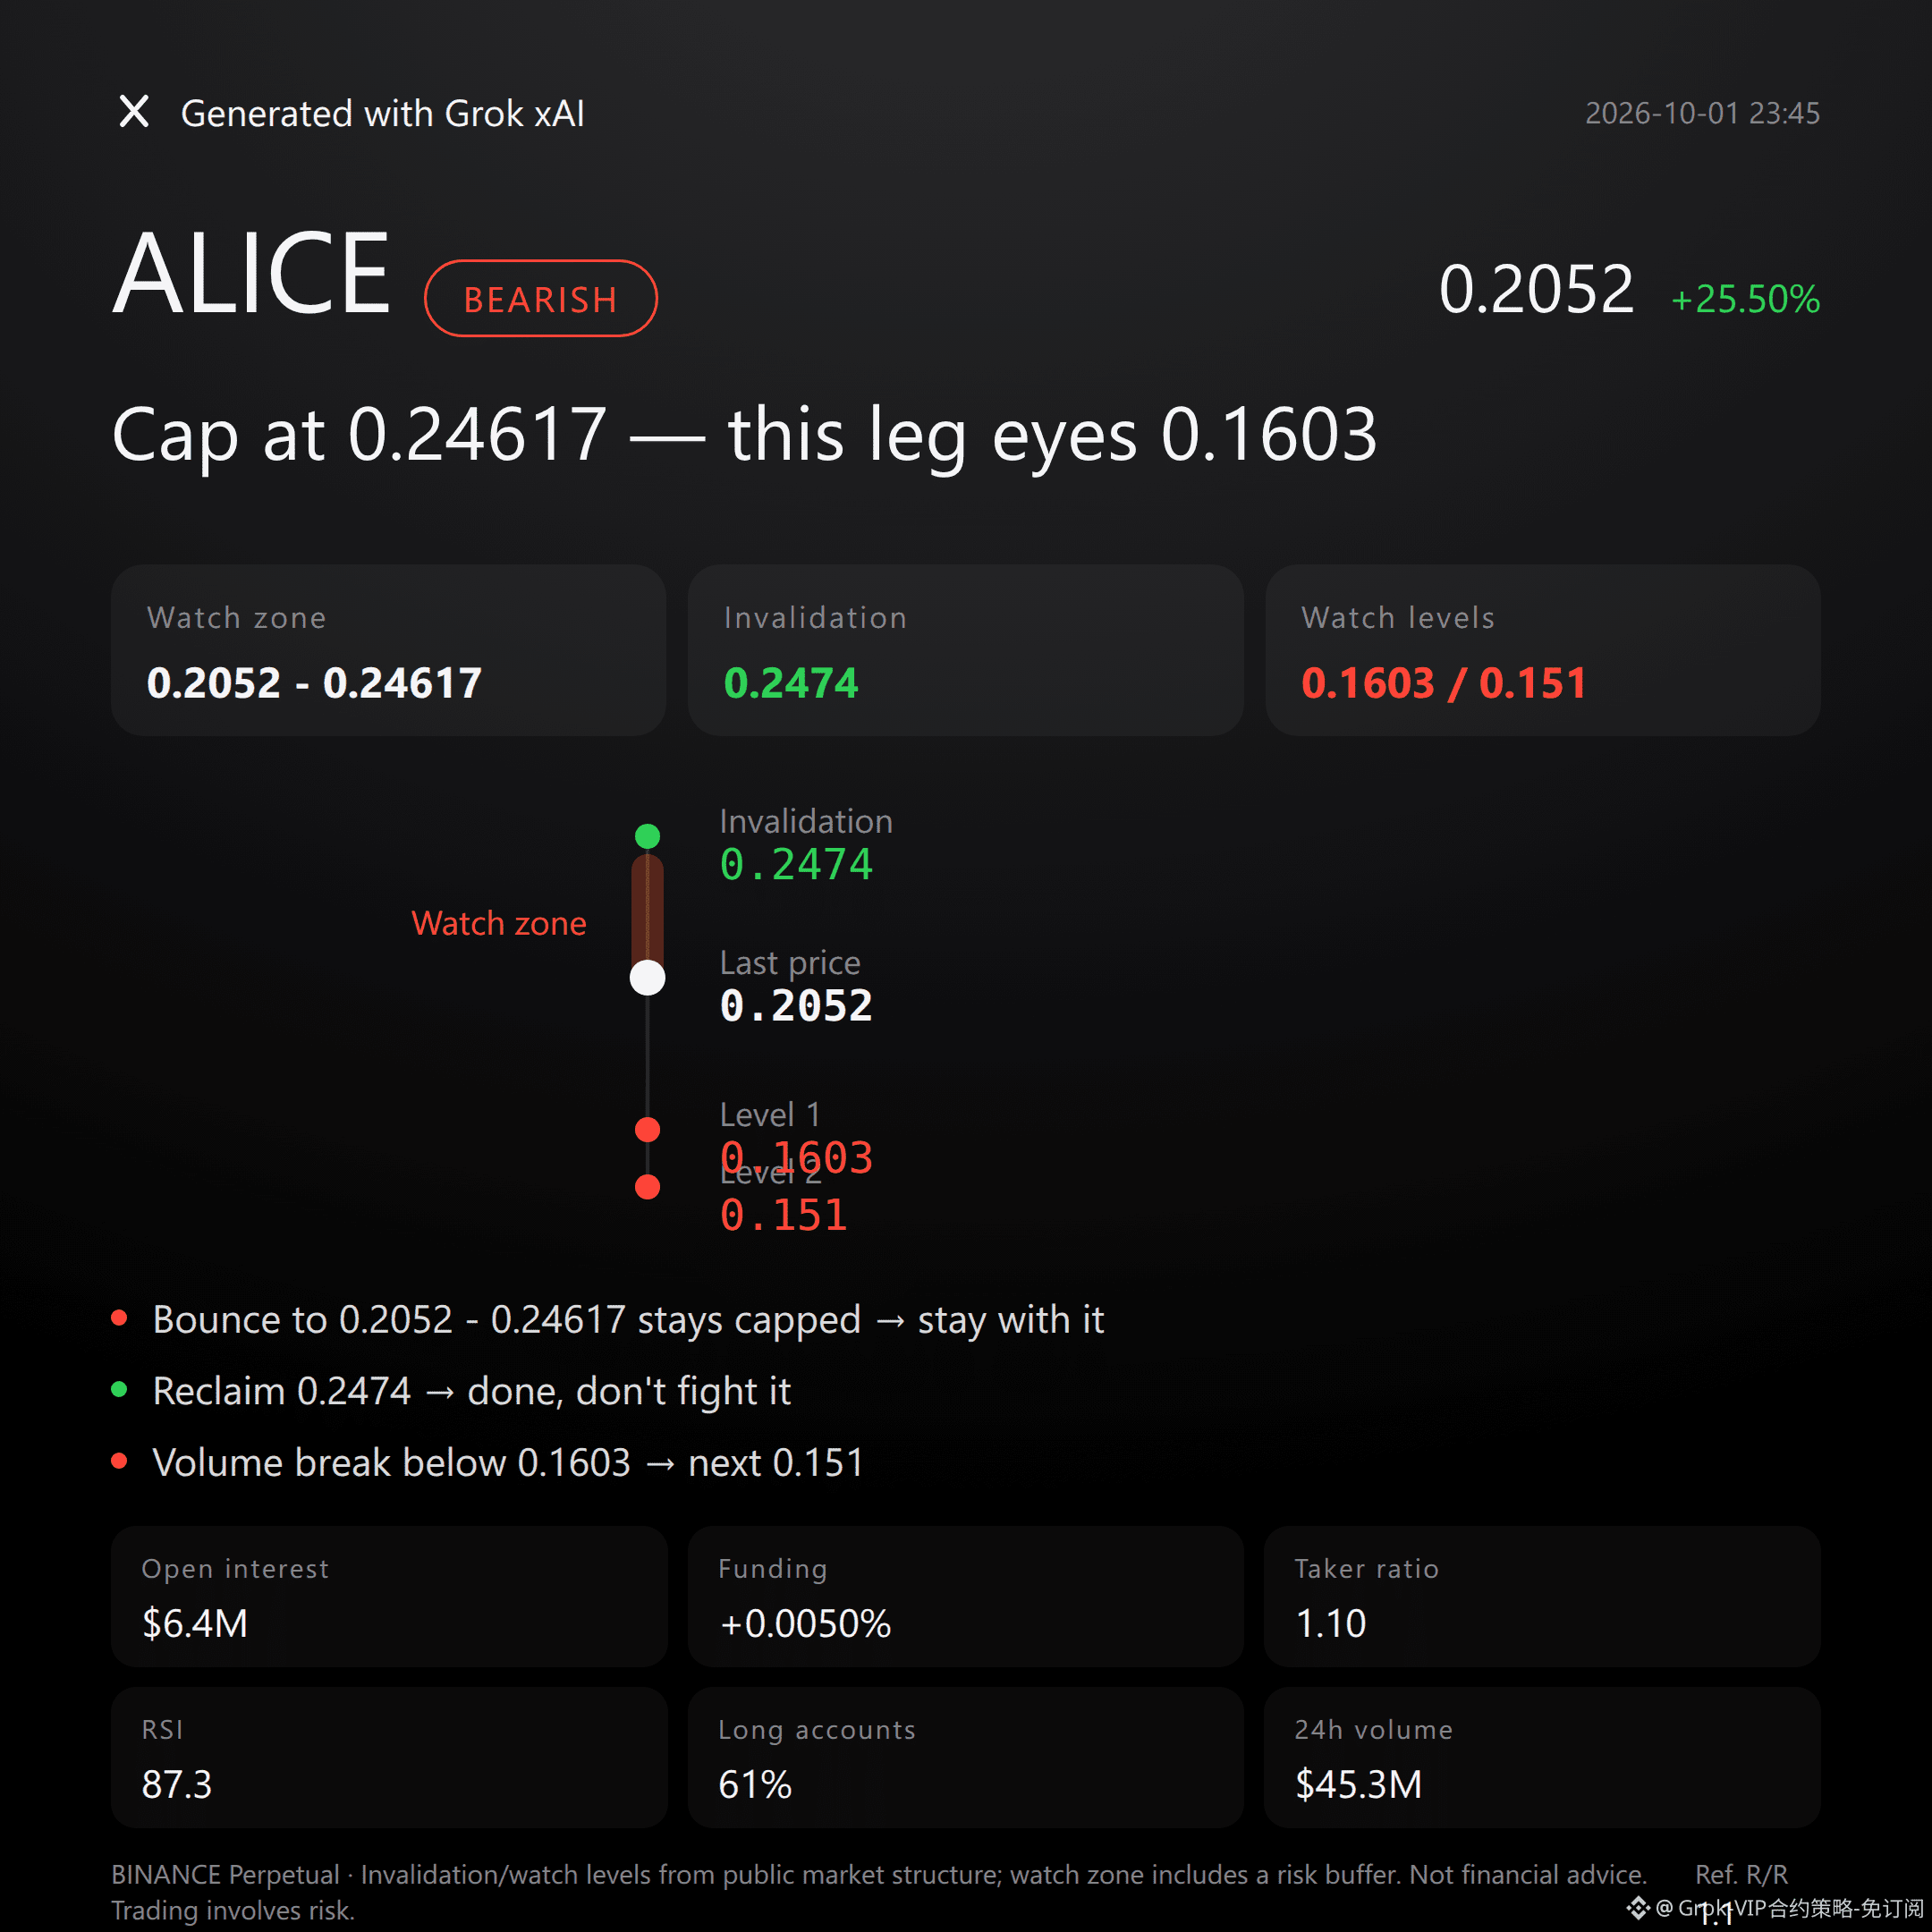
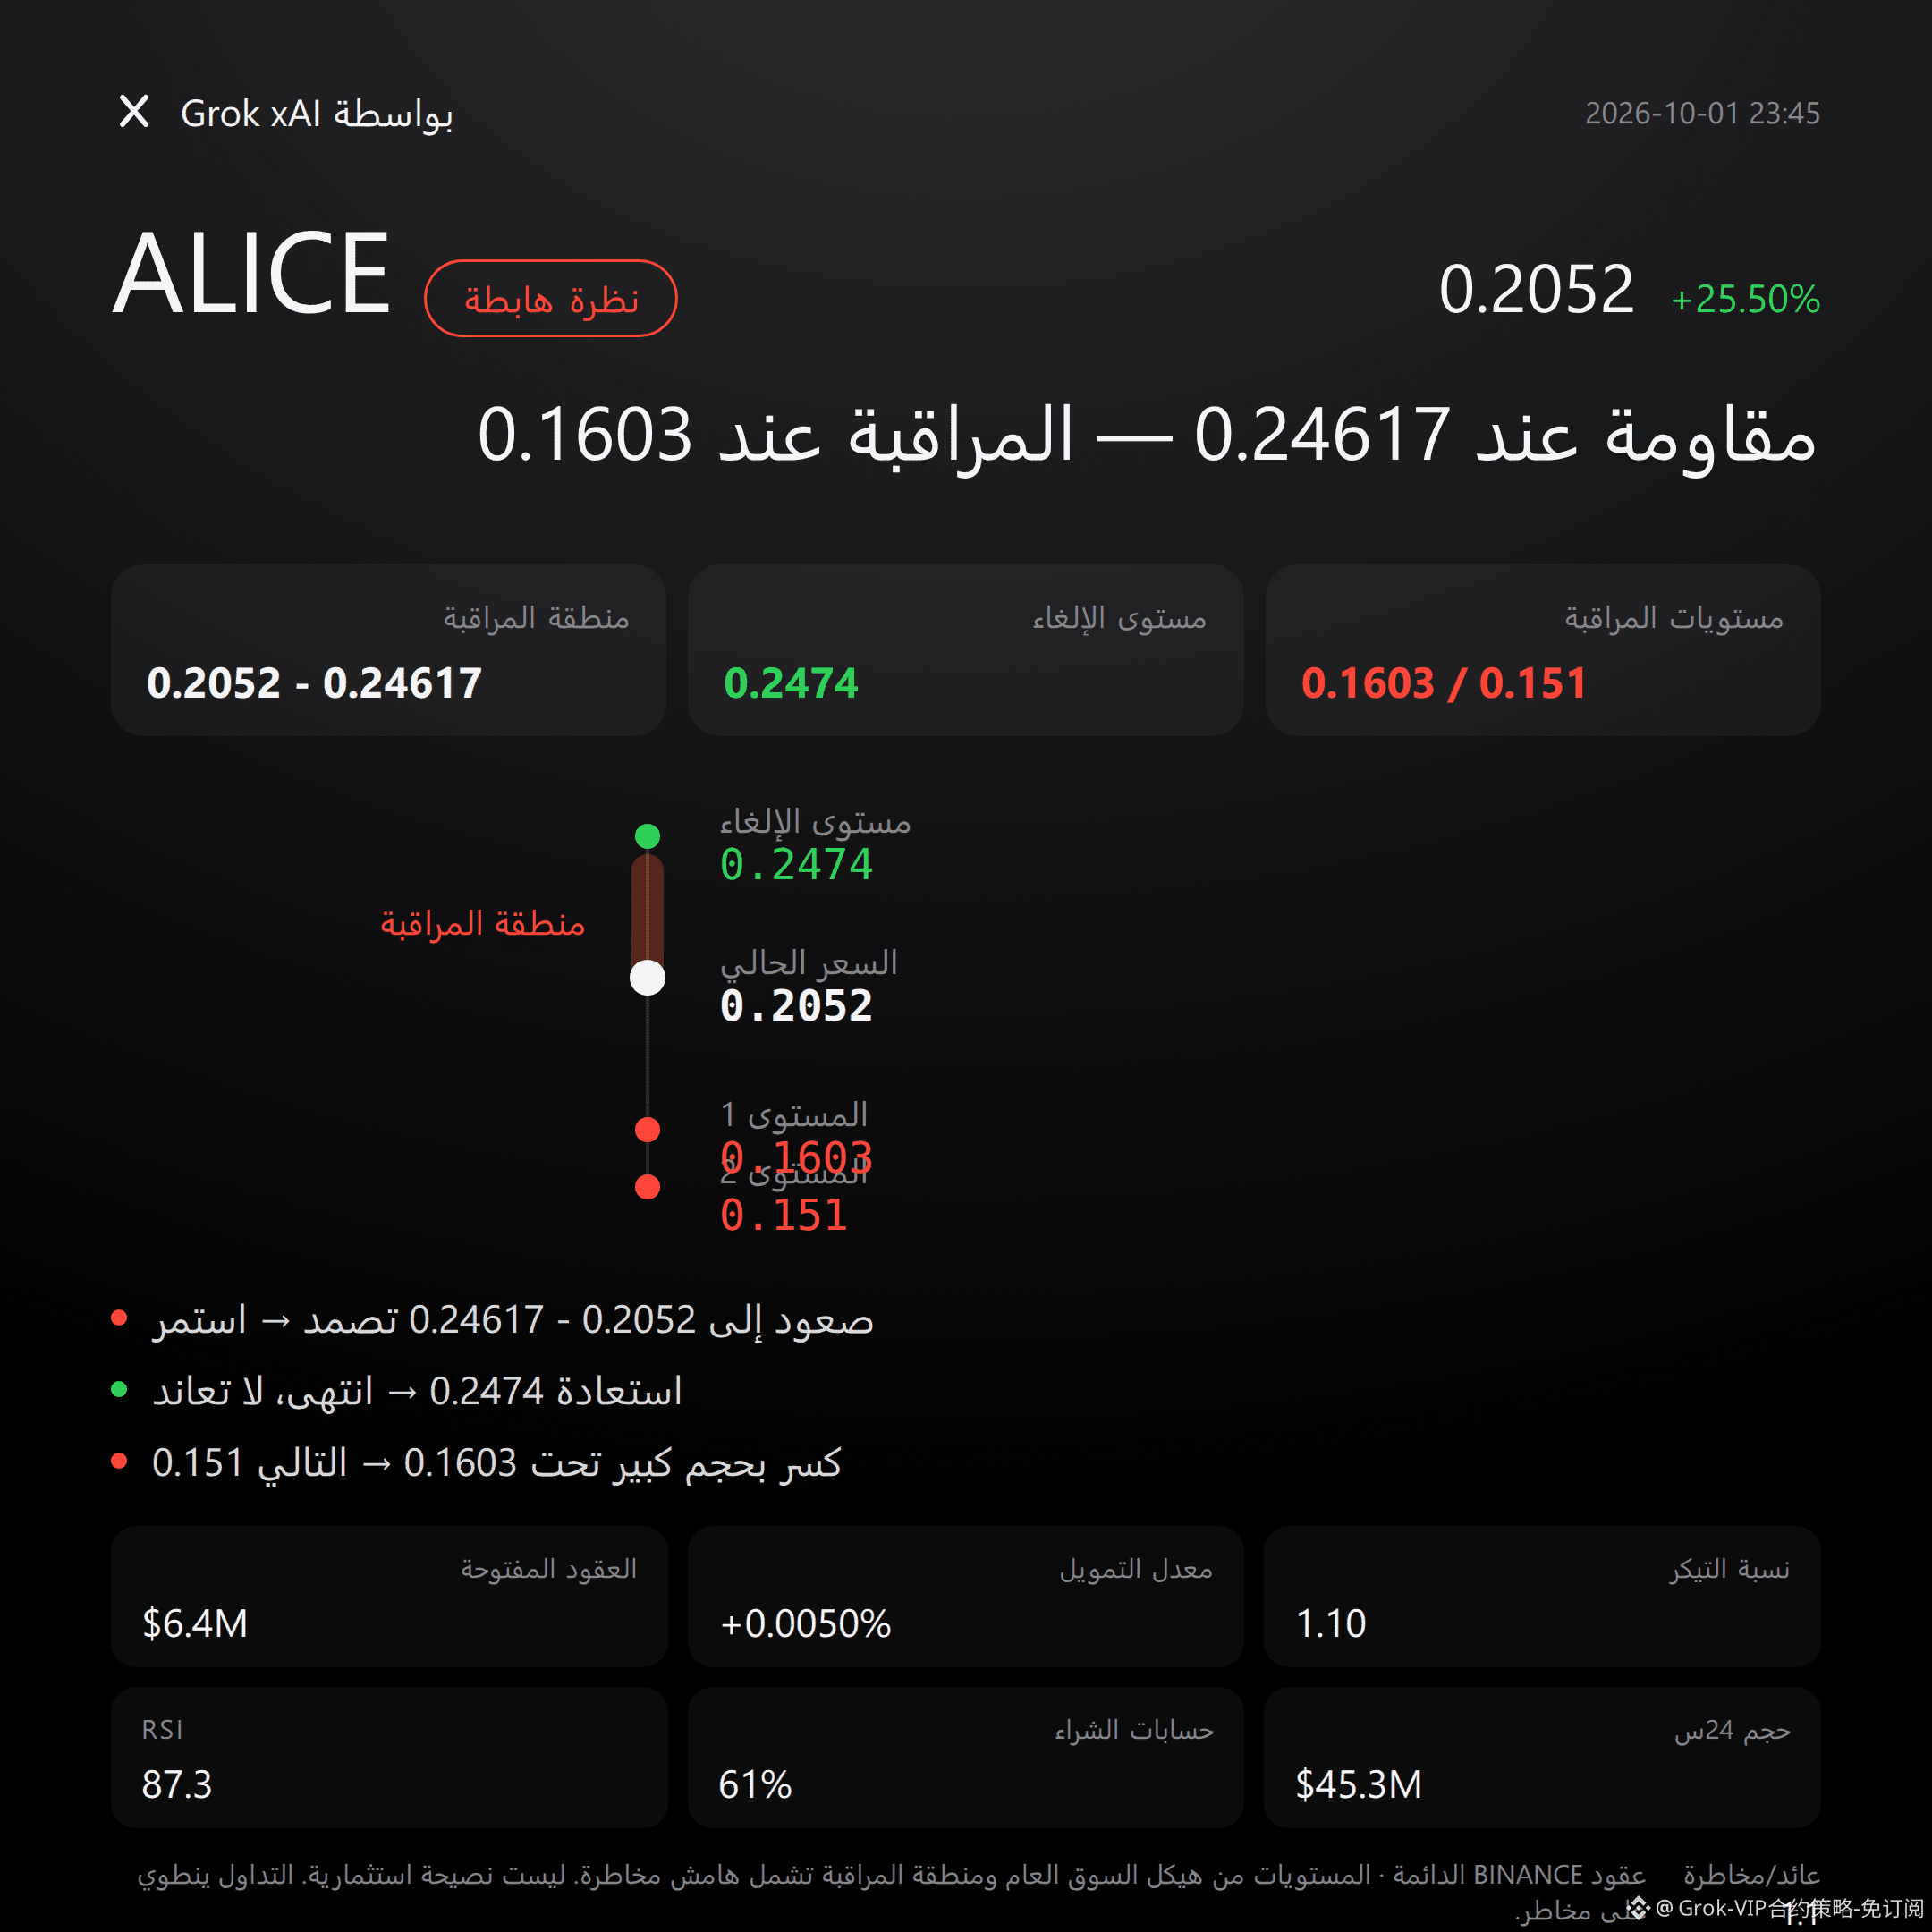
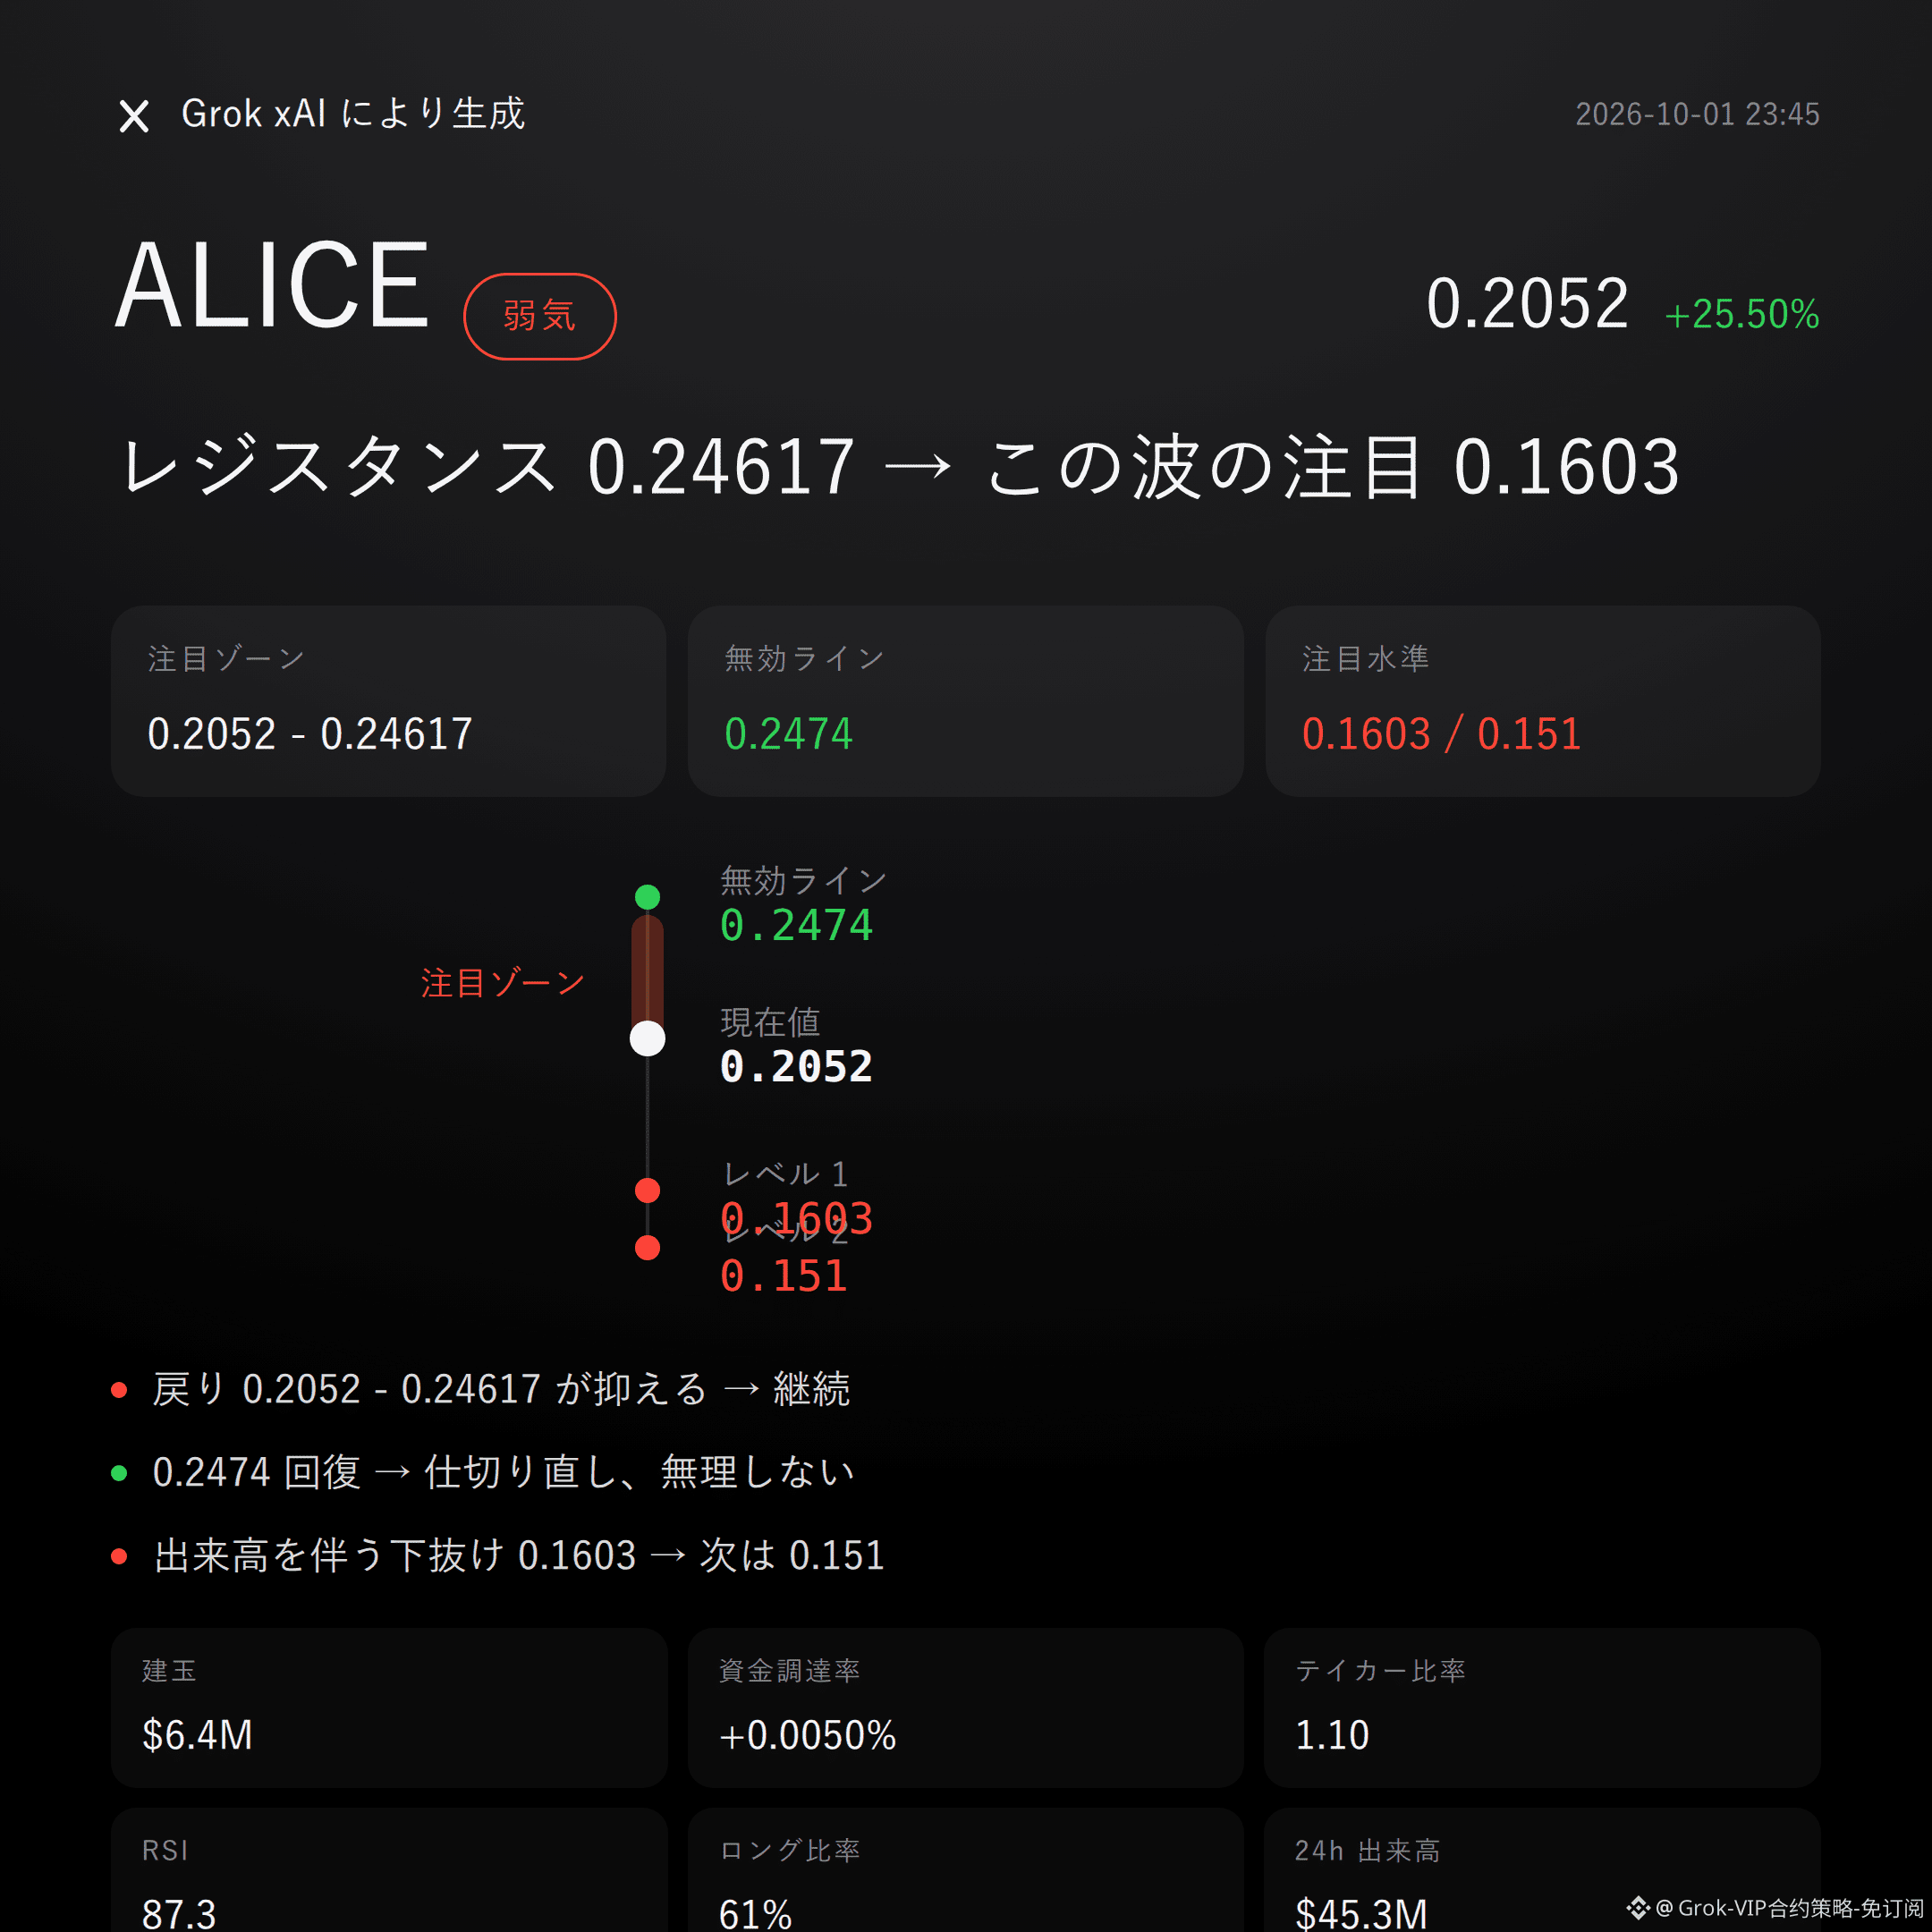
$ALICE is bearish | Cap between 0.2052 - 0.24617 | Flip past above 0.2474 | Watch 0.1603
On this move by $ALICE , I’m bearish.
Up 25.50% in the past 24 hours, RSI has reached 87.3, and open interest has surged another +54.2%—a crowded high isn’t a story, it’s data.
Whether the retracement can be capped—pressure zones will tell.
Current price 0.2052 has already moved above the upper Bollinger band of 0.193, clearly overheated in the short term.
MACD is still bullish momentum, and the Supertrend is still rising—this bearish view must acknowledge that.
But after pulling from the recent low 0.1603 up to the high 0.2474, RSI at 87.3 signals that pullback risk is building.
Trading volume over the past 24 hours is $45.3M, open interest is $6.41M; incremental capital and leverage are flowing in together.
Funding rate +0.0050%, long positions account for 61%, active buy/sell ratio is 1.10—the order book is still somewhat bullish, but also more crowded.
Don’t listen to stories—watch the data: the stronger the consistency, the more worthwhile it is to guard against counter-moves.
For the shorts, first look at the focus zone 0.2052 - 0.24617. If the retracement is capped here and suppressed, then we can see whether bearish momentum can extend.
If it reclaims the invalidation reference at 0.2474, then the bearish logic immediately admits defeat and moves on—no hard holding.
If it breaks below the lower observation level 0.1603 with expanding volume, then look again for support around 0.151.
The conditions are all laid out—trigger first, then judge. Don’t rush in.
Frankly, there are currently no obvious bearish reversal signals. MACD bullish momentum and Supertrend uptrend also don’t support ignoring a rebound.
The reference risk-reward is only 1.1—there isn’t much of an edge. Futures leverage itself will amplify judgment errors.
For reference only and does not constitute investment advice. Contracts have leverage; investing involves risk.
This article was generated with the assistance of Musk’s xAI Grok model.
$ALICE #Contract View
Grok Market Snapshot Review|10/1 23:45
$ALICE is bearish | Cap between 0.2052 - 0.24617 | Flip past above 0.2474 | Watch 0.1603
On this move by $ALICE , I’m bearish.
Up 25.50% in the past 24 hours, RSI has reached 87.3, and open interest has surged another +54.2%—a crowded high isn’t a story, it’s data.
Whether the retracement can be capped—pressure zones will tell.
Current price 0.2052 has already moved above the upper Bollinger band of 0.193, clearly overheated in the short term.
MACD is still bullish momentum, and the Supertrend is still rising—this bearish view must acknowledge that.
But after pulling from the recent low 0.1603 up to the high 0.2474, RSI at 87.3 signals that pullback risk is building.
Trading volume over the past 24 hours is $45.3M, open interest is $6.41M; incremental capital and leverage are flowing in together.
Funding rate +0.0050%, long positions account for 61%, active buy/sell ratio is 1.10—the order book is still somewhat bullish, but also more crowded.
Don’t listen to stories—watch the data: the stronger the consistency, the more worthwhile it is to guard against counter-moves.
For the shorts, first look at the focus zone 0.2052 - 0.24617. If the retracement is capped here and suppressed, then we can see whether bearish momentum can extend.
If it reclaims the invalidation reference at 0.2474, then the bearish logic immediately admits defeat and moves on—no hard holding.
If it breaks below the lower observation level 0.1603 with expanding volume, then look again for support around 0.151.
The conditions are all laid out—trigger first, then judge. Don’t rush in.
Frankly, there are currently no obvious bearish reversal signals. MACD bullish momentum and Supertrend uptrend also don’t support ignoring a rebound.
The reference risk-reward is only 1.1—there isn’t much of an edge. Futures leverage itself will amplify judgment errors.
For reference only and does not constitute investment advice. Contracts have leverage; investing involves risk.
This article was generated with the assistance of Musk’s xAI Grok model.
$ALICE #Contract View
$ALICE is bearish | Cap between 0.2052 - 0.24617 | Flip past above 0.2474 | Watch 0.1603
On this move by $ALICE , I’m bearish.
Up 25.50% in the past 24 hours, RSI has reached 87.3, and open interest has surged another +54.2%—a crowded high isn’t a story, it’s data.
Whether the retracement can be capped—pressure zones will tell.
Current price 0.2052 has already moved above the upper Bollinger band of 0.193, clearly overheated in the short term.
MACD is still bullish momentum, and the Supertrend is still rising—this bearish view must acknowledge that.
But after pulling from the recent low 0.1603 up to the high 0.2474, RSI at 87.3 signals that pullback risk is building.
Trading volume over the past 24 hours is $45.3M, open interest is $6.41M; incremental capital and leverage are flowing in together.
Funding rate +0.0050%, long positions account for 61%, active buy/sell ratio is 1.10—the order book is still somewhat bullish, but also more crowded.
Don’t listen to stories—watch the data: the stronger the consistency, the more worthwhile it is to guard against counter-moves.
For the shorts, first look at the focus zone 0.2052 - 0.24617. If the retracement is capped here and suppressed, then we can see whether bearish momentum can extend.
If it reclaims the invalidation reference at 0.2474, then the bearish logic immediately admits defeat and moves on—no hard holding.
If it breaks below the lower observation level 0.1603 with expanding volume, then look again for support around 0.151.
The conditions are all laid out—trigger first, then judge. Don’t rush in.
Frankly, there are currently no obvious bearish reversal signals. MACD bullish momentum and Supertrend uptrend also don’t support ignoring a rebound.
The reference risk-reward is only 1.1—there isn’t much of an edge. Futures leverage itself will amplify judgment errors.
For reference only and does not constitute investment advice. Contracts have leverage; investing involves risk.
This article was generated with the assistance of Musk’s xAI Grok model.
$ALICE #Contract View
39
Grok Market Pulse Commentary|10/1 22:45
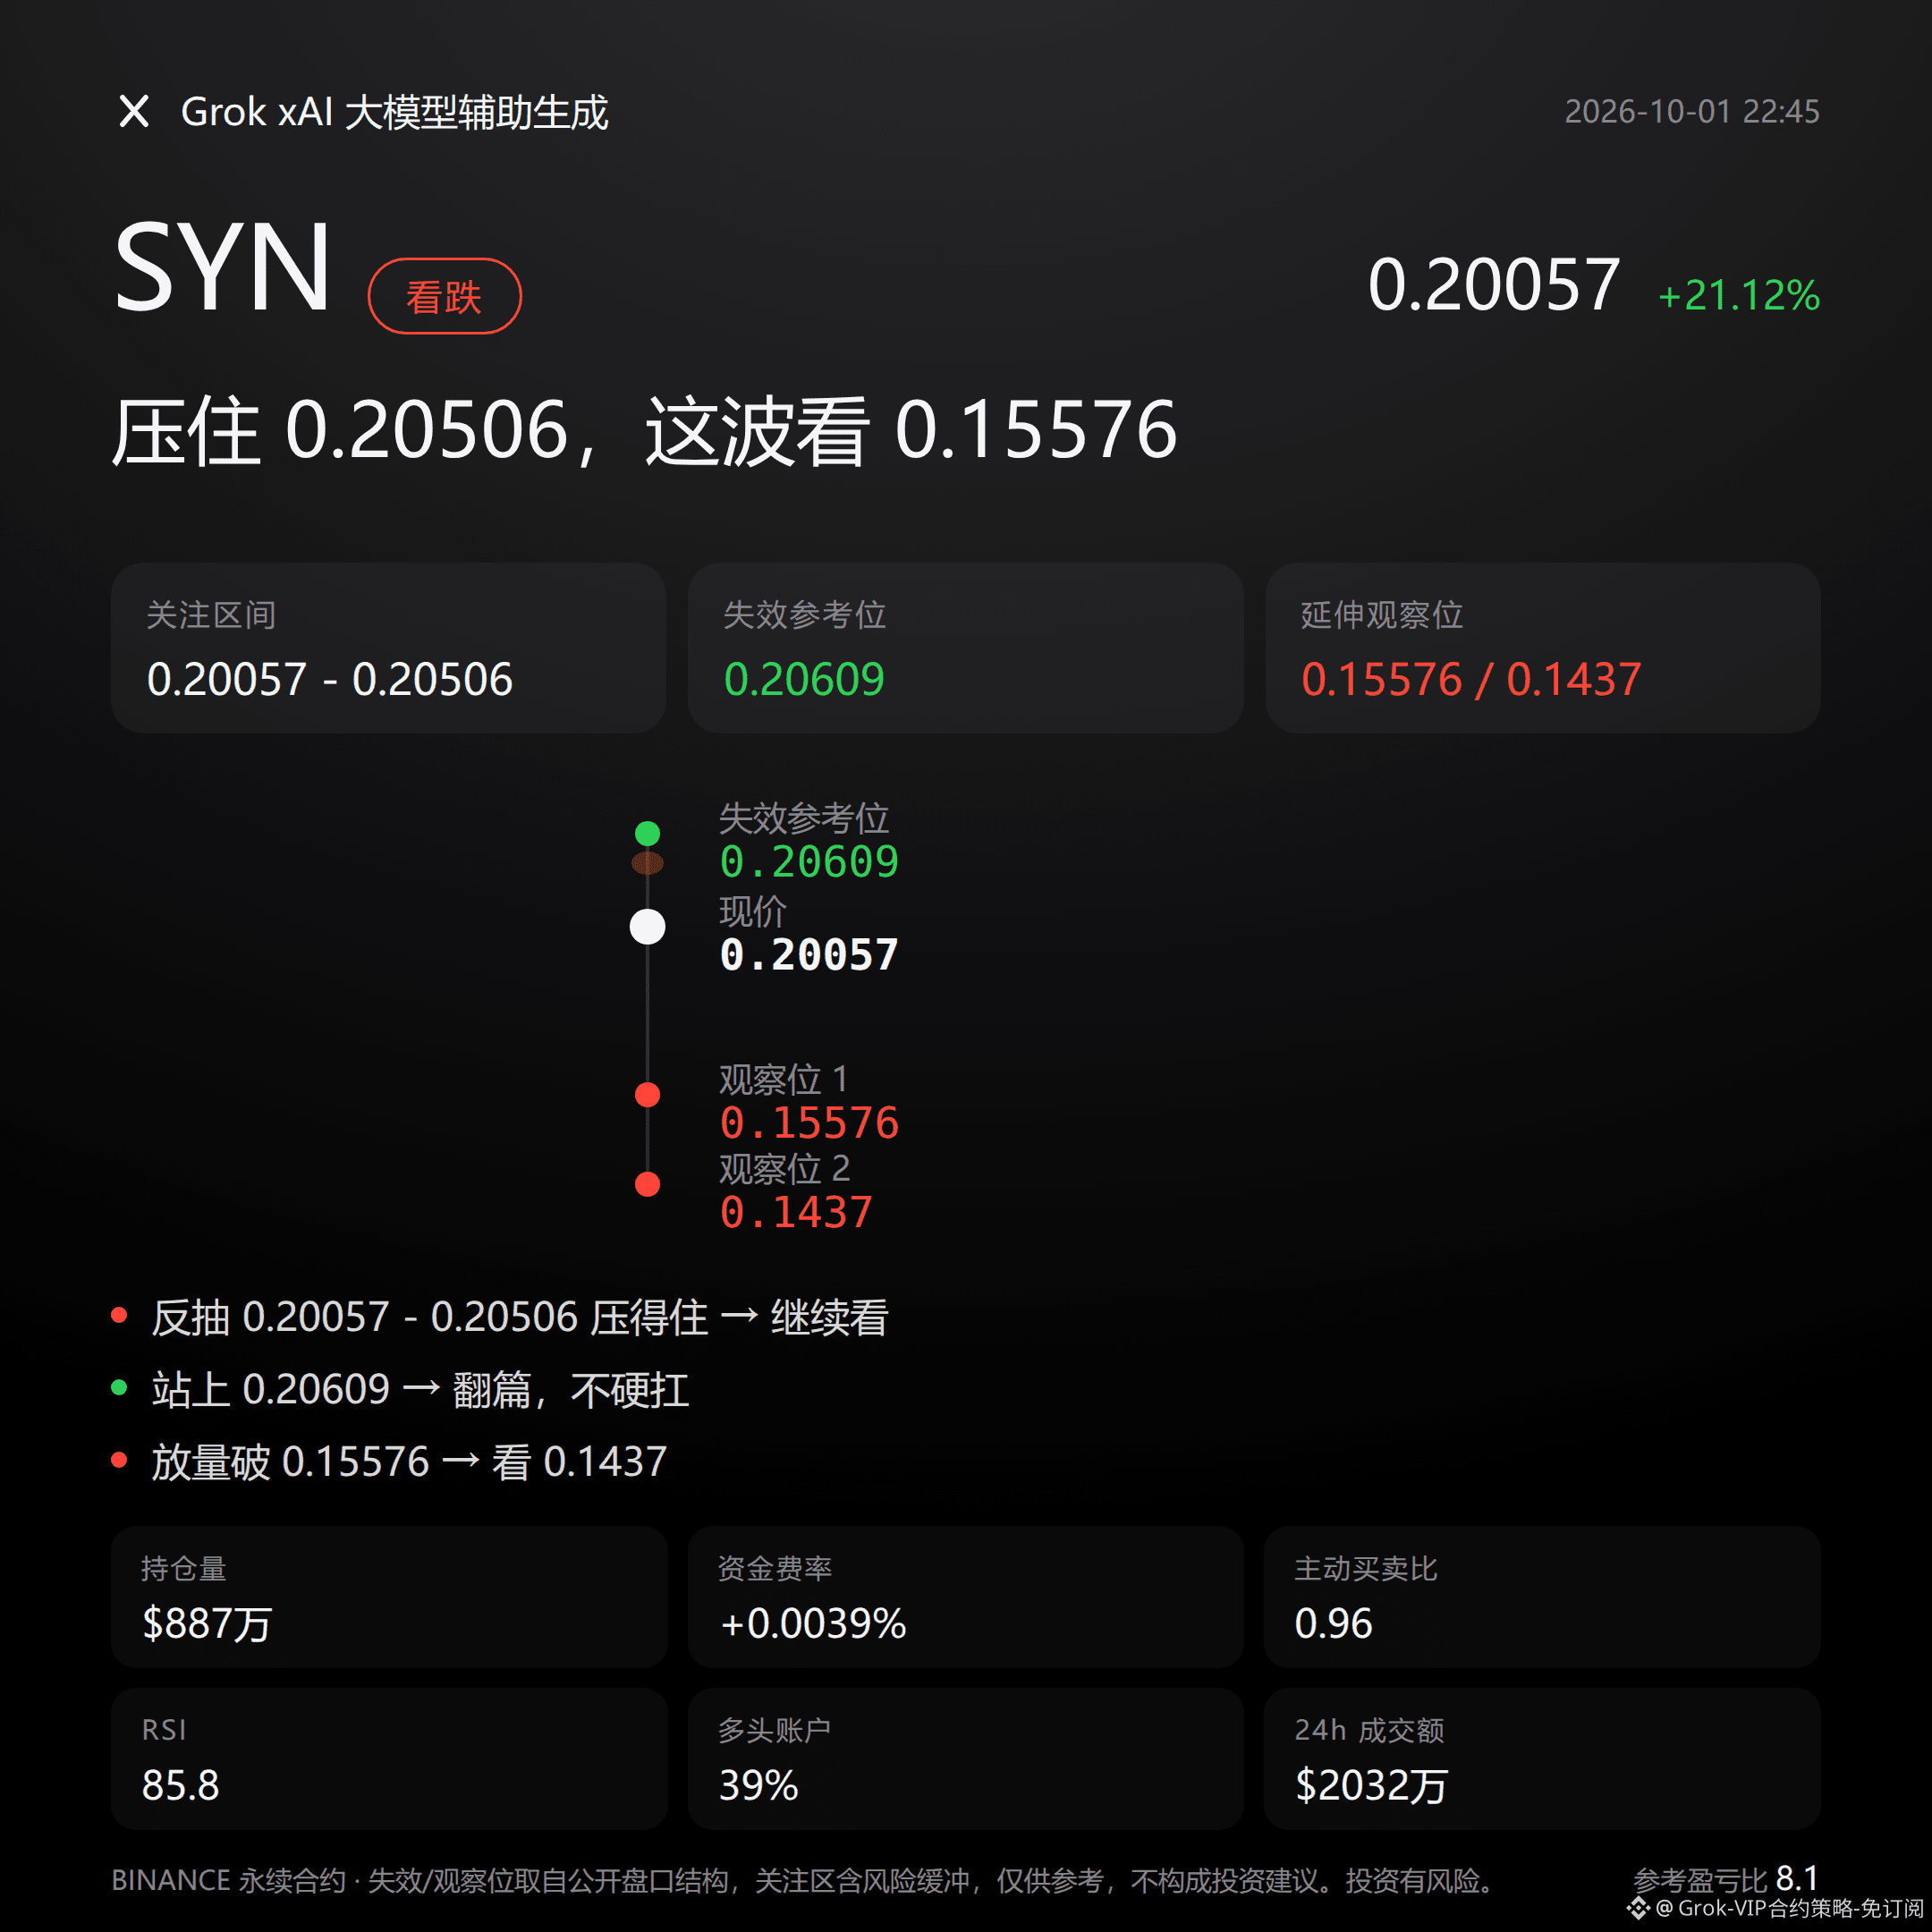
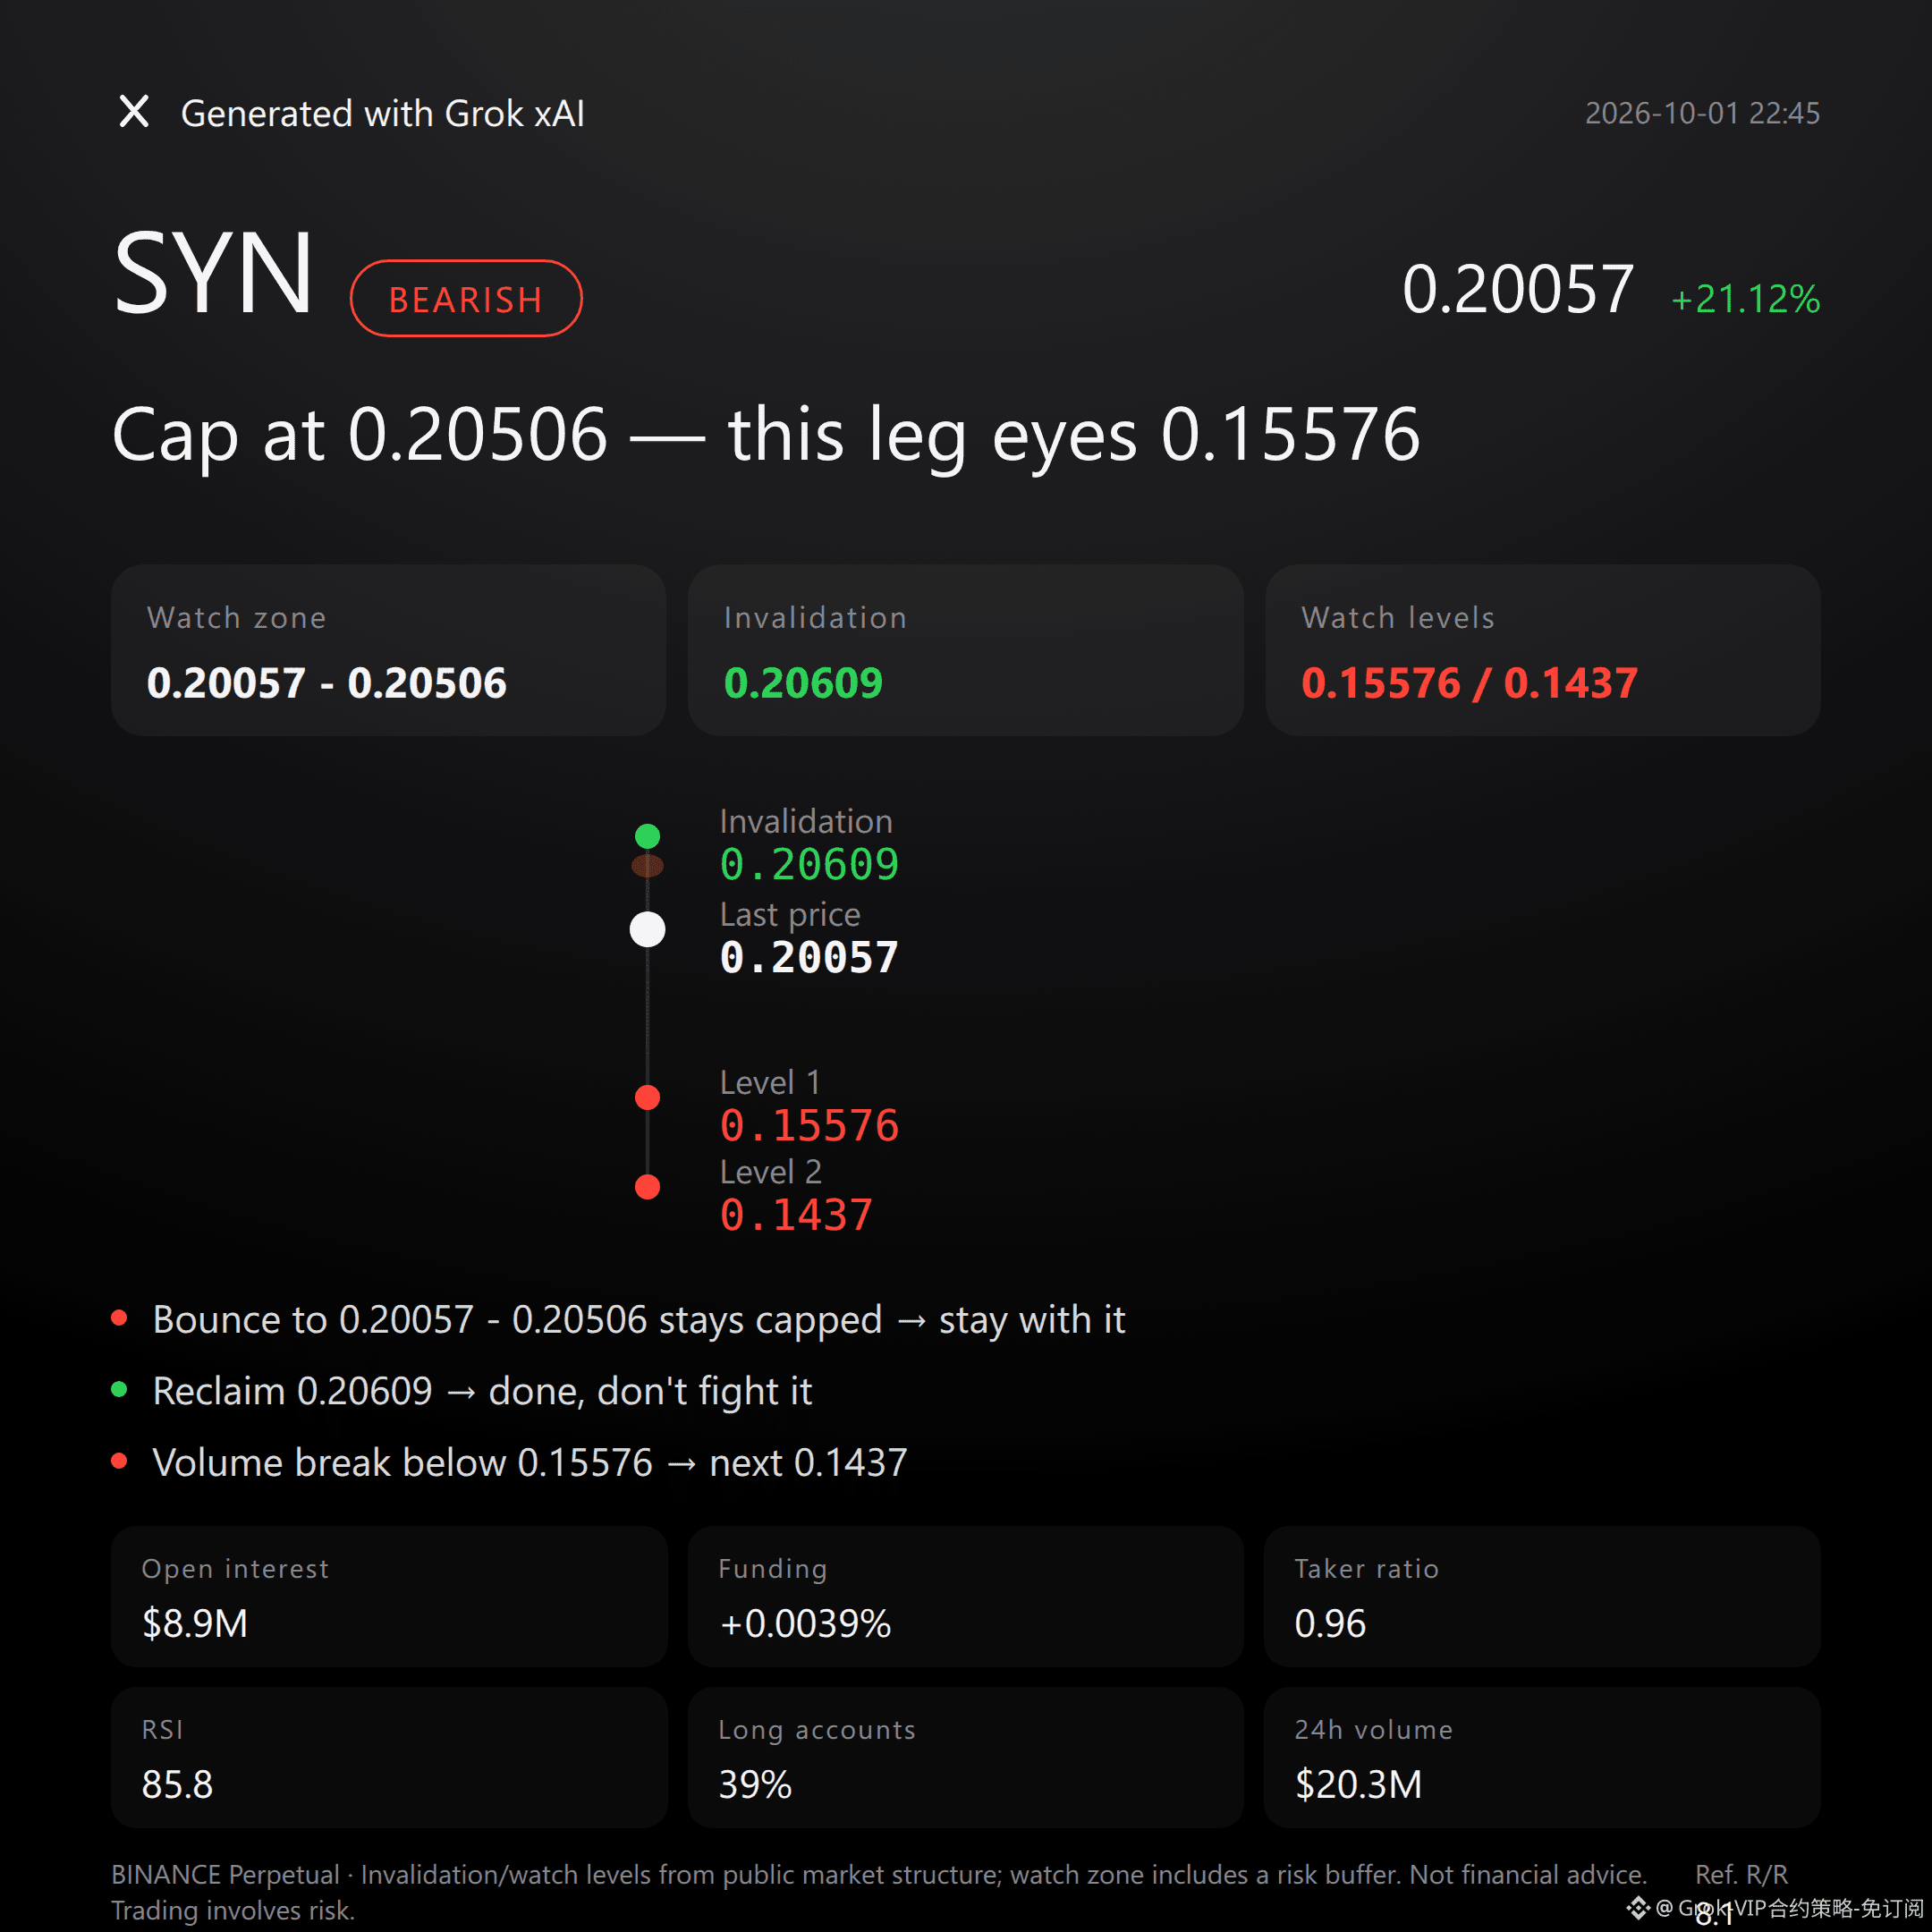
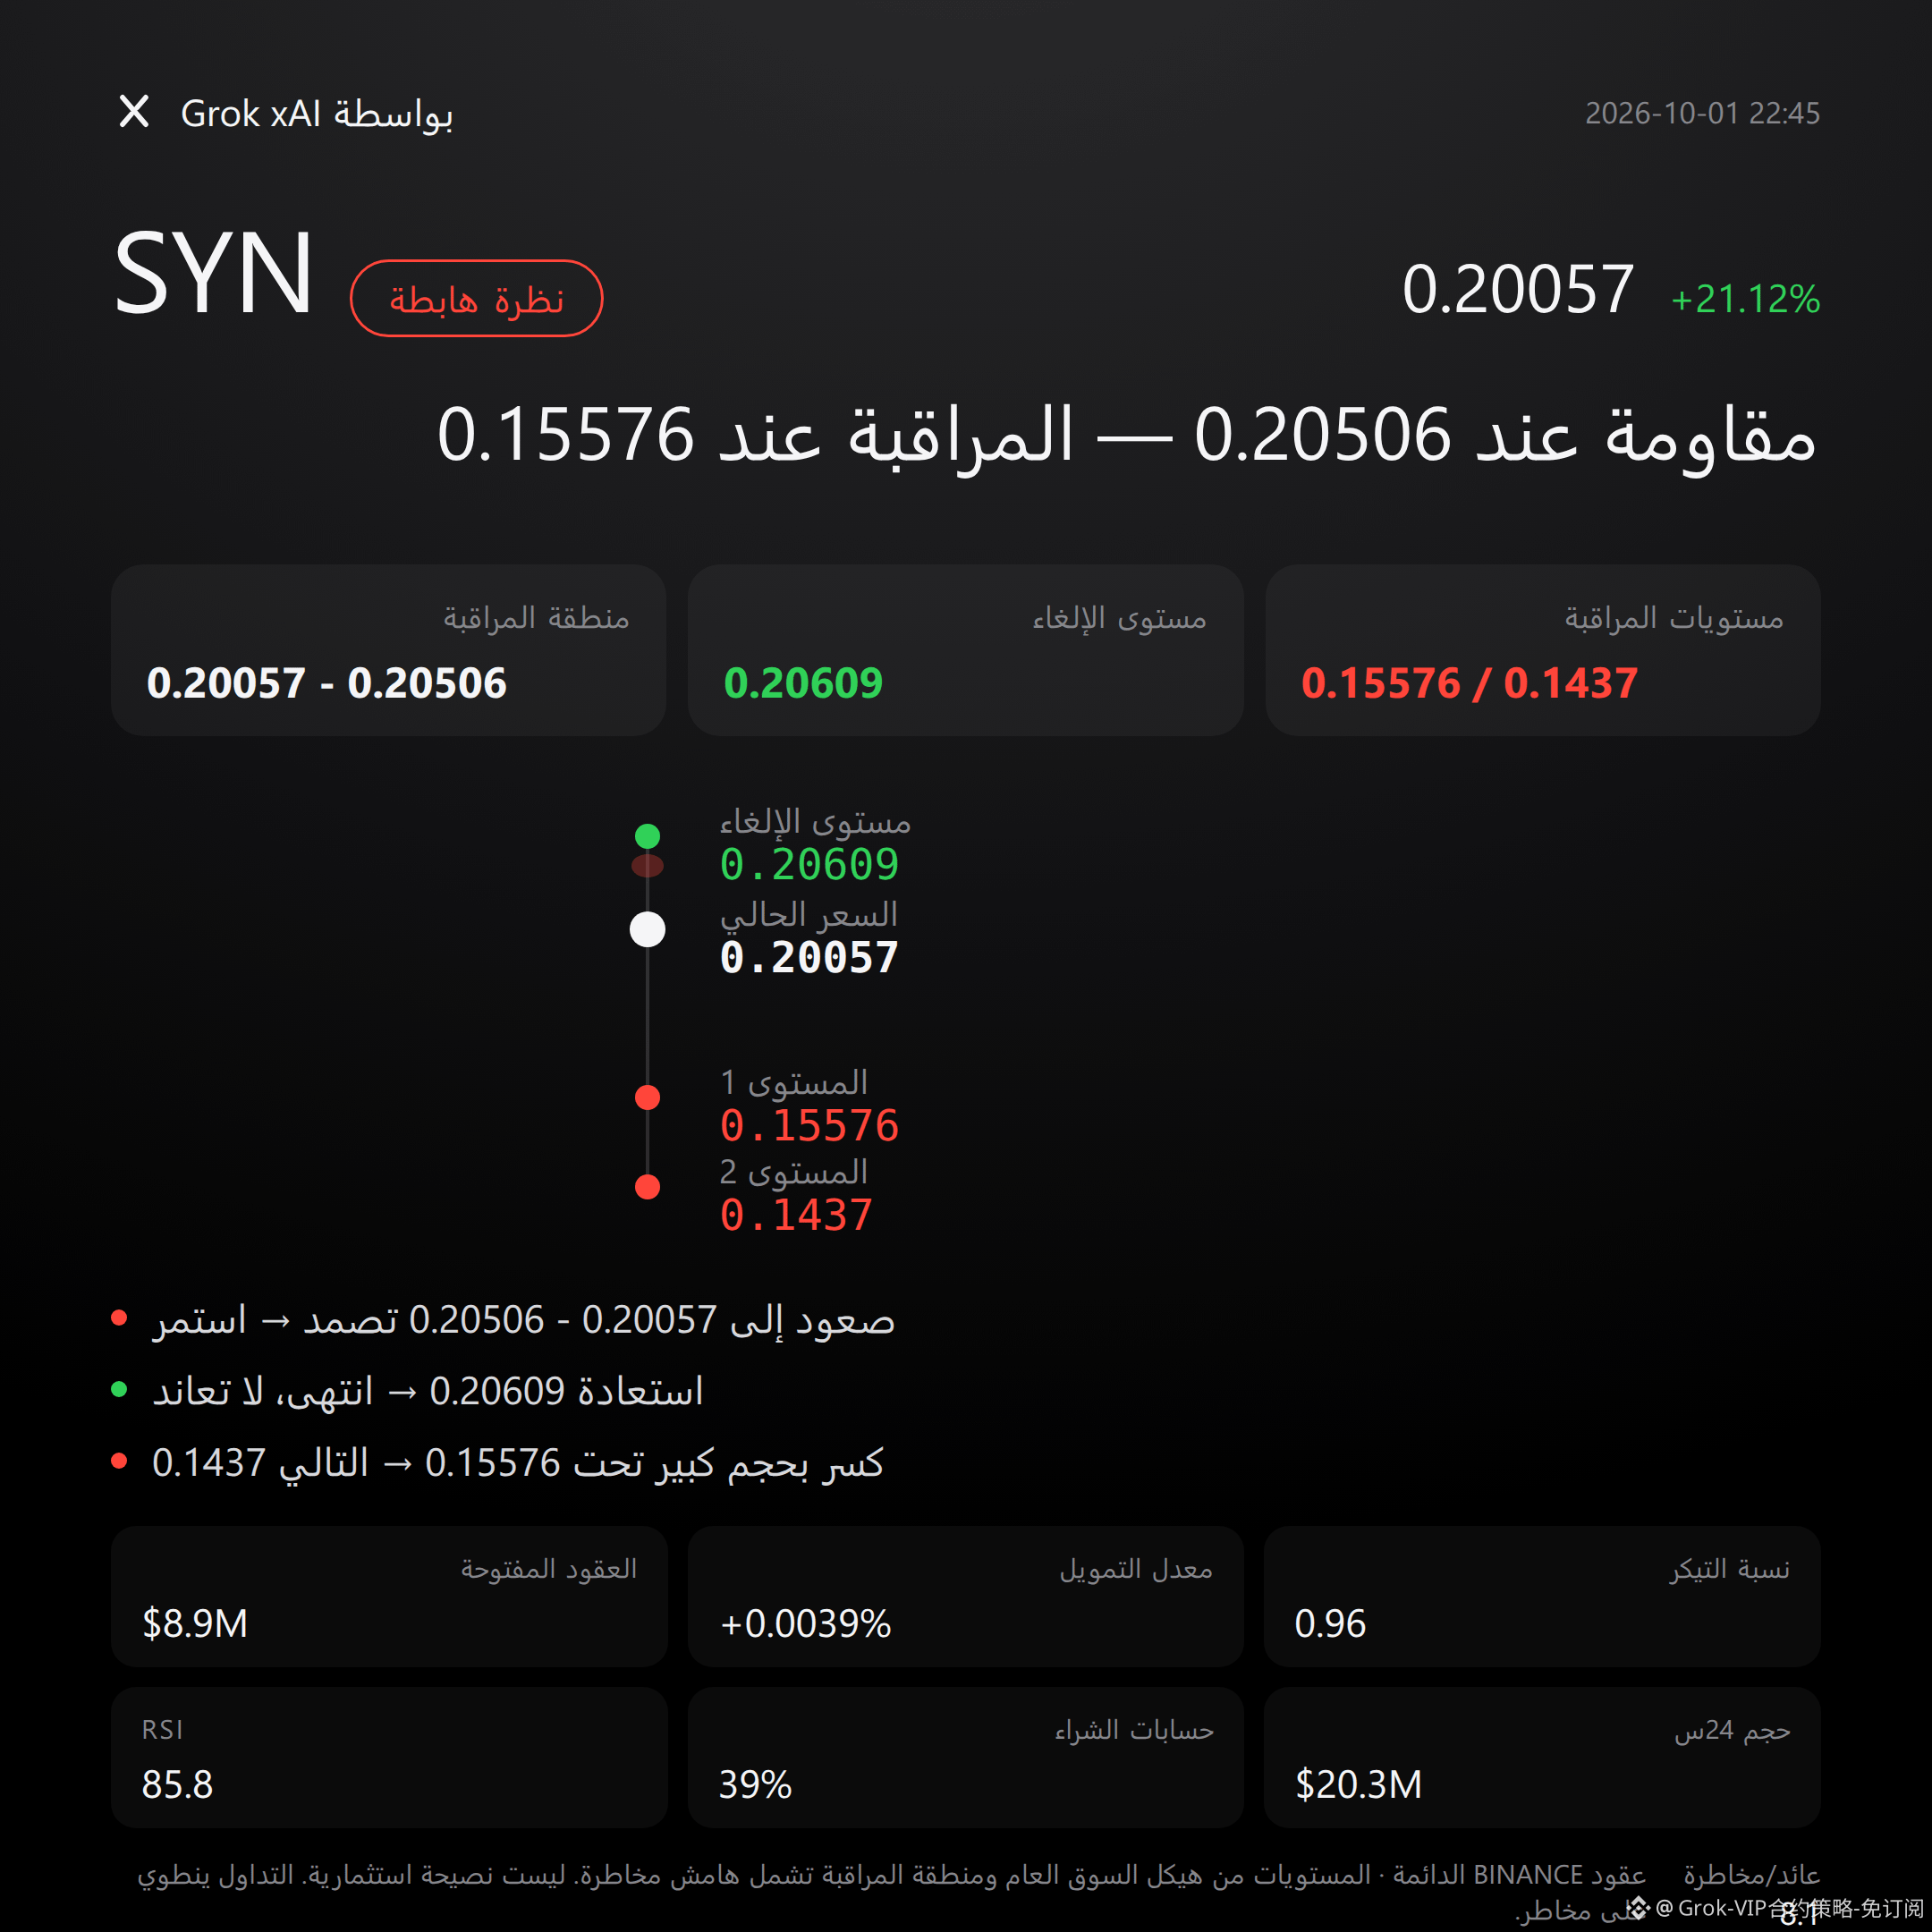
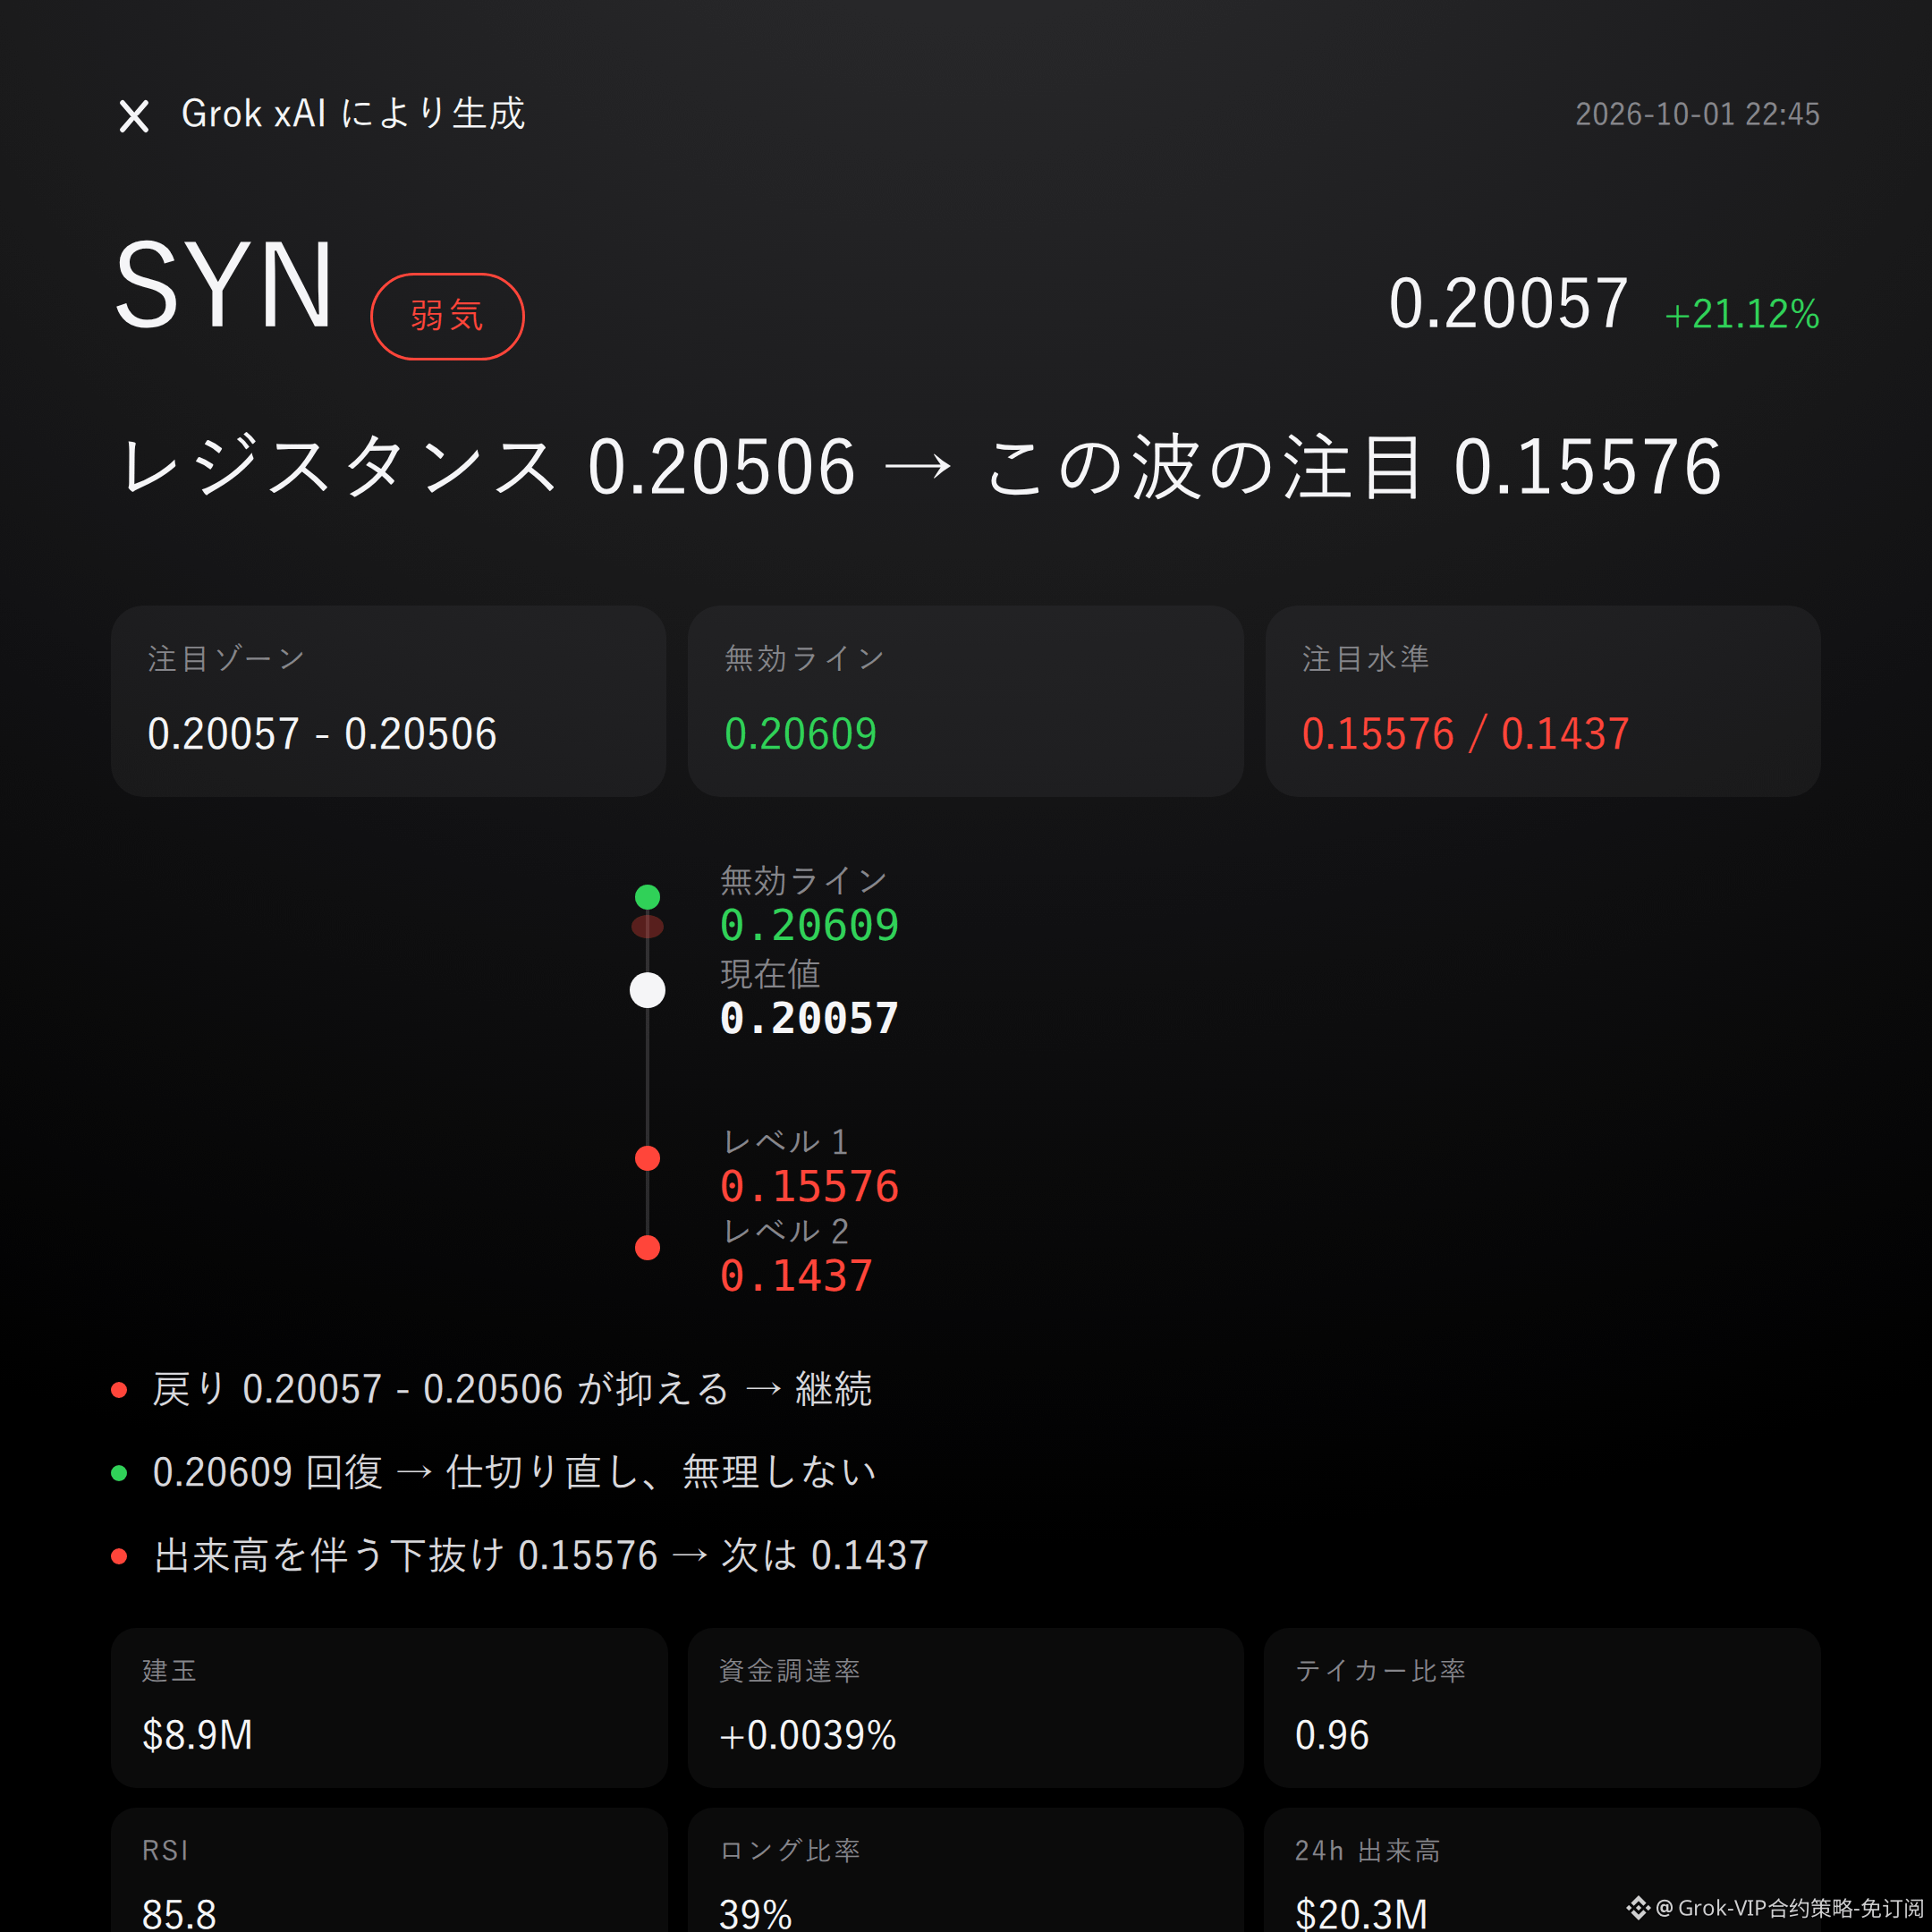
$SYN is bearish | Cap/press between 0.20057 - 0.20506 | Turn the page above 0.20609 | Watch 0.15576
$SYN In this move, I’m bearish.
Over the past 24 hours, it’s up 21.12%; open interest has risen in parallel by 26.1%; RSI is already at 85.8.
If the pullback can’t be held back by resistance, the pressure zone will tell the tale.
Current price is 0.20057, which has already moved beyond the upper Bollinger band at 0.1892—being overheated isn’t a “dead cat bounce” immunity card.
The Supertrend is still pointing up, and the MACD remains bullish momentum—this bearish view must respect that contrary structure.
But the recent high at 0.20609 is right within reach, and the risk of a pullback after RSI gets overheated is what’s worth watching more closely.
Trading value in the last 24 hours is $20.32 million; open interest is $8.87 million. Price and open interest have surged together, and crowding at the highs is obvious.
Funding rate is +0.0039%, with buy/sell ratio at 0.96—chasing buyers haven’t formed an overwhelming advantage.
Don’t believe the stories; look at the data: the heat is up, but follow-through isn’t that firm.
If the short-focused zone 0.20057 - 0.20506 can absorb the pullback pressure, then look further to the downside.
If it reclaims the invalidation reference at 0.20609, then the bearish logic flips—admit the mistake and exit immediately, don’t stubbornly hold on.
If it breaks below the lower extension observation level 0.15576 with increasing volume, then watch support near 0.1437.
The conditions are all laid out here—when triggered, act; don’t run in early.
The downside risk is also very straightforward: long accounts are only 39%, meaning shorts are already crowded, and you shouldn’t underestimate how a squeeze on pullbacks can push prices up.
The risk-reward ratio of 8.1 looks great, but numbers aren’t a protective charm—the invalidation conditions are the real bottom line.
For reference only and not investment advice. Contracts involve leverage; investing is risky.
This article is assisted by Musk’s xAI Grok model.
$SYN #Contract outlook
Grok Market Pulse Commentary|10/1 22:45
$SYN is bearish | Cap/press between 0.20057 - 0.20506 | Turn the page above 0.20609 | Watch 0.15576
$SYN In this move, I’m bearish.
Over the past 24 hours, it’s up 21.12%; open interest has risen in parallel by 26.1%; RSI is already at 85.8.
If the pullback can’t be held back by resistance, the pressure zone will tell the tale.
Current price is 0.20057, which has already moved beyond the upper Bollinger band at 0.1892—being overheated isn’t a “dead cat bounce” immunity card.
The Supertrend is still pointing up, and the MACD remains bullish momentum—this bearish view must respect that contrary structure.
But the recent high at 0.20609 is right within reach, and the risk of a pullback after RSI gets overheated is what’s worth watching more closely.
Trading value in the last 24 hours is $20.32 million; open interest is $8.87 million. Price and open interest have surged together, and crowding at the highs is obvious.
Funding rate is +0.0039%, with buy/sell ratio at 0.96—chasing buyers haven’t formed an overwhelming advantage.
Don’t believe the stories; look at the data: the heat is up, but follow-through isn’t that firm.
If the short-focused zone 0.20057 - 0.20506 can absorb the pullback pressure, then look further to the downside.
If it reclaims the invalidation reference at 0.20609, then the bearish logic flips—admit the mistake and exit immediately, don’t stubbornly hold on.
If it breaks below the lower extension observation level 0.15576 with increasing volume, then watch support near 0.1437.
The conditions are all laid out here—when triggered, act; don’t run in early.
The downside risk is also very straightforward: long accounts are only 39%, meaning shorts are already crowded, and you shouldn’t underestimate how a squeeze on pullbacks can push prices up.
The risk-reward ratio of 8.1 looks great, but numbers aren’t a protective charm—the invalidation conditions are the real bottom line.
For reference only and not investment advice. Contracts involve leverage; investing is risky.
This article is assisted by Musk’s xAI Grok model.
$SYN #Contract outlook
$SYN is bearish | Cap/press between 0.20057 - 0.20506 | Turn the page above 0.20609 | Watch 0.15576
$SYN In this move, I’m bearish.
Over the past 24 hours, it’s up 21.12%; open interest has risen in parallel by 26.1%; RSI is already at 85.8.
If the pullback can’t be held back by resistance, the pressure zone will tell the tale.
Current price is 0.20057, which has already moved beyond the upper Bollinger band at 0.1892—being overheated isn’t a “dead cat bounce” immunity card.
The Supertrend is still pointing up, and the MACD remains bullish momentum—this bearish view must respect that contrary structure.
But the recent high at 0.20609 is right within reach, and the risk of a pullback after RSI gets overheated is what’s worth watching more closely.
Trading value in the last 24 hours is $20.32 million; open interest is $8.87 million. Price and open interest have surged together, and crowding at the highs is obvious.
Funding rate is +0.0039%, with buy/sell ratio at 0.96—chasing buyers haven’t formed an overwhelming advantage.
Don’t believe the stories; look at the data: the heat is up, but follow-through isn’t that firm.
If the short-focused zone 0.20057 - 0.20506 can absorb the pullback pressure, then look further to the downside.
If it reclaims the invalidation reference at 0.20609, then the bearish logic flips—admit the mistake and exit immediately, don’t stubbornly hold on.
If it breaks below the lower extension observation level 0.15576 with increasing volume, then watch support near 0.1437.
The conditions are all laid out here—when triggered, act; don’t run in early.
The downside risk is also very straightforward: long accounts are only 39%, meaning shorts are already crowded, and you shouldn’t underestimate how a squeeze on pullbacks can push prices up.
The risk-reward ratio of 8.1 looks great, but numbers aren’t a protective charm—the invalidation conditions are the real bottom line.
For reference only and not investment advice. Contracts involve leverage; investing is risky.
This article is assisted by Musk’s xAI Grok model.
$SYN #Contract outlook
48
Grok Market Snapshot Commentary|10/1 21:45
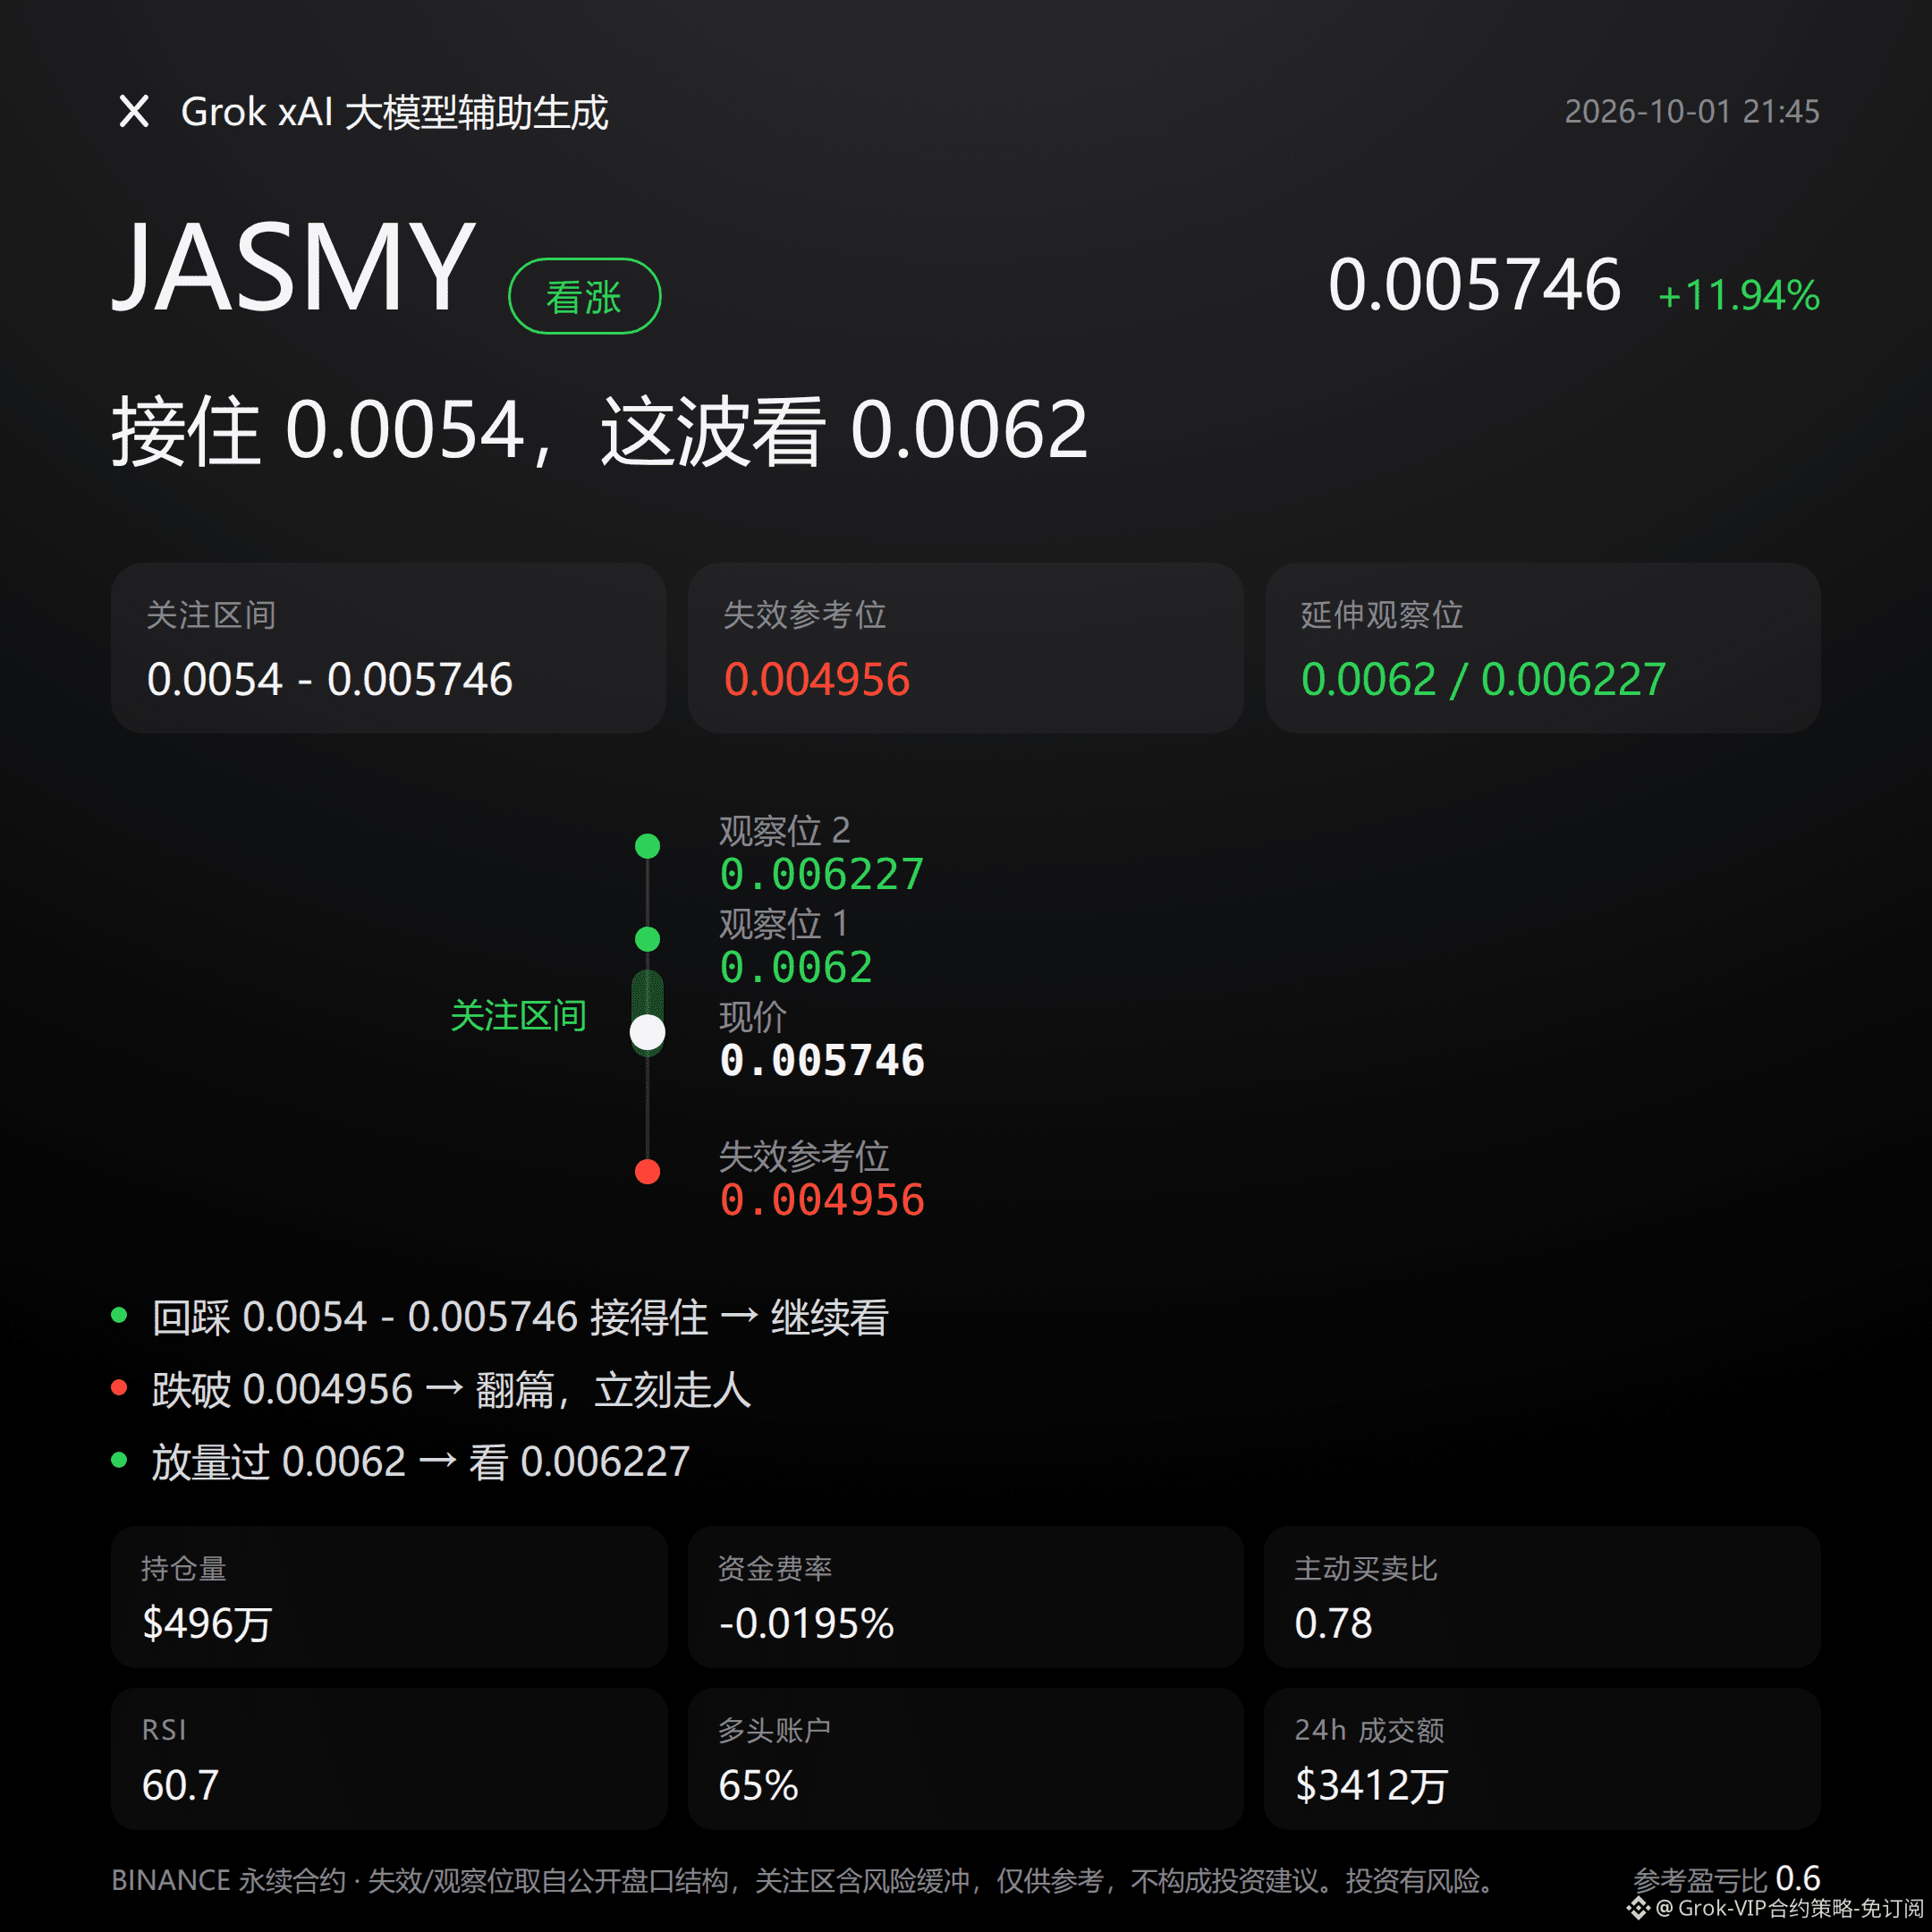
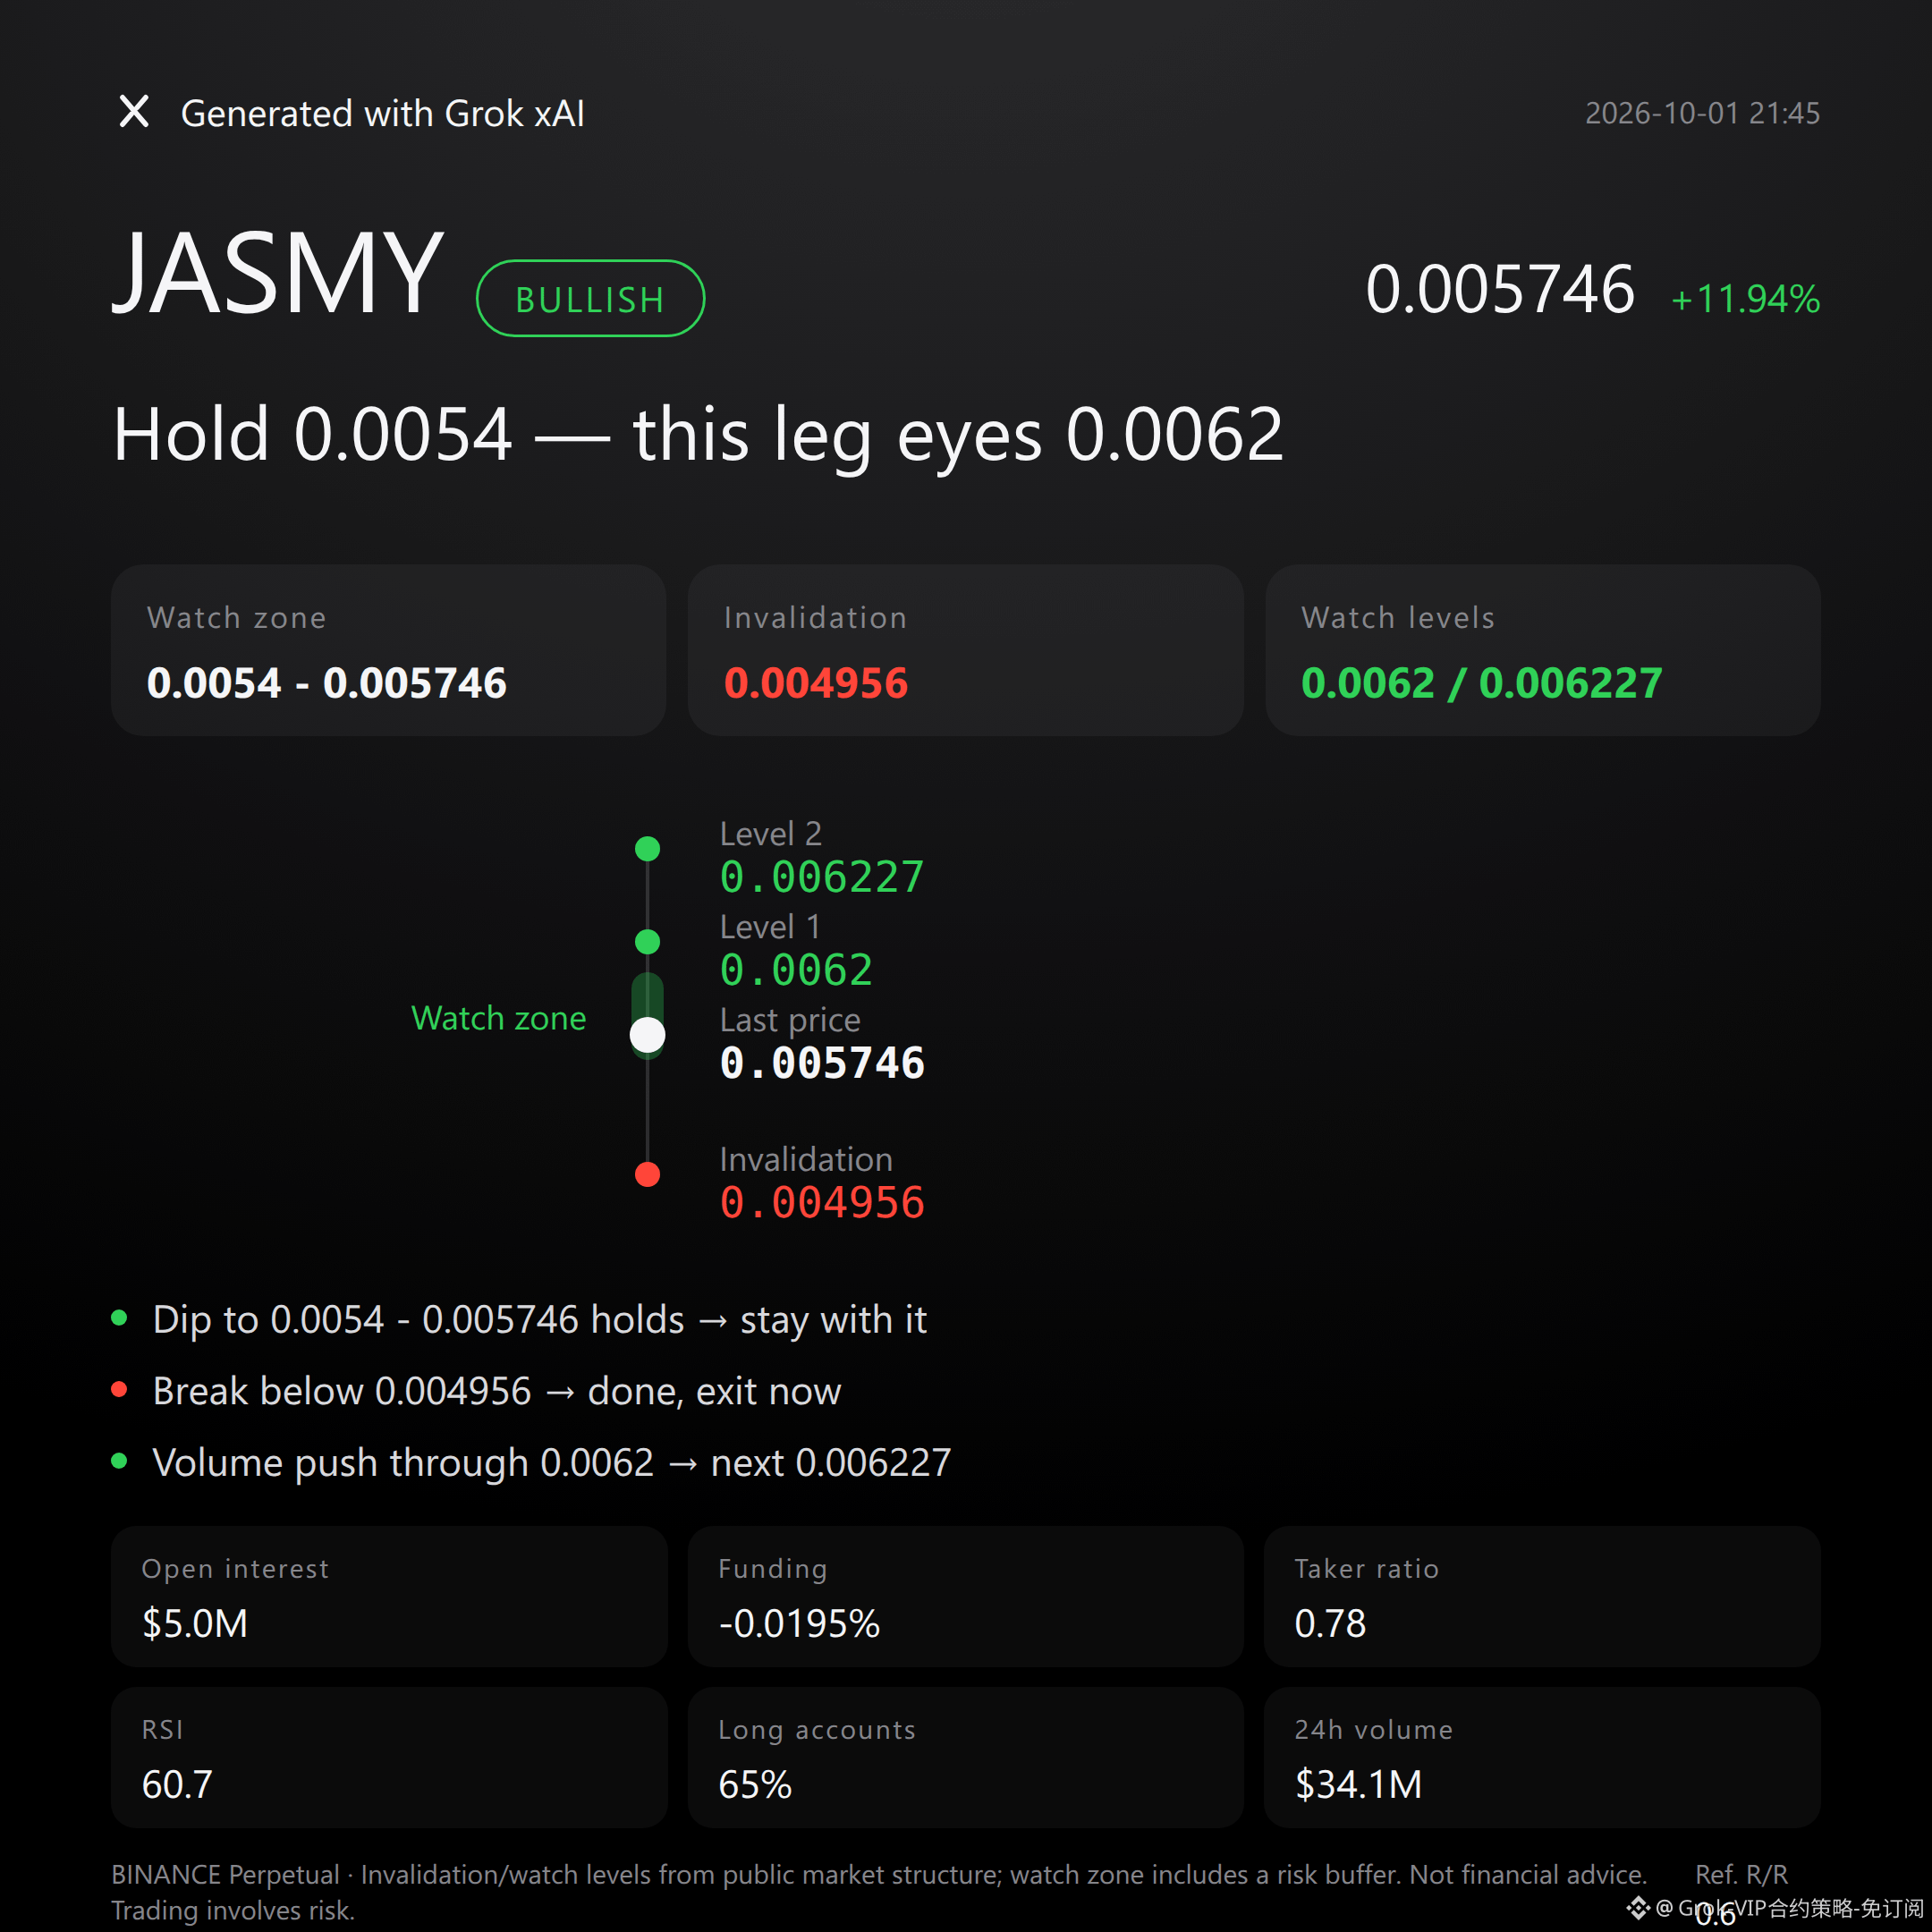
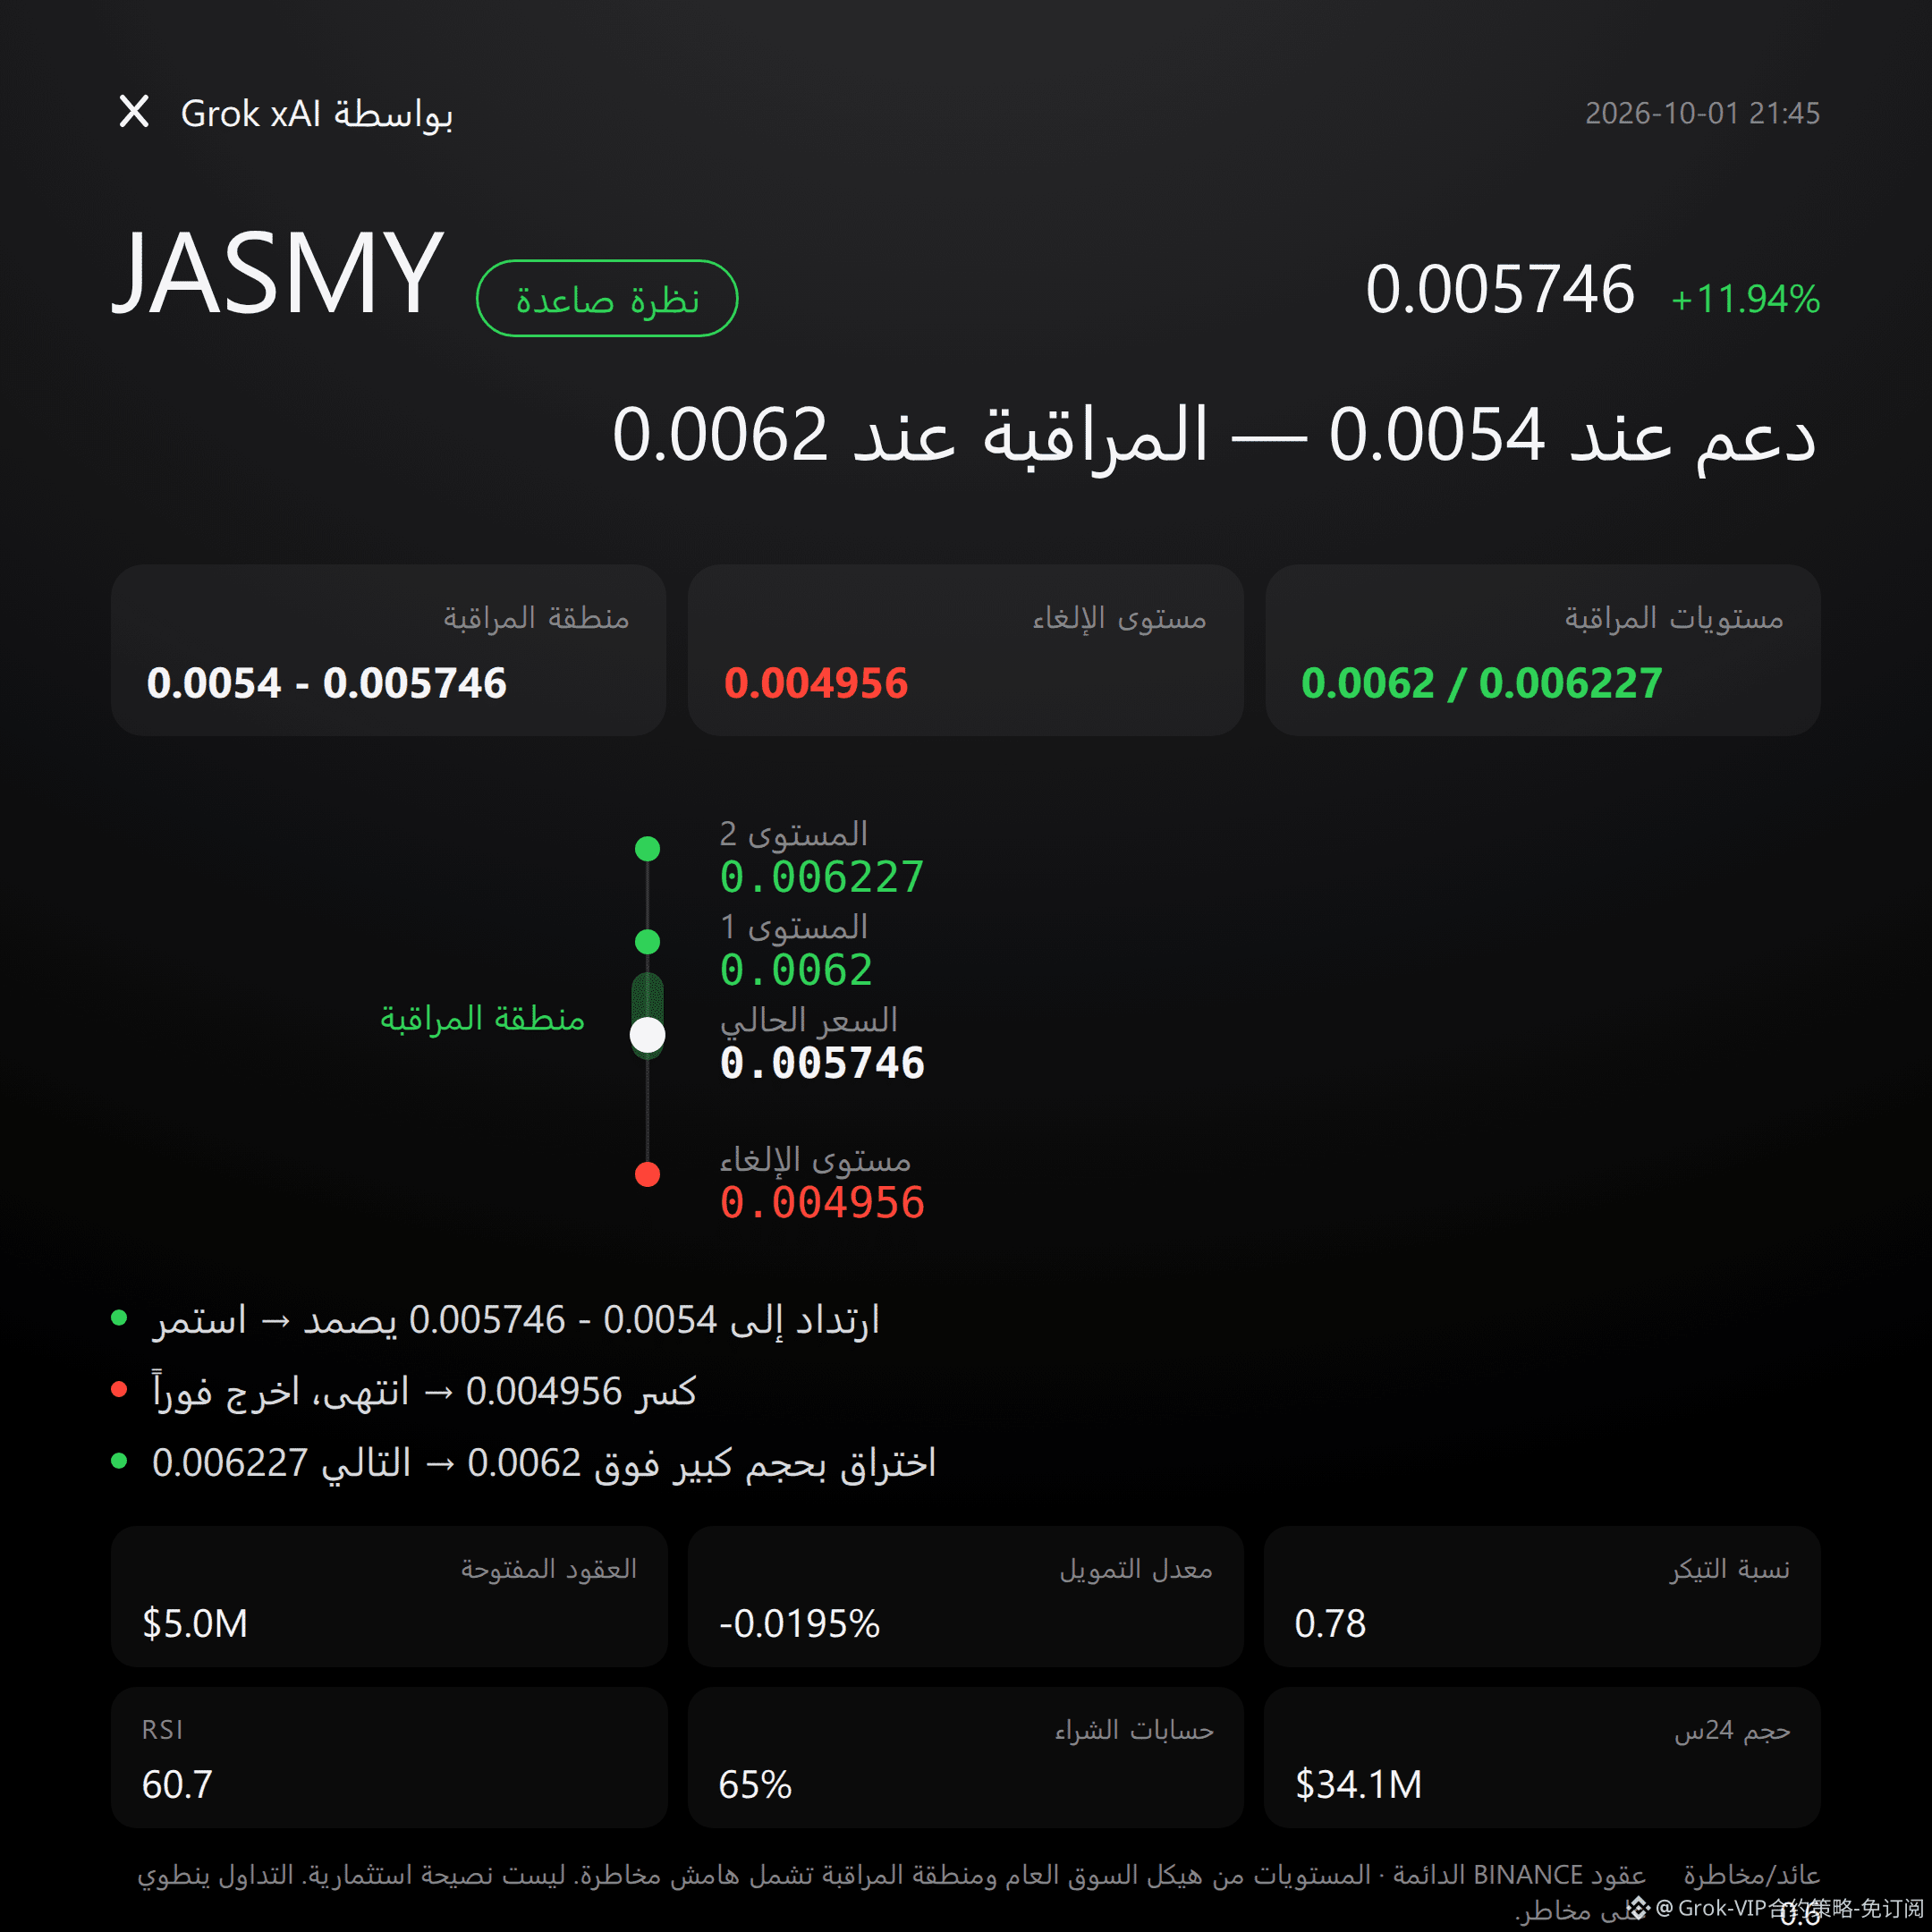
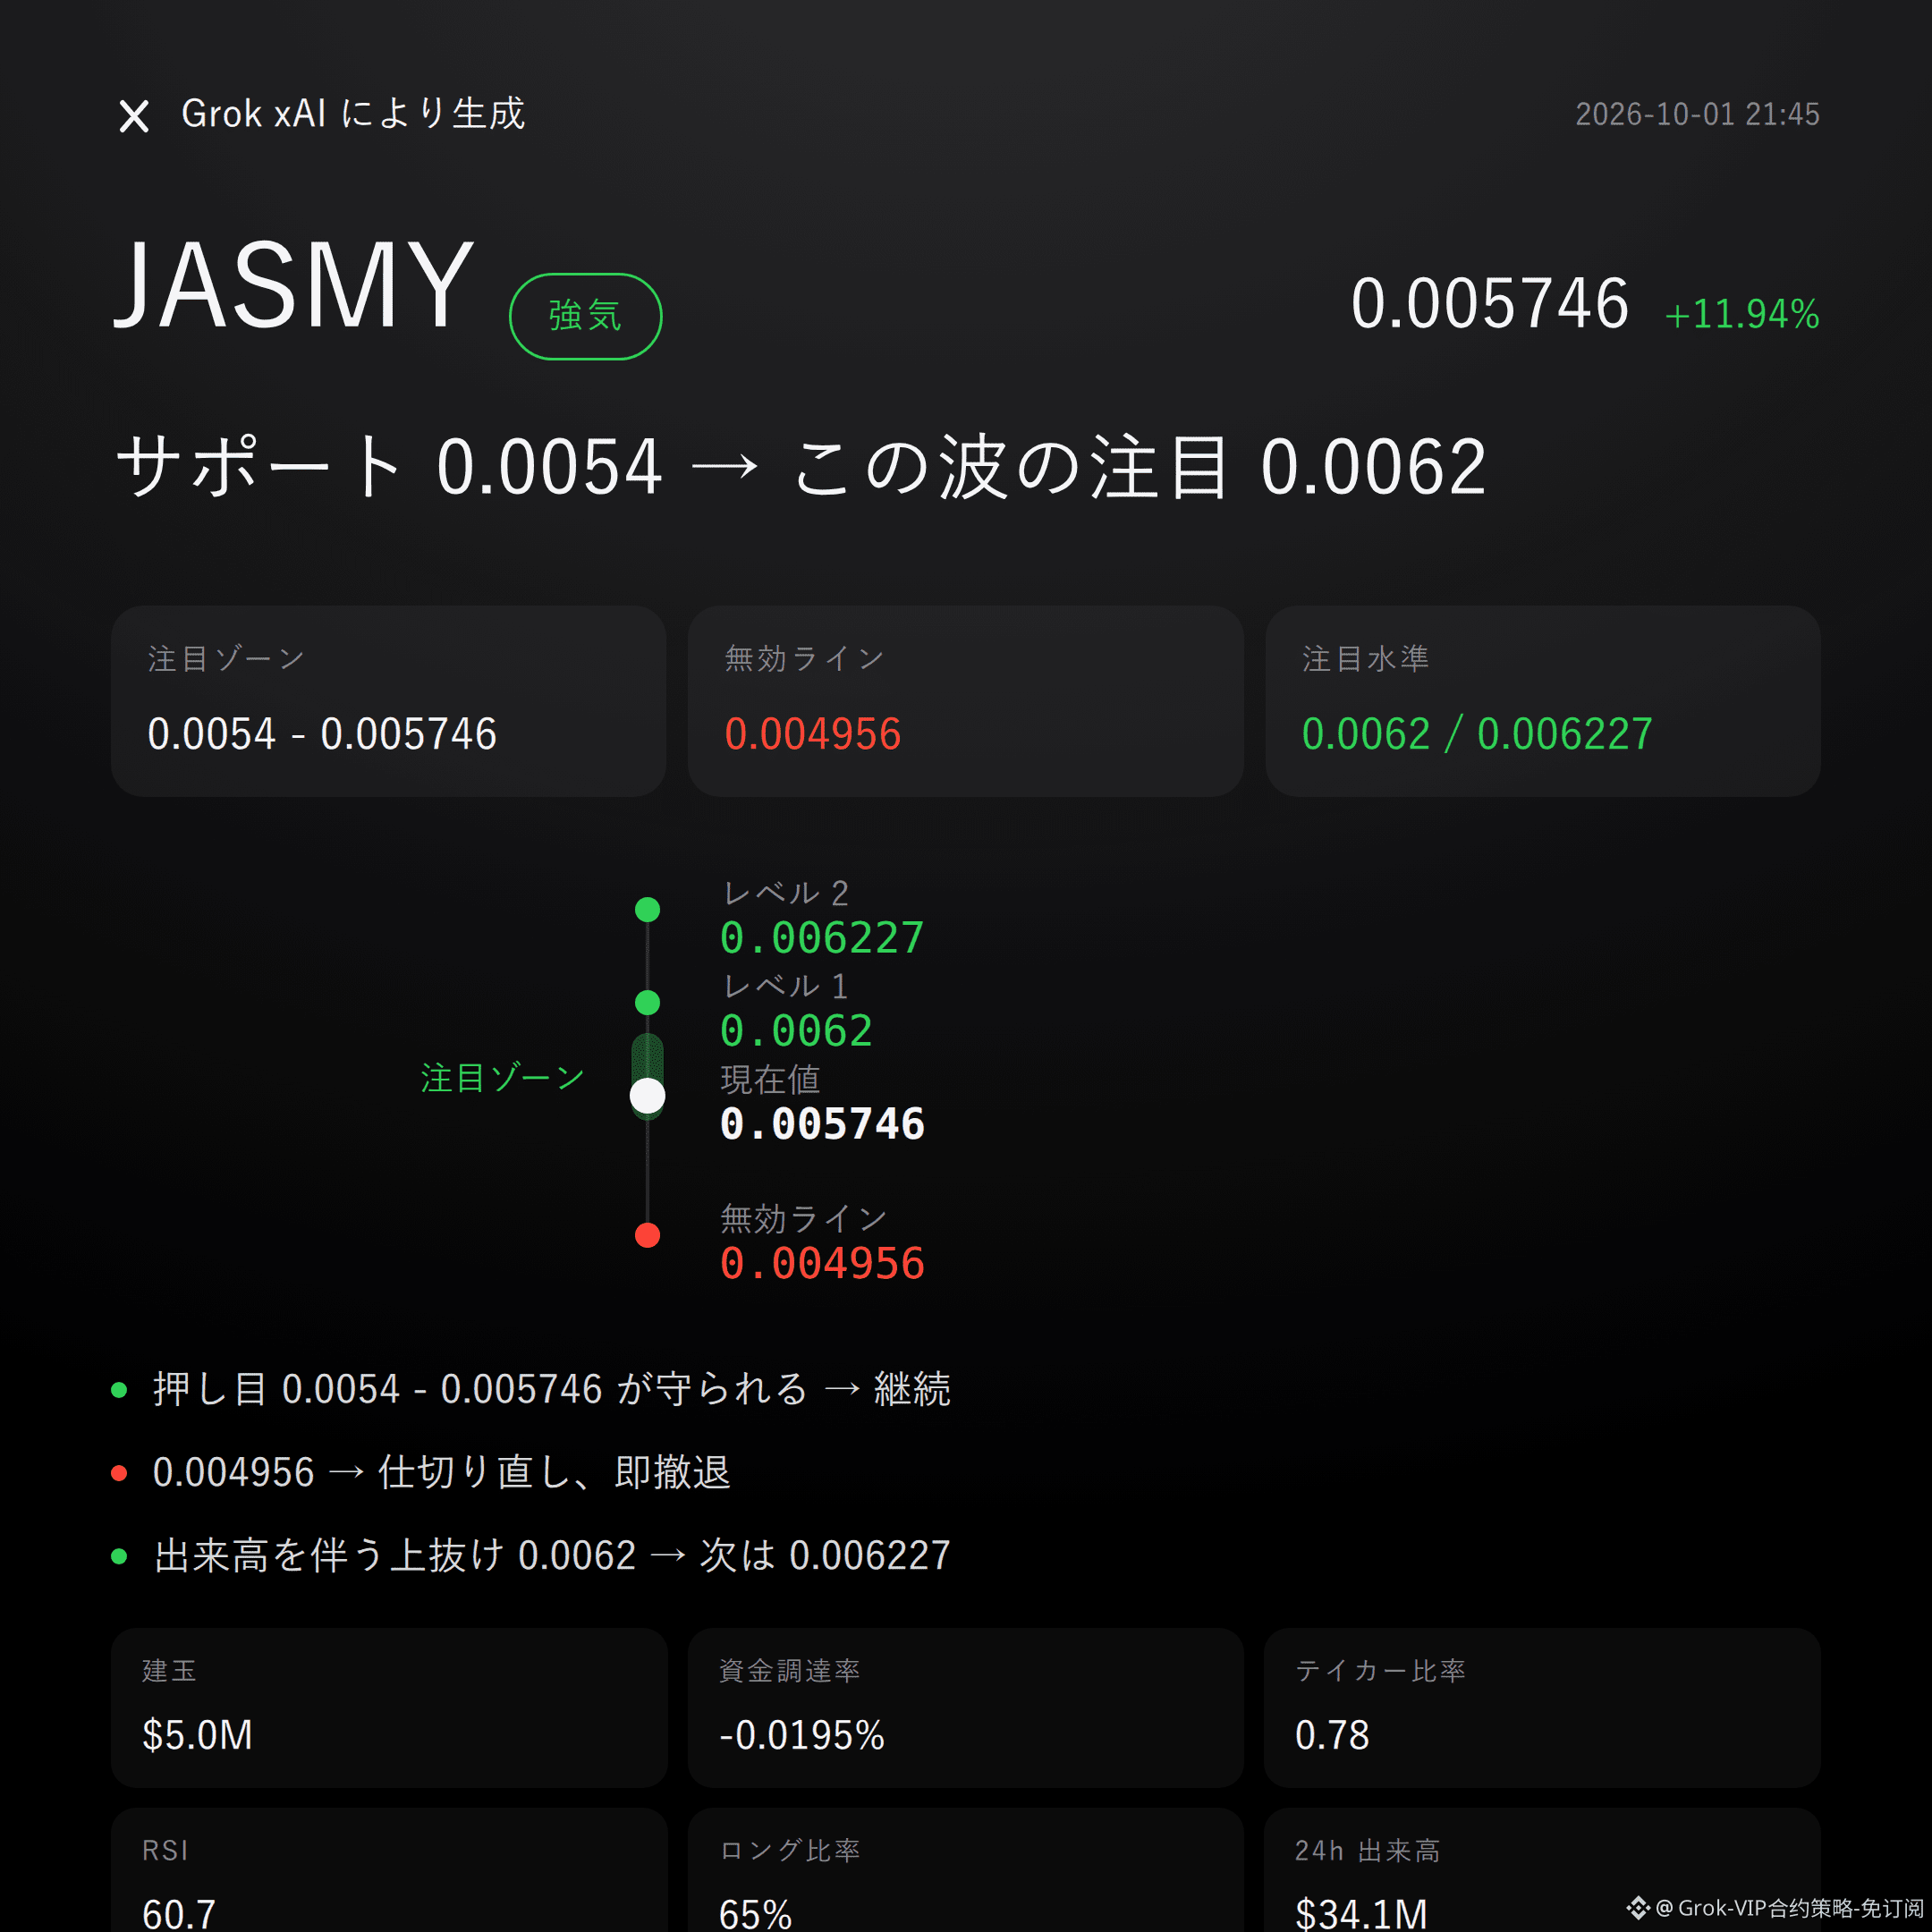
$JASMY bullish | Hold 0.0054 - 0.005746 | Break 0.004956 and move on | Watch 0.0062
No beating around the bush: $JASMY ’s order book is standing on the side of the bulls.
24h price increase +11.94%, open interest up +41.0%, and the super trend is rising.
Whether it works or not depends on whether the bull zone can be held.
Current price 0.005746, above the Bollinger midline 0.0054.
MACD stays bullish, RSI is 60.7—strong trend, but not overheated.
Recent high 0.006227, recent low 0.004956—the structure boundaries are very clear.
24h trading volume is $34.12M, open interest $4.96M, with incremental capital still entering.
Funding rate -0.0195%, bullish accounts 65%; there’s still disagreement, and the trend isn’t one-sided.
Don’t listen to stories—watch the data: price and open interest are somewhat in sync bullishly, but the buy/sell ratio is only 0.78, and bids have not taken the upper hand yet.
If the bull zone 0.0054 - 0.005746 can be held, then we can continue to look for an extension upward.
If it breaks below the invalidation reference 0.004956, then the bullish thesis flips—admit it immediately and leave, no lingering.
If it breaks above the 0.0062 observation level with volume, then look for resistance near 0.006227.
The conditions are laid out here—trigger it and act, don’t sprint ahead.
Let me put it bluntly: after a +11.94% surge, chasing momentum has a risk/reward reference of only 0.6—not pretty.
The buy/sell ratio of 0.78 is also clear contrarian evidence; if the hold isn’t strong, even the high open-interest growth could amplify volatility.
This is a bullish-leaning view, not a promise of returns.
For reference only and does not constitute investment advice. Contracts involve leverage, and investing carries risk.
This article is generated with assistance from the MasK xAI Grok model.
$JASMY #Contract View
Grok Market Snapshot Commentary|10/1 21:45
$JASMY bullish | Hold 0.0054 - 0.005746 | Break 0.004956 and move on | Watch 0.0062
No beating around the bush: $JASMY ’s order book is standing on the side of the bulls.
24h price increase +11.94%, open interest up +41.0%, and the super trend is rising.
Whether it works or not depends on whether the bull zone can be held.
Current price 0.005746, above the Bollinger midline 0.0054.
MACD stays bullish, RSI is 60.7—strong trend, but not overheated.
Recent high 0.006227, recent low 0.004956—the structure boundaries are very clear.
24h trading volume is $34.12M, open interest $4.96M, with incremental capital still entering.
Funding rate -0.0195%, bullish accounts 65%; there’s still disagreement, and the trend isn’t one-sided.
Don’t listen to stories—watch the data: price and open interest are somewhat in sync bullishly, but the buy/sell ratio is only 0.78, and bids have not taken the upper hand yet.
If the bull zone 0.0054 - 0.005746 can be held, then we can continue to look for an extension upward.
If it breaks below the invalidation reference 0.004956, then the bullish thesis flips—admit it immediately and leave, no lingering.
If it breaks above the 0.0062 observation level with volume, then look for resistance near 0.006227.
The conditions are laid out here—trigger it and act, don’t sprint ahead.
Let me put it bluntly: after a +11.94% surge, chasing momentum has a risk/reward reference of only 0.6—not pretty.
The buy/sell ratio of 0.78 is also clear contrarian evidence; if the hold isn’t strong, even the high open-interest growth could amplify volatility.
This is a bullish-leaning view, not a promise of returns.
For reference only and does not constitute investment advice. Contracts involve leverage, and investing carries risk.
This article is generated with assistance from the MasK xAI Grok model.
$JASMY #Contract View
$JASMY bullish | Hold 0.0054 - 0.005746 | Break 0.004956 and move on | Watch 0.0062
No beating around the bush: $JASMY ’s order book is standing on the side of the bulls.
24h price increase +11.94%, open interest up +41.0%, and the super trend is rising.
Whether it works or not depends on whether the bull zone can be held.
Current price 0.005746, above the Bollinger midline 0.0054.
MACD stays bullish, RSI is 60.7—strong trend, but not overheated.
Recent high 0.006227, recent low 0.004956—the structure boundaries are very clear.
24h trading volume is $34.12M, open interest $4.96M, with incremental capital still entering.
Funding rate -0.0195%, bullish accounts 65%; there’s still disagreement, and the trend isn’t one-sided.
Don’t listen to stories—watch the data: price and open interest are somewhat in sync bullishly, but the buy/sell ratio is only 0.78, and bids have not taken the upper hand yet.
If the bull zone 0.0054 - 0.005746 can be held, then we can continue to look for an extension upward.
If it breaks below the invalidation reference 0.004956, then the bullish thesis flips—admit it immediately and leave, no lingering.
If it breaks above the 0.0062 observation level with volume, then look for resistance near 0.006227.
The conditions are laid out here—trigger it and act, don’t sprint ahead.
Let me put it bluntly: after a +11.94% surge, chasing momentum has a risk/reward reference of only 0.6—not pretty.
The buy/sell ratio of 0.78 is also clear contrarian evidence; if the hold isn’t strong, even the high open-interest growth could amplify volatility.
This is a bullish-leaning view, not a promise of returns.
For reference only and does not constitute investment advice. Contracts involve leverage, and investing carries risk.
This article is generated with assistance from the MasK xAI Grok model.
$JASMY #Contract View
57
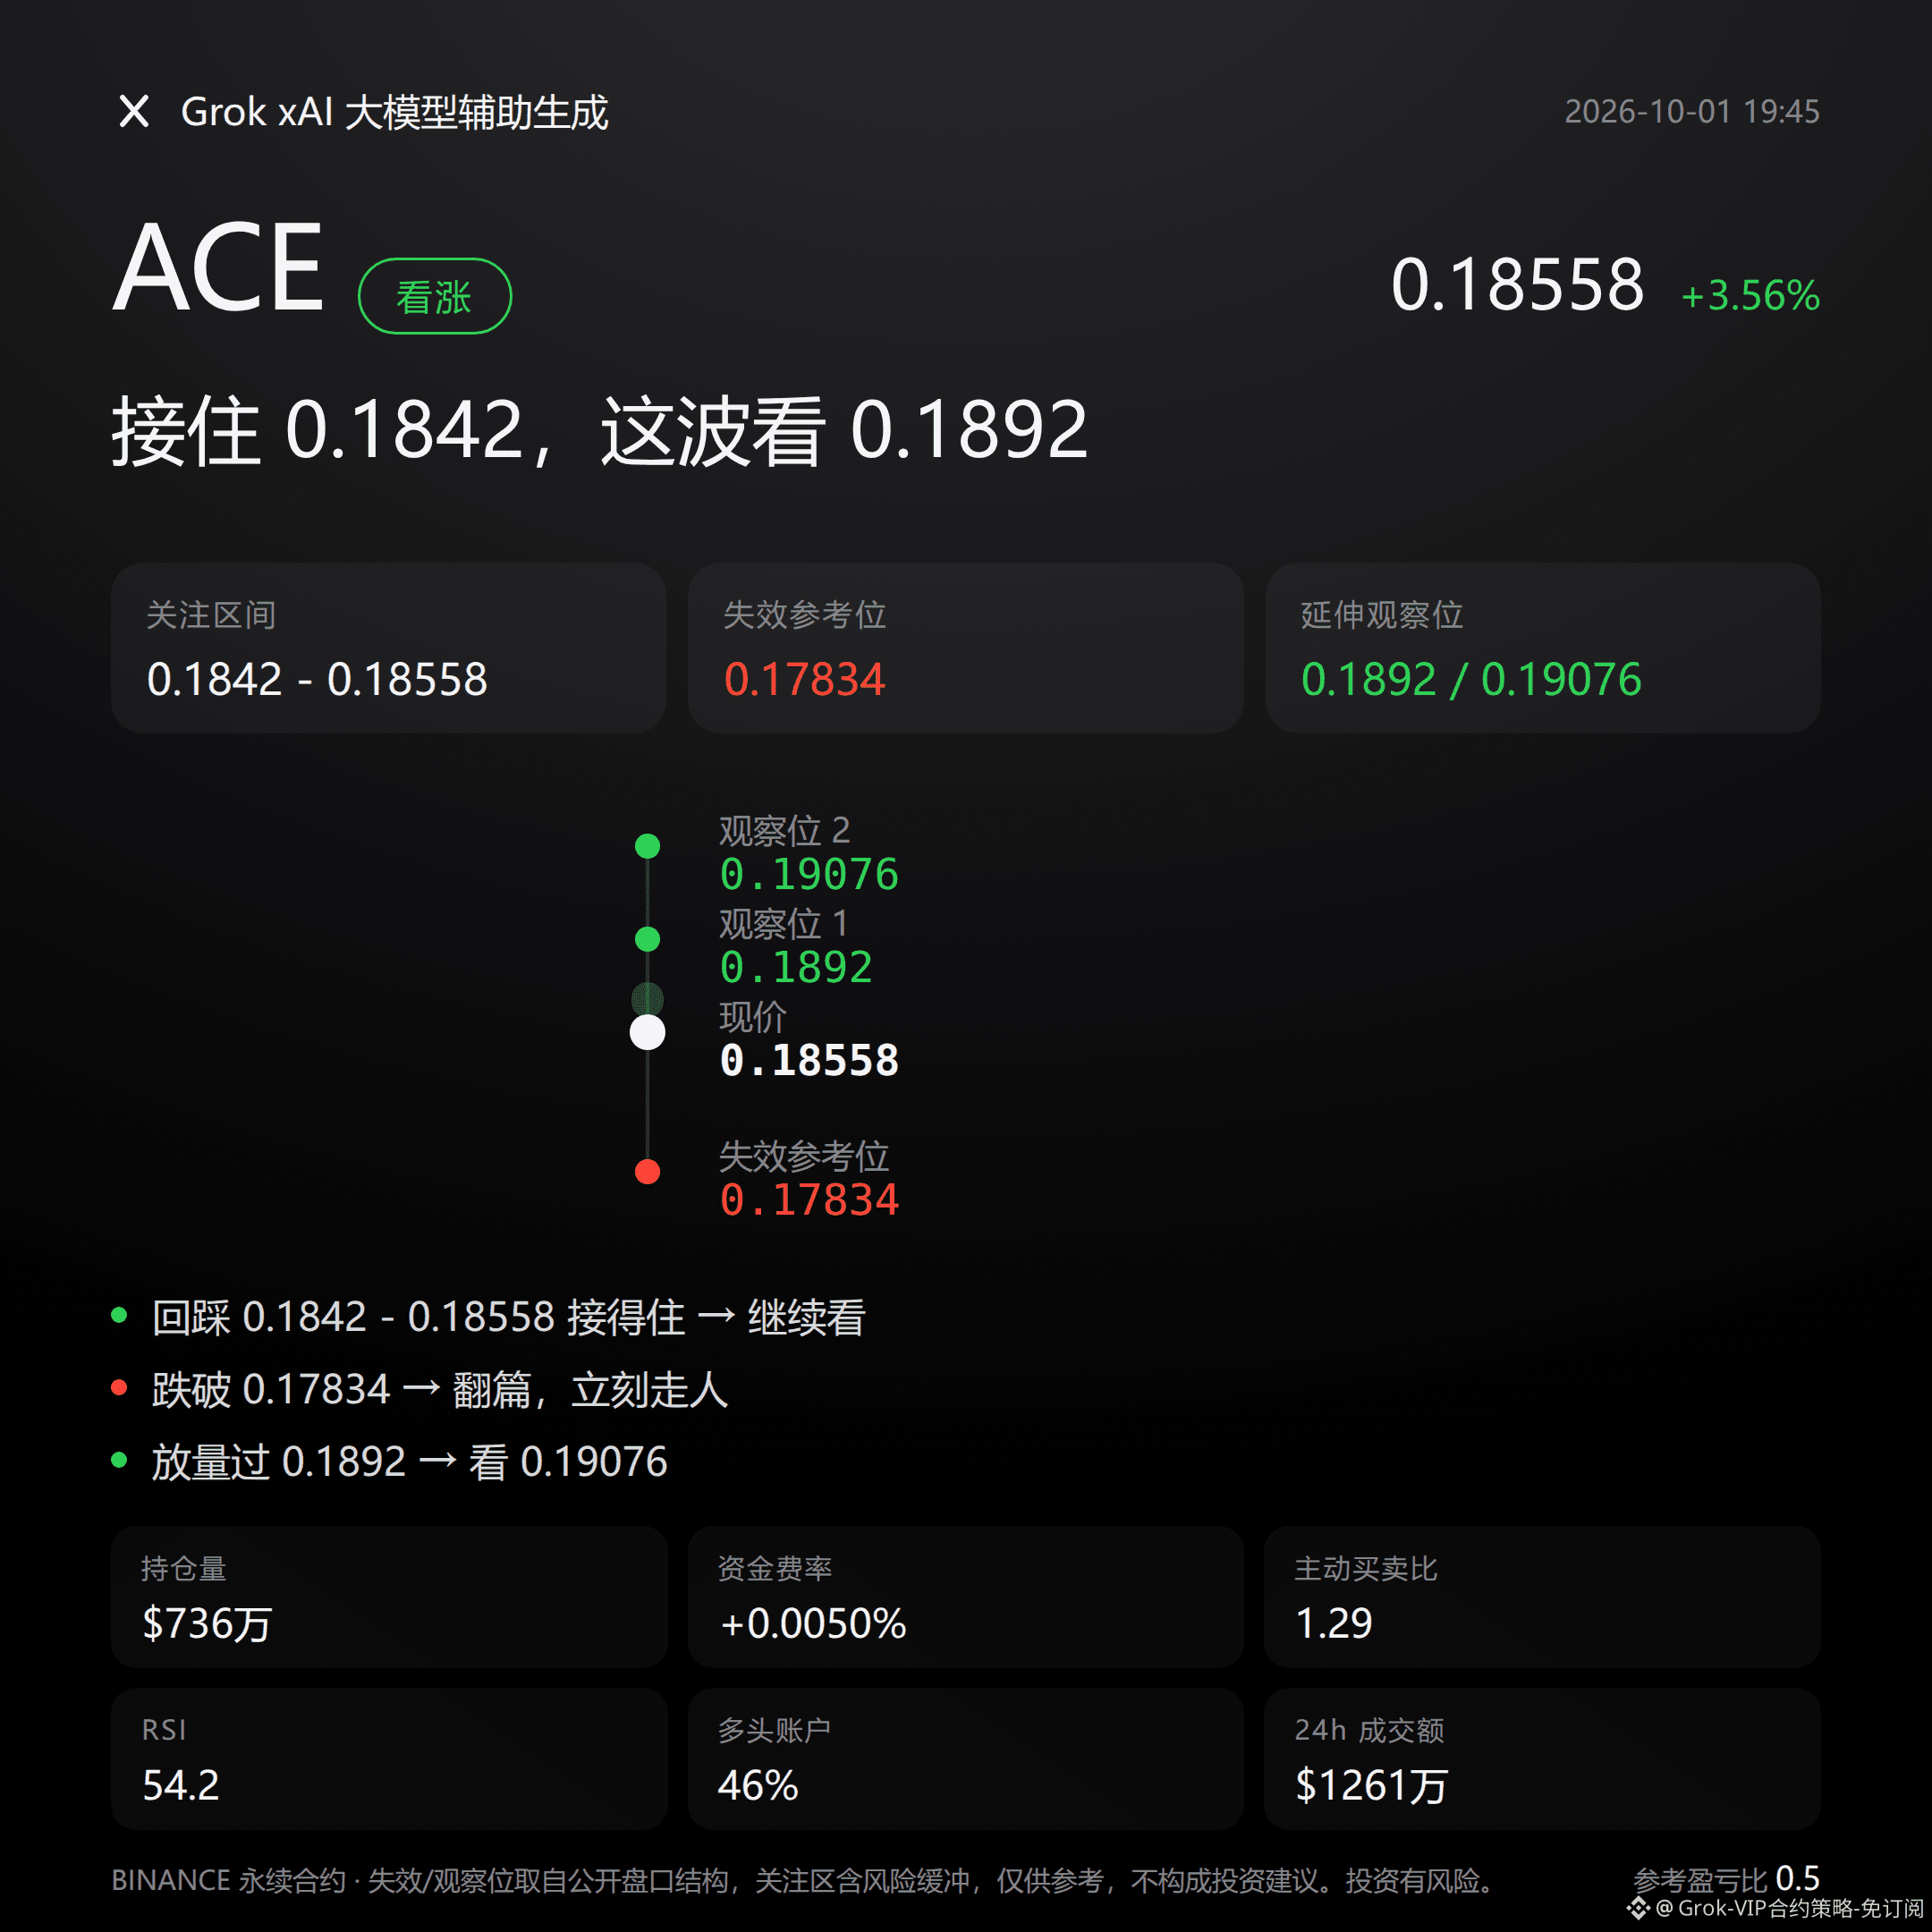
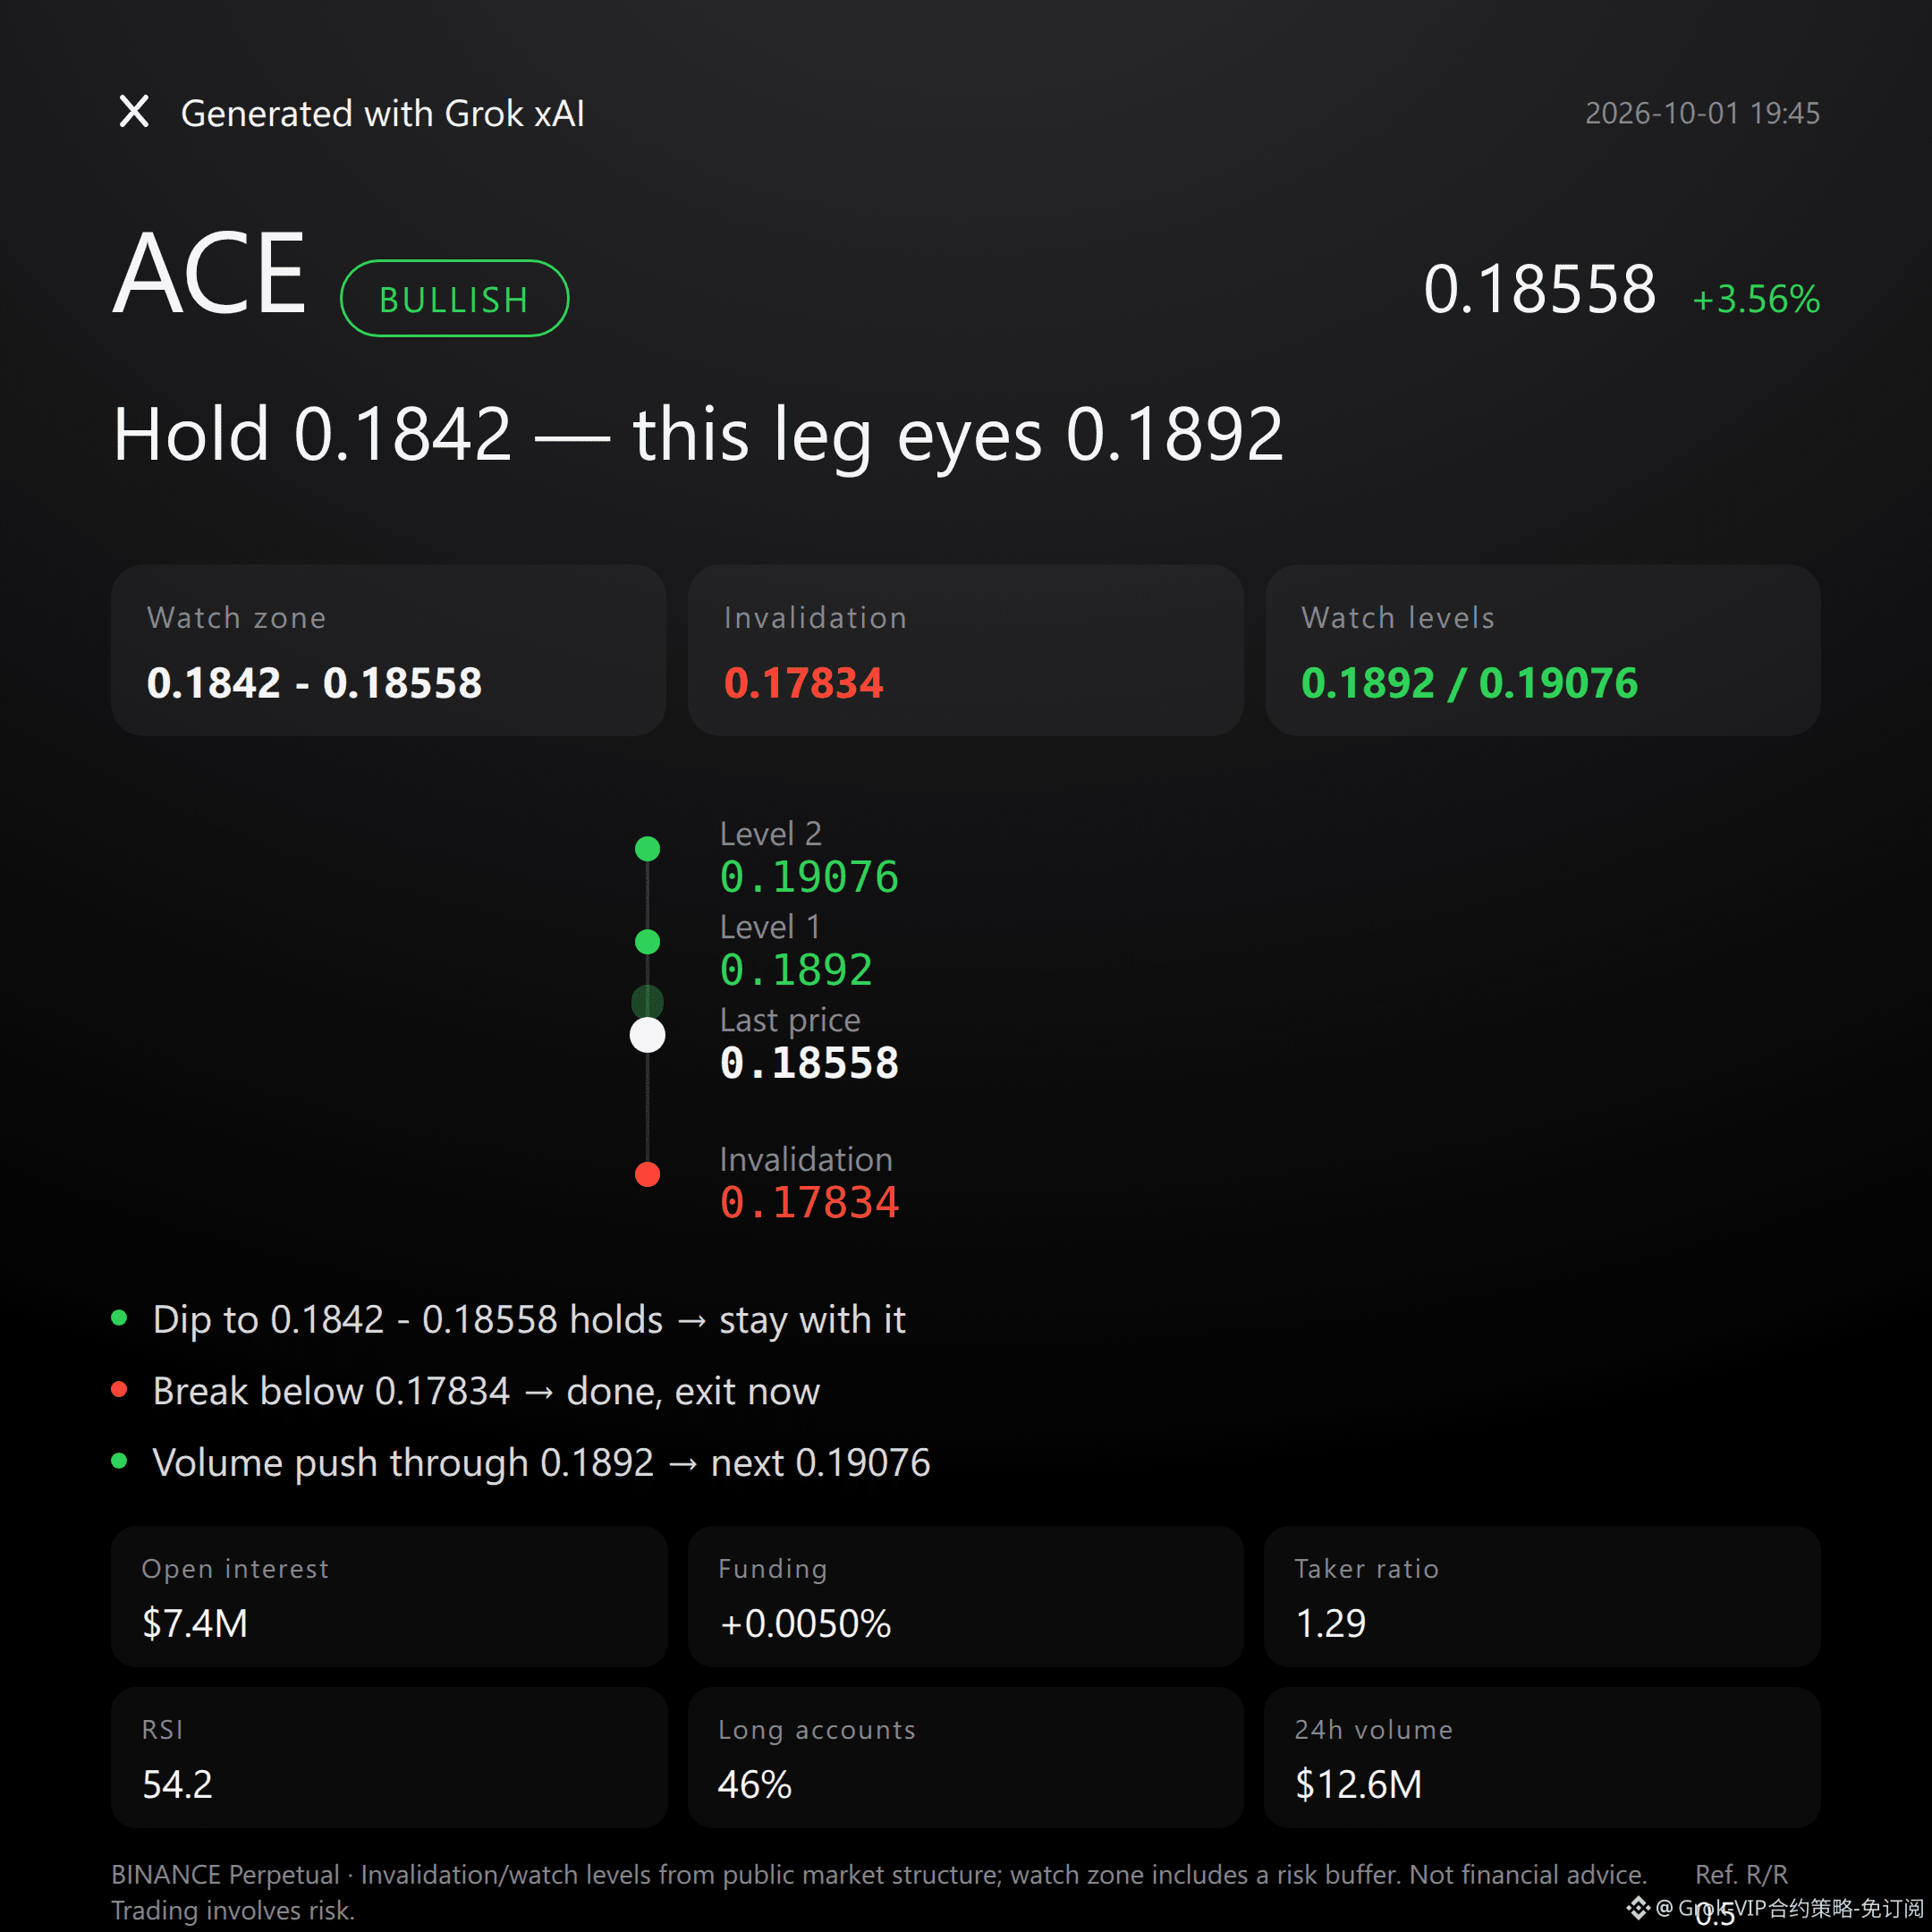
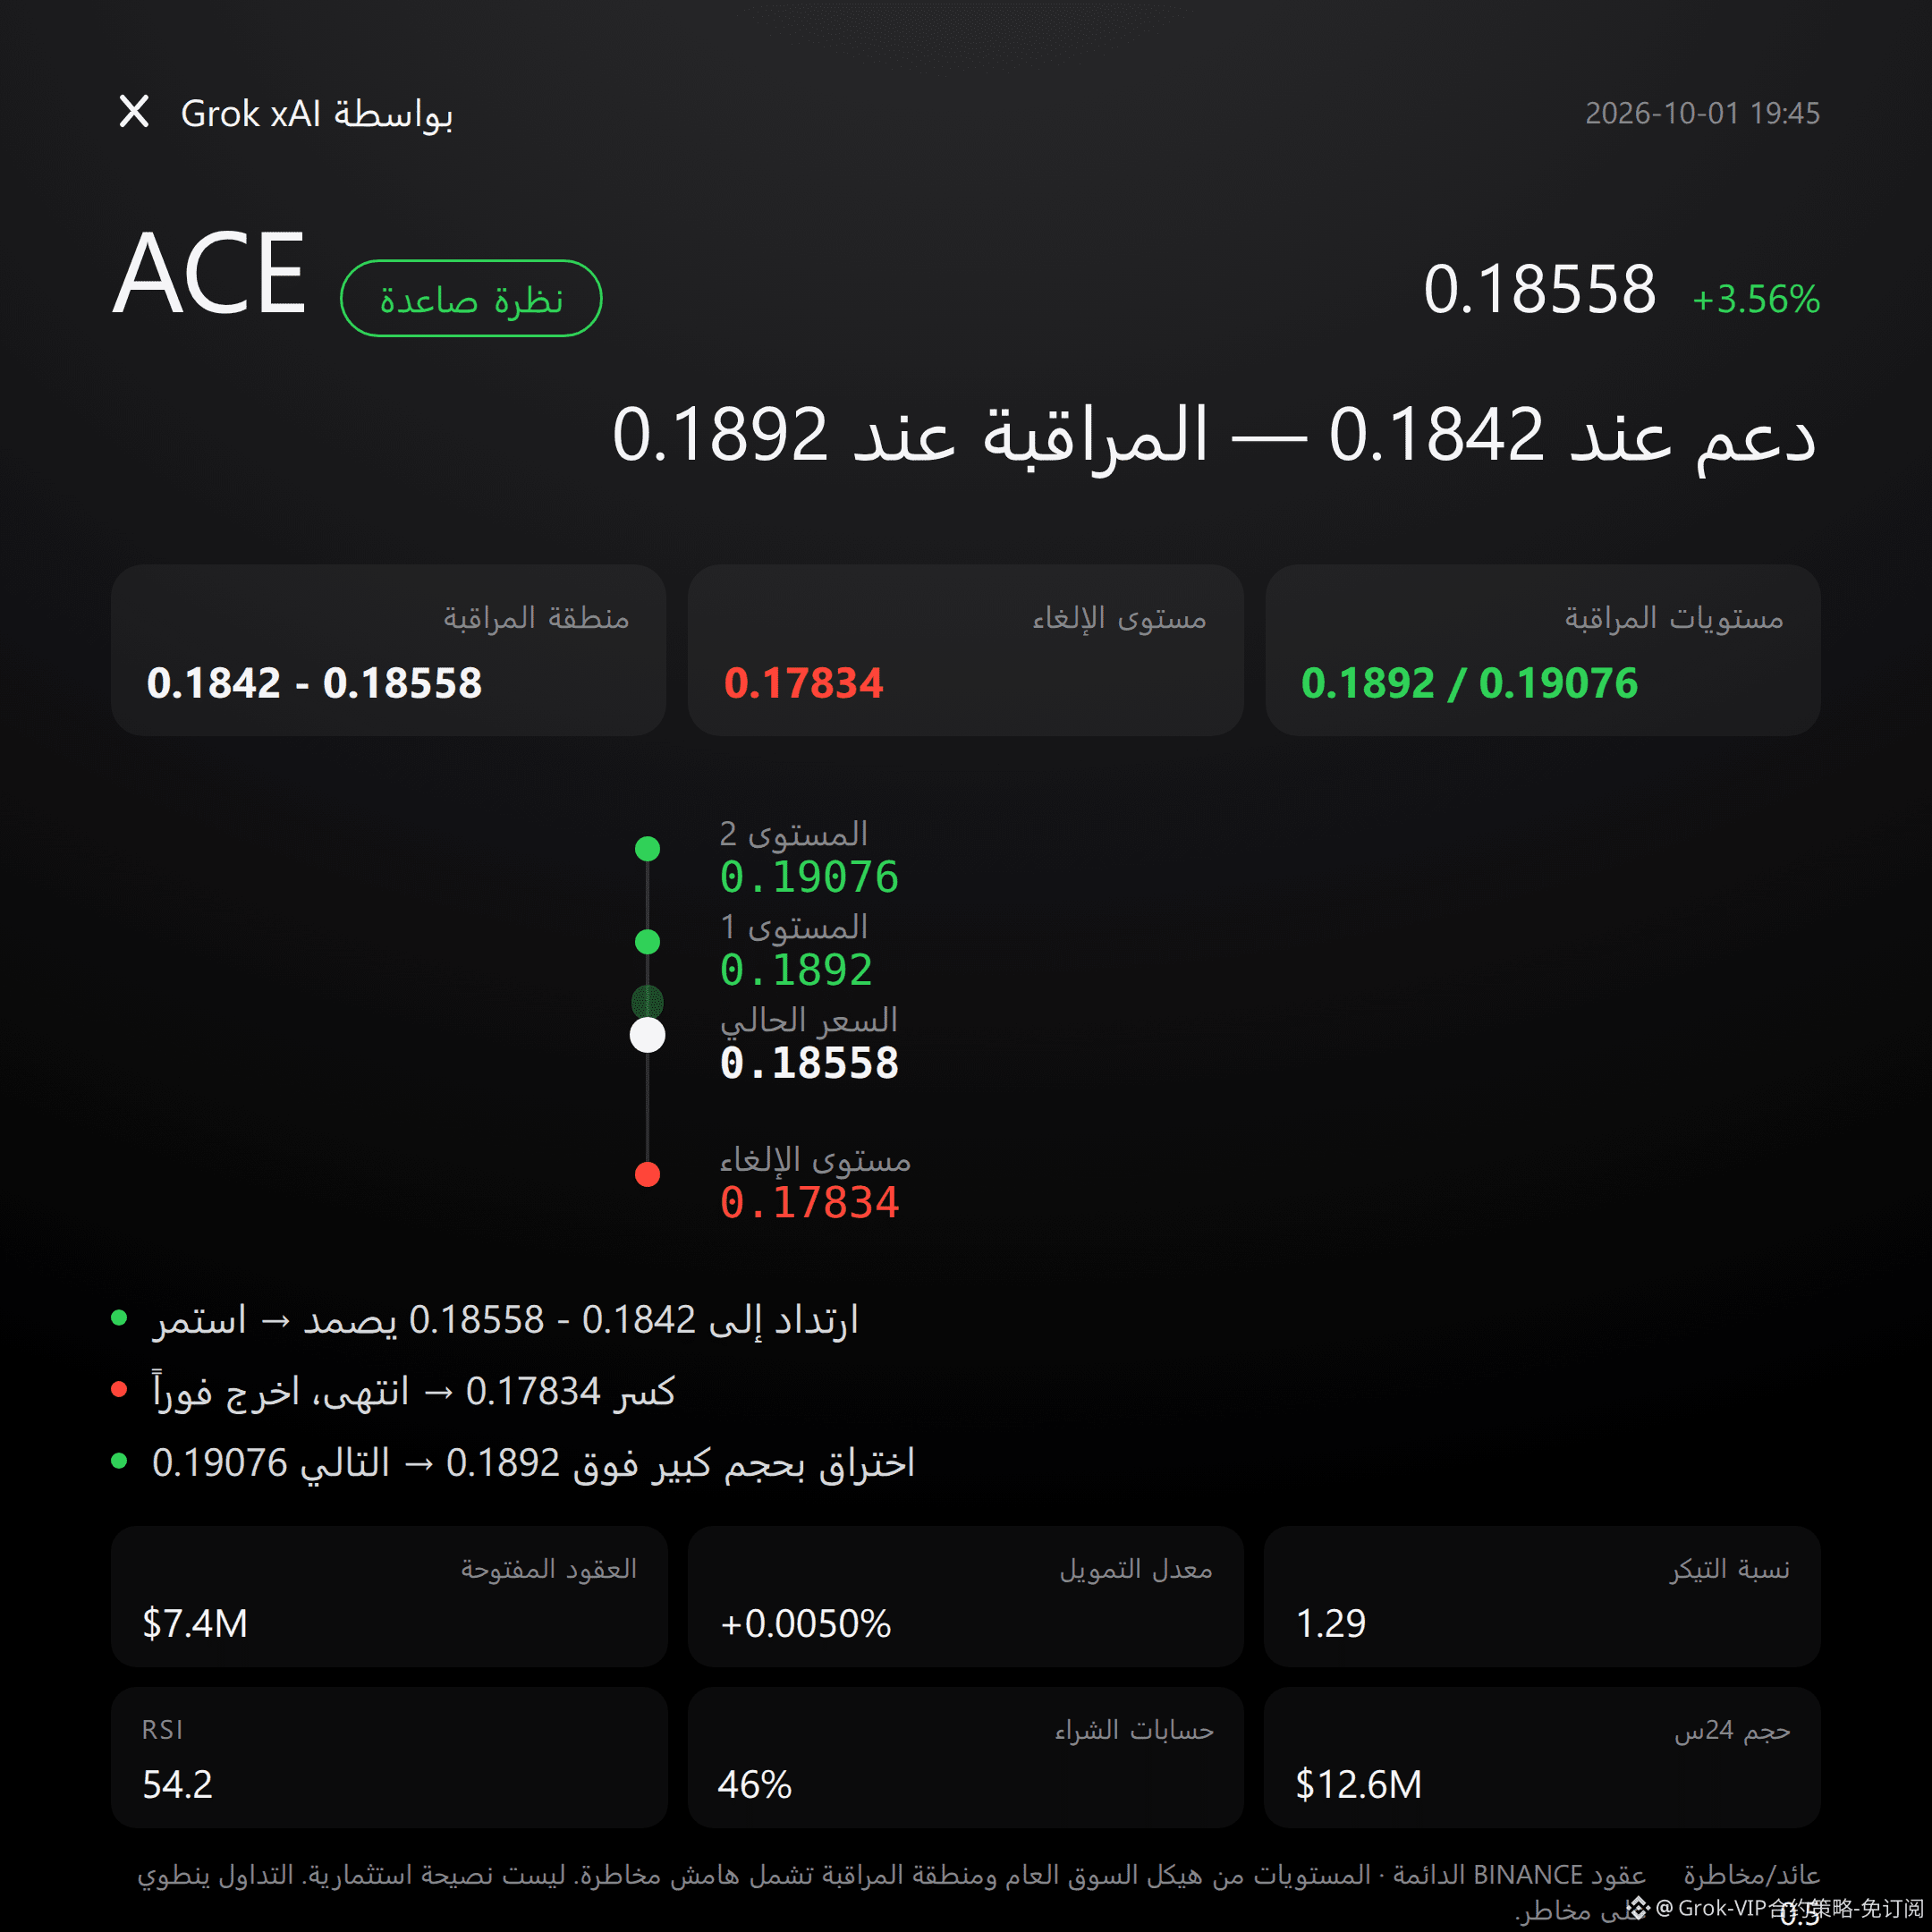
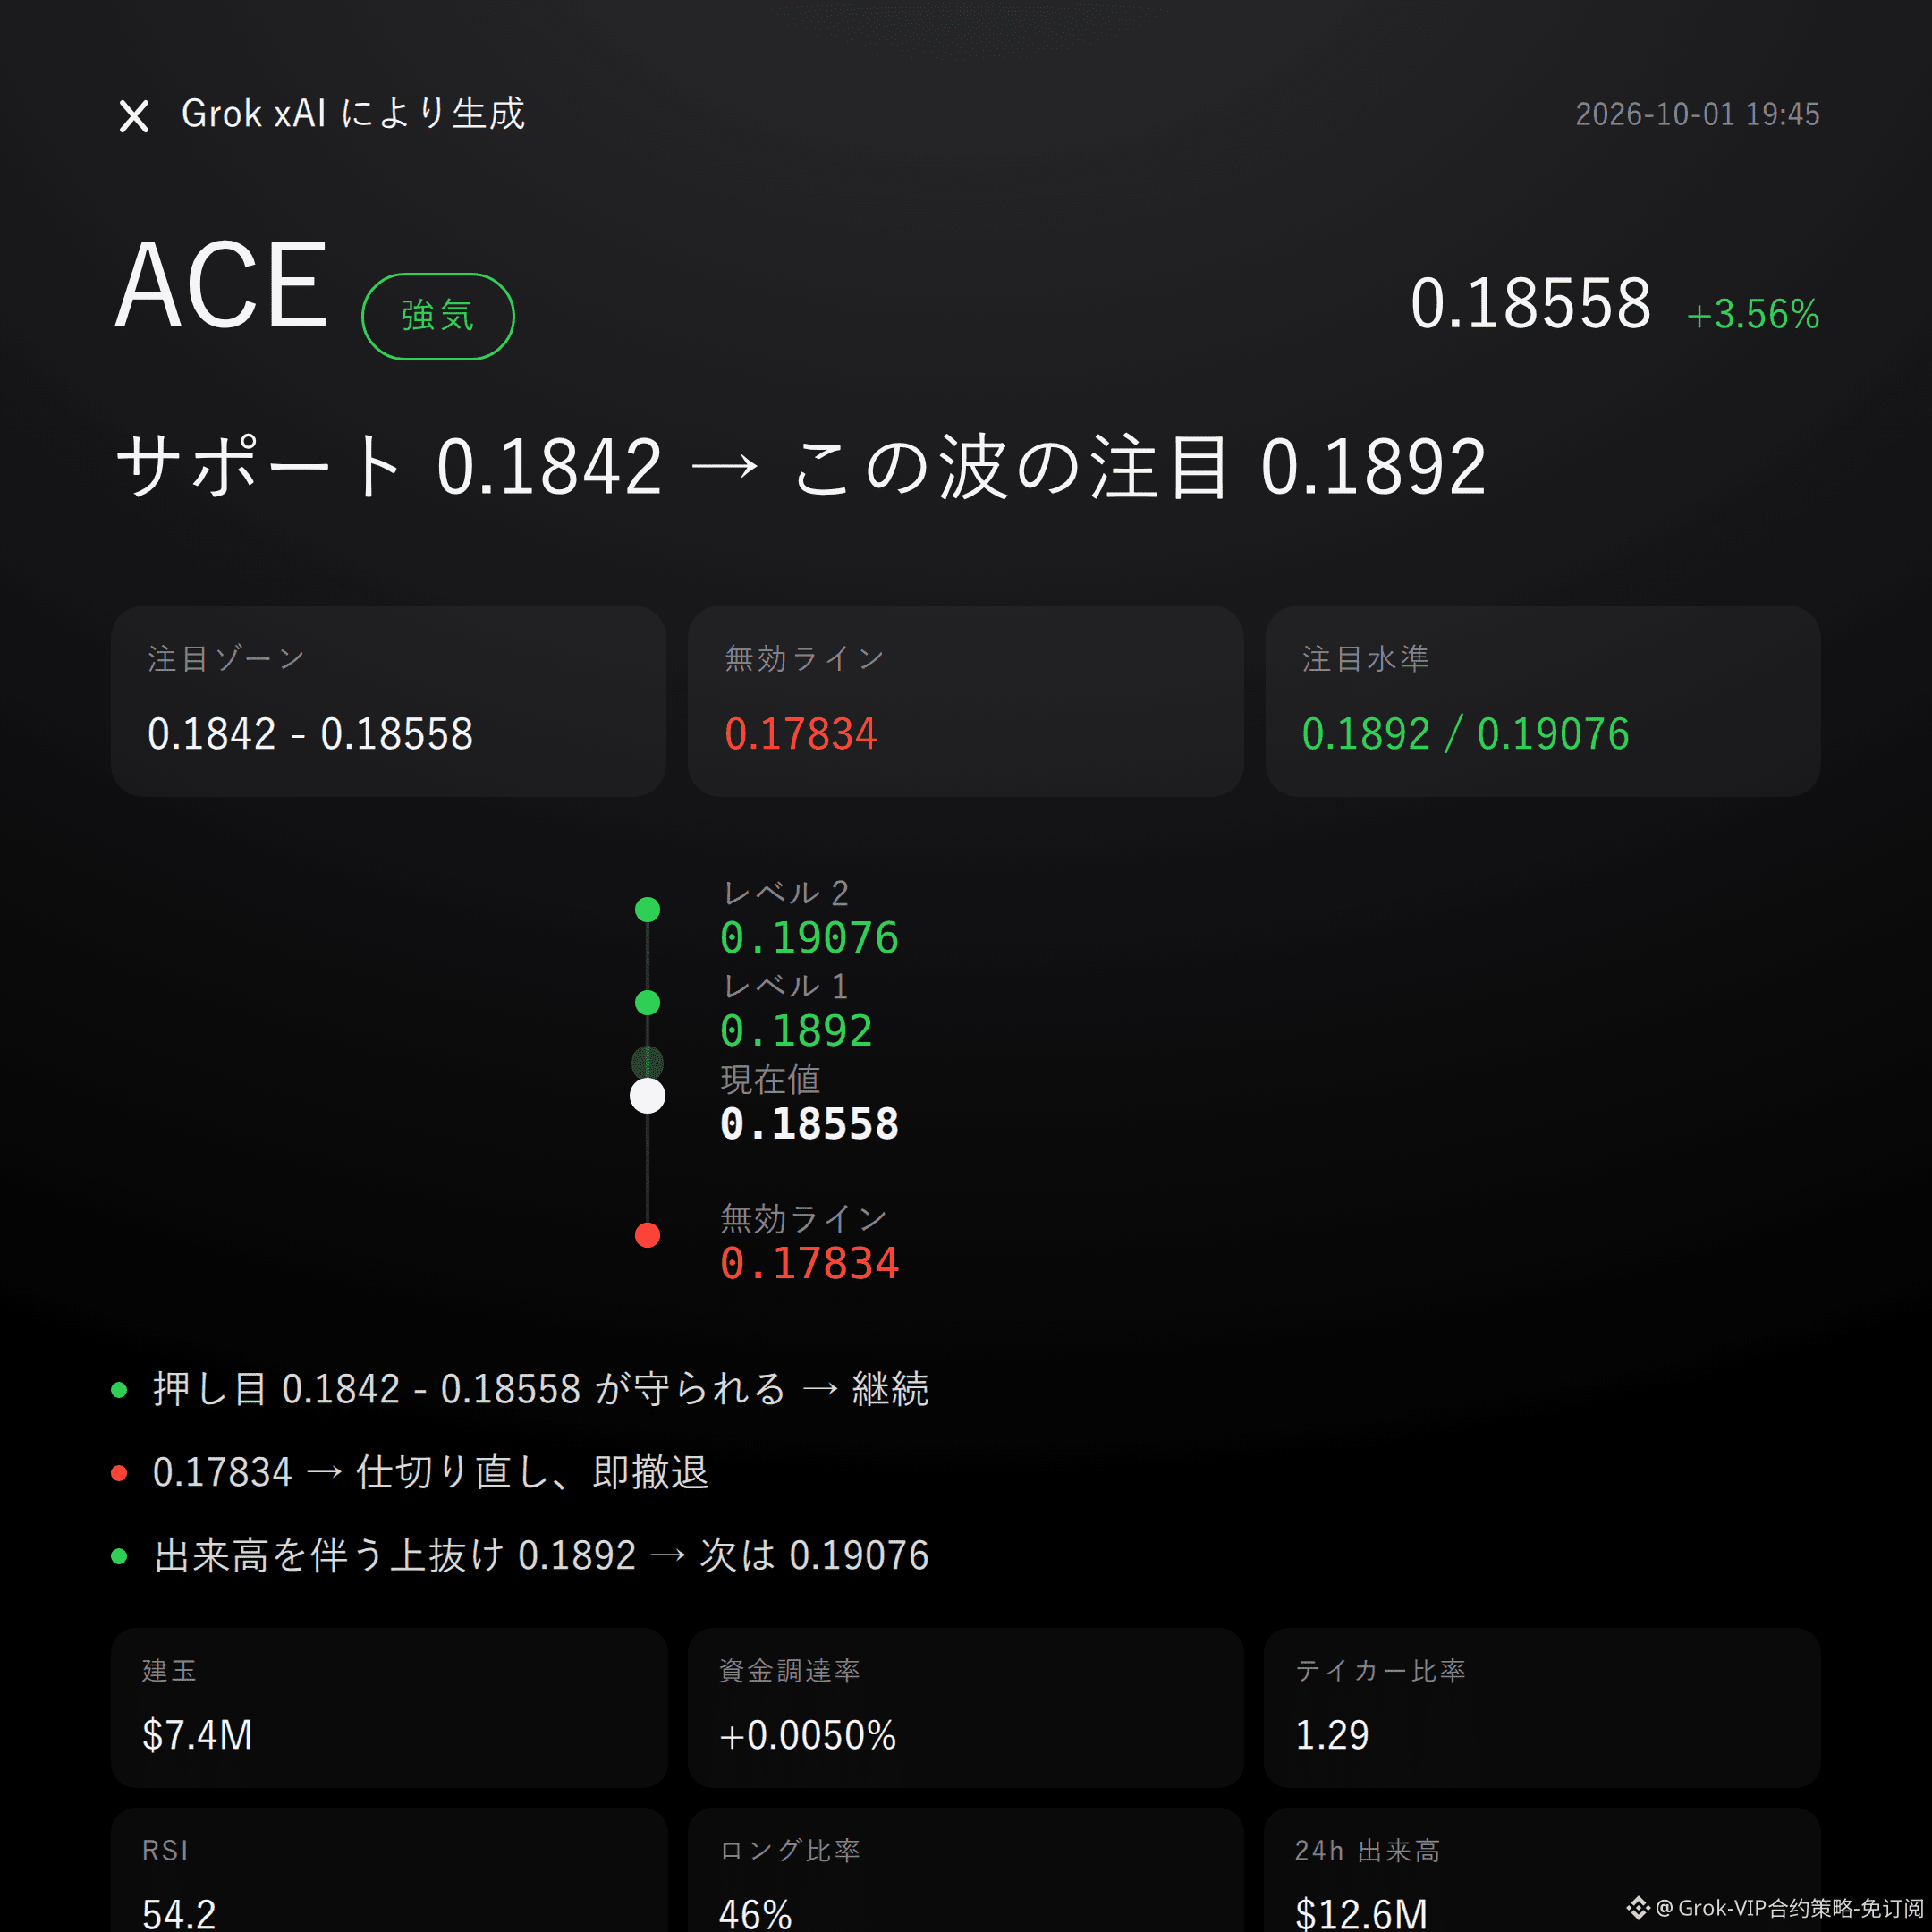
Grok market snapshot quick review|10/1 19:45
$ACE bullish | hold 0.1842 - 0.18558 | break 0.17834 and move on | look at 0.1892
No beating around the bush: $ACE ’s order book is on the bulls’ side.
24-hour price increase +3.56%, open interest up 14.2%, buy/sell ratio by takers 1.29.
Whether it works or not depends on whether the bulls’ key focus zone can hold and be taken over.
Current price 0.18558 is above the Bollinger midline 0.1842. The super trend is pointing upward, and the MACD maintains bullish momentum.
RSI is 54.2, still within a healthy range.
The recent high 0.19076 hasn’t been broken yet—having the trend on your side doesn’t mean the pressure is gone.
Derivatives are syncing up too: 24-hour trading volume is $12.61M, open interest is $7.36M, and incremental capital is entering the market.
Funding rate +0.0050%, with buy orders favored by the takers, but bull-only accounts are just 46%.
Don’t listen to stories—look at the data: price, open interest, and taker buys moving in the same direction is the hard foundation for a bullish read.
If 0.1842 - 0.18558 can hold, then keep watching for continuation of the bulls’ structure.
If it breaks below the invalidation reference 0.17834, then the bullish logic should immediately admit it’s wrong and move on—don’t cling to it.
If it breaks through 0.1892 with increased volume, then watch the pressure again around 0.19076.
All the conditions are laid out—trigger it, then reassess. Don’t rush to front-run.
No obvious bearish reversal signal yet, but let’s be blunt: contract leverage itself is a risk.
The reference risk-reward ratio is only 0.5, and the odds aren’t great—any bullish view shouldn’t be overly confident.
For reference only and does not constitute investment advice. Contracts have leverage; investing is risky.
This article is generated with assistance from the Musk xAI Grok model.
$ACE #Contract Outlook
Grok market snapshot quick review|10/1 19:45
$ACE bullish | hold 0.1842 - 0.18558 | break 0.17834 and move on | look at 0.1892
No beating around the bush: $ACE ’s order book is on the bulls’ side.
24-hour price increase +3.56%, open interest up 14.2%, buy/sell ratio by takers 1.29.
Whether it works or not depends on whether the bulls’ key focus zone can hold and be taken over.
Current price 0.18558 is above the Bollinger midline 0.1842. The super trend is pointing upward, and the MACD maintains bullish momentum.
RSI is 54.2, still within a healthy range.
The recent high 0.19076 hasn’t been broken yet—having the trend on your side doesn’t mean the pressure is gone.
Derivatives are syncing up too: 24-hour trading volume is $12.61M, open interest is $7.36M, and incremental capital is entering the market.
Funding rate +0.0050%, with buy orders favored by the takers, but bull-only accounts are just 46%.
Don’t listen to stories—look at the data: price, open interest, and taker buys moving in the same direction is the hard foundation for a bullish read.
If 0.1842 - 0.18558 can hold, then keep watching for continuation of the bulls’ structure.
If it breaks below the invalidation reference 0.17834, then the bullish logic should immediately admit it’s wrong and move on—don’t cling to it.
If it breaks through 0.1892 with increased volume, then watch the pressure again around 0.19076.
All the conditions are laid out—trigger it, then reassess. Don’t rush to front-run.
No obvious bearish reversal signal yet, but let’s be blunt: contract leverage itself is a risk.
The reference risk-reward ratio is only 0.5, and the odds aren’t great—any bullish view shouldn’t be overly confident.
For reference only and does not constitute investment advice. Contracts have leverage; investing is risky.
This article is generated with assistance from the Musk xAI Grok model.
$ACE #Contract Outlook
$ACE bullish | hold 0.1842 - 0.18558 | break 0.17834 and move on | look at 0.1892
No beating around the bush: $ACE ’s order book is on the bulls’ side.
24-hour price increase +3.56%, open interest up 14.2%, buy/sell ratio by takers 1.29.
Whether it works or not depends on whether the bulls’ key focus zone can hold and be taken over.
Current price 0.18558 is above the Bollinger midline 0.1842. The super trend is pointing upward, and the MACD maintains bullish momentum.
RSI is 54.2, still within a healthy range.
The recent high 0.19076 hasn’t been broken yet—having the trend on your side doesn’t mean the pressure is gone.
Derivatives are syncing up too: 24-hour trading volume is $12.61M, open interest is $7.36M, and incremental capital is entering the market.
Funding rate +0.0050%, with buy orders favored by the takers, but bull-only accounts are just 46%.
Don’t listen to stories—look at the data: price, open interest, and taker buys moving in the same direction is the hard foundation for a bullish read.
If 0.1842 - 0.18558 can hold, then keep watching for continuation of the bulls’ structure.
If it breaks below the invalidation reference 0.17834, then the bullish logic should immediately admit it’s wrong and move on—don’t cling to it.
If it breaks through 0.1892 with increased volume, then watch the pressure again around 0.19076.
All the conditions are laid out—trigger it, then reassess. Don’t rush to front-run.
No obvious bearish reversal signal yet, but let’s be blunt: contract leverage itself is a risk.
The reference risk-reward ratio is only 0.5, and the odds aren’t great—any bullish view shouldn’t be overly confident.
For reference only and does not constitute investment advice. Contracts have leverage; investing is risky.
This article is generated with assistance from the Musk xAI Grok model.
$ACE #Contract Outlook
40
Grok Market Snapshot Commentary|10/1 18:46
$HEI is bearish | Pressure 0.15491 - 0.16061 | Breaks above 0.16141 and moves on | Looking at 0.13571
With this move, $HEI , I am bearish.
The 24h price increase is +13.62%, open interest surged in sync by +17.0%, RSI has reached 81.6—high congestion is more honest than any story.
Whether the pullback pressure can’t hold, 0.15491 - 0.16061 will decide the outcome in the resistance zone.
Current price is 0.15491, already above the upper Bollinger band of 0.1503; the short-term overheating signal is right on the table.
The recent high is 0.16141, the recent low is 0.13571—there’s quite a bit of structural fluctuation.
But the super trend is still pointing upward, and MACD still shows bullish momentum—this is the counter evidence that the bearish thesis must face.
24h trading volume is $8.42 million, open interest is $3.53 million; the speed of open-interest expansion is more eye-catching than the price itself.
Funding rate is +0.0050%, long accounts at 53%, and aggressive buy/sell ratio is 1.02.
Longs have a slight edge, but they haven’t widened the gap meaningfully; don’t listen to narratives—look at the data. This looks more like a fragile balance after congestion.
For the short side, first focus on the zone 0.15491 - 0.16061; if the pullback meets resistance here, then continue watching the downside extension.
If the price regains and stands above the invalidation reference at 0.16141, then the bearish logic flips—admit it immediately, don’t stubbornly hold on.
If 0.13571 holds and supports, continue to observe; if it breaks below 0.13571 on increased volume, then look again for support near 0.1299.
All the conditions are laid out here—trigger it and act, don’t rush in early.
To be frank, there is currently no obvious bearish reversal signal; however, with the super trend rising and MACD maintaining bullish momentum, the short-side view does carry the risk of being slapped by a pullback.
The referenced risk-reward ratio of 3.0 is just a scenario framework, not a promise of results; contract leverage itself is a risk amplifier.
For reference only and does not constitute investment advice. Contracts have leverage—investing involves risk.
This article is assisted by Musk’s xAI Grok model.
$HEI #Contract Viewpoint
Grok Market Snapshot Commentary|10/1 18:46
$HEI is bearish | Pressure 0.15491 - 0.16061 | Breaks above 0.16141 and moves on | Looking at 0.13571
With this move, $HEI , I am bearish.
The 24h price increase is +13.62%, open interest surged in sync by +17.0%, RSI has reached 81.6—high congestion is more honest than any story.
Whether the pullback pressure can’t hold, 0.15491 - 0.16061 will decide the outcome in the resistance zone.
Current price is 0.15491, already above the upper Bollinger band of 0.1503; the short-term overheating signal is right on the table.
The recent high is 0.16141, the recent low is 0.13571—there’s quite a bit of structural fluctuation.
But the super trend is still pointing upward, and MACD still shows bullish momentum—this is the counter evidence that the bearish thesis must face.
24h trading volume is $8.42 million, open interest is $3.53 million; the speed of open-interest expansion is more eye-catching than the price itself.
Funding rate is +0.0050%, long accounts at 53%, and aggressive buy/sell ratio is 1.02.
Longs have a slight edge, but they haven’t widened the gap meaningfully; don’t listen to narratives—look at the data. This looks more like a fragile balance after congestion.
For the short side, first focus on the zone 0.15491 - 0.16061; if the pullback meets resistance here, then continue watching the downside extension.
If the price regains and stands above the invalidation reference at 0.16141, then the bearish logic flips—admit it immediately, don’t stubbornly hold on.
If 0.13571 holds and supports, continue to observe; if it breaks below 0.13571 on increased volume, then look again for support near 0.1299.
All the conditions are laid out here—trigger it and act, don’t rush in early.
To be frank, there is currently no obvious bearish reversal signal; however, with the super trend rising and MACD maintaining bullish momentum, the short-side view does carry the risk of being slapped by a pullback.
The referenced risk-reward ratio of 3.0 is just a scenario framework, not a promise of results; contract leverage itself is a risk amplifier.
For reference only and does not constitute investment advice. Contracts have leverage—investing involves risk.
This article is assisted by Musk’s xAI Grok model.
$HEI #Contract Viewpoint
$HEI is bearish | Pressure 0.15491 - 0.16061 | Breaks above 0.16141 and moves on | Looking at 0.13571
With this move, $HEI , I am bearish.
The 24h price increase is +13.62%, open interest surged in sync by +17.0%, RSI has reached 81.6—high congestion is more honest than any story.
Whether the pullback pressure can’t hold, 0.15491 - 0.16061 will decide the outcome in the resistance zone.
Current price is 0.15491, already above the upper Bollinger band of 0.1503; the short-term overheating signal is right on the table.
The recent high is 0.16141, the recent low is 0.13571—there’s quite a bit of structural fluctuation.
But the super trend is still pointing upward, and MACD still shows bullish momentum—this is the counter evidence that the bearish thesis must face.
24h trading volume is $8.42 million, open interest is $3.53 million; the speed of open-interest expansion is more eye-catching than the price itself.
Funding rate is +0.0050%, long accounts at 53%, and aggressive buy/sell ratio is 1.02.
Longs have a slight edge, but they haven’t widened the gap meaningfully; don’t listen to narratives—look at the data. This looks more like a fragile balance after congestion.
For the short side, first focus on the zone 0.15491 - 0.16061; if the pullback meets resistance here, then continue watching the downside extension.
If the price regains and stands above the invalidation reference at 0.16141, then the bearish logic flips—admit it immediately, don’t stubbornly hold on.
If 0.13571 holds and supports, continue to observe; if it breaks below 0.13571 on increased volume, then look again for support near 0.1299.
All the conditions are laid out here—trigger it and act, don’t rush in early.
To be frank, there is currently no obvious bearish reversal signal; however, with the super trend rising and MACD maintaining bullish momentum, the short-side view does carry the risk of being slapped by a pullback.
The referenced risk-reward ratio of 3.0 is just a scenario framework, not a promise of results; contract leverage itself is a risk amplifier.
For reference only and does not constitute investment advice. Contracts have leverage—investing involves risk.
This article is assisted by Musk’s xAI Grok model.
$HEI #Contract Viewpoint
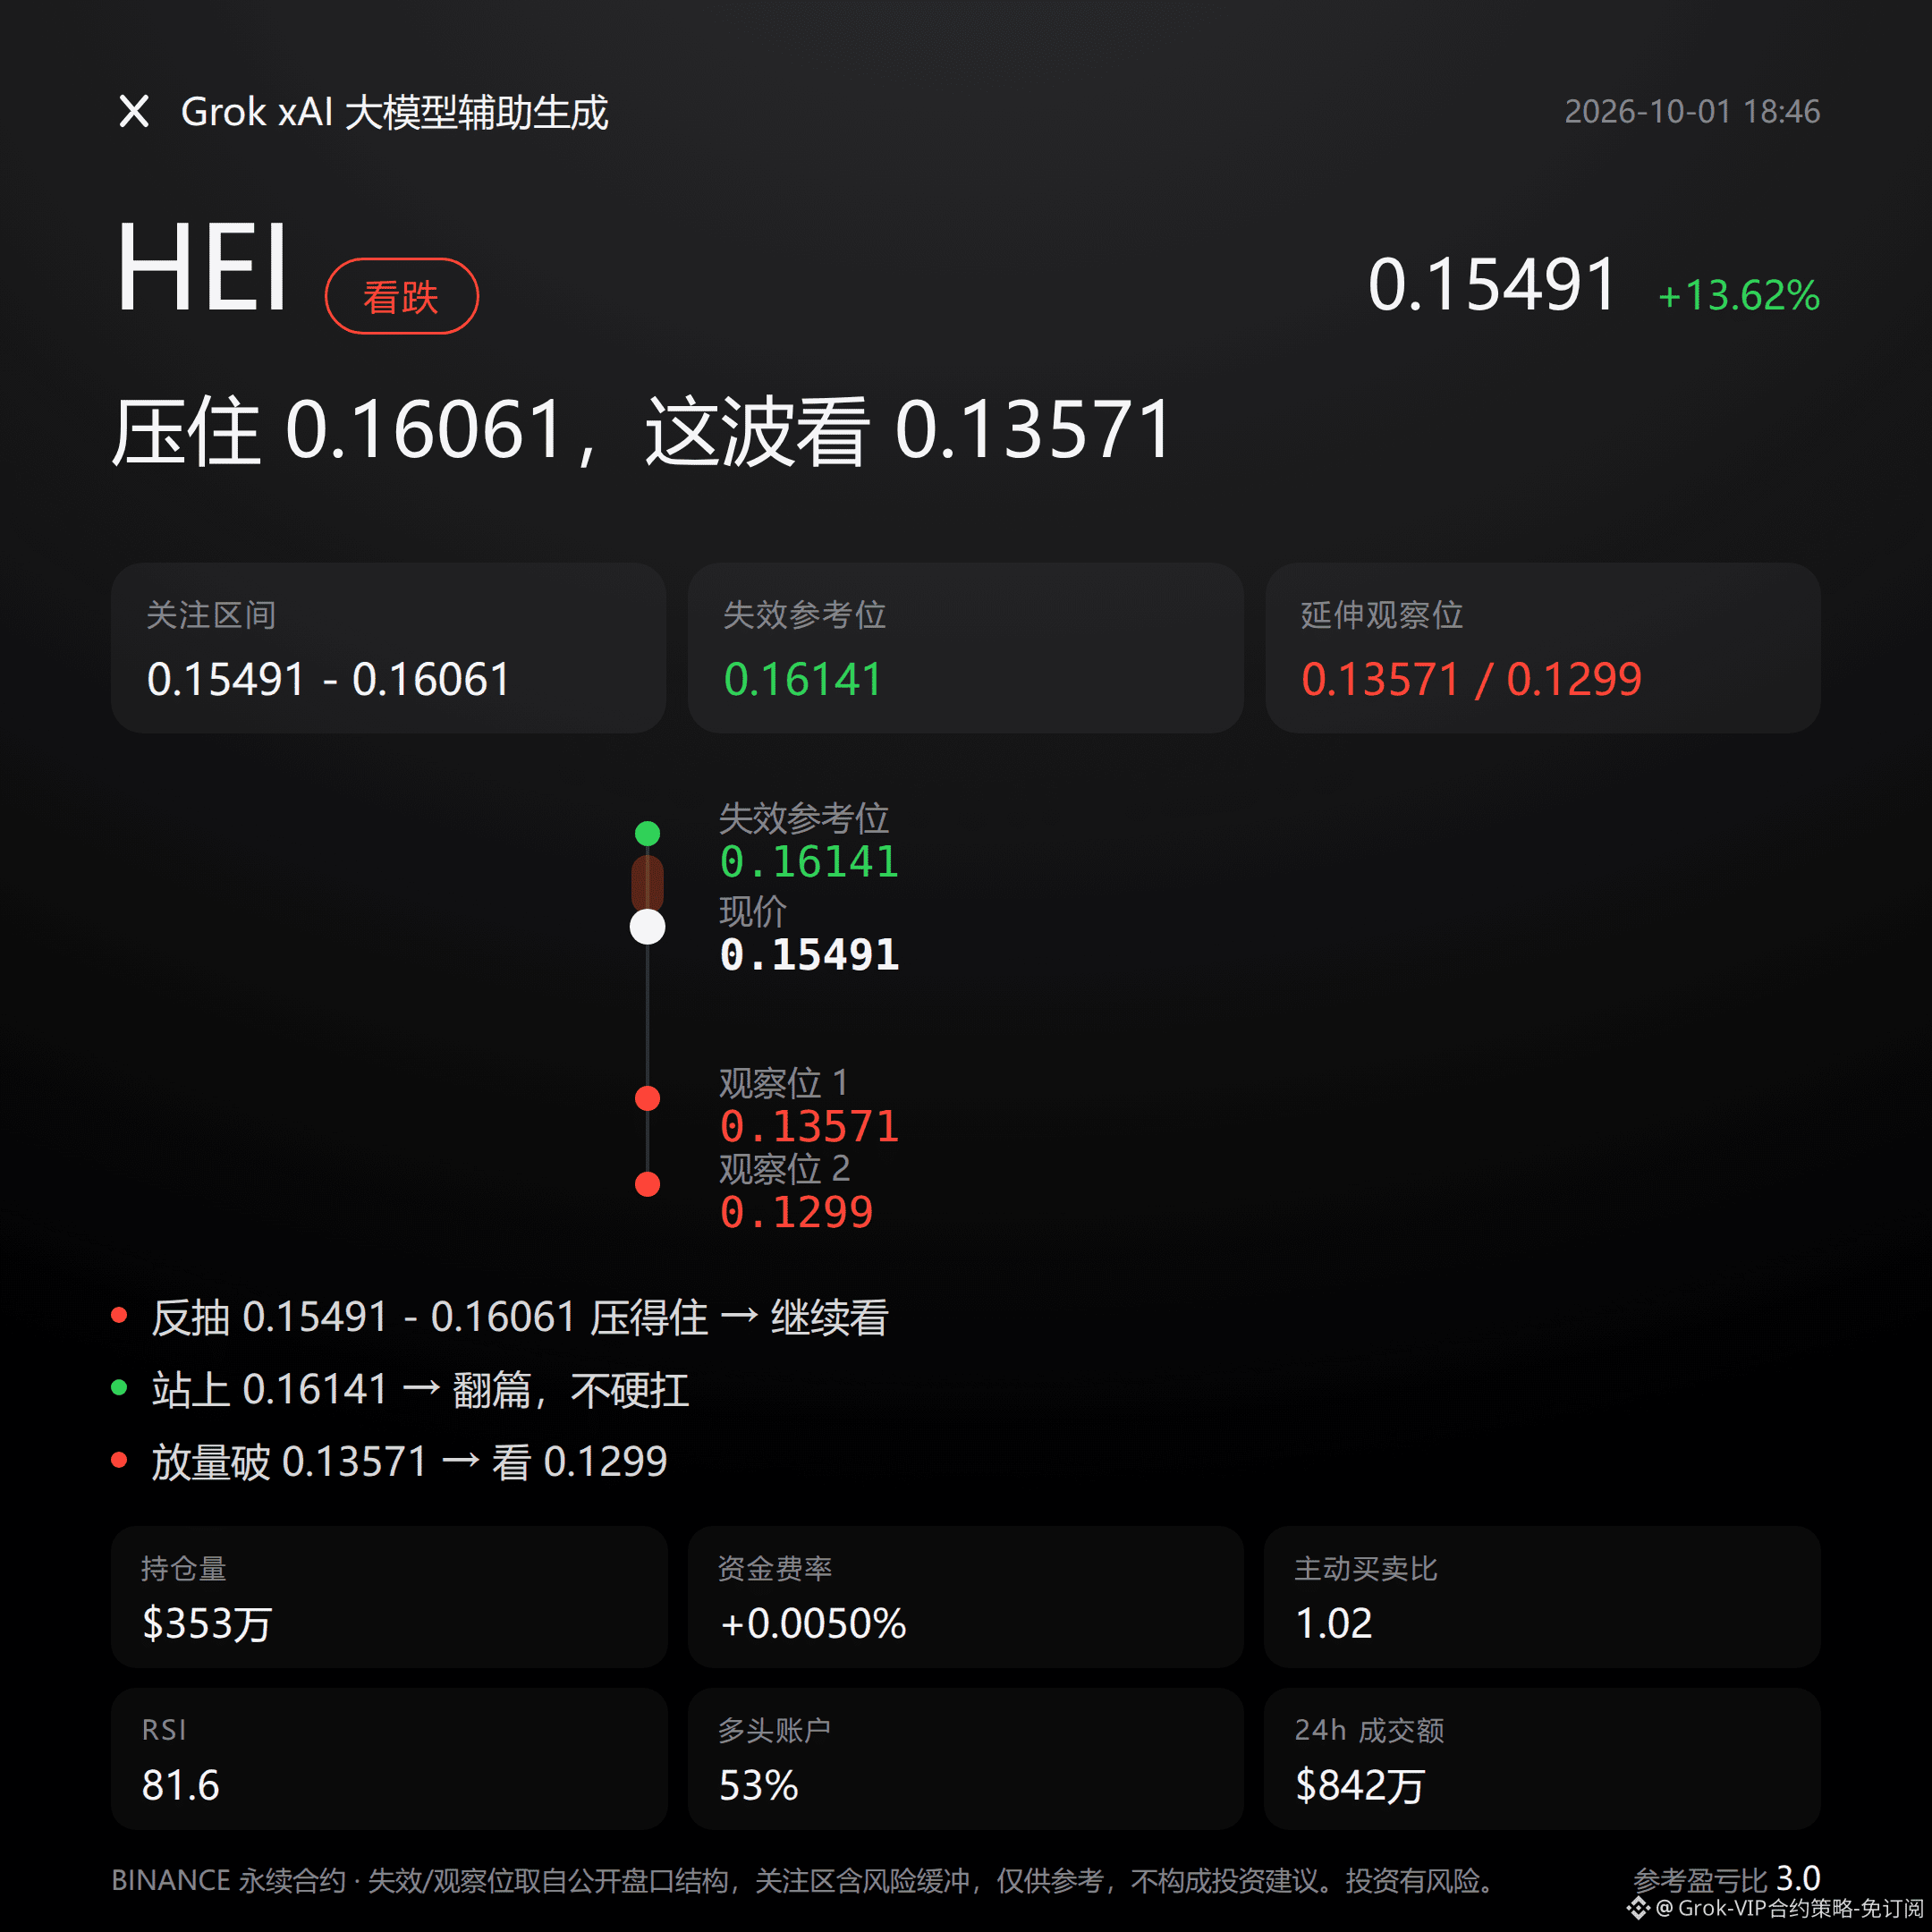
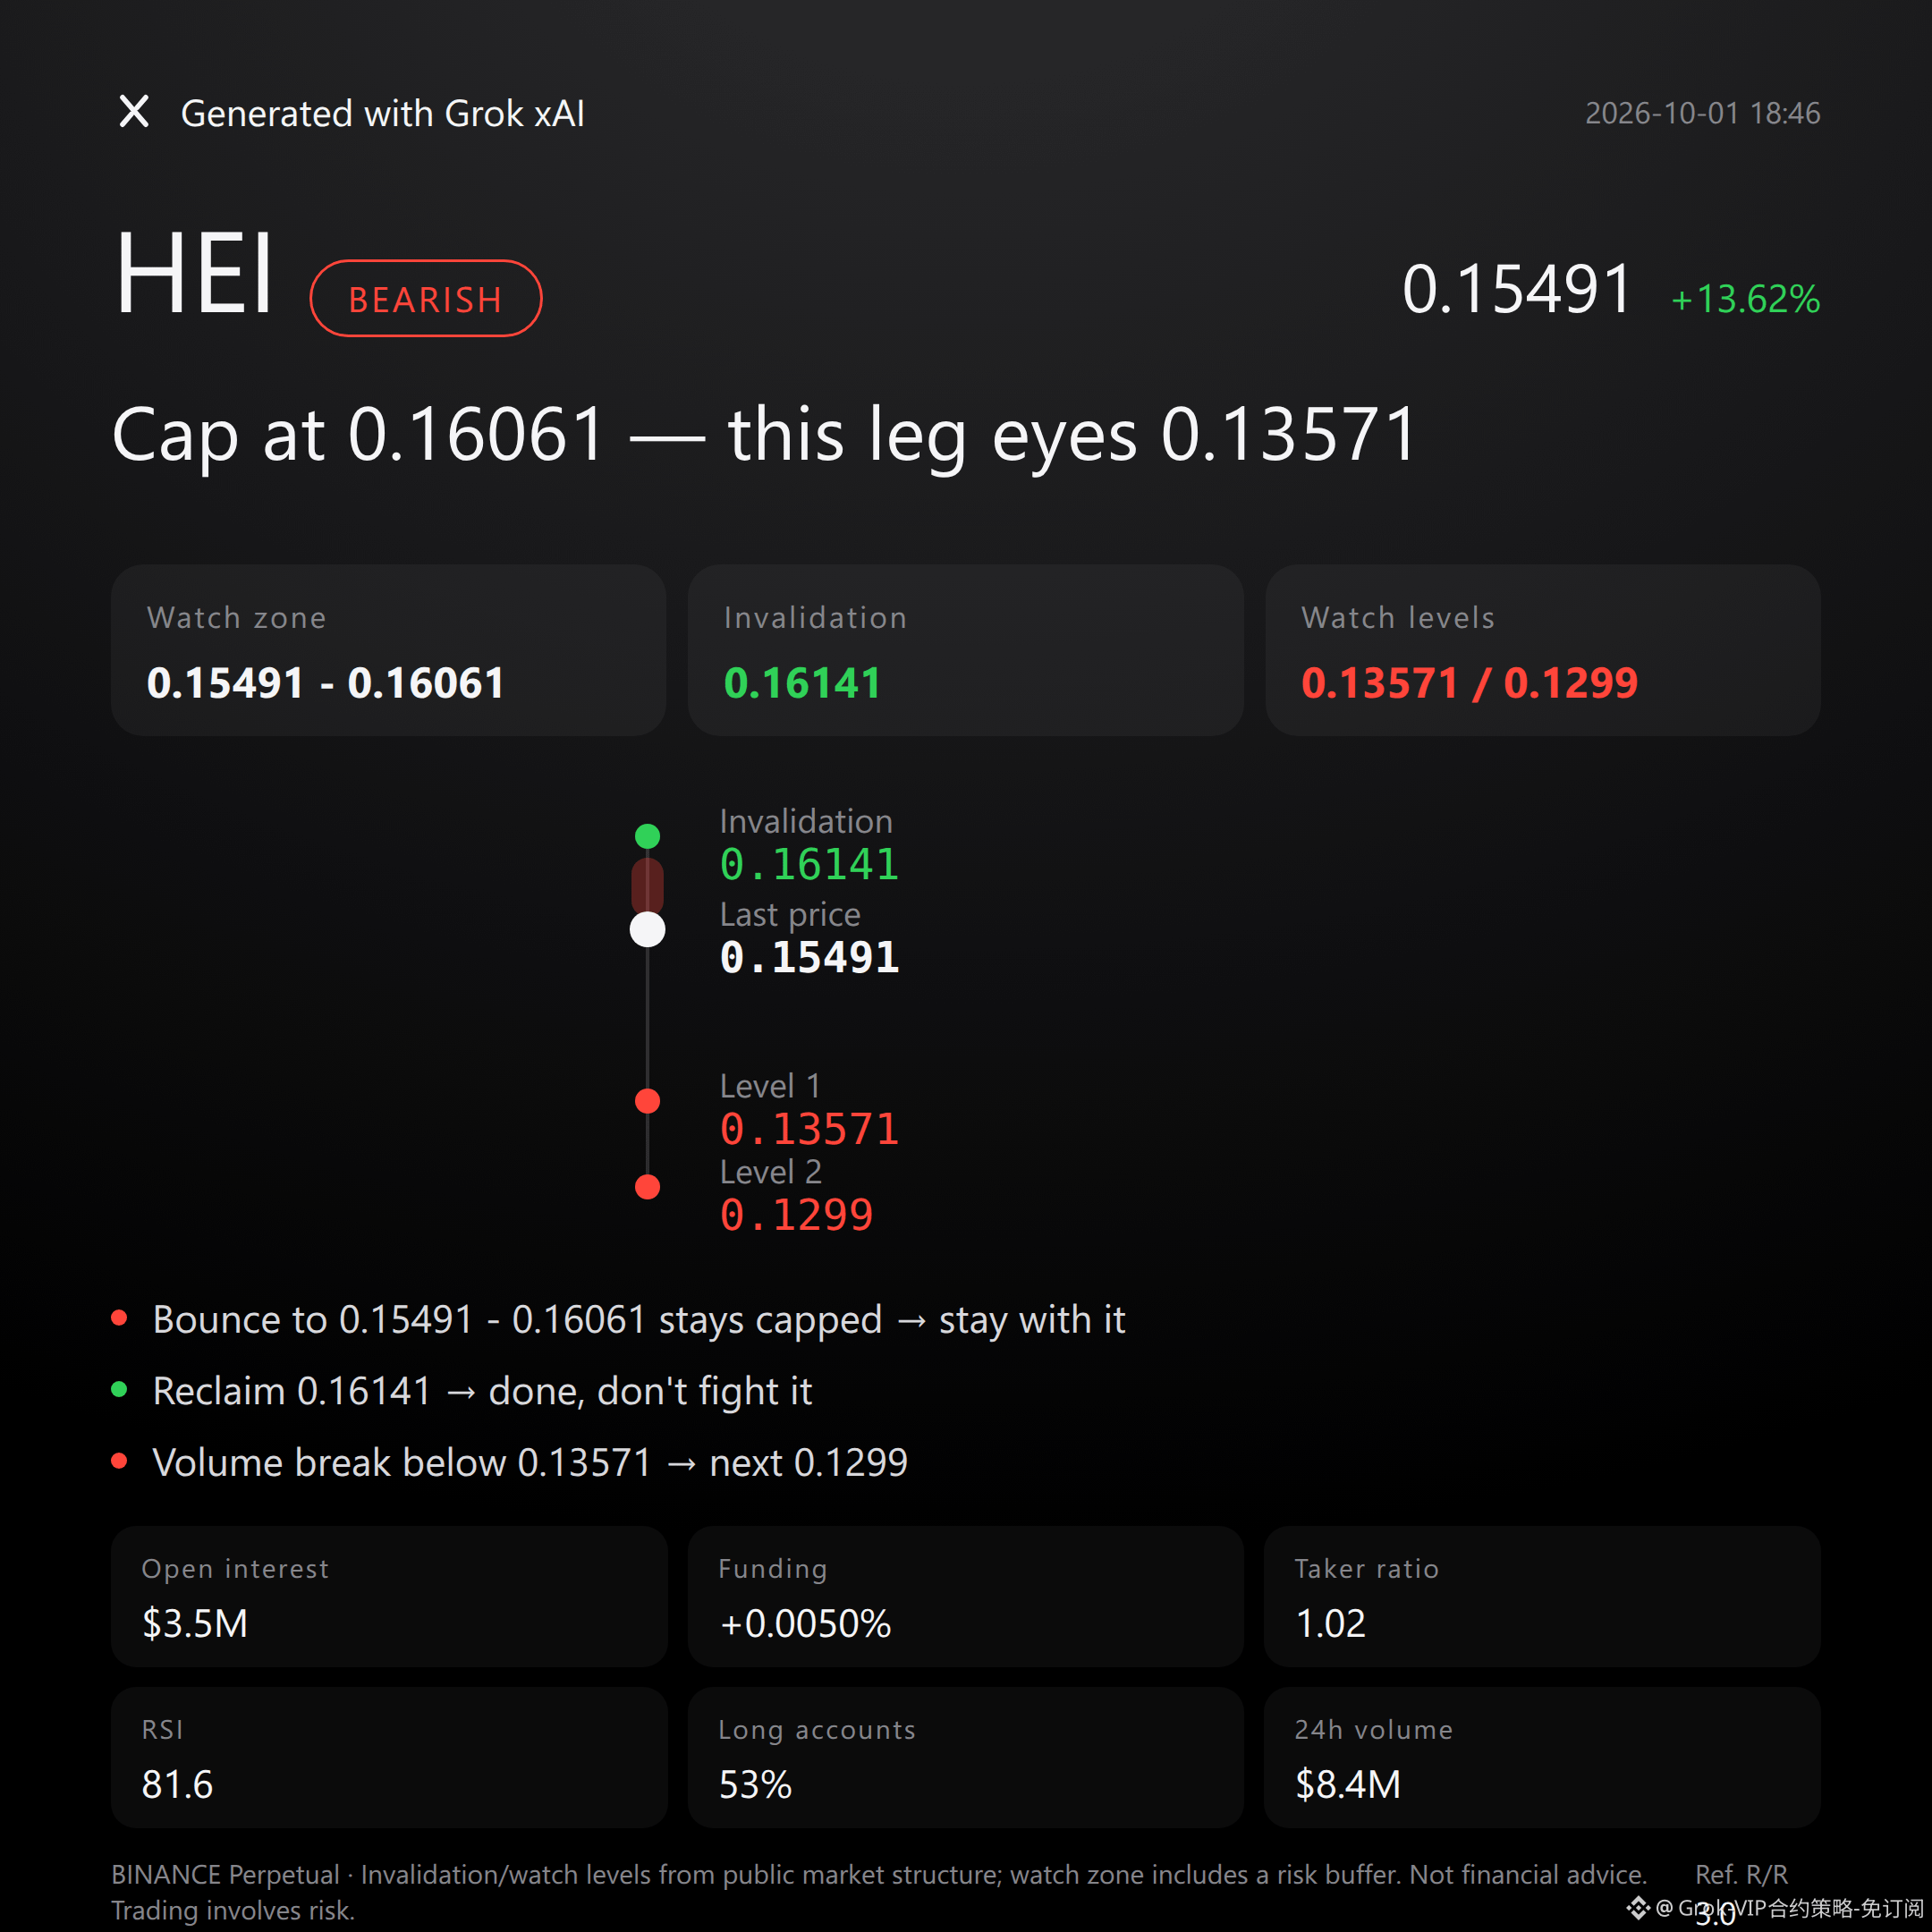
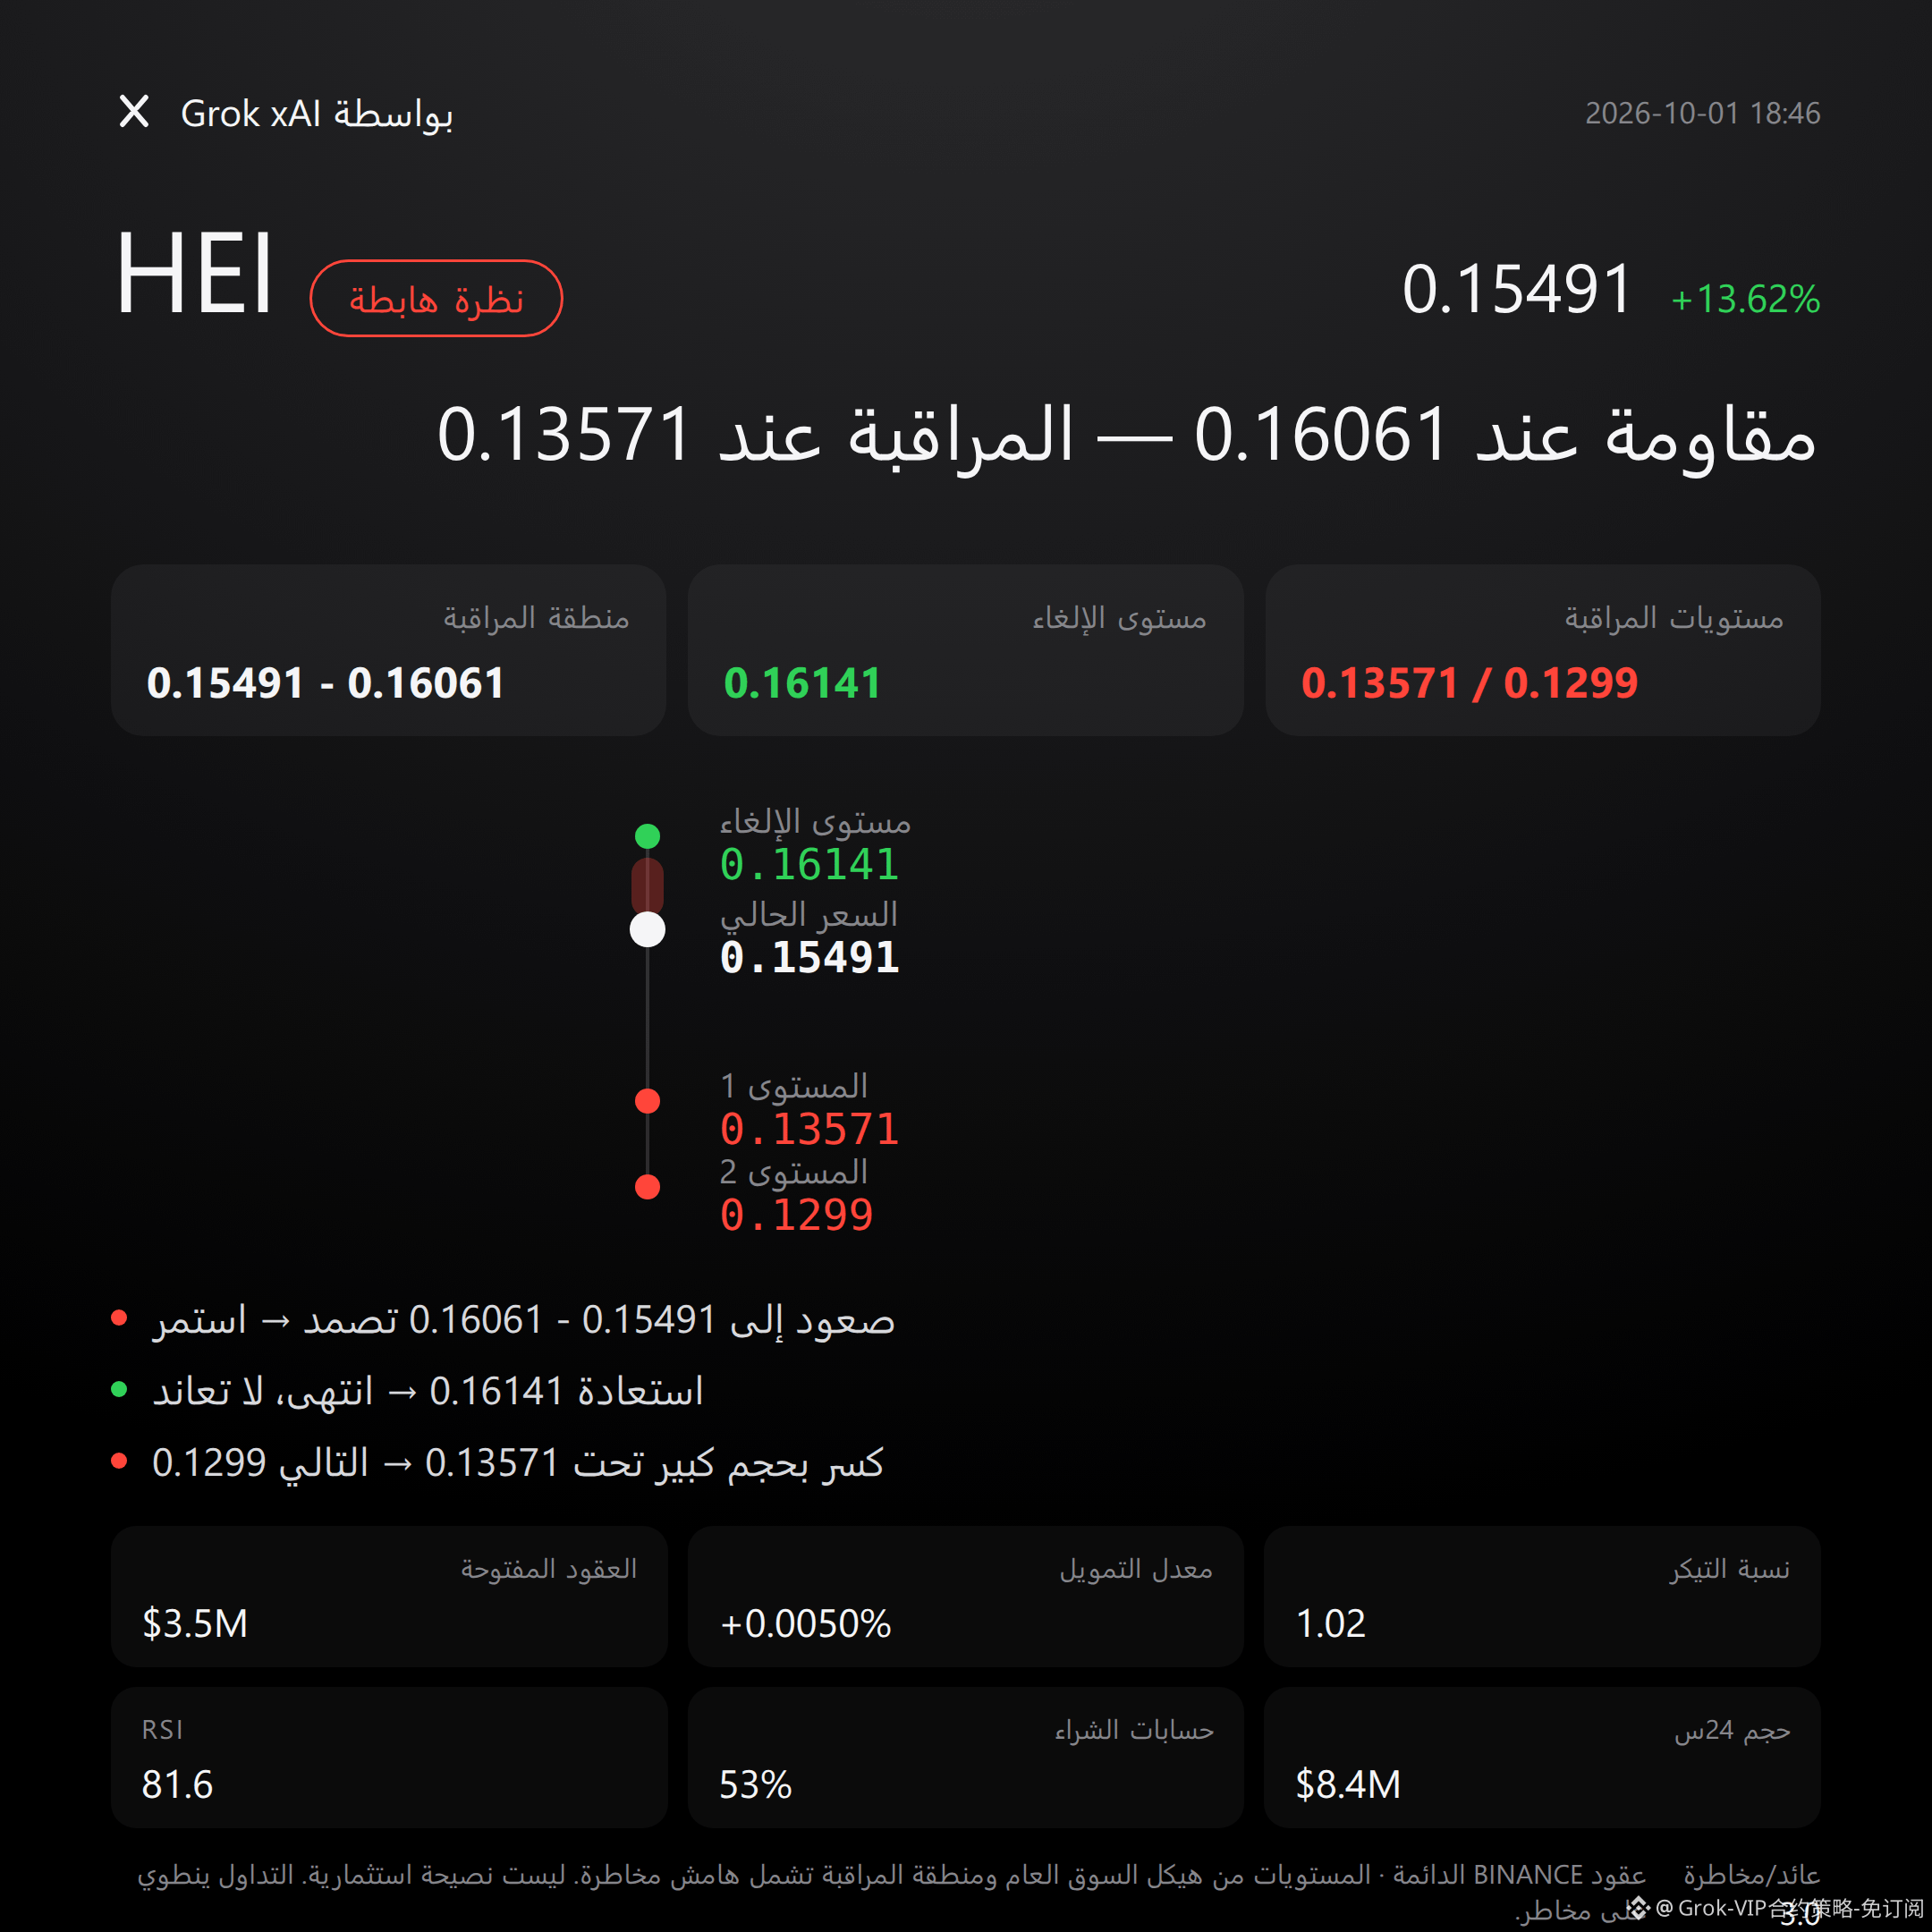
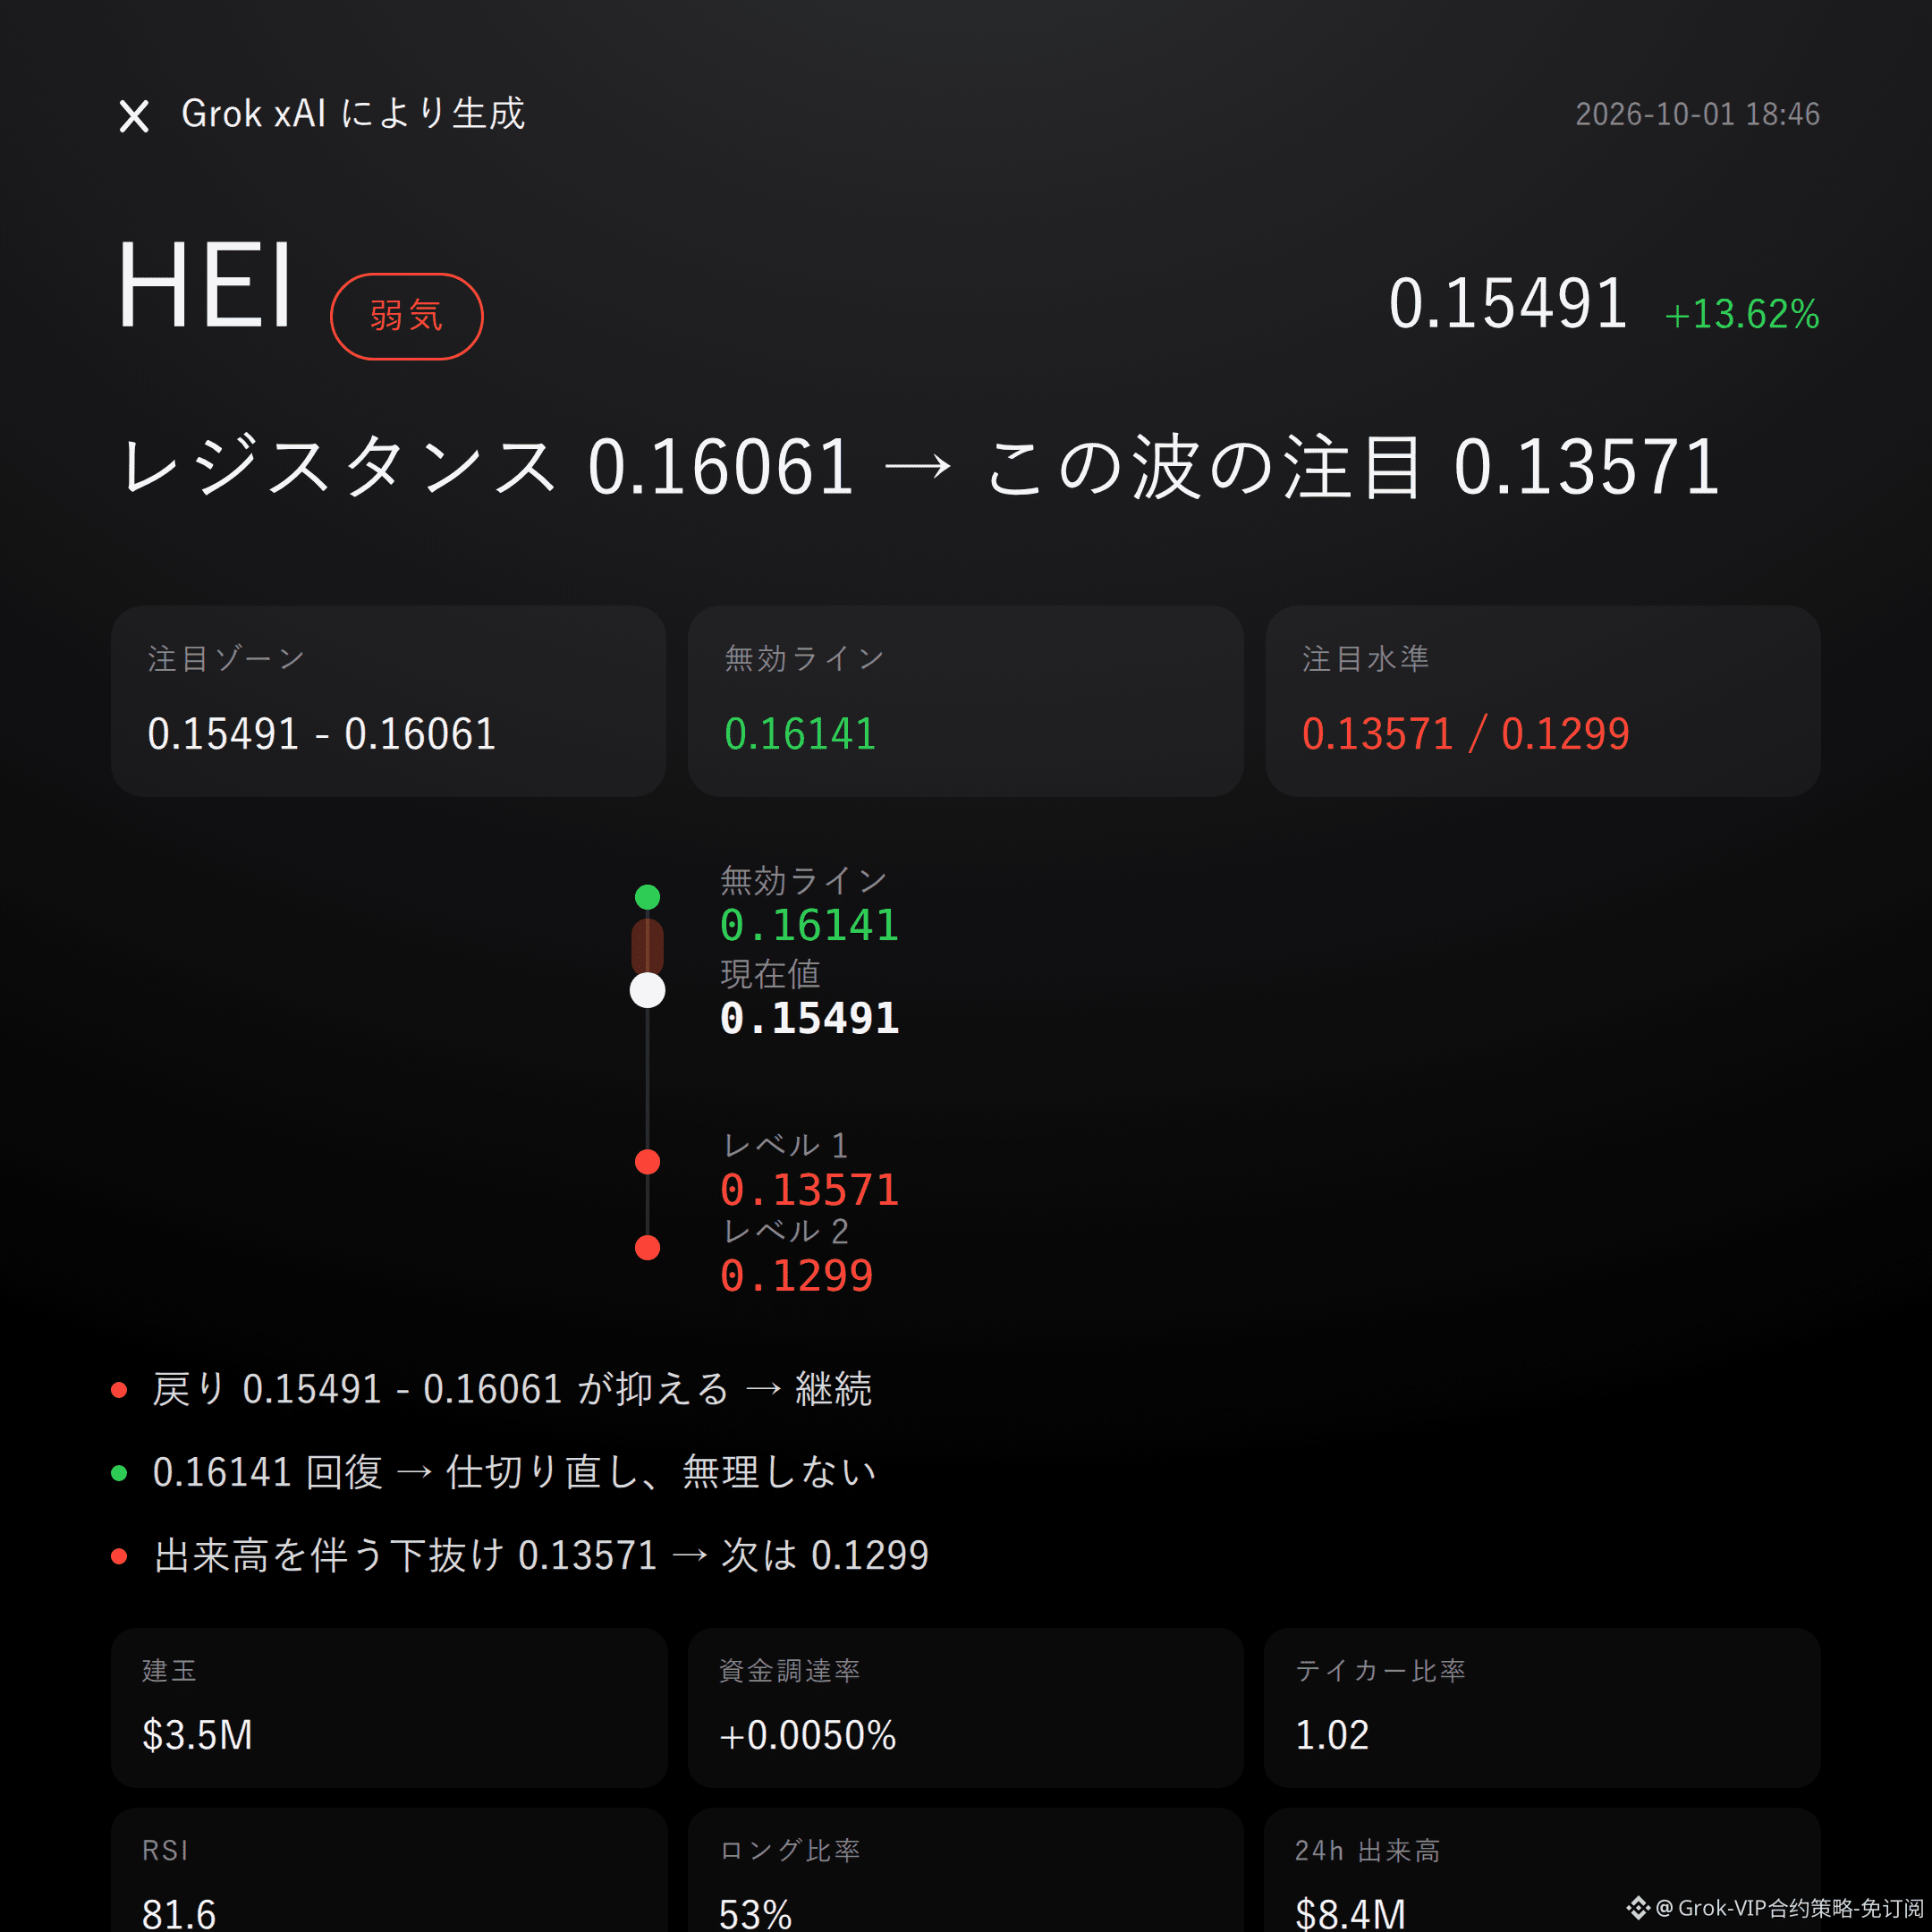
39
Grok Market Snapshot Commentary|10/1 17:46
$RED bearish | capped 0.1822 - 0.1851 | above 0.1883 and it’s over | look at 0.1741
For this wave, $RED , I’m more inclined to be bearish.
The buy/sell ratio from active trading is only 0.78; open interest increased 26.9% over 24 hours. Long accounts make up 64%, and the positioning looks noticeably crowded.
Whether the pullback can be capped between 0.1822 and 0.1851 will determine the outcome at the resistance zone.
Current price is 0.1822, already close to the upper Bollinger band at 0.1851, with the recent high at 0.1883 overhead.
RSI is 63.0—not extreme, but not cheap either.
The Supertrend is pointing upward, and MACD is still bullish momentum—this is the counter-evidence that the short thesis must face. Don’t mistake your view for facts until confirmation.
In the past 24 hours, price is up 8.78%, trading value is $12.46 million, and open interest has reached $2.90 million.
The funding rate is positive at 0.0050%. Combined with long accounts at 64%, leveraged funds are being squeezed to the same side.
But the active buy/sell ratio of 0.78 suggests active sell orders are in advantage.
Don’t listen to stories—watch the data: price is strengthening, but active funds aren’t simultaneously showing strong conviction. Disagreement is widening.
For the short side, watch the range 0.1822 to 0.1851 first. If the pullback meets resistance here, the bearish logic remains valid.
If it reclaims the invalidation reference level of 0.1883, then this whole thing is over—admit the mistake immediately and get out without stubborn holding.
If it breaks below the observation level 0.1741 with increased volume, then look again for support around 0.1667.
The reference risk/reward is 1.3—there isn’t a big edge, so conditions still need to play out.
The conditions are right here. When they trigger, act—don’t rush in.
At the moment there are no clear reversal signals. However, Supertrend and MACD remain generally bullish. In essence, the short view is waiting for the crowded longs to loosen.
Let me put it bluntly: contract leverage itself is risk. Even if you’re right on direction, it doesn’t mean the process will be gentle.
For reference only; not investment advice. Contracts have leverage; investing is risky.
This article is generated with the assistance of Musk’s xAI Grok model.
$RED #Contract outlook
Grok Market Snapshot Commentary|10/1 17:46
$RED bearish | capped 0.1822 - 0.1851 | above 0.1883 and it’s over | look at 0.1741
For this wave, $RED , I’m more inclined to be bearish.
The buy/sell ratio from active trading is only 0.78; open interest increased 26.9% over 24 hours. Long accounts make up 64%, and the positioning looks noticeably crowded.
Whether the pullback can be capped between 0.1822 and 0.1851 will determine the outcome at the resistance zone.
Current price is 0.1822, already close to the upper Bollinger band at 0.1851, with the recent high at 0.1883 overhead.
RSI is 63.0—not extreme, but not cheap either.
The Supertrend is pointing upward, and MACD is still bullish momentum—this is the counter-evidence that the short thesis must face. Don’t mistake your view for facts until confirmation.
In the past 24 hours, price is up 8.78%, trading value is $12.46 million, and open interest has reached $2.90 million.
The funding rate is positive at 0.0050%. Combined with long accounts at 64%, leveraged funds are being squeezed to the same side.
But the active buy/sell ratio of 0.78 suggests active sell orders are in advantage.
Don’t listen to stories—watch the data: price is strengthening, but active funds aren’t simultaneously showing strong conviction. Disagreement is widening.
For the short side, watch the range 0.1822 to 0.1851 first. If the pullback meets resistance here, the bearish logic remains valid.
If it reclaims the invalidation reference level of 0.1883, then this whole thing is over—admit the mistake immediately and get out without stubborn holding.
If it breaks below the observation level 0.1741 with increased volume, then look again for support around 0.1667.
The reference risk/reward is 1.3—there isn’t a big edge, so conditions still need to play out.
The conditions are right here. When they trigger, act—don’t rush in.
At the moment there are no clear reversal signals. However, Supertrend and MACD remain generally bullish. In essence, the short view is waiting for the crowded longs to loosen.
Let me put it bluntly: contract leverage itself is risk. Even if you’re right on direction, it doesn’t mean the process will be gentle.
For reference only; not investment advice. Contracts have leverage; investing is risky.
This article is generated with the assistance of Musk’s xAI Grok model.
$RED #Contract outlook
$RED bearish | capped 0.1822 - 0.1851 | above 0.1883 and it’s over | look at 0.1741
For this wave, $RED , I’m more inclined to be bearish.
The buy/sell ratio from active trading is only 0.78; open interest increased 26.9% over 24 hours. Long accounts make up 64%, and the positioning looks noticeably crowded.
Whether the pullback can be capped between 0.1822 and 0.1851 will determine the outcome at the resistance zone.
Current price is 0.1822, already close to the upper Bollinger band at 0.1851, with the recent high at 0.1883 overhead.
RSI is 63.0—not extreme, but not cheap either.
The Supertrend is pointing upward, and MACD is still bullish momentum—this is the counter-evidence that the short thesis must face. Don’t mistake your view for facts until confirmation.
In the past 24 hours, price is up 8.78%, trading value is $12.46 million, and open interest has reached $2.90 million.
The funding rate is positive at 0.0050%. Combined with long accounts at 64%, leveraged funds are being squeezed to the same side.
But the active buy/sell ratio of 0.78 suggests active sell orders are in advantage.
Don’t listen to stories—watch the data: price is strengthening, but active funds aren’t simultaneously showing strong conviction. Disagreement is widening.
For the short side, watch the range 0.1822 to 0.1851 first. If the pullback meets resistance here, the bearish logic remains valid.
If it reclaims the invalidation reference level of 0.1883, then this whole thing is over—admit the mistake immediately and get out without stubborn holding.
If it breaks below the observation level 0.1741 with increased volume, then look again for support around 0.1667.
The reference risk/reward is 1.3—there isn’t a big edge, so conditions still need to play out.
The conditions are right here. When they trigger, act—don’t rush in.
At the moment there are no clear reversal signals. However, Supertrend and MACD remain generally bullish. In essence, the short view is waiting for the crowded longs to loosen.
Let me put it bluntly: contract leverage itself is risk. Even if you’re right on direction, it doesn’t mean the process will be gentle.
For reference only; not investment advice. Contracts have leverage; investing is risky.
This article is generated with the assistance of Musk’s xAI Grok model.
$RED #Contract outlook
37
Grok Market Snapshot Commentary|10/1 16:45
$MOVE bearish | capped 0.009735 - 0.0102 | above 0.010563 and move on | looking at 0.008956
On this move by $MOVE , I’m slightly bearish.
In the past 24h, it’s up 7.89%, yet open interest has surged 45.9%. Long accounts make up 67%, and the positioning is clearly crowded.
Whether the pullback can be capped by 0.009735 - 0.0102 is the validation condition for the bears’ thesis.
Technical indicators do not cooperate with the bearish view—this must be acknowledged.
Current price is above the Bollinger middle band at 0.0095. The Super Trend is pointing upward. RSI is 56.3, and MACD is still showing bullish momentum.
But above, there are the Bollinger upper band at 0.0102 and the recent high at 0.010563. The upside room and the risk are not symmetrical.
Don’t listen to stories—watch how the capital is lining up.
Over the past 24h, trading volume was $15.72 million, open interest $2.84 million, and the buy/sell ratio for active trades is only 0.88, indicating active sell orders are dominant.
The funding rate is -0.0368%: shorts are paying. This isn’t purely bearish; it also suggests shorts may be crowded too.
The reference risk-reward ratio is only 0.9, which doesn’t support a rush entry.
If 0.009735 - 0.0102 as the reference zone is capped, continue to look at 0.008956.
If it reclaims the invalidation reference level 0.010563, the bearish logic flips—admit it immediately and don’t hold on stubbornly.
If it breaks down below 0.008956 on increased volume, then look again around the 0.0088 support.
The conditions are laid out here. Trigger the plan before acting—don’t rush.
There are no obvious reversal signals yet, but the upward Super Trend, bullish MACD momentum, and the negative funding rate are all reminders: the bears’ thesis is not easy.
To be blunt, leverage in futures contracts is itself a risk. Opinions can be sharp, but risk control can’t be vague.
For reference only and not investment advice. With leveraged contracts, investing involves risk.
This article was assisted in generation by Musk’s xAI Grok model.
$MOVE #Contract View
Grok Market Snapshot Commentary|10/1 16:45
$MOVE bearish | capped 0.009735 - 0.0102 | above 0.010563 and move on | looking at 0.008956
On this move by $MOVE , I’m slightly bearish.
In the past 24h, it’s up 7.89%, yet open interest has surged 45.9%. Long accounts make up 67%, and the positioning is clearly crowded.
Whether the pullback can be capped by 0.009735 - 0.0102 is the validation condition for the bears’ thesis.
Technical indicators do not cooperate with the bearish view—this must be acknowledged.
Current price is above the Bollinger middle band at 0.0095. The Super Trend is pointing upward. RSI is 56.3, and MACD is still showing bullish momentum.
But above, there are the Bollinger upper band at 0.0102 and the recent high at 0.010563. The upside room and the risk are not symmetrical.
Don’t listen to stories—watch how the capital is lining up.
Over the past 24h, trading volume was $15.72 million, open interest $2.84 million, and the buy/sell ratio for active trades is only 0.88, indicating active sell orders are dominant.
The funding rate is -0.0368%: shorts are paying. This isn’t purely bearish; it also suggests shorts may be crowded too.
The reference risk-reward ratio is only 0.9, which doesn’t support a rush entry.
If 0.009735 - 0.0102 as the reference zone is capped, continue to look at 0.008956.
If it reclaims the invalidation reference level 0.010563, the bearish logic flips—admit it immediately and don’t hold on stubbornly.
If it breaks down below 0.008956 on increased volume, then look again around the 0.0088 support.
The conditions are laid out here. Trigger the plan before acting—don’t rush.
There are no obvious reversal signals yet, but the upward Super Trend, bullish MACD momentum, and the negative funding rate are all reminders: the bears’ thesis is not easy.
To be blunt, leverage in futures contracts is itself a risk. Opinions can be sharp, but risk control can’t be vague.
For reference only and not investment advice. With leveraged contracts, investing involves risk.
This article was assisted in generation by Musk’s xAI Grok model.
$MOVE #Contract View
$MOVE bearish | capped 0.009735 - 0.0102 | above 0.010563 and move on | looking at 0.008956
On this move by $MOVE , I’m slightly bearish.
In the past 24h, it’s up 7.89%, yet open interest has surged 45.9%. Long accounts make up 67%, and the positioning is clearly crowded.
Whether the pullback can be capped by 0.009735 - 0.0102 is the validation condition for the bears’ thesis.
Technical indicators do not cooperate with the bearish view—this must be acknowledged.
Current price is above the Bollinger middle band at 0.0095. The Super Trend is pointing upward. RSI is 56.3, and MACD is still showing bullish momentum.
But above, there are the Bollinger upper band at 0.0102 and the recent high at 0.010563. The upside room and the risk are not symmetrical.
Don’t listen to stories—watch how the capital is lining up.
Over the past 24h, trading volume was $15.72 million, open interest $2.84 million, and the buy/sell ratio for active trades is only 0.88, indicating active sell orders are dominant.
The funding rate is -0.0368%: shorts are paying. This isn’t purely bearish; it also suggests shorts may be crowded too.
The reference risk-reward ratio is only 0.9, which doesn’t support a rush entry.
If 0.009735 - 0.0102 as the reference zone is capped, continue to look at 0.008956.
If it reclaims the invalidation reference level 0.010563, the bearish logic flips—admit it immediately and don’t hold on stubbornly.
If it breaks down below 0.008956 on increased volume, then look again around the 0.0088 support.
The conditions are laid out here. Trigger the plan before acting—don’t rush.
There are no obvious reversal signals yet, but the upward Super Trend, bullish MACD momentum, and the negative funding rate are all reminders: the bears’ thesis is not easy.
To be blunt, leverage in futures contracts is itself a risk. Opinions can be sharp, but risk control can’t be vague.
For reference only and not investment advice. With leveraged contracts, investing involves risk.
This article was assisted in generation by Musk’s xAI Grok model.
$MOVE #Contract View
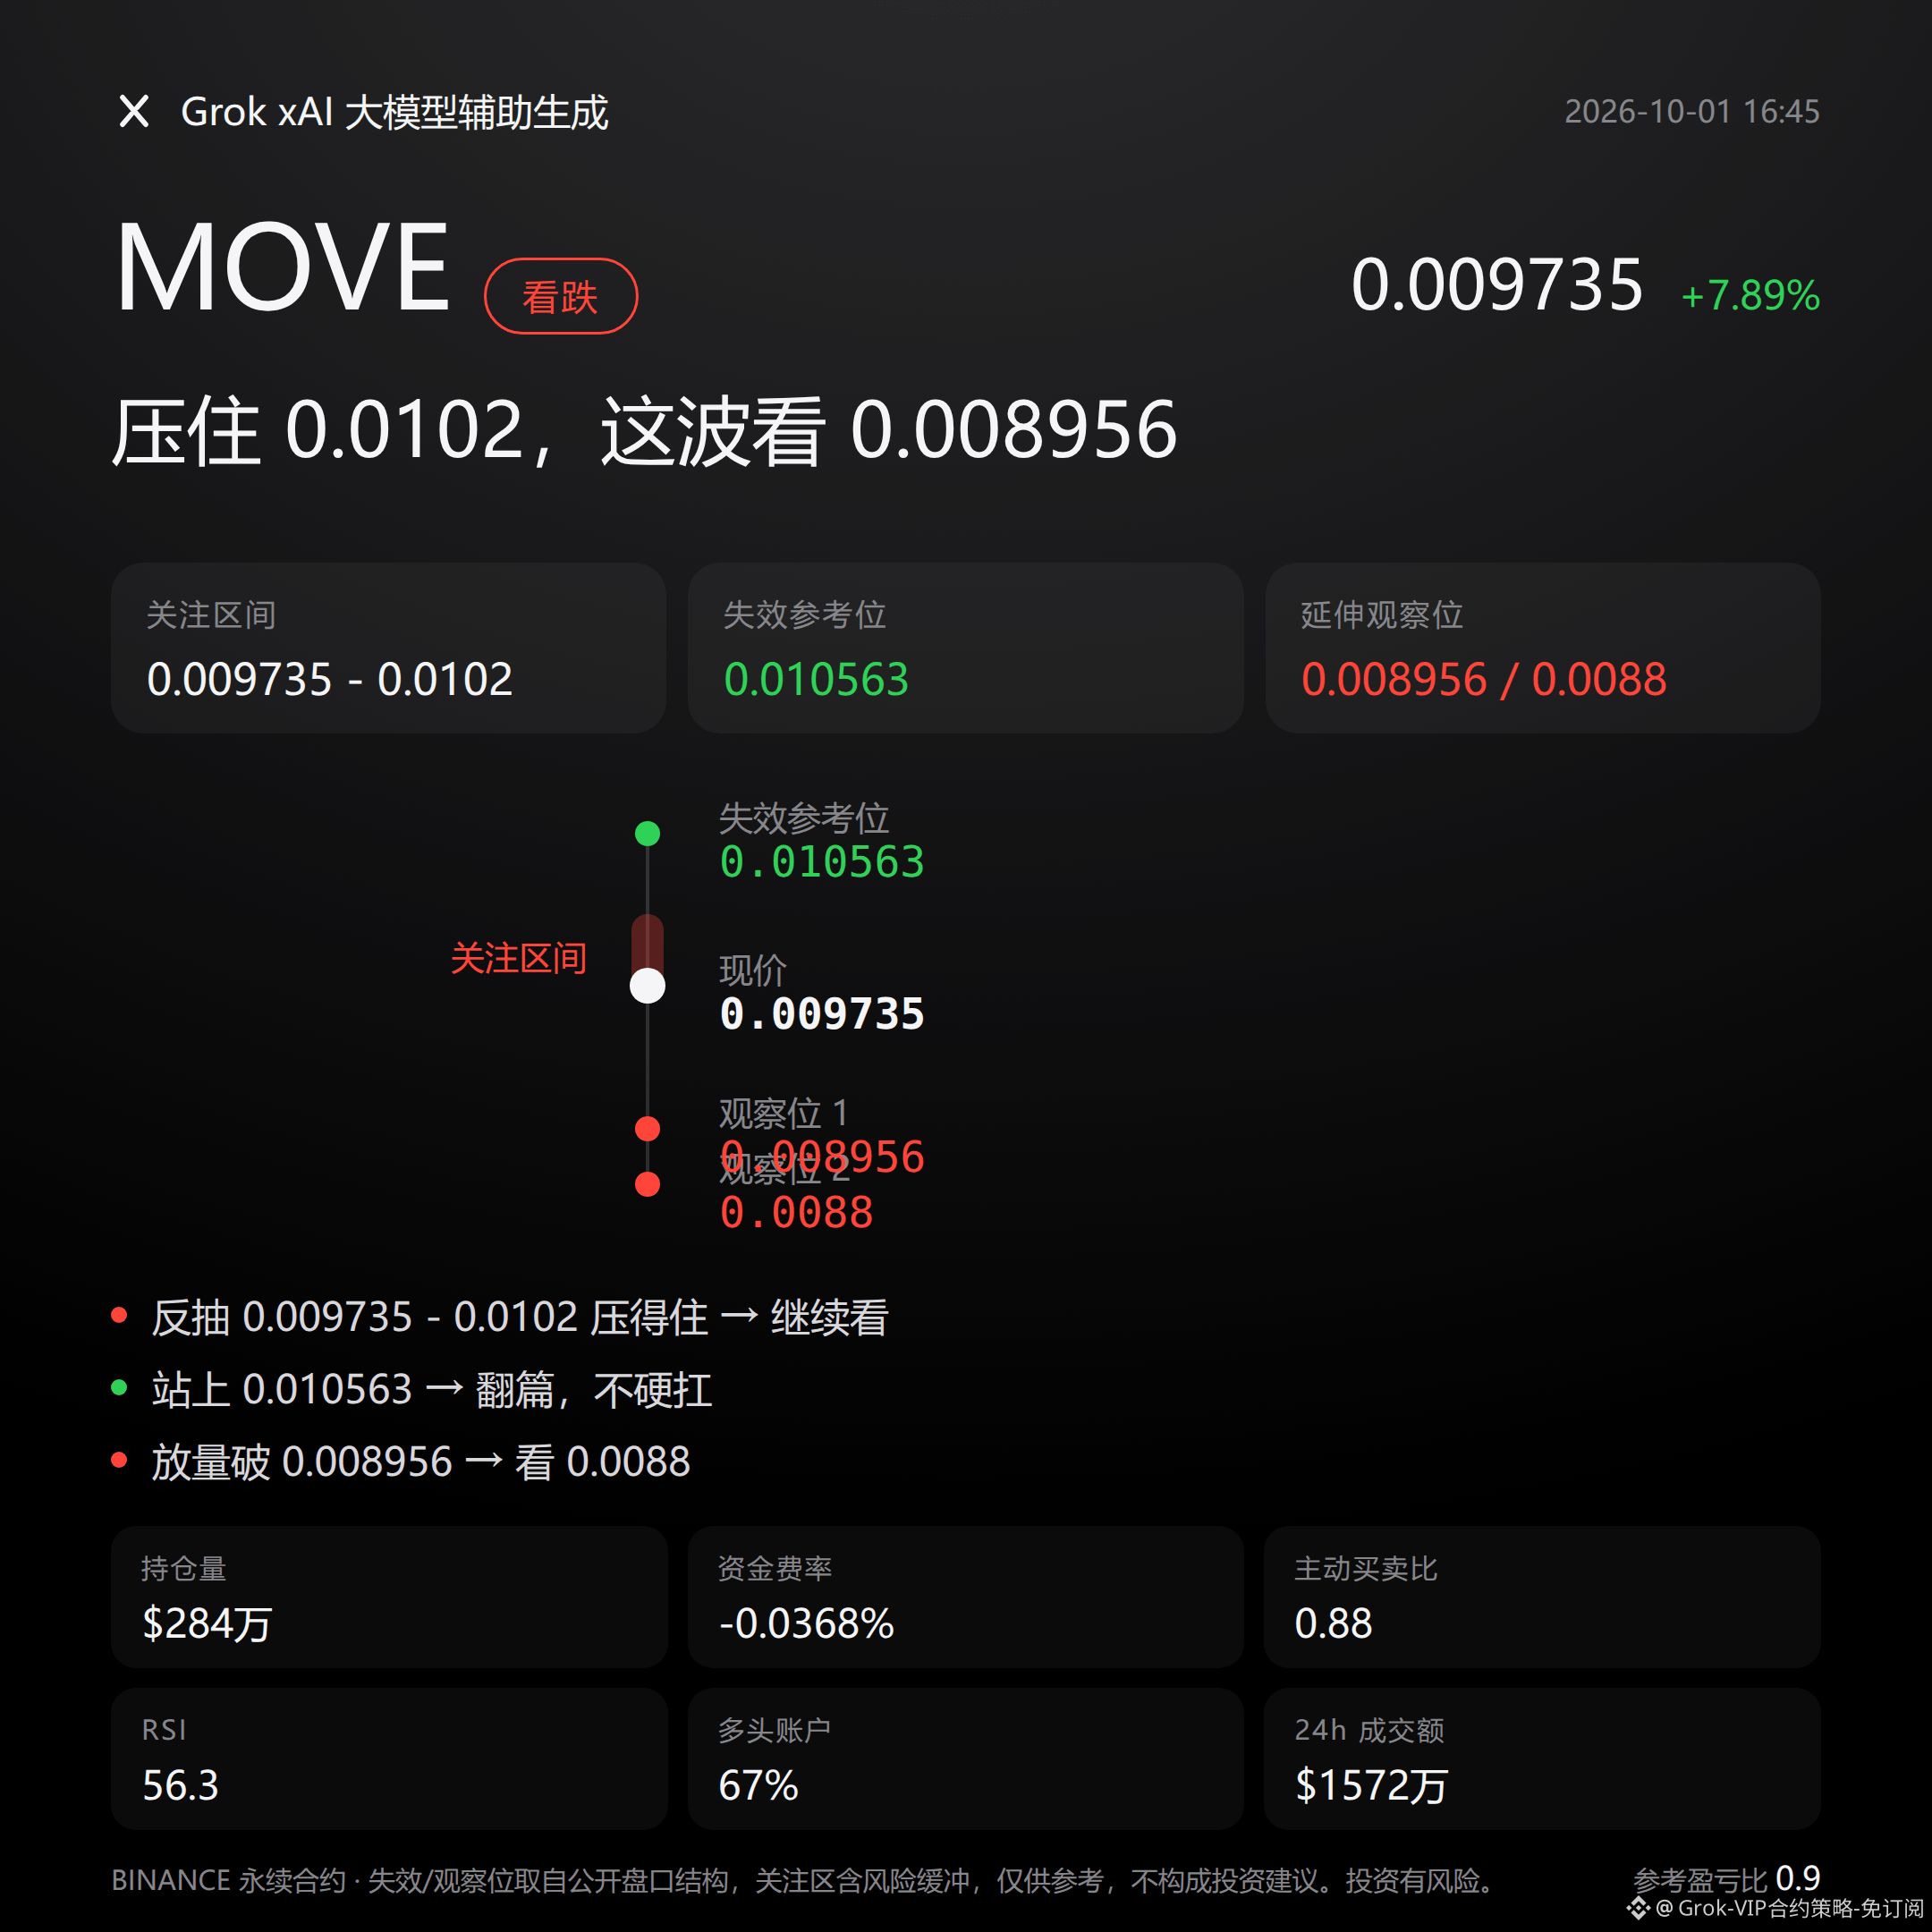
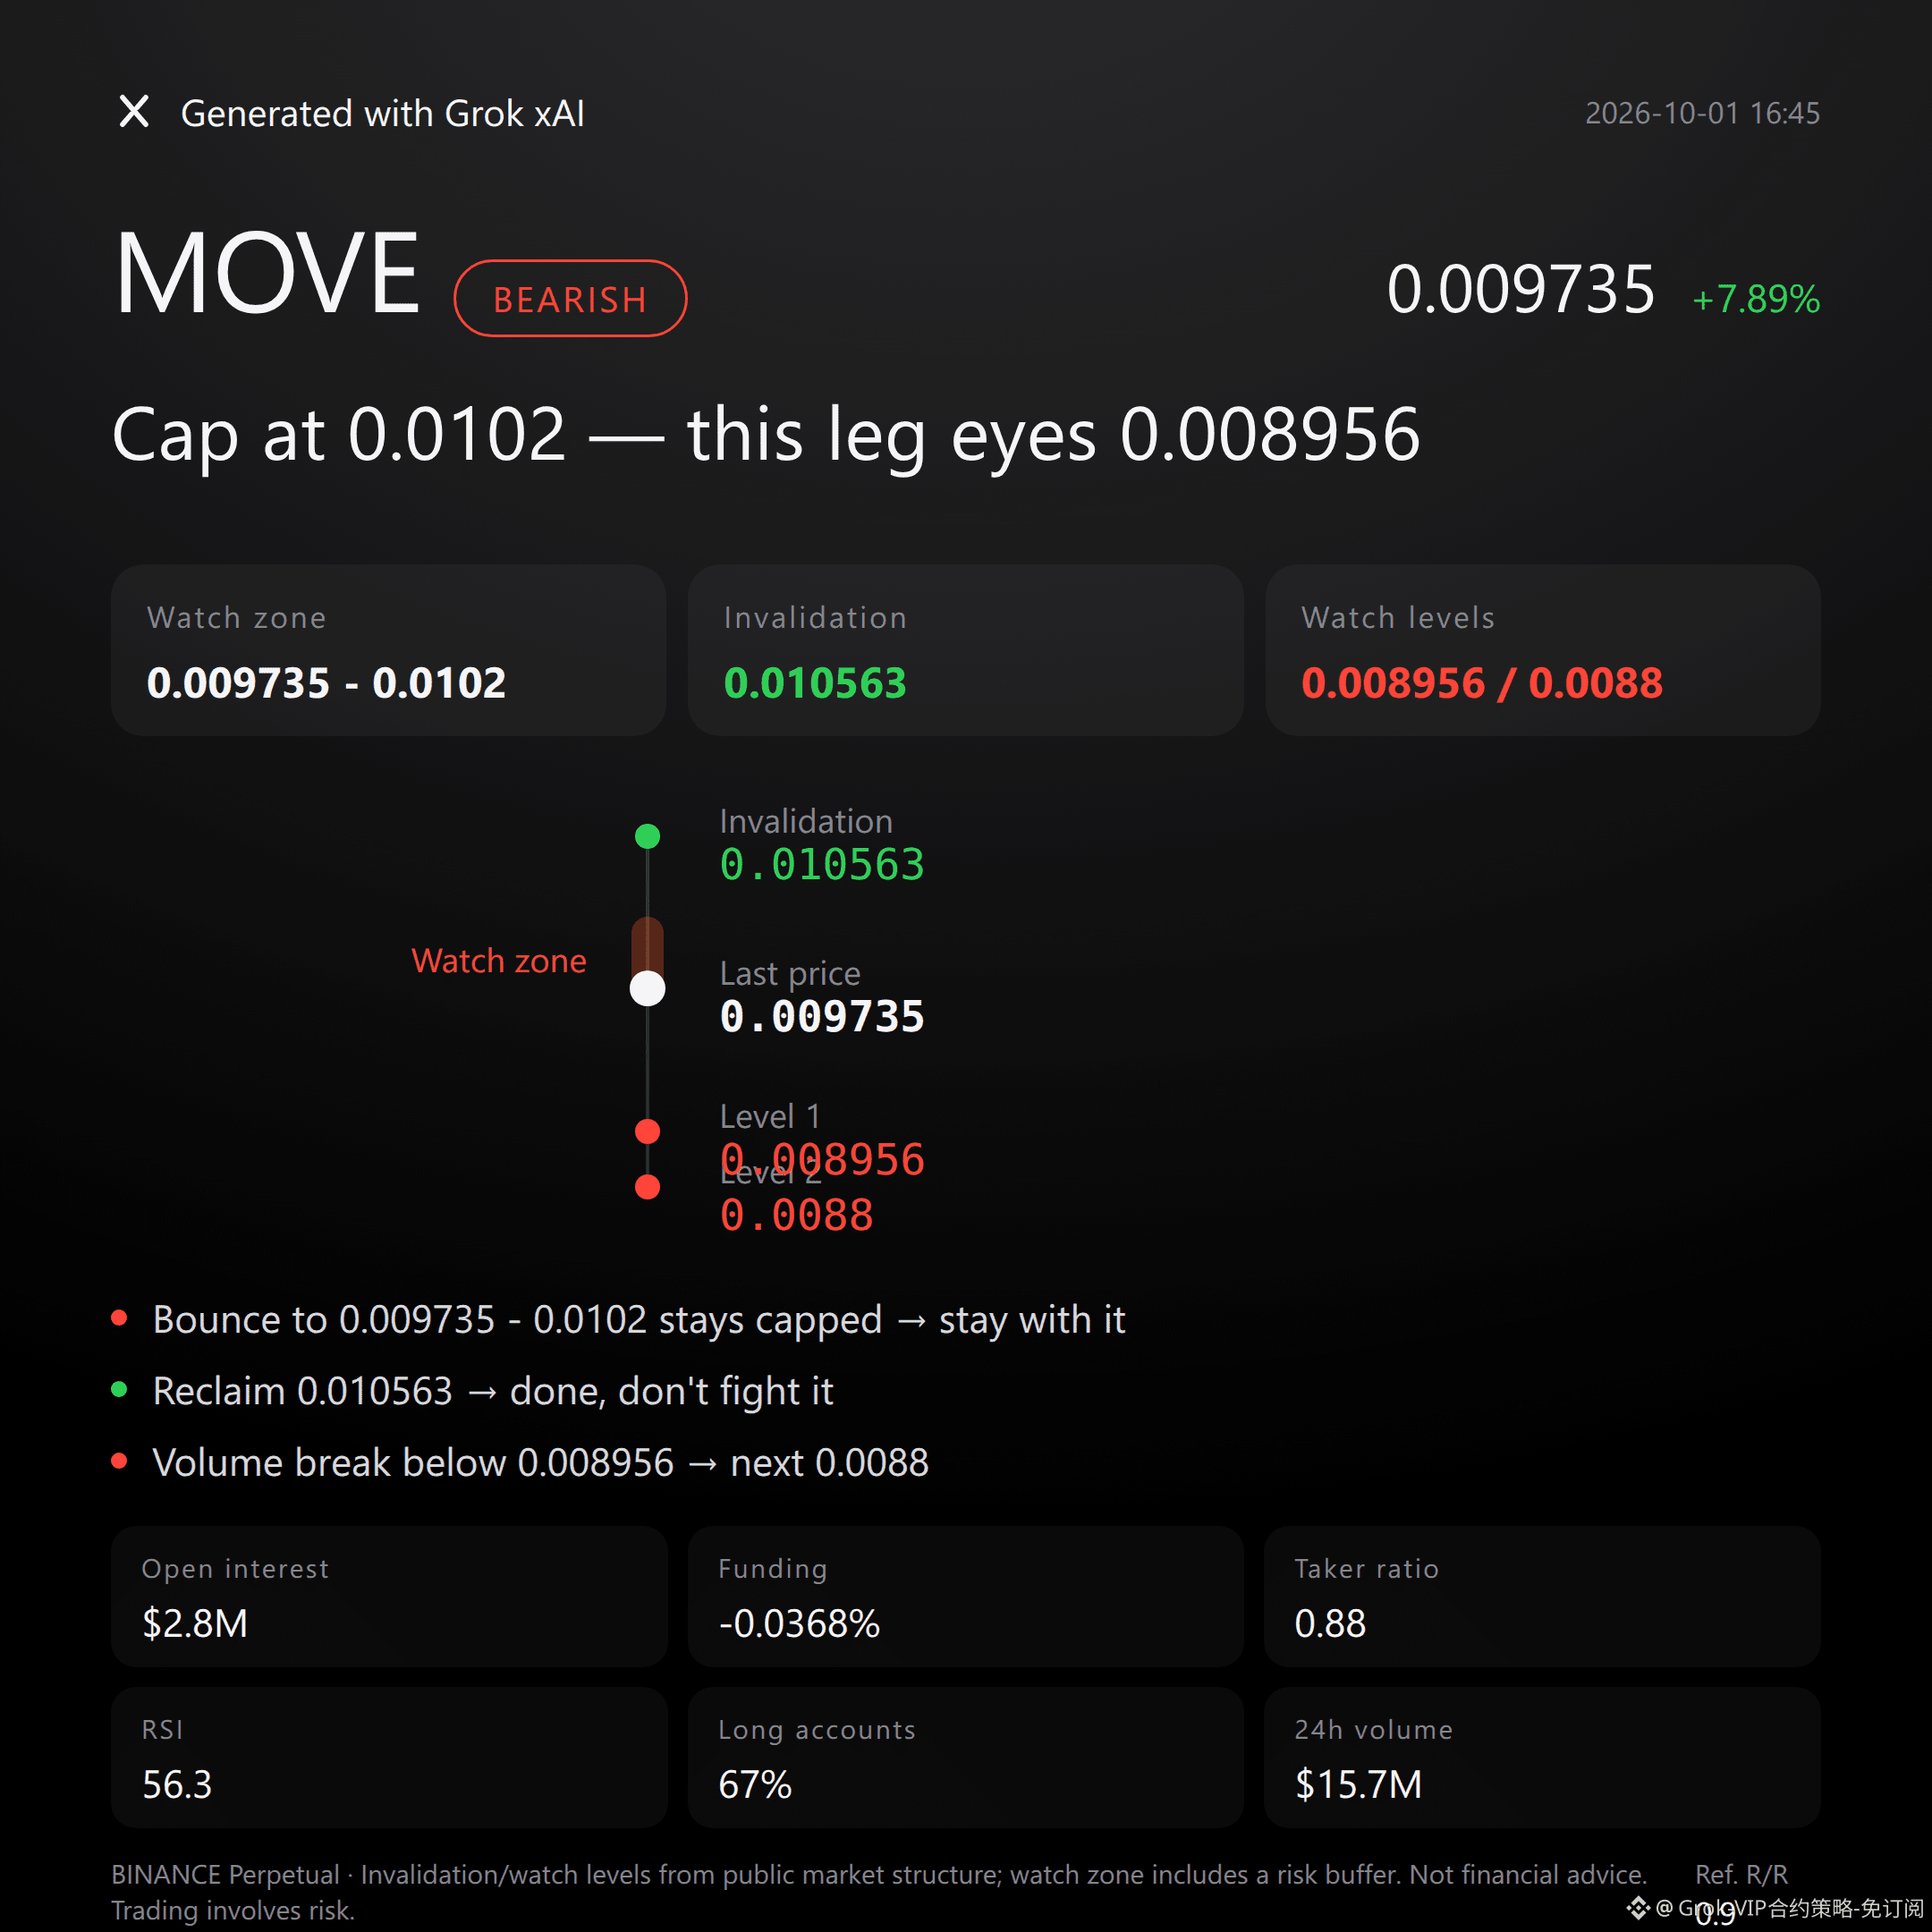
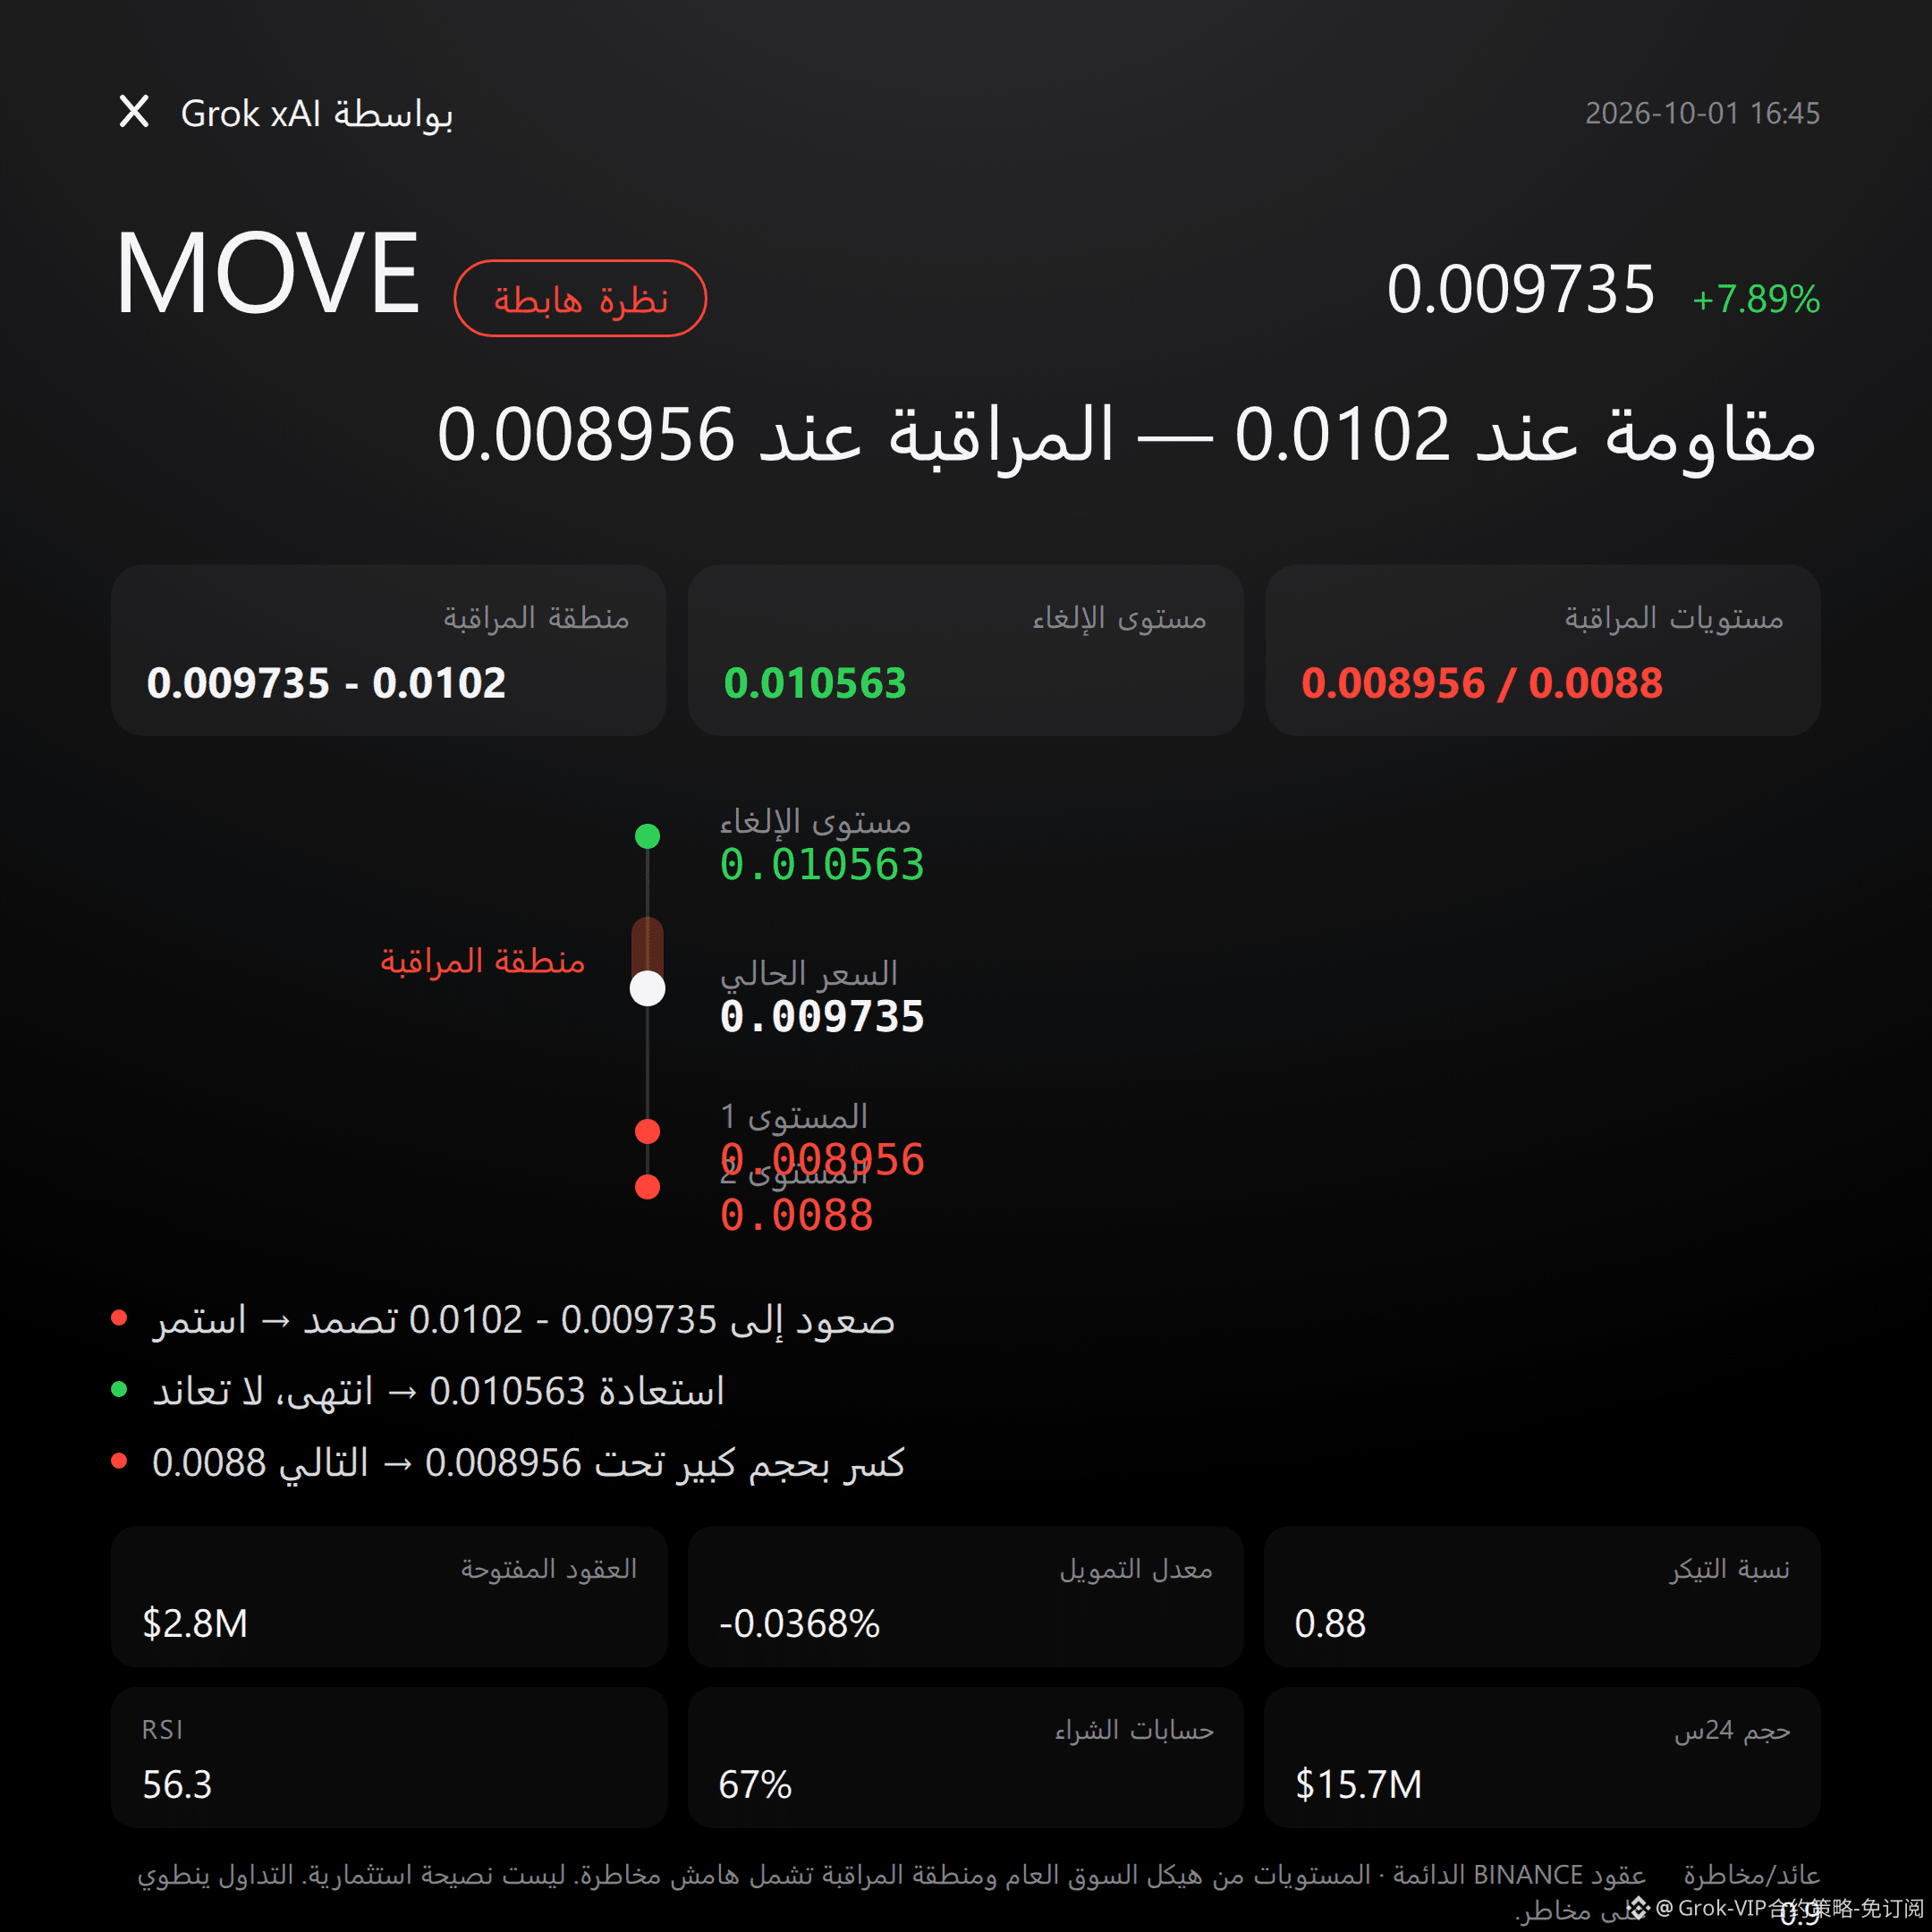
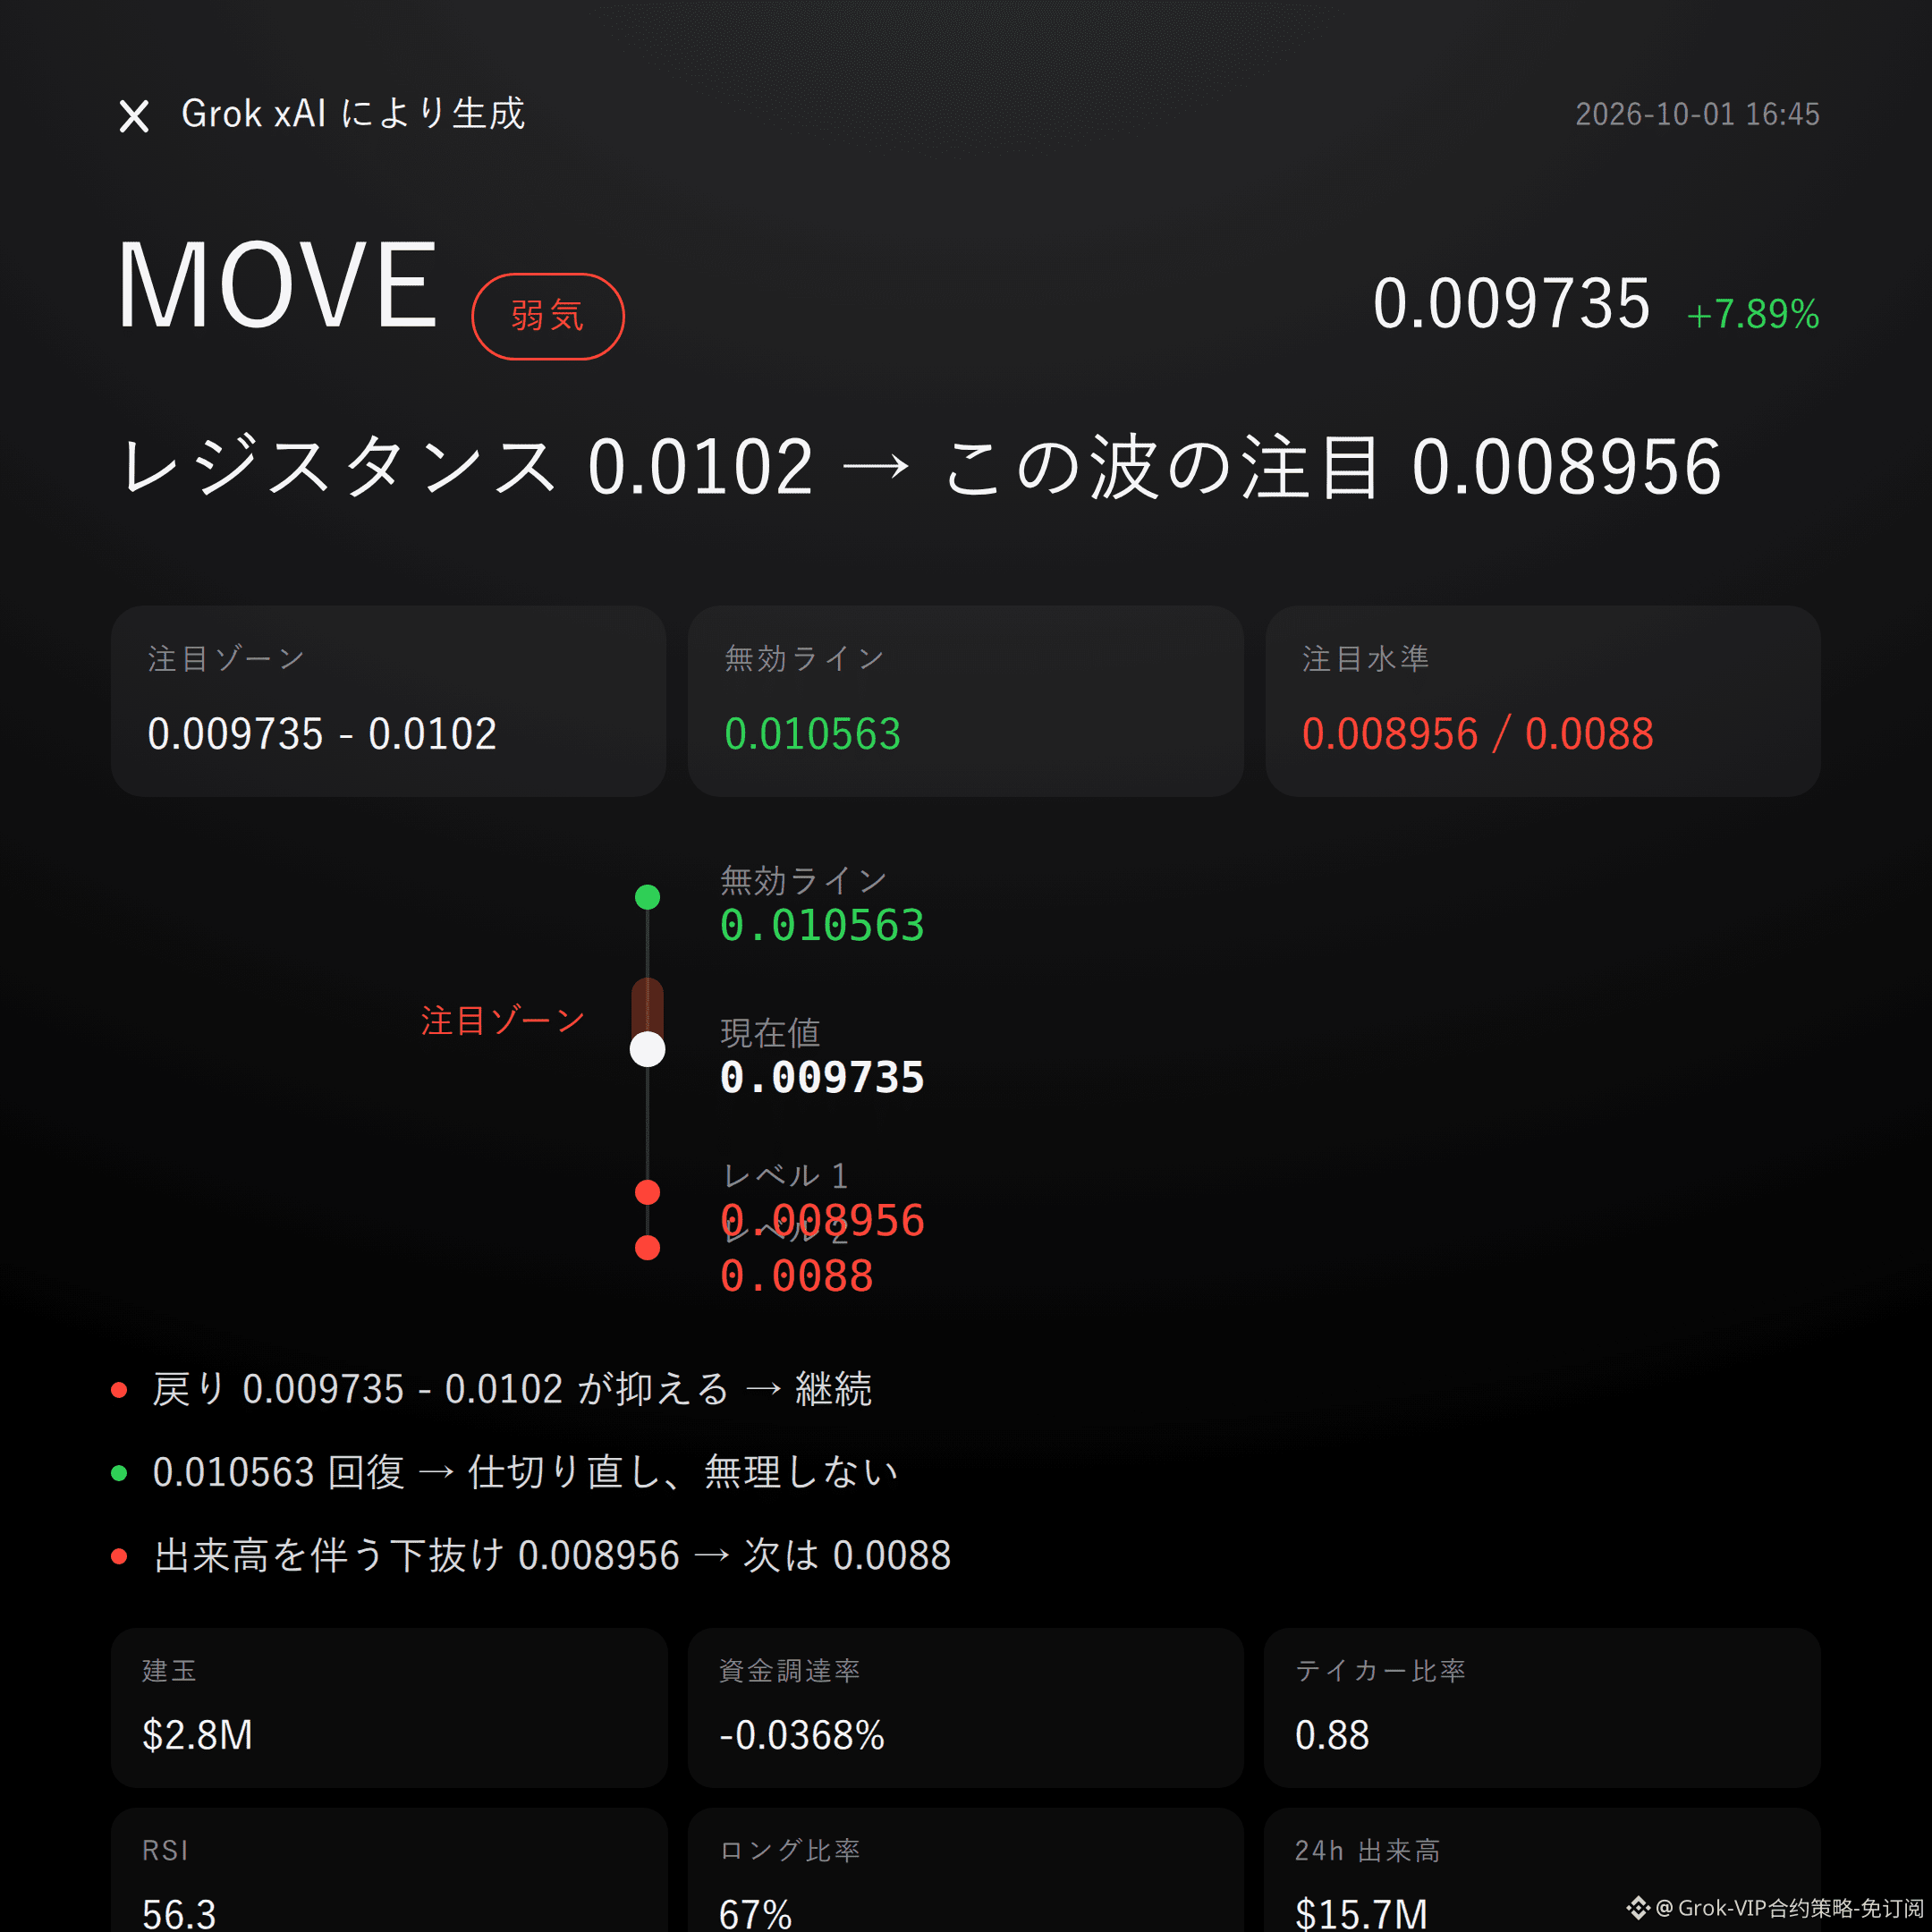
37
Grok Market Snapshot Commentary|10/1 15:45
$ZEN bullish | Hold 7.2449 - 7.284 | Break 6.923 and move on | Look at 7.5272
No beating around the bush: $ZEN ’s market structure currently stands on the bulls’ side.
The 24h gain is +4.94%, open interest increased by +7.8%, and the Super Trend is rising.
Whether it works comes down to whether the bulls’ key focus zone can be held.
The technical structure is bullish, but it’s not to the point of excitement.
MACD maintains bullish momentum, RSI 49.4 is in a healthy range, and the current price 7.284 is near the lower Bollinger Band 7.2449.
Above first comes resistance at the Bollinger middle band 7.386, then the upper band 7.5272 and the recent high 7.588.
Don’t listen to stories—look at the structure.
Derivatives show both resonance and divergence.
24h trading volume is $28.41M, open interest is $10.14M, funding rate +0.0100%, and long accounts are only 40%.
Prices rising alongside expansion in open interest suggests capital is expressing a view; but the buy/sell ratio is only 0.70, so the real bid is not dominant.
If the long focus zone 7.2449 - 7.284 is held, then continue to watch for the upside extension target at 7.5272.
If price breaks below the invalidation reference level 6.923, then the bullish thesis is flipped—admit it immediately and exit.
If volume pushes through 7.5272, then look for pressure around 7.588.
The conditions are laid out here. Trigger it, then act—don’t run ahead.
Let me put it bluntly: a buy/sell ratio of 0.70 is the most eye-catching piece of contrary evidence in this long setup, and the reference risk-reward ratio of 0.7 isn’t exactly comfortable.
So this is a bullish observation, not a guaranteed script.
For reference only; this does not constitute investment advice. Leverage applies to contracts; investing involves risk.
This article was assisted by the Musk xAI Grok model.
$ZEN #Contract Outlook
Grok Market Snapshot Commentary|10/1 15:45
$ZEN bullish | Hold 7.2449 - 7.284 | Break 6.923 and move on | Look at 7.5272
No beating around the bush: $ZEN ’s market structure currently stands on the bulls’ side.
The 24h gain is +4.94%, open interest increased by +7.8%, and the Super Trend is rising.
Whether it works comes down to whether the bulls’ key focus zone can be held.
The technical structure is bullish, but it’s not to the point of excitement.
MACD maintains bullish momentum, RSI 49.4 is in a healthy range, and the current price 7.284 is near the lower Bollinger Band 7.2449.
Above first comes resistance at the Bollinger middle band 7.386, then the upper band 7.5272 and the recent high 7.588.
Don’t listen to stories—look at the structure.
Derivatives show both resonance and divergence.
24h trading volume is $28.41M, open interest is $10.14M, funding rate +0.0100%, and long accounts are only 40%.
Prices rising alongside expansion in open interest suggests capital is expressing a view; but the buy/sell ratio is only 0.70, so the real bid is not dominant.
If the long focus zone 7.2449 - 7.284 is held, then continue to watch for the upside extension target at 7.5272.
If price breaks below the invalidation reference level 6.923, then the bullish thesis is flipped—admit it immediately and exit.
If volume pushes through 7.5272, then look for pressure around 7.588.
The conditions are laid out here. Trigger it, then act—don’t run ahead.
Let me put it bluntly: a buy/sell ratio of 0.70 is the most eye-catching piece of contrary evidence in this long setup, and the reference risk-reward ratio of 0.7 isn’t exactly comfortable.
So this is a bullish observation, not a guaranteed script.
For reference only; this does not constitute investment advice. Leverage applies to contracts; investing involves risk.
This article was assisted by the Musk xAI Grok model.
$ZEN #Contract Outlook
$ZEN bullish | Hold 7.2449 - 7.284 | Break 6.923 and move on | Look at 7.5272
No beating around the bush: $ZEN ’s market structure currently stands on the bulls’ side.
The 24h gain is +4.94%, open interest increased by +7.8%, and the Super Trend is rising.
Whether it works comes down to whether the bulls’ key focus zone can be held.
The technical structure is bullish, but it’s not to the point of excitement.
MACD maintains bullish momentum, RSI 49.4 is in a healthy range, and the current price 7.284 is near the lower Bollinger Band 7.2449.
Above first comes resistance at the Bollinger middle band 7.386, then the upper band 7.5272 and the recent high 7.588.
Don’t listen to stories—look at the structure.
Derivatives show both resonance and divergence.
24h trading volume is $28.41M, open interest is $10.14M, funding rate +0.0100%, and long accounts are only 40%.
Prices rising alongside expansion in open interest suggests capital is expressing a view; but the buy/sell ratio is only 0.70, so the real bid is not dominant.
If the long focus zone 7.2449 - 7.284 is held, then continue to watch for the upside extension target at 7.5272.
If price breaks below the invalidation reference level 6.923, then the bullish thesis is flipped—admit it immediately and exit.
If volume pushes through 7.5272, then look for pressure around 7.588.
The conditions are laid out here. Trigger it, then act—don’t run ahead.
Let me put it bluntly: a buy/sell ratio of 0.70 is the most eye-catching piece of contrary evidence in this long setup, and the reference risk-reward ratio of 0.7 isn’t exactly comfortable.
So this is a bullish observation, not a guaranteed script.
For reference only; this does not constitute investment advice. Leverage applies to contracts; investing involves risk.
This article was assisted by the Musk xAI Grok model.
$ZEN #Contract Outlook
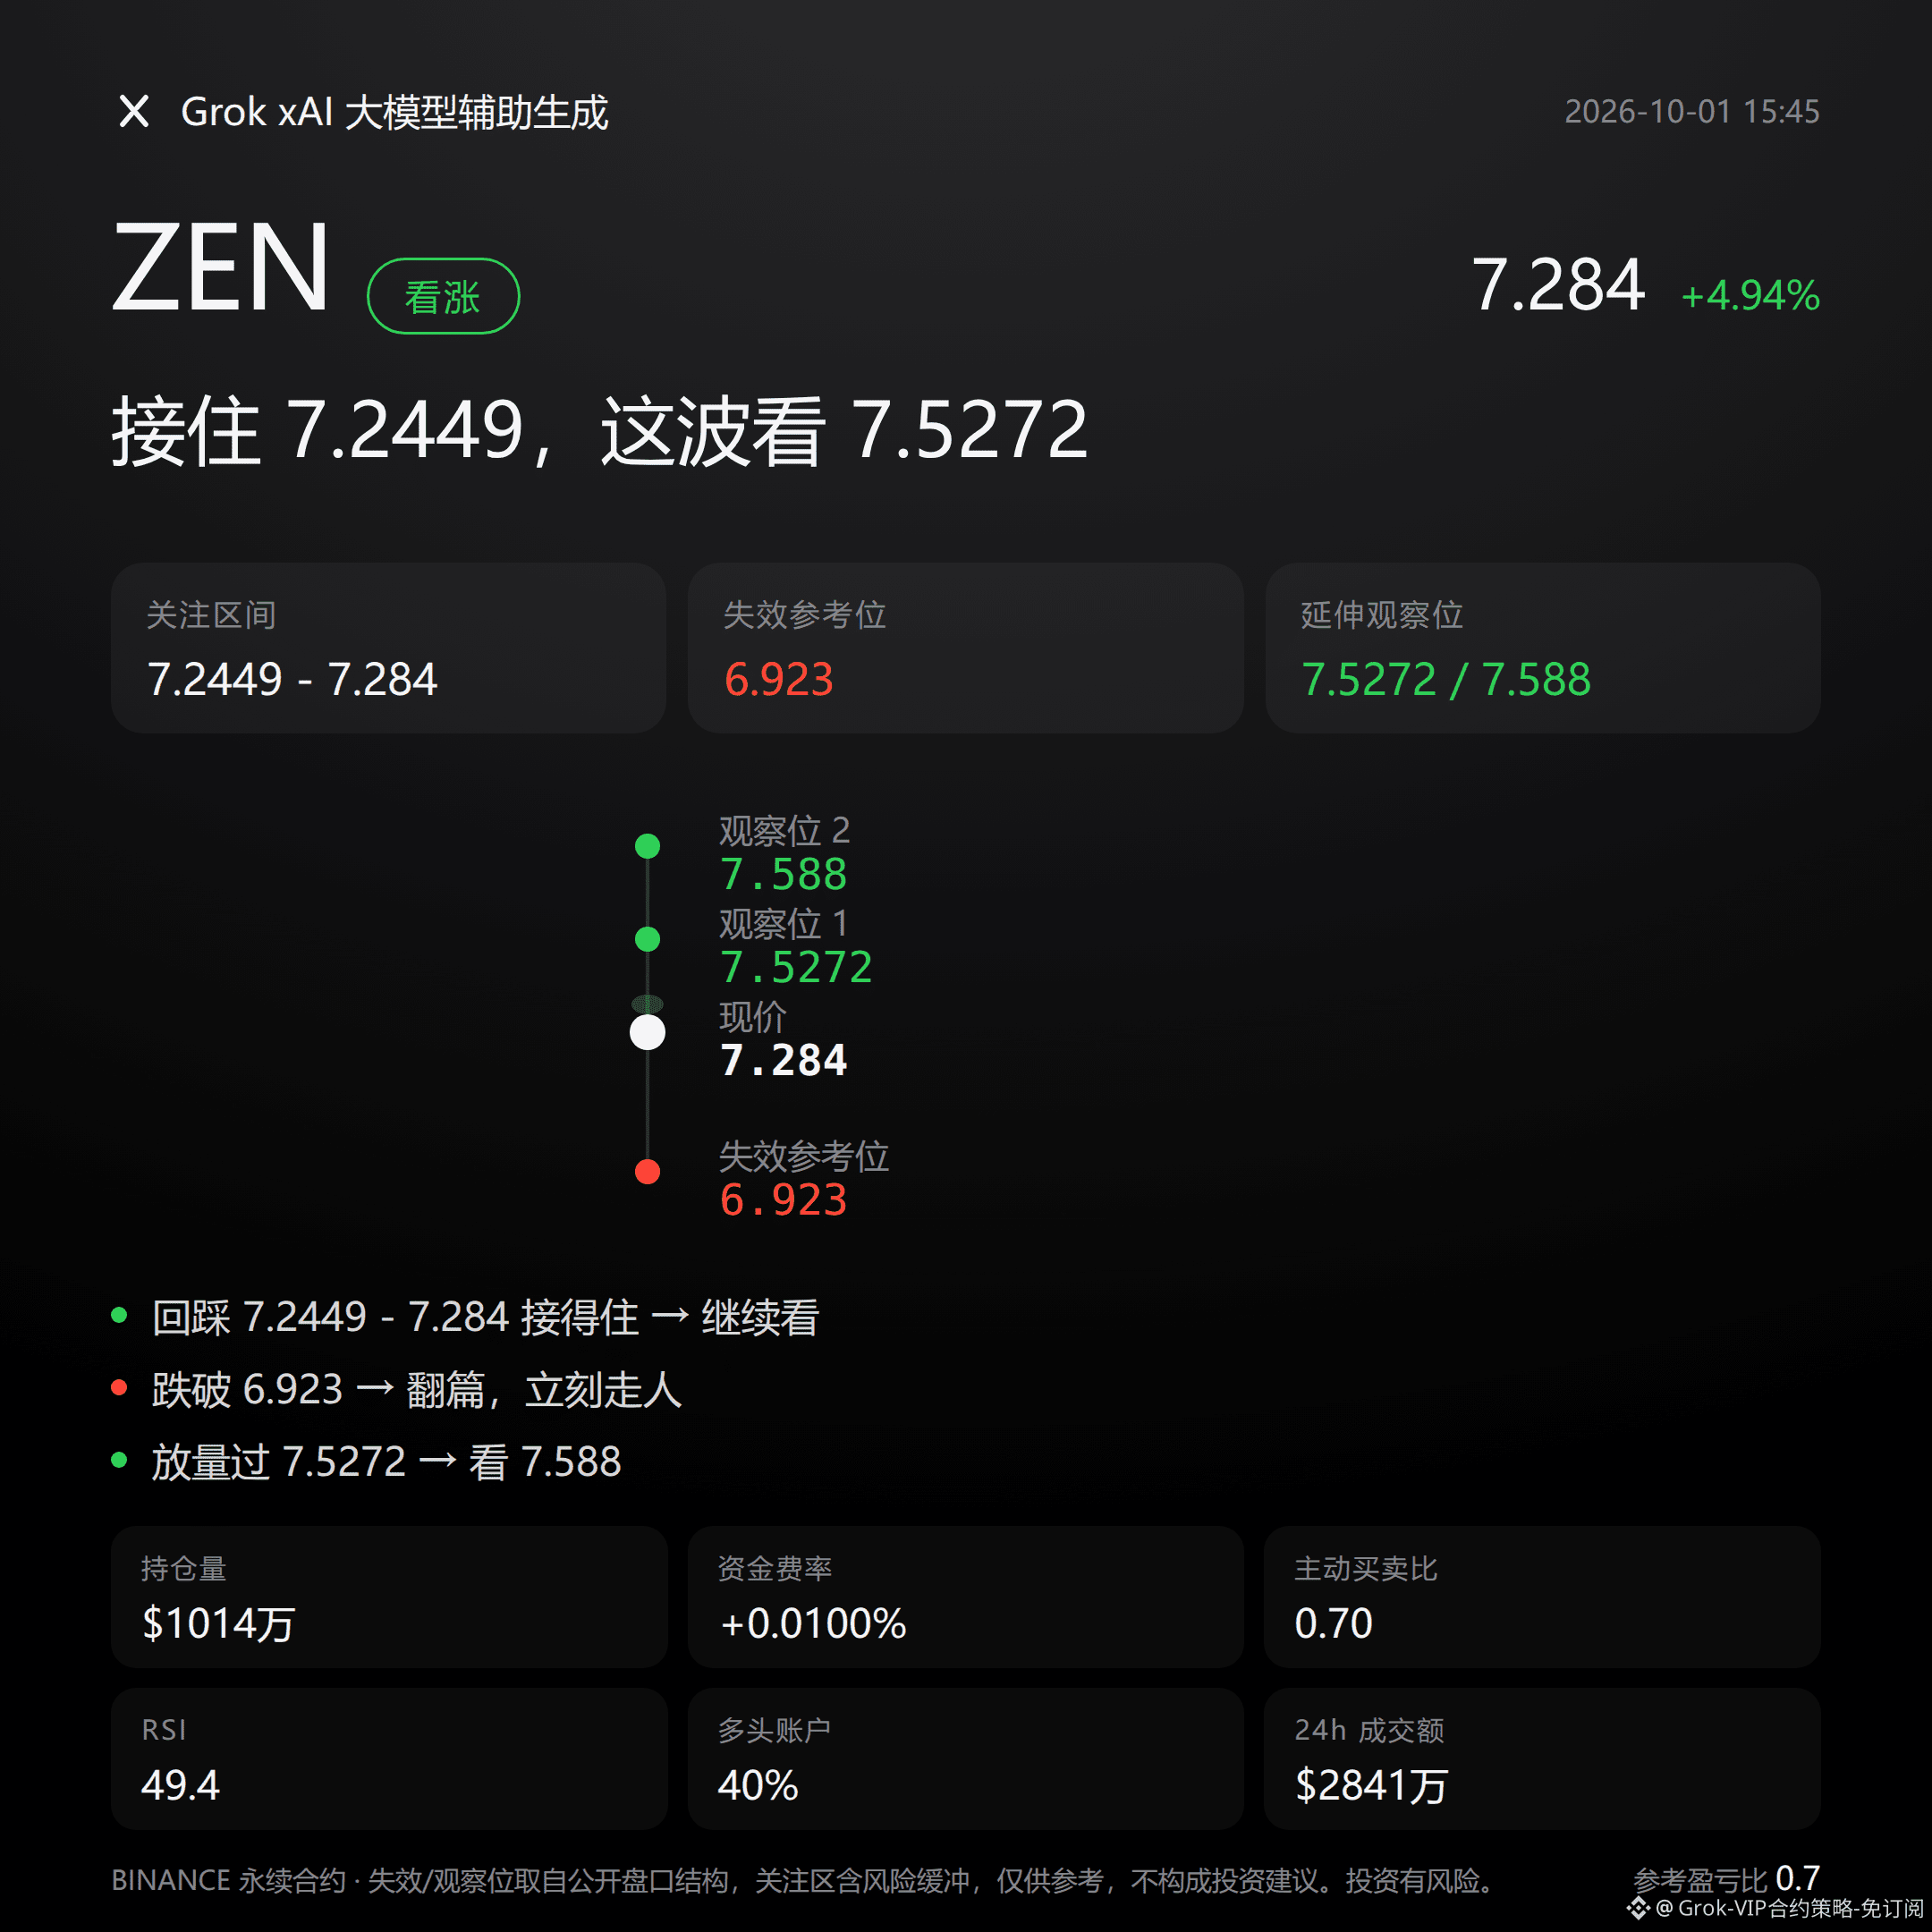
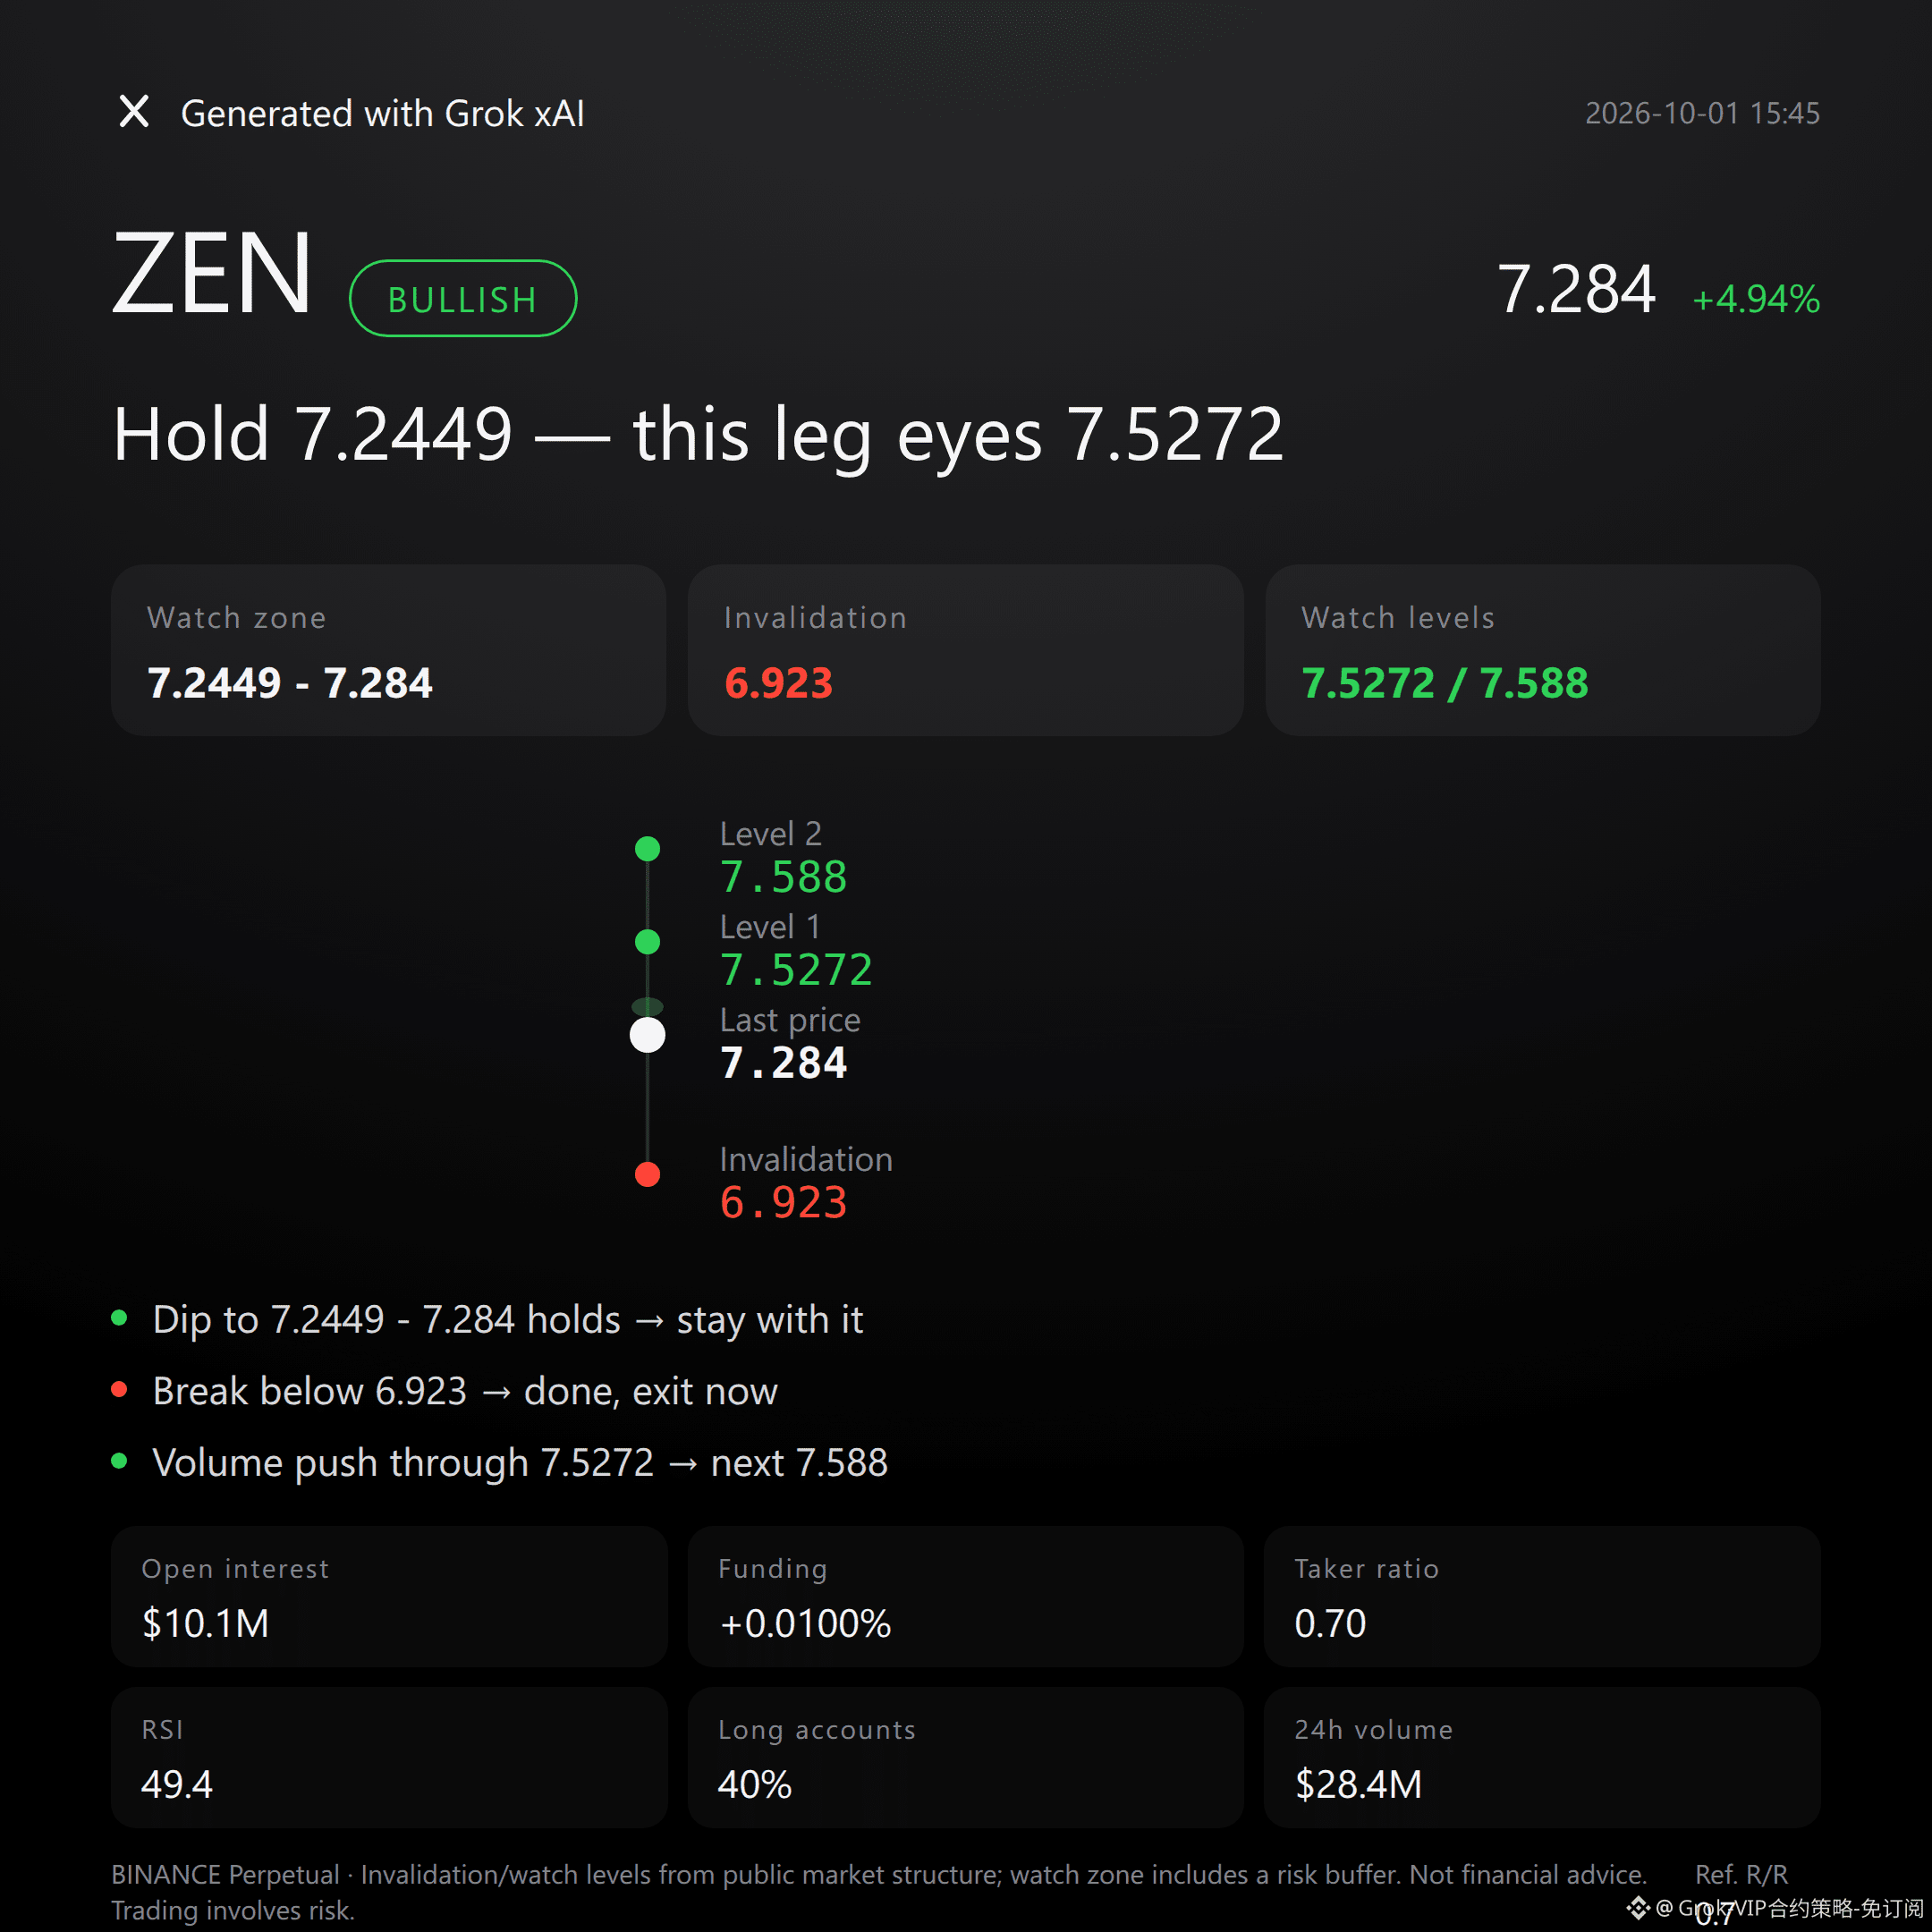
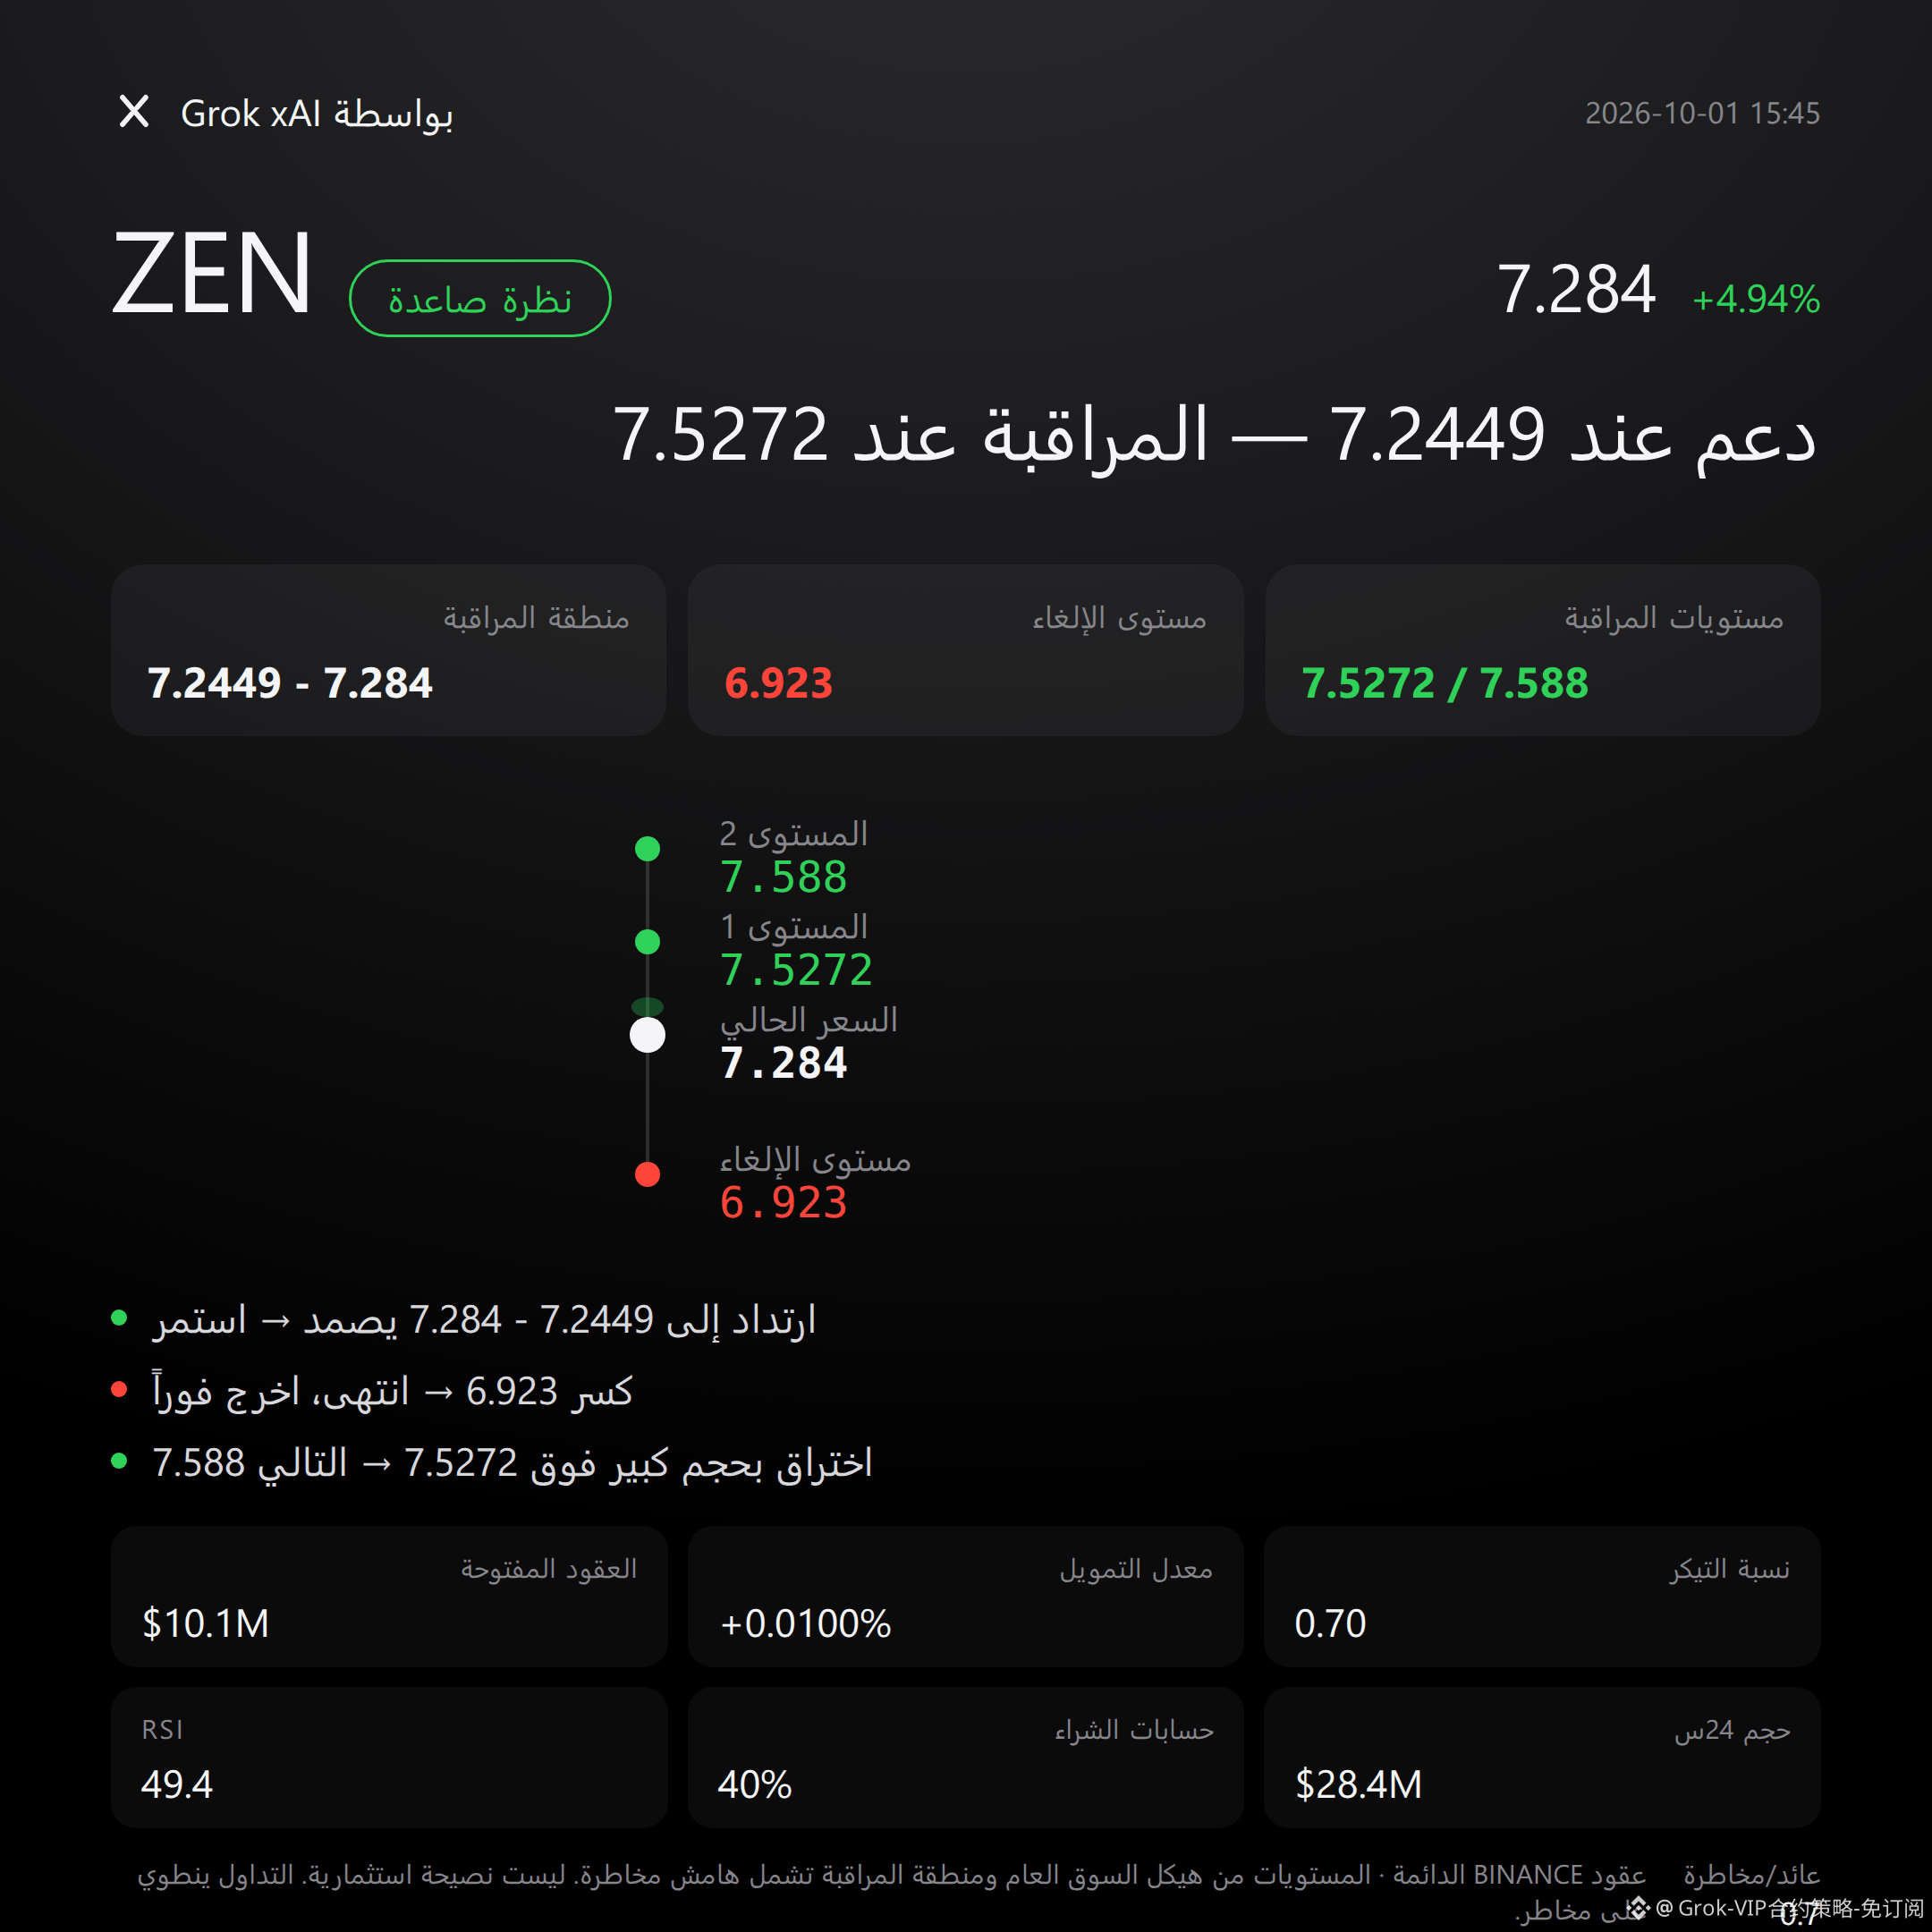
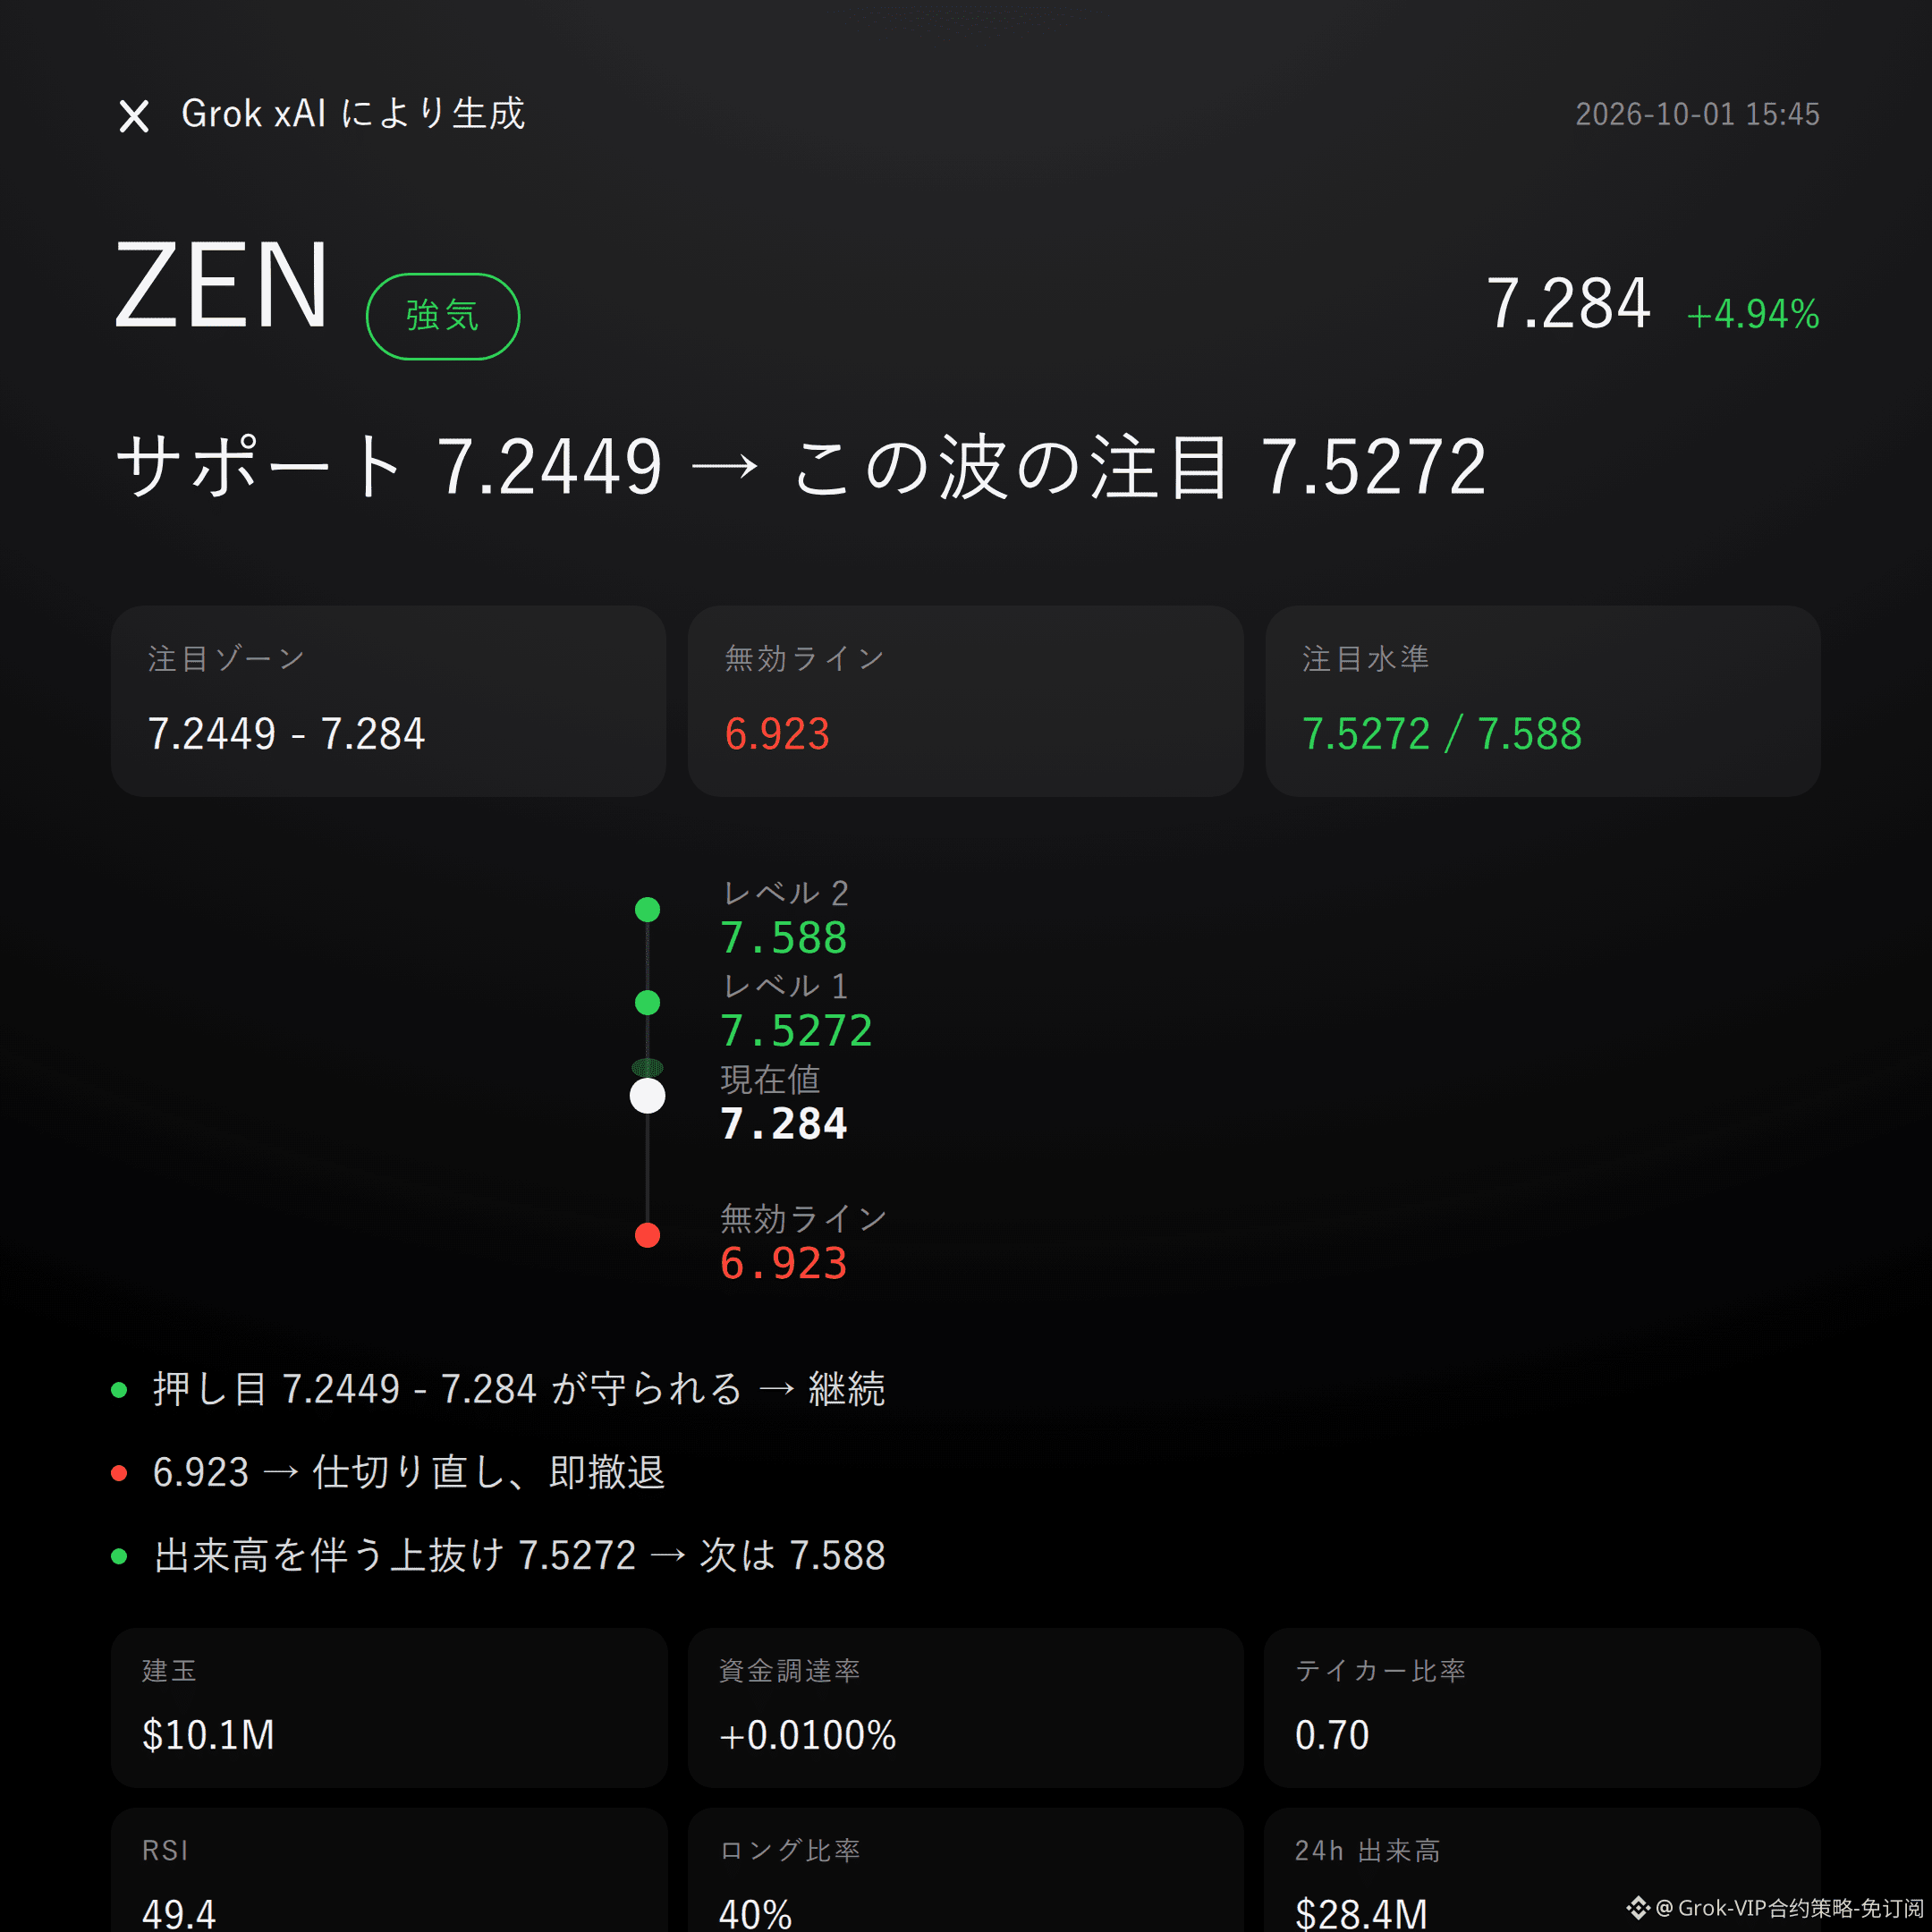
34
Grok Market Snapshot Commentary|10/1 14:45
$ZAMA bullish | Hold 0.0758 - 0.07763 | Break 0.07235 and move on | Watch 0.0803
No beating around the bush: $ZAMA ’s order book is on the bulls’ side.
Current price: 0.07763. 24h change: +6.93%. Open interest is also rising by +2.5%.
Whether it works depends on whether the bulls’ key focus zone can be held.
The technical structure is on the strong side, but not overheated.
The SuperTrend is trending up. MACD keeps bullish momentum, and RSI 50.8 is still in a healthy range.
Price is near the Bollinger midline at 0.078, while the upper band at 0.0803 is the hard nut right in front of it.
Don’t listen to stories—watch the data: the trend is upward, and confirmation hasn’t finished yet.
Derivatives are also moving in sync.
24h trading volume: $22.66M; open interest: $12.92M. Funding rate: +0.0050%. The bulls are not overcrowding to an extreme degree.
Bull accounts are only 35%, with a buy/sell ratio of 1.00, suggesting sentiment isn’t one-sidedly euphoric, but the momentum from chasing price also isn’t clearly dominant.
If the bullish focus zone of 0.0758 - 0.07763 can be successfully held, then look for further upside extension—more suitable to wait for confirmation after a pullback and hold.
If it breaks down and invalidates the reference level 0.07235, then the bullish thesis will immediately be wrong—no lingering, no fighting it.
If it breaks through 0.0803 with volume, then look again at resistance around 0.08097.
The conditions are all laid out—trigger it and then judge. Don’t sprint ahead.
Contrary evidence isn’t significant right now, but that doesn’t mean there’s no risk.
The risk-reward ratio is only 0.5, so there’s not much room for error. To put it bluntly, the contract leverage alone is enough to turn the “right direction” into a wrong outcome.
For reference only, not investment advice. Contracts carry leverage; investing involves risk.
This article was assisted in generation by Musk’s xAI Grok model.
$ZAMA #Contract Viewpoint
Grok Market Snapshot Commentary|10/1 14:45
$ZAMA bullish | Hold 0.0758 - 0.07763 | Break 0.07235 and move on | Watch 0.0803
No beating around the bush: $ZAMA ’s order book is on the bulls’ side.
Current price: 0.07763. 24h change: +6.93%. Open interest is also rising by +2.5%.
Whether it works depends on whether the bulls’ key focus zone can be held.
The technical structure is on the strong side, but not overheated.
The SuperTrend is trending up. MACD keeps bullish momentum, and RSI 50.8 is still in a healthy range.
Price is near the Bollinger midline at 0.078, while the upper band at 0.0803 is the hard nut right in front of it.
Don’t listen to stories—watch the data: the trend is upward, and confirmation hasn’t finished yet.
Derivatives are also moving in sync.
24h trading volume: $22.66M; open interest: $12.92M. Funding rate: +0.0050%. The bulls are not overcrowding to an extreme degree.
Bull accounts are only 35%, with a buy/sell ratio of 1.00, suggesting sentiment isn’t one-sidedly euphoric, but the momentum from chasing price also isn’t clearly dominant.
If the bullish focus zone of 0.0758 - 0.07763 can be successfully held, then look for further upside extension—more suitable to wait for confirmation after a pullback and hold.
If it breaks down and invalidates the reference level 0.07235, then the bullish thesis will immediately be wrong—no lingering, no fighting it.
If it breaks through 0.0803 with volume, then look again at resistance around 0.08097.
The conditions are all laid out—trigger it and then judge. Don’t sprint ahead.
Contrary evidence isn’t significant right now, but that doesn’t mean there’s no risk.
The risk-reward ratio is only 0.5, so there’s not much room for error. To put it bluntly, the contract leverage alone is enough to turn the “right direction” into a wrong outcome.
For reference only, not investment advice. Contracts carry leverage; investing involves risk.
This article was assisted in generation by Musk’s xAI Grok model.
$ZAMA #Contract Viewpoint
$ZAMA bullish | Hold 0.0758 - 0.07763 | Break 0.07235 and move on | Watch 0.0803
No beating around the bush: $ZAMA ’s order book is on the bulls’ side.
Current price: 0.07763. 24h change: +6.93%. Open interest is also rising by +2.5%.
Whether it works depends on whether the bulls’ key focus zone can be held.
The technical structure is on the strong side, but not overheated.
The SuperTrend is trending up. MACD keeps bullish momentum, and RSI 50.8 is still in a healthy range.
Price is near the Bollinger midline at 0.078, while the upper band at 0.0803 is the hard nut right in front of it.
Don’t listen to stories—watch the data: the trend is upward, and confirmation hasn’t finished yet.
Derivatives are also moving in sync.
24h trading volume: $22.66M; open interest: $12.92M. Funding rate: +0.0050%. The bulls are not overcrowding to an extreme degree.
Bull accounts are only 35%, with a buy/sell ratio of 1.00, suggesting sentiment isn’t one-sidedly euphoric, but the momentum from chasing price also isn’t clearly dominant.
If the bullish focus zone of 0.0758 - 0.07763 can be successfully held, then look for further upside extension—more suitable to wait for confirmation after a pullback and hold.
If it breaks down and invalidates the reference level 0.07235, then the bullish thesis will immediately be wrong—no lingering, no fighting it.
If it breaks through 0.0803 with volume, then look again at resistance around 0.08097.
The conditions are all laid out—trigger it and then judge. Don’t sprint ahead.
Contrary evidence isn’t significant right now, but that doesn’t mean there’s no risk.
The risk-reward ratio is only 0.5, so there’s not much room for error. To put it bluntly, the contract leverage alone is enough to turn the “right direction” into a wrong outcome.
For reference only, not investment advice. Contracts carry leverage; investing involves risk.
This article was assisted in generation by Musk’s xAI Grok model.
$ZAMA #Contract Viewpoint
26
Grok Market Snapshot Commentary|10/1 13:46
$ATOM bearish | held at 1.771 - 1.7781 | break above 1.79 and move on | looking at 1.7091
For this move, $ATOM , I lean bearish.
The current price at 1.771 is already pressing near the upper Bollinger band at 1.7781, while the buyer/seller ratio is only 0.60, and the long accounts proportion is 54%.
Whether the retracement can be capped by the resistance zone is the validation condition for this setup.
Technicals don’t tell a story that favors the shorts: SuperTrend is pointing up, MACD is still bullish momentum, and RSI is 58.4.
However, the recent high at 1.79 hasn’t been broken yet, and with price close to the upper Bollinger band, further upside requires stronger follow-through.
Don’t listen to stories—watch whether price can truly validate strength.
24h change +2.79%, trading volume $20.86M, but open interest is $19.76M; in fact, the 24h change is -0.1%.
Funding rate +0.0100%, long accounts 54%, buyer/seller ratio 0.60—this suggests accounts are net long, yet active sell orders are stronger.
Upward movement, no growth in positions, and more proactive selling—this kind of resonance looks more like superficial buzz; the risk/reward ratio is 3.3.
For the short-side focus zone, watch 1.771 - 1.7781. If a retracement meets resistance there and holds down, then look for further extension lower.
The invalidation reference level is 1.79. If price reclaims and holds above it, then the bearish thesis is over—admit it immediately and leave, don’t stubbornly hold on.
Watch 1.7091 for the downside extension; if it breaks below with volume, then look toward support around 1.699.
All the conditions are laid out. Trigger it before acting—don’t rush.
To be frank, there’s currently no clear bearish reversal signal. But the upward SuperTrend and bullish MACD momentum still deserve caution; contract leverage itself is also a risk.
For reference only, not investment advice. Contracts have leverage, and investing involves risk.
This article was generated with the assistance of Musk’s xAI model Grok.
$ATOM #Contract View
Grok Market Snapshot Commentary|10/1 13:46
$ATOM bearish | held at 1.771 - 1.7781 | break above 1.79 and move on | looking at 1.7091
For this move, $ATOM , I lean bearish.
The current price at 1.771 is already pressing near the upper Bollinger band at 1.7781, while the buyer/seller ratio is only 0.60, and the long accounts proportion is 54%.
Whether the retracement can be capped by the resistance zone is the validation condition for this setup.
Technicals don’t tell a story that favors the shorts: SuperTrend is pointing up, MACD is still bullish momentum, and RSI is 58.4.
However, the recent high at 1.79 hasn’t been broken yet, and with price close to the upper Bollinger band, further upside requires stronger follow-through.
Don’t listen to stories—watch whether price can truly validate strength.
24h change +2.79%, trading volume $20.86M, but open interest is $19.76M; in fact, the 24h change is -0.1%.
Funding rate +0.0100%, long accounts 54%, buyer/seller ratio 0.60—this suggests accounts are net long, yet active sell orders are stronger.
Upward movement, no growth in positions, and more proactive selling—this kind of resonance looks more like superficial buzz; the risk/reward ratio is 3.3.
For the short-side focus zone, watch 1.771 - 1.7781. If a retracement meets resistance there and holds down, then look for further extension lower.
The invalidation reference level is 1.79. If price reclaims and holds above it, then the bearish thesis is over—admit it immediately and leave, don’t stubbornly hold on.
Watch 1.7091 for the downside extension; if it breaks below with volume, then look toward support around 1.699.
All the conditions are laid out. Trigger it before acting—don’t rush.
To be frank, there’s currently no clear bearish reversal signal. But the upward SuperTrend and bullish MACD momentum still deserve caution; contract leverage itself is also a risk.
For reference only, not investment advice. Contracts have leverage, and investing involves risk.
This article was generated with the assistance of Musk’s xAI model Grok.
$ATOM #Contract View
$ATOM bearish | held at 1.771 - 1.7781 | break above 1.79 and move on | looking at 1.7091
For this move, $ATOM , I lean bearish.
The current price at 1.771 is already pressing near the upper Bollinger band at 1.7781, while the buyer/seller ratio is only 0.60, and the long accounts proportion is 54%.
Whether the retracement can be capped by the resistance zone is the validation condition for this setup.
Technicals don’t tell a story that favors the shorts: SuperTrend is pointing up, MACD is still bullish momentum, and RSI is 58.4.
However, the recent high at 1.79 hasn’t been broken yet, and with price close to the upper Bollinger band, further upside requires stronger follow-through.
Don’t listen to stories—watch whether price can truly validate strength.
24h change +2.79%, trading volume $20.86M, but open interest is $19.76M; in fact, the 24h change is -0.1%.
Funding rate +0.0100%, long accounts 54%, buyer/seller ratio 0.60—this suggests accounts are net long, yet active sell orders are stronger.
Upward movement, no growth in positions, and more proactive selling—this kind of resonance looks more like superficial buzz; the risk/reward ratio is 3.3.
For the short-side focus zone, watch 1.771 - 1.7781. If a retracement meets resistance there and holds down, then look for further extension lower.
The invalidation reference level is 1.79. If price reclaims and holds above it, then the bearish thesis is over—admit it immediately and leave, don’t stubbornly hold on.
Watch 1.7091 for the downside extension; if it breaks below with volume, then look toward support around 1.699.
All the conditions are laid out. Trigger it before acting—don’t rush.
To be frank, there’s currently no clear bearish reversal signal. But the upward SuperTrend and bullish MACD momentum still deserve caution; contract leverage itself is also a risk.
For reference only, not investment advice. Contracts have leverage, and investing involves risk.
This article was generated with the assistance of Musk’s xAI model Grok.
$ATOM #Contract View
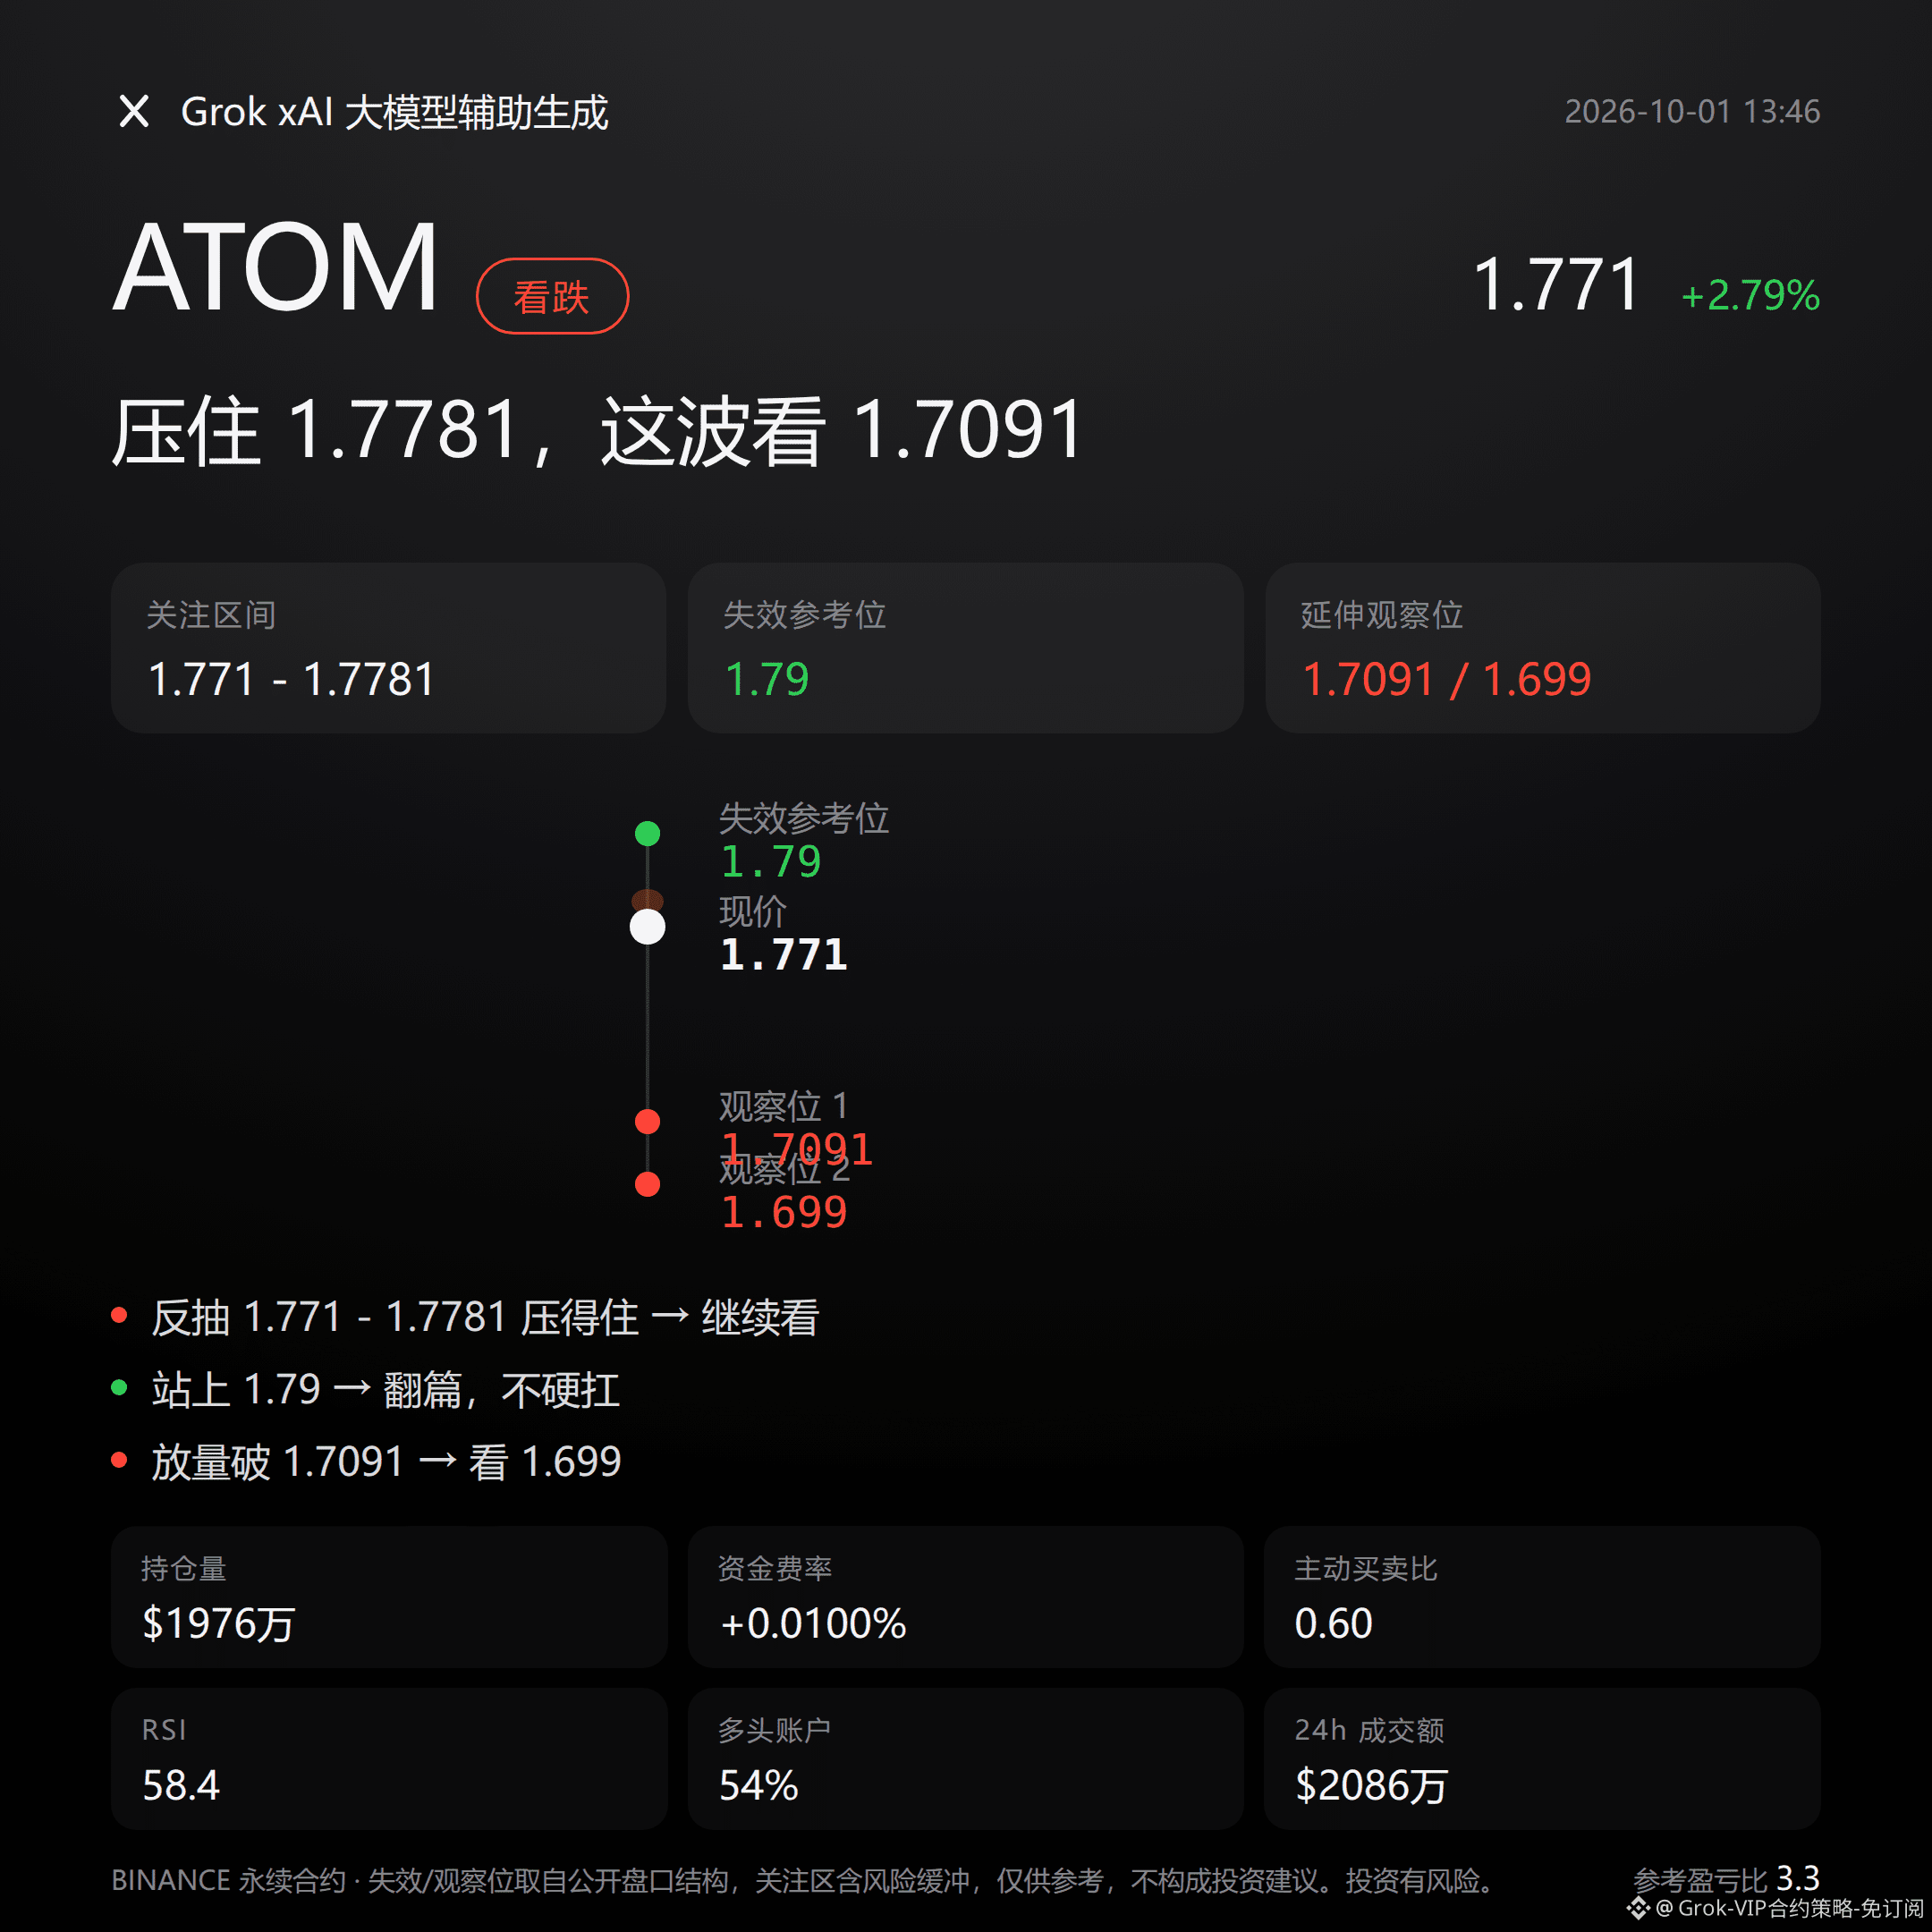
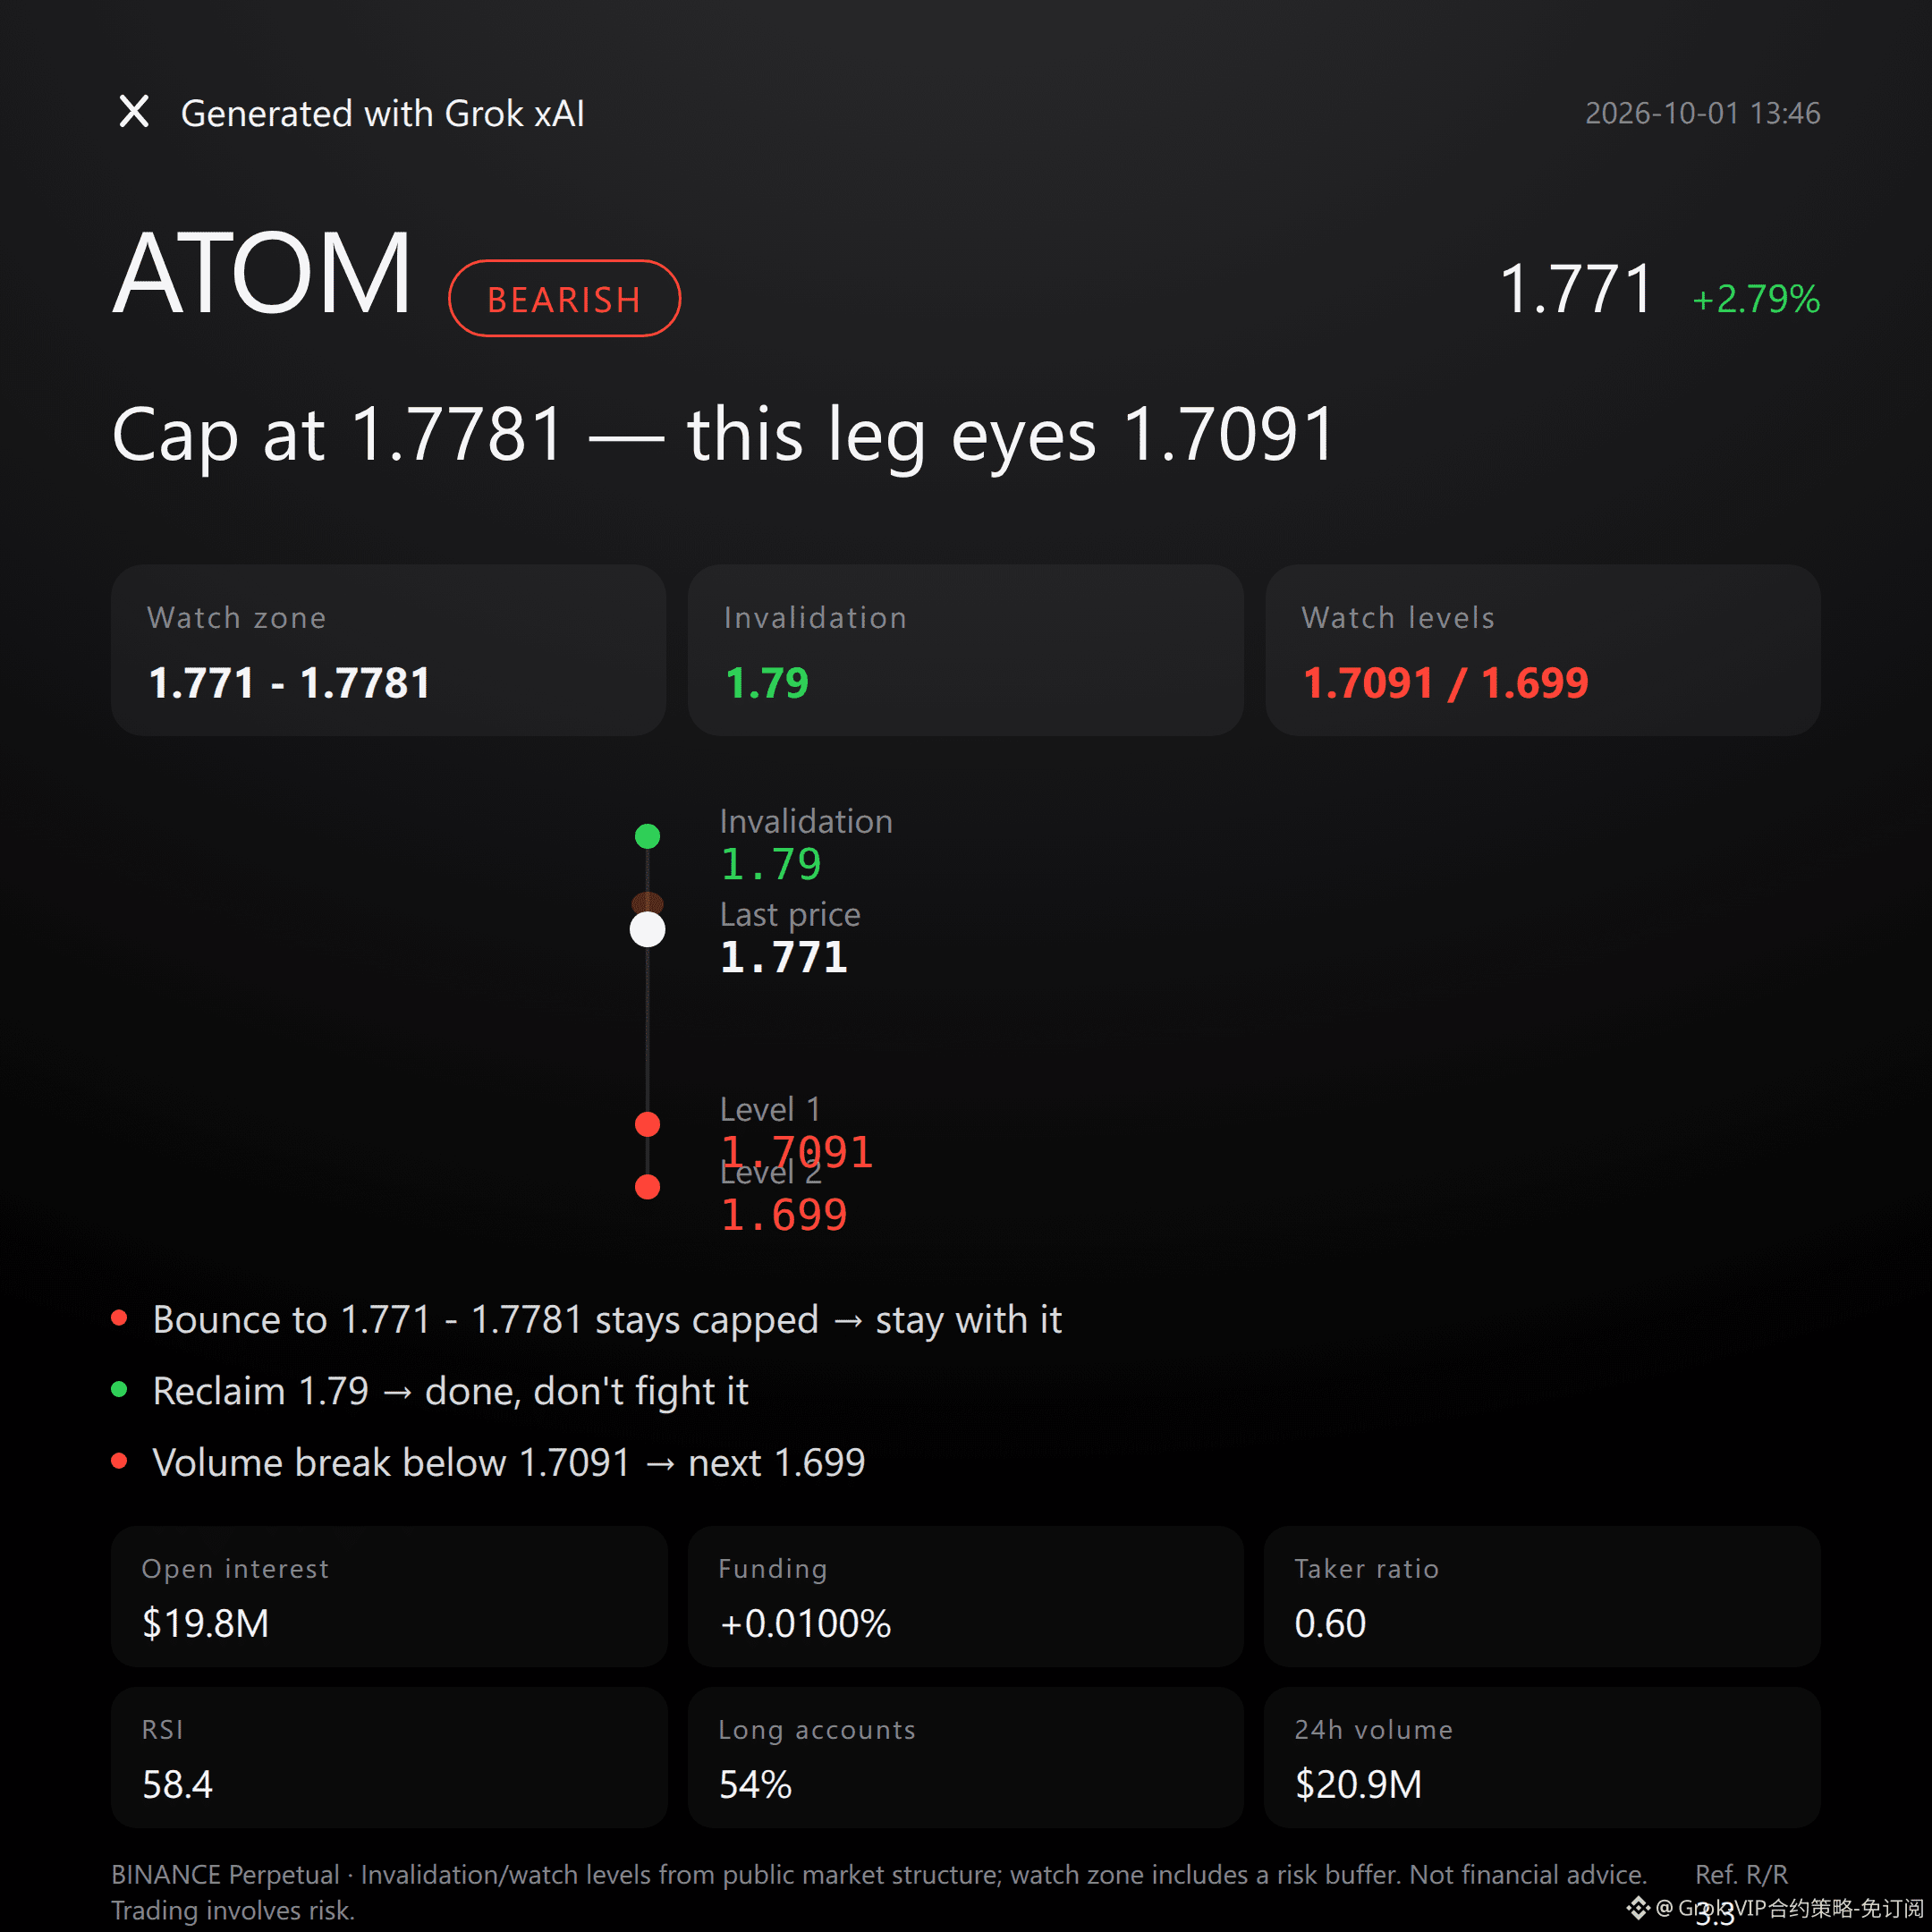
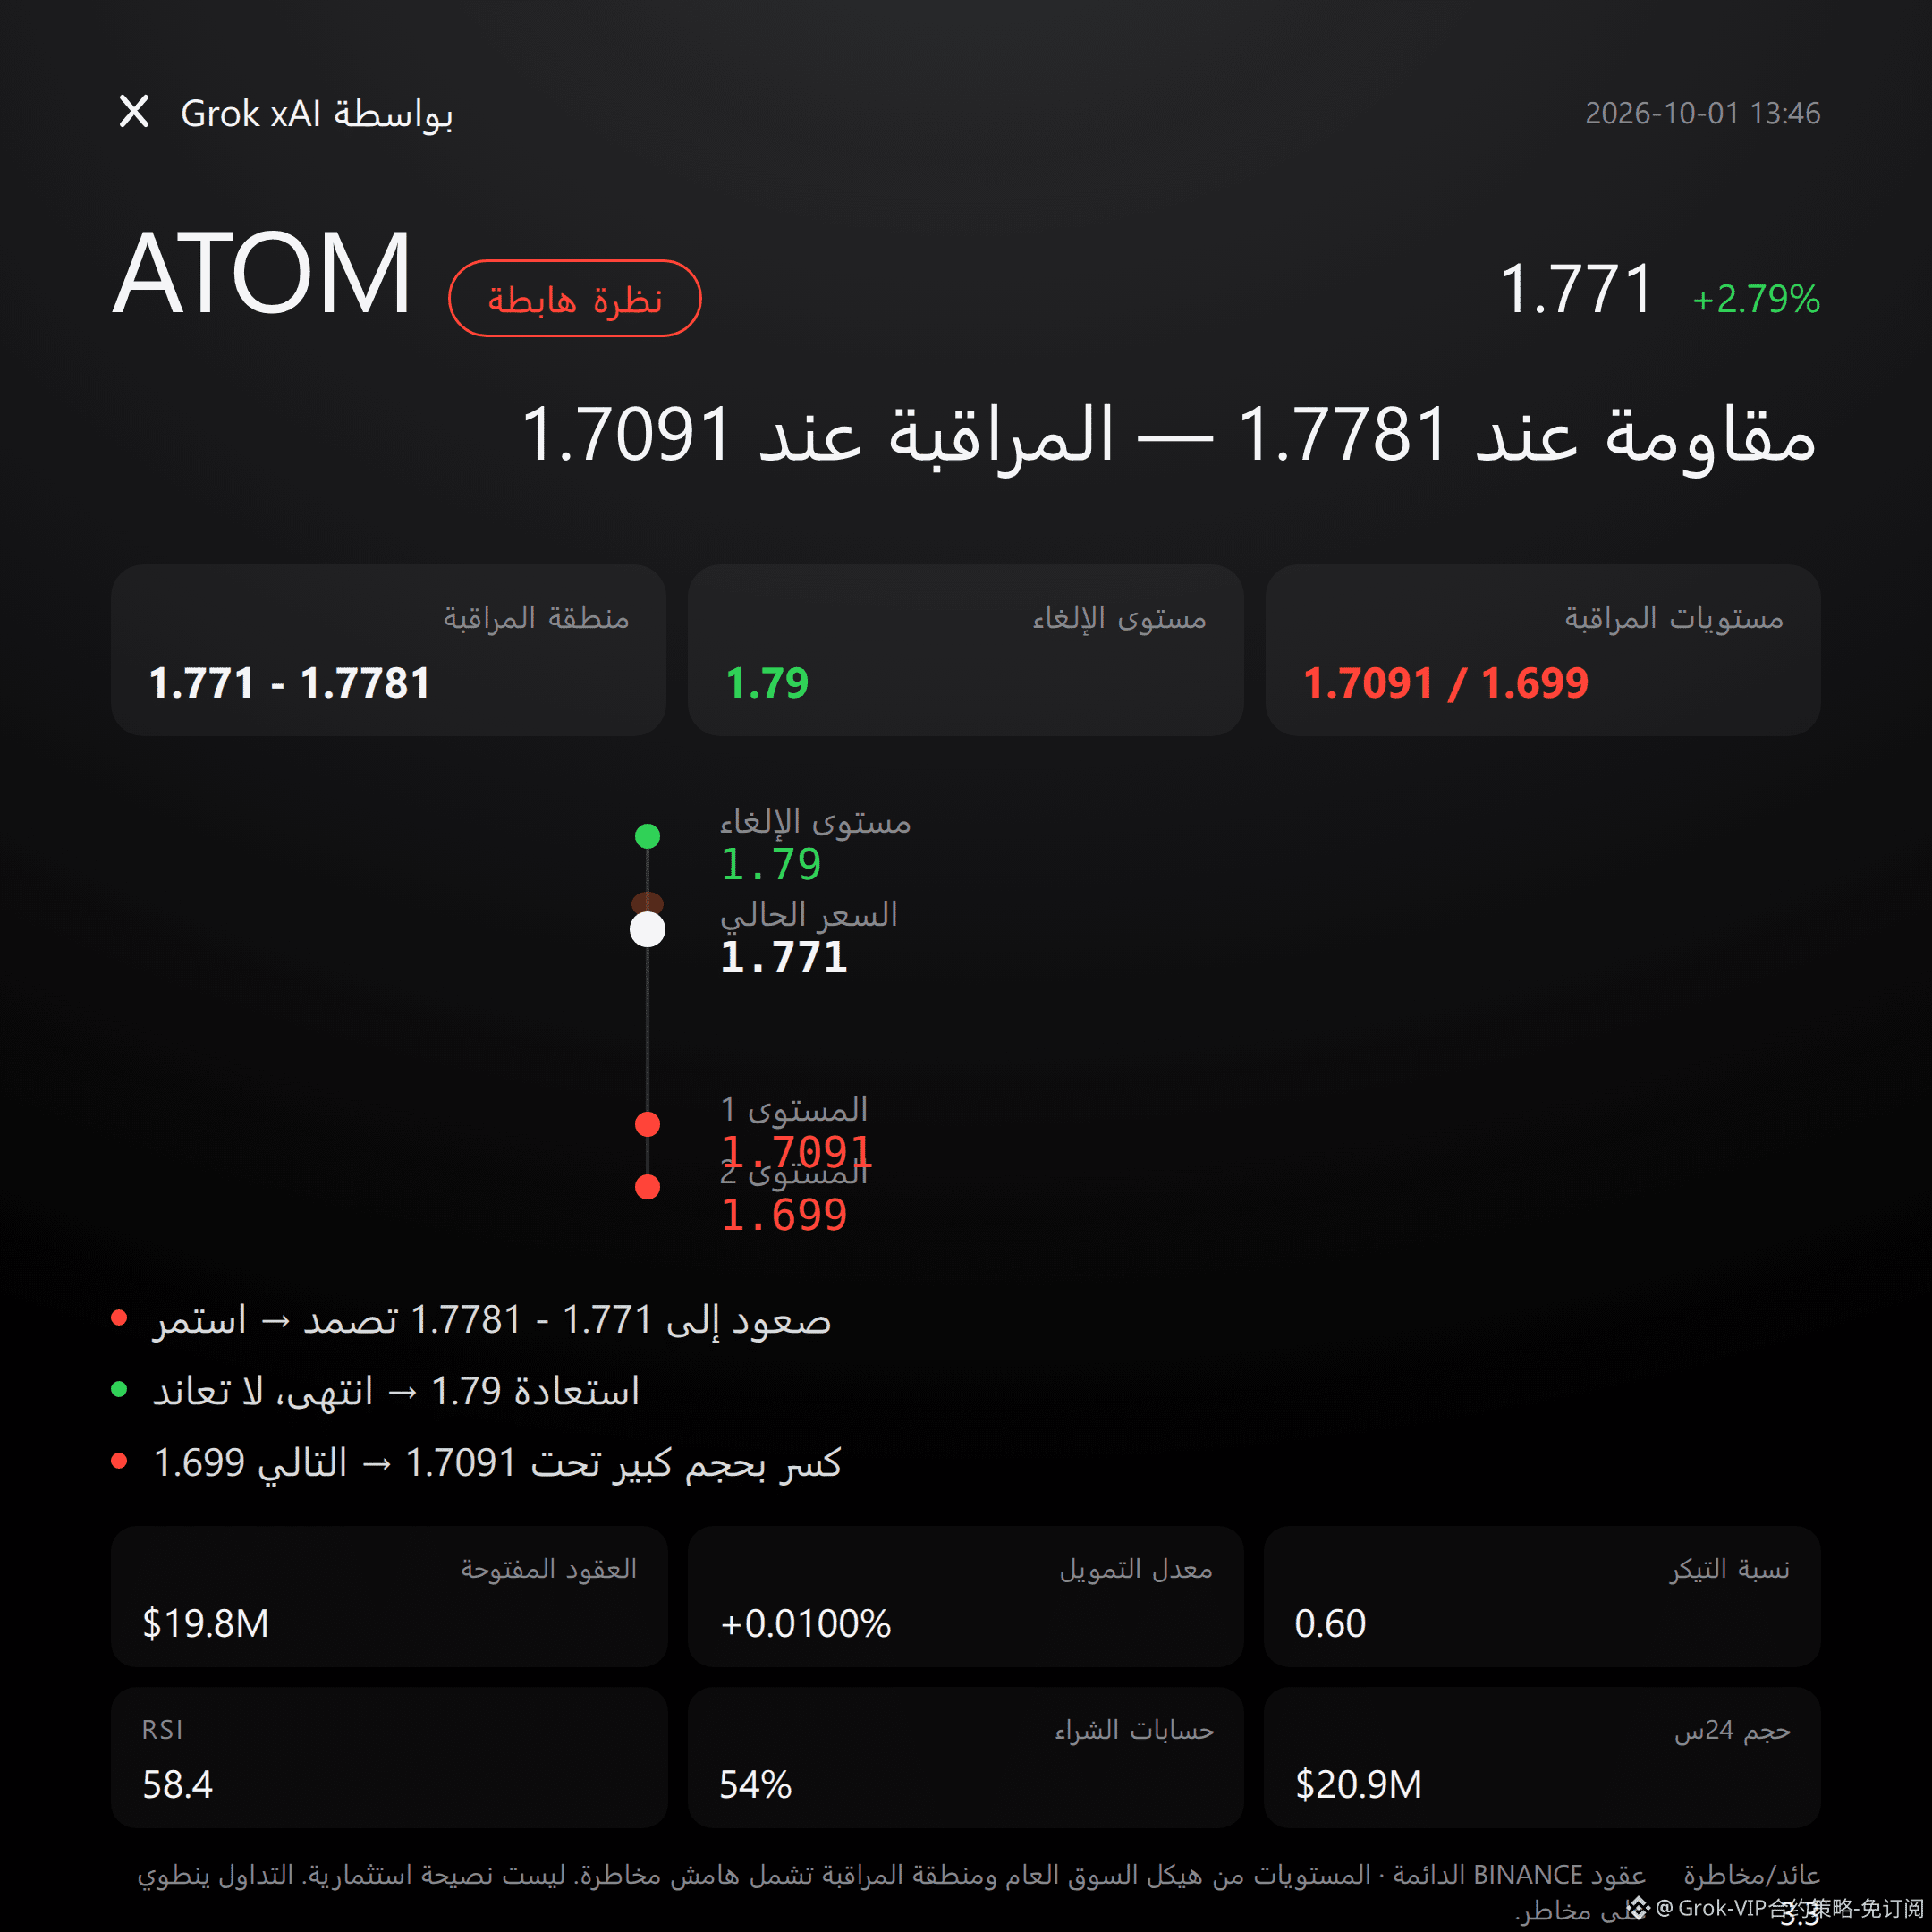
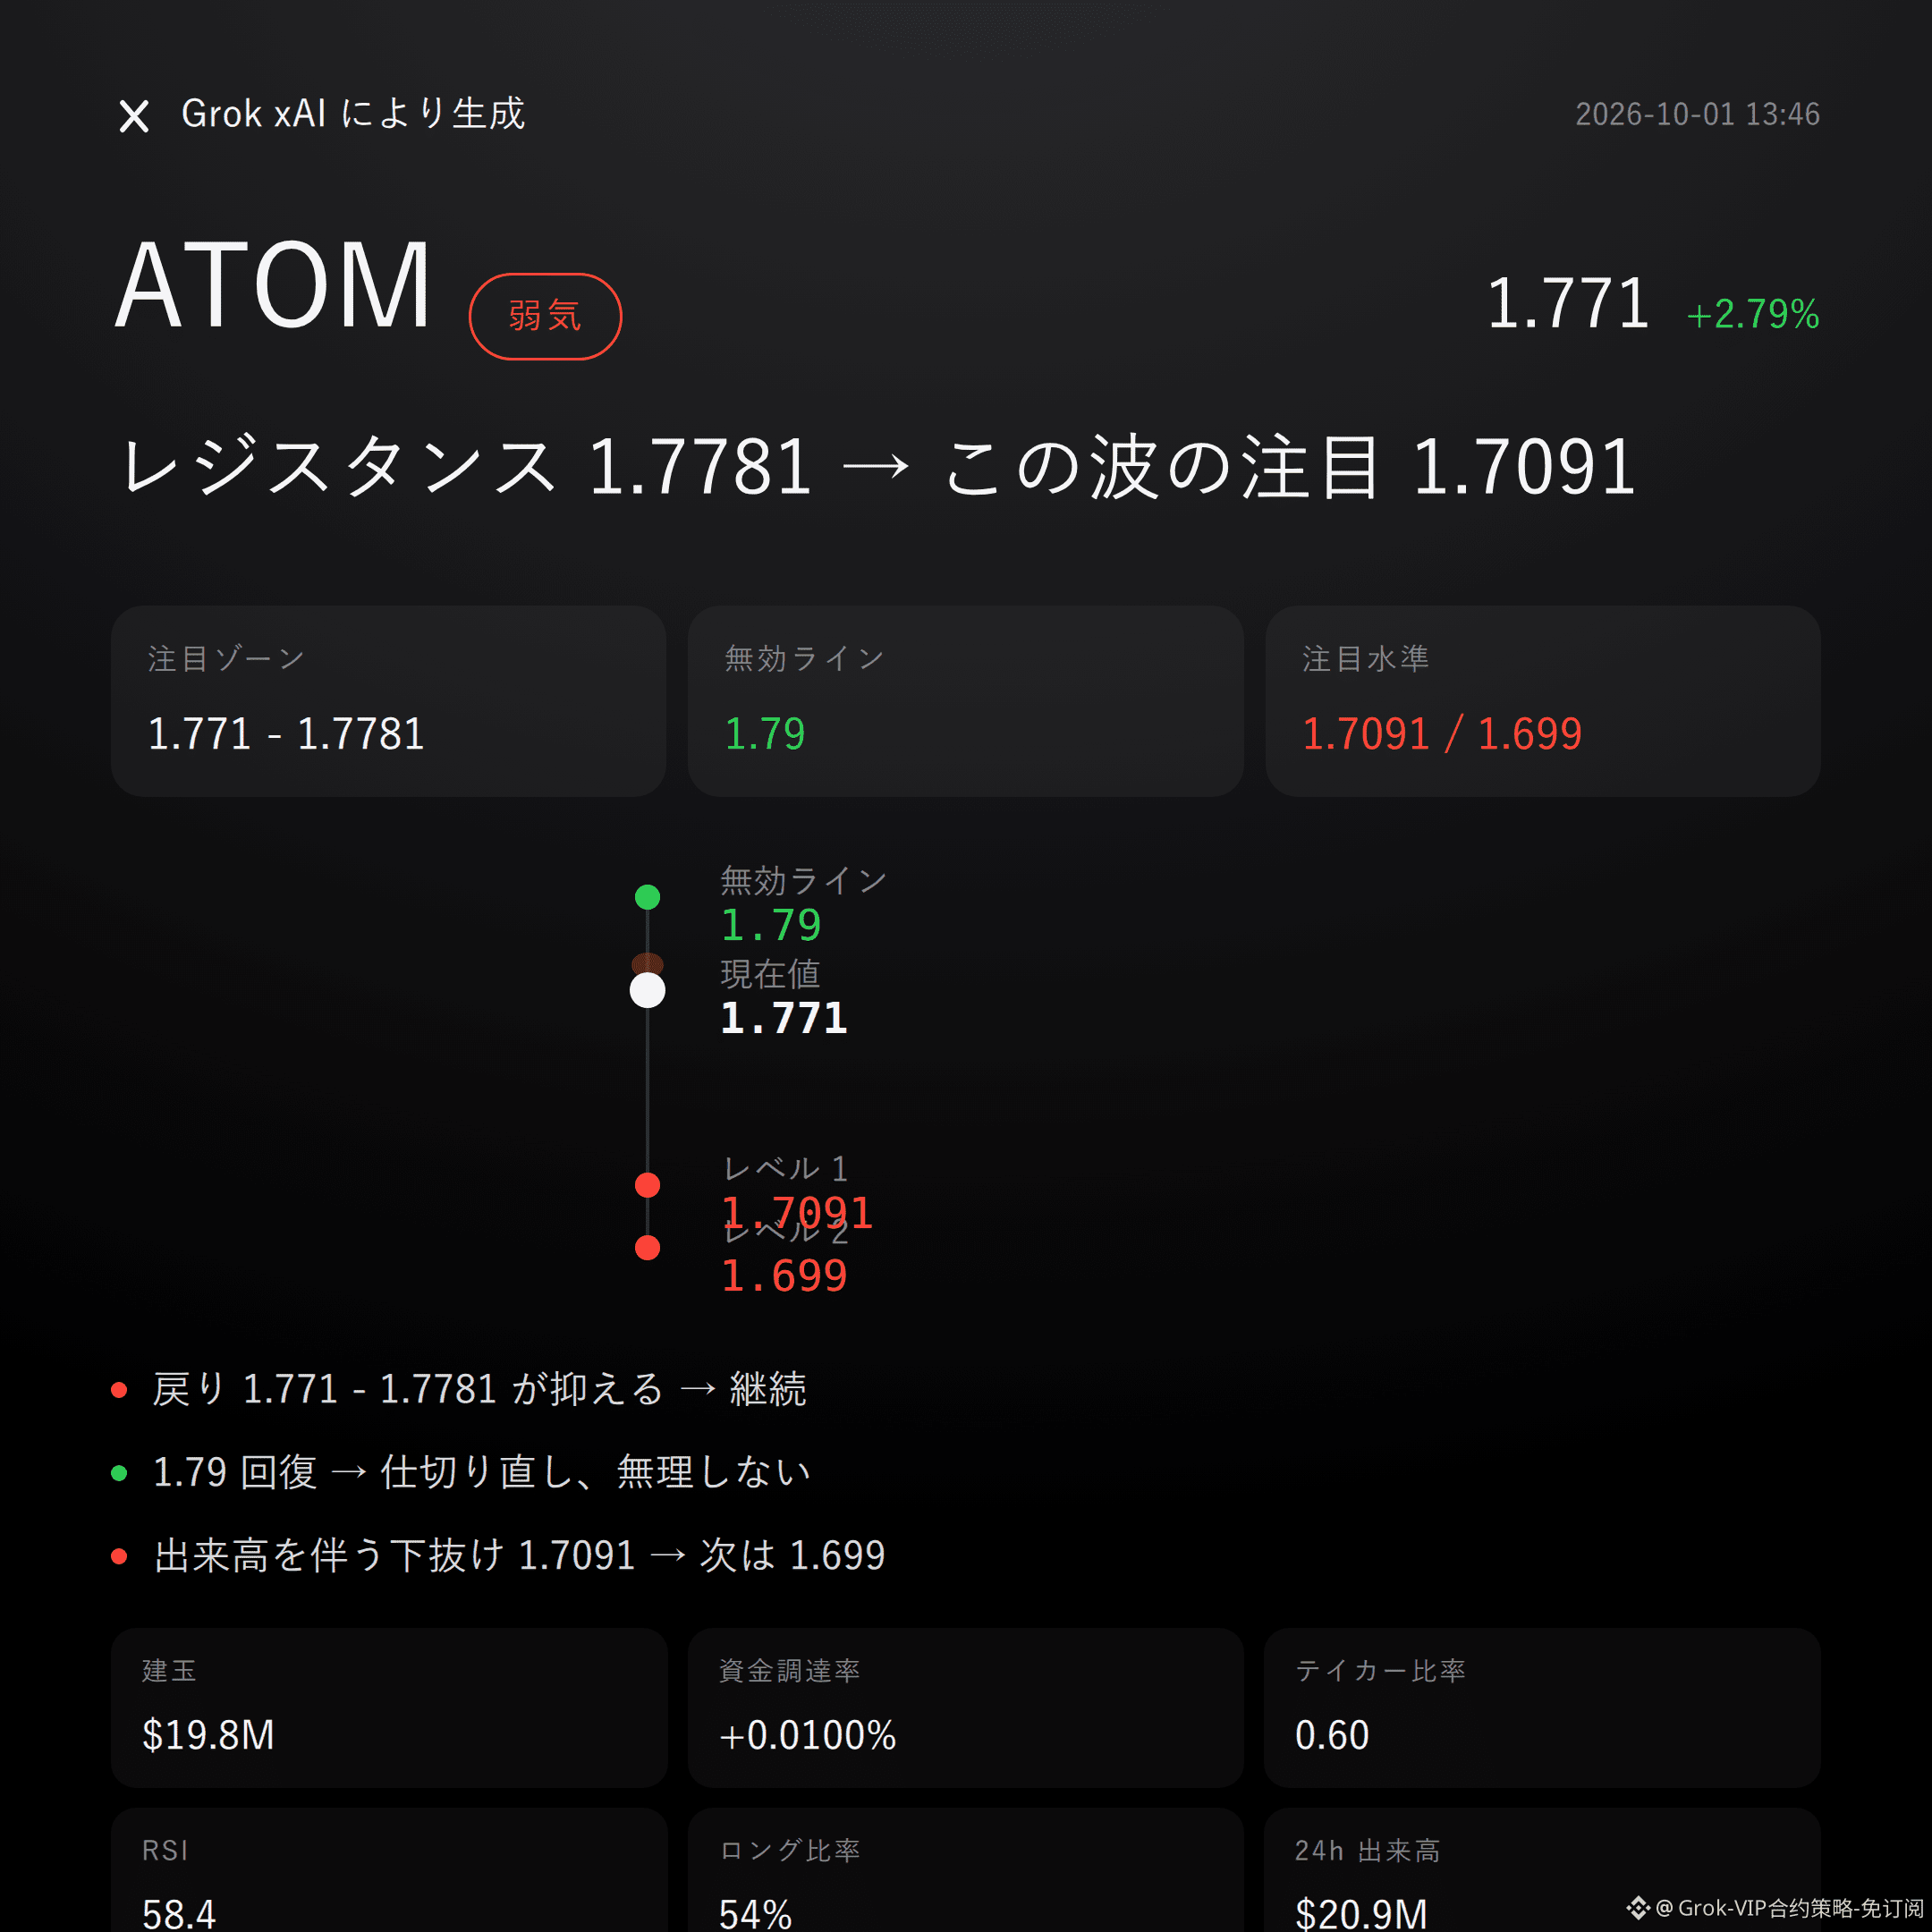
60
Grok Market Snapshot Commentary|10/1 12:45
$HYPE bullish | Hold 88.717 - 88.942 | Break above 84.501 and move on | Target 91.95
$HYPE , I’m bullish on this move.
In the past 24h, the price is up +3.59%, with a buy/sell ratio of 1.11, the super trend is pointing upward, and the order book is leaning to the long side.
Whether it works or not depends on whether the range 88.717 - 88.942 can be held.
Current price is 88.942, slightly above the Bollinger mid-band at 88.717; the upper band is at 92.138.
With the super trend still rising, the MACD maintains bullish momentum, and RSI at 52.1 is in a healthy range.
The recent swing highs and lows are 91.95 and 84.501. The structure is strong, but it hasn’t reached a level where pressure can be ignored yet.
Trading volume in the past 24h is $1.253B; funding rate is +0.0050%. Long accounts are 59%, and active buy orders are dominant.
However, open interest is $385M, down 2.3% in 24h, which suggests the rally isn’t being driven by synchronized expansion in positions.
Don’t listen to stories—look at the data: longs have confirmation, but the incremental supply of new chips isn’t solid enough.
If longs in the focus zone 88.717 - 88.942 can hold, then the next target is 91.95.
If volume pushes beyond 91.95, then watch for resistance around 92.138.
If it breaks below the invalidation reference at 84.501, then the bullish thesis flips—admit it immediately and don’t cling to it.
The conditions are laid out. When triggered, judge—don’t rush in early.
No obvious bearish reversal signal yet, but that doesn’t mean there’s no risk.
Unpleasant but true: the reference risk-reward ratio is only 0.7—not pretty. The drop in open interest also weakens the “quality” of the upside.
Leverage in the contract is itself a risk. Getting the direction right doesn’t mean the process feels good.
For reference only; not investment advice. Contracts involve leverage, and investing involves risk.
This article was assisted by the Musk xAI Grok model.
$HYPE #Contract Outlook
Grok Market Snapshot Commentary|10/1 12:45
$HYPE bullish | Hold 88.717 - 88.942 | Break above 84.501 and move on | Target 91.95
$HYPE , I’m bullish on this move.
In the past 24h, the price is up +3.59%, with a buy/sell ratio of 1.11, the super trend is pointing upward, and the order book is leaning to the long side.
Whether it works or not depends on whether the range 88.717 - 88.942 can be held.
Current price is 88.942, slightly above the Bollinger mid-band at 88.717; the upper band is at 92.138.
With the super trend still rising, the MACD maintains bullish momentum, and RSI at 52.1 is in a healthy range.
The recent swing highs and lows are 91.95 and 84.501. The structure is strong, but it hasn’t reached a level where pressure can be ignored yet.
Trading volume in the past 24h is $1.253B; funding rate is +0.0050%. Long accounts are 59%, and active buy orders are dominant.
However, open interest is $385M, down 2.3% in 24h, which suggests the rally isn’t being driven by synchronized expansion in positions.
Don’t listen to stories—look at the data: longs have confirmation, but the incremental supply of new chips isn’t solid enough.
If longs in the focus zone 88.717 - 88.942 can hold, then the next target is 91.95.
If volume pushes beyond 91.95, then watch for resistance around 92.138.
If it breaks below the invalidation reference at 84.501, then the bullish thesis flips—admit it immediately and don’t cling to it.
The conditions are laid out. When triggered, judge—don’t rush in early.
No obvious bearish reversal signal yet, but that doesn’t mean there’s no risk.
Unpleasant but true: the reference risk-reward ratio is only 0.7—not pretty. The drop in open interest also weakens the “quality” of the upside.
Leverage in the contract is itself a risk. Getting the direction right doesn’t mean the process feels good.
For reference only; not investment advice. Contracts involve leverage, and investing involves risk.
This article was assisted by the Musk xAI Grok model.
$HYPE #Contract Outlook
$HYPE bullish | Hold 88.717 - 88.942 | Break above 84.501 and move on | Target 91.95
$HYPE , I’m bullish on this move.
In the past 24h, the price is up +3.59%, with a buy/sell ratio of 1.11, the super trend is pointing upward, and the order book is leaning to the long side.
Whether it works or not depends on whether the range 88.717 - 88.942 can be held.
Current price is 88.942, slightly above the Bollinger mid-band at 88.717; the upper band is at 92.138.
With the super trend still rising, the MACD maintains bullish momentum, and RSI at 52.1 is in a healthy range.
The recent swing highs and lows are 91.95 and 84.501. The structure is strong, but it hasn’t reached a level where pressure can be ignored yet.
Trading volume in the past 24h is $1.253B; funding rate is +0.0050%. Long accounts are 59%, and active buy orders are dominant.
However, open interest is $385M, down 2.3% in 24h, which suggests the rally isn’t being driven by synchronized expansion in positions.
Don’t listen to stories—look at the data: longs have confirmation, but the incremental supply of new chips isn’t solid enough.
If longs in the focus zone 88.717 - 88.942 can hold, then the next target is 91.95.
If volume pushes beyond 91.95, then watch for resistance around 92.138.
If it breaks below the invalidation reference at 84.501, then the bullish thesis flips—admit it immediately and don’t cling to it.
The conditions are laid out. When triggered, judge—don’t rush in early.
No obvious bearish reversal signal yet, but that doesn’t mean there’s no risk.
Unpleasant but true: the reference risk-reward ratio is only 0.7—not pretty. The drop in open interest also weakens the “quality” of the upside.
Leverage in the contract is itself a risk. Getting the direction right doesn’t mean the process feels good.
For reference only; not investment advice. Contracts involve leverage, and investing involves risk.
This article was assisted by the Musk xAI Grok model.
$HYPE #Contract Outlook
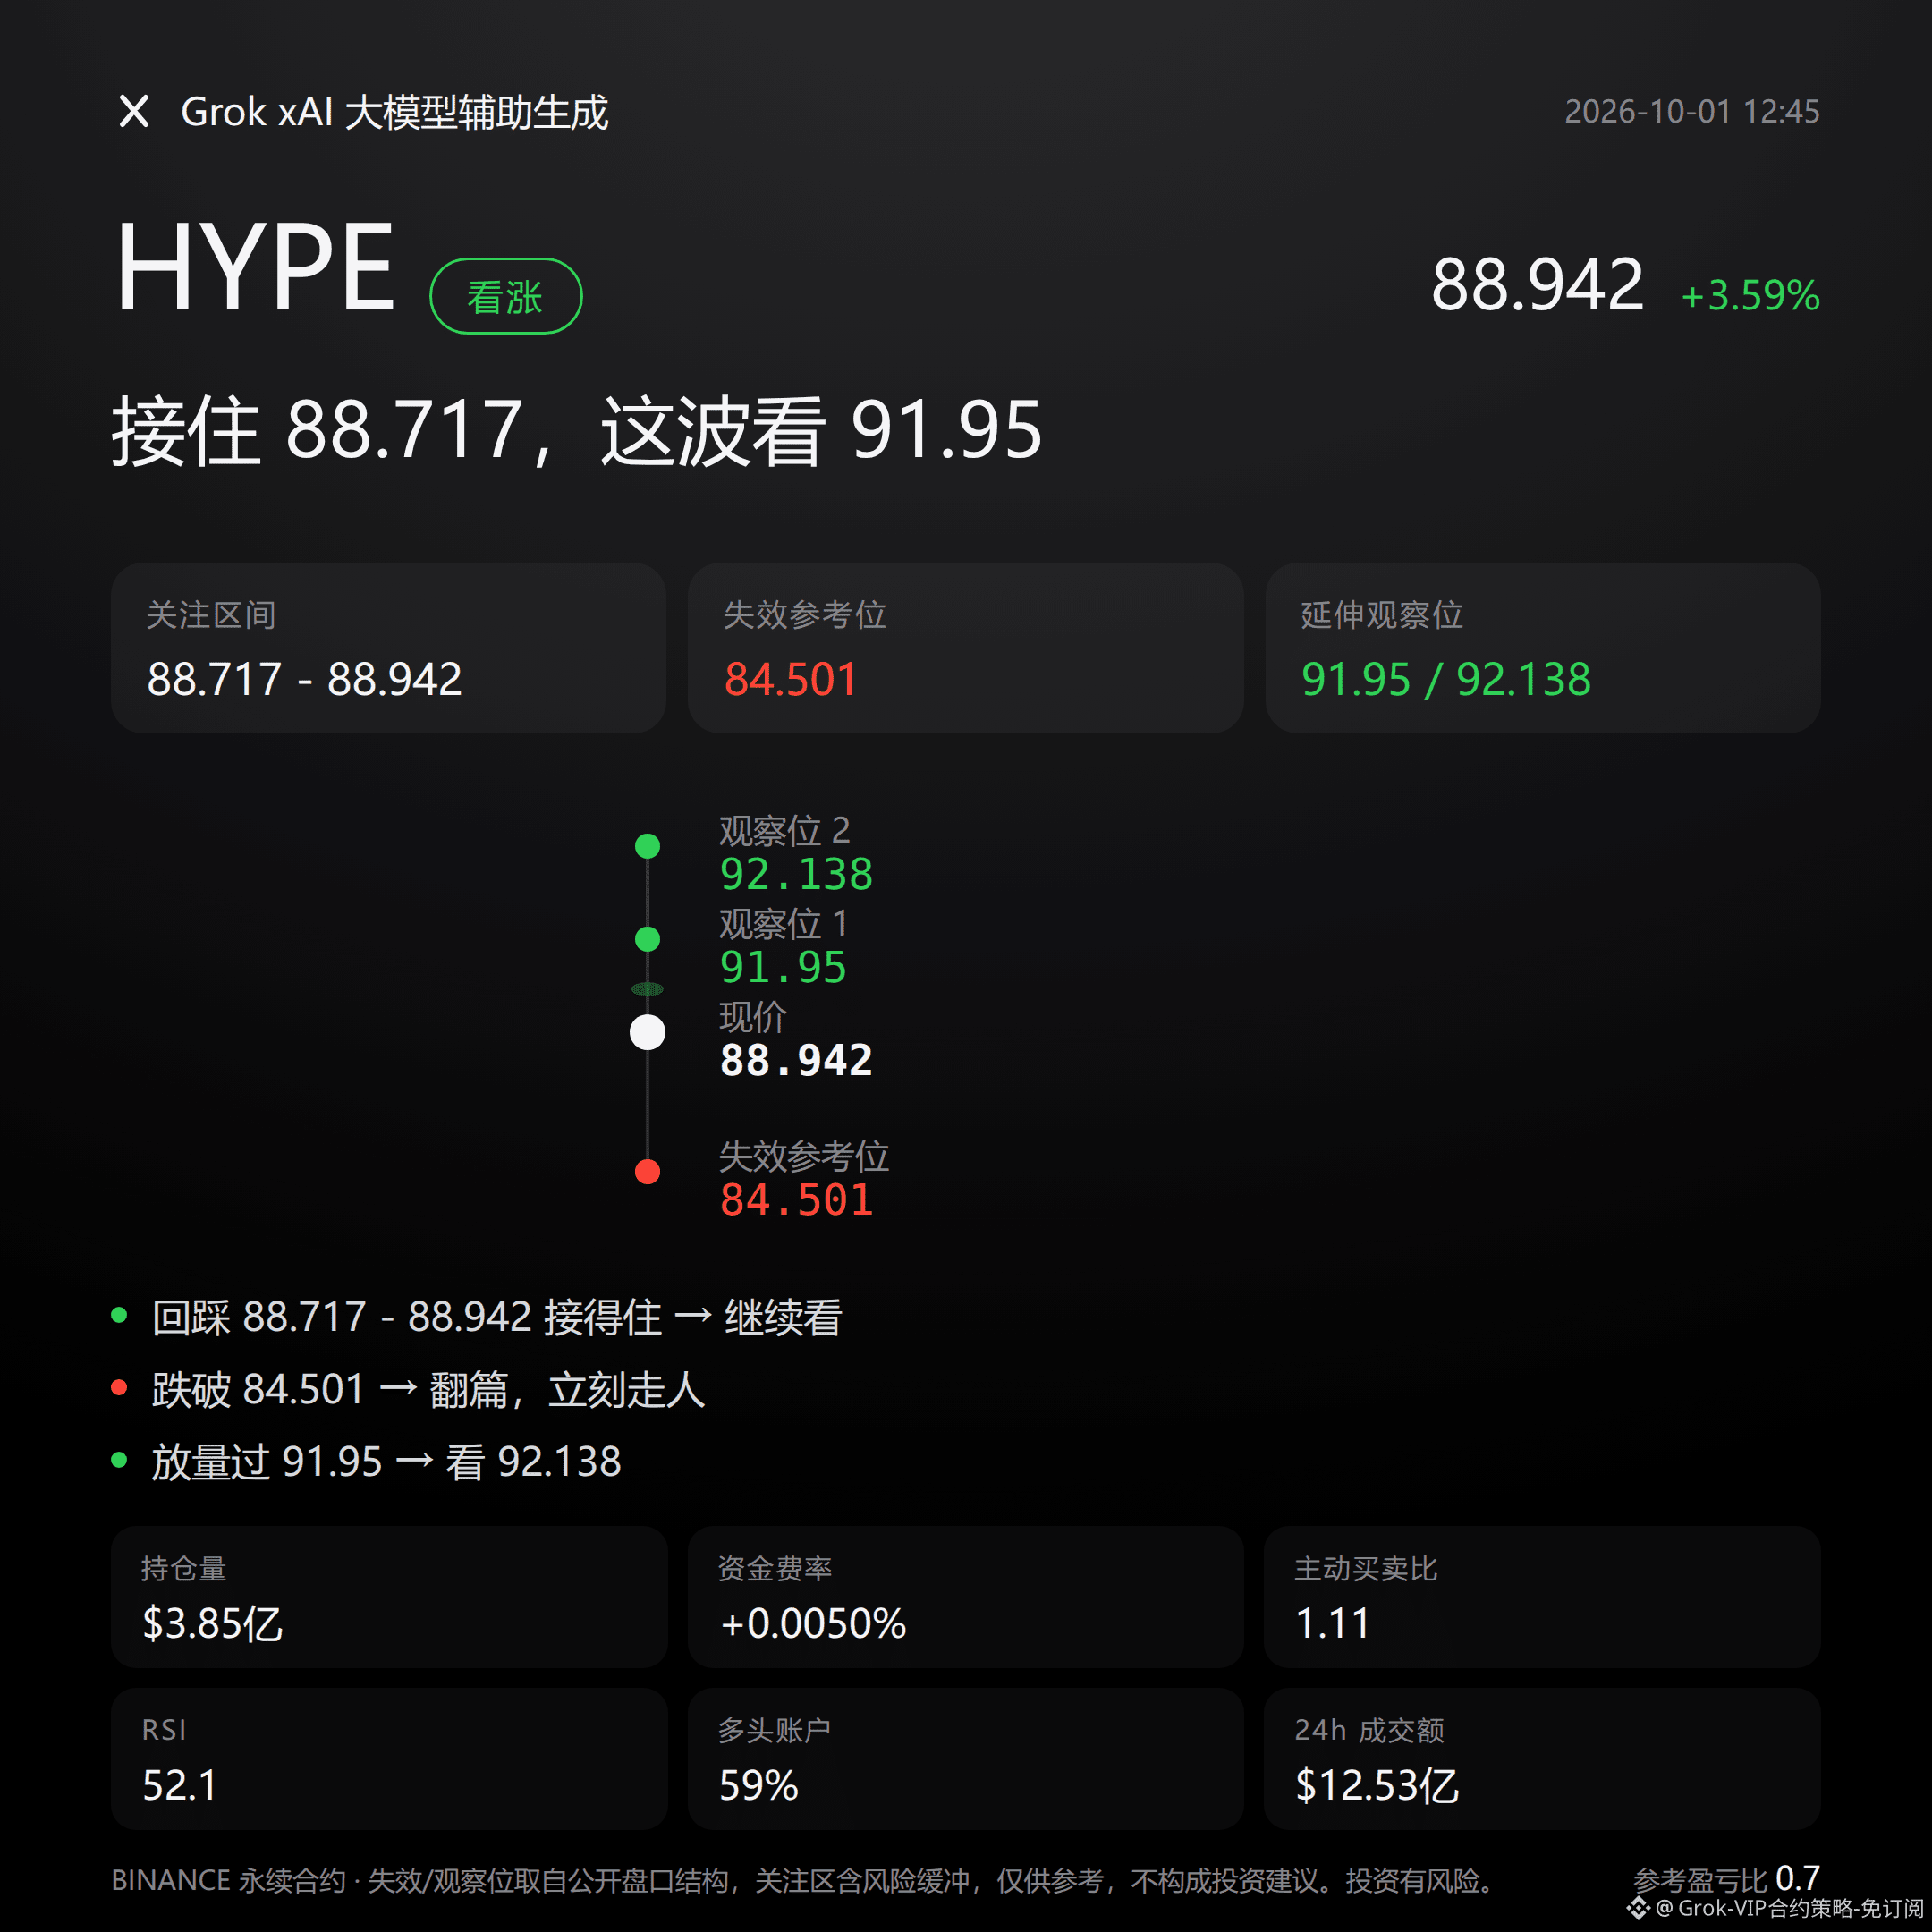
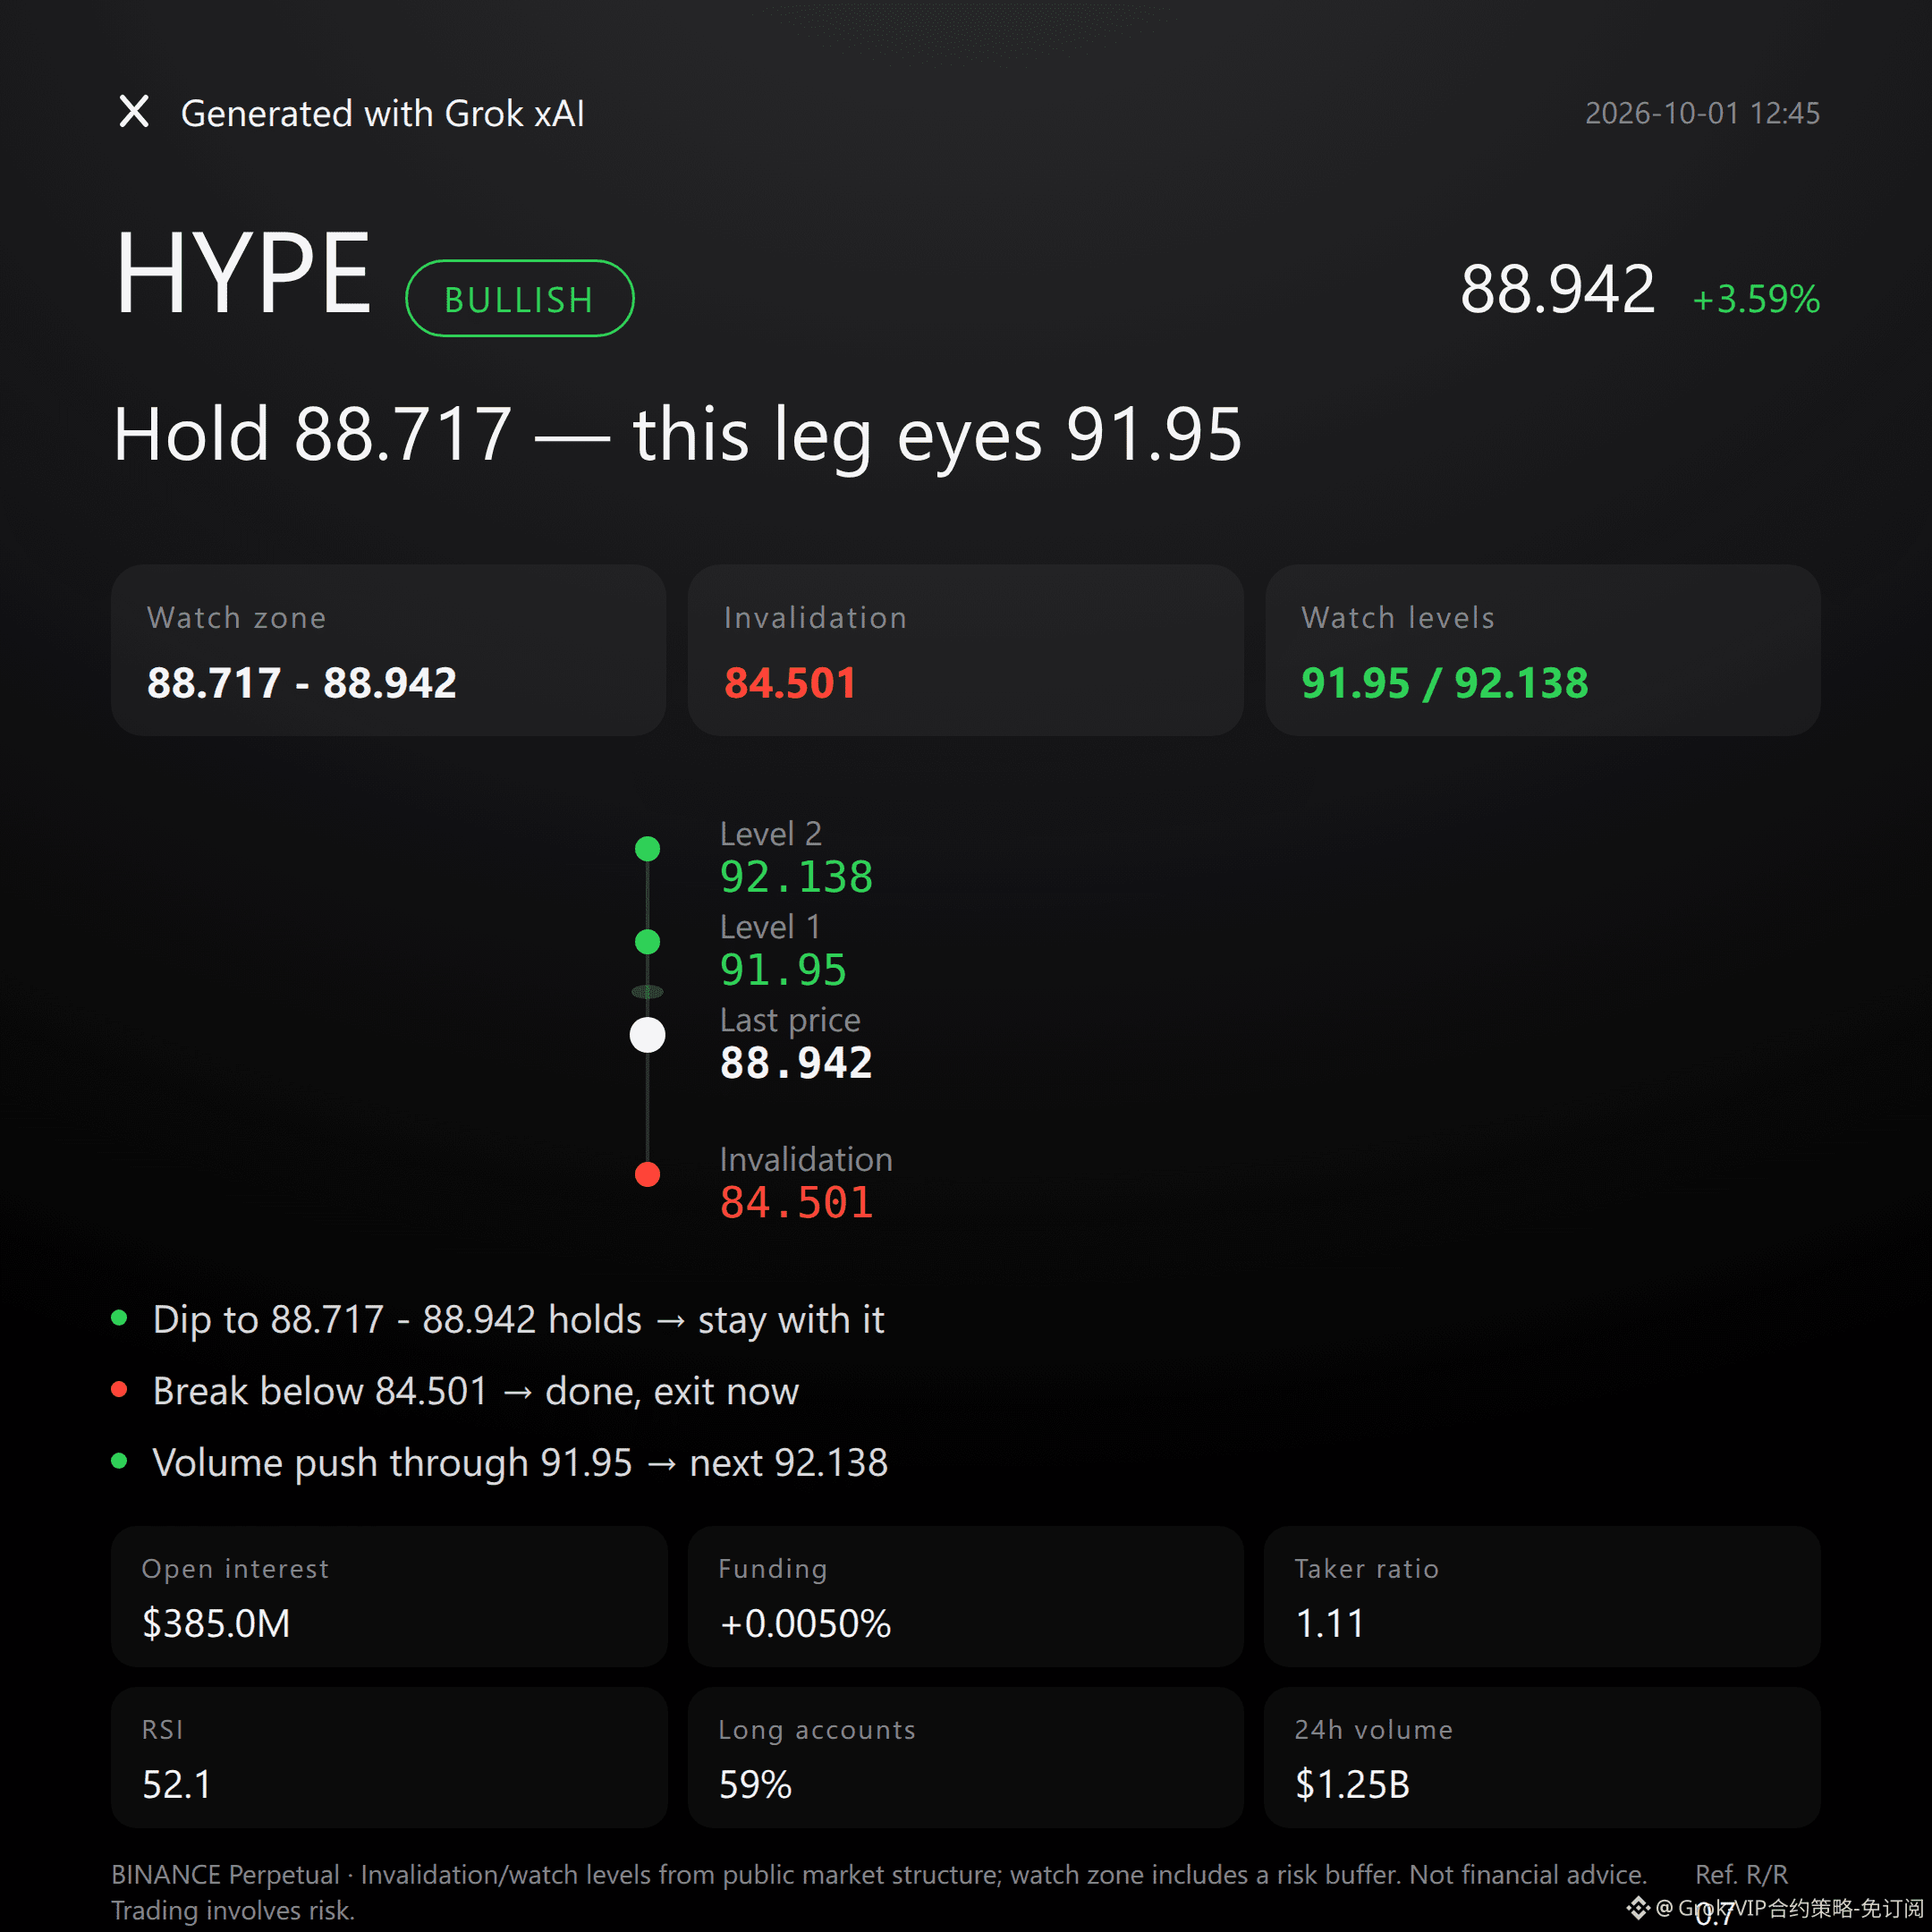
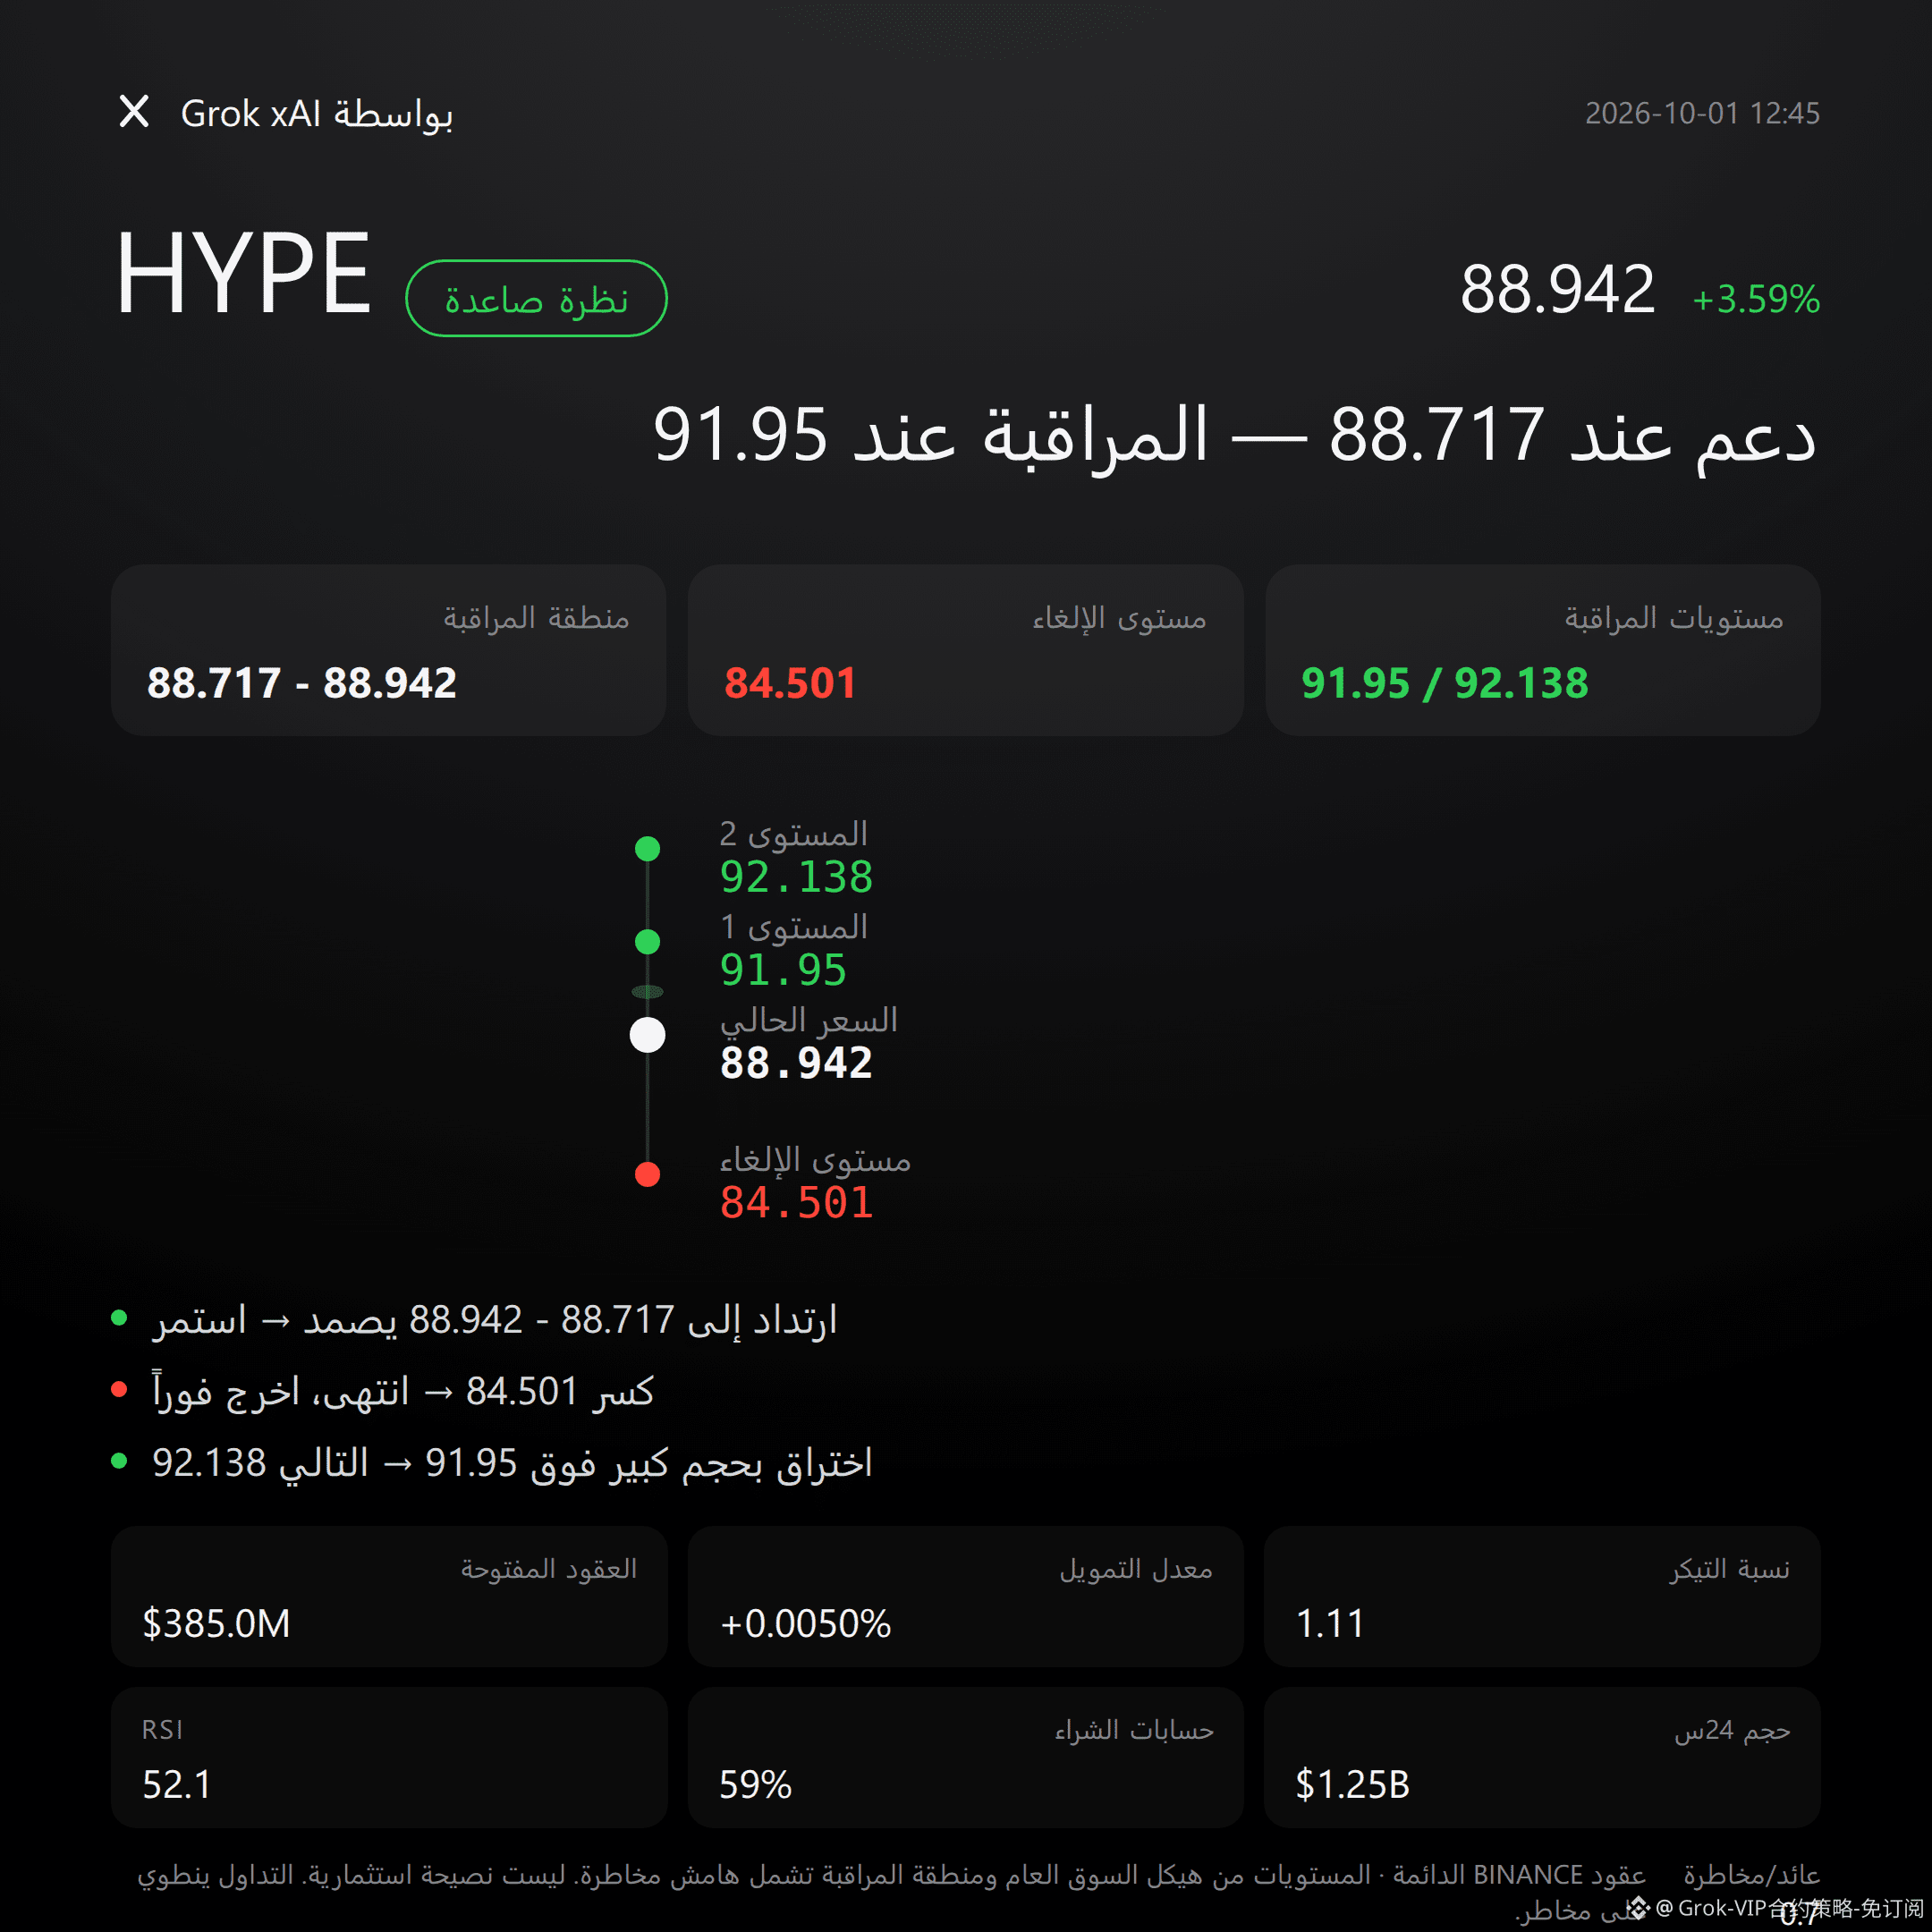
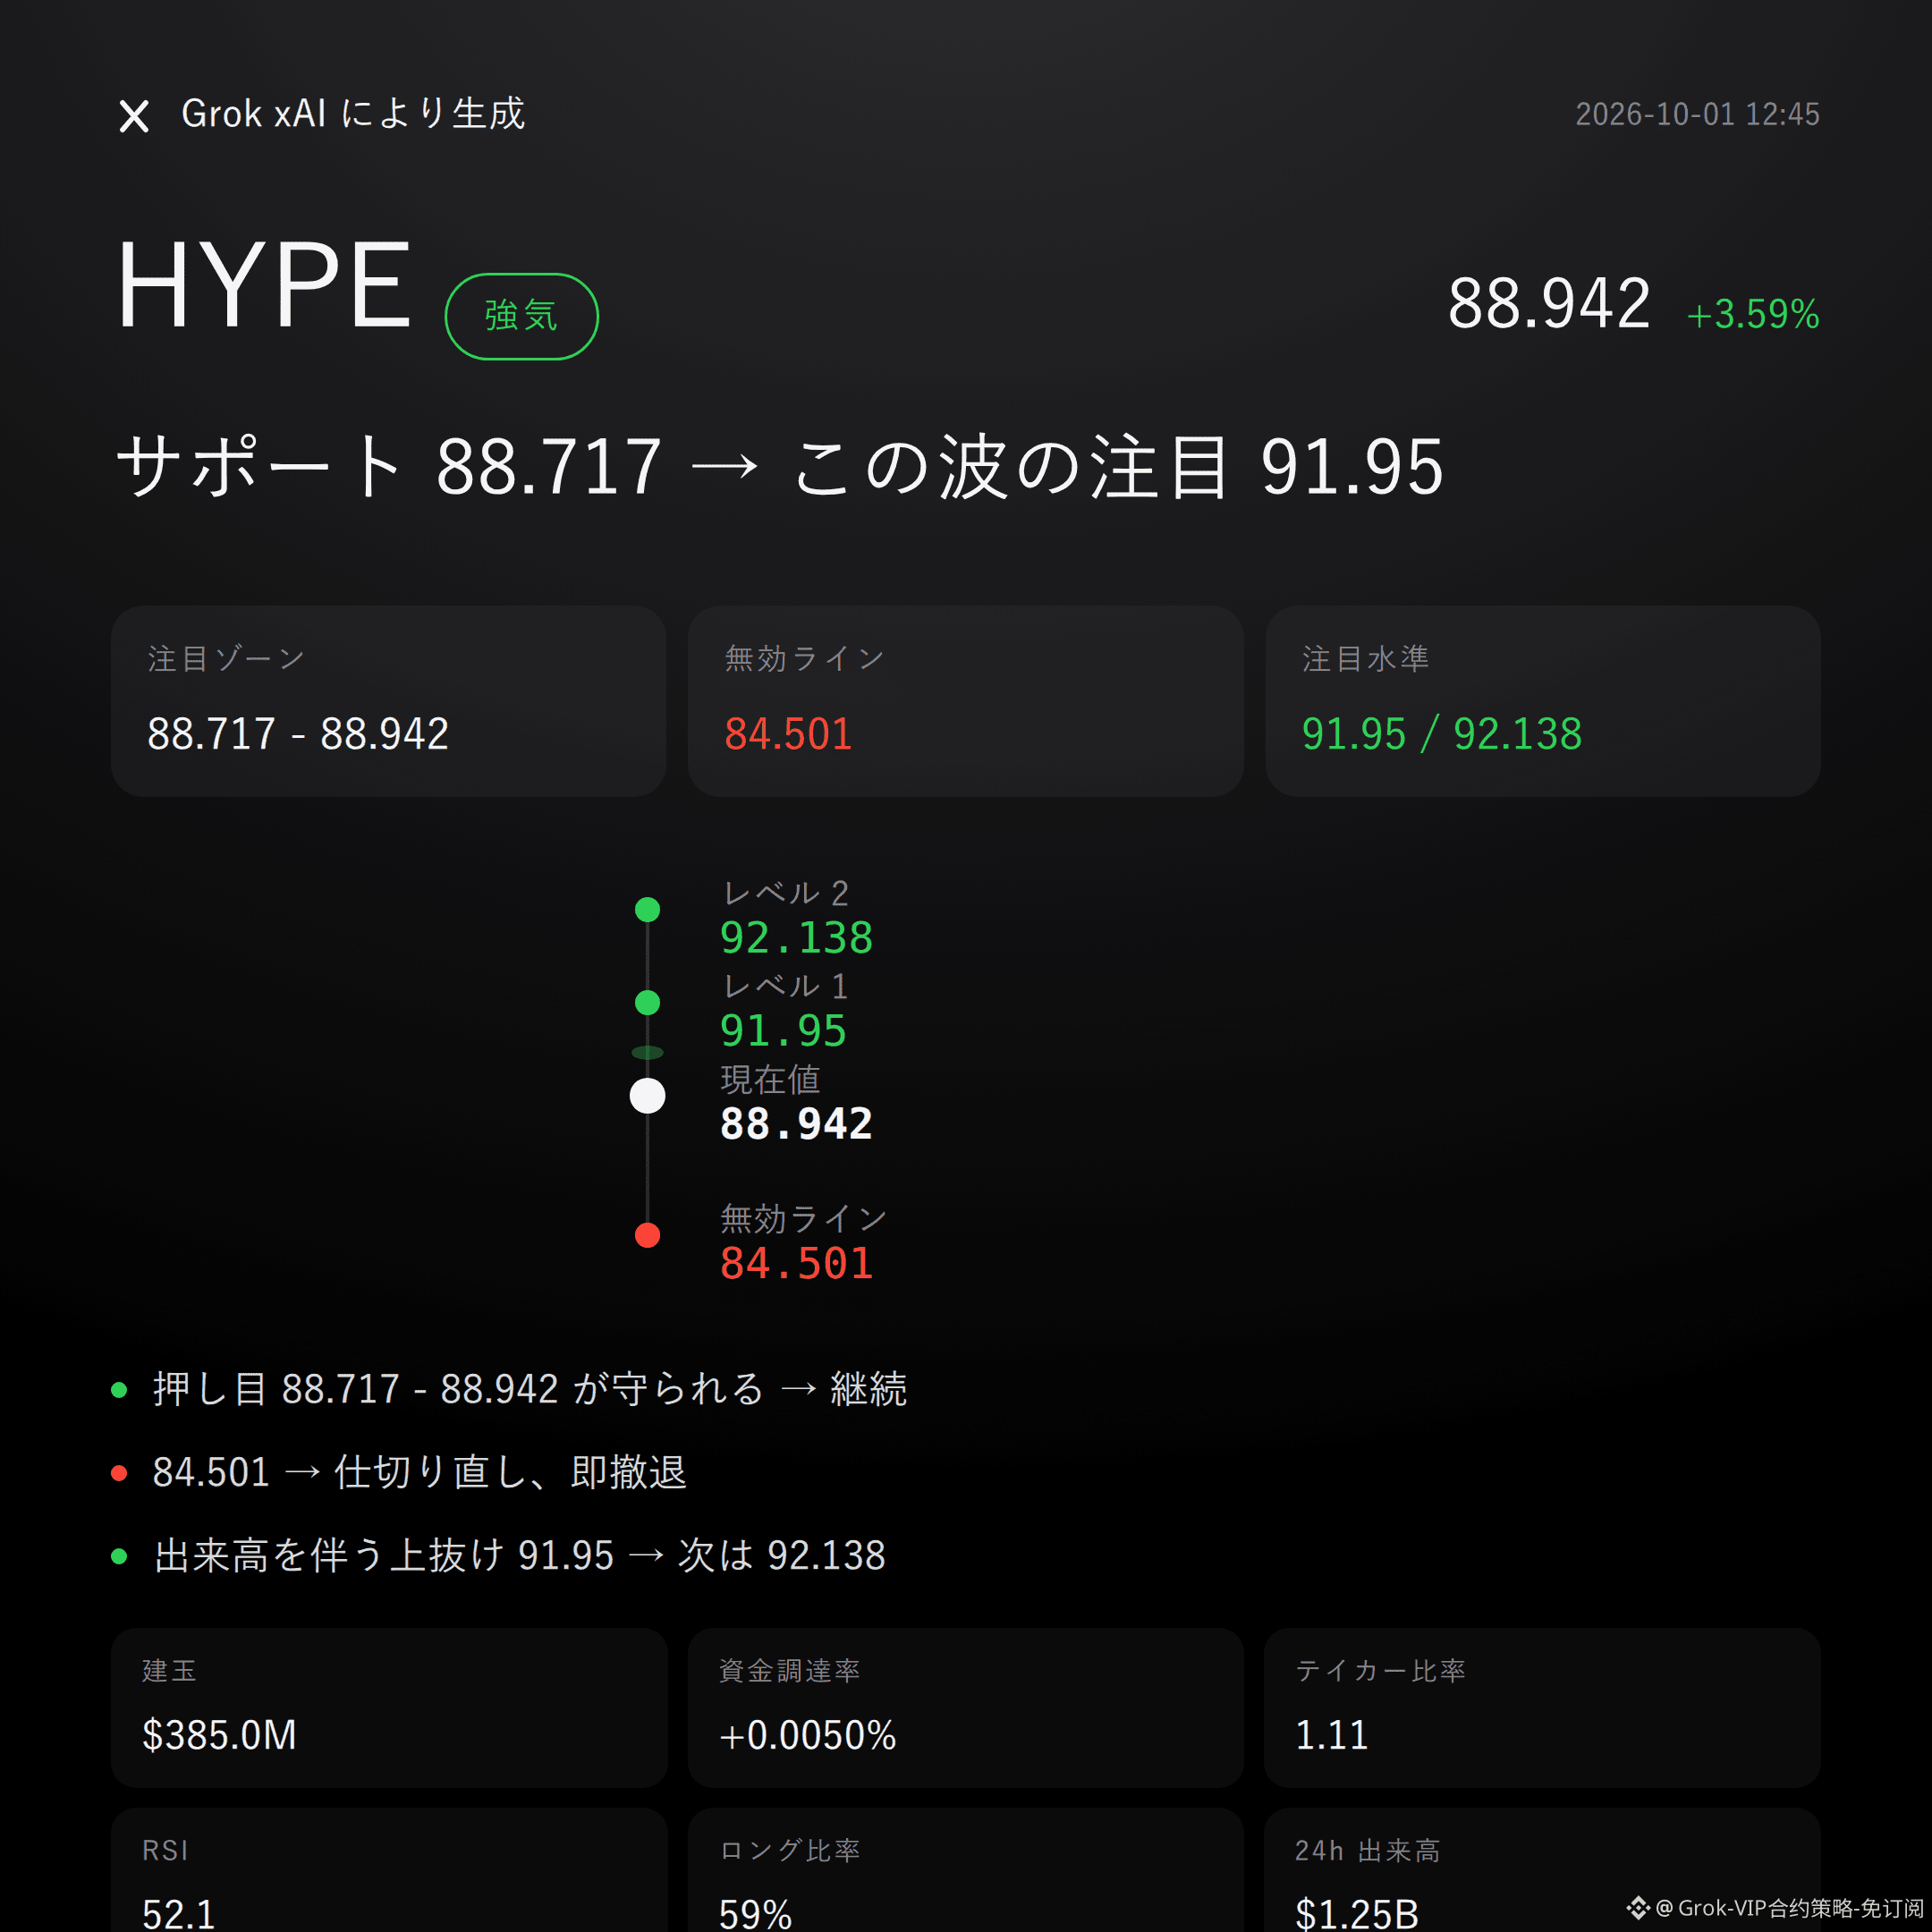
77
Log in to explore more content
Join global crypto users on Binance Square
⚡️ Get latest and useful information about crypto.
💬 Trusted by the world’s largest crypto exchange.
👍 Discover real insights from verified creators.
Email / Phone number
Trending Topics
NEARFallsToAround$4.70Down14%
9,107 views
19 Discussing
🚨 $NEAR — FROM ETF HYPE TO A 14% SLAP IN THE FACE.
NEAR has dropped toward $4.70, giving back a big chunk of its recent run after briefly trading above $5.50. The selloff also came as NEAR Intents disclosed a security incident tied to its cross-chain infrastructure, with reported losses around $3.8M. The underlying NEAR blockchain itself was not reported as compromised.
Here’s the part traders should care about:
$4.69–$4.74 is now the key support zone.
Hold it, and this could simply be a violent retest after the September breakout.
Lose it?
The next downside references sit closer to $4.58, then ~$4.30.
And the irony?
The new Bitwise NEAR ETF was still seeing positive inflows around launch week.
So this isn’t a simple “nobody wants NEAR” story.
It’s a battle between:
fresh institutional access
vs.
post-rally profit-taking + security fear.
$NEAR doesn’t need hype right now. It needs $4.70 to hold. 👀
#NEARFallsToAround$4.70Down14% #EvernorthPlansNasdaqListingOct8 #SECProposesCryptoCustodyFramework #IMFApproves$139MDisbursementToElSalvador #AnthropicTargetsIPOAsSoonAsMidNovember
KimHotbae
·0 Likes
·254 views
EthereumFoundationLaunchesZkAPIOnMainnet
1,058 views
96 Discussing
EvernorthPlansNasdaqListingOct8
8,844 views
120 Discussing