
CryptoTraders.com
176 Posts

CryptoTraders.com
Home of Top Analysts, Elite Trade Alerts, Cutting-Edge Algorithms, and Powerful Scanners — all built to give you the edge in any market. Join & Activate your 14-day free trial now to see the results yourself!
0 Following
2 Followers
2 Liked
Posts
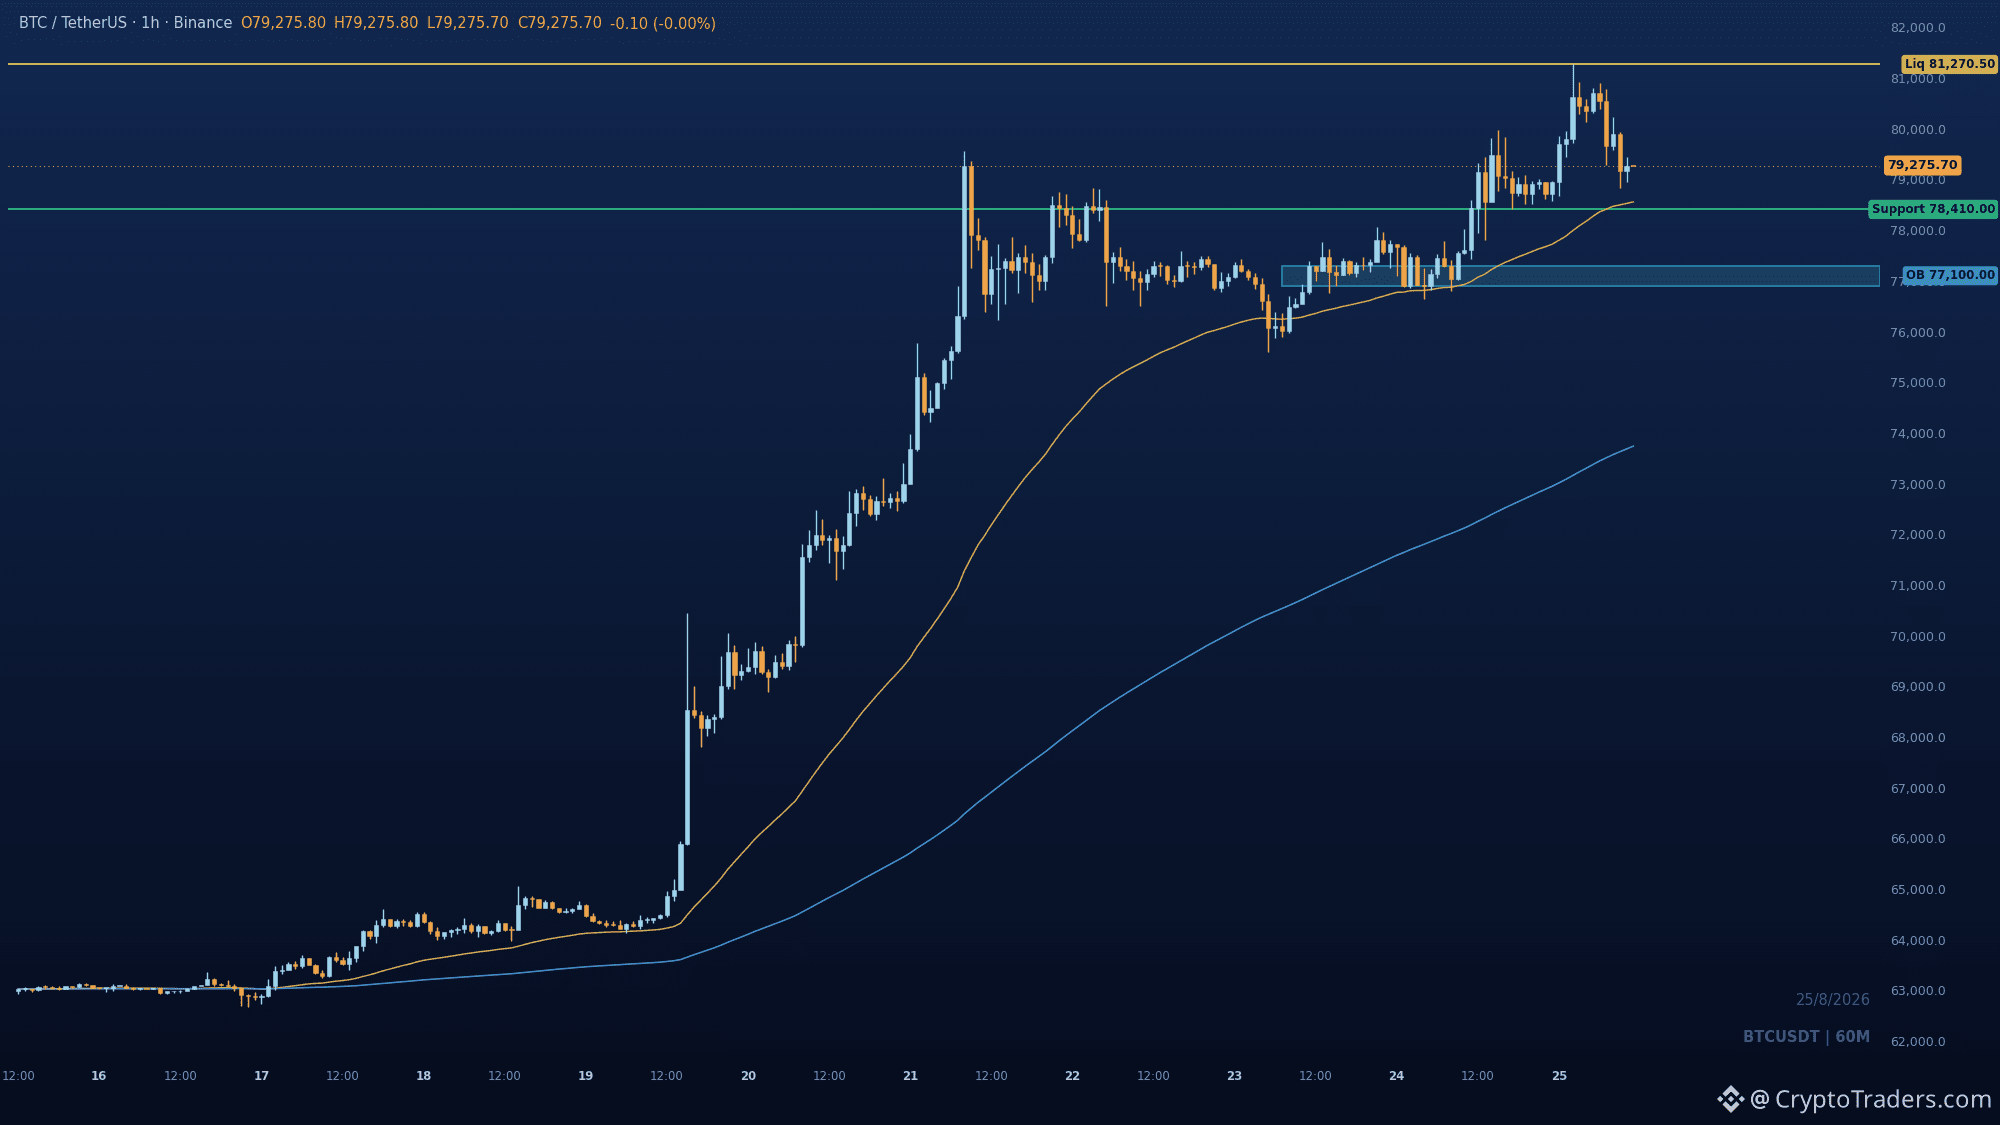
Either $BTC holds 78,410 and reloads for another run at 81,270.5, or that bid fails and the pullback deepens toward the 76,900-77,300 order block. The 1h chart shows a clean BOS into 81,270.5, then a repricing dip back into demand. Price is holding premium above the 50 EMA, and the 78,410-78,558 zone is the line in the sand. Holding that zone keeps buyers in control and sets up a raid on the buy-side liquidity above the recent high. A close below 78,410 shifts the bias to a deeper retracement. Would you trust the 78,410 bid on this pullback, or wait for a retest of the order block? More daily setups like this in the group, check my bio. #BTC Price Analysis# #Bitcoin Price Prediction: What is Bitcoins next move?#
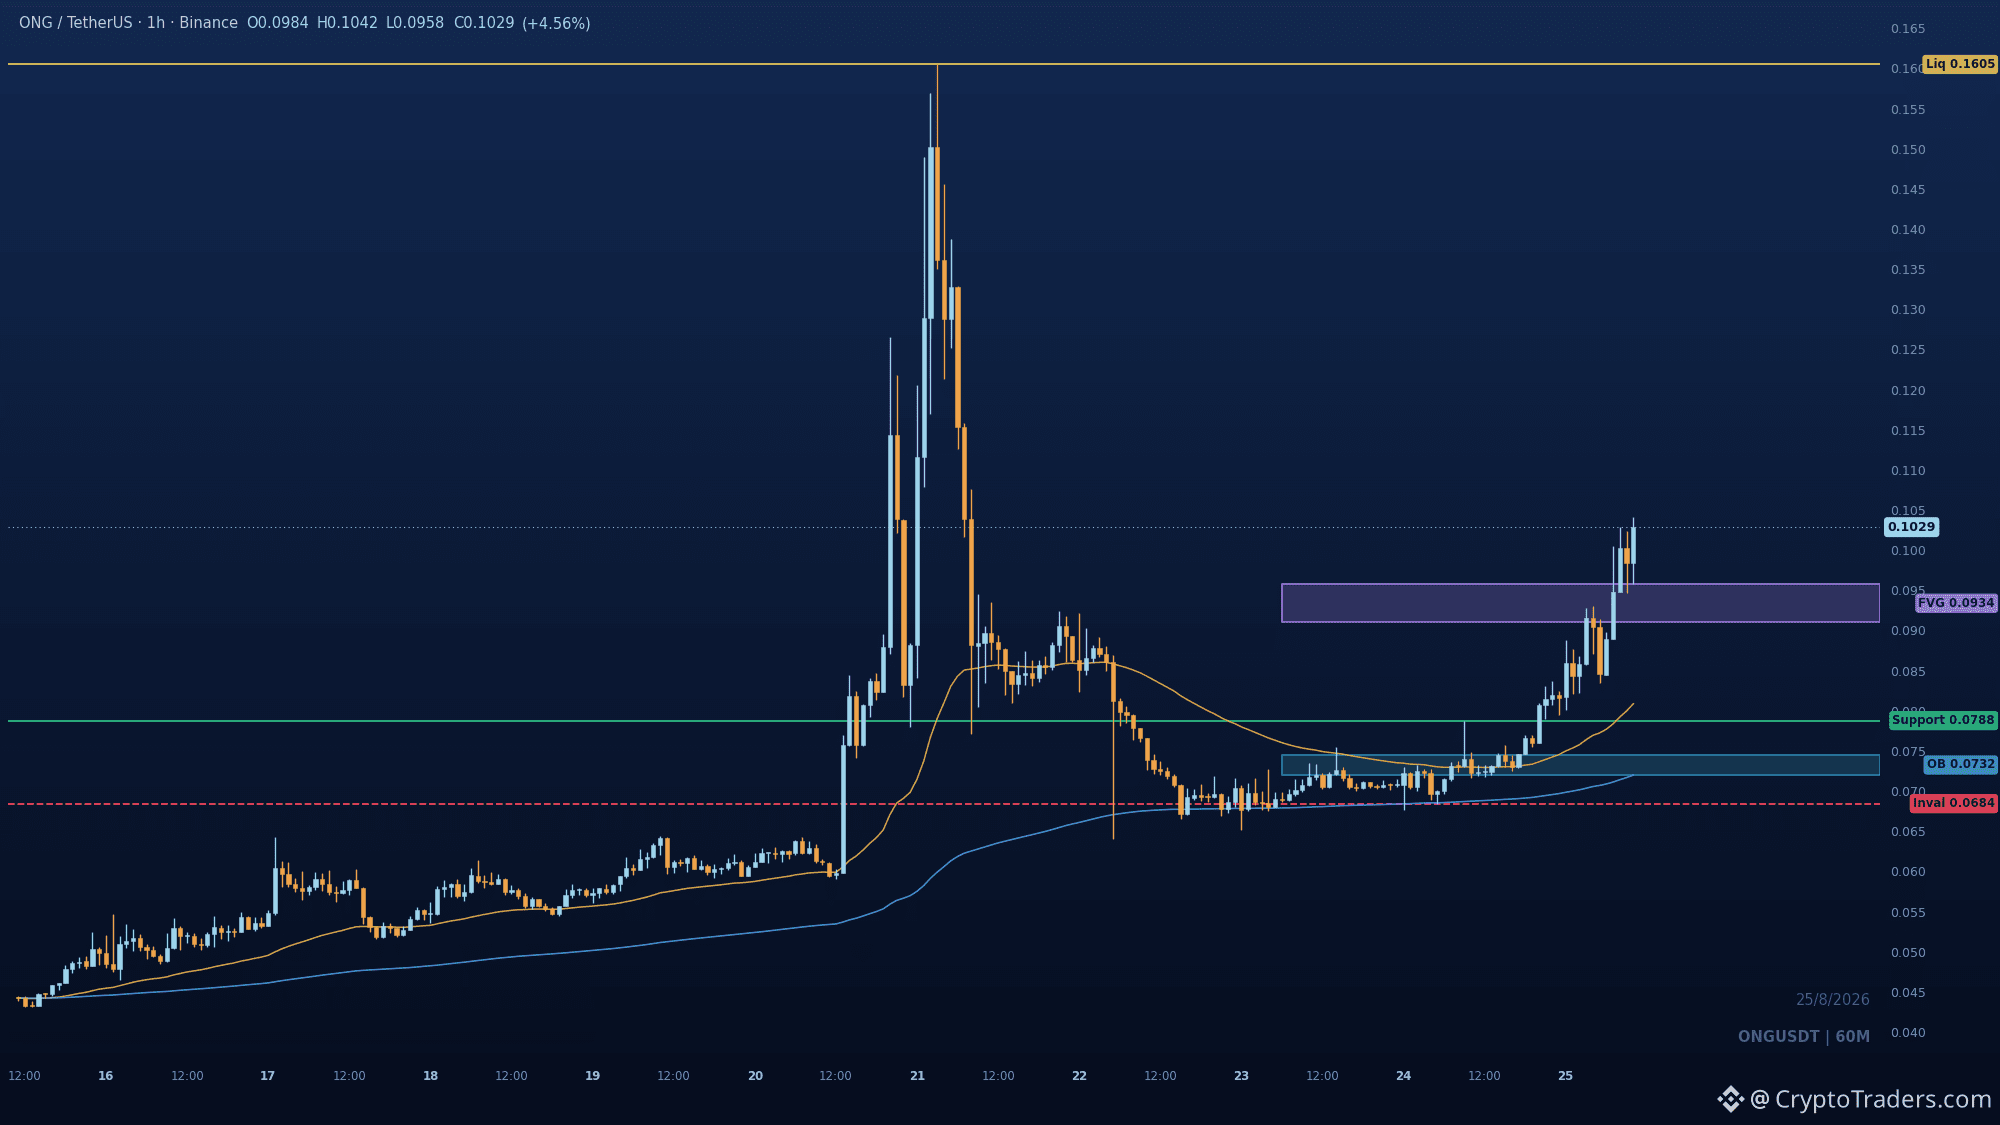
Either $ONG defends the 0.07878 breakout and rides the trend toward 0.1605, or the pullback deepens into the 0.091-0.0958 imbalance for bids. The 1h chart favors continuation. Smart money absorbed the 0.06844 base, reclaimed the EMA stack, and printed a clean BOS above 0.07878. Price is now in premium, with the broken swing acting as support. Watch the 0.0958-0.091 FVG as the first bid zone on any dip. A hold there keeps the path to 0.1605 liquidity open. Only a loss of 0.06844 invalidates the bullish structure. Where do you see the next bid if the pullback comes? This kind of breakdown is daily bread in our trading community. #Altcoin Season#
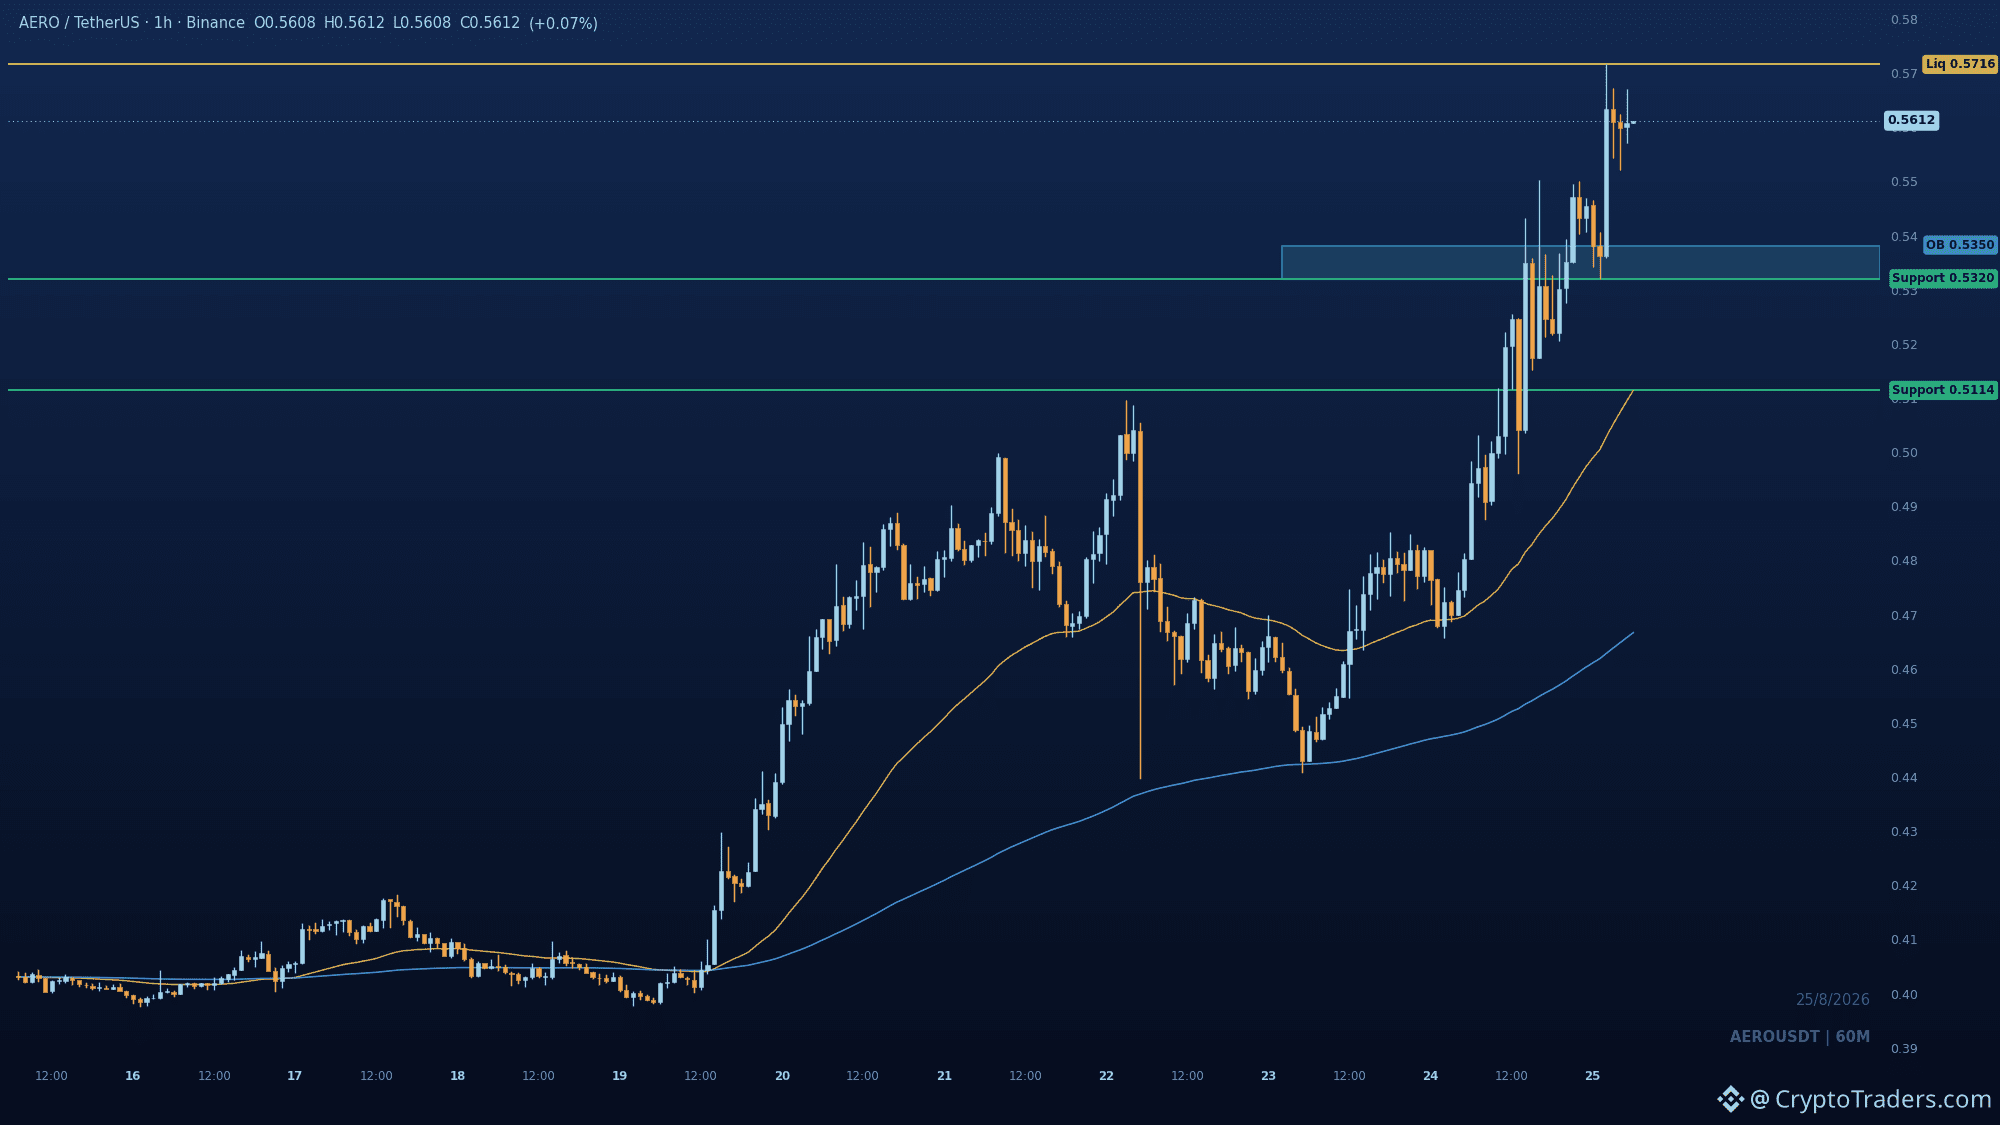
0.5716. That is the number $AERO just swept, and the 1h chart says the rally is not done until buyers defend the broken structure. The BOS into the range high printed fresh liquidity, and price is holding premium near the top. The real play is the retest of the 0.538-0.532 order block, where bids likely step in before continuation. Lose 0.532 and the 50 EMA at 0.5114 becomes the mean reversion target. Will the pullback hold that demand zone, or is this a sweep-and-dump? We post reads like this daily in the group, check the bio. #Altcoin Season#
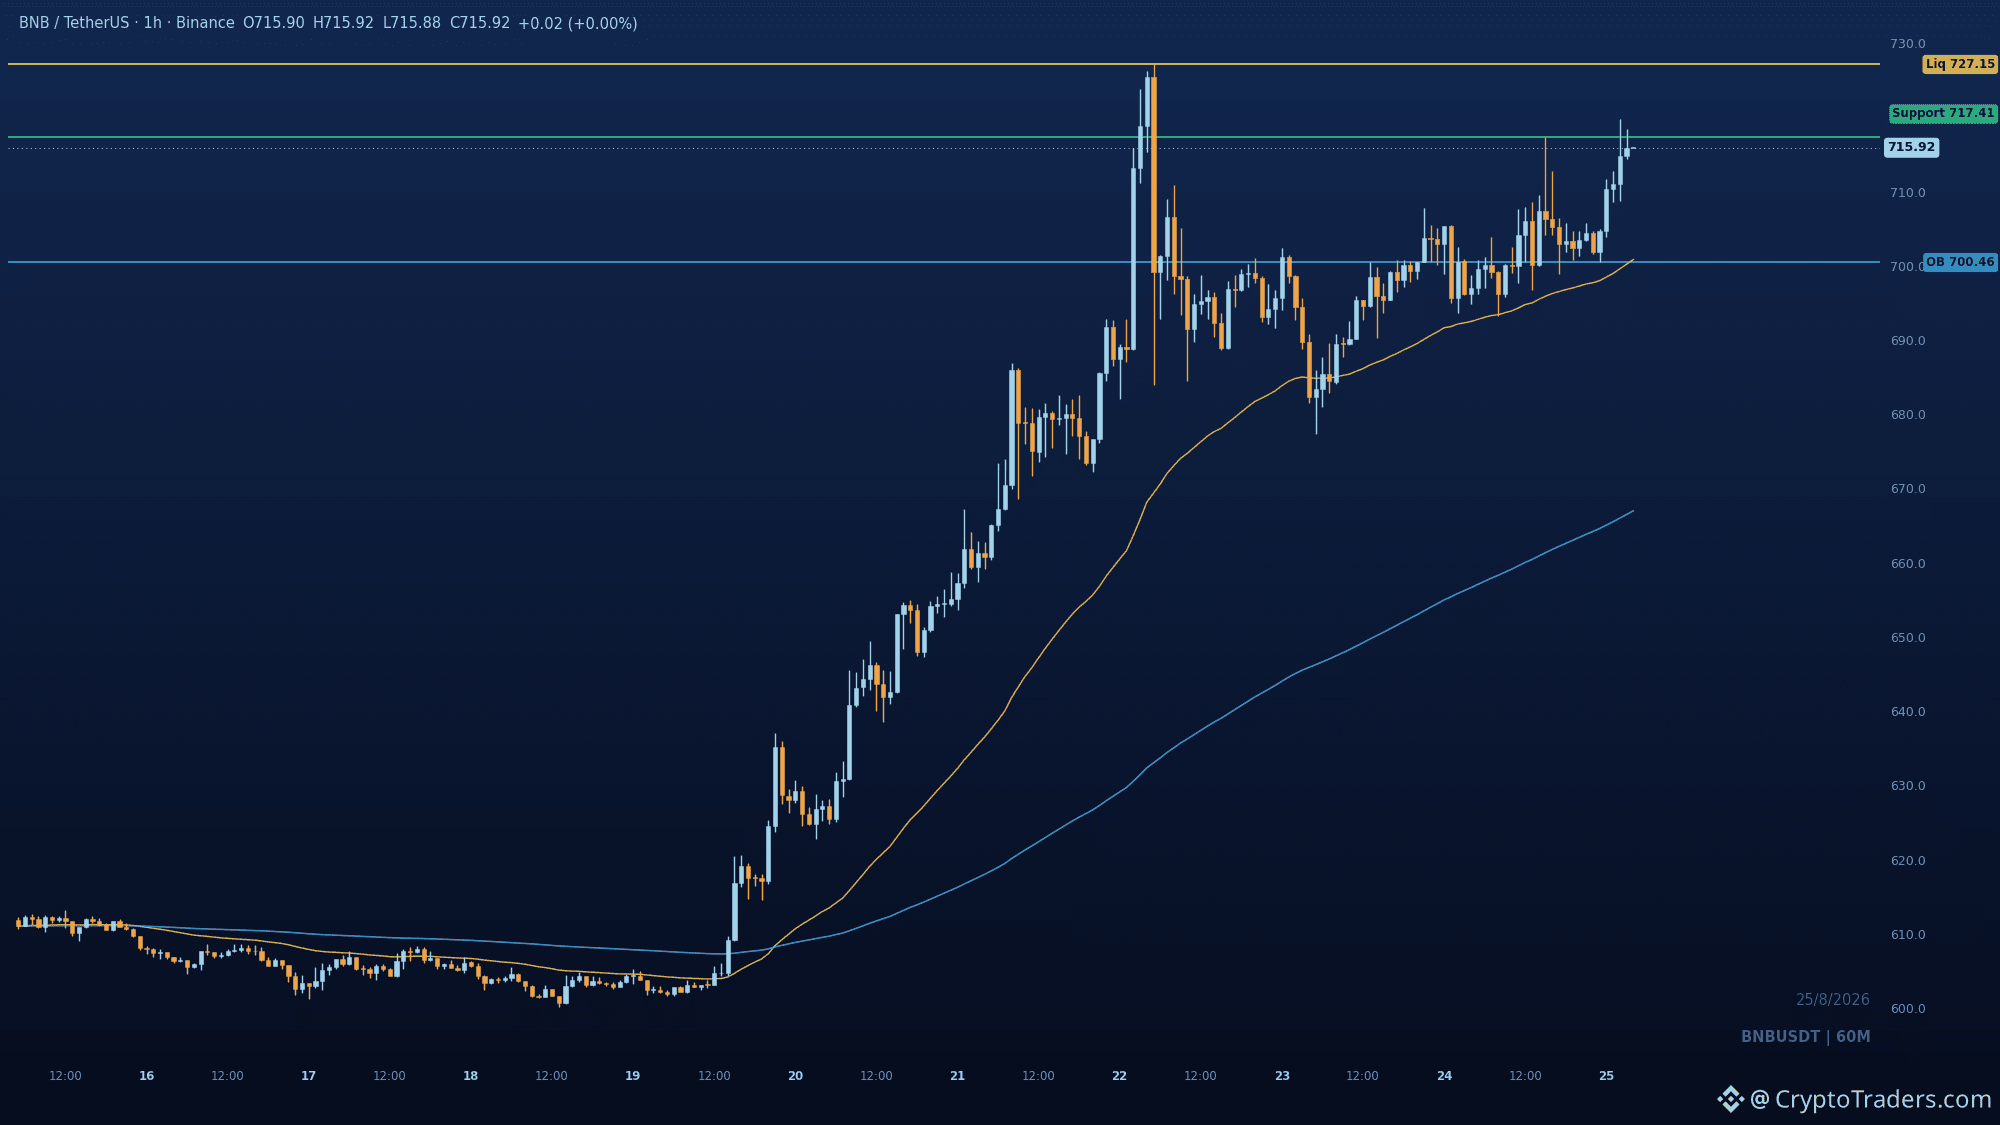
$BNB 's 24h climb to 715.50 just printed a fresh BOS through 717.41, and the 1h chart says the rally has legs toward 727.15. The move is riding premium near the top of the 600.18-727.15 range, with smart money absorbing the 700.46 dip and pressing back into upper-range liquidity. First target is the 727.15 buy-side high; the cleaner path is a defended retest of 717.41 or the 700.46-700.85 demand zone rather than chasing extension. Invalidation sits at 700.46, so a break below that flips the structure. Will BNB take out 727.15 on the first attempt? More daily chart analysis like this goes out in the group, check the bio. #Altcoin Season#
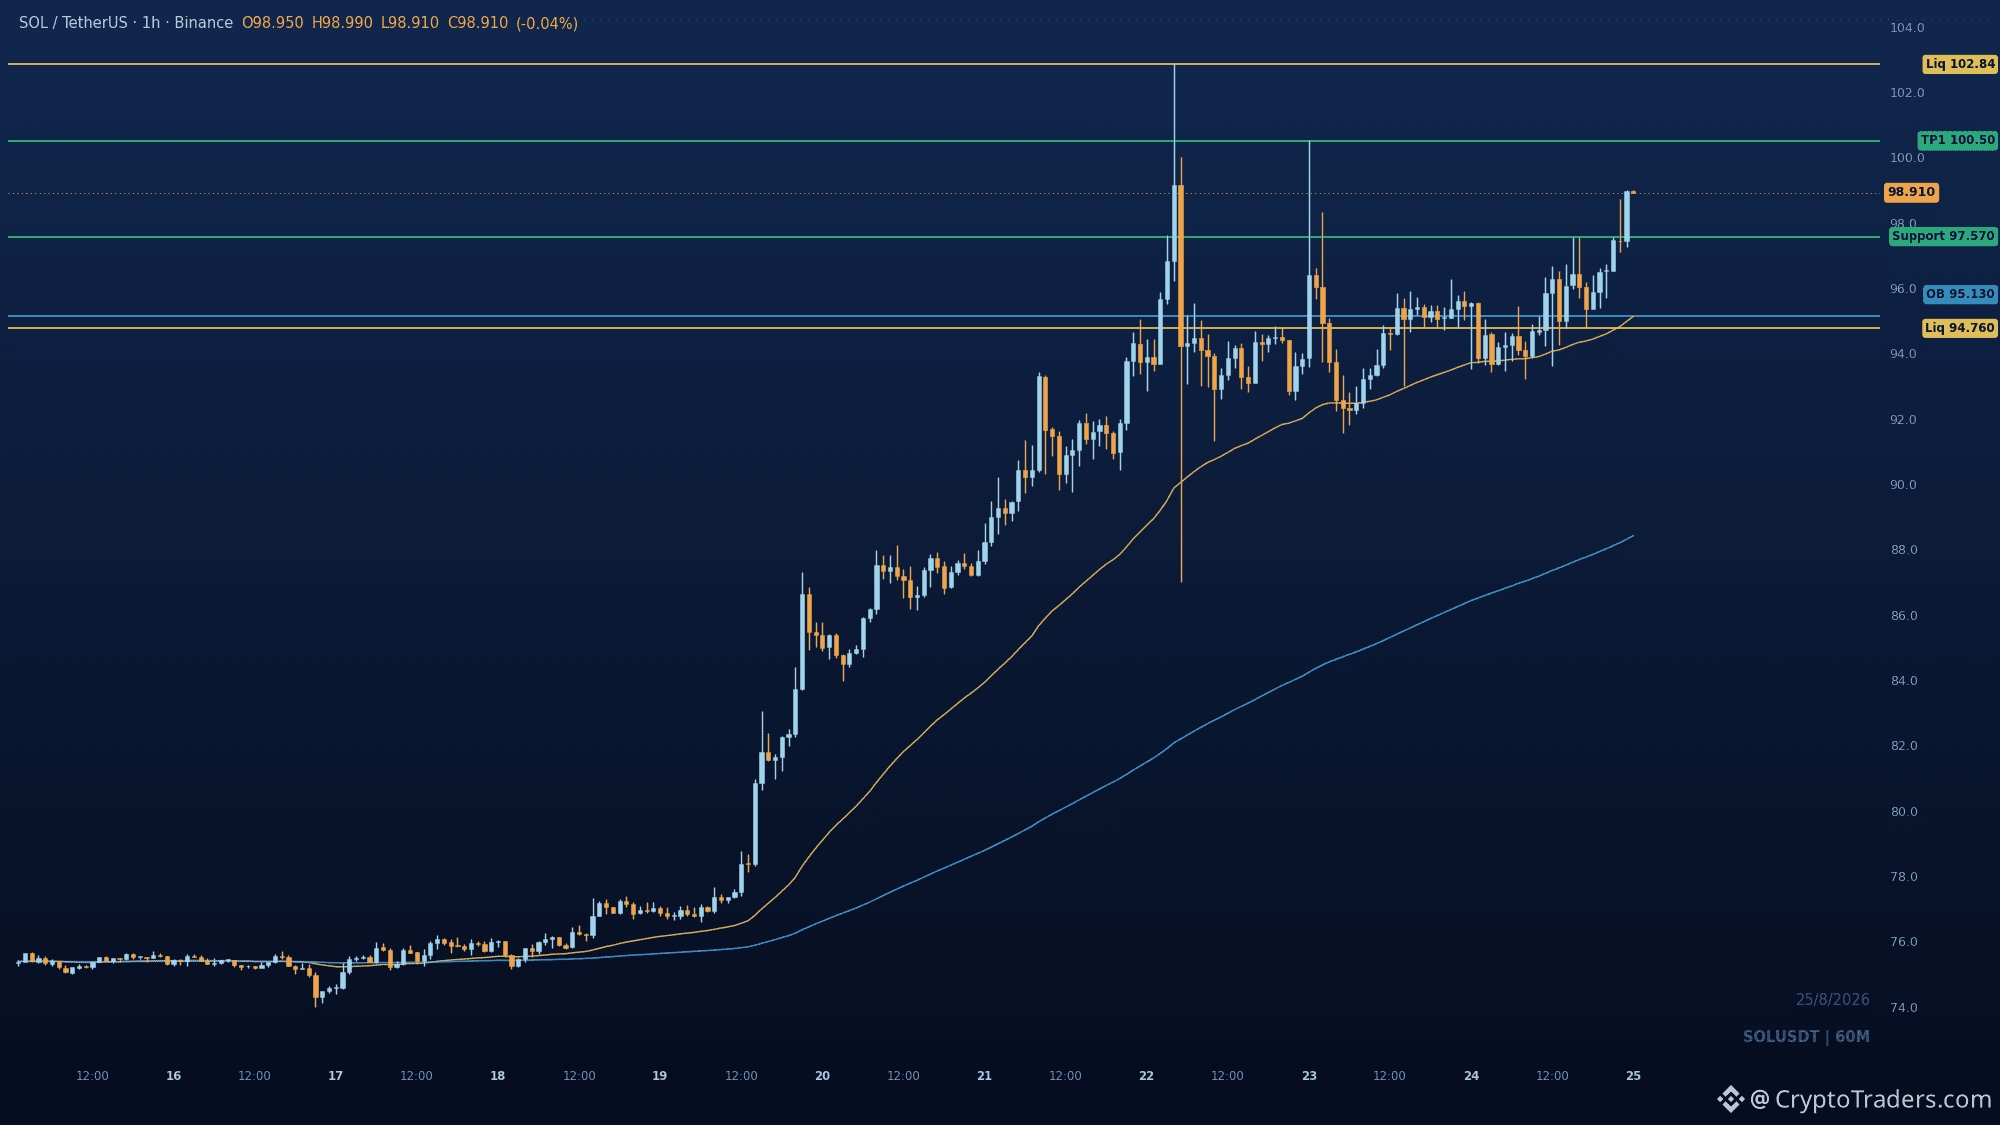
$SOL just broke 97.57 and is trading in premium above both EMAs, but the real question is whether buyers can defend that broken high on a retest. The 1h chart shows a fresh BOS from the 94.76 pullback, with price now sitting above the 50 EMA and looking for continuation. Support sits at the 97.57 broken high, with an order block at 95.13-95.60 offering deeper demand if the pullback extends. Upside targets are 100.5 and the 102.84 liquidity high, with momentum favoring a push if 97.57 holds as support. Invalidation comes on a close below 94.76, which would flip the structure bearish. Would you trust a retest into the 97.57-95.13 zone as a long entry, or are you waiting for a breakout above 100.5 first? More reads like this go out daily in the group, check the bio for details. #Altcoin Season#
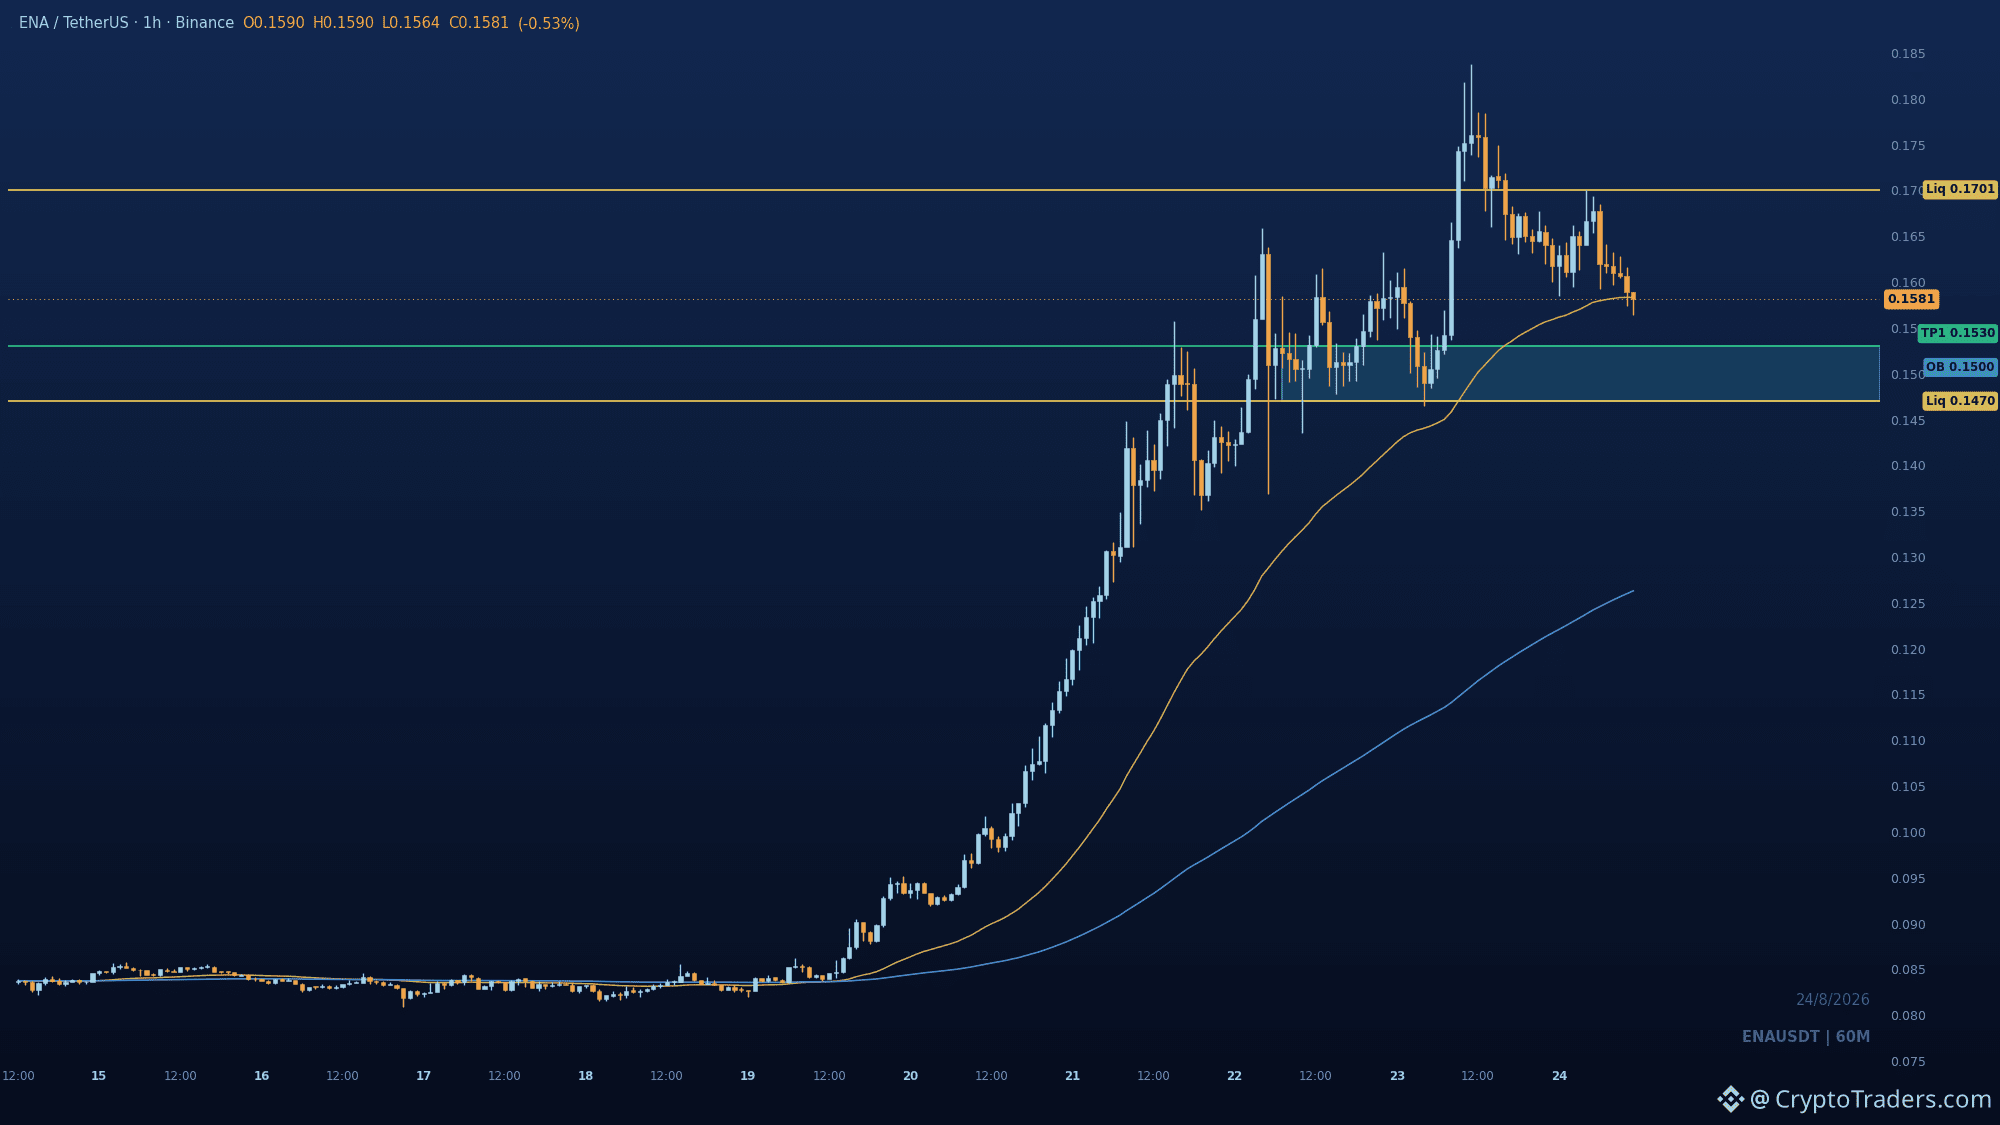
The $ENA 24h slide to 0.1581 just broke 0.1592, and the 1h chart says the dip is not done yet. The raid to 0.18375 buy-side liquidity failed above 0.17006, and price is now repricing toward the sell-side pool below spot. Next targets are 0.153 then 0.147 demand, where the order block sits. Only a reclaim of 0.17006 flips control back to buyers. Does 0.147 hold, or does this premium unwind get deeper? Reads like this are daily bread in our trading community, and the full breakdown lands in the group every morning. #Altcoin Season#
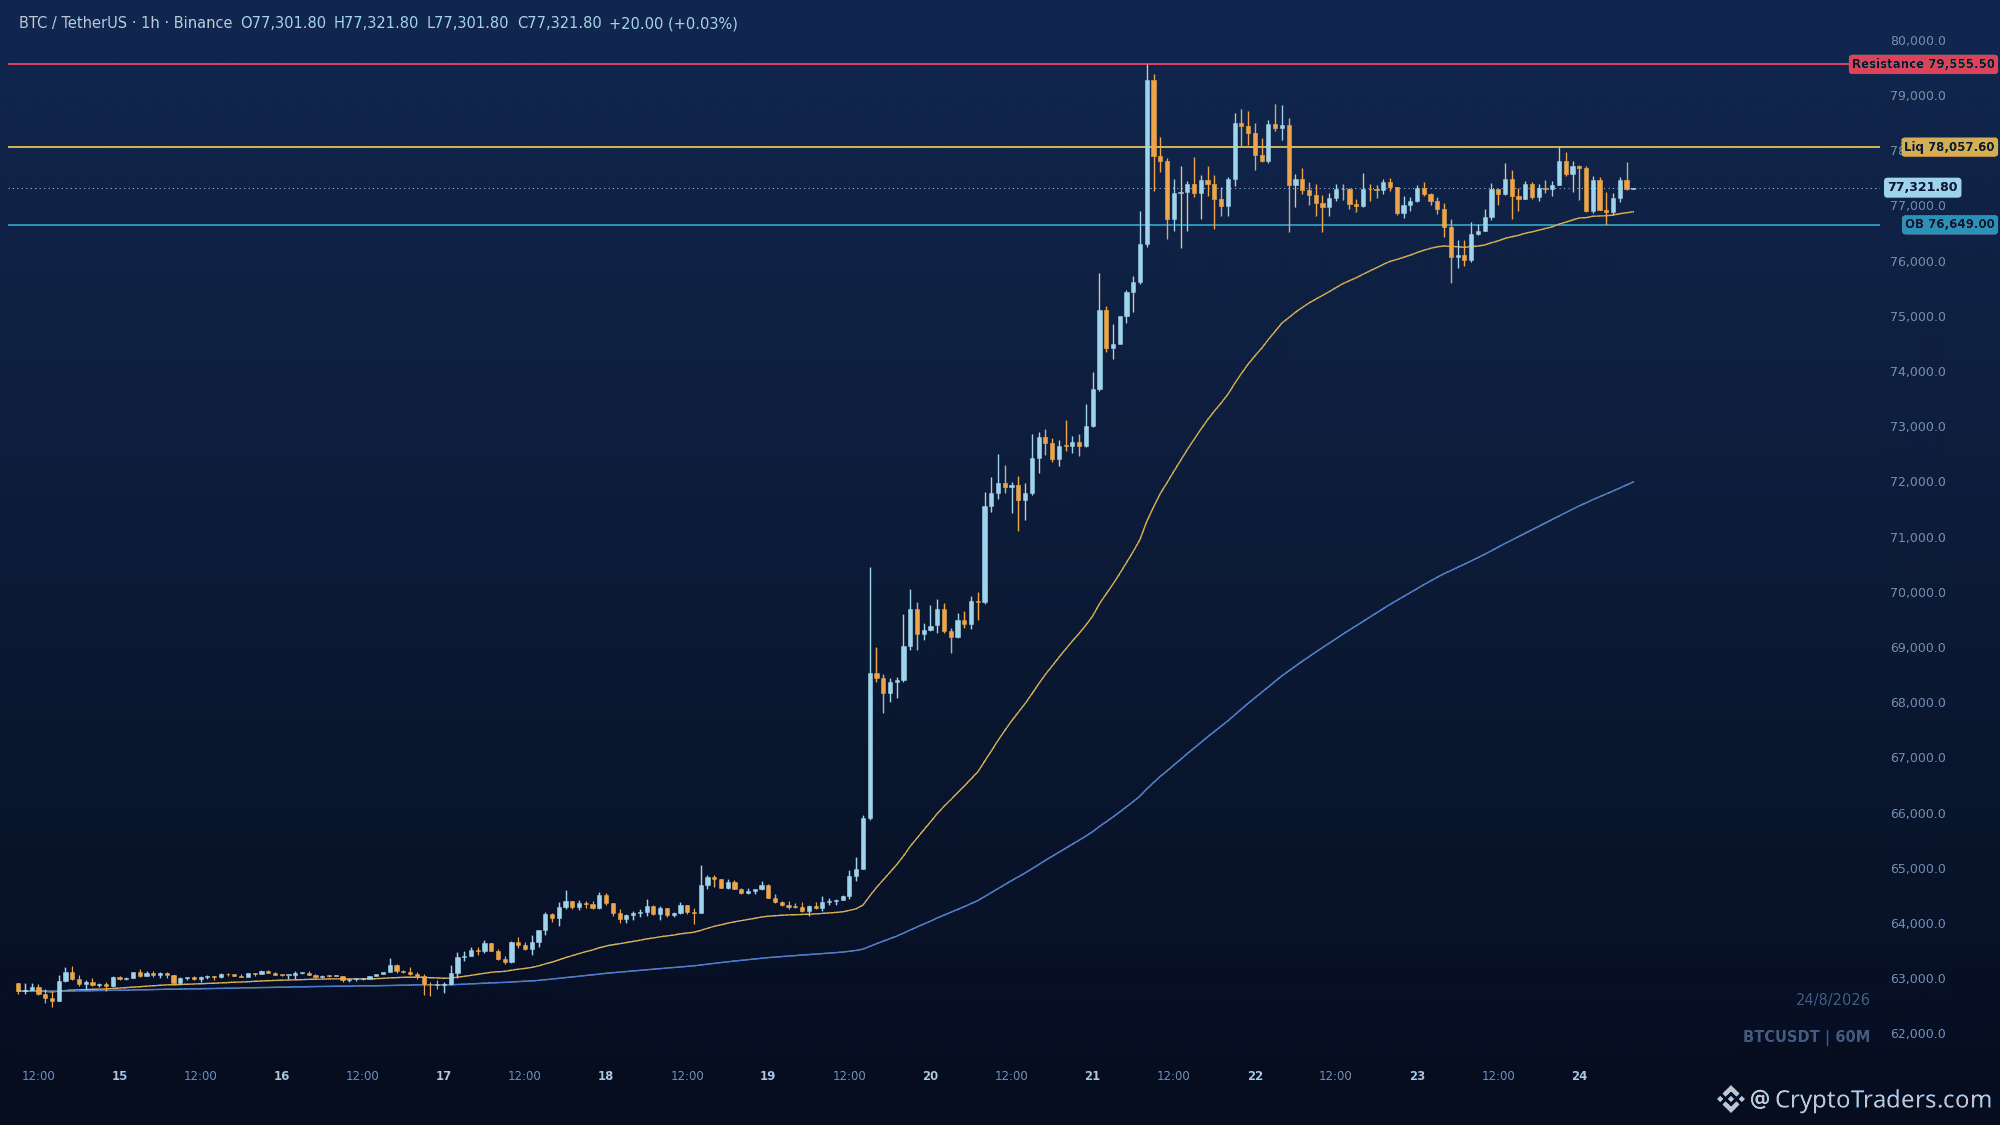
Can $BTC hold 76,649 on this shallow pullback and still reach for the 78,057.6 liquidity? The 1h BOS above the 50 EMA keeps the bullish structure intact, with price trading in premium after a strong markup. Demand sits at 76,649 to 76,885.7, defended by the 1h order block, and as long as bids hold there, the path targets 78,057.6 and then 79,555.5 window liquidity. A loss of 76,649 flips the tape and deepens the pullback, so that level is the line in the sand. Do you think the next push takes out the swing high or do we see a retest first? More daily chart reads like this in the group, check the bio for the way in. #BTC Price Analysis# #Bitcoin Price Prediction: What is Bitcoins next move?#
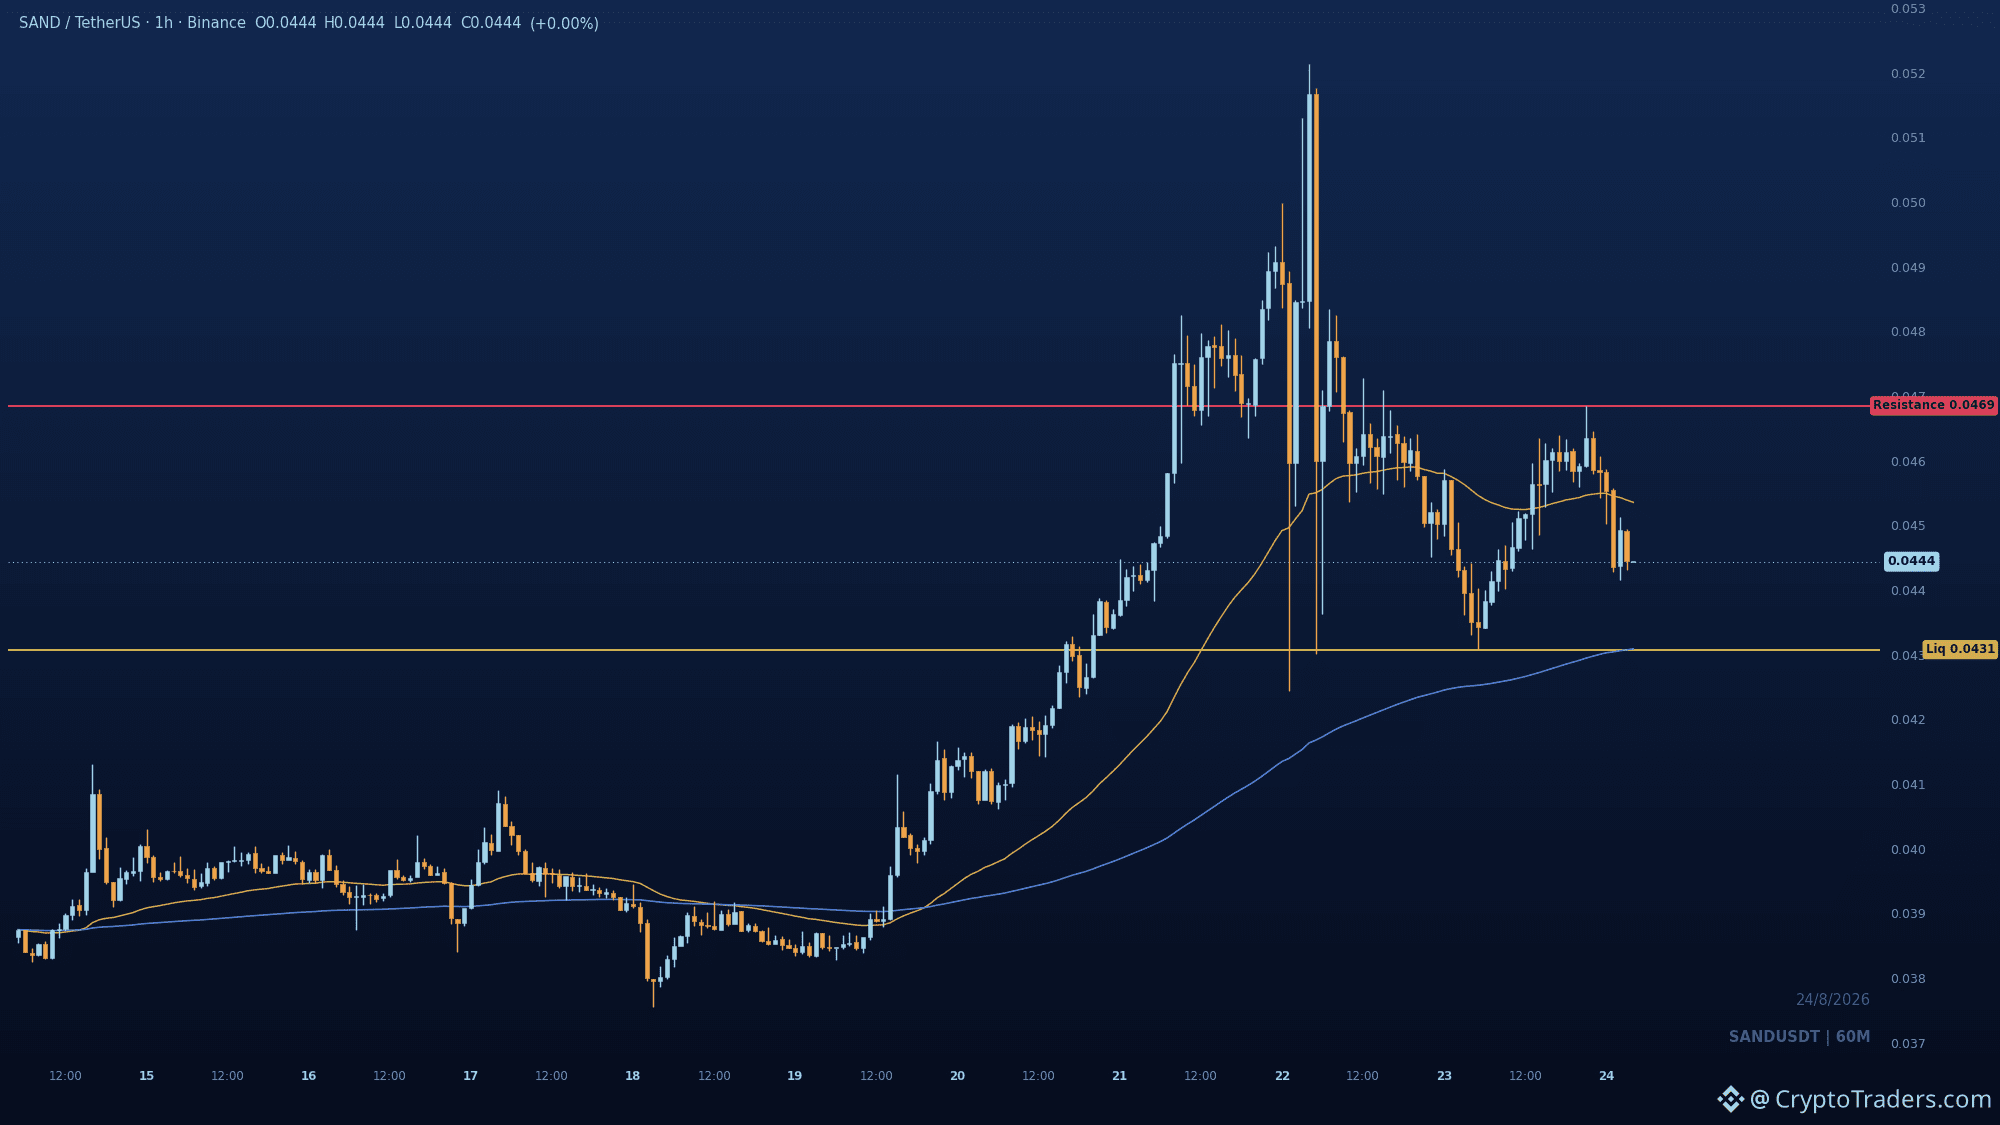
SAND Bridge Exploit and Delisting Pressure: What's Next? $SAND is trading at 0.04457, up 1.2 percent on the day, but the damage from August 21 is still being priced in. The Sandbox confirmed a bridge vulnerability that let an attacker mint roughly 14.9 billion unbacked SAND across Base and BNB Smart Chain. That is nearly five times SAND's legitimate 3 billion token cap. The team disabled Base and BSC bridging and says Ethereum and Polygon SAND plus locked collateral were untouched, with genuine backing at risk under 0.01 percent of total supply. Coinbase is also delisting SAND futures on August 26, which forces settlement and adds short-term volatility. The chart: On the 1h, the higher-timeframe structure turned bullish after a BOS above 0.04685, but the latest leg is corrective. Price rejected below the 50 EMA and is now balancing between 0.04308 sell-side liquidity and 0.04685 supply. Reclaiming 0.04536 is the first sign buyers are back. The base case is a probe into 0.04308, where the 200 EMA adds confluence, then a reaction. Losing 0.04308 opens a deeper discount. What to watch: Can price hold 0.04308 on the first touch? A reclaim of 0.04536 would target 0.04685. Also watch whether liquidity providers on Base and BSC rebalance away, and how forced settlement around the delisting affects the tape. Does the under 0.01 percent backing at risk restore trust, or is the Coinbase delisting the bigger overhang? This is one of several charts the group gets each day, my bio points the way. #Altcoin Season# #Macro Insights#
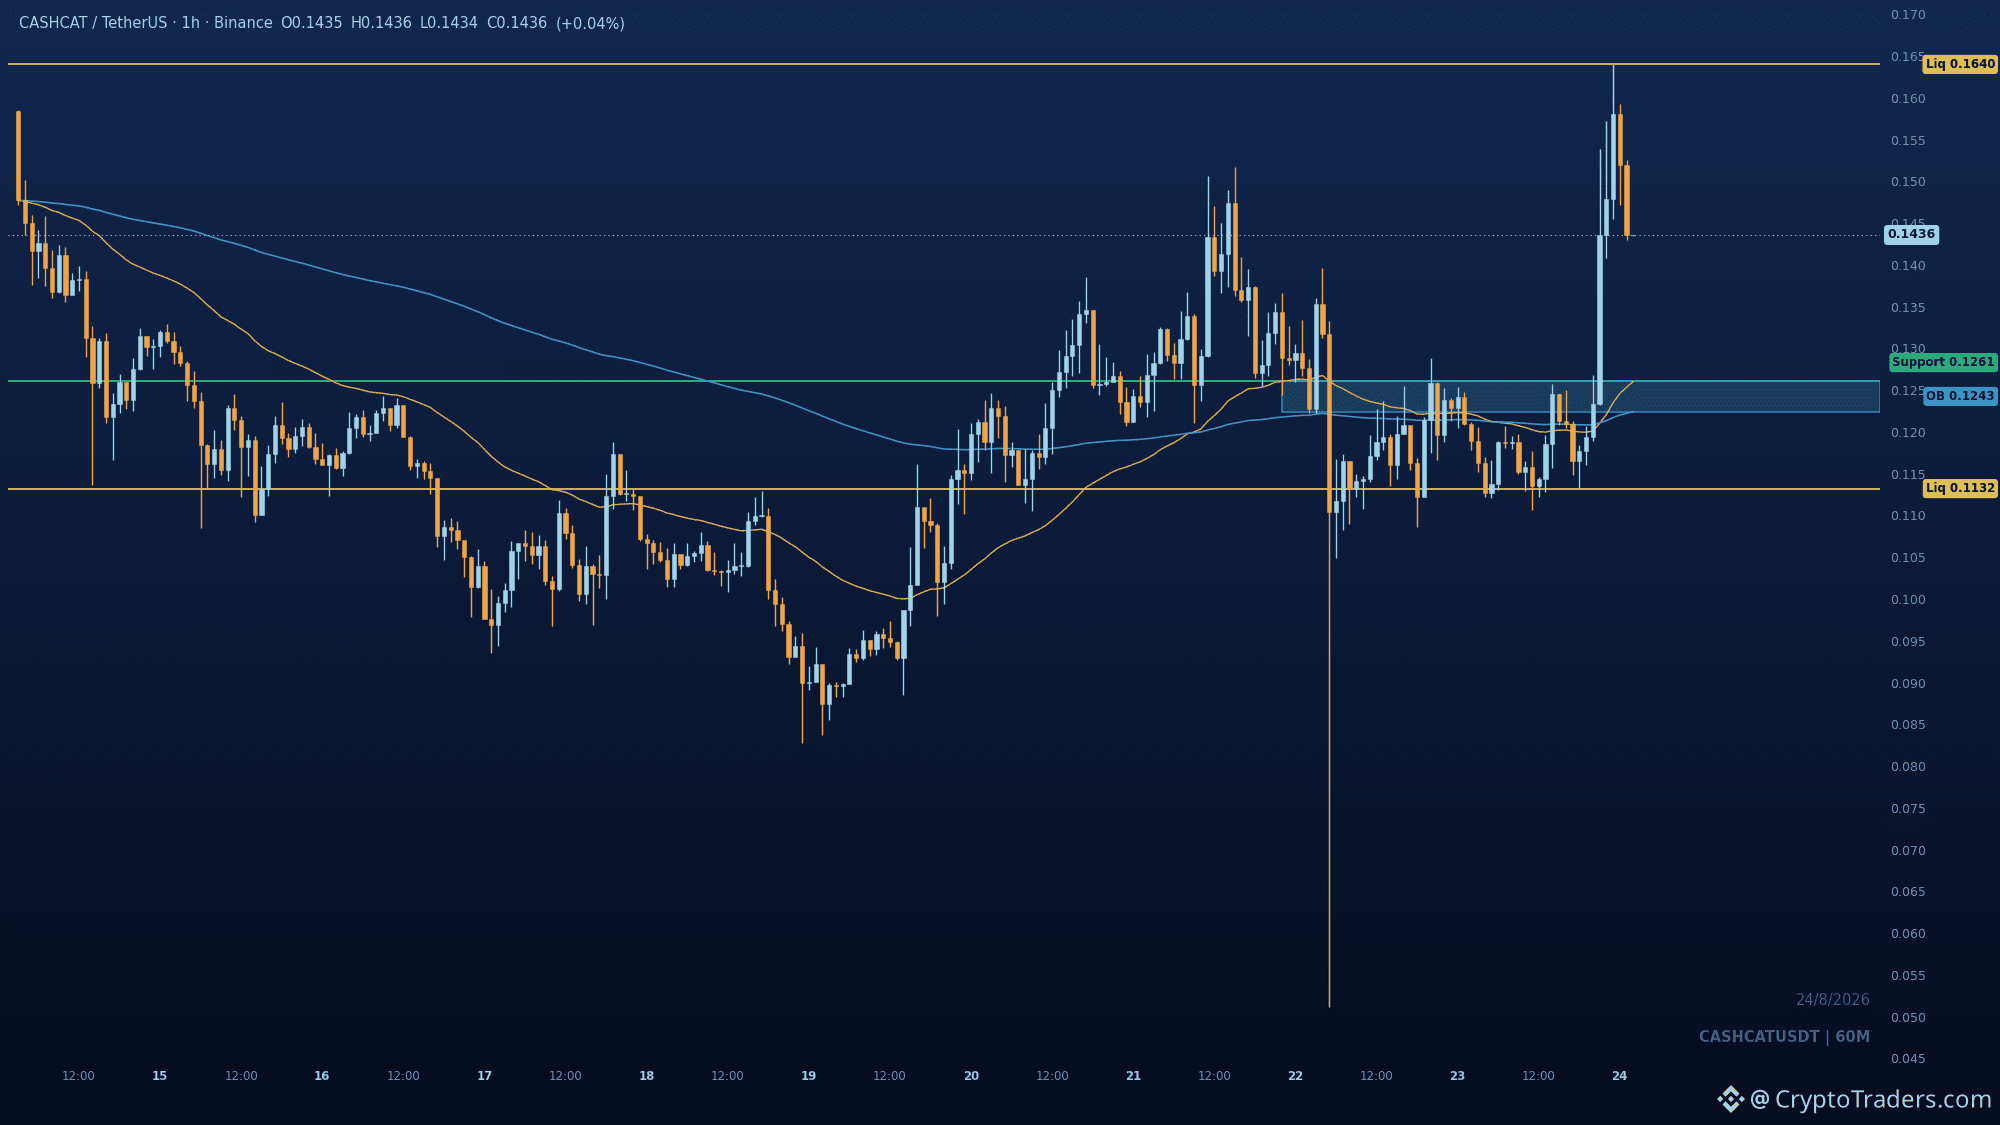
Thin liquidity is the real story for $CASHCAT even as its turnover hits 92.6 million against a 5.3 million main pool. 1⃣ Liquidity vs. market cap: CASHCAT's 92.6 million in turnover compares with roughly 5.3 million in main-pool liquidity, a ratio that amplifies downside risk. Long liquidations and falling open interest add to fragility, while wallet growth may be inflated by Fomo-generated addresses. 2⃣ Wider market parallels: CATE shows a similar pattern, with a 4.39x move on just 1.93 million liquidity versus a 58.29 million implied market cap. Even XRP's 39 percent weekly gain saw only 13.24 million in U.S. ETF inflows, and its intraday high was cut by 12.3 percent. 3⃣ Scheduled supply risks: FOLD faces 21.63 million tokens in monthly releases starting September 1, against only 160,000 in operator bonds. ENA's 171.875 million monthly vesting and a 1 billion FalconX facility that remains undeployed add to supply overhang. The takeaway: momentum without liquidity depth is a fragile foundation. Are these low-liquidity rallies sustainable, or are we one sell-off away from a cascade? We post reads like this daily in the community, check the bio for more. #Altcoin Season# #Macro Insights#
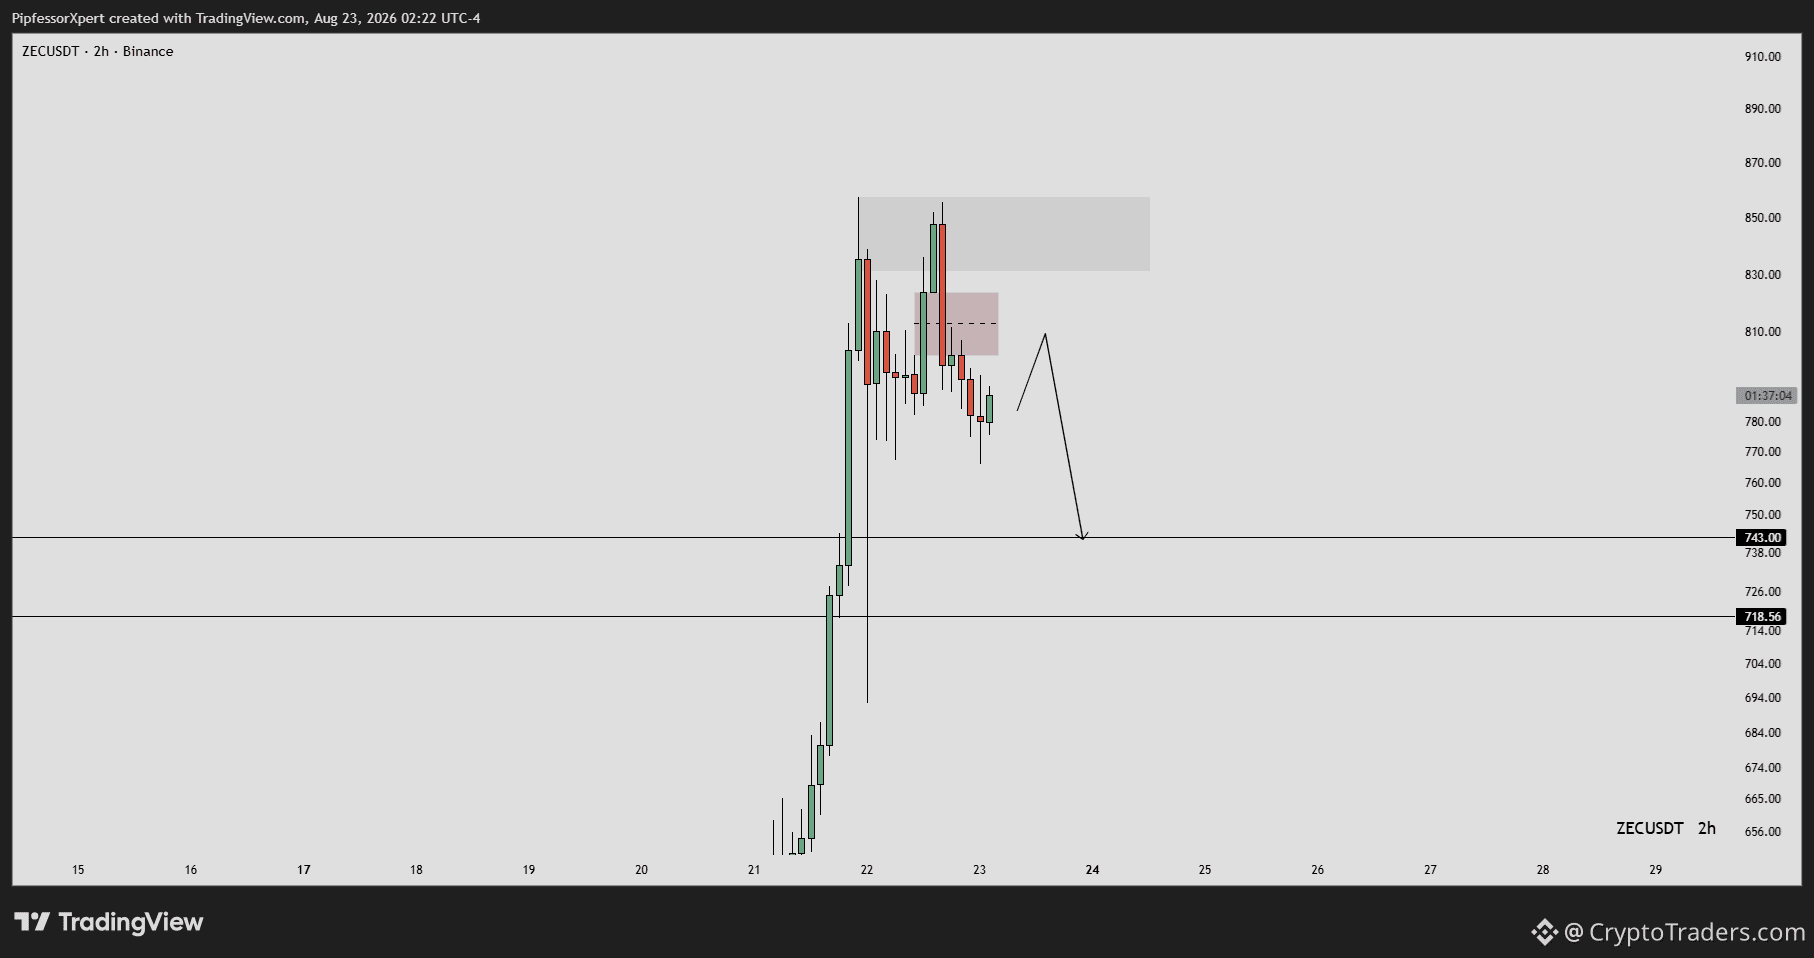
The 24h +6.4% push on $ZEC is stalling right under the 830-860 supply shelf, and the 2h chart is already printing a lower high rejection. The gray zone overhead has capped every attempt, with the red 800-825 band acting as the first breakdown trigger. A sweep of that red zone opens the slide toward the 743.00 support, with 718.56 as the deeper magnet if momentum carries. Invalidation comes only on a daily close back above 860, which would flip the supply story. Are you fading this rejection or waiting for the retest of 743? More daily analysis where this came from, bio points the way. #Altcoin Season#
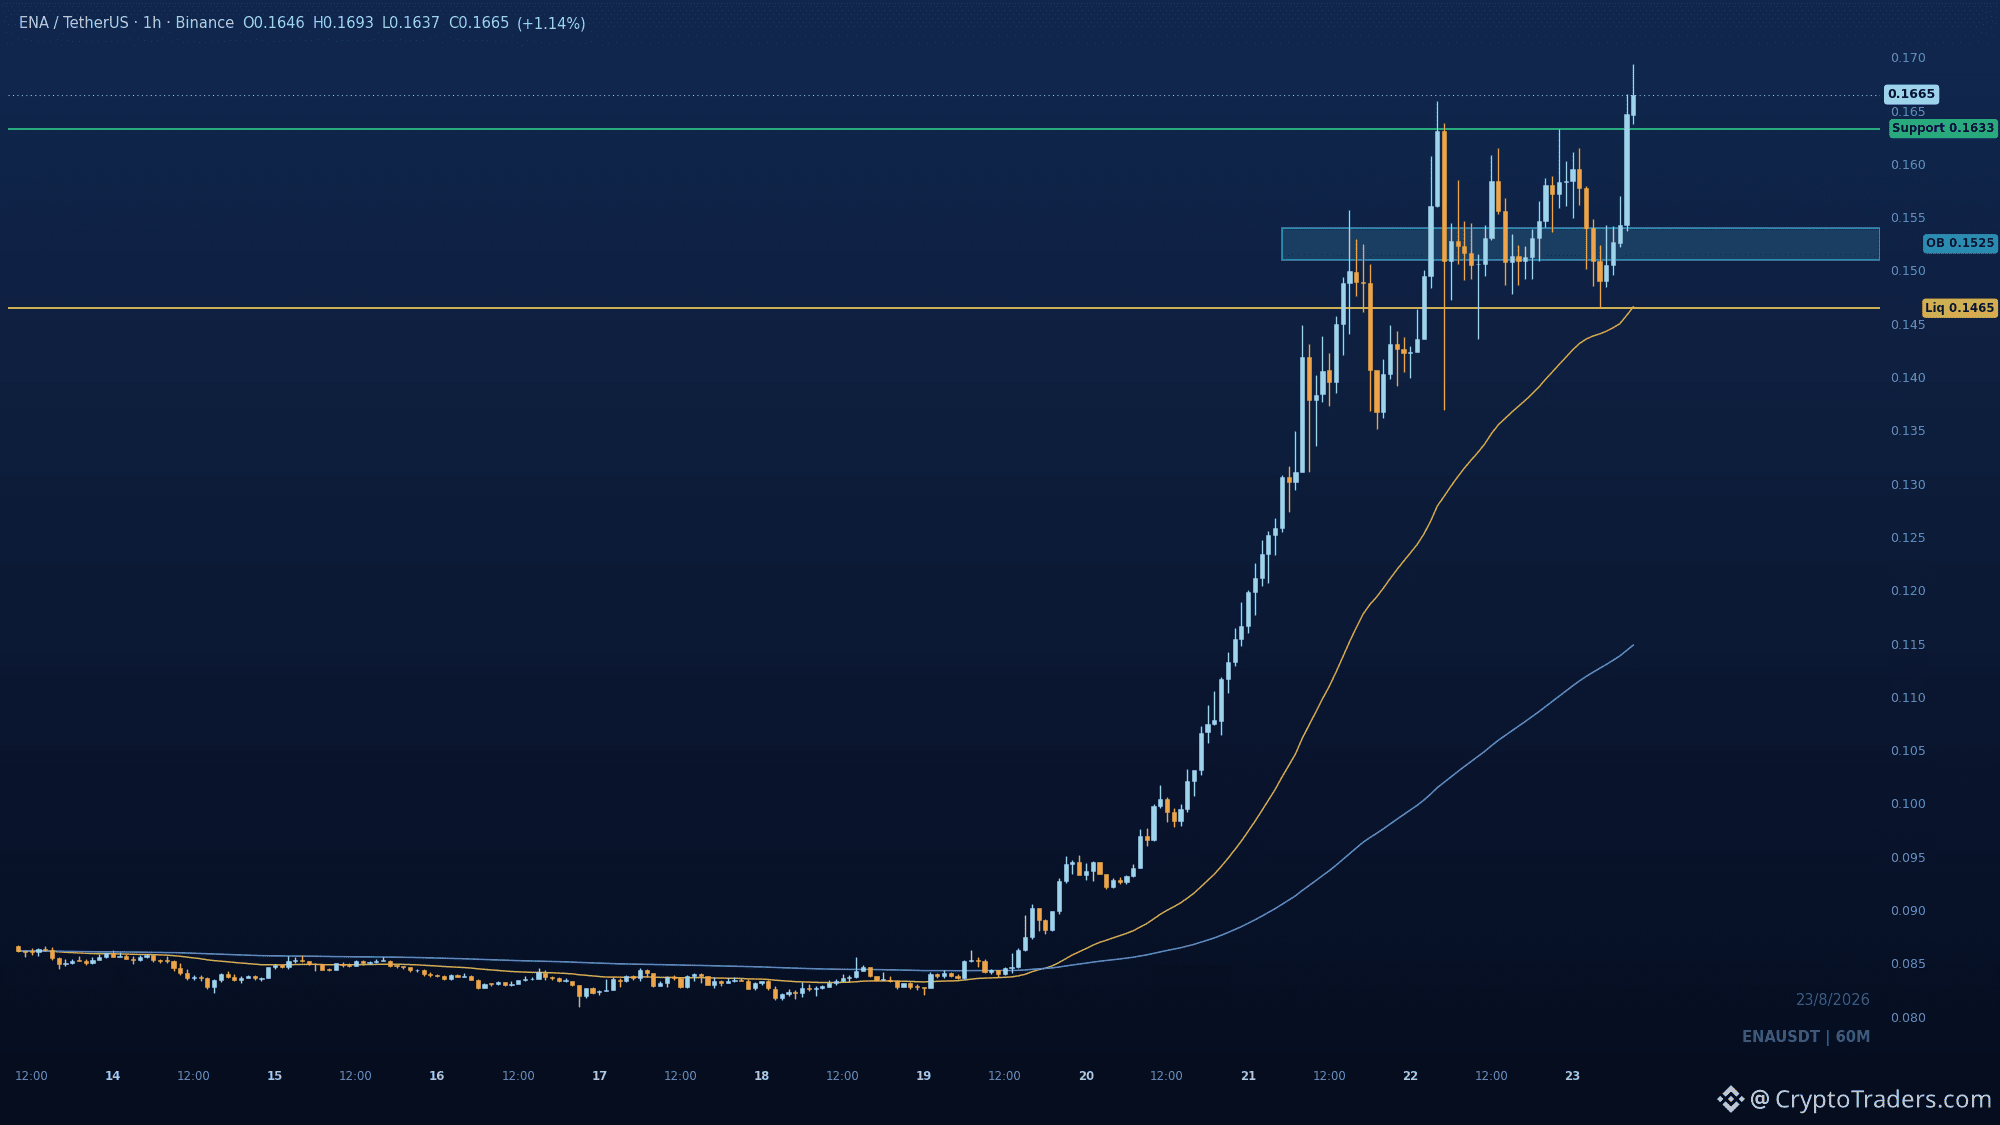
The $ENA breakout through 0.1633 is clean, but the real tell is that price is now running premium with no pullback, which is exactly where smart money lets retail chase. The broken swing high at 0.1633 is the first support, and the order block at 0.151-0.154 is the deeper demand zone if the pullback gets aggressive. As long as 0.1633 holds on a retest, the bullish expansion continues; a close below 0.14646 invalidates the entire move. What's your read on whether ENA holds the flip or fills the imbalance first? The community gets a fresh chart breakdown like this every morning. #Altcoin Season#
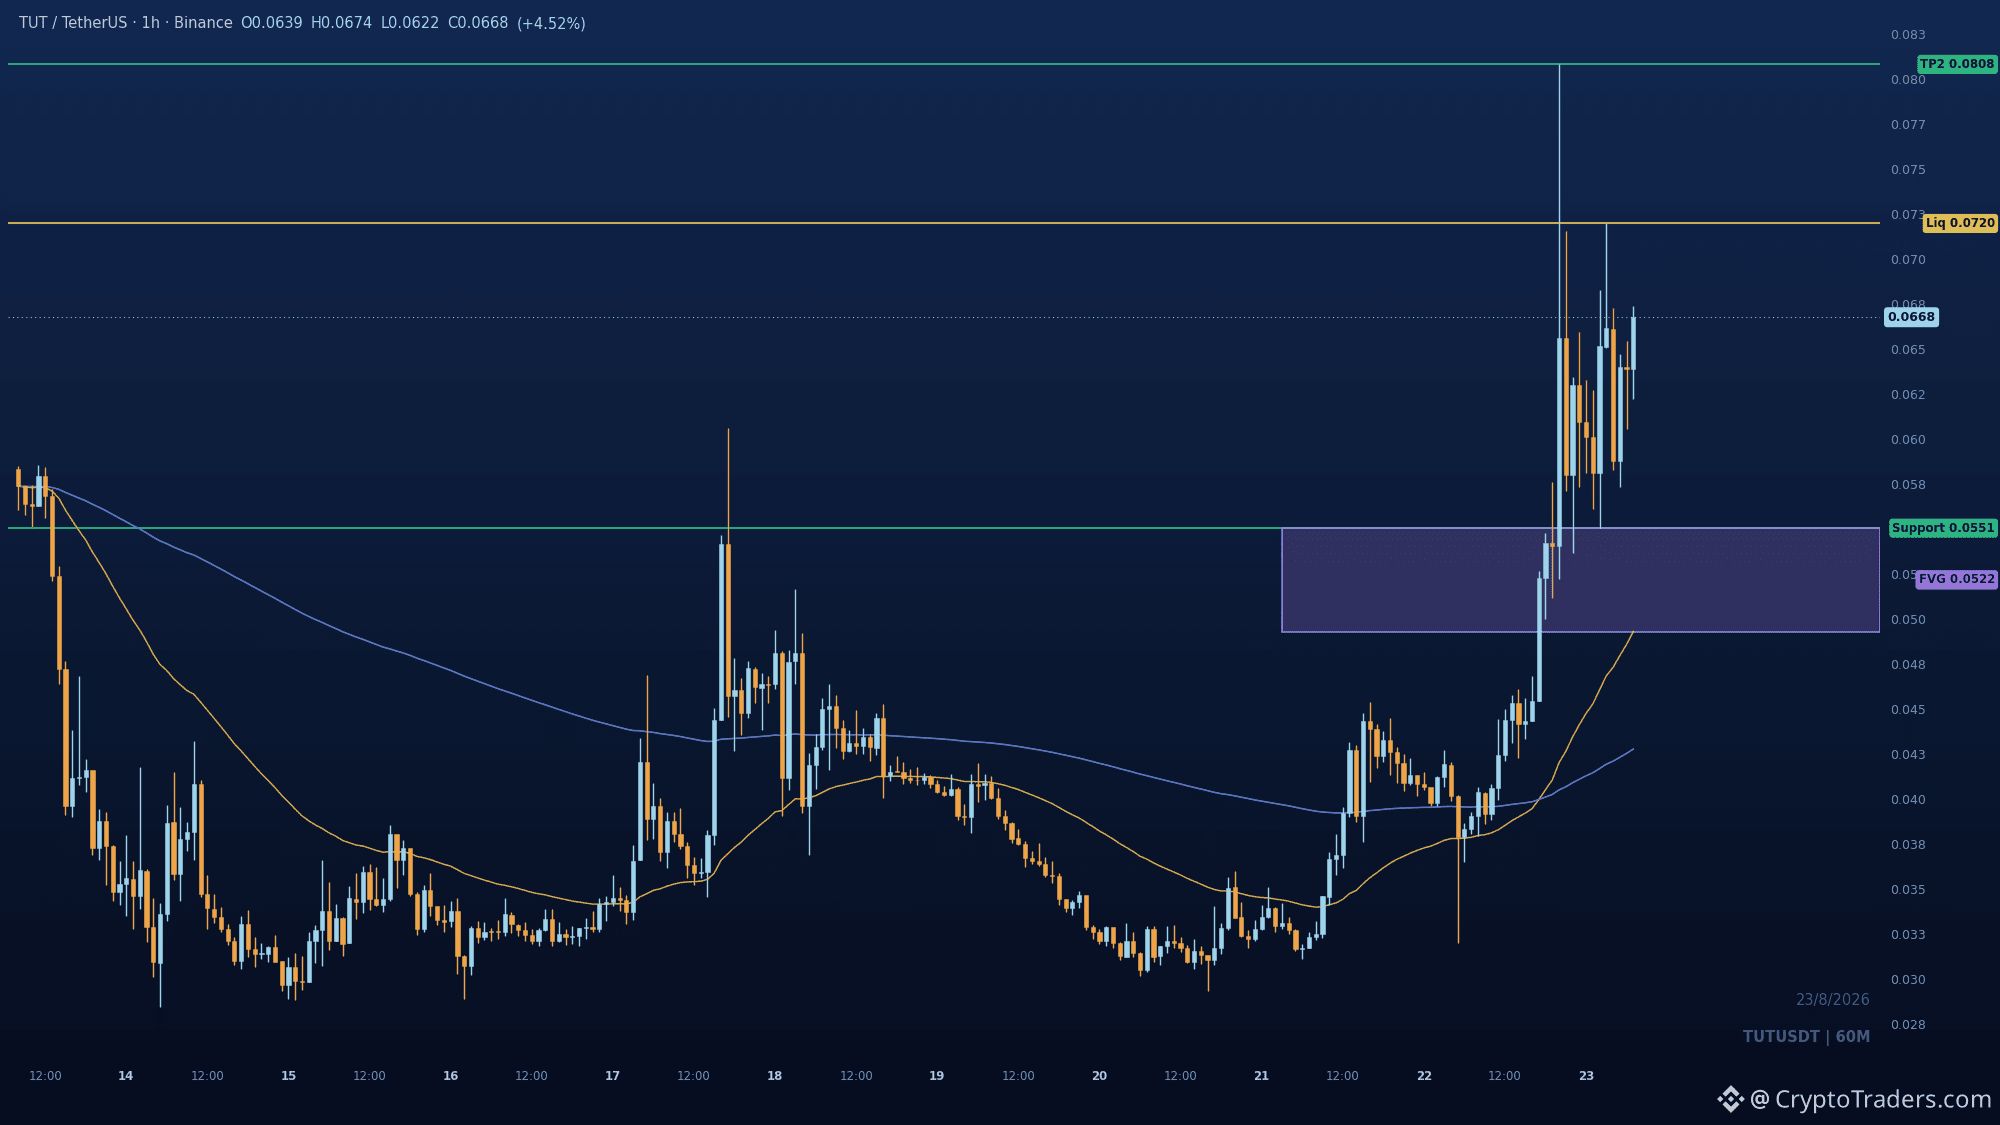
The BOS on $TUT just cleared prior supply and left price consolidating in premium, setting up the next leg toward fresh highs. The 0.07198 high is the nearest buy-side liquidity; a clean break there opens 0.08082. Bids should defend the 0.05505 broken swing, with the impulse imbalance at 0.0493-0.05505 as deeper support. Hold above 0.05505 keeps the bullish tape intact; losing it flips the structure. Are you watching for the 0.07198 sweep or waiting for a deeper retest? More reads like this land in the group daily, check the bio for the way in. #Altcoin Season#
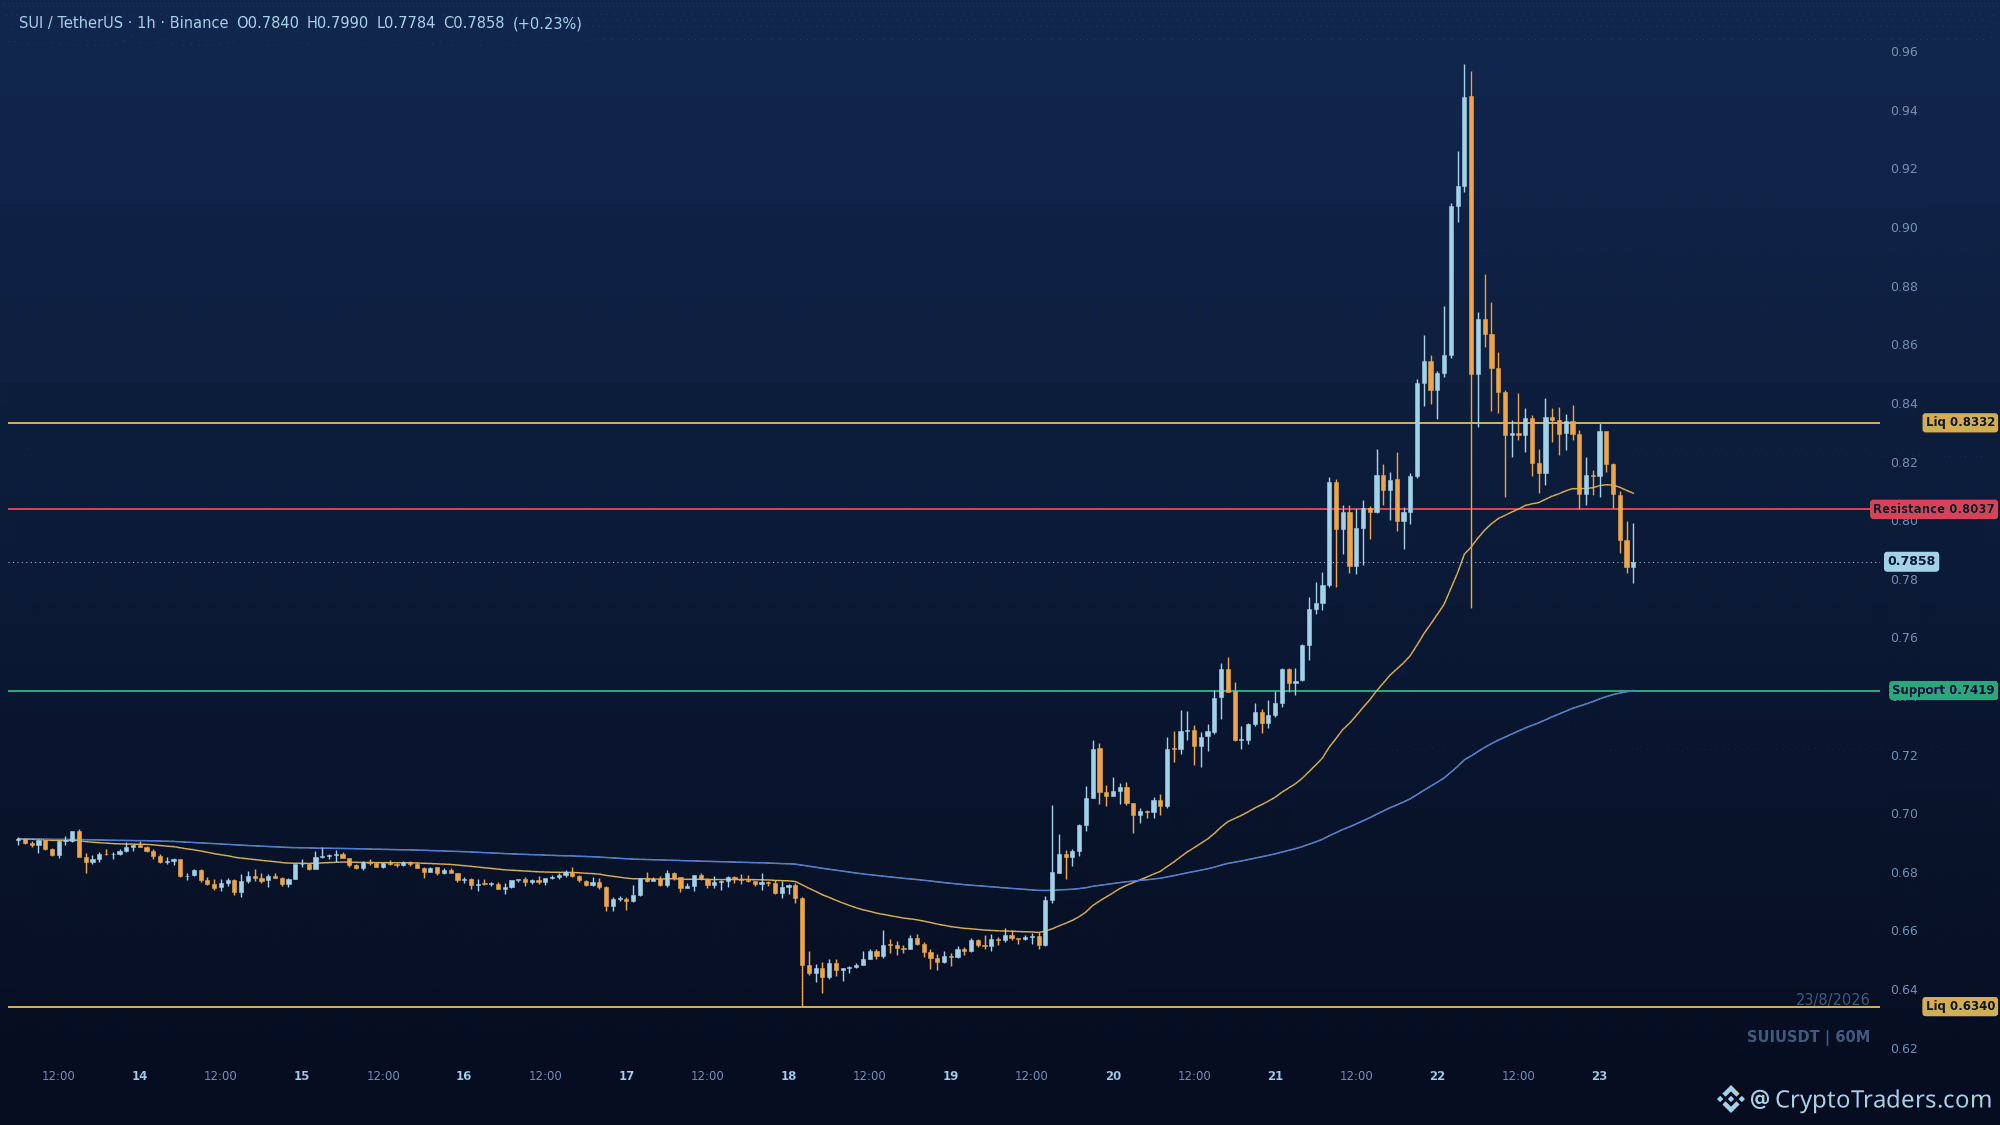
0.8037. That is the whole story on $SUI right now, the broken swing that flips the tape from bullish impulse to bearish CHoCH. 📉 The 0.9555 expansion was pure distribution, and the displacement through 0.8037 opened the door to discount trading under the 50 EMA. Relief into 0.8037-0.8092 is the most likely path, but sellers defending that retest should send price hunting 0.7419 below. Invalidation sits at 0.8332, a reclaim that would put the bearish case back in question. Is 0.7419 the real target, or does the 200 EMA demand area hold first? More daily reads like this in the group, check the bio for the link. #Altcoin Season#
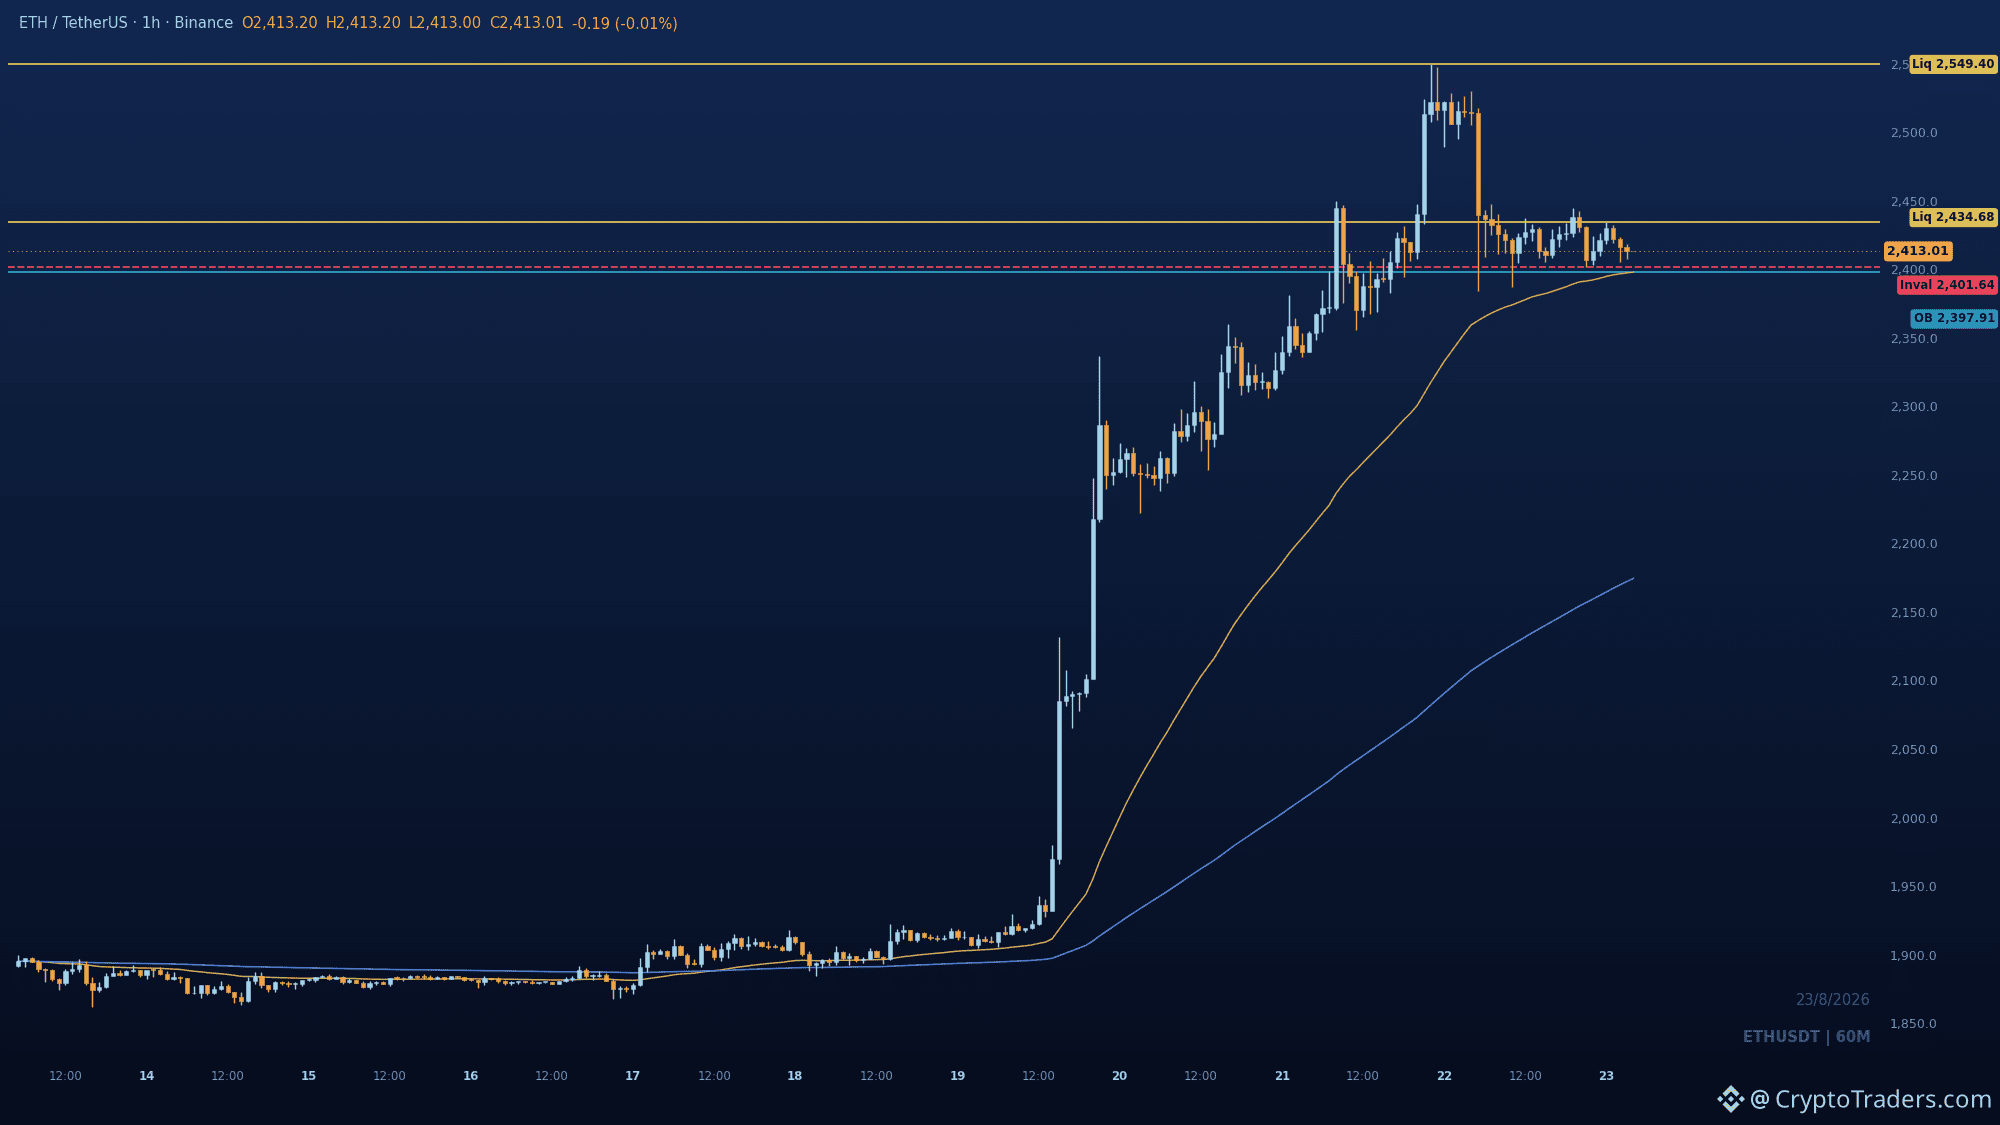
$ETH slides to 2,415 as Aligned's month-12 unlock looms, but the story is the leverage hiding in altcoin rallies. 📉
1⃣ Unlock overhang: Aligned's aggregation fees are prepaid in ETH, so token demand is uncertain. A 1.7284 billion team and investor token unlock at month 12 equals roughly 108% of the launch float, and the token trades below CoinList's lower sale option. That's a supply wall with no clear buyer.
2⃣ Leveraged rallies: ZEC's 153% spot volume jump pushed open interest up 38.5% to 1.41 billion with positive funding, but no DCG transfer or open-market purchase followed Grayscale's filing. SOL's short liquidations were 86% of all liquidations at 44.41 million, while U.S. funds only absorbed 24.6 million. When forced buying ends, momentum can reverse.
3⃣ Strategy shifts: Strategy raised 333.7 million via MSTR issuance, spent 184.6 million on dividends and buybacks, and added 149.1 million to cash reserves, buying zero Bitcoin. That dilutes BTC per share but lowers forced-sale risk, a defensive posture.
Meanwhile, today's movers show risk-off: TRUMP fell 16.4% on 279 million volume, RE dropped 17.2% on 120 million, while TUT jumped 58.1% on thin 69 million. Leverage is the common thread.
Can altcoin strength survive without fresh spot inflows?
We break down moves like this daily in the community, and the bio has the entry point.
#Altcoin Season# #Macro Insights#
1⃣ Unlock overhang: Aligned's aggregation fees are prepaid in ETH, so token demand is uncertain. A 1.7284 billion team and investor token unlock at month 12 equals roughly 108% of the launch float, and the token trades below CoinList's lower sale option. That's a supply wall with no clear buyer.
2⃣ Leveraged rallies: ZEC's 153% spot volume jump pushed open interest up 38.5% to 1.41 billion with positive funding, but no DCG transfer or open-market purchase followed Grayscale's filing. SOL's short liquidations were 86% of all liquidations at 44.41 million, while U.S. funds only absorbed 24.6 million. When forced buying ends, momentum can reverse.
3⃣ Strategy shifts: Strategy raised 333.7 million via MSTR issuance, spent 184.6 million on dividends and buybacks, and added 149.1 million to cash reserves, buying zero Bitcoin. That dilutes BTC per share but lowers forced-sale risk, a defensive posture.
Meanwhile, today's movers show risk-off: TRUMP fell 16.4% on 279 million volume, RE dropped 17.2% on 120 million, while TUT jumped 58.1% on thin 69 million. Leverage is the common thread.
Can altcoin strength survive without fresh spot inflows?
We break down moves like this daily in the community, and the bio has the entry point.
#Altcoin Season# #Macro Insights#
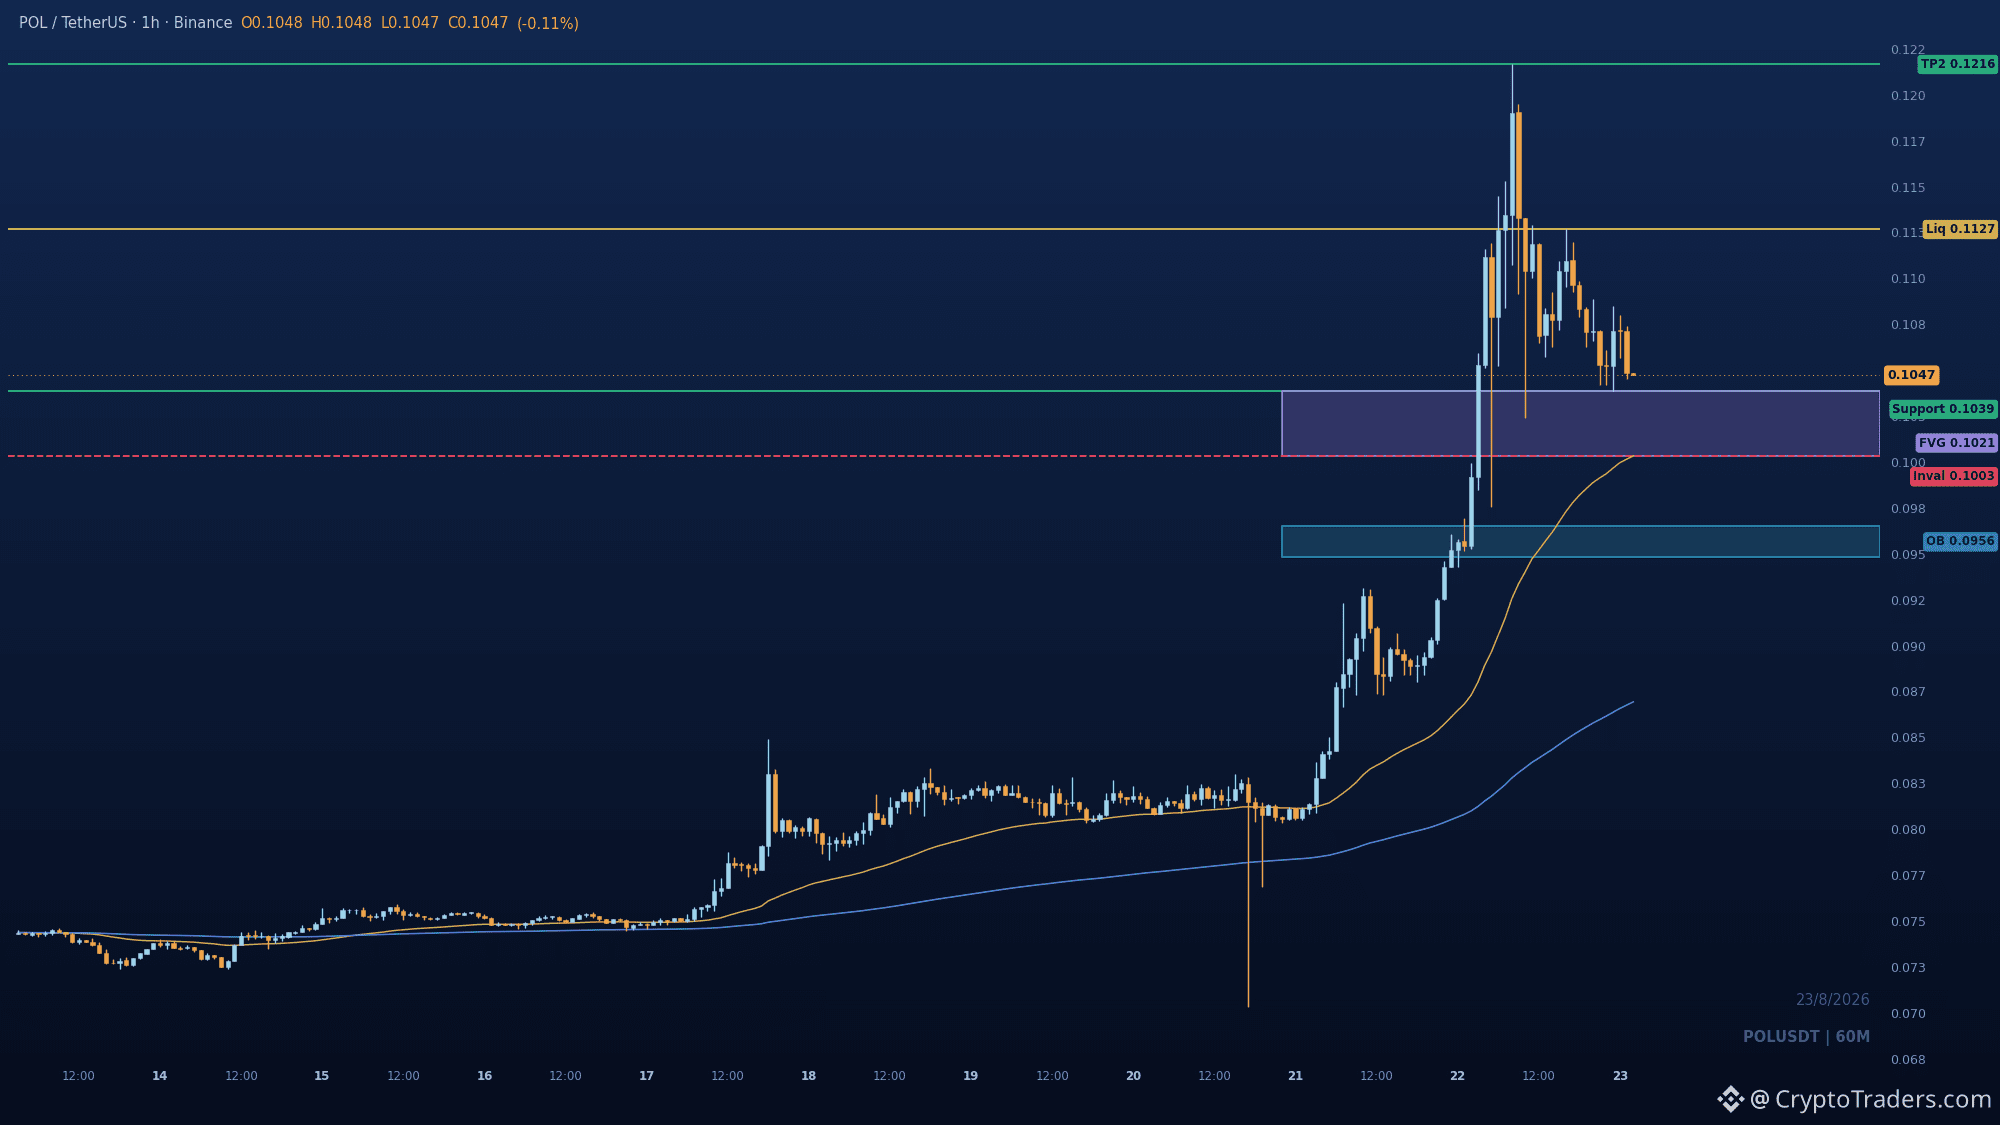
The impulsive BOS on $POL just cleared the prior highs, and the retrace into 0.10389 is the classic rebalance before the next leg up. The 1h chart shows price expanding aggressively, sweeping buy-side liquidity, then repricing lower to fill the imbalance at 0.10033-0.10389. If 0.10389 holds or gets briefly swept, buyers likely defend and rotate price back toward the 0.11266 high, with 0.12165 as the extended target. The bullish case dies only if 0.10033 gives way; that would flip the structure and open the door to the 0.0948-0.0965 order block. Do you think the dip to 0.10389 gets bought, or are we looking at a deeper fill first? More reads like this land daily in the group, my bio points the way. #Altcoin Season#
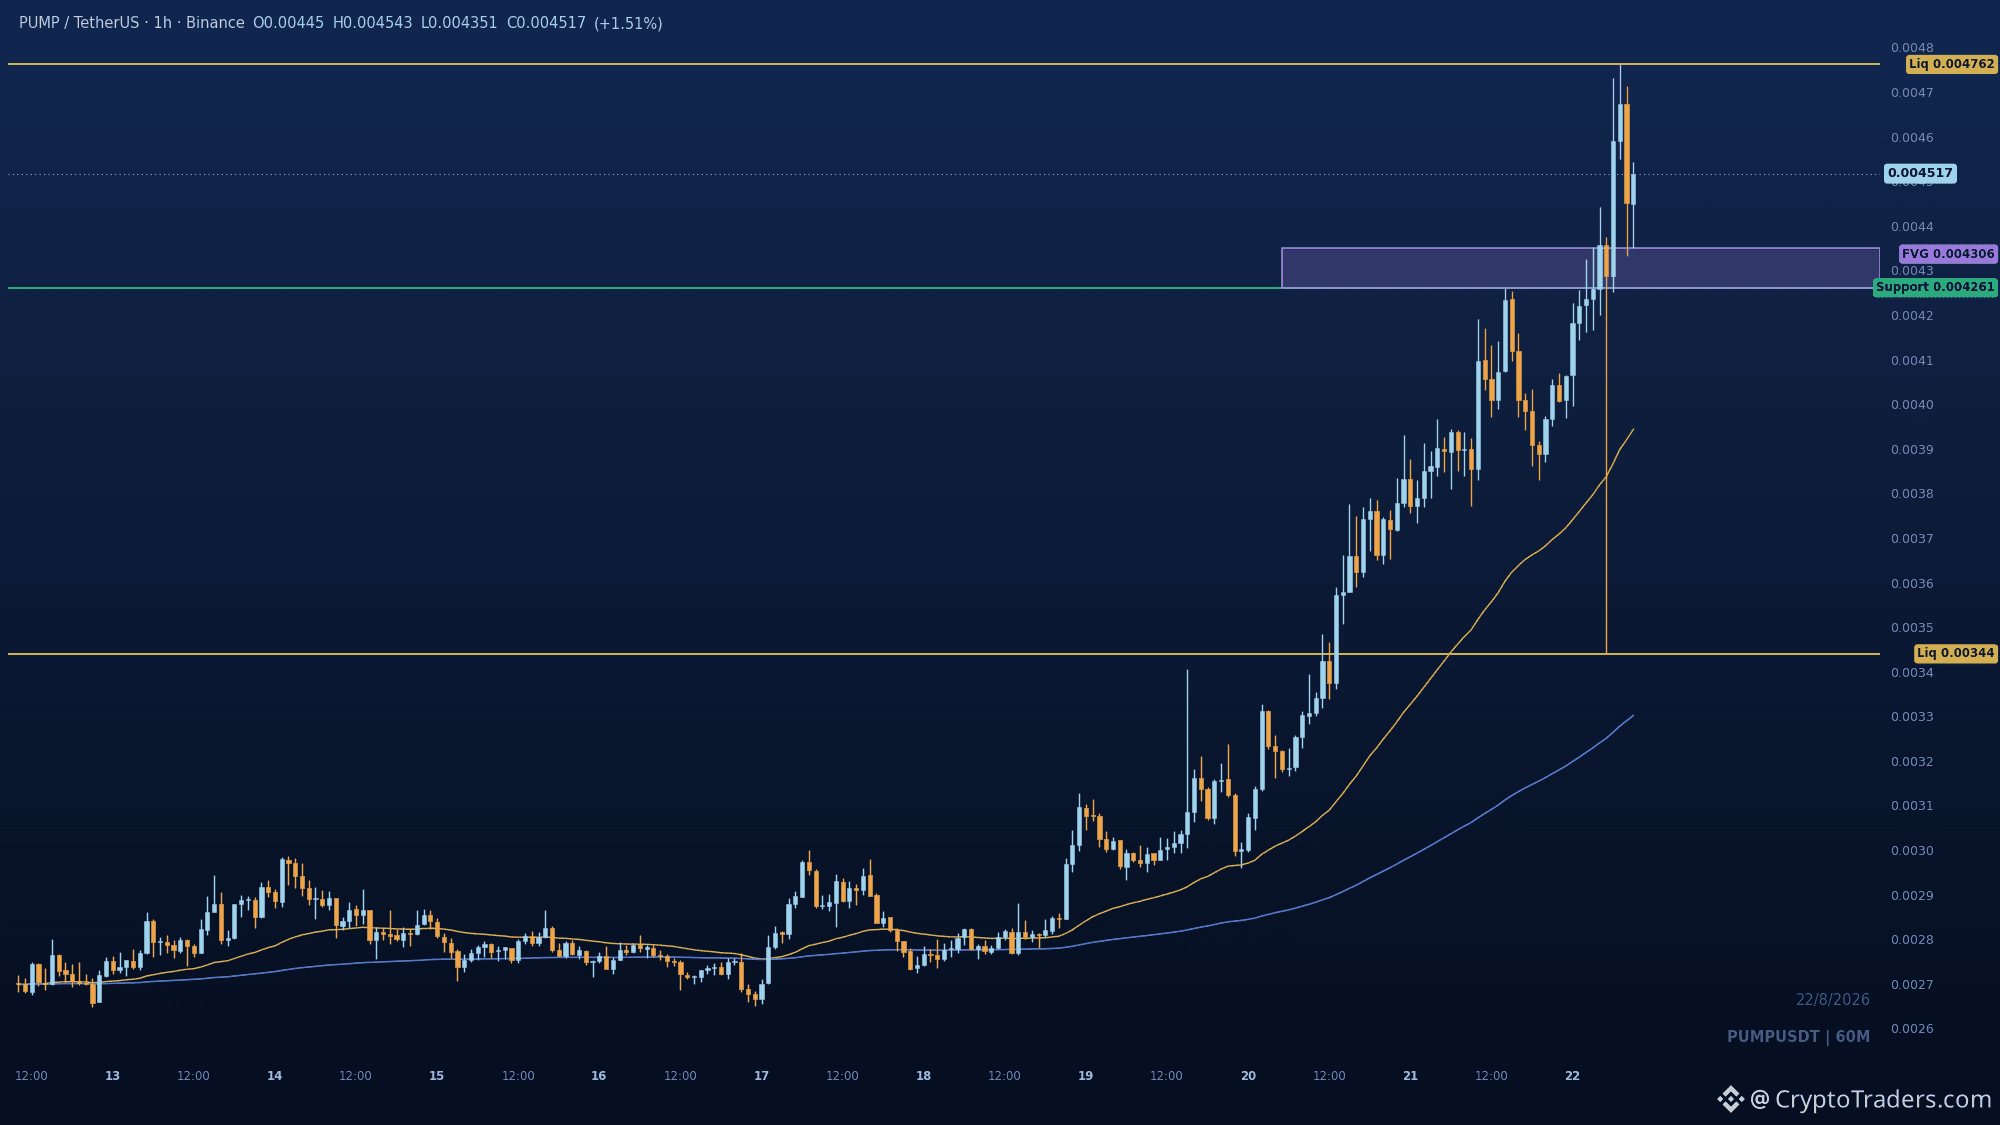
Either $PUMP holds the 0.004261 flip and grinds toward 0.004762, or that broken swing fails and the pullback gets deeper than the bulls want. Fresh BOS above 0.004261 with bullish displacement behind it, price now stretched in premium near the range high. Pullback into the 0.004351-0.004261 imbalance is the cleaner institutional re-entry zone, not a chase up here. Defence of 0.004261 confirms continuation toward 0.004762; a close below 0.00344 kills the setup. Are you waiting for the retest or fading the extension? Reads like this are daily bread in our trading community. #Altcoin Season#
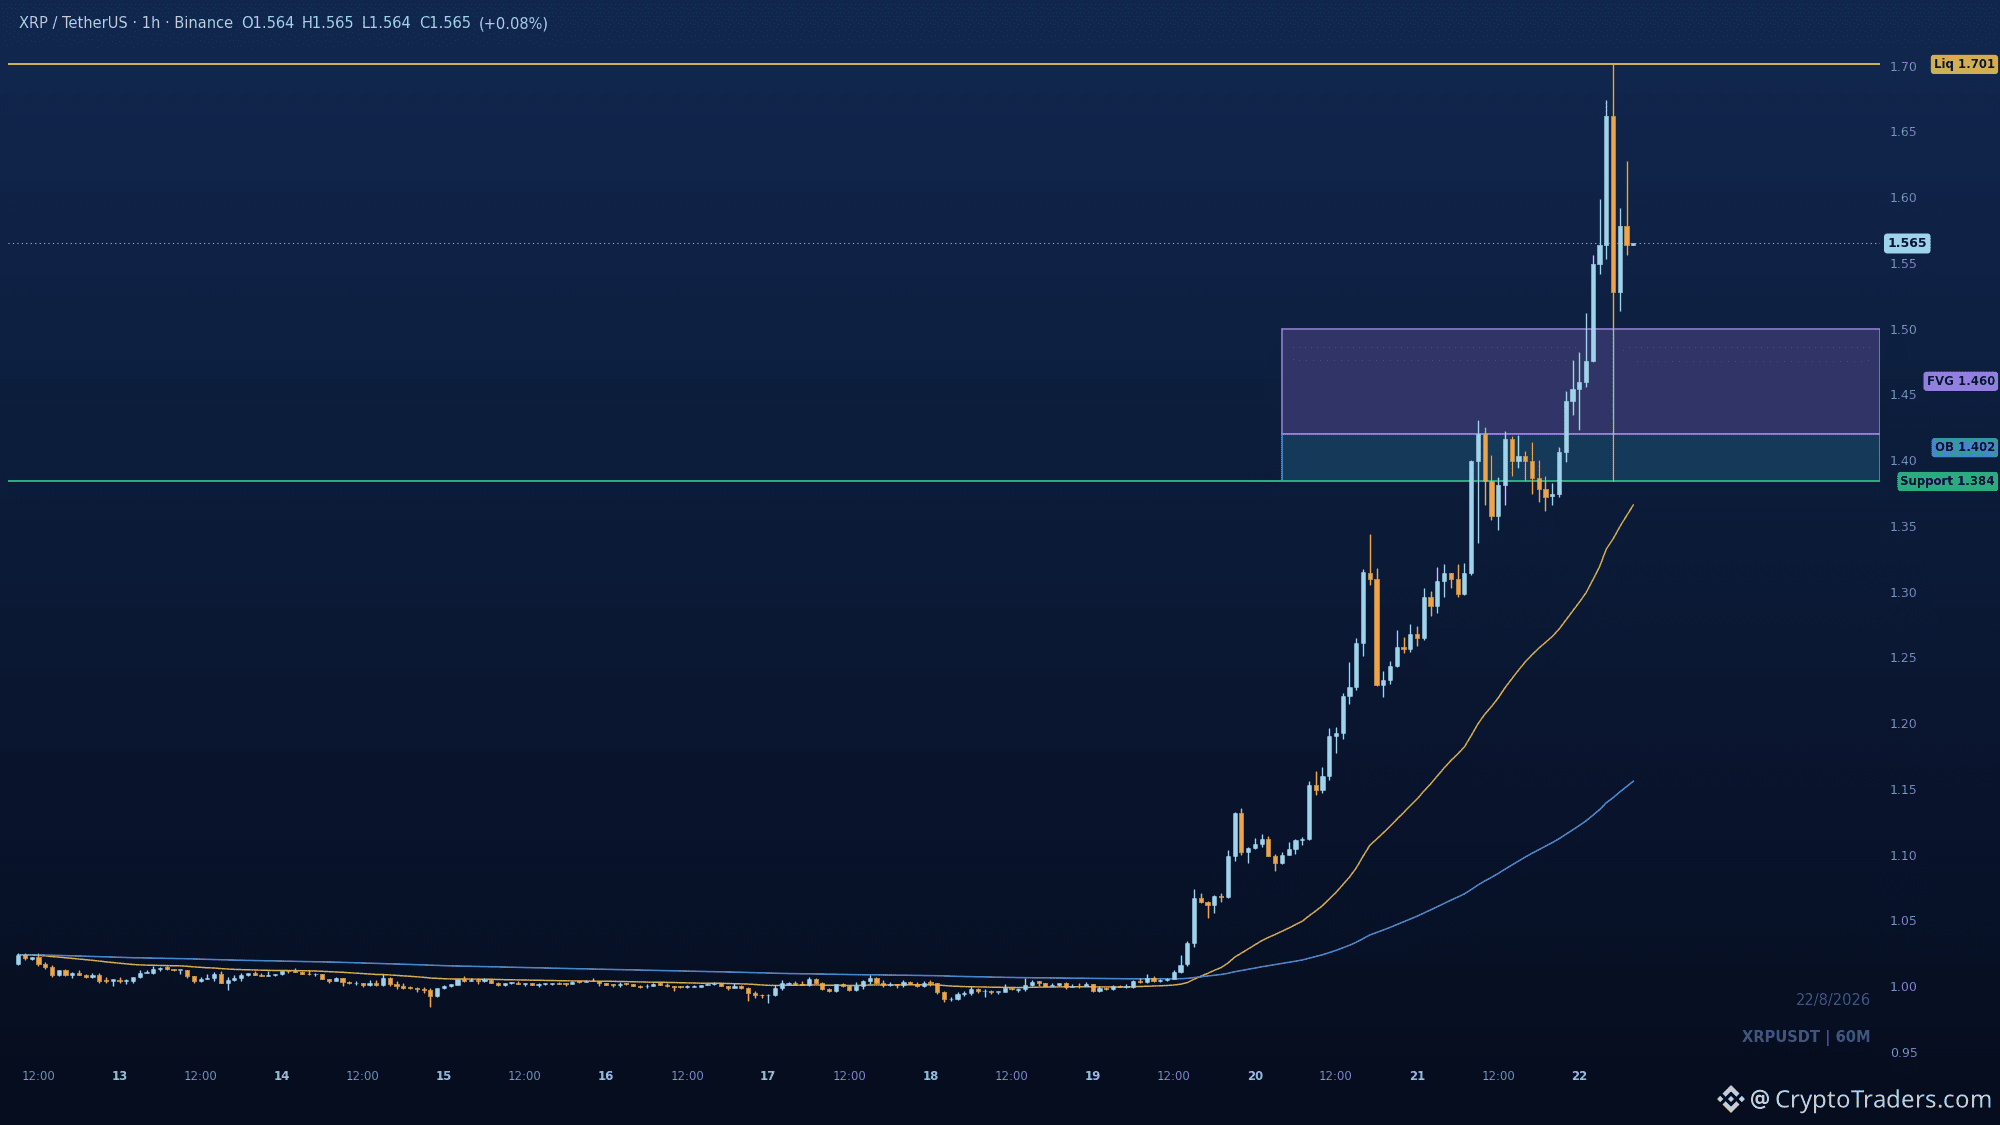
Some are staring at the 1.701 sweep on $XRP , but the trade here is the pullback into the 1.50-1.42 imbalance, not the top long. The 1h chart shows a clean BOS expansion into the buy-side high, then a repricing lower that leaves bulls in control of structure. Demand sits at 1.42-1.3838, the last order block before the impulse, and that is where the bid should defend. A hold above 1.3838 keeps the path open for another run at the 1.701 target. A close below that swing low flips the structure. Are you waiting for the retest of 1.50 or bidding the 1.42 order block? More reads like this land in the group daily, check the bio for the link. #Altcoin Season#
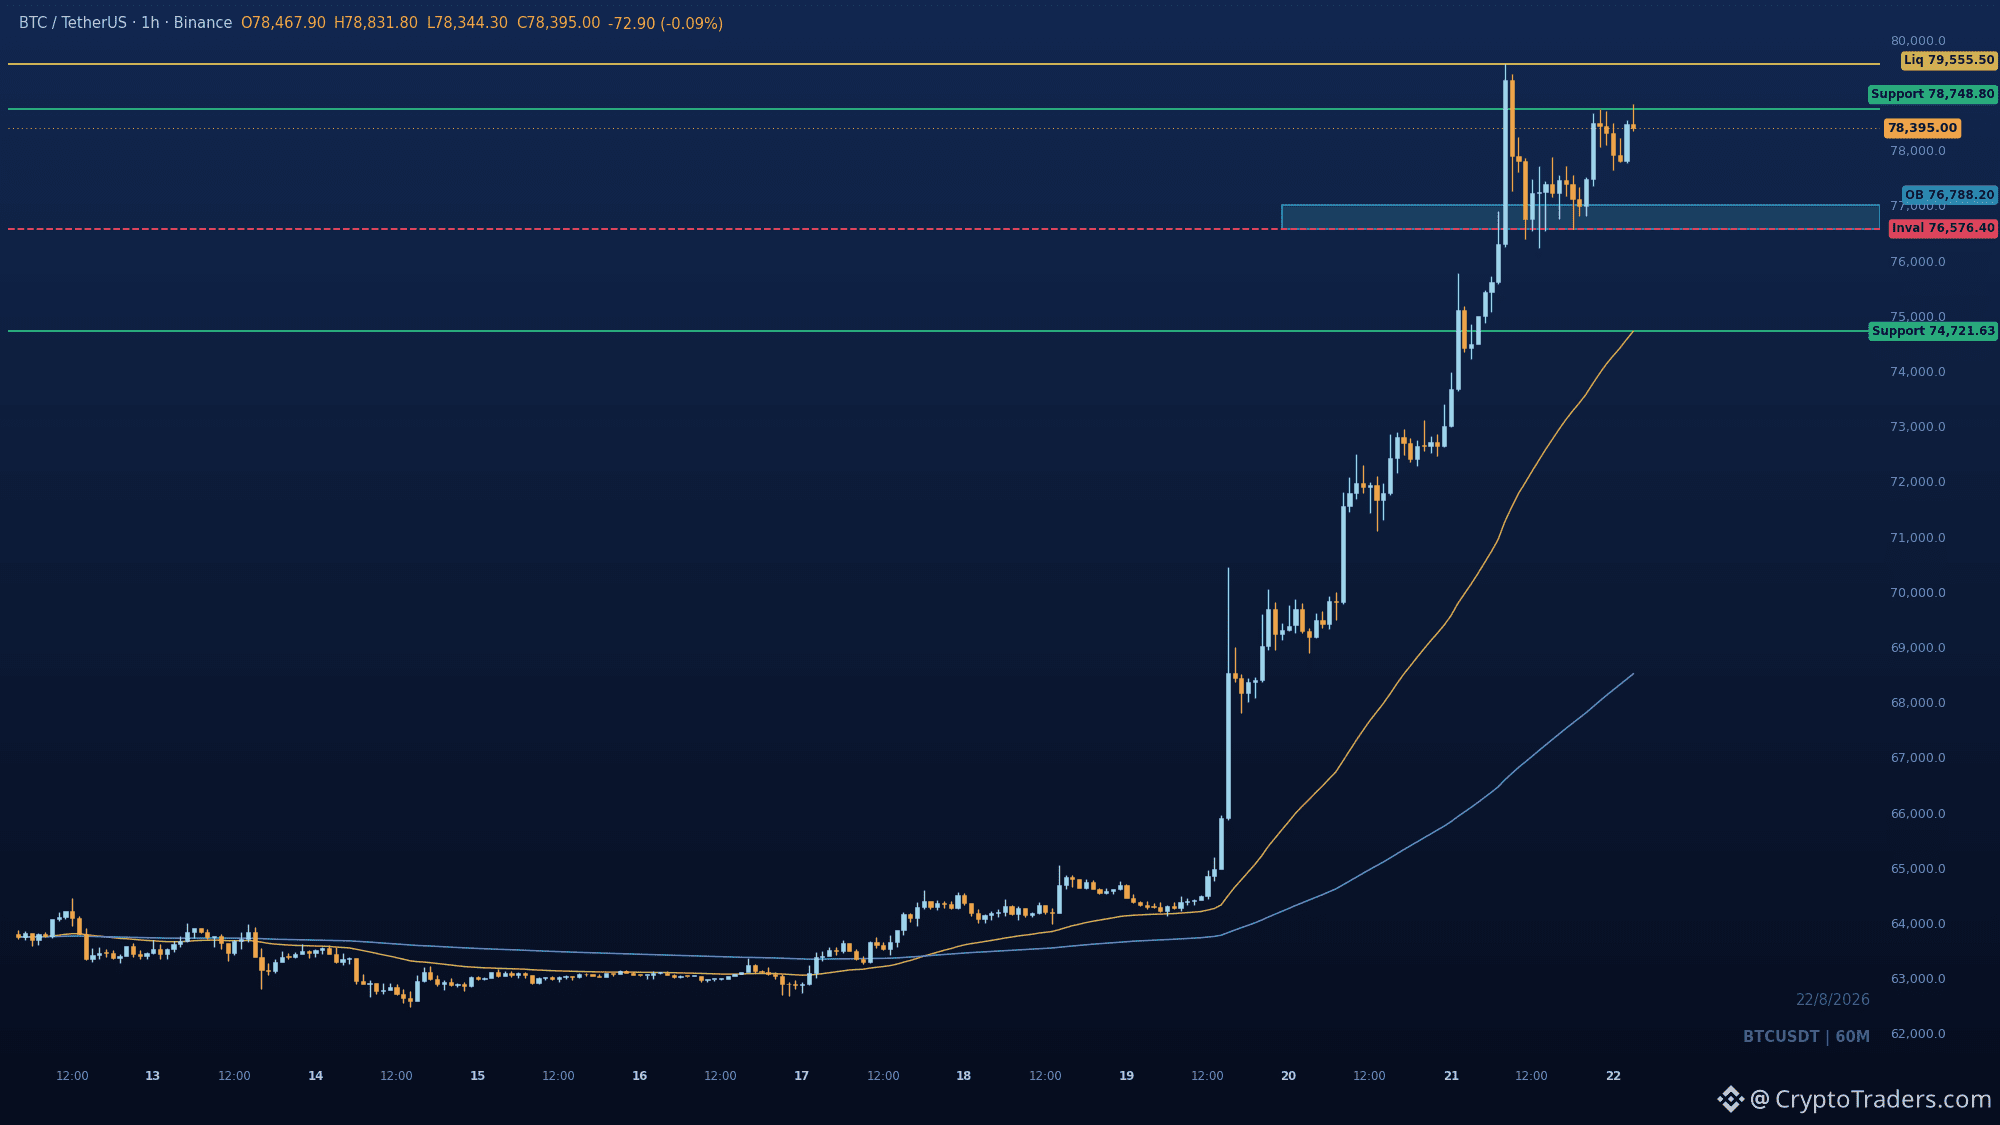
Either $BTC holds 76,576 and grinds back through 78,749 toward 79,556, or that broken swing fails and the bid gets tested. Momentum favors the former. Structure is clean: repeated BOS through prior highs, price now consolidating in premium below the spike high. Key zone is the 76,576-77,000 order block, the last defended demand before the push. A hold there sets up the rotation back through 78,749. Confirmation is a reclaim of 78,749 as support; invalidation is a close below 76,576, which would open the 50 EMA near 74,722. What level are you watching for the next long trigger? More daily chart reads like this in the group, my bio has the link. #BTC Price Analysis# #Bitcoin Price Prediction: What is Bitcoins next move?#
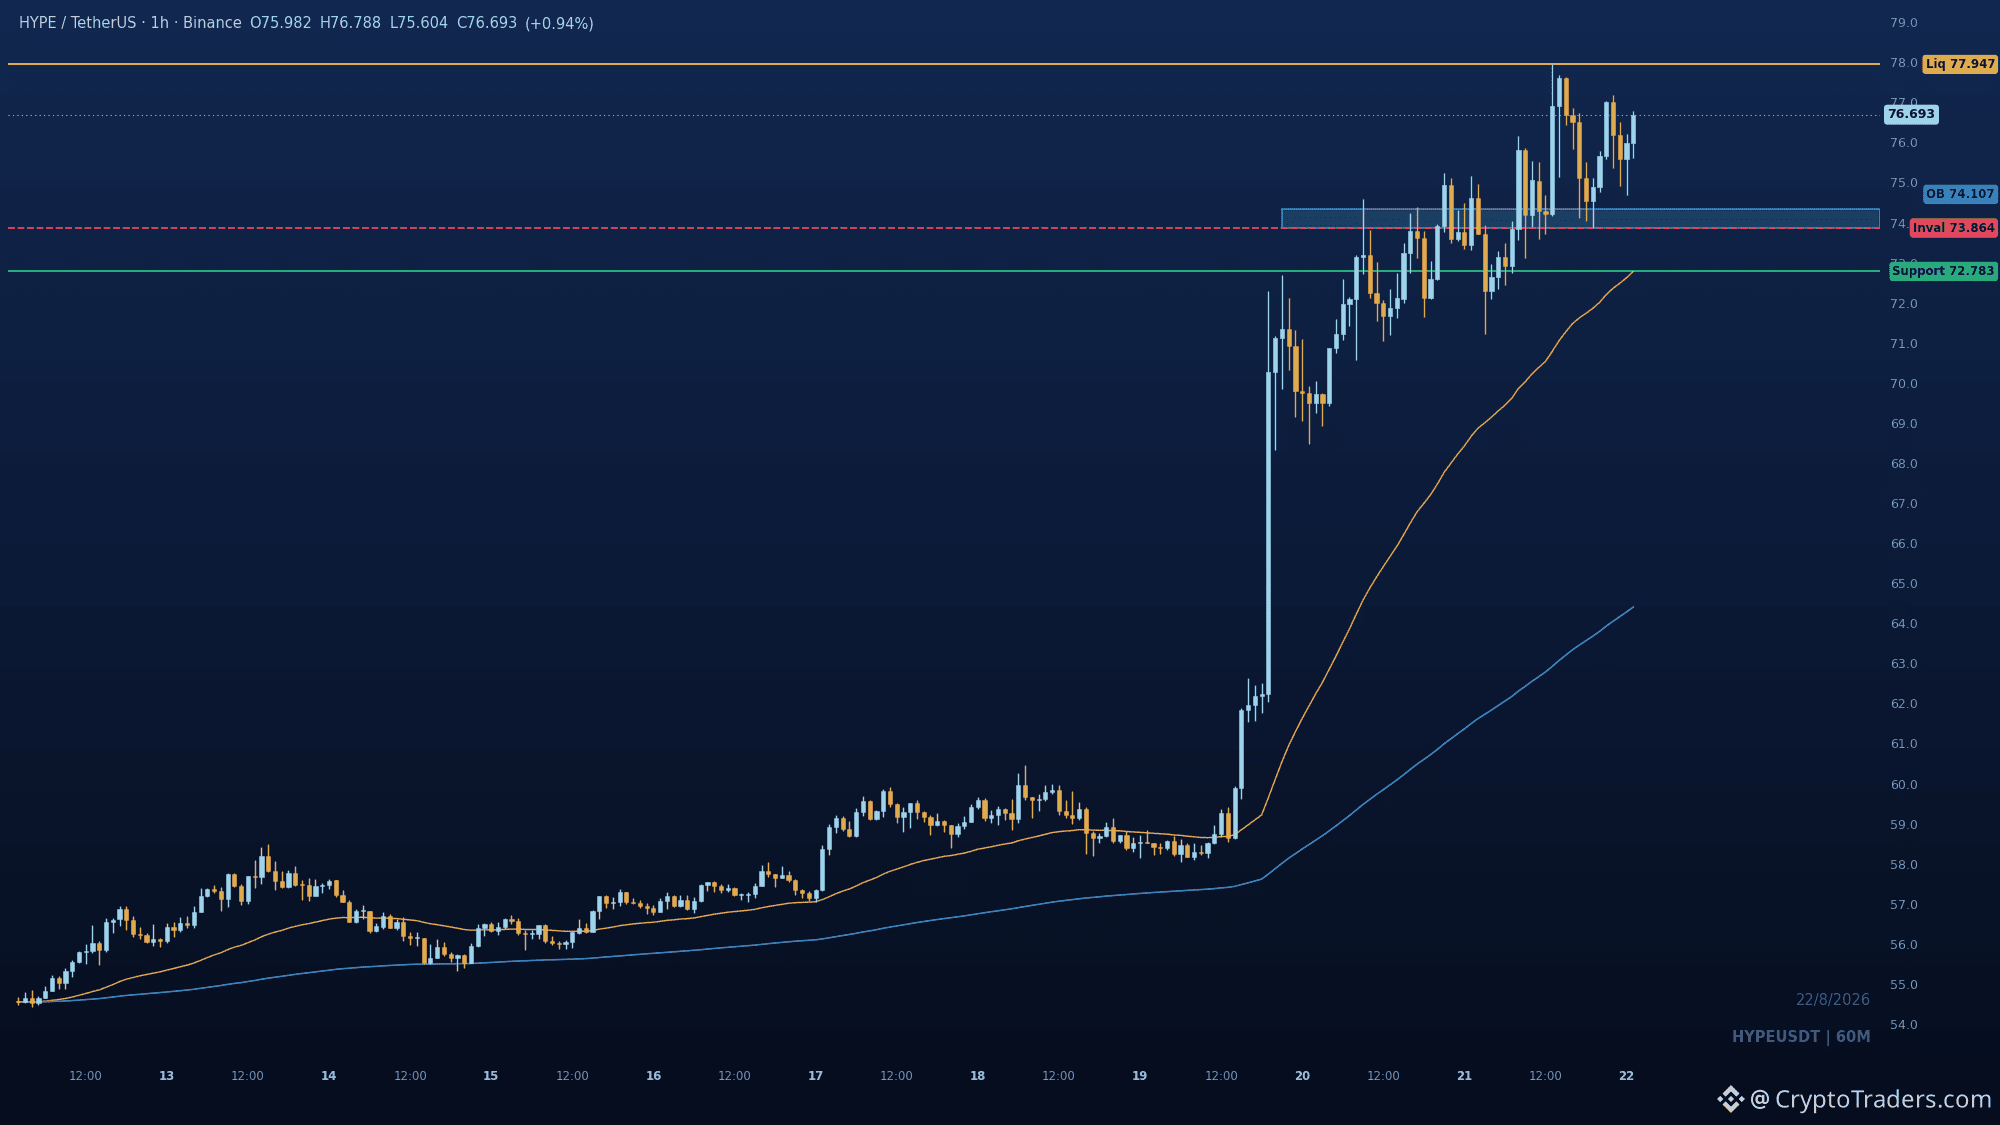
$HYPE buybacks quietly recycle 56.3 percent of perp volume into token demand, a structural bid most alts lack. 1⃣ TradeXYZ's TWAP engine: Deployer fees fund recurring purchases targeting 59,000 HYPE, or 0.0265 percent of circulating supply, while the protocol handles 56.3 percent of Hyperliquid perp volume over 30 days. Higher HIP-3 fees would auto-recycle more activity into buybacks and burns, though the effect hinges on sustained volume. 2⃣ FOLD's fragile math: Interfold requesters pay E3 fees in USDS, so token value relies on operators locking 32,000 FOLD each. With only three operators, requests paused, and major unlocks starting September 1, the 126.39 million FDV is exposed to thin-liquidity selling. 3⃣ ALIGN's 108 percent overhang: The token trades at 0.02159, below CoinList's 0.03 lower option, while 1.7284 billion team and investor tokens unlock at month 12, roughly 108 percent of the 1.6 billion launch float. Unless usage demand accelerates, supply pressure looms large. The standout pattern: HYPE's buyback loop is self-funding, while FOLD and ALIGN rely on future usage that hasn't arrived. Which token's tokenomics would you trust through a bear market? We unpack these flows and more daily in the community, my bio points the way. #Altcoin Season# #Macro Insights#
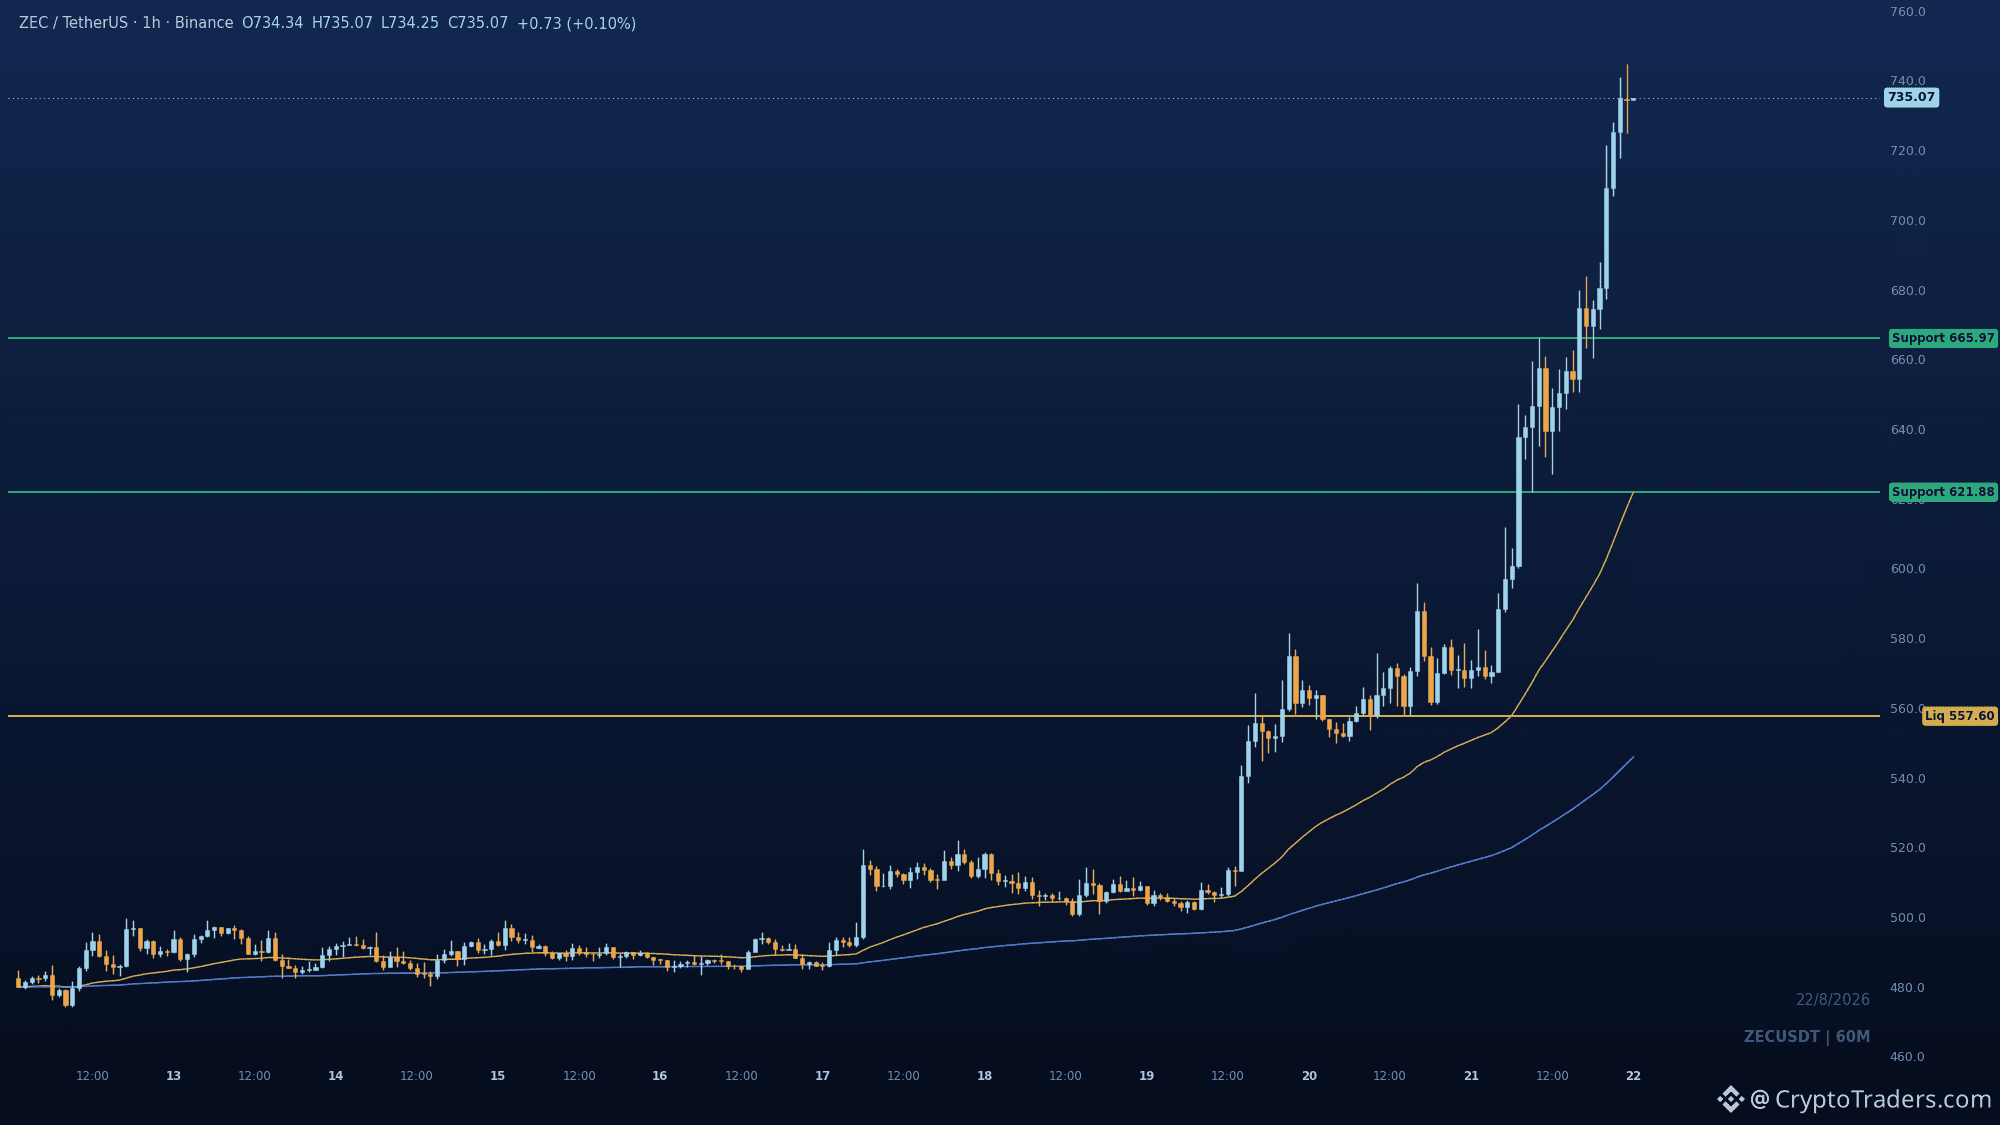
Is the optimal entry on $ZEC the retest of 665.97 after that clean BOS, or are you chasing the momentum at 735? Fresh BOS through 665.97 has price expanding at the top of the range, open upside discovery. Pullback toward 665.97 is the defended flip zone; deeper mean reversion can probe 621.88 before buyers step in. Losing 665.97 invalidates the structure and opens the slide to 557.6 liquidity. Are you waiting for the retest or riding momentum? More daily analysis like this in the group, check the bio. #Altcoin Season#
Log in to explore more content