

AnFX Crypto
901 Posts

AnFX Crypto
Report
Block User
Teknikal Analisis Price Action | Twitter@anFx Crypto
Open Trade
Frequent Trader
2.3 Years
344 Following
126 Followers
246 Liked
Posts
Portfolio
All
Quotes
PINNED
·
--
Hamster Kombat, the popular Telegram-based clicker game, has just released an ambitious roadmap for the end of 2024 and throughout 2025. The development team announced their plans that include NFT integration, development of a Web3 gaming platform, and a token buyback strategy to maintain price stability and reward distribution to players.$HMSTR
#hamsterkombat
{future}(HMSTRUSDT)
Hamster Kombat, the popular Telegram-based clicker game, has just released an ambitious roadmap for the end of 2024 and throughout 2025. The development team announced their plans that include NFT integration, development of a Web3 gaming platform, and a token buyback strategy to maintain price stability and reward distribution to players.$HMSTR
#hamsterkombat
#hamsterkombat

6
24
14.5k
·
--
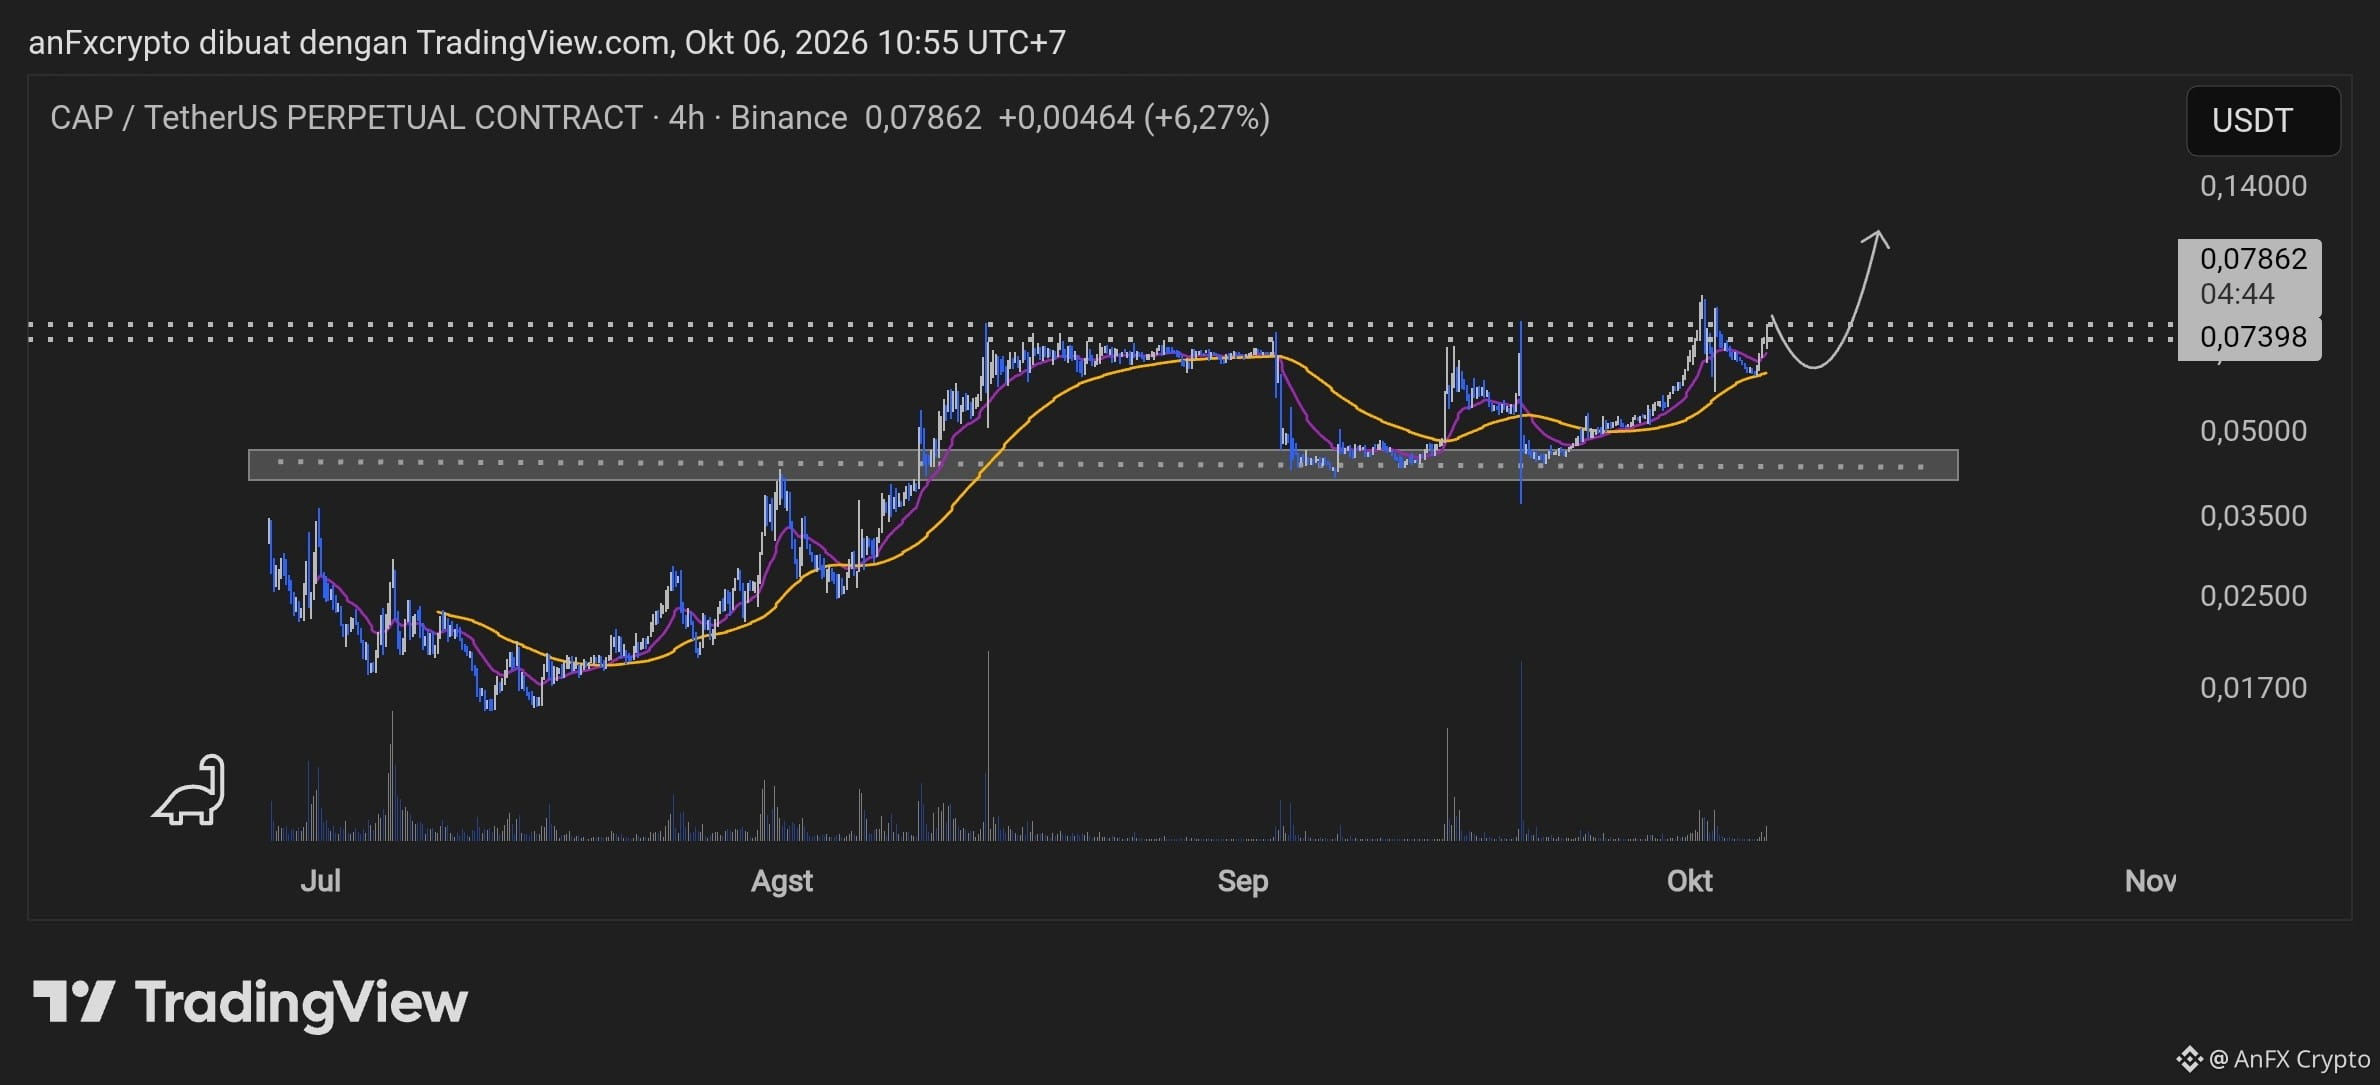
Technical Analysis: $CAP /USDT (Perpetual - 4H)
The market shows a strong Bullish Continuation structure after emerging from a base accumulation phase in the $0.01700 - $0.02500 area.
Trend Structure: The 4H chart is forming a Higher High and Higher Low pattern. The breakout above the key horizontal resistance area around $0.07398 confirms buyer dominance.
Moving Averages (MA): The MA lines (yellow & purple) are below price action and rising sharply, acting as dynamic support that sustains upward momentum.
Price Projection: The ideal scenario is a healthy retest of the former resistance area ($0.0739 - $0.0760) before continuing the rally toward the projected target around $0.14000.
Trading Signal (Execution Plan)
ParameterPrice Level / DetailsPosition DirectionLONG (Buy on Dip)Entry Area$0.0720 - $0.0765 (Wait for a retest / healthy correction)Take Profit 1 (TP 1)$0.0950 (Initial confirmation target)Take Profit 2 (TP 2)$0.1180 (Intermediate resistance)Take Profit 3 (TP 3)$0.1400 (Main breakout projection target)Stop Loss (SL)$0.0650 (Below the local swing low / structure invalidation)Risk/Reward Ratio1 : 3.5+
Risk Management Notes
Capital Allocation: Limit risk to a maximum of 1–2% of total capital per trade.
Leverage Use: Use conservative leverage (3x - 5x) on perpetual contracts to avoid liquidation spike risk due to excessive volatility.
Entry Confirmation: Make sure a rejection pattern (such as a pin bar or bullish engulfing) appears in the entry area before fully opening a position.
{future}(CAPUSDT)
Technical Analysis: $CAP /USDT (Perpetual - 4H)
The market shows a strong Bullish Continuation structure after emerging from a base accumulation phase in the $0.01700 - $0.02500 area.
Trend Structure: The 4H chart is forming a Higher High and Higher Low pattern. The breakout above the key horizontal resistance area around $0.07398 confirms buyer dominance.
Moving Averages (MA): The MA lines (yellow & purple) are below price action and rising sharply, acting as dynamic support that sustains upward momentum.
Price Projection: The ideal scenario is a healthy retest of the former resistance area ($0.0739 - $0.0760) before continuing the rally toward the projected target around $0.14000.
Trading Signal (Execution Plan)
ParameterPrice Level / DetailsPosition DirectionLONG (Buy on Dip)Entry Area$0.0720 - $0.0765 (Wait for a retest / healthy correction)Take Profit 1 (TP 1)$0.0950 (Initial confirmation target)Take Profit 2 (TP 2)$0.1180 (Intermediate resistance)Take Profit 3 (TP 3)$0.1400 (Main breakout projection target)Stop Loss (SL)$0.0650 (Below the local swing low / structure invalidation)Risk/Reward Ratio1 : 3.5+
Risk Management Notes
Capital Allocation: Limit risk to a maximum of 1–2% of total capital per trade.
Leverage Use: Use conservative leverage (3x - 5x) on perpetual contracts to avoid liquidation spike risk due to excessive volatility.
Entry Confirmation: Make sure a rejection pattern (such as a pin bar or bullish engulfing) appears in the entry area before fully opening a position.
The market shows a strong Bullish Continuation structure after emerging from a base accumulation phase in the $0.01700 - $0.02500 area.
Trend Structure: The 4H chart is forming a Higher High and Higher Low pattern. The breakout above the key horizontal resistance area around $0.07398 confirms buyer dominance.
Moving Averages (MA): The MA lines (yellow & purple) are below price action and rising sharply, acting as dynamic support that sustains upward momentum.
Price Projection: The ideal scenario is a healthy retest of the former resistance area ($0.0739 - $0.0760) before continuing the rally toward the projected target around $0.14000.
Trading Signal (Execution Plan)
ParameterPrice Level / DetailsPosition DirectionLONG (Buy on Dip)Entry Area$0.0720 - $0.0765 (Wait for a retest / healthy correction)Take Profit 1 (TP 1)$0.0950 (Initial confirmation target)Take Profit 2 (TP 2)$0.1180 (Intermediate resistance)Take Profit 3 (TP 3)$0.1400 (Main breakout projection target)Stop Loss (SL)$0.0650 (Below the local swing low / structure invalidation)Risk/Reward Ratio1 : 3.5+
Risk Management Notes
Capital Allocation: Limit risk to a maximum of 1–2% of total capital per trade.
Leverage Use: Use conservative leverage (3x - 5x) on perpetual contracts to avoid liquidation spike risk due to excessive volatility.
Entry Confirmation: Make sure a rejection pattern (such as a pin bar or bullish engulfing) appears in the entry area before fully opening a position.
194
·
--
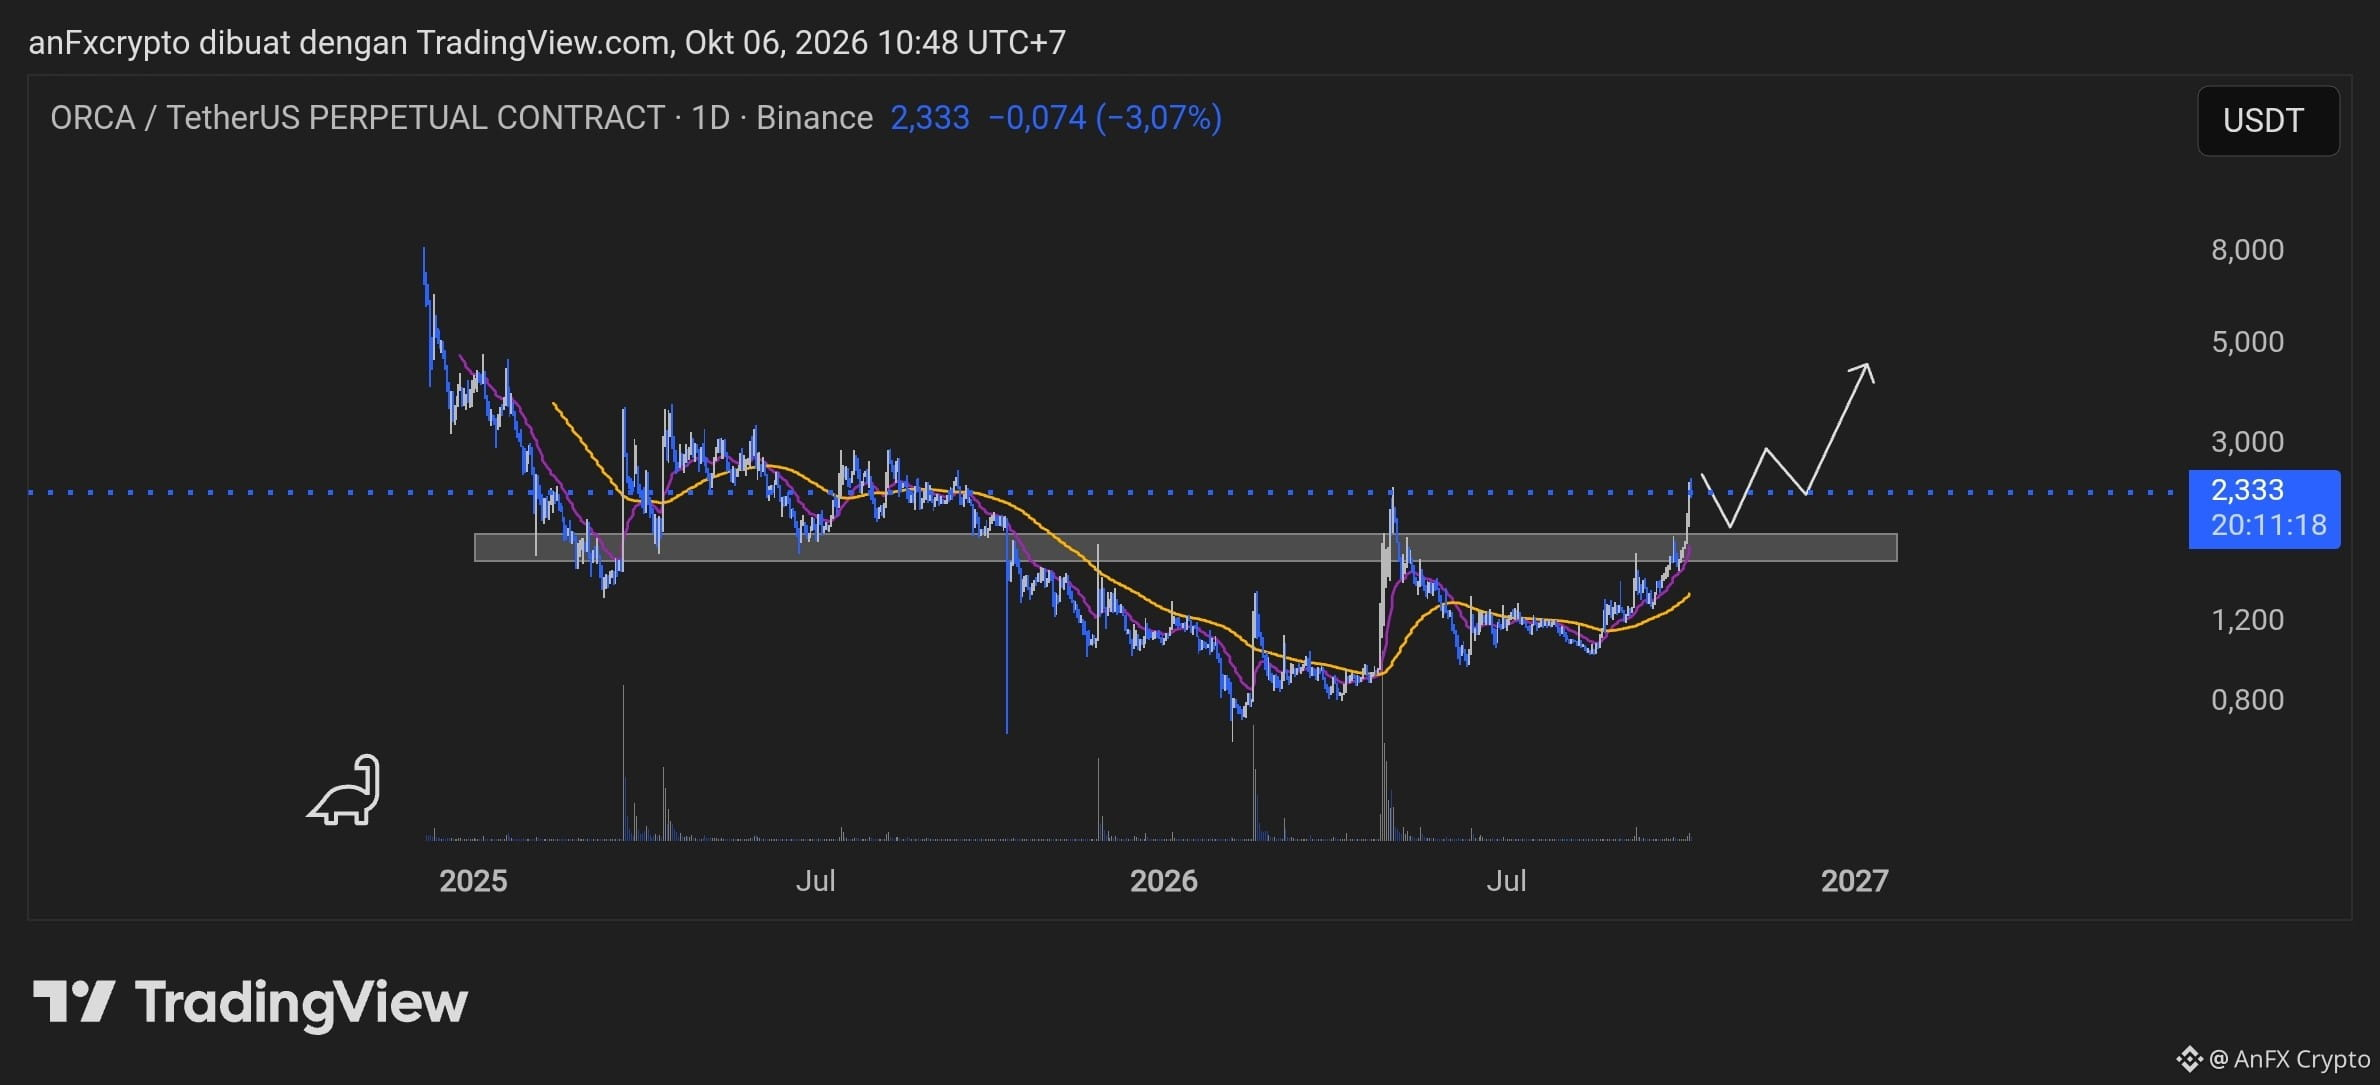
The $ORCA /USDT chart on the daily timeframe (1D) shows early signs of a trend reversal (bullish reversal) following a fairly long accumulation phase.
Technical Analysis
Market Structure: After a downtrend from its peak around 8,000 USDT to a low of 0,800 USDT, the price formed a Rounding Bottom pattern. The current price is 2,333 USDT and has successfully broken through the horizontal resistance zone (the gray area between 1,800–2,000 USDT).
Role Reversal of Levels (RBS): The 1,800–2,000 USDT area could now become a new support level (Resistance-turned-Support).
Moving Average: The moving average indicator is beginning to curve upward beneath the candlestick movement, signaling the potential formation of medium-term bullish momentum.
Price Outlook: Based on the projected path shown on the chart, the best opportunity is to wait for a healthy correction (pullback) to the support area before the price resumes strengthening toward the next target area.
Trading Signal Plan (Swing Trade)
Position Type: Long (Buy)
Entry Zone (Buy Limit): 1,850–2,100 USDT (Wait for a pullback to the support area)
Take Profit 1 (TP 1): 3,000 USDT
Take Profit 2 (TP 2): 4,500 USDT
Stop Loss (SL): 1,650 USDT (Below the lower boundary of the support zone)
Risk-to-Reward Ratio: ~ 1 : 3.5
Risk Management & Execution Strategy
Buying Approach: Avoid impulsive buying (FOMO) at the current market price (2,333 USDT). Place staggered buy orders within the entry range.
Capital Allocation: Limit risk to a maximum of 1–2% of the account's total equity per trade.
Profit Protection: Once the price reaches TP 1 at 3,000 USDT, immediately move the Stop Loss to the Break-Even point (purchase price) to protect the position from a potential sudden reversal.
{future}(ORCAUSDT)
The $ORCA /USDT chart on the daily timeframe (1D) shows early signs of a trend reversal (bullish reversal) following a fairly long accumulation phase.
Technical Analysis
Market Structure: After a downtrend from its peak around 8,000 USDT to a low of 0,800 USDT, the price formed a Rounding Bottom pattern. The current price is 2,333 USDT and has successfully broken through the horizontal resistance zone (the gray area between 1,800–2,000 USDT).
Role Reversal of Levels (RBS): The 1,800–2,000 USDT area could now become a new support level (Resistance-turned-Support).
Moving Average: The moving average indicator is beginning to curve upward beneath the candlestick movement, signaling the potential formation of medium-term bullish momentum.
Price Outlook: Based on the projected path shown on the chart, the best opportunity is to wait for a healthy correction (pullback) to the support area before the price resumes strengthening toward the next target area.
Trading Signal Plan (Swing Trade)
Position Type: Long (Buy)
Entry Zone (Buy Limit): 1,850–2,100 USDT (Wait for a pullback to the support area)
Take Profit 1 (TP 1): 3,000 USDT
Take Profit 2 (TP 2): 4,500 USDT
Stop Loss (SL): 1,650 USDT (Below the lower boundary of the support zone)
Risk-to-Reward Ratio: ~ 1 : 3.5
Risk Management & Execution Strategy
Buying Approach: Avoid impulsive buying (FOMO) at the current market price (2,333 USDT). Place staggered buy orders within the entry range.
Capital Allocation: Limit risk to a maximum of 1–2% of the account's total equity per trade.
Profit Protection: Once the price reaches TP 1 at 3,000 USDT, immediately move the Stop Loss to the Break-Even point (purchase price) to protect the position from a potential sudden reversal.
Technical Analysis
Market Structure: After a downtrend from its peak around 8,000 USDT to a low of 0,800 USDT, the price formed a Rounding Bottom pattern. The current price is 2,333 USDT and has successfully broken through the horizontal resistance zone (the gray area between 1,800–2,000 USDT).
Role Reversal of Levels (RBS): The 1,800–2,000 USDT area could now become a new support level (Resistance-turned-Support).
Moving Average: The moving average indicator is beginning to curve upward beneath the candlestick movement, signaling the potential formation of medium-term bullish momentum.
Price Outlook: Based on the projected path shown on the chart, the best opportunity is to wait for a healthy correction (pullback) to the support area before the price resumes strengthening toward the next target area.
Trading Signal Plan (Swing Trade)
Position Type: Long (Buy)
Entry Zone (Buy Limit): 1,850–2,100 USDT (Wait for a pullback to the support area)
Take Profit 1 (TP 1): 3,000 USDT
Take Profit 2 (TP 2): 4,500 USDT
Stop Loss (SL): 1,650 USDT (Below the lower boundary of the support zone)
Risk-to-Reward Ratio: ~ 1 : 3.5
Risk Management & Execution Strategy
Buying Approach: Avoid impulsive buying (FOMO) at the current market price (2,333 USDT). Place staggered buy orders within the entry range.
Capital Allocation: Limit risk to a maximum of 1–2% of the account's total equity per trade.
Profit Protection: Once the price reaches TP 1 at 3,000 USDT, immediately move the Stop Loss to the Break-Even point (purchase price) to protect the position from a potential sudden reversal.
351
·
--
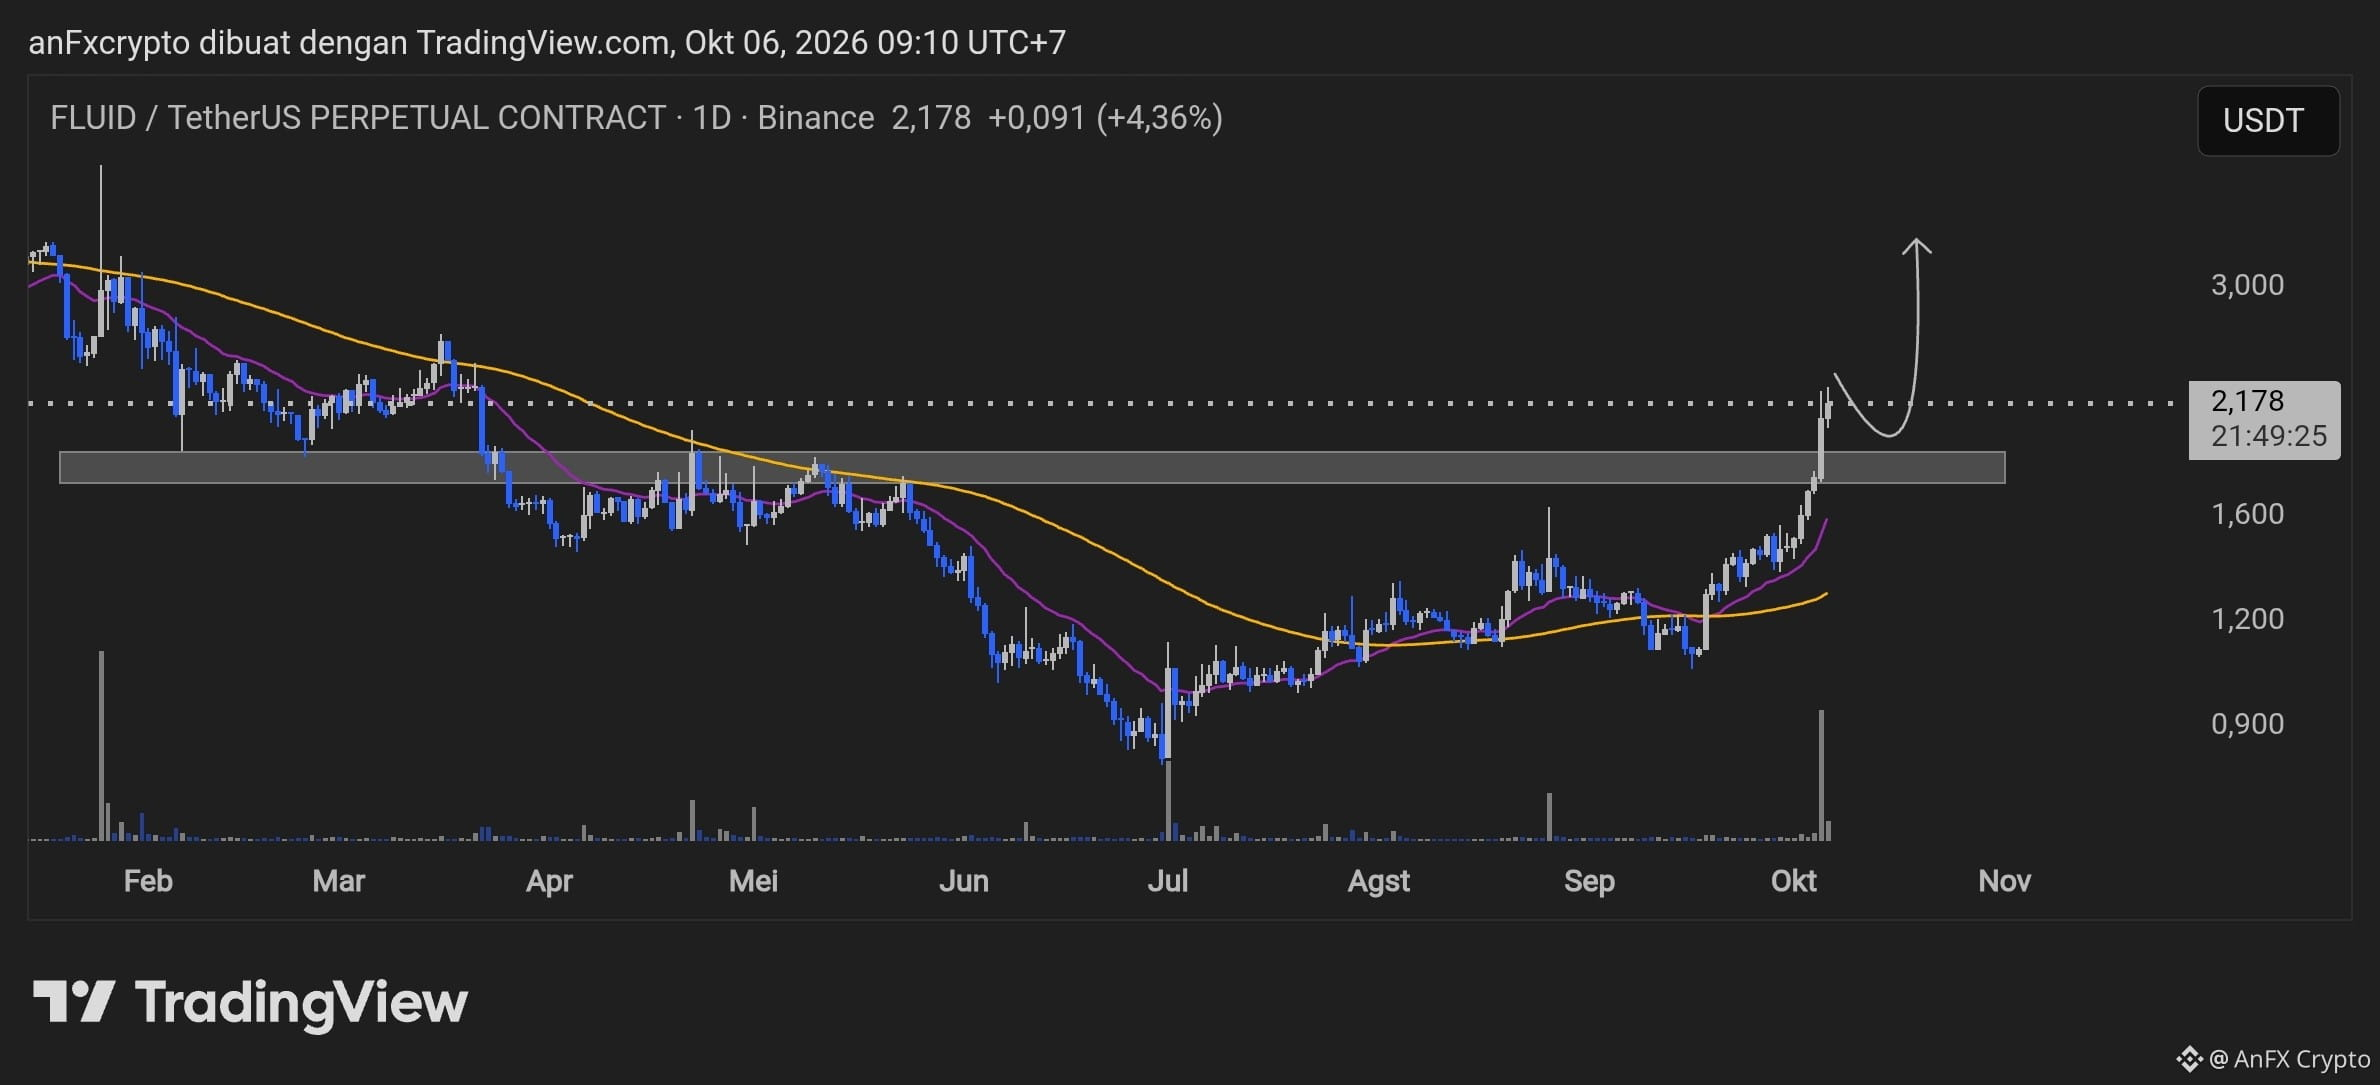
Technical Analysis ($FLUID /USDT - Timeframe 1D)
Trend Structure: Bullish reversal following a turn from the base accumulation area (bottoming phase) around 0.800–1.000 USDT.
Major Breakout: The price successfully broke through the key resistance zone at 1.700–1.850 USDT, marked by a surge in trading volume.
Movement Indicator: The Moving Average (MA) lines have formed a Golden Cross and are sloping upward, confirming strong bullish momentum.
Price Projection: The ideal scenario suggests a healthy correction (pullback/retest) to the new support zone (former resistance) before continuing upward toward the psychological target around 3.000 USDT.
Trading Signal Plan (Long / Buy on Dip)
Position: LONG (Spot / Futures)
Entry Area (Buy Limit): 1.850–2.050 USDT (wait for confirmation of a retest of the demand area)
Take Profit 1 (TP1): 2.500 USDT
Take Profit 2 (TP2): 3.000 USDT
Take Profit 3 (TP3): 3.300 USDT
Stop Loss (SL): 1.650 USDT (placed below the nearest support area)
Risk-to-Reward Ratio (RRR): ~1:3
Recommended Leverage: Maximum 2x–5x (Futures), or Spot Trading is recommended to minimize the risk of liquidation from short-term fluctuations.
Risk Management & Execution Strategy
Capital Allocation: Use a maximum of 3%–5% of your total trading portfolio for this position.
Avoid FOMO: Do not enter immediately at the current market price (2.178 USDT), as the position could be exposed to a short-term correction. Let the price approach the nearest entry area to achieve an optimal risk ratio.
Position Management: Move the Stop Loss to the Break-Even (BEP) level after TP1 is reached to secure your capital.
{future}(FLUIDUSDT)
Technical Analysis ($FLUID /USDT - Timeframe 1D)
Trend Structure: Bullish reversal following a turn from the base accumulation area (bottoming phase) around 0.800–1.000 USDT.
Major Breakout: The price successfully broke through the key resistance zone at 1.700–1.850 USDT, marked by a surge in trading volume.
Movement Indicator: The Moving Average (MA) lines have formed a Golden Cross and are sloping upward, confirming strong bullish momentum.
Price Projection: The ideal scenario suggests a healthy correction (pullback/retest) to the new support zone (former resistance) before continuing upward toward the psychological target around 3.000 USDT.
Trading Signal Plan (Long / Buy on Dip)
Position: LONG (Spot / Futures)
Entry Area (Buy Limit): 1.850–2.050 USDT (wait for confirmation of a retest of the demand area)
Take Profit 1 (TP1): 2.500 USDT
Take Profit 2 (TP2): 3.000 USDT
Take Profit 3 (TP3): 3.300 USDT
Stop Loss (SL): 1.650 USDT (placed below the nearest support area)
Risk-to-Reward Ratio (RRR): ~1:3
Recommended Leverage: Maximum 2x–5x (Futures), or Spot Trading is recommended to minimize the risk of liquidation from short-term fluctuations.
Risk Management & Execution Strategy
Capital Allocation: Use a maximum of 3%–5% of your total trading portfolio for this position.
Avoid FOMO: Do not enter immediately at the current market price (2.178 USDT), as the position could be exposed to a short-term correction. Let the price approach the nearest entry area to achieve an optimal risk ratio.
Position Management: Move the Stop Loss to the Break-Even (BEP) level after TP1 is reached to secure your capital.
Trend Structure: Bullish reversal following a turn from the base accumulation area (bottoming phase) around 0.800–1.000 USDT.
Major Breakout: The price successfully broke through the key resistance zone at 1.700–1.850 USDT, marked by a surge in trading volume.
Movement Indicator: The Moving Average (MA) lines have formed a Golden Cross and are sloping upward, confirming strong bullish momentum.
Price Projection: The ideal scenario suggests a healthy correction (pullback/retest) to the new support zone (former resistance) before continuing upward toward the psychological target around 3.000 USDT.
Trading Signal Plan (Long / Buy on Dip)
Position: LONG (Spot / Futures)
Entry Area (Buy Limit): 1.850–2.050 USDT (wait for confirmation of a retest of the demand area)
Take Profit 1 (TP1): 2.500 USDT
Take Profit 2 (TP2): 3.000 USDT
Take Profit 3 (TP3): 3.300 USDT
Stop Loss (SL): 1.650 USDT (placed below the nearest support area)
Risk-to-Reward Ratio (RRR): ~1:3
Recommended Leverage: Maximum 2x–5x (Futures), or Spot Trading is recommended to minimize the risk of liquidation from short-term fluctuations.
Risk Management & Execution Strategy
Capital Allocation: Use a maximum of 3%–5% of your total trading portfolio for this position.
Avoid FOMO: Do not enter immediately at the current market price (2.178 USDT), as the position could be exposed to a short-term correction. Let the price approach the nearest entry area to achieve an optimal risk ratio.
Position Management: Move the Stop Loss to the Break-Even (BEP) level after TP1 is reached to secure your capital.
135
·
--
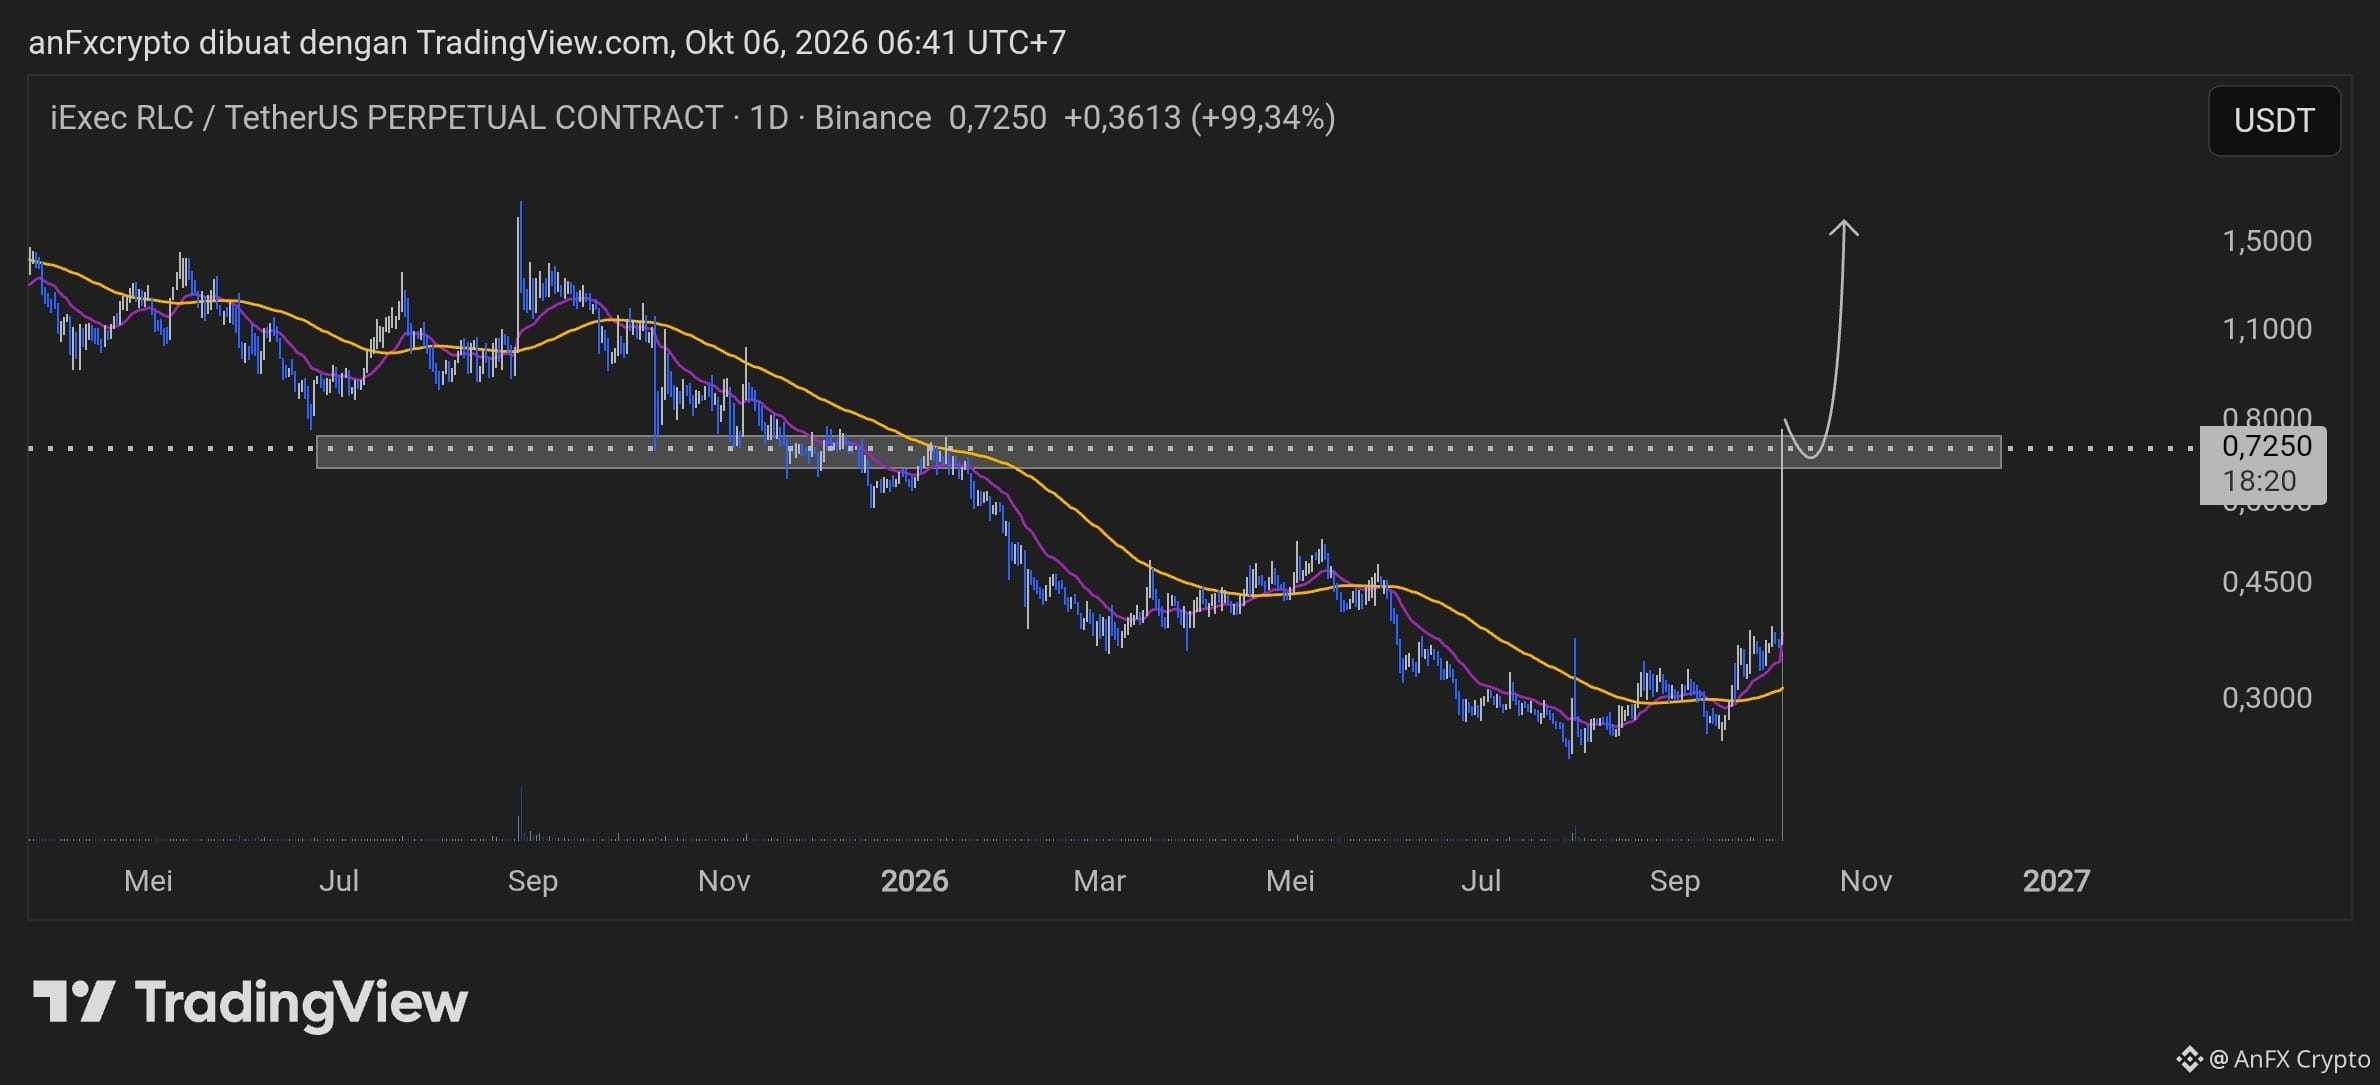
Technical Analysis $RLC /USDT (Timeframe 1D)
Market Structure: A strong impulsive breakout (+99.34%) occurred after a long-term accumulation phase ($0.2500 - $0.3500). This move successfully broke through the Moving Average indicators with significant volume.
Key Resistance Zone ($0.7000 - $0.8000): The price is currently stalling right at a historical supply zone. Technically, a sudden spike in a single daily candle could trigger short-term profit-taking.
Price Projection: The most rational scenario is to wait for a healthy correction (retest) of the lower boundary of the gray zone to confirm resistance-turned-support before continuing the uptrend toward the main target at $1.5000.
Trading Signal (Buy on Dip)
Pair: RLC/USDT Perpetual
Bias: Bullish (Long)
Entry Area: $0.6800 - $0.7250
Take Profit (TP):
TP 1: $0.9500
TP 2: $1.2000
TP 3: $1.5000
Stop Loss (SL): $0.5900
{future}(RLCUSDT)
Risk-to-Reward Ratio: 1 : 3.8
Risk Management & Execution
Avoid making FOMO-driven decisions to open a Market Buy position at the current market price ($0.7250) without waiting for signs of consolidation in the retest area.
Given the extremely high daily volatility, limit leverage to a maximum of 2x - 5x and risk no more than 1% - 2% of total equity.
Technical Analysis $RLC /USDT (Timeframe 1D)
Market Structure: A strong impulsive breakout (+99.34%) occurred after a long-term accumulation phase ($0.2500 - $0.3500). This move successfully broke through the Moving Average indicators with significant volume.
Key Resistance Zone ($0.7000 - $0.8000): The price is currently stalling right at a historical supply zone. Technically, a sudden spike in a single daily candle could trigger short-term profit-taking.
Price Projection: The most rational scenario is to wait for a healthy correction (retest) of the lower boundary of the gray zone to confirm resistance-turned-support before continuing the uptrend toward the main target at $1.5000.
Trading Signal (Buy on Dip)
Pair: RLC/USDT Perpetual
Bias: Bullish (Long)
Entry Area: $0.6800 - $0.7250
Take Profit (TP):
TP 1: $0.9500
TP 2: $1.2000
TP 3: $1.5000
Stop Loss (SL): $0.5900
Risk-to-Reward Ratio: 1 : 3.8
Risk Management & Execution
Avoid making FOMO-driven decisions to open a Market Buy position at the current market price ($0.7250) without waiting for signs of consolidation in the retest area.
Given the extremely high daily volatility, limit leverage to a maximum of 2x - 5x and risk no more than 1% - 2% of total equity.
Market Structure: A strong impulsive breakout (+99.34%) occurred after a long-term accumulation phase ($0.2500 - $0.3500). This move successfully broke through the Moving Average indicators with significant volume.
Key Resistance Zone ($0.7000 - $0.8000): The price is currently stalling right at a historical supply zone. Technically, a sudden spike in a single daily candle could trigger short-term profit-taking.
Price Projection: The most rational scenario is to wait for a healthy correction (retest) of the lower boundary of the gray zone to confirm resistance-turned-support before continuing the uptrend toward the main target at $1.5000.
Trading Signal (Buy on Dip)
Pair: RLC/USDT Perpetual
Bias: Bullish (Long)
Entry Area: $0.6800 - $0.7250
Take Profit (TP):
TP 1: $0.9500
TP 2: $1.2000
TP 3: $1.5000
Stop Loss (SL): $0.5900
Risk-to-Reward Ratio: 1 : 3.8
Risk Management & Execution
Avoid making FOMO-driven decisions to open a Market Buy position at the current market price ($0.7250) without waiting for signs of consolidation in the retest area.
Given the extremely high daily volatility, limit leverage to a maximum of 2x - 5x and risk no more than 1% - 2% of total equity.
1.1k
·
--
Technical Analysis: $BEAMX /USDT (Perpetual Contract - 1D Chart)
1. Market Structure & Price Action
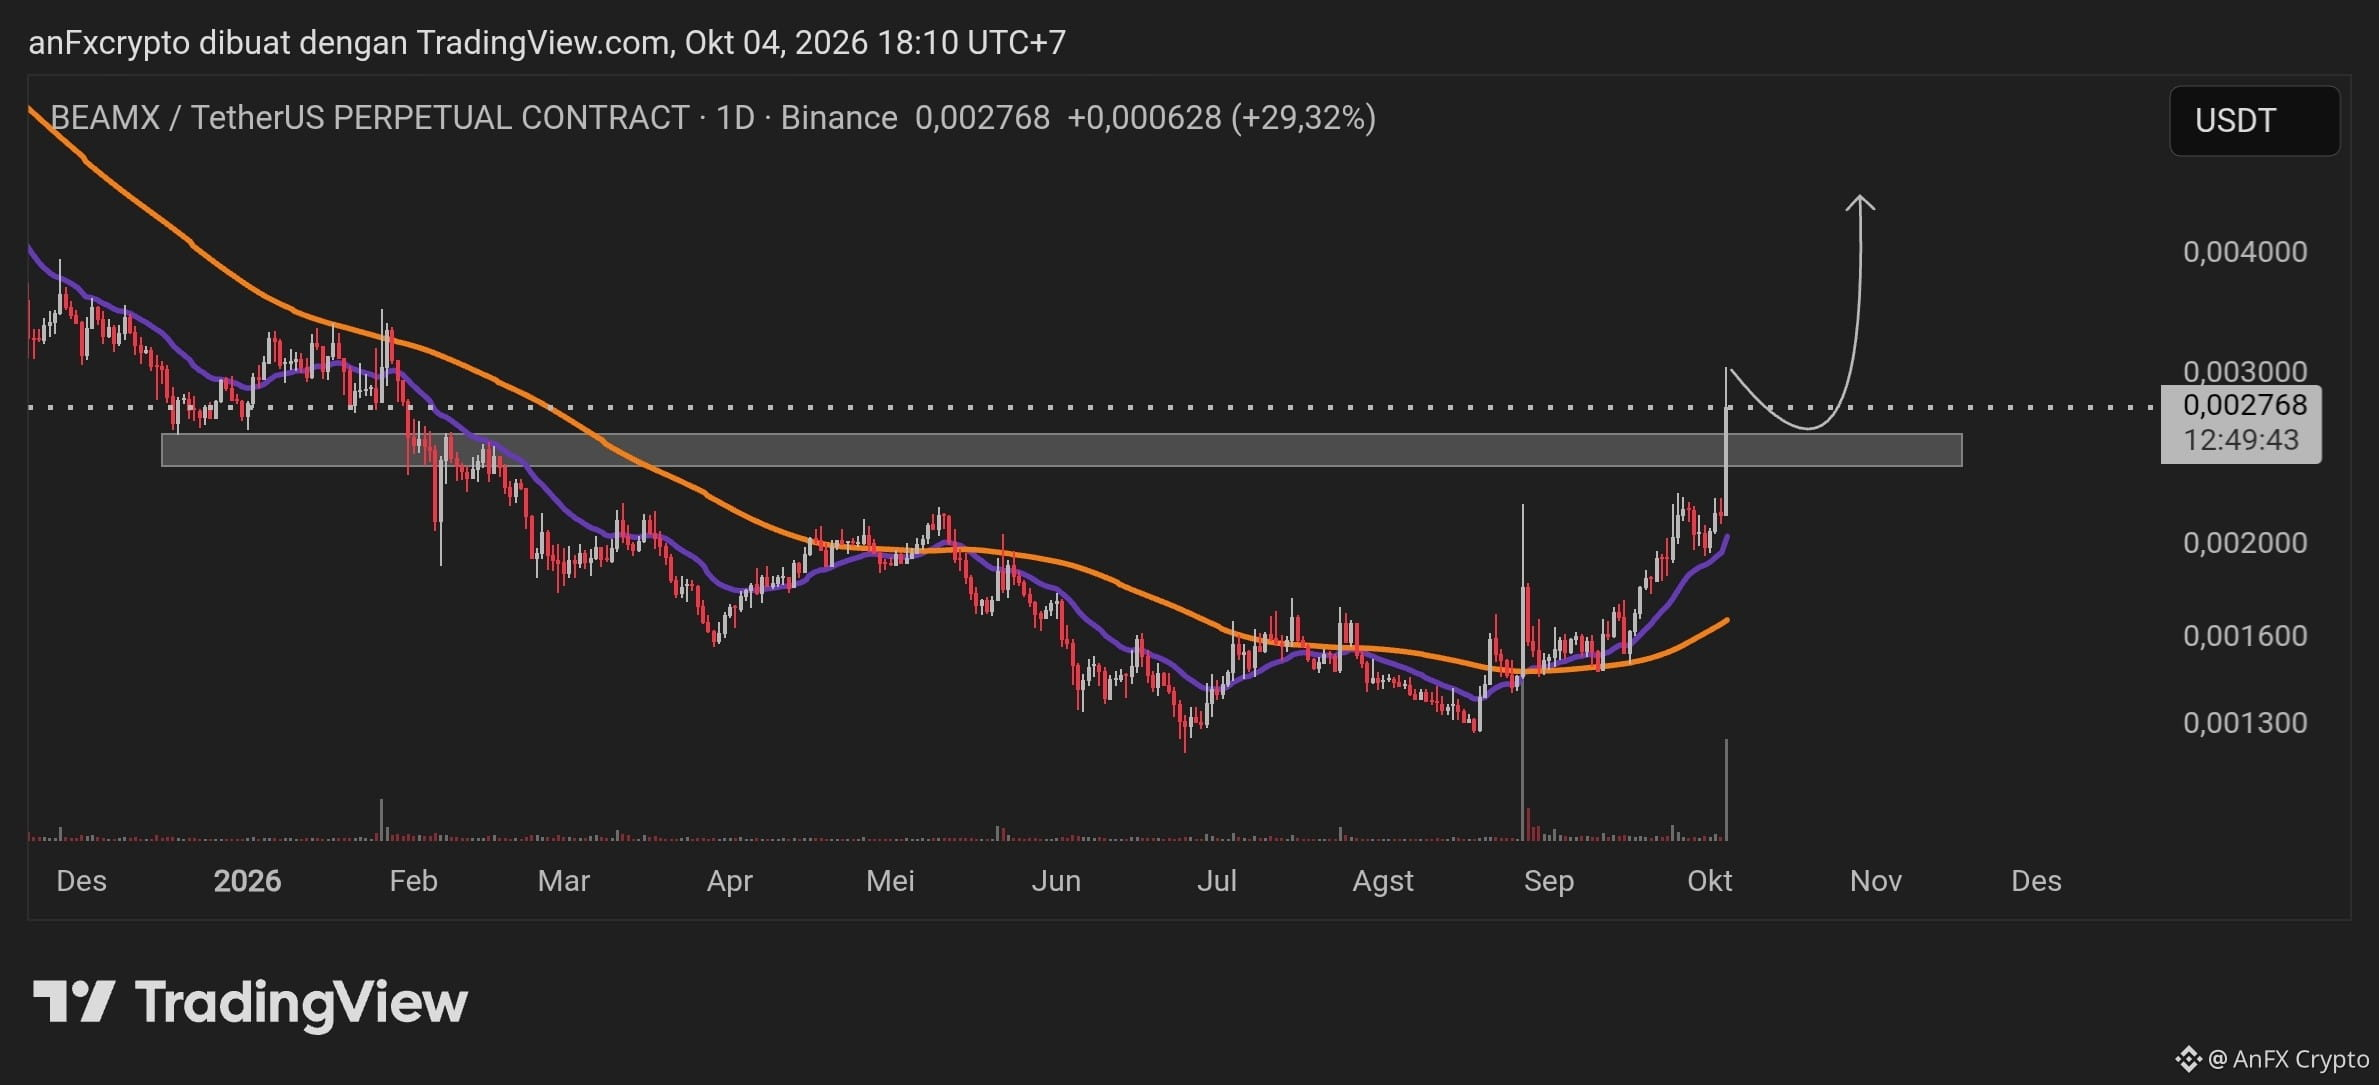
Breakout Structure (Change of Character): After a consolidation phase and a sufficiently long downtrend in the $0.001300 - $0.001600 range, price managed to make a strong bullish push (+29.32%), breaking through the key resistance area at $0.002400 - $0.002600 (gray box).
Moving Average Confirmation (MA): The short-period MA indicator line (purple) has crossed upward above the long-term MA (orange), and both lines have started to curve upward, indicating a momentum shift from bearish to bullish.
Volume Confirmation: A significant spike in trading volume occurred when the breakout candle formed, indicating aggressive accumulation from institutions/buyers.
Retest Projection: Chasing the price at the impulsive peak ($0,002768) carries the risk of a pullback. The most conservative and rational scenario is to wait for price to undergo a throwback/retest to the Resistance Become Support (RBS) area before continuing the move higher toward the $0,004000+ target.
2. Trading Signals (Trading Setup)
Pair: BEAMX/USDT (Spot / Futures)
Position Direction: LONG / BUY (Limit Order)
Entry Zone: $0,002450 – $0,002600 (Gray box retest area)
Stop Loss (SL): $0,002200 (Below the lower boundary of the retest support; risk limit ~10%–13%)
Take Profit (TP):
TP 1: $0,003200 (Conservative target / retest of the local high)
TP 2: $0,004000 (Main target in line with the chart projection)
TP 3: $0,004500 (Extension target)
Risk-to-Reward Ratio (RRR): 1 : 3.8 (At TP 2)
3. Risk Management & Execution Guide
Position Sizing: Limit maximum risk per trade to 1%–2% of your total capital balance.
Leverage Use: If trading on Futures/Perpetuals, use low leverage (3x–5x) to account for daily wick volatility.
Invalidation Conditions: The bullish scenario is considered void/failed if the Daily candle closes fully (Daily Body Close) below the $0,002300 level. If this happens, exit the position immediately to protect your capital.
{future}(BEAMXUSDT)
Technical Analysis: $BEAMX /USDT (Perpetual Contract - 1D Chart)
1. Market Structure & Price Action
Breakout Structure (Change of Character): After a consolidation phase and a sufficiently long downtrend in the $0.001300 - $0.001600 range, price managed to make a strong bullish push (+29.32%), breaking through the key resistance area at $0.002400 - $0.002600 (gray box).
Moving Average Confirmation (MA): The short-period MA indicator line (purple) has crossed upward above the long-term MA (orange), and both lines have started to curve upward, indicating a momentum shift from bearish to bullish.
Volume Confirmation: A significant spike in trading volume occurred when the breakout candle formed, indicating aggressive accumulation from institutions/buyers.
Retest Projection: Chasing the price at the impulsive peak ($0,002768) carries the risk of a pullback. The most conservative and rational scenario is to wait for price to undergo a throwback/retest to the Resistance Become Support (RBS) area before continuing the move higher toward the $0,004000+ target.
2. Trading Signals (Trading Setup)
Pair: BEAMX/USDT (Spot / Futures)
Position Direction: LONG / BUY (Limit Order)
Entry Zone: $0,002450 – $0,002600 (Gray box retest area)
Stop Loss (SL): $0,002200 (Below the lower boundary of the retest support; risk limit ~10%–13%)
Take Profit (TP):
TP 1: $0,003200 (Conservative target / retest of the local high)
TP 2: $0,004000 (Main target in line with the chart projection)
TP 3: $0,004500 (Extension target)
Risk-to-Reward Ratio (RRR): 1 : 3.8 (At TP 2)
3. Risk Management & Execution Guide
Position Sizing: Limit maximum risk per trade to 1%–2% of your total capital balance.
Leverage Use: If trading on Futures/Perpetuals, use low leverage (3x–5x) to account for daily wick volatility.
Invalidation Conditions: The bullish scenario is considered void/failed if the Daily candle closes fully (Daily Body Close) below the $0,002300 level. If this happens, exit the position immediately to protect your capital.
1. Market Structure & Price Action
Breakout Structure (Change of Character): After a consolidation phase and a sufficiently long downtrend in the $0.001300 - $0.001600 range, price managed to make a strong bullish push (+29.32%), breaking through the key resistance area at $0.002400 - $0.002600 (gray box).
Moving Average Confirmation (MA): The short-period MA indicator line (purple) has crossed upward above the long-term MA (orange), and both lines have started to curve upward, indicating a momentum shift from bearish to bullish.
Volume Confirmation: A significant spike in trading volume occurred when the breakout candle formed, indicating aggressive accumulation from institutions/buyers.
Retest Projection: Chasing the price at the impulsive peak ($0,002768) carries the risk of a pullback. The most conservative and rational scenario is to wait for price to undergo a throwback/retest to the Resistance Become Support (RBS) area before continuing the move higher toward the $0,004000+ target.
2. Trading Signals (Trading Setup)
Pair: BEAMX/USDT (Spot / Futures)
Position Direction: LONG / BUY (Limit Order)
Entry Zone: $0,002450 – $0,002600 (Gray box retest area)
Stop Loss (SL): $0,002200 (Below the lower boundary of the retest support; risk limit ~10%–13%)
Take Profit (TP):
TP 1: $0,003200 (Conservative target / retest of the local high)
TP 2: $0,004000 (Main target in line with the chart projection)
TP 3: $0,004500 (Extension target)
Risk-to-Reward Ratio (RRR): 1 : 3.8 (At TP 2)
3. Risk Management & Execution Guide
Position Sizing: Limit maximum risk per trade to 1%–2% of your total capital balance.
Leverage Use: If trading on Futures/Perpetuals, use low leverage (3x–5x) to account for daily wick volatility.
Invalidation Conditions: The bullish scenario is considered void/failed if the Daily candle closes fully (Daily Body Close) below the $0,002300 level. If this happens, exit the position immediately to protect your capital.
1
151
·
--
Here is a technical analysis and trading signal setup for $ATH /USDT Perpetual Contract (Timeframe 1D)
Technical Market Analysis
Trend Structure & Pattern (Trend Reversal):
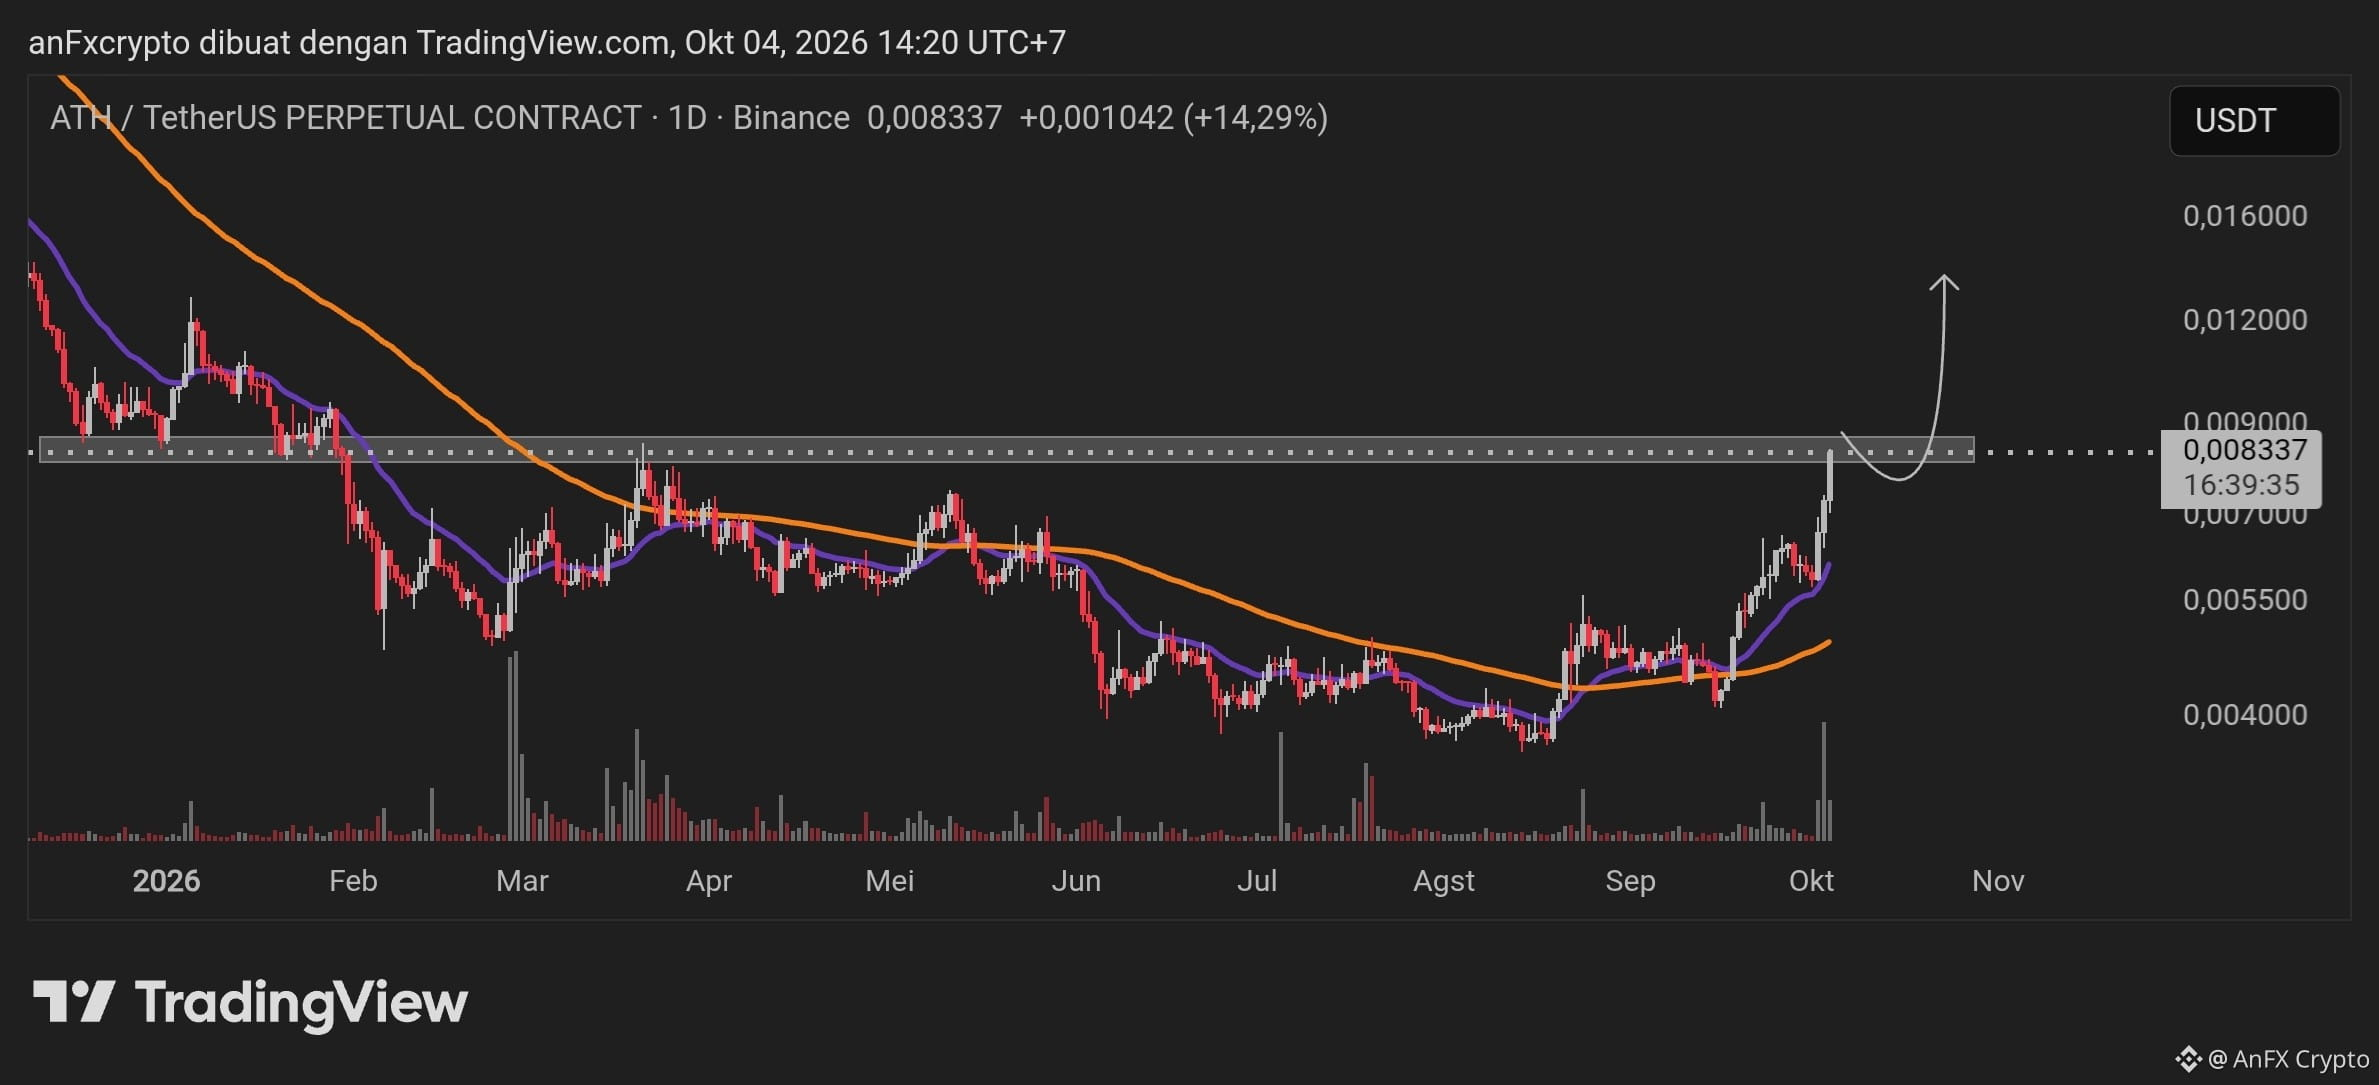
Accumulation Phase Complete: After experiencing a long downtrend from the beginning of 2026 (peak above $0.0160 to the low around $0.0038), price has formed a base (bottoming phase) in the $0.0038–$0.0050 area.
Breakout Moving Average: Price has successfully broken above the long-term Moving Average (orange line) and is supported by the short-term MA (purple line), which is now acting as dynamic support.
Key Resistance Area / Supply Zone:
Currently, price is at $0.008337 (+14.29%) and is testing a key resistance area in the $0.0080 – $0.0088 range (gray zone).
A strong daily candle close above $0.0088 will confirm the continuation of the uptrend (bullish continuation) toward the next target at $0.0130 – $0.0150.
Trading Signals (Swing Long Setup)
Trade Type: BUY / LONG (Breakout & Retest Strategy)
Entry Zone (Buy): $0.0080 – $0.0085 (sweet retest/pullback area within the new support zone)
Take Profit (TP):
TP 1: $0.0105 (first psychological area)
TP 2: $0.0125 (next local swing high)
TP 3: $0.0150 (Major Resistance / projected arrow target)
Stop Loss (SL): $0.0068 (below MA support & the last swing low structure)
Risk to Reward Ratio (RRR): ~ 1 : 3.2
Risk Management Notes
Candle Confirmation: It is recommended to wait for the daily candle close confirmation to avoid fakeouts in the resistance zone.
Leverage & Capital Allocation: If using Futures, limit leverage to 3x – 5x and allocate a maximum of 1% – 2% of total capital per trade.
{future}(ATHUSDT)
Here is a technical analysis and trading signal setup for $ATH /USDT Perpetual Contract (Timeframe 1D)
Technical Market Analysis
Trend Structure & Pattern (Trend Reversal):
Accumulation Phase Complete: After experiencing a long downtrend from the beginning of 2026 (peak above $0.0160 to the low around $0.0038), price has formed a base (bottoming phase) in the $0.0038–$0.0050 area.
Breakout Moving Average: Price has successfully broken above the long-term Moving Average (orange line) and is supported by the short-term MA (purple line), which is now acting as dynamic support.
Key Resistance Area / Supply Zone:
Currently, price is at $0.008337 (+14.29%) and is testing a key resistance area in the $0.0080 – $0.0088 range (gray zone).
A strong daily candle close above $0.0088 will confirm the continuation of the uptrend (bullish continuation) toward the next target at $0.0130 – $0.0150.
Trading Signals (Swing Long Setup)
Trade Type: BUY / LONG (Breakout & Retest Strategy)
Entry Zone (Buy): $0.0080 – $0.0085 (sweet retest/pullback area within the new support zone)
Take Profit (TP):
TP 1: $0.0105 (first psychological area)
TP 2: $0.0125 (next local swing high)
TP 3: $0.0150 (Major Resistance / projected arrow target)
Stop Loss (SL): $0.0068 (below MA support & the last swing low structure)
Risk to Reward Ratio (RRR): ~ 1 : 3.2
Risk Management Notes
Candle Confirmation: It is recommended to wait for the daily candle close confirmation to avoid fakeouts in the resistance zone.
Leverage & Capital Allocation: If using Futures, limit leverage to 3x – 5x and allocate a maximum of 1% – 2% of total capital per trade.
Technical Market Analysis
Trend Structure & Pattern (Trend Reversal):
Accumulation Phase Complete: After experiencing a long downtrend from the beginning of 2026 (peak above $0.0160 to the low around $0.0038), price has formed a base (bottoming phase) in the $0.0038–$0.0050 area.
Breakout Moving Average: Price has successfully broken above the long-term Moving Average (orange line) and is supported by the short-term MA (purple line), which is now acting as dynamic support.
Key Resistance Area / Supply Zone:
Currently, price is at $0.008337 (+14.29%) and is testing a key resistance area in the $0.0080 – $0.0088 range (gray zone).
A strong daily candle close above $0.0088 will confirm the continuation of the uptrend (bullish continuation) toward the next target at $0.0130 – $0.0150.
Trading Signals (Swing Long Setup)
Trade Type: BUY / LONG (Breakout & Retest Strategy)
Entry Zone (Buy): $0.0080 – $0.0085 (sweet retest/pullback area within the new support zone)
Take Profit (TP):
TP 1: $0.0105 (first psychological area)
TP 2: $0.0125 (next local swing high)
TP 3: $0.0150 (Major Resistance / projected arrow target)
Stop Loss (SL): $0.0068 (below MA support & the last swing low structure)
Risk to Reward Ratio (RRR): ~ 1 : 3.2
Risk Management Notes
Candle Confirmation: It is recommended to wait for the daily candle close confirmation to avoid fakeouts in the resistance zone.
Leverage & Capital Allocation: If using Futures, limit leverage to 3x – 5x and allocate a maximum of 1% – 2% of total capital per trade.
1
195
·
--
Technical Analysis: $COLLECT /USDT Perpetual (1D)
Market Structure & Trend Direction:
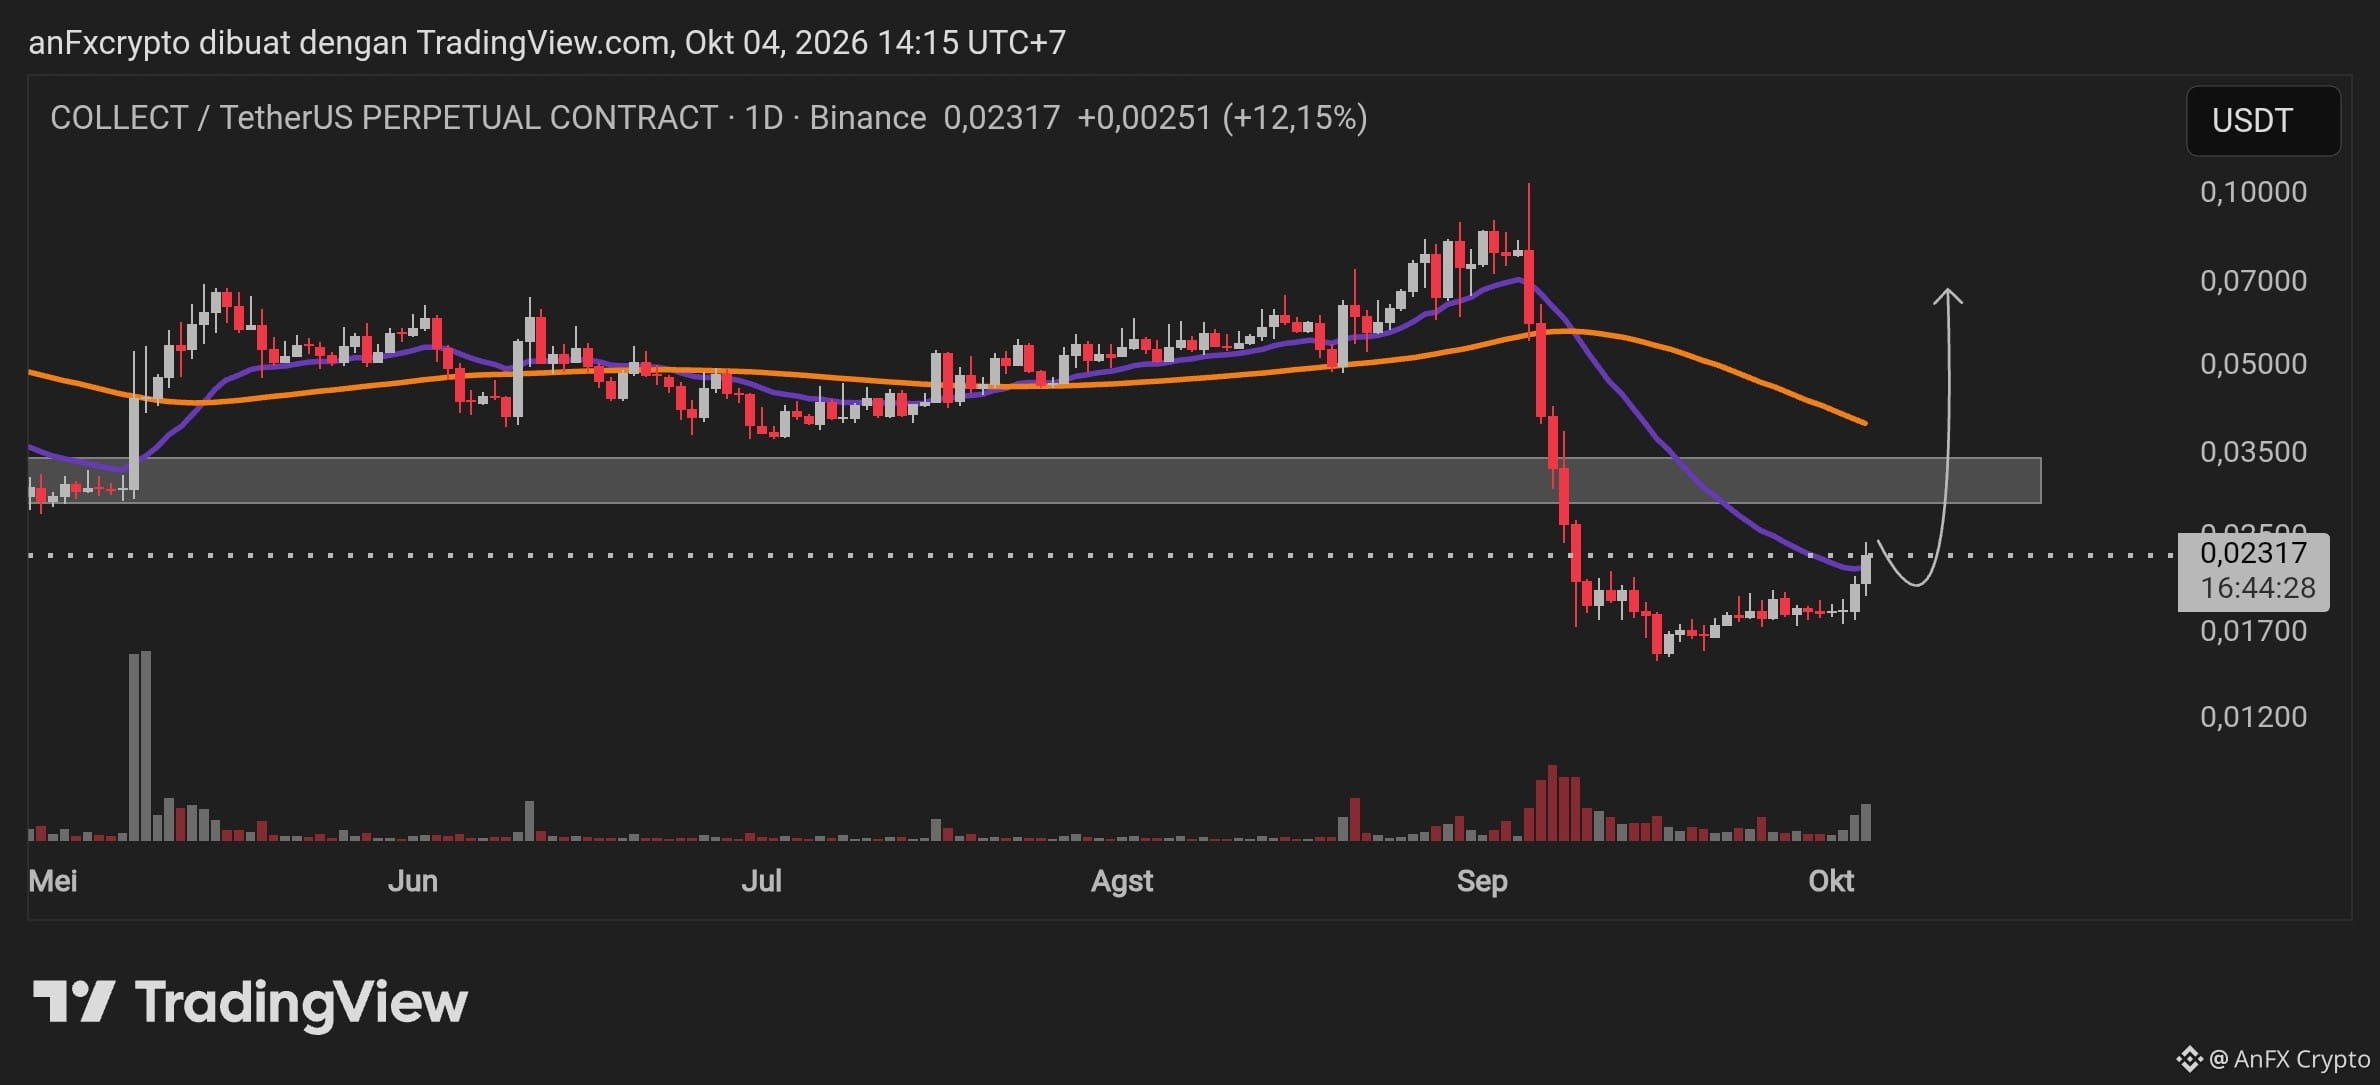
Rebound from Local Bottom: After a sharp drop from its peak in the range of $0.09000 – $0.10000 to hit the local bottom at $0.01700, the price has started showing signs of consolidation and accumulation.
Testing Dynamic Resistance: The current price is at $0.02317 (+12.15%) and is beginning to attempt a break upward through the short-term Moving Average (purple line).
Main Resistance Zone (Gray Box): The area $0.03000 – $0.03500 was previously a support breakdown level that is now acting as strong resistance. This area becomes the initial target to test the strength of the relief rally.
Price Movement Projection:
Bullish Scenario (Primary): There is a push that carries the price beyond the short MA toward the resistance zone $0.03000 – $0.03500. If this area is successfully broken with high volume, the strength may continue toward the long-term MA (orange line) at $0.05000, with a potential target up to $0.07000.
Bearish Scenario (Invalidation): A strong rejection below $0.02500 or a drop below the $0.01700 support will invalidate this reversal structure.
Trading Plan & Signals
Trade Direction: LONG / BUY
Entry Area: $0.02150 – $0.02320 (staged entries in the current consolidation area)
Take Profit Targets (TP):
TP 1: $0.03000 (lower bound of gray resistance)
TP 2: $0.03500 (upper bound of gray resistance)
TP 3: $0.05000 (Dynamic Orange MA Area)
TP 4: $0.07000 (extended swing target)
Stop Loss (SL): $0.01650 (placed below the swing low of $0.01700)
Risk/Reward Ratio: ~ 1 : 2.5+
Leverage Recommendation: Max 3x – 5x (Futures/Perpetual)
Risk Management
Position Sizing: Limit the maximum risk allocation to 1% – 2% of the total account equity for this trade.
Volume Confirmation: Watch for a spike in buy volume to ensure the move is not a fakeout before adding to the position.
Stop Loss Adjustment: If price reaches TP 1 ($0.03000), move the Stop Loss to the Break Even Point (BEP) area to lock the position against loss risk.
{future}(COLLECTUSDT)
Technical Analysis: $COLLECT /USDT Perpetual (1D)
Market Structure & Trend Direction:
Rebound from Local Bottom: After a sharp drop from its peak in the range of $0.09000 – $0.10000 to hit the local bottom at $0.01700, the price has started showing signs of consolidation and accumulation.
Testing Dynamic Resistance: The current price is at $0.02317 (+12.15%) and is beginning to attempt a break upward through the short-term Moving Average (purple line).
Main Resistance Zone (Gray Box): The area $0.03000 – $0.03500 was previously a support breakdown level that is now acting as strong resistance. This area becomes the initial target to test the strength of the relief rally.
Price Movement Projection:
Bullish Scenario (Primary): There is a push that carries the price beyond the short MA toward the resistance zone $0.03000 – $0.03500. If this area is successfully broken with high volume, the strength may continue toward the long-term MA (orange line) at $0.05000, with a potential target up to $0.07000.
Bearish Scenario (Invalidation): A strong rejection below $0.02500 or a drop below the $0.01700 support will invalidate this reversal structure.
Trading Plan & Signals
Trade Direction: LONG / BUY
Entry Area: $0.02150 – $0.02320 (staged entries in the current consolidation area)
Take Profit Targets (TP):
TP 1: $0.03000 (lower bound of gray resistance)
TP 2: $0.03500 (upper bound of gray resistance)
TP 3: $0.05000 (Dynamic Orange MA Area)
TP 4: $0.07000 (extended swing target)
Stop Loss (SL): $0.01650 (placed below the swing low of $0.01700)
Risk/Reward Ratio: ~ 1 : 2.5+
Leverage Recommendation: Max 3x – 5x (Futures/Perpetual)
Risk Management
Position Sizing: Limit the maximum risk allocation to 1% – 2% of the total account equity for this trade.
Volume Confirmation: Watch for a spike in buy volume to ensure the move is not a fakeout before adding to the position.
Stop Loss Adjustment: If price reaches TP 1 ($0.03000), move the Stop Loss to the Break Even Point (BEP) area to lock the position against loss risk.
Market Structure & Trend Direction:
Rebound from Local Bottom: After a sharp drop from its peak in the range of $0.09000 – $0.10000 to hit the local bottom at $0.01700, the price has started showing signs of consolidation and accumulation.
Testing Dynamic Resistance: The current price is at $0.02317 (+12.15%) and is beginning to attempt a break upward through the short-term Moving Average (purple line).
Main Resistance Zone (Gray Box): The area $0.03000 – $0.03500 was previously a support breakdown level that is now acting as strong resistance. This area becomes the initial target to test the strength of the relief rally.
Price Movement Projection:
Bullish Scenario (Primary): There is a push that carries the price beyond the short MA toward the resistance zone $0.03000 – $0.03500. If this area is successfully broken with high volume, the strength may continue toward the long-term MA (orange line) at $0.05000, with a potential target up to $0.07000.
Bearish Scenario (Invalidation): A strong rejection below $0.02500 or a drop below the $0.01700 support will invalidate this reversal structure.
Trading Plan & Signals
Trade Direction: LONG / BUY
Entry Area: $0.02150 – $0.02320 (staged entries in the current consolidation area)
Take Profit Targets (TP):
TP 1: $0.03000 (lower bound of gray resistance)
TP 2: $0.03500 (upper bound of gray resistance)
TP 3: $0.05000 (Dynamic Orange MA Area)
TP 4: $0.07000 (extended swing target)
Stop Loss (SL): $0.01650 (placed below the swing low of $0.01700)
Risk/Reward Ratio: ~ 1 : 2.5+
Leverage Recommendation: Max 3x – 5x (Futures/Perpetual)
Risk Management
Position Sizing: Limit the maximum risk allocation to 1% – 2% of the total account equity for this trade.
Volume Confirmation: Watch for a spike in buy volume to ensure the move is not a fakeout before adding to the position.
Stop Loss Adjustment: If price reaches TP 1 ($0.03000), move the Stop Loss to the Break Even Point (BEP) area to lock the position against loss risk.
1
263
·
--
Technical Analysis $STRK /USDT (Daily / 1D)
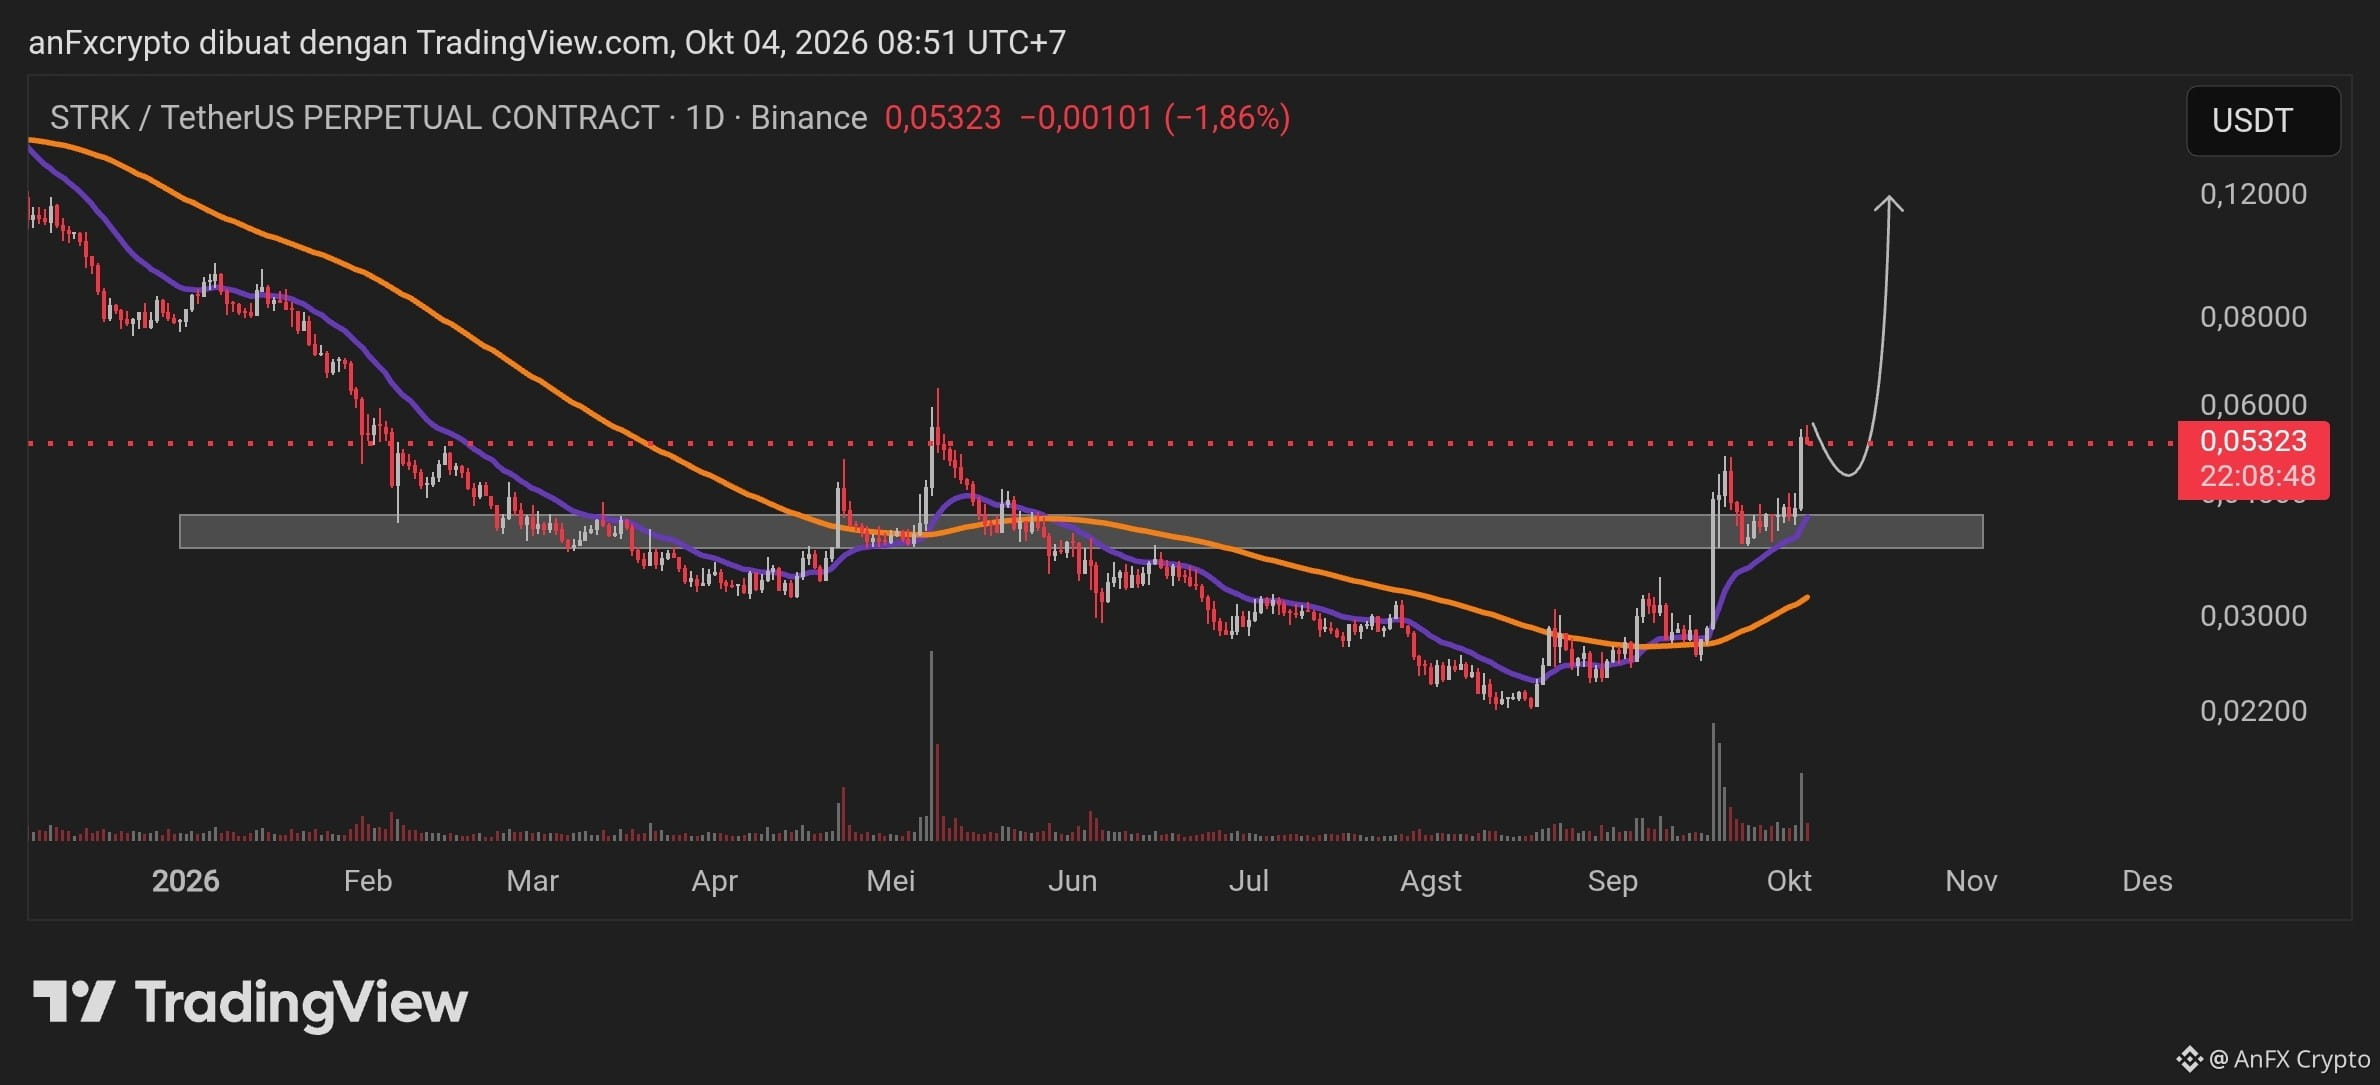
Market Structure: There is a potential bullish reversal from the base accumulation phase (bottoming phase) in the 0.02200 - 0.02500 USDT area. Price has broken through the long-term downtrend structure and formed a new higher high around 0.06000 USDT.
Support & Demand Area (Gray Zone): The 0.04200 - 0.04800 USDT area acts as a key demand zone as well as a support retest. Holding above this zone confirms the continuation of the uptrend (higher low).
Moving Averages (MA): The short-to-medium-term MA line (purple) and the long-term MA line (orange) have started to curve upward (golden cross setup), indicating strengthening buying momentum.
Volume: A significant volume spike is visible during the impulsive move at the end of September, indicating accumulation by institutional buyers (smart money).
Signal & Trading Plan (Buy / Long)
Bias: Bullish Continuation / Buy on Dip
Entry Area:
Entry 1 (Aggressive): 0.05000 – 0.05300 USDT
Entry 2 (Conservative/Retest): 0.04500 – 0.04800 USDT (Gray Support Zone)
Take Profit (TP):
TP 1: 0.06000 USDT (Local Resistance)
TP 2: 0.08000 USDT (Mid-Term Target)
TP 3: 0.12000 USDT (Main Swing Target)
Stop Loss (SL): 0.03950 USDT (Close the daily candle below the support & MA zone)
Risk Management
Risk to Reward Ratio (RRR): ~1:2.5 to 1:4 (depending on the entry point).
Invalidation: If price closes below 0.04000 USDT on the daily timeframe, the bullish scenario is void and price may potentially return to consolidation in the bottom area.
Position Sizing Recommendation: Limit maximum risk to 1–2% of total account equity.
{future}(STRKUSDT)
Technical Analysis $STRK /USDT (Daily / 1D)
Market Structure: There is a potential bullish reversal from the base accumulation phase (bottoming phase) in the 0.02200 - 0.02500 USDT area. Price has broken through the long-term downtrend structure and formed a new higher high around 0.06000 USDT.
Support & Demand Area (Gray Zone): The 0.04200 - 0.04800 USDT area acts as a key demand zone as well as a support retest. Holding above this zone confirms the continuation of the uptrend (higher low).
Moving Averages (MA): The short-to-medium-term MA line (purple) and the long-term MA line (orange) have started to curve upward (golden cross setup), indicating strengthening buying momentum.
Volume: A significant volume spike is visible during the impulsive move at the end of September, indicating accumulation by institutional buyers (smart money).
Signal & Trading Plan (Buy / Long)
Bias: Bullish Continuation / Buy on Dip
Entry Area:
Entry 1 (Aggressive): 0.05000 – 0.05300 USDT
Entry 2 (Conservative/Retest): 0.04500 – 0.04800 USDT (Gray Support Zone)
Take Profit (TP):
TP 1: 0.06000 USDT (Local Resistance)
TP 2: 0.08000 USDT (Mid-Term Target)
TP 3: 0.12000 USDT (Main Swing Target)
Stop Loss (SL): 0.03950 USDT (Close the daily candle below the support & MA zone)
Risk Management
Risk to Reward Ratio (RRR): ~1:2.5 to 1:4 (depending on the entry point).
Invalidation: If price closes below 0.04000 USDT on the daily timeframe, the bullish scenario is void and price may potentially return to consolidation in the bottom area.
Position Sizing Recommendation: Limit maximum risk to 1–2% of total account equity.
Market Structure: There is a potential bullish reversal from the base accumulation phase (bottoming phase) in the 0.02200 - 0.02500 USDT area. Price has broken through the long-term downtrend structure and formed a new higher high around 0.06000 USDT.
Support & Demand Area (Gray Zone): The 0.04200 - 0.04800 USDT area acts as a key demand zone as well as a support retest. Holding above this zone confirms the continuation of the uptrend (higher low).
Moving Averages (MA): The short-to-medium-term MA line (purple) and the long-term MA line (orange) have started to curve upward (golden cross setup), indicating strengthening buying momentum.
Volume: A significant volume spike is visible during the impulsive move at the end of September, indicating accumulation by institutional buyers (smart money).
Signal & Trading Plan (Buy / Long)
Bias: Bullish Continuation / Buy on Dip
Entry Area:
Entry 1 (Aggressive): 0.05000 – 0.05300 USDT
Entry 2 (Conservative/Retest): 0.04500 – 0.04800 USDT (Gray Support Zone)
Take Profit (TP):
TP 1: 0.06000 USDT (Local Resistance)
TP 2: 0.08000 USDT (Mid-Term Target)
TP 3: 0.12000 USDT (Main Swing Target)
Stop Loss (SL): 0.03950 USDT (Close the daily candle below the support & MA zone)
Risk Management
Risk to Reward Ratio (RRR): ~1:2.5 to 1:4 (depending on the entry point).
Invalidation: If price closes below 0.04000 USDT on the daily timeframe, the bullish scenario is void and price may potentially return to consolidation in the bottom area.
Position Sizing Recommendation: Limit maximum risk to 1–2% of total account equity.
247
·
--
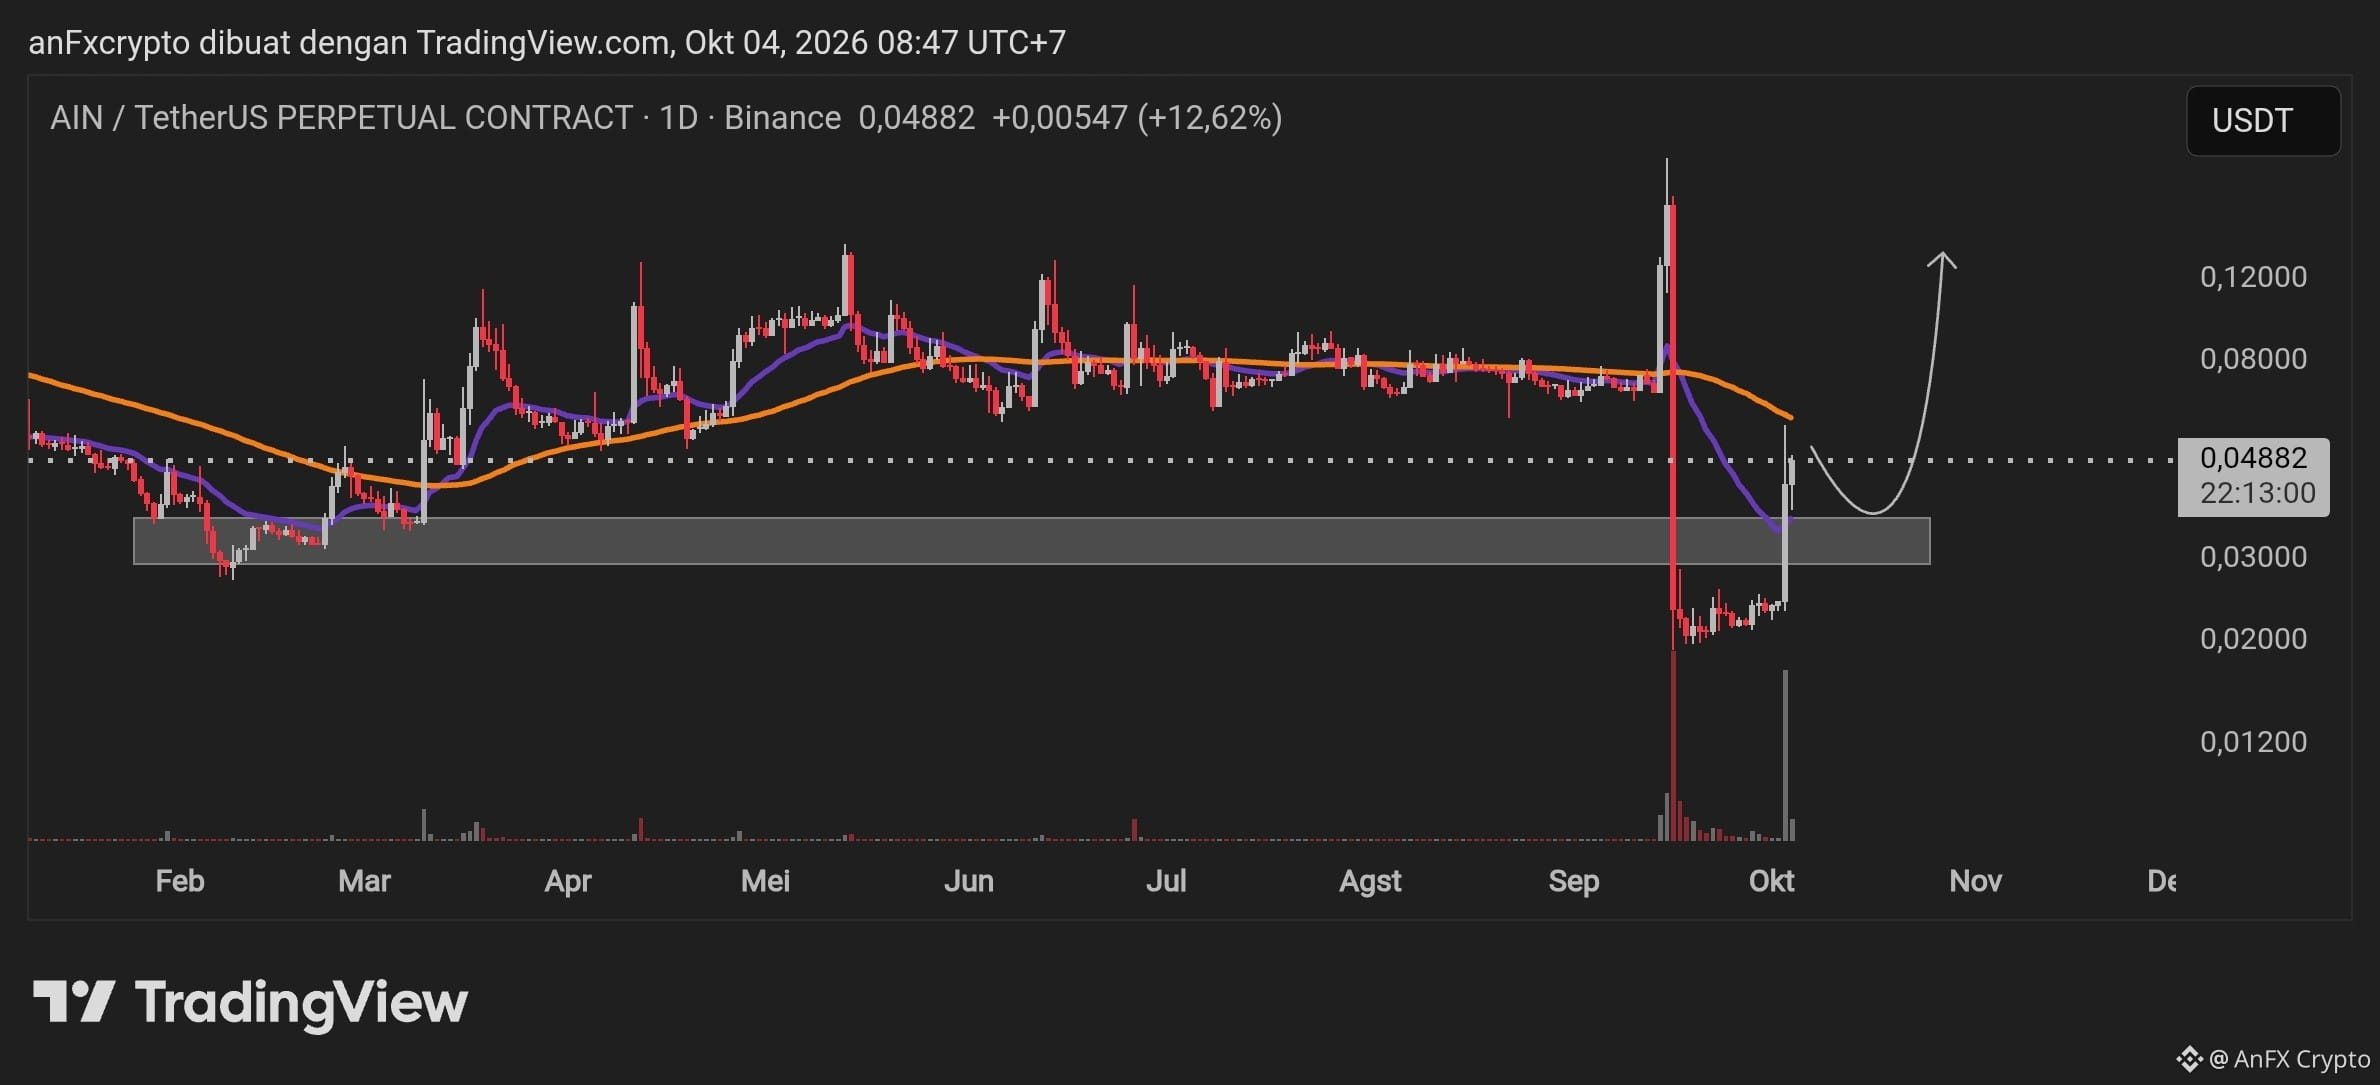
Technical Analysis: $AIN /USDT Perpetual (1D)
The AIN/USDT market shows a reversal in direction (trend reversal) after experiencing a sharp drop (flash crash) toward the lowest area of $0.01200 – $0.02000.
Market Structure & Price Action: After a long consolidation phase in the range of $0.02000, a buy impulse pushed the price up significantly, breaking through $0.04882 (+12.62%). This move confirms strong accumulation volume.
Key Support & Resistance Levels:
Main Support (Demand Zone): $0.03000 – $0.03500 (previously a local resistance that is now confirmed as support).
Dynamic Resistance: Long-term Moving Average (orange line) in the area of $0.06800 – $0.07000.
Main Resistance: $0.09500 and $0.12000 (upside targets according to the wave projection on the chart).
Indicators: The short-term Moving Average (purple line) is starting to curve upward (bullish crossover setup), indicating bullish momentum for the medium term.
Trading Signal (Trading Plan)
The best scenario is to wait for confirmation of a pullback / retest to the support area before opening a long position (Buy on Dip).
ParameterPrice Level / DescriptionPosition DirectionLONG / BUYEntry Zone$0.03100 – $0.03600 (Wait for a retest of the support area)Take Profit 1 (TP 1)$0.06800 (MA Resistance & Conservative Target)Take Profit 2 (TP 2)$0.09500 (Mid-term Supply Area)Take Profit 3 (TP 3)$0.12000 (Main Projection Target)Stop Loss (SL)$0.02400 (Below the nearest support structure)Risk / Reward Ratio1 : 3.5+
Risk Management & Execution Strategy
Leverage & Position Sizing: Use low leverage (2x – 5x) on the Perpetual Contract, considering this asset has a history of high volatility and extreme price wicks. Limit maximum risk to 1–2% of total portfolio equity.
Entry Validation: If price breaks below $0.03000 with a daily candle close, cancel the long scenario and wait for a new market structure to form.
{future}(AINUSDT)
Technical Analysis: $AIN /USDT Perpetual (1D)
The AIN/USDT market shows a reversal in direction (trend reversal) after experiencing a sharp drop (flash crash) toward the lowest area of $0.01200 – $0.02000.
Market Structure & Price Action: After a long consolidation phase in the range of $0.02000, a buy impulse pushed the price up significantly, breaking through $0.04882 (+12.62%). This move confirms strong accumulation volume.
Key Support & Resistance Levels:
Main Support (Demand Zone): $0.03000 – $0.03500 (previously a local resistance that is now confirmed as support).
Dynamic Resistance: Long-term Moving Average (orange line) in the area of $0.06800 – $0.07000.
Main Resistance: $0.09500 and $0.12000 (upside targets according to the wave projection on the chart).
Indicators: The short-term Moving Average (purple line) is starting to curve upward (bullish crossover setup), indicating bullish momentum for the medium term.
Trading Signal (Trading Plan)
The best scenario is to wait for confirmation of a pullback / retest to the support area before opening a long position (Buy on Dip).
ParameterPrice Level / DescriptionPosition DirectionLONG / BUYEntry Zone$0.03100 – $0.03600 (Wait for a retest of the support area)Take Profit 1 (TP 1)$0.06800 (MA Resistance & Conservative Target)Take Profit 2 (TP 2)$0.09500 (Mid-term Supply Area)Take Profit 3 (TP 3)$0.12000 (Main Projection Target)Stop Loss (SL)$0.02400 (Below the nearest support structure)Risk / Reward Ratio1 : 3.5+
Risk Management & Execution Strategy
Leverage & Position Sizing: Use low leverage (2x – 5x) on the Perpetual Contract, considering this asset has a history of high volatility and extreme price wicks. Limit maximum risk to 1–2% of total portfolio equity.
Entry Validation: If price breaks below $0.03000 with a daily candle close, cancel the long scenario and wait for a new market structure to form.
The AIN/USDT market shows a reversal in direction (trend reversal) after experiencing a sharp drop (flash crash) toward the lowest area of $0.01200 – $0.02000.
Market Structure & Price Action: After a long consolidation phase in the range of $0.02000, a buy impulse pushed the price up significantly, breaking through $0.04882 (+12.62%). This move confirms strong accumulation volume.
Key Support & Resistance Levels:
Main Support (Demand Zone): $0.03000 – $0.03500 (previously a local resistance that is now confirmed as support).
Dynamic Resistance: Long-term Moving Average (orange line) in the area of $0.06800 – $0.07000.
Main Resistance: $0.09500 and $0.12000 (upside targets according to the wave projection on the chart).
Indicators: The short-term Moving Average (purple line) is starting to curve upward (bullish crossover setup), indicating bullish momentum for the medium term.
Trading Signal (Trading Plan)
The best scenario is to wait for confirmation of a pullback / retest to the support area before opening a long position (Buy on Dip).
ParameterPrice Level / DescriptionPosition DirectionLONG / BUYEntry Zone$0.03100 – $0.03600 (Wait for a retest of the support area)Take Profit 1 (TP 1)$0.06800 (MA Resistance & Conservative Target)Take Profit 2 (TP 2)$0.09500 (Mid-term Supply Area)Take Profit 3 (TP 3)$0.12000 (Main Projection Target)Stop Loss (SL)$0.02400 (Below the nearest support structure)Risk / Reward Ratio1 : 3.5+
Risk Management & Execution Strategy
Leverage & Position Sizing: Use low leverage (2x – 5x) on the Perpetual Contract, considering this asset has a history of high volatility and extreme price wicks. Limit maximum risk to 1–2% of total portfolio equity.
Entry Validation: If price breaks below $0.03000 with a daily candle close, cancel the long scenario and wait for a new market structure to form.
988
·
--
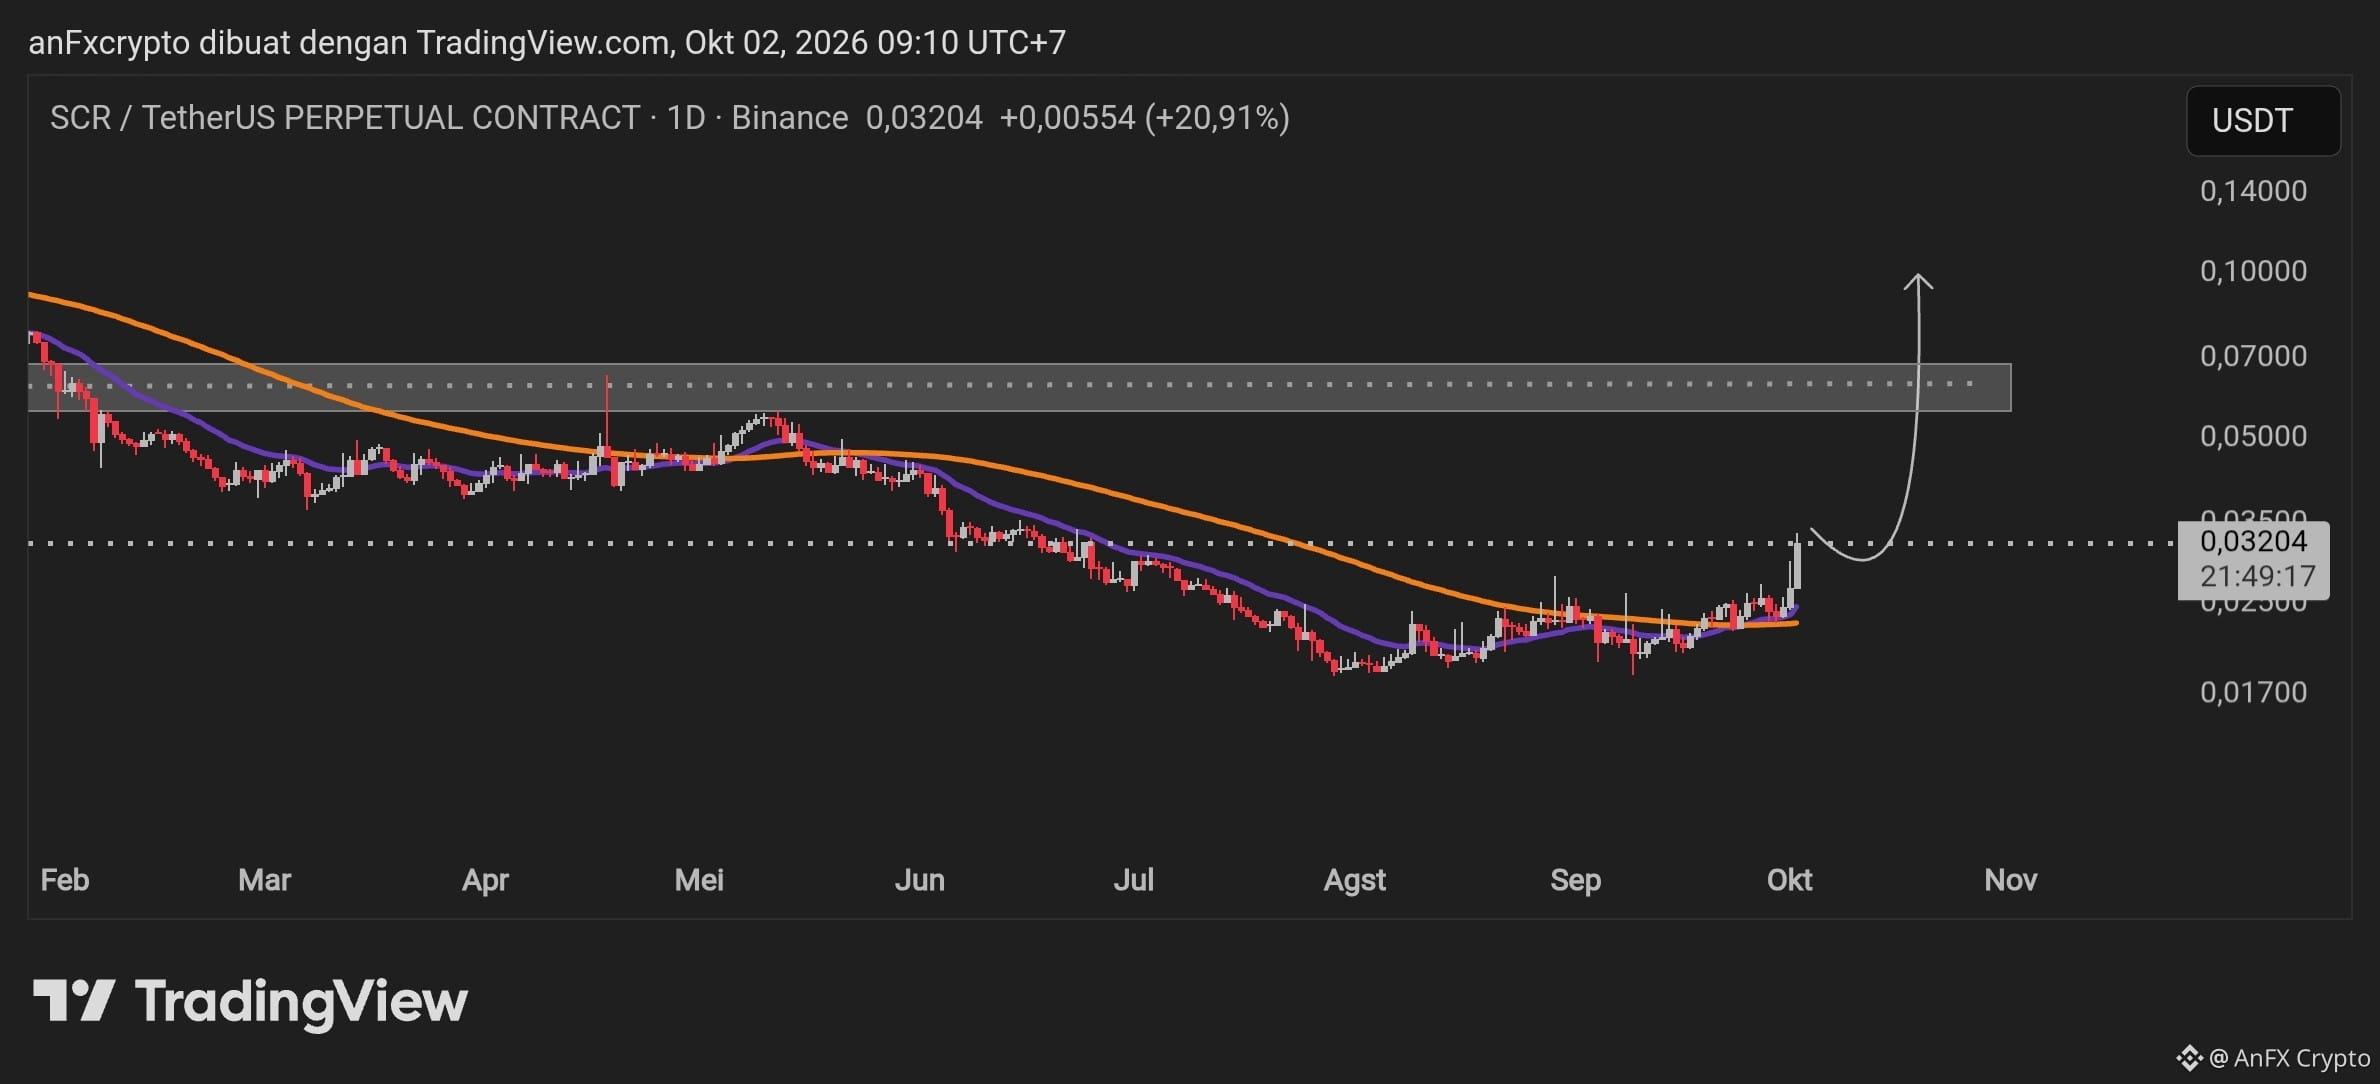
Here is an in-depth technical analysis along with a trading plan based on the daily chart $SCR /USDT Perpetual Contract:
Technical Analysis (1-Day Timeframe)
Market Structure & Bottoming Phase
After experiencing a long downtrend from the range of \$0.14000 to the All-Time Low in the \$0.01700 area, the price started forming a consolidation/accumulation pattern in the \$0.01700 – \$0.02300 range.
A strong bullish impulse (increase of +20,91\%) occurred, successfully breaking through the Moving Average/EMA line.
Price Movement Projection
According to the curve projection on the chart, this initial rise may experience a healthy correction (pullback/retest) toward the new support area around \$0.02700 – \$0.03000.
If the retest is successfully held above support/MA, the price has the potential to continue rallying toward the main resistance area (the shaded supply zone box) in the range \$0.05500 – \$0.07000 up to the psychological target at \$0.10000.
Trading Signals (Swing Trade)
Asset Pair: SCR/USDT (Perpetual)
Direction: BUY / LONG (Wait for Retest)
Entry Zone (Limit Buy): \$0.02700 – \$0.03000 (Waiting for a limited correction back to the breakout/EMA area)
Stop Loss (SL): \$0.02250 (Below the swing low and the Moving Average line)
Take Profit 1 (TP 1): \$0.05000 (Local resistance area / lower boundary of the supply zone)
Take Profit 2 (TP 2): \$0.06800 (Main target inside the gray box / supply zone)
Take Profit 3 (TP 3): \$0.10000 (Extension projection target / major direction reversal)
Risk Management Notes
Risk to Reward Ratio (RRR): Ranging from 1 : 3.5 to 1 : 6, providing a very favorable risk profile probability for swing trading.
Execution Strategy: Avoid FOMO buying at the current market price (\approx \$0.03204). Let the price retest the entry zone first to minimize drawdown.
Capital Allocation: Limit maximum risk to 1% – 2% of your total portfolio equity on this position.
{future}(SCRUSDT)
Here is an in-depth technical analysis along with a trading plan based on the daily chart $SCR /USDT Perpetual Contract:
Technical Analysis (1-Day Timeframe)
Market Structure & Bottoming Phase
After experiencing a long downtrend from the range of \$0.14000 to the All-Time Low in the \$0.01700 area, the price started forming a consolidation/accumulation pattern in the \$0.01700 – \$0.02300 range.
A strong bullish impulse (increase of +20,91\%) occurred, successfully breaking through the Moving Average/EMA line.
Price Movement Projection
According to the curve projection on the chart, this initial rise may experience a healthy correction (pullback/retest) toward the new support area around \$0.02700 – \$0.03000.
If the retest is successfully held above support/MA, the price has the potential to continue rallying toward the main resistance area (the shaded supply zone box) in the range \$0.05500 – \$0.07000 up to the psychological target at \$0.10000.
Trading Signals (Swing Trade)
Asset Pair: SCR/USDT (Perpetual)
Direction: BUY / LONG (Wait for Retest)
Entry Zone (Limit Buy): \$0.02700 – \$0.03000 (Waiting for a limited correction back to the breakout/EMA area)
Stop Loss (SL): \$0.02250 (Below the swing low and the Moving Average line)
Take Profit 1 (TP 1): \$0.05000 (Local resistance area / lower boundary of the supply zone)
Take Profit 2 (TP 2): \$0.06800 (Main target inside the gray box / supply zone)
Take Profit 3 (TP 3): \$0.10000 (Extension projection target / major direction reversal)
Risk Management Notes
Risk to Reward Ratio (RRR): Ranging from 1 : 3.5 to 1 : 6, providing a very favorable risk profile probability for swing trading.
Execution Strategy: Avoid FOMO buying at the current market price (\approx \$0.03204). Let the price retest the entry zone first to minimize drawdown.
Capital Allocation: Limit maximum risk to 1% – 2% of your total portfolio equity on this position.
Technical Analysis (1-Day Timeframe)
Market Structure & Bottoming Phase
After experiencing a long downtrend from the range of \$0.14000 to the All-Time Low in the \$0.01700 area, the price started forming a consolidation/accumulation pattern in the \$0.01700 – \$0.02300 range.
A strong bullish impulse (increase of +20,91\%) occurred, successfully breaking through the Moving Average/EMA line.
Price Movement Projection
According to the curve projection on the chart, this initial rise may experience a healthy correction (pullback/retest) toward the new support area around \$0.02700 – \$0.03000.
If the retest is successfully held above support/MA, the price has the potential to continue rallying toward the main resistance area (the shaded supply zone box) in the range \$0.05500 – \$0.07000 up to the psychological target at \$0.10000.
Trading Signals (Swing Trade)
Asset Pair: SCR/USDT (Perpetual)
Direction: BUY / LONG (Wait for Retest)
Entry Zone (Limit Buy): \$0.02700 – \$0.03000 (Waiting for a limited correction back to the breakout/EMA area)
Stop Loss (SL): \$0.02250 (Below the swing low and the Moving Average line)
Take Profit 1 (TP 1): \$0.05000 (Local resistance area / lower boundary of the supply zone)
Take Profit 2 (TP 2): \$0.06800 (Main target inside the gray box / supply zone)
Take Profit 3 (TP 3): \$0.10000 (Extension projection target / major direction reversal)
Risk Management Notes
Risk to Reward Ratio (RRR): Ranging from 1 : 3.5 to 1 : 6, providing a very favorable risk profile probability for swing trading.
Execution Strategy: Avoid FOMO buying at the current market price (\approx \$0.03204). Let the price retest the entry zone first to minimize drawdown.
Capital Allocation: Limit maximum risk to 1% – 2% of your total portfolio equity on this position.
1
102
·
--
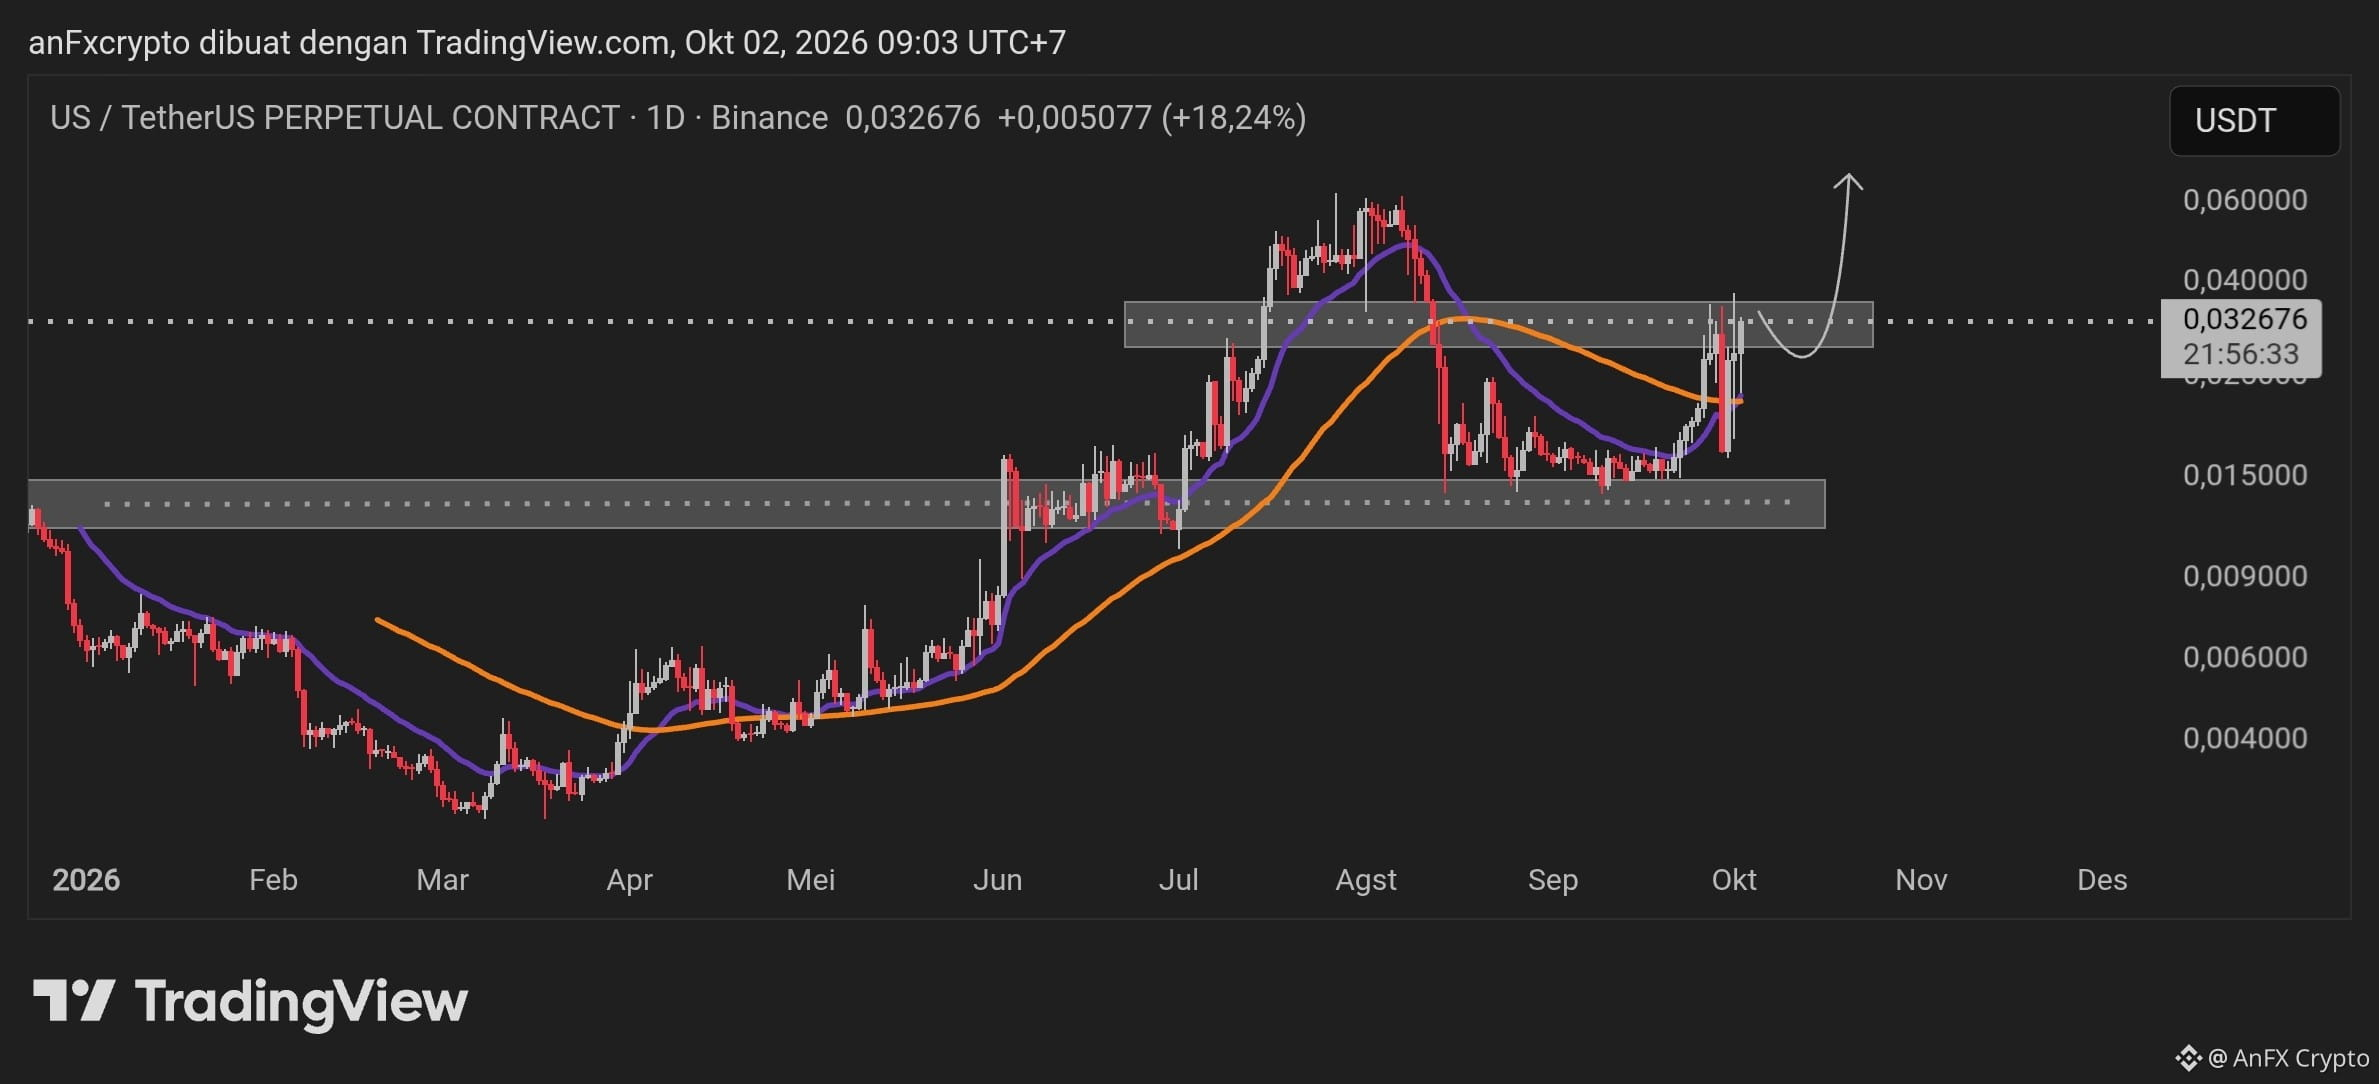
Technical Analysis: $US /USDT (Perpetual Contract - 1D)
The daily chart of US/USDT shows a significant bullish recovery trend structure after an accumulation phase in the bottoming area.
Key Market Observations
Price Structure & Momentum: Current price is at $0,032676 (+18,24%), testing the Supply / Major Daily Resistance zone in the range of $0,03100 – $0,03900.
Moving Average (MA) Indicator: The fast MA line (purple) and the slow MA line (orange) have started to curve upward (Golden Cross/Bullish Crossover), indicating strong medium-term buying momentum.
Key Zones:
Major Resistance / Supply Zone: $0,03100 – $0,03900 (upper gray box).
Major Support / Demand Zone: $0,01200 – $0,01500 (lower gray box).
Ideal Retest Area: $0,03000 – $0,03200.
Price Movement Scenario Projection
Bullish Primary Scenario (Retest & Continuation): Price breaks through the Supply Zone, followed by a healthy correction (retest) to the $0,03000 – $0,03200 area to confirm resistance turned into support. If this area holds, the next upside target is toward the peak projection around $0,06000.
Alternative Scenario (Rejection / Deep Pullback): If there is strong rejection at the Supply Zone during the Daily Closing, price may correct back toward the dynamic MA support at the $0,02200 – $0,02500 area before attempting another breakout.
Trading Signals (Trade Plan)
Setup 1: Buy on Retest / Confirm Breakout (Conservative – Recommended)
Entry Zone: $0,03000 – $0,03250 (Wait for the daily candle close / confirm a stabilized pullback)
Stop Loss (SL): $0,02550 (Below the lower boundary of the local retest area)
Take Profit (TP):
TP 1: $0,04200 (Initial psychological resistance level)
TP 2: $0,05800 – $0,06000 (Main target of the scenario)
Risk-to-Reward Ratio (RRR): ~ 1 : 2,5+
Setup 2: Limit Order Buy on Dip (Aggressive / Medium-Term)
Entry Zone: $0,02200 – $0,02450 (Moving Average Support Area)
Stop Loss (SL): $0,01850
Take Profit (TP): $0,03500 – $0,03900
Technical Analysis: $US /USDT (Perpetual Contract - 1D)
The daily chart of US/USDT shows a significant bullish recovery trend structure after an accumulation phase in the bottoming area.
Key Market Observations
Price Structure & Momentum: Current price is at $0,032676 (+18,24%), testing the Supply / Major Daily Resistance zone in the range of $0,03100 – $0,03900.
Moving Average (MA) Indicator: The fast MA line (purple) and the slow MA line (orange) have started to curve upward (Golden Cross/Bullish Crossover), indicating strong medium-term buying momentum.
Key Zones:
Major Resistance / Supply Zone: $0,03100 – $0,03900 (upper gray box).
Major Support / Demand Zone: $0,01200 – $0,01500 (lower gray box).
Ideal Retest Area: $0,03000 – $0,03200.
Price Movement Scenario Projection
Bullish Primary Scenario (Retest & Continuation): Price breaks through the Supply Zone, followed by a healthy correction (retest) to the $0,03000 – $0,03200 area to confirm resistance turned into support. If this area holds, the next upside target is toward the peak projection around $0,06000.
Alternative Scenario (Rejection / Deep Pullback): If there is strong rejection at the Supply Zone during the Daily Closing, price may correct back toward the dynamic MA support at the $0,02200 – $0,02500 area before attempting another breakout.
Trading Signals (Trade Plan)
Setup 1: Buy on Retest / Confirm Breakout (Conservative – Recommended)
Entry Zone: $0,03000 – $0,03250 (Wait for the daily candle close / confirm a stabilized pullback)
Stop Loss (SL): $0,02550 (Below the lower boundary of the local retest area)
Take Profit (TP):
TP 1: $0,04200 (Initial psychological resistance level)
TP 2: $0,05800 – $0,06000 (Main target of the scenario)
Risk-to-Reward Ratio (RRR): ~ 1 : 2,5+
Setup 2: Limit Order Buy on Dip (Aggressive / Medium-Term)
Entry Zone: $0,02200 – $0,02450 (Moving Average Support Area)
Stop Loss (SL): $0,01850
Take Profit (TP): $0,03500 – $0,03900
The daily chart of US/USDT shows a significant bullish recovery trend structure after an accumulation phase in the bottoming area.
Key Market Observations
Price Structure & Momentum: Current price is at $0,032676 (+18,24%), testing the Supply / Major Daily Resistance zone in the range of $0,03100 – $0,03900.
Moving Average (MA) Indicator: The fast MA line (purple) and the slow MA line (orange) have started to curve upward (Golden Cross/Bullish Crossover), indicating strong medium-term buying momentum.
Key Zones:
Major Resistance / Supply Zone: $0,03100 – $0,03900 (upper gray box).
Major Support / Demand Zone: $0,01200 – $0,01500 (lower gray box).
Ideal Retest Area: $0,03000 – $0,03200.
Price Movement Scenario Projection
Bullish Primary Scenario (Retest & Continuation): Price breaks through the Supply Zone, followed by a healthy correction (retest) to the $0,03000 – $0,03200 area to confirm resistance turned into support. If this area holds, the next upside target is toward the peak projection around $0,06000.
Alternative Scenario (Rejection / Deep Pullback): If there is strong rejection at the Supply Zone during the Daily Closing, price may correct back toward the dynamic MA support at the $0,02200 – $0,02500 area before attempting another breakout.
Trading Signals (Trade Plan)
Setup 1: Buy on Retest / Confirm Breakout (Conservative – Recommended)
Entry Zone: $0,03000 – $0,03250 (Wait for the daily candle close / confirm a stabilized pullback)
Stop Loss (SL): $0,02550 (Below the lower boundary of the local retest area)
Take Profit (TP):
TP 1: $0,04200 (Initial psychological resistance level)
TP 2: $0,05800 – $0,06000 (Main target of the scenario)
Risk-to-Reward Ratio (RRR): ~ 1 : 2,5+
Setup 2: Limit Order Buy on Dip (Aggressive / Medium-Term)
Entry Zone: $0,02200 – $0,02450 (Moving Average Support Area)
Stop Loss (SL): $0,01850
Take Profit (TP): $0,03500 – $0,03900
120
·
--
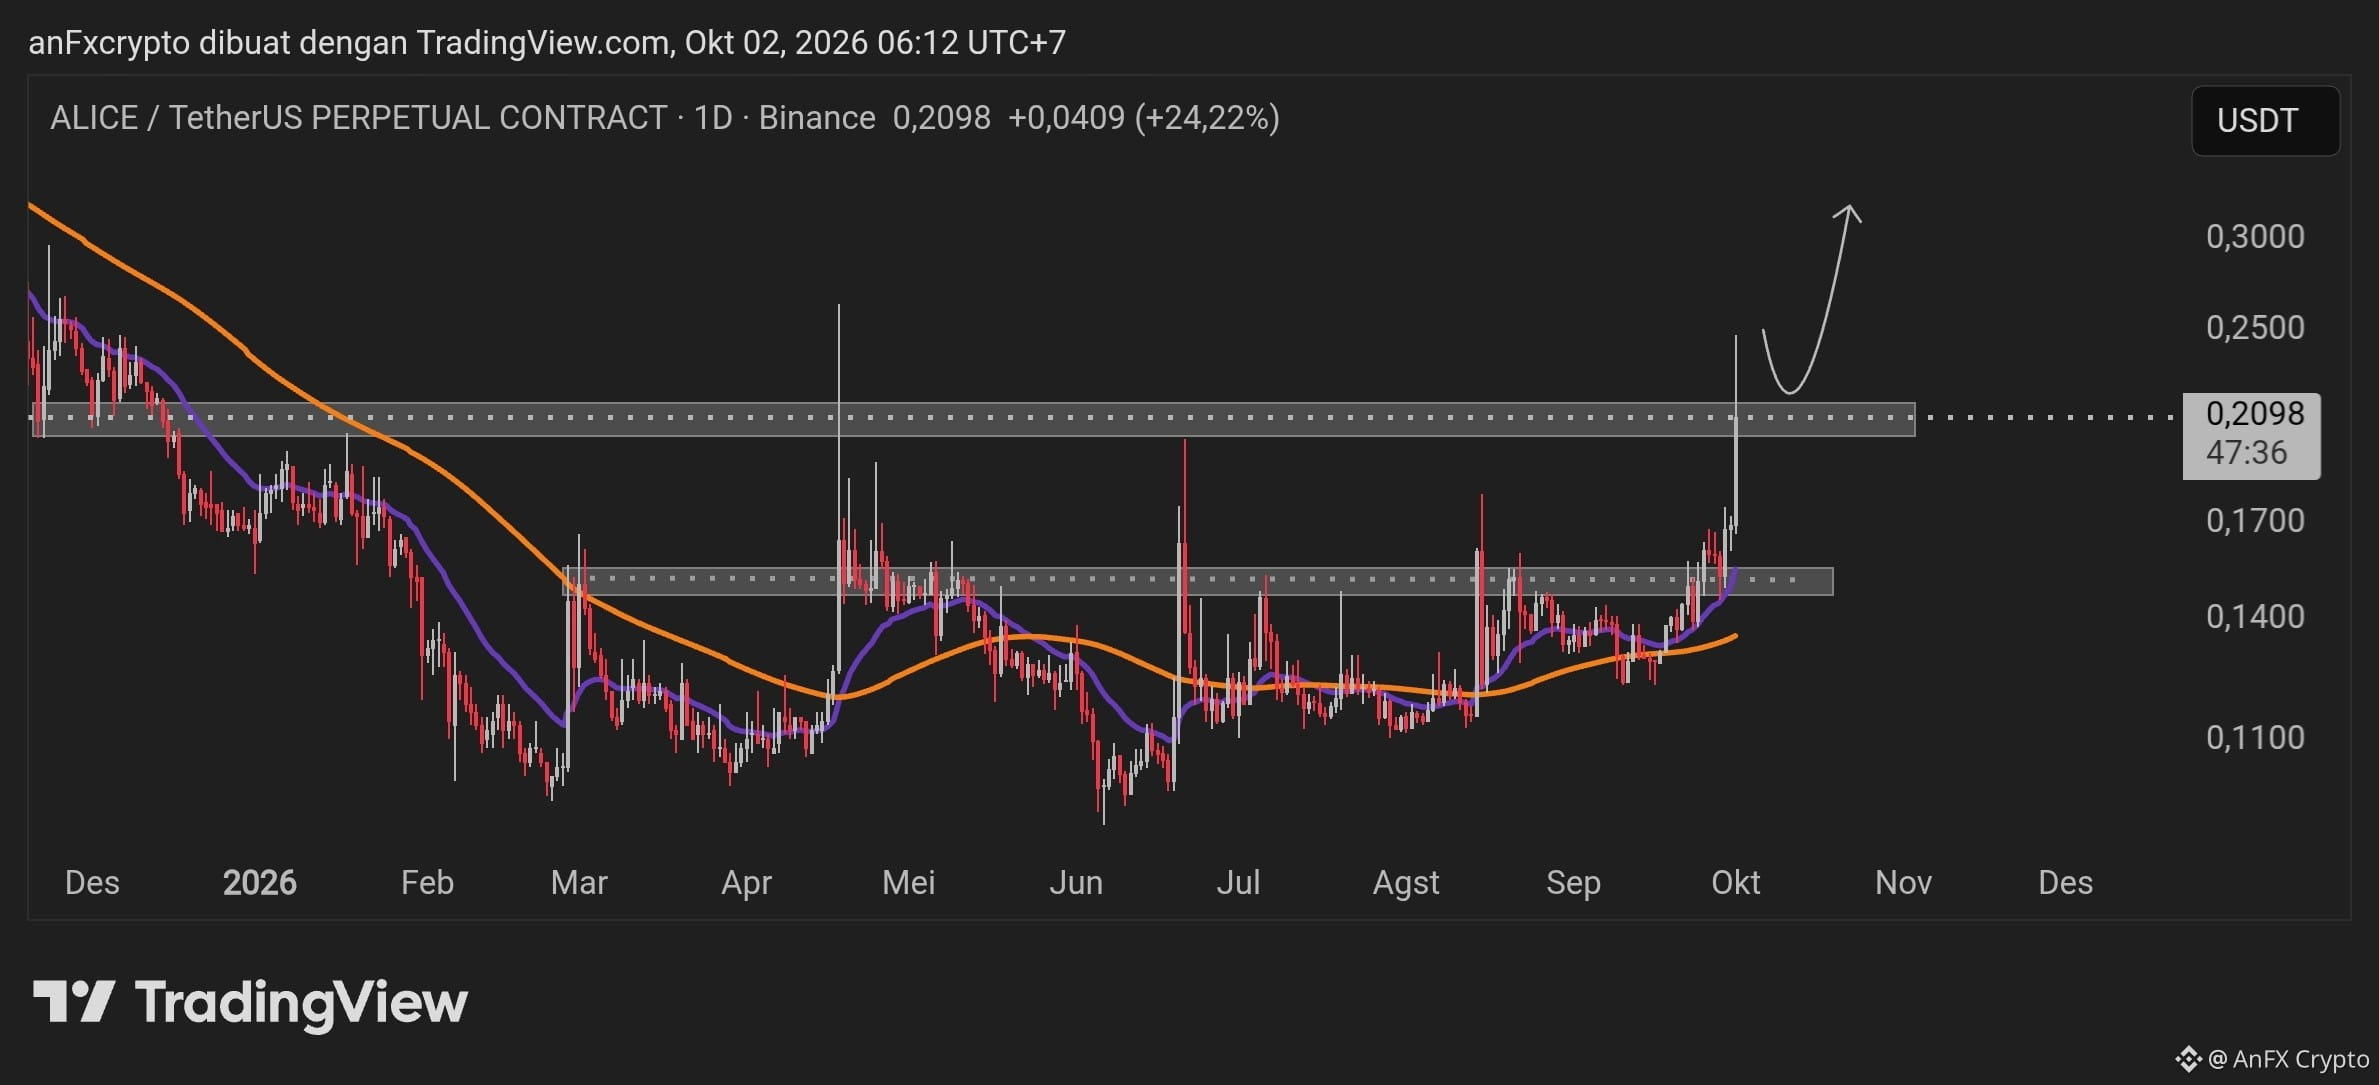
Technical Analysis: $ALICE /USDT (Daily Chart / 1D)
The market experienced a bullish impulsive breakout from a long-term accumulation phase. Here is the breakdown of its technical structure:
Market Structure & Trend: After moving sideways in the $0.1100–$0.1600 range, the price successfully broke through a strong resistance zone with a significant momentum push (+24.22%).
Moving Average Indicators: The MA lines (purple & orange) show a positive crossover (golden cross) with an upward slope, confirming buyer dominance (bulls).
Key Zones (Key Levels):
Resistance Becomes Support (Upper Gray Zone): $0.1950 – $0.2150.
Strong Support (Lower Gray Zone): $0.1450 – $0.1600.
Movement Scenario: As projected on the chart, there is potential for a throwback/retest first into the support area $0.1950–$0.2100 before continuing the rise toward the target $0.3000+.
Trading Signal: ALICE/USDT (Long Setup)
Strategy: Buy on Retest (Enter when a healthy correction occurs into the new support zone).
Direction: LONG / BUY
Entry Area: $0.1950 – $0.2100 (Wait for price to enter the retest support area)
Take Profit (TP):
TP 1: $0.2500 (Retest of the candle’s highest point)
TP 2: $0.2800
TP 3: $0.3100 – $0.3200 (Main projection target)
Stop Loss (SL): $0.1780 (Placed below the retest support zone to limit risk)
Risk to Reward Ratio: 1 : 2.5+
Risk Management & Execution Tips
Entry Confirmation: Watch for a reversal candlestick pattern (bullish engulfing or pin bar) on the 1H/4H chart when price touches the $0.1950–$0.2100 area.
Position Sizing: Limit maximum risk to 1%–2% of trading capital per position.
Secure Profits: When TP 1 ($0.2500) is reached, move the Stop Loss to the entry point (Break Even Point) and use a Trailing Stop to lock in remaining gains.
{future}(ALICEUSDT)
Technical Analysis: $ALICE /USDT (Daily Chart / 1D)
The market experienced a bullish impulsive breakout from a long-term accumulation phase. Here is the breakdown of its technical structure:
Market Structure & Trend: After moving sideways in the $0.1100–$0.1600 range, the price successfully broke through a strong resistance zone with a significant momentum push (+24.22%).
Moving Average Indicators: The MA lines (purple & orange) show a positive crossover (golden cross) with an upward slope, confirming buyer dominance (bulls).
Key Zones (Key Levels):
Resistance Becomes Support (Upper Gray Zone): $0.1950 – $0.2150.
Strong Support (Lower Gray Zone): $0.1450 – $0.1600.
Movement Scenario: As projected on the chart, there is potential for a throwback/retest first into the support area $0.1950–$0.2100 before continuing the rise toward the target $0.3000+.
Trading Signal: ALICE/USDT (Long Setup)
Strategy: Buy on Retest (Enter when a healthy correction occurs into the new support zone).
Direction: LONG / BUY
Entry Area: $0.1950 – $0.2100 (Wait for price to enter the retest support area)
Take Profit (TP):
TP 1: $0.2500 (Retest of the candle’s highest point)
TP 2: $0.2800
TP 3: $0.3100 – $0.3200 (Main projection target)
Stop Loss (SL): $0.1780 (Placed below the retest support zone to limit risk)
Risk to Reward Ratio: 1 : 2.5+
Risk Management & Execution Tips
Entry Confirmation: Watch for a reversal candlestick pattern (bullish engulfing or pin bar) on the 1H/4H chart when price touches the $0.1950–$0.2100 area.
Position Sizing: Limit maximum risk to 1%–2% of trading capital per position.
Secure Profits: When TP 1 ($0.2500) is reached, move the Stop Loss to the entry point (Break Even Point) and use a Trailing Stop to lock in remaining gains.
The market experienced a bullish impulsive breakout from a long-term accumulation phase. Here is the breakdown of its technical structure:
Market Structure & Trend: After moving sideways in the $0.1100–$0.1600 range, the price successfully broke through a strong resistance zone with a significant momentum push (+24.22%).
Moving Average Indicators: The MA lines (purple & orange) show a positive crossover (golden cross) with an upward slope, confirming buyer dominance (bulls).
Key Zones (Key Levels):
Resistance Becomes Support (Upper Gray Zone): $0.1950 – $0.2150.
Strong Support (Lower Gray Zone): $0.1450 – $0.1600.
Movement Scenario: As projected on the chart, there is potential for a throwback/retest first into the support area $0.1950–$0.2100 before continuing the rise toward the target $0.3000+.
Trading Signal: ALICE/USDT (Long Setup)
Strategy: Buy on Retest (Enter when a healthy correction occurs into the new support zone).
Direction: LONG / BUY
Entry Area: $0.1950 – $0.2100 (Wait for price to enter the retest support area)
Take Profit (TP):
TP 1: $0.2500 (Retest of the candle’s highest point)
TP 2: $0.2800
TP 3: $0.3100 – $0.3200 (Main projection target)
Stop Loss (SL): $0.1780 (Placed below the retest support zone to limit risk)
Risk to Reward Ratio: 1 : 2.5+
Risk Management & Execution Tips
Entry Confirmation: Watch for a reversal candlestick pattern (bullish engulfing or pin bar) on the 1H/4H chart when price touches the $0.1950–$0.2100 area.
Position Sizing: Limit maximum risk to 1%–2% of trading capital per position.
Secure Profits: When TP 1 ($0.2500) is reached, move the Stop Loss to the entry point (Break Even Point) and use a Trailing Stop to lock in remaining gains.
60
·
--
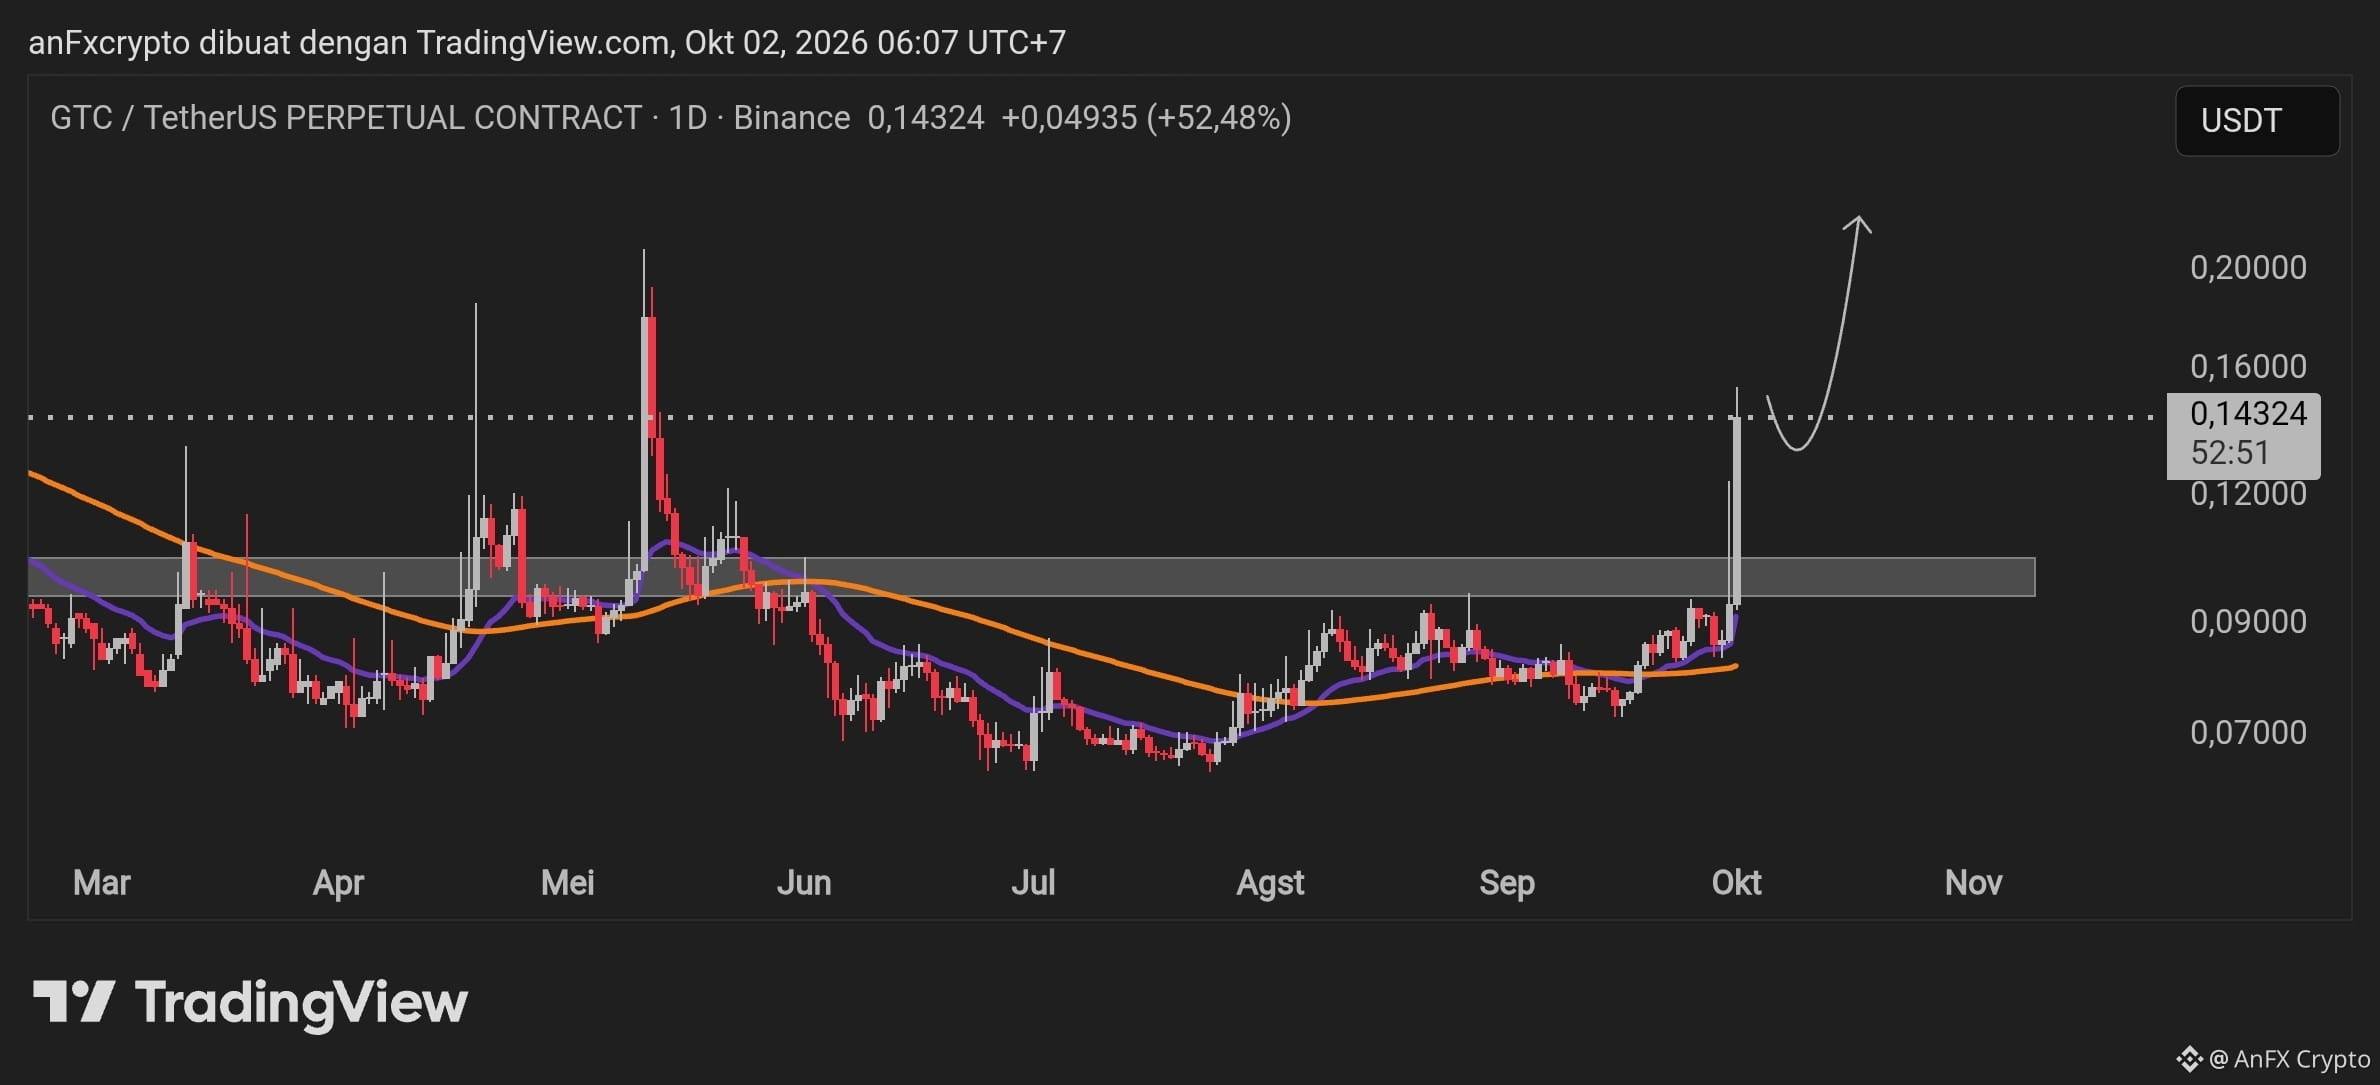
Chart $GTC /USDT (Daily / 1D) shows a significant price surge (bullish breakout) after a long consolidation phase.
Technical Analysis
Market Structure & Breakout:
Structure: There was a Change of Character (CHoCH) from a sideways trend into bullish continuation.
Resistance Flip: The consolidation range at $0.09000 – $0.10500, which previously acted as strong resistance, has now been successfully broken out (breakout) with high volume and momentum (+52%).
Current Price Conditions:
The current price is around $0.14324. Placing a direct buy (market order) on the green candle that is surging high is very risky and may trigger FOMO and chasing the market.
Projection Scenario (According to the Chart):
The most ideal scenario is Breakout – Retest – Continuation. We are waiting for a pullback or a healthy correction into the Demand/Support Flip area before continuing the rise toward targets of $0.20000+.
Signals & Trading Plan (GTC/USDT Perpetual)
Bias: Bullish (Buy on Retest Strategy)
Entry Area (Limit Buy): $0.12000 – $0.12800 (Wait for a correction into the retest area)
Stop Loss (SL): $0.10200 (Below the upper bound of the support flip area)
Take Profit (TP):
TP 1: $0.16000 (Latest swing high)
TP 2: $0.20000 (Main resistance target)
Risk-to-Reward Ratio (RRR): ~ 1 : 3
Risk Management Notes
Leverage: It is recommended to use low leverage (2x – 5x) due to the extremely high volatility after a move of >50%.
Position Sizing: Risk no more than 1% – 2% of total account equity.
Discipline: If the price does not pull back and instead continues rising immediately without entering the target entry area, let that opportunity pass—don’t force an entry at the top.
{future}(GTCUSDT)
Chart $GTC /USDT (Daily / 1D) shows a significant price surge (bullish breakout) after a long consolidation phase.
Technical Analysis
Market Structure & Breakout:
Structure: There was a Change of Character (CHoCH) from a sideways trend into bullish continuation.
Resistance Flip: The consolidation range at $0.09000 – $0.10500, which previously acted as strong resistance, has now been successfully broken out (breakout) with high volume and momentum (+52%).
Current Price Conditions:
The current price is around $0.14324. Placing a direct buy (market order) on the green candle that is surging high is very risky and may trigger FOMO and chasing the market.
Projection Scenario (According to the Chart):
The most ideal scenario is Breakout – Retest – Continuation. We are waiting for a pullback or a healthy correction into the Demand/Support Flip area before continuing the rise toward targets of $0.20000+.
Signals & Trading Plan (GTC/USDT Perpetual)
Bias: Bullish (Buy on Retest Strategy)
Entry Area (Limit Buy): $0.12000 – $0.12800 (Wait for a correction into the retest area)
Stop Loss (SL): $0.10200 (Below the upper bound of the support flip area)
Take Profit (TP):
TP 1: $0.16000 (Latest swing high)
TP 2: $0.20000 (Main resistance target)
Risk-to-Reward Ratio (RRR): ~ 1 : 3
Risk Management Notes
Leverage: It is recommended to use low leverage (2x – 5x) due to the extremely high volatility after a move of >50%.
Position Sizing: Risk no more than 1% – 2% of total account equity.
Discipline: If the price does not pull back and instead continues rising immediately without entering the target entry area, let that opportunity pass—don’t force an entry at the top.
Technical Analysis
Market Structure & Breakout:
Structure: There was a Change of Character (CHoCH) from a sideways trend into bullish continuation.
Resistance Flip: The consolidation range at $0.09000 – $0.10500, which previously acted as strong resistance, has now been successfully broken out (breakout) with high volume and momentum (+52%).
Current Price Conditions:
The current price is around $0.14324. Placing a direct buy (market order) on the green candle that is surging high is very risky and may trigger FOMO and chasing the market.
Projection Scenario (According to the Chart):
The most ideal scenario is Breakout – Retest – Continuation. We are waiting for a pullback or a healthy correction into the Demand/Support Flip area before continuing the rise toward targets of $0.20000+.
Signals & Trading Plan (GTC/USDT Perpetual)
Bias: Bullish (Buy on Retest Strategy)
Entry Area (Limit Buy): $0.12000 – $0.12800 (Wait for a correction into the retest area)
Stop Loss (SL): $0.10200 (Below the upper bound of the support flip area)
Take Profit (TP):
TP 1: $0.16000 (Latest swing high)
TP 2: $0.20000 (Main resistance target)
Risk-to-Reward Ratio (RRR): ~ 1 : 3
Risk Management Notes
Leverage: It is recommended to use low leverage (2x – 5x) due to the extremely high volatility after a move of >50%.
Position Sizing: Risk no more than 1% – 2% of total account equity.
Discipline: If the price does not pull back and instead continues rising immediately without entering the target entry area, let that opportunity pass—don’t force an entry at the top.
74
·
--
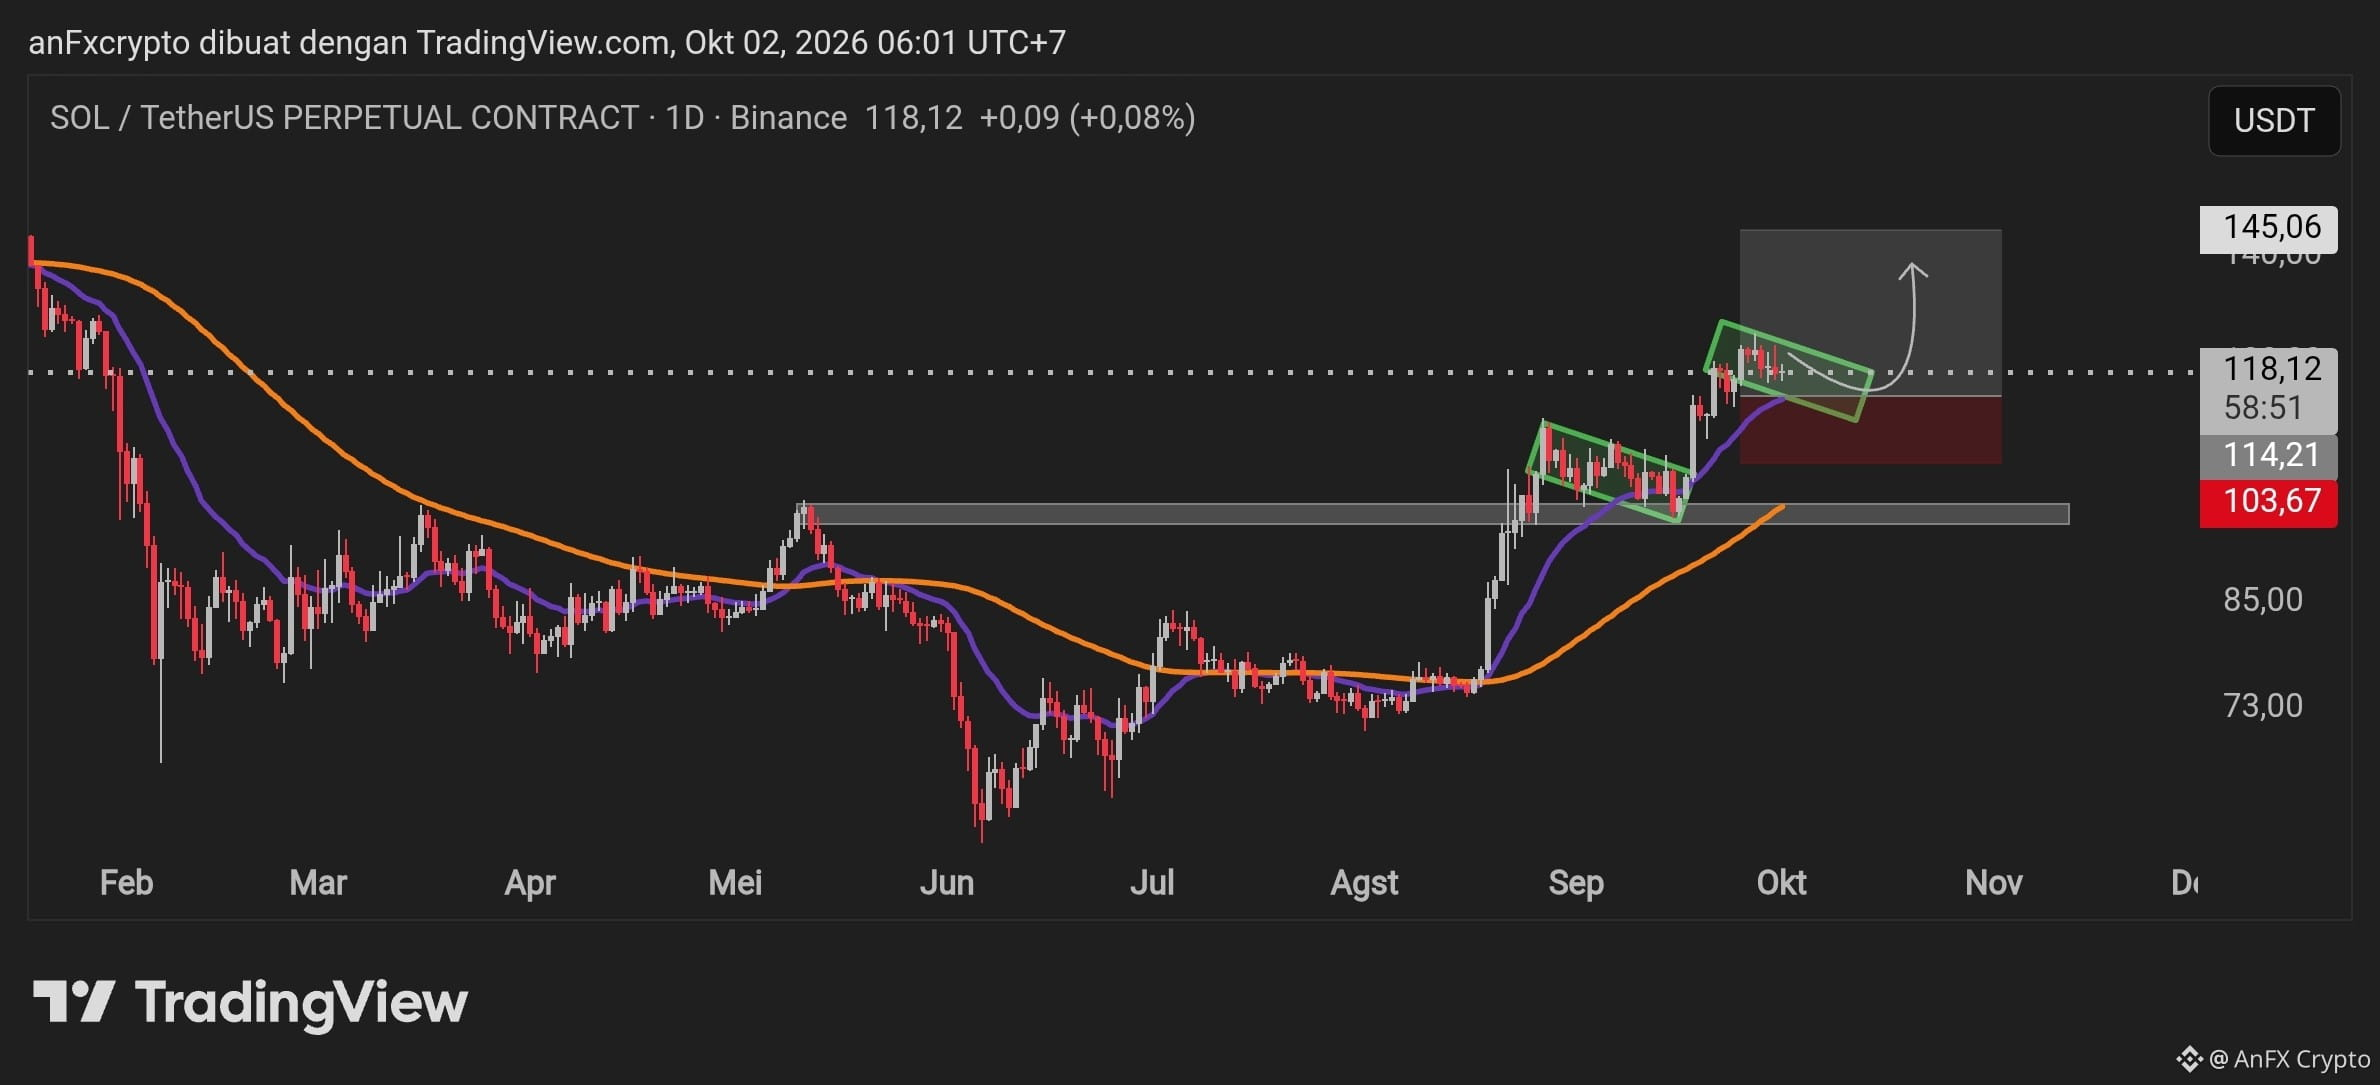
Here is a technical analysis and swing trading signal based on the daily chart ($SOL /USDT Perpetual Contract - 1D):
Market Structure & Technical Analysis
Main Trend (Trend):
Bullish Structure: After forming a market bottom in the area around $73.00, SOL has confirmed a reversal and formed a higher highs and higher lows structure.
Moving Average (MA/EMA): The purple EMA (fast) indicator has been above the orange EMA (slow) (Golden Cross) and is acting as a dynamic support that underpins price movement.
Chart Pattern:
A Bullish Flag / Falling Channel pattern has formed in the price range of $115–$120. This pattern is a signal for continuation of the uptrend (bullish continuation pattern) following the prior impulsive move.
Key Support & Resistance Levels:
Strong Support (Invalidation Level): The gray zone around 103.67 USDT (former resistance that has now turned into strong demand support).
Resistance/Target: The 145.06 USDT area as the next main resistance target.
Trading Signal (Long Position / Buy)
ParameterLevel PriceMarket BiasBullish (Long)Entry Area114.00 – 118.00 USDT (Buy in stages in the consolidation/flag pattern area)Take Profit 1 (TP 1)130.00 USDT (Partial / psychological target)Take Profit 2 (TP 2 / Main)145.00 USDT (Projected target based on the chart)Stop Loss (SL)103.50 USDT (Below the horizontal support zone)Risk-to-Reward Ratio~1 : 2.0 (Very ideal for swing trading)
Risk Management Notes
Breakout Confirmation: The signal will be stronger if the daily candle closes above the upper boundary of the green channel (~120.00 USDT) with increased trading volume.
Capital Management: Limit maximum risk to 1%–2% of total account equity per trade.
SL Adjustment: If price successfully breaks above $130.00, move the Stop Loss to the Breakeven level (entry price) to secure the position without risk.
{future}(SOLUSDT)
Here is a technical analysis and swing trading signal based on the daily chart ($SOL /USDT Perpetual Contract - 1D):
Market Structure & Technical Analysis
Main Trend (Trend):
Bullish Structure: After forming a market bottom in the area around $73.00, SOL has confirmed a reversal and formed a higher highs and higher lows structure.
Moving Average (MA/EMA): The purple EMA (fast) indicator has been above the orange EMA (slow) (Golden Cross) and is acting as a dynamic support that underpins price movement.
Chart Pattern:
A Bullish Flag / Falling Channel pattern has formed in the price range of $115–$120. This pattern is a signal for continuation of the uptrend (bullish continuation pattern) following the prior impulsive move.
Key Support & Resistance Levels:
Strong Support (Invalidation Level): The gray zone around 103.67 USDT (former resistance that has now turned into strong demand support).
Resistance/Target: The 145.06 USDT area as the next main resistance target.
Trading Signal (Long Position / Buy)
ParameterLevel PriceMarket BiasBullish (Long)Entry Area114.00 – 118.00 USDT (Buy in stages in the consolidation/flag pattern area)Take Profit 1 (TP 1)130.00 USDT (Partial / psychological target)Take Profit 2 (TP 2 / Main)145.00 USDT (Projected target based on the chart)Stop Loss (SL)103.50 USDT (Below the horizontal support zone)Risk-to-Reward Ratio~1 : 2.0 (Very ideal for swing trading)
Risk Management Notes
Breakout Confirmation: The signal will be stronger if the daily candle closes above the upper boundary of the green channel (~120.00 USDT) with increased trading volume.
Capital Management: Limit maximum risk to 1%–2% of total account equity per trade.
SL Adjustment: If price successfully breaks above $130.00, move the Stop Loss to the Breakeven level (entry price) to secure the position without risk.
Market Structure & Technical Analysis
Main Trend (Trend):
Bullish Structure: After forming a market bottom in the area around $73.00, SOL has confirmed a reversal and formed a higher highs and higher lows structure.
Moving Average (MA/EMA): The purple EMA (fast) indicator has been above the orange EMA (slow) (Golden Cross) and is acting as a dynamic support that underpins price movement.
Chart Pattern:
A Bullish Flag / Falling Channel pattern has formed in the price range of $115–$120. This pattern is a signal for continuation of the uptrend (bullish continuation pattern) following the prior impulsive move.
Key Support & Resistance Levels:
Strong Support (Invalidation Level): The gray zone around 103.67 USDT (former resistance that has now turned into strong demand support).
Resistance/Target: The 145.06 USDT area as the next main resistance target.
Trading Signal (Long Position / Buy)
ParameterLevel PriceMarket BiasBullish (Long)Entry Area114.00 – 118.00 USDT (Buy in stages in the consolidation/flag pattern area)Take Profit 1 (TP 1)130.00 USDT (Partial / psychological target)Take Profit 2 (TP 2 / Main)145.00 USDT (Projected target based on the chart)Stop Loss (SL)103.50 USDT (Below the horizontal support zone)Risk-to-Reward Ratio~1 : 2.0 (Very ideal for swing trading)
Risk Management Notes
Breakout Confirmation: The signal will be stronger if the daily candle closes above the upper boundary of the green channel (~120.00 USDT) with increased trading volume.
Capital Management: Limit maximum risk to 1%–2% of total account equity per trade.
SL Adjustment: If price successfully breaks above $130.00, move the Stop Loss to the Breakeven level (entry price) to secure the position without risk.
78
·
--
Technical Analysis $MOVR /USDT (Timeframe 1D)
Market Structure & Trend: The MOVR/USDT pair shows a strong indication of a trend reversal (bullish reversal) from the previous downtrend phase. After forming a base (bottom) in the $0.53 – $0.70 range, accompanied by a surge in trading volume at the end of August/September, the price successfully broke out above the main Moving Average indicator line (the orange line).
Movement Pattern (Price Action): The chart shows a Bullish Retest / Pullback Setup scenario. After impulsively moving upward above the MA, the price is expected to undergo a normal correction (retest) toward the support area before continuing the rally toward the supply zone (resistance area) above.
Trading Signal (Plan Setup: LONG)
ParameterLevel Price / DetailAsset PairMOVR/USDT (Perpetual Contract / Spot)Position DirectionLONG / BUYEntry Area$1.1645 – $1.2226 (Recommended to enter gradually within the pullback area)Take Profit (TP)$1.5533 (Target at the main resistance area)Stop Loss (SL)$1.0271 (Structure invalidation level below the swing low)Risk to Reward Ratio~ 1 : 2.83 (Risk Estimate: ~11.8%, Profit Potential Estimate: ~33.4%)
Execution & Risk Management Recommendations
Entry Confirmation: It is recommended not to rush into a market order at the running price level ($1.2226). Place a limit order around $1.1645 – $1.1800 or wait for confirmation of a reversal candle (bullish pinbar/engulfing) on a lower timeframe (1H/4H) around the support area.
Setup Invalidation: This analysis scenario is invalid if the daily candle (daily close) is decisively closed below the $1.0271 level.
Capital Management: Limit the maximum risk to 1% – 2% of the total trading account equity for this transaction.
Market Sentiment: Ensure Bitcoin (BTC) movement is stable or consolidating, as a sharp decline in BTC can disrupt the bullish structure of altcoins.
{future}(MOVRUSDT)
Technical Analysis $MOVR /USDT (Timeframe 1D)
Market Structure & Trend: The MOVR/USDT pair shows a strong indication of a trend reversal (bullish reversal) from the previous downtrend phase. After forming a base (bottom) in the $0.53 – $0.70 range, accompanied by a surge in trading volume at the end of August/September, the price successfully broke out above the main Moving Average indicator line (the orange line).
Movement Pattern (Price Action): The chart shows a Bullish Retest / Pullback Setup scenario. After impulsively moving upward above the MA, the price is expected to undergo a normal correction (retest) toward the support area before continuing the rally toward the supply zone (resistance area) above.
Trading Signal (Plan Setup: LONG)
ParameterLevel Price / DetailAsset PairMOVR/USDT (Perpetual Contract / Spot)Position DirectionLONG / BUYEntry Area$1.1645 – $1.2226 (Recommended to enter gradually within the pullback area)Take Profit (TP)$1.5533 (Target at the main resistance area)Stop Loss (SL)$1.0271 (Structure invalidation level below the swing low)Risk to Reward Ratio~ 1 : 2.83 (Risk Estimate: ~11.8%, Profit Potential Estimate: ~33.4%)
Execution & Risk Management Recommendations
Entry Confirmation: It is recommended not to rush into a market order at the running price level ($1.2226). Place a limit order around $1.1645 – $1.1800 or wait for confirmation of a reversal candle (bullish pinbar/engulfing) on a lower timeframe (1H/4H) around the support area.
Setup Invalidation: This analysis scenario is invalid if the daily candle (daily close) is decisively closed below the $1.0271 level.
Capital Management: Limit the maximum risk to 1% – 2% of the total trading account equity for this transaction.
Market Sentiment: Ensure Bitcoin (BTC) movement is stable or consolidating, as a sharp decline in BTC can disrupt the bullish structure of altcoins.
Market Structure & Trend: The MOVR/USDT pair shows a strong indication of a trend reversal (bullish reversal) from the previous downtrend phase. After forming a base (bottom) in the $0.53 – $0.70 range, accompanied by a surge in trading volume at the end of August/September, the price successfully broke out above the main Moving Average indicator line (the orange line).
Movement Pattern (Price Action): The chart shows a Bullish Retest / Pullback Setup scenario. After impulsively moving upward above the MA, the price is expected to undergo a normal correction (retest) toward the support area before continuing the rally toward the supply zone (resistance area) above.
Trading Signal (Plan Setup: LONG)
ParameterLevel Price / DetailAsset PairMOVR/USDT (Perpetual Contract / Spot)Position DirectionLONG / BUYEntry Area$1.1645 – $1.2226 (Recommended to enter gradually within the pullback area)Take Profit (TP)$1.5533 (Target at the main resistance area)Stop Loss (SL)$1.0271 (Structure invalidation level below the swing low)Risk to Reward Ratio~ 1 : 2.83 (Risk Estimate: ~11.8%, Profit Potential Estimate: ~33.4%)
Execution & Risk Management Recommendations
Entry Confirmation: It is recommended not to rush into a market order at the running price level ($1.2226). Place a limit order around $1.1645 – $1.1800 or wait for confirmation of a reversal candle (bullish pinbar/engulfing) on a lower timeframe (1H/4H) around the support area.
Setup Invalidation: This analysis scenario is invalid if the daily candle (daily close) is decisively closed below the $1.0271 level.
Capital Management: Limit the maximum risk to 1% – 2% of the total trading account equity for this transaction.
Market Sentiment: Ensure Bitcoin (BTC) movement is stable or consolidating, as a sharp decline in BTC can disrupt the bullish structure of altcoins.
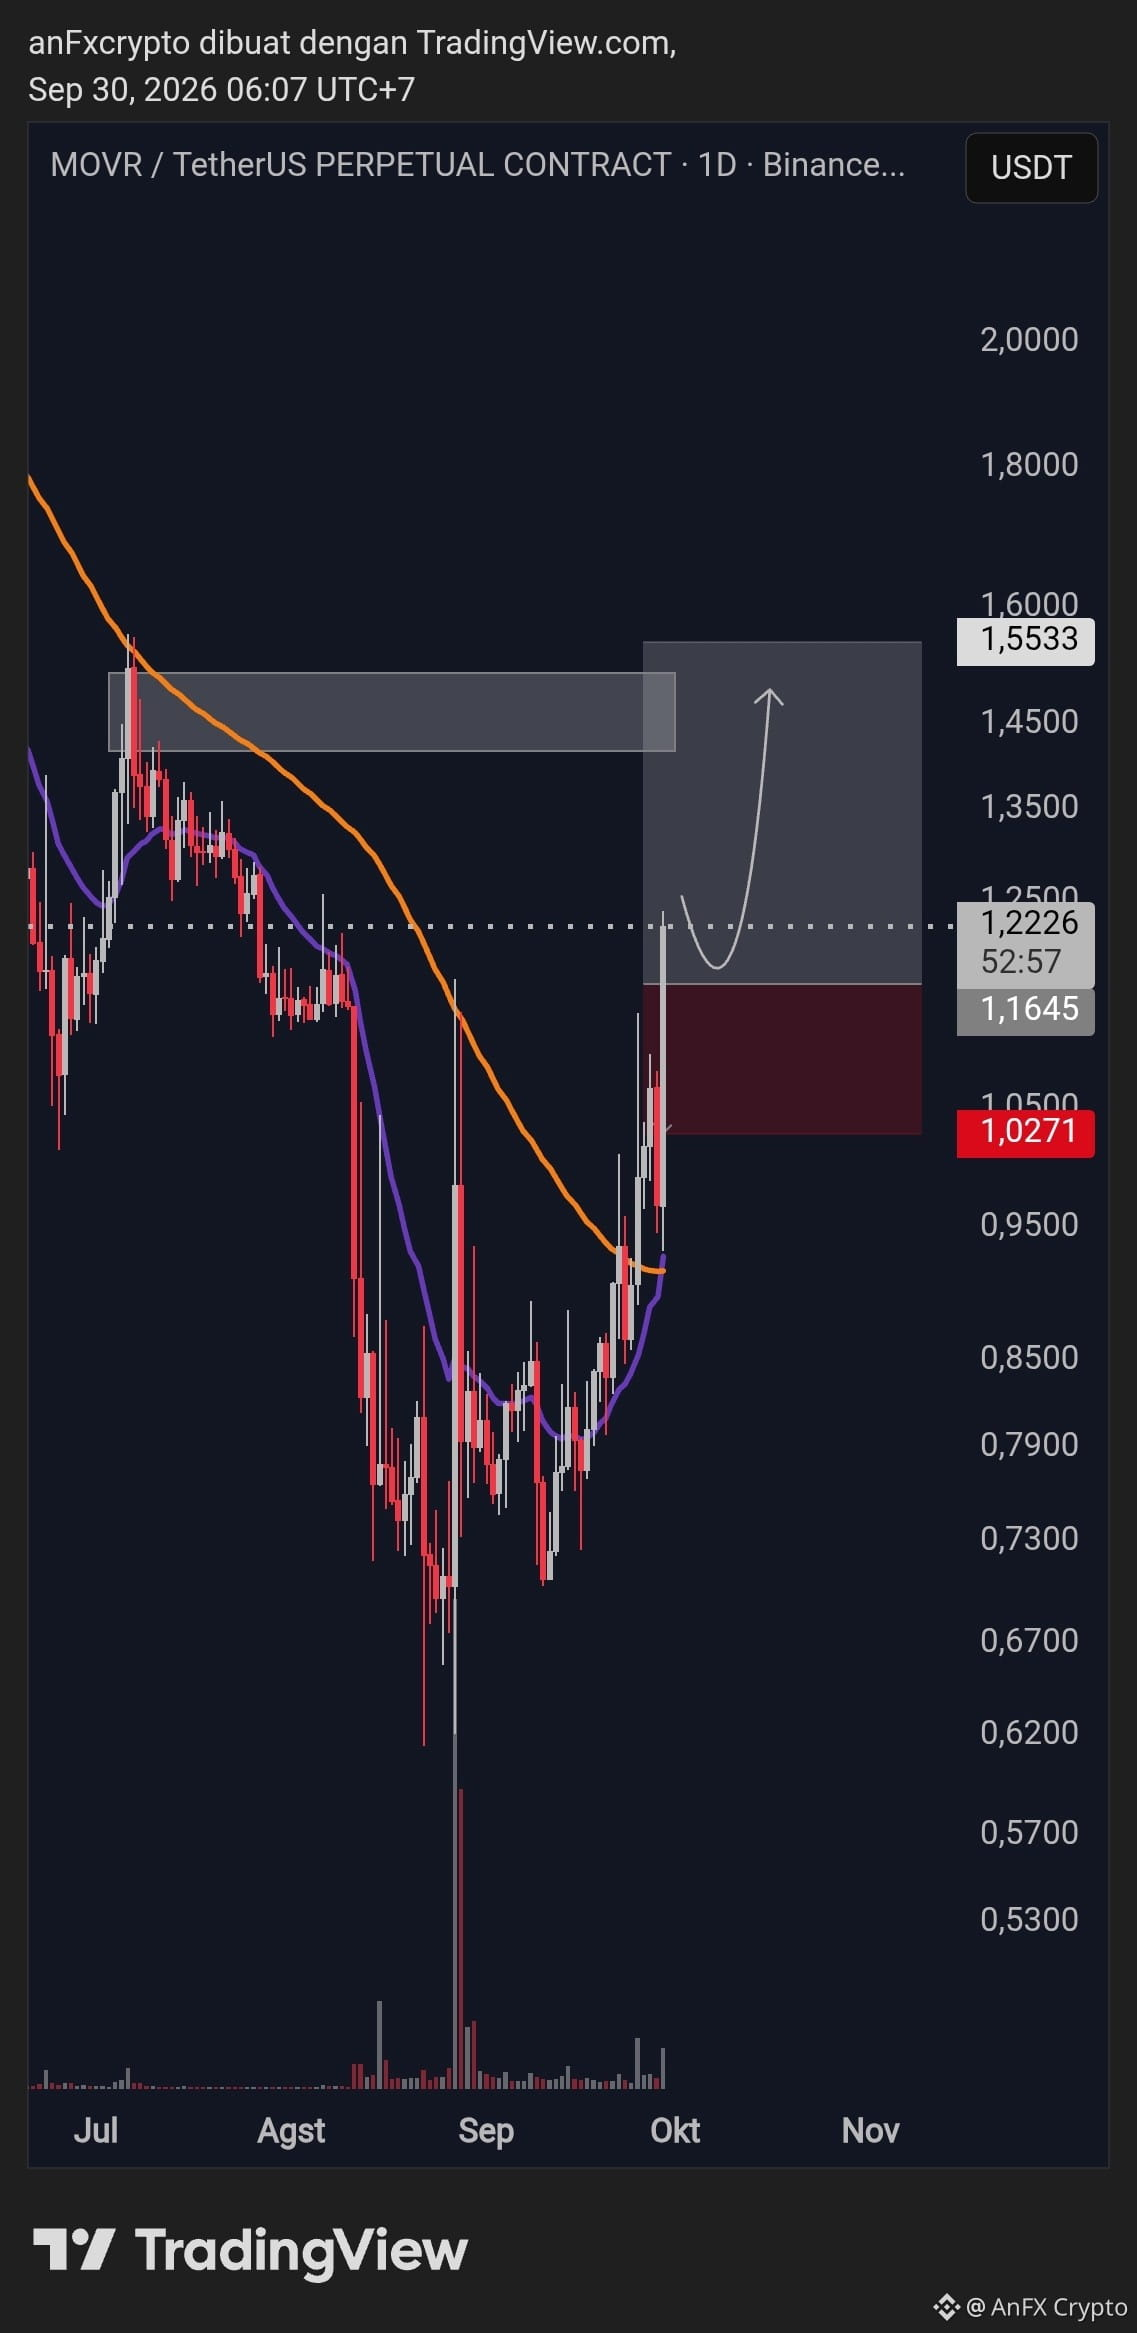
12
·
--
Based on technical analysis on the chart $PHA /USDT Perpetual (Timeframe 4 Hours / 4H):
1. Market Structure Analysis & Indicators
Trend Structure: The market is currently in a Bullish Continuation structure. After experiencing an impulsive price move (impulsive wave) toward the local peak area around ~0.098, the price made a healthy correction toward the Demand Zone / Order Block in the range of 0.06059 – 0.06392.
Support Reaction: A strong bounce occurred from the Demand area, supported by the intersection of dynamic Moving Average (MA) lines acting as support.
Volume: Selling volume during the correction decreased drastically (declining volume), indicating that selling pressure is weakening and that the lower area is being utilized by buyers for re-accumulation.
2. Signals & Trading Plan (LONG Setup)
Parameter | Price Level | Market Bias
Entry Zone (Buy/Long): 0.07000 – 0.07250 (or wait for a light dip toward the re-test area)
Take Profit 1 (TP 1): 0.08500 (Local resistance area)
Take Profit 2 (TP 2): 0.09800 (Major Swing High)
Take Profit 3 (TP 3 / Main Target): 0.10895 (Main target according to the chart projection)
Stop Loss (SL): 0.05051 (Below the lower boundary of the Demand Zone)
3. Risk Management & Execution Notes
Risk to Reward Ratio (RRR): Around 1 : 2.5+, making this risk-to-potential-profit ratio very ideal for swing trading.
Capital Management: Limit maximum risk to 1% – 2% of your account’s total equity for this trade.
Leverage: If using Futures/Perpetual contracts, it is recommended to use controlled leverage (e.g., 3x – 5x) to avoid extreme volatility.
Invalidation Scenario: If price closes (4H candle close) below the 0.06000 area, the bullish structure fails and it is recommended to be disciplined with a cut loss or capital preservation.
{future}(PHAUSDT)
Based on technical analysis on the chart $PHA /USDT Perpetual (Timeframe 4 Hours / 4H):
1. Market Structure Analysis & Indicators
Trend Structure: The market is currently in a Bullish Continuation structure. After experiencing an impulsive price move (impulsive wave) toward the local peak area around ~0.098, the price made a healthy correction toward the Demand Zone / Order Block in the range of 0.06059 – 0.06392.
Support Reaction: A strong bounce occurred from the Demand area, supported by the intersection of dynamic Moving Average (MA) lines acting as support.
Volume: Selling volume during the correction decreased drastically (declining volume), indicating that selling pressure is weakening and that the lower area is being utilized by buyers for re-accumulation.
2. Signals & Trading Plan (LONG Setup)
Parameter | Price Level | Market Bias
Entry Zone (Buy/Long): 0.07000 – 0.07250 (or wait for a light dip toward the re-test area)
Take Profit 1 (TP 1): 0.08500 (Local resistance area)
Take Profit 2 (TP 2): 0.09800 (Major Swing High)
Take Profit 3 (TP 3 / Main Target): 0.10895 (Main target according to the chart projection)
Stop Loss (SL): 0.05051 (Below the lower boundary of the Demand Zone)
3. Risk Management & Execution Notes
Risk to Reward Ratio (RRR): Around 1 : 2.5+, making this risk-to-potential-profit ratio very ideal for swing trading.
Capital Management: Limit maximum risk to 1% – 2% of your account’s total equity for this trade.
Leverage: If using Futures/Perpetual contracts, it is recommended to use controlled leverage (e.g., 3x – 5x) to avoid extreme volatility.
Invalidation Scenario: If price closes (4H candle close) below the 0.06000 area, the bullish structure fails and it is recommended to be disciplined with a cut loss or capital preservation.
1. Market Structure Analysis & Indicators
Trend Structure: The market is currently in a Bullish Continuation structure. After experiencing an impulsive price move (impulsive wave) toward the local peak area around ~0.098, the price made a healthy correction toward the Demand Zone / Order Block in the range of 0.06059 – 0.06392.
Support Reaction: A strong bounce occurred from the Demand area, supported by the intersection of dynamic Moving Average (MA) lines acting as support.
Volume: Selling volume during the correction decreased drastically (declining volume), indicating that selling pressure is weakening and that the lower area is being utilized by buyers for re-accumulation.
2. Signals & Trading Plan (LONG Setup)
Parameter | Price Level | Market Bias
Entry Zone (Buy/Long): 0.07000 – 0.07250 (or wait for a light dip toward the re-test area)
Take Profit 1 (TP 1): 0.08500 (Local resistance area)
Take Profit 2 (TP 2): 0.09800 (Major Swing High)
Take Profit 3 (TP 3 / Main Target): 0.10895 (Main target according to the chart projection)
Stop Loss (SL): 0.05051 (Below the lower boundary of the Demand Zone)
3. Risk Management & Execution Notes
Risk to Reward Ratio (RRR): Around 1 : 2.5+, making this risk-to-potential-profit ratio very ideal for swing trading.
Capital Management: Limit maximum risk to 1% – 2% of your account’s total equity for this trade.
Leverage: If using Futures/Perpetual contracts, it is recommended to use controlled leverage (e.g., 3x – 5x) to avoid extreme volatility.
Invalidation Scenario: If price closes (4H candle close) below the 0.06000 area, the bullish structure fails and it is recommended to be disciplined with a cut loss or capital preservation.
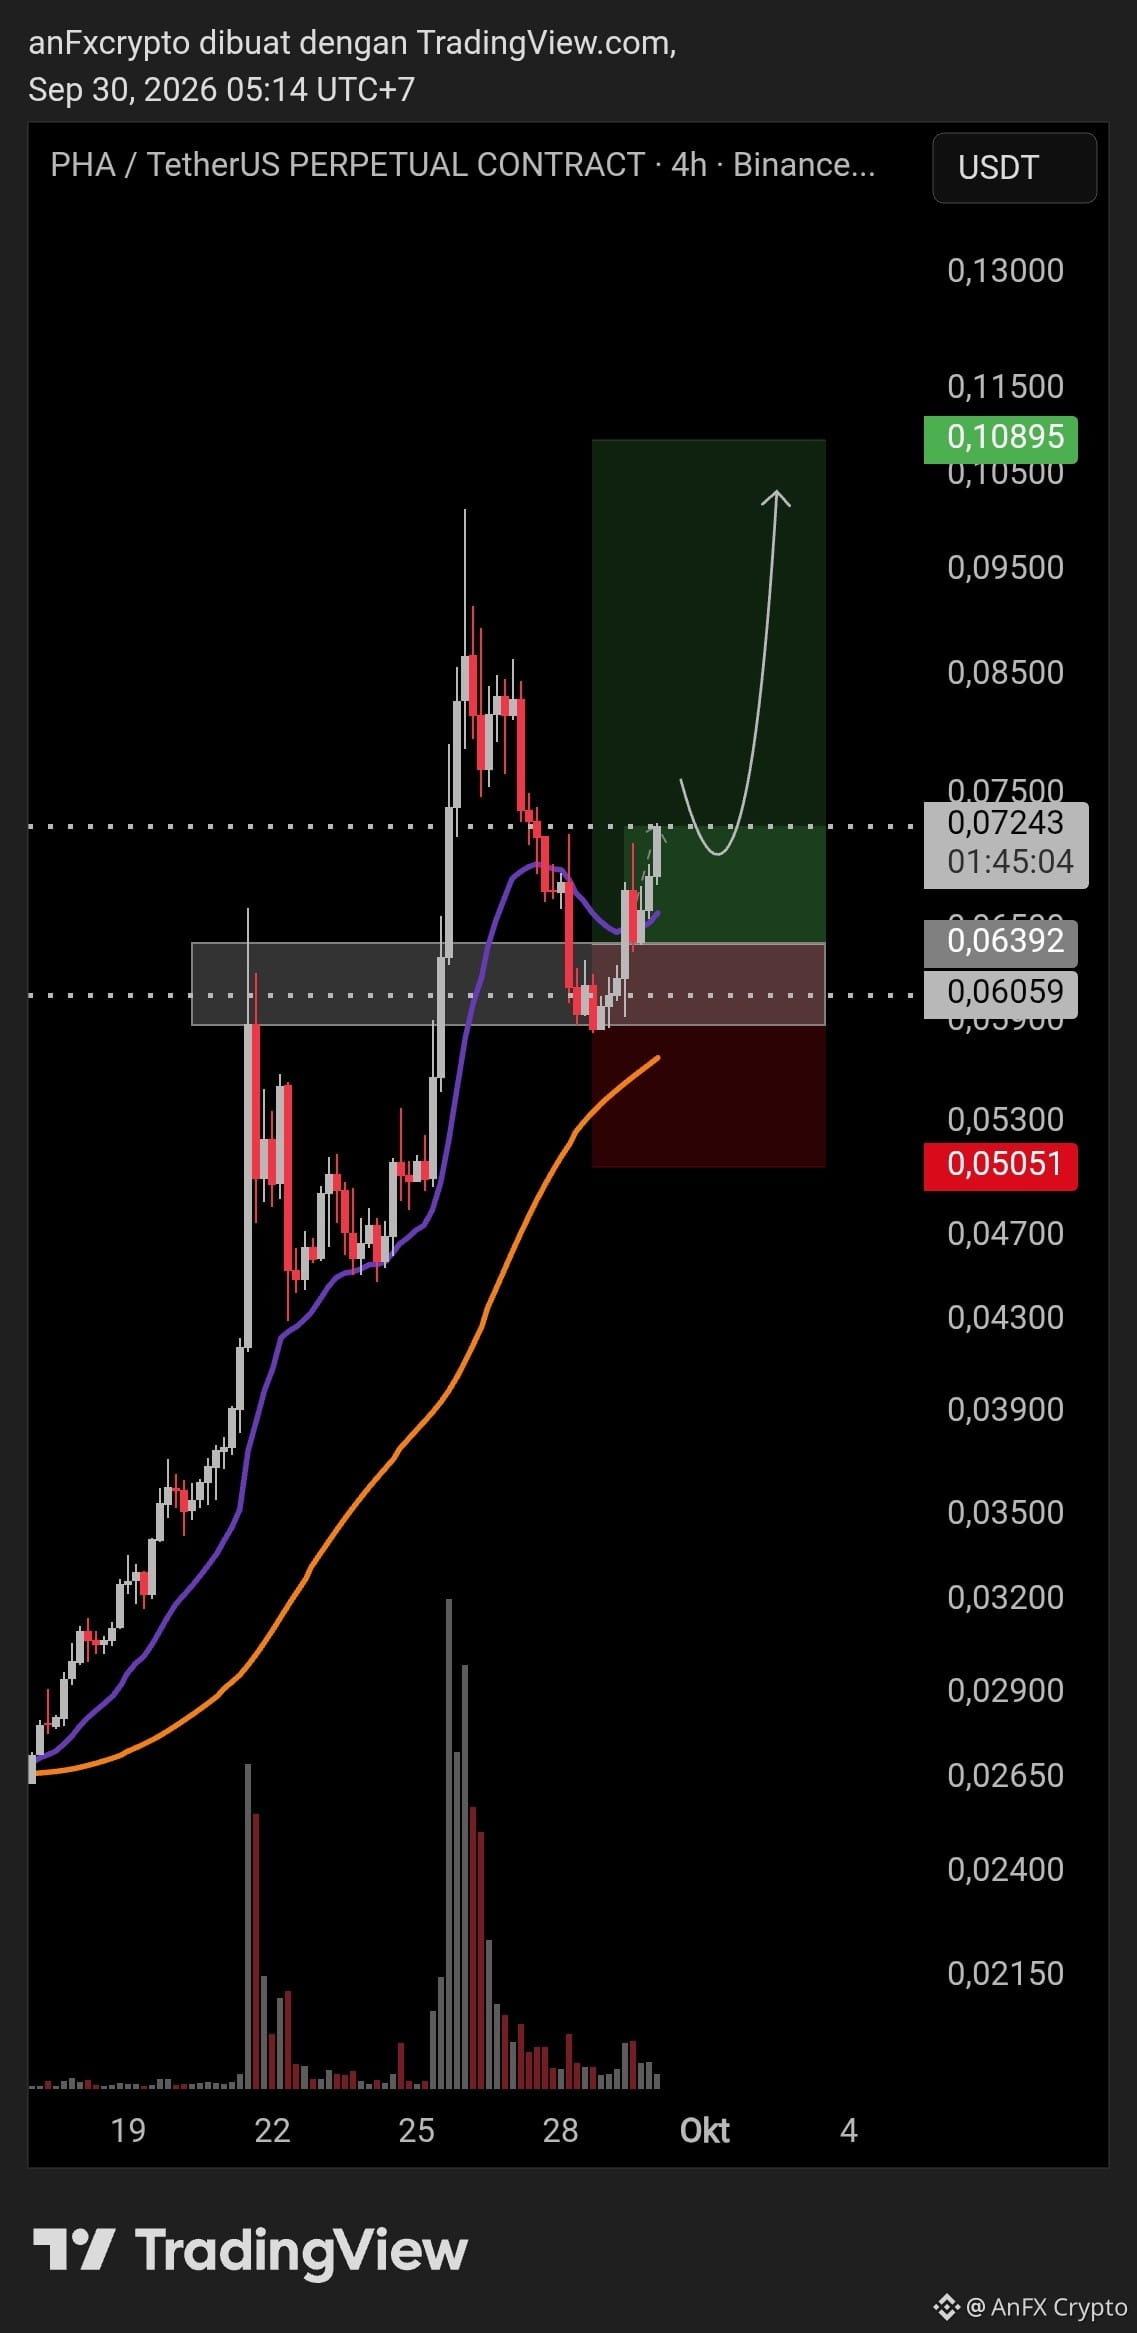
12
·
--
Technical Analysis ($BTW /USDT - 4H)
Price Structure & Trend: The BTW/USDT Perpetual pair (4H) shows highly fluctuating movement (high volatility) with the formation of an expansion/channel pattern. A quick breakout (liquidity sweep) occurred up to the $0.9000–$1.0000 range before strongly bouncing back above $1.2000.
Dynamic Support Indicator: Current price ($1.2975) is above the main Moving Average (purple line in the $1.1900–$1.2000 range), which is now acting as a dynamic support area.
Volume: A spike in transaction volume is visible on the correction and previous reversal candles, indicating accumulation from buyers in the lower-low area.
Directional Projection (Chart Setup): Based on the projection lines on the chart, price is expected to undergo a healthy correction (pullback/retest) first toward the $1.1928 zone before continuing the bullish push toward the upper target.
Trading Signal (Long / Buy)
Trade Direction: LONG / BUY
Entry Area:
Entry 1 (Market): $1.2900 – $1.2975
Entry 2 (Limit / Pullback): $1.1928 – $1.2200 (Ideal retest area)
Take Profit (TP):
TP 1: $1.4500 (Local resistance)
TP 2 (Main Target): $1.5635 (According to the upper bound of the green area)
TP 3 (Extended Target): $1.6000 – $1.8000
Stop Loss (SL): $1.0280 (Below the critical support line / red zone)
Risk to Reward Ratio (RRR): ~1 : 1.6+ (the closer the entry to the $1.1928 level, the better the RRR ratio)
Risk Management Guide
Leverage: Maximum 3x – 5x is recommended on futures/perpetual contracts to anticipate needle-like volatility (wick).
Position Allocation: Limit maximum risk to 1% – 2% of total portfolio equity for this trade.
Confirmation: If you haven’t opened a position yet, wait for a price bounce (bullish rejection candle) around the $1.1928 support area to get a safer entry confirmation.
{future}(BTWUSDT)
Technical Analysis ($BTW /USDT - 4H)
Price Structure & Trend: The BTW/USDT Perpetual pair (4H) shows highly fluctuating movement (high volatility) with the formation of an expansion/channel pattern. A quick breakout (liquidity sweep) occurred up to the $0.9000–$1.0000 range before strongly bouncing back above $1.2000.
Dynamic Support Indicator: Current price ($1.2975) is above the main Moving Average (purple line in the $1.1900–$1.2000 range), which is now acting as a dynamic support area.
Volume: A spike in transaction volume is visible on the correction and previous reversal candles, indicating accumulation from buyers in the lower-low area.
Directional Projection (Chart Setup): Based on the projection lines on the chart, price is expected to undergo a healthy correction (pullback/retest) first toward the $1.1928 zone before continuing the bullish push toward the upper target.
Trading Signal (Long / Buy)
Trade Direction: LONG / BUY
Entry Area:
Entry 1 (Market): $1.2900 – $1.2975
Entry 2 (Limit / Pullback): $1.1928 – $1.2200 (Ideal retest area)
Take Profit (TP):
TP 1: $1.4500 (Local resistance)
TP 2 (Main Target): $1.5635 (According to the upper bound of the green area)
TP 3 (Extended Target): $1.6000 – $1.8000
Stop Loss (SL): $1.0280 (Below the critical support line / red zone)
Risk to Reward Ratio (RRR): ~1 : 1.6+ (the closer the entry to the $1.1928 level, the better the RRR ratio)
Risk Management Guide
Leverage: Maximum 3x – 5x is recommended on futures/perpetual contracts to anticipate needle-like volatility (wick).
Position Allocation: Limit maximum risk to 1% – 2% of total portfolio equity for this trade.
Confirmation: If you haven’t opened a position yet, wait for a price bounce (bullish rejection candle) around the $1.1928 support area to get a safer entry confirmation.
Price Structure & Trend: The BTW/USDT Perpetual pair (4H) shows highly fluctuating movement (high volatility) with the formation of an expansion/channel pattern. A quick breakout (liquidity sweep) occurred up to the $0.9000–$1.0000 range before strongly bouncing back above $1.2000.
Dynamic Support Indicator: Current price ($1.2975) is above the main Moving Average (purple line in the $1.1900–$1.2000 range), which is now acting as a dynamic support area.
Volume: A spike in transaction volume is visible on the correction and previous reversal candles, indicating accumulation from buyers in the lower-low area.
Directional Projection (Chart Setup): Based on the projection lines on the chart, price is expected to undergo a healthy correction (pullback/retest) first toward the $1.1928 zone before continuing the bullish push toward the upper target.
Trading Signal (Long / Buy)
Trade Direction: LONG / BUY
Entry Area:
Entry 1 (Market): $1.2900 – $1.2975
Entry 2 (Limit / Pullback): $1.1928 – $1.2200 (Ideal retest area)
Take Profit (TP):
TP 1: $1.4500 (Local resistance)
TP 2 (Main Target): $1.5635 (According to the upper bound of the green area)
TP 3 (Extended Target): $1.6000 – $1.8000
Stop Loss (SL): $1.0280 (Below the critical support line / red zone)
Risk to Reward Ratio (RRR): ~1 : 1.6+ (the closer the entry to the $1.1928 level, the better the RRR ratio)
Risk Management Guide
Leverage: Maximum 3x – 5x is recommended on futures/perpetual contracts to anticipate needle-like volatility (wick).
Position Allocation: Limit maximum risk to 1% – 2% of total portfolio equity for this trade.
Confirmation: If you haven’t opened a position yet, wait for a price bounce (bullish rejection candle) around the $1.1928 support area to get a safer entry confirmation.
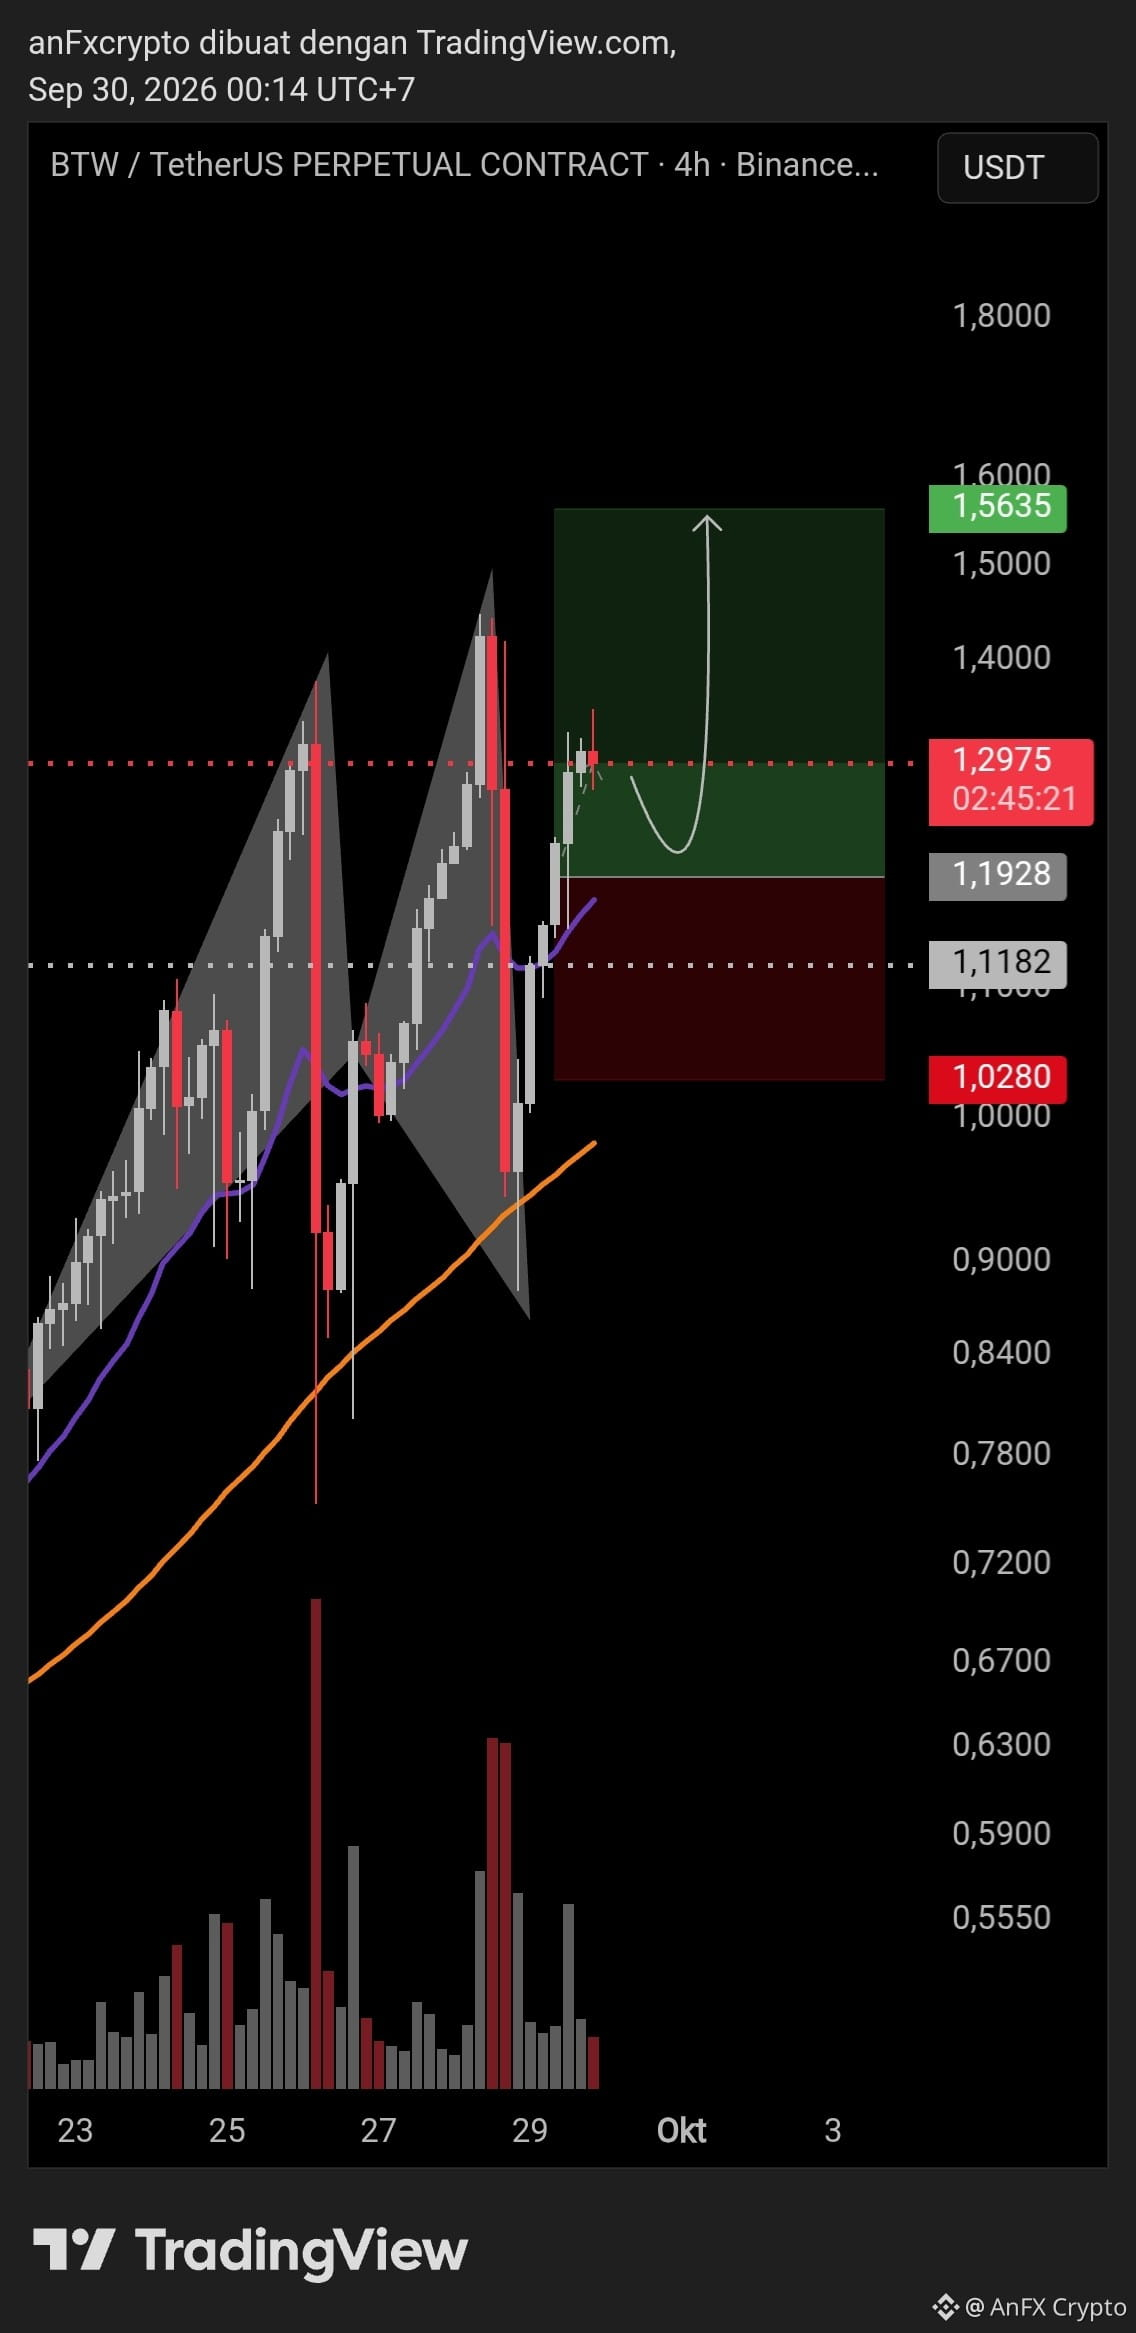
99
·
--
Technical Analysis ($CRV /USDT - 1D Perpetual)
Market Structure & Reversal:
Accumulation Pattern: After experiencing a prolonged downtrend until the lowest point in the range of $0.1750 – $0.1950, CRV forms a base pattern (accumulation / rounded bottom).
Breakout & Potential Retest: Price has broken through the local structure resistance zone in the area of $0.3700. The white line projection indicates the potential for a healthy correction (retest) into the demand zone of $0.3700 – $0.4000 before continuing the main bullish push.
Moving Average Confirmation: The moving average line (EMA) is starting to curve upward and shows bullish crossover indications, supported by a volume surge during the accumulation phase.
Trading Signal (Long Position / Buy Setup)
ParameterLevel Price / DetailsDescriptionAsset PairCRV / TetherUS PerpetualBinance Futures (Timeframe 1D)Position DirectionLONG / BUYTrend-Following Reversal SetupEntry Zone (Buy)$0.3700 – $0.4070Buy the Dip / Retest SupportStop Loss (SL)$0.2715Below the swing low (Invalidation Level)Target Profit 1 (TP 1)$0.5400Local resistance area (Take partial profit)Target Profit 2 (TP 2)$0.7000Mid-range targetTarget Profit 3 (TP 3)$0.8930 – $0.9500Major Resistance Zone (Main Target)Risk-to-Reward Ratio (RRR)1 : 3.84Very ideal for Swing Trading
Risk Calculation & Execution Plan
Risk Projection (SL): A decrease of -$0.1285 per coin (~32.1% of the average entry price $0.4000).
Profit Projection (TP Main): An increase of +$0.4932 per coin (~123.3% of the average entry price $0.4000).
Risk Management Plan:
Position Sizing: Limit maximum loss risk to 1% – 3% of the total trading portfolio equity in this trade.
DCA Entry: Perform staged buying (Dollar-Cost Averaging) within the price range $0.3700 – $0.4070 to obtain the best average entry price.
Profit Protection: Once TP 1 at $0.5400 is hit, immediately move the Stop Loss location to the Entry point (Break Even Point / BEP) to keep the trade position protected from capital loss risk.
{future}(CRVUSDT)
Technical Analysis ($CRV /USDT - 1D Perpetual)
Market Structure & Reversal:
Accumulation Pattern: After experiencing a prolonged downtrend until the lowest point in the range of $0.1750 – $0.1950, CRV forms a base pattern (accumulation / rounded bottom).
Breakout & Potential Retest: Price has broken through the local structure resistance zone in the area of $0.3700. The white line projection indicates the potential for a healthy correction (retest) into the demand zone of $0.3700 – $0.4000 before continuing the main bullish push.
Moving Average Confirmation: The moving average line (EMA) is starting to curve upward and shows bullish crossover indications, supported by a volume surge during the accumulation phase.
Trading Signal (Long Position / Buy Setup)
ParameterLevel Price / DetailsDescriptionAsset PairCRV / TetherUS PerpetualBinance Futures (Timeframe 1D)Position DirectionLONG / BUYTrend-Following Reversal SetupEntry Zone (Buy)$0.3700 – $0.4070Buy the Dip / Retest SupportStop Loss (SL)$0.2715Below the swing low (Invalidation Level)Target Profit 1 (TP 1)$0.5400Local resistance area (Take partial profit)Target Profit 2 (TP 2)$0.7000Mid-range targetTarget Profit 3 (TP 3)$0.8930 – $0.9500Major Resistance Zone (Main Target)Risk-to-Reward Ratio (RRR)1 : 3.84Very ideal for Swing Trading
Risk Calculation & Execution Plan
Risk Projection (SL): A decrease of -$0.1285 per coin (~32.1% of the average entry price $0.4000).
Profit Projection (TP Main): An increase of +$0.4932 per coin (~123.3% of the average entry price $0.4000).
Risk Management Plan:
Position Sizing: Limit maximum loss risk to 1% – 3% of the total trading portfolio equity in this trade.
DCA Entry: Perform staged buying (Dollar-Cost Averaging) within the price range $0.3700 – $0.4070 to obtain the best average entry price.
Profit Protection: Once TP 1 at $0.5400 is hit, immediately move the Stop Loss location to the Entry point (Break Even Point / BEP) to keep the trade position protected from capital loss risk.
Market Structure & Reversal:
Accumulation Pattern: After experiencing a prolonged downtrend until the lowest point in the range of $0.1750 – $0.1950, CRV forms a base pattern (accumulation / rounded bottom).
Breakout & Potential Retest: Price has broken through the local structure resistance zone in the area of $0.3700. The white line projection indicates the potential for a healthy correction (retest) into the demand zone of $0.3700 – $0.4000 before continuing the main bullish push.
Moving Average Confirmation: The moving average line (EMA) is starting to curve upward and shows bullish crossover indications, supported by a volume surge during the accumulation phase.
Trading Signal (Long Position / Buy Setup)
ParameterLevel Price / DetailsDescriptionAsset PairCRV / TetherUS PerpetualBinance Futures (Timeframe 1D)Position DirectionLONG / BUYTrend-Following Reversal SetupEntry Zone (Buy)$0.3700 – $0.4070Buy the Dip / Retest SupportStop Loss (SL)$0.2715Below the swing low (Invalidation Level)Target Profit 1 (TP 1)$0.5400Local resistance area (Take partial profit)Target Profit 2 (TP 2)$0.7000Mid-range targetTarget Profit 3 (TP 3)$0.8930 – $0.9500Major Resistance Zone (Main Target)Risk-to-Reward Ratio (RRR)1 : 3.84Very ideal for Swing Trading
Risk Calculation & Execution Plan
Risk Projection (SL): A decrease of -$0.1285 per coin (~32.1% of the average entry price $0.4000).
Profit Projection (TP Main): An increase of +$0.4932 per coin (~123.3% of the average entry price $0.4000).
Risk Management Plan:
Position Sizing: Limit maximum loss risk to 1% – 3% of the total trading portfolio equity in this trade.
DCA Entry: Perform staged buying (Dollar-Cost Averaging) within the price range $0.3700 – $0.4070 to obtain the best average entry price.
Profit Protection: Once TP 1 at $0.5400 is hit, immediately move the Stop Loss location to the Entry point (Break Even Point / BEP) to keep the trade position protected from capital loss risk.
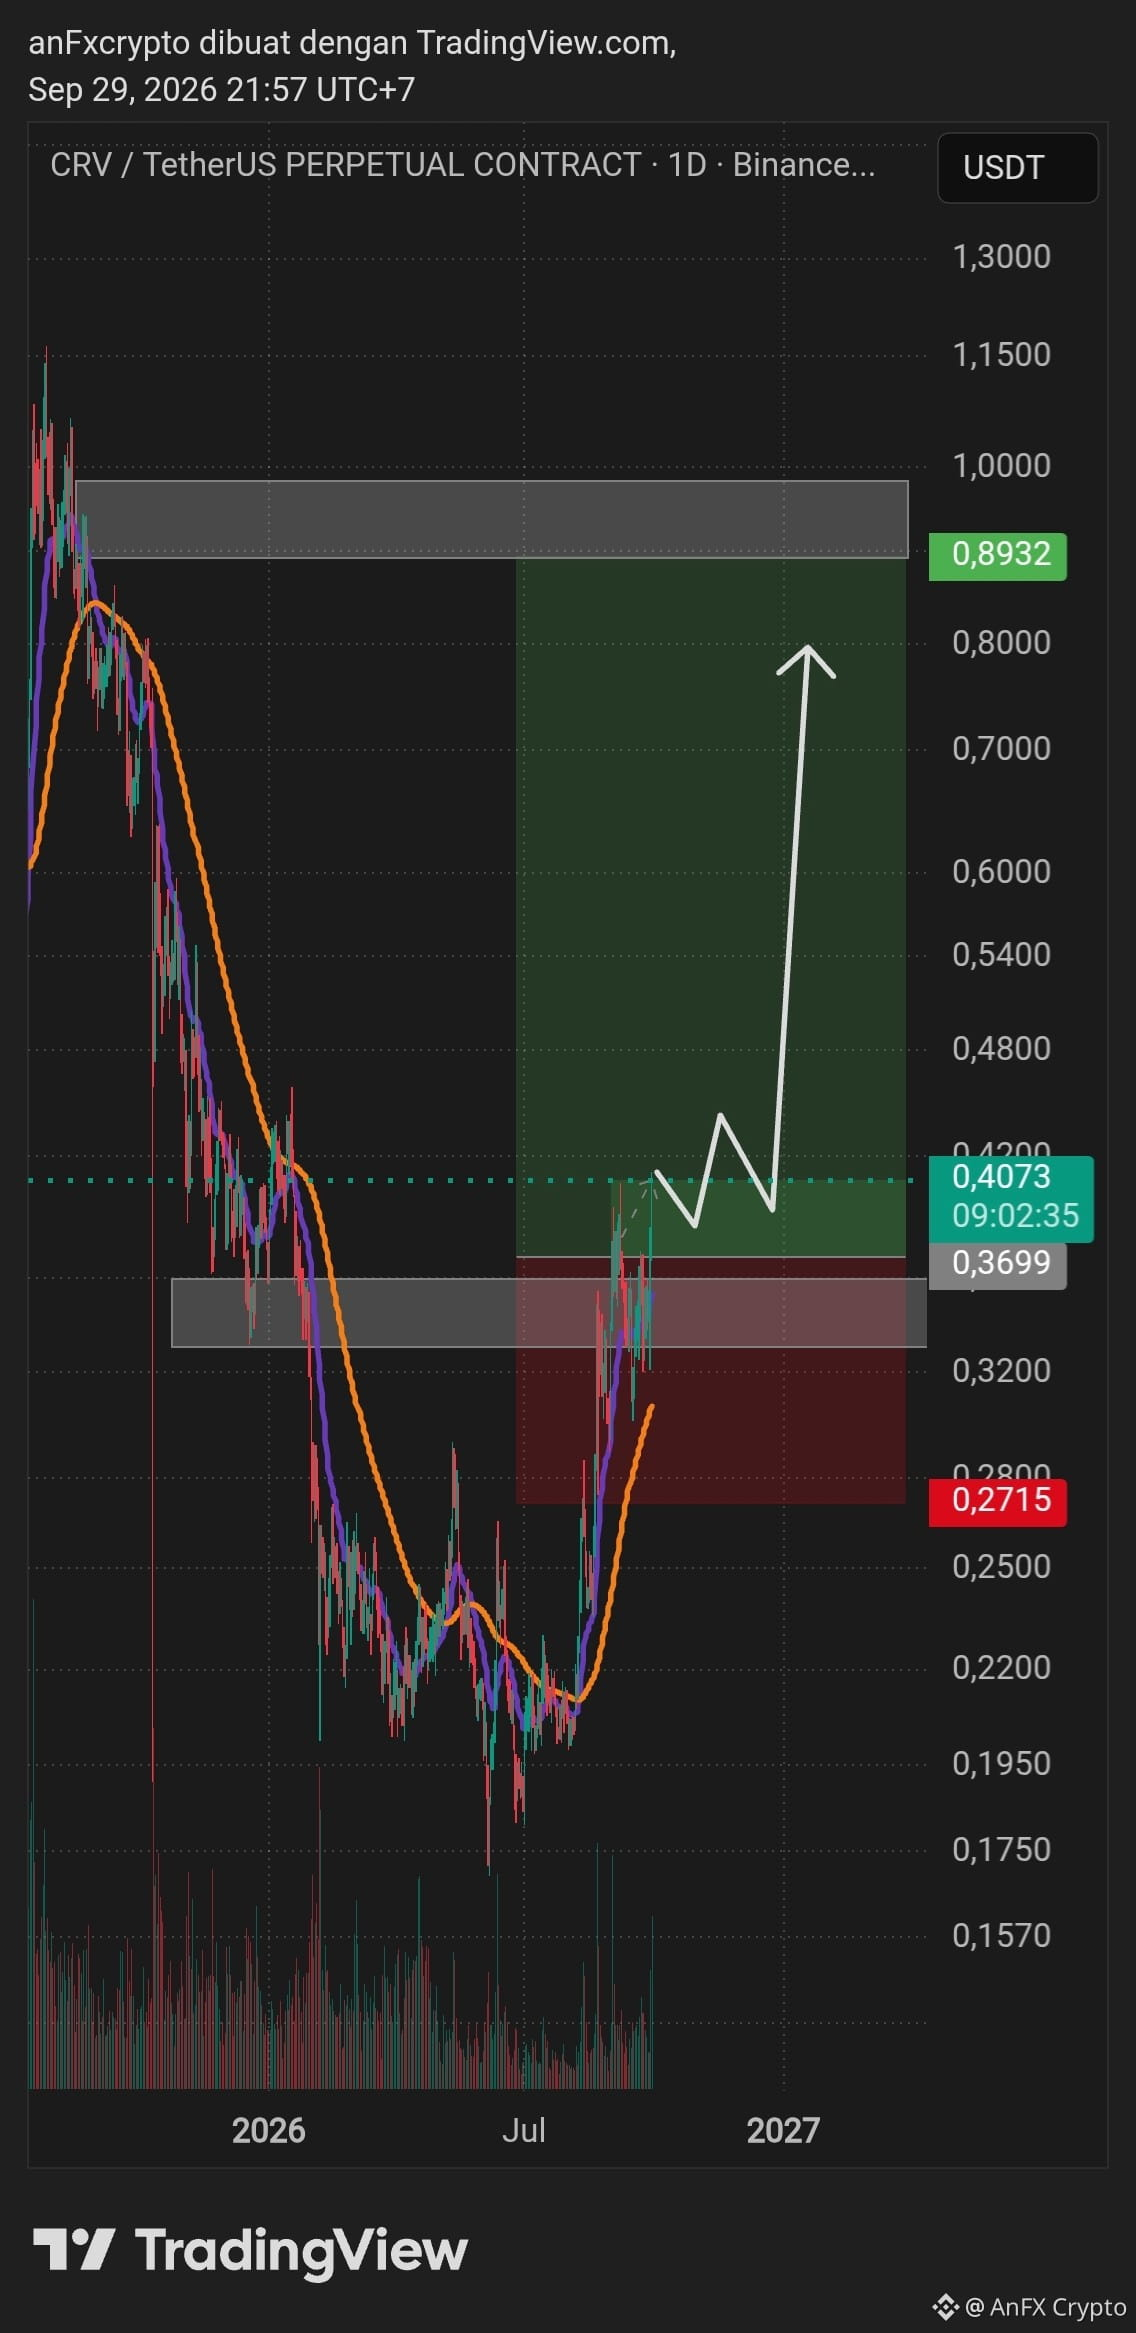
70
·
--
Technical Analysis $AAVE /USDT (1D -)
Market Structure & Price Action:
Trend & Reversal (Reversal): After experiencing a sharp decline and touching the base around $60.50 in July 2026, AAVE has shown a strong bullish impulse push.
Breakout & New Support Zone: Price has broken through an important resistance boundary in the $125.00 – $143.57 area, which is now functioning as a Demand / Support Swap zone.
Movement Projection: The chart indicates a potential healthy correction phase (pullback/retest) back into the demand area before continuing the main bullish expansion toward the Major Supply Zone in the $305.00 – $360.00 range.
Trading Signal (Swing Long Setup)
Bias: Bullish (Buy / Long)
Buy Zone (Entry): $143.50 – $165.00 (Waiting for a correction/retest into the demand area)
Stop Loss (SL): $112.51 (A daily candle close below the demand zone invalidates the bullish structure)
Take Profit (TP): $359.89 (Main target at the upper supply zone)
Risk-to-Reward Ratio (RRR): ~ 1 : 3.8 (Technically very promising)
Execution Plan & Risk Management
Entry Strategy:
Perform Dollar-Cost Averaging (DCA) with staged entries in the $143.50 – $165.00 area. Do not use Full Margin / All-in at the current market price ($175.49) to anticipate a pullback.
Leverage Management & Position Sizing:
Since this is a Swing Trade scenario on the Daily Timeframe (1D), use low leverage (Spot / Futures 2x–5x) to avoid liquidation due to daily volatility.
Limit the maximum loss risk to 1% – 2% of your total portfolio equity on this position.
Stop Loss Adjustment:
If price successfully bounces and breaks through the $200.00 level, move the Stop Loss to Breakeven (BEP / entry price) to secure the main capital.
{future}(AAVEUSDT)
Technical Analysis $AAVE /USDT (1D -)
Market Structure & Price Action:
Trend & Reversal (Reversal): After experiencing a sharp decline and touching the base around $60.50 in July 2026, AAVE has shown a strong bullish impulse push.
Breakout & New Support Zone: Price has broken through an important resistance boundary in the $125.00 – $143.57 area, which is now functioning as a Demand / Support Swap zone.
Movement Projection: The chart indicates a potential healthy correction phase (pullback/retest) back into the demand area before continuing the main bullish expansion toward the Major Supply Zone in the $305.00 – $360.00 range.
Trading Signal (Swing Long Setup)
Bias: Bullish (Buy / Long)
Buy Zone (Entry): $143.50 – $165.00 (Waiting for a correction/retest into the demand area)
Stop Loss (SL): $112.51 (A daily candle close below the demand zone invalidates the bullish structure)
Take Profit (TP): $359.89 (Main target at the upper supply zone)
Risk-to-Reward Ratio (RRR): ~ 1 : 3.8 (Technically very promising)
Execution Plan & Risk Management
Entry Strategy:
Perform Dollar-Cost Averaging (DCA) with staged entries in the $143.50 – $165.00 area. Do not use Full Margin / All-in at the current market price ($175.49) to anticipate a pullback.
Leverage Management & Position Sizing:
Since this is a Swing Trade scenario on the Daily Timeframe (1D), use low leverage (Spot / Futures 2x–5x) to avoid liquidation due to daily volatility.
Limit the maximum loss risk to 1% – 2% of your total portfolio equity on this position.
Stop Loss Adjustment:
If price successfully bounces and breaks through the $200.00 level, move the Stop Loss to Breakeven (BEP / entry price) to secure the main capital.
Market Structure & Price Action:
Trend & Reversal (Reversal): After experiencing a sharp decline and touching the base around $60.50 in July 2026, AAVE has shown a strong bullish impulse push.
Breakout & New Support Zone: Price has broken through an important resistance boundary in the $125.00 – $143.57 area, which is now functioning as a Demand / Support Swap zone.
Movement Projection: The chart indicates a potential healthy correction phase (pullback/retest) back into the demand area before continuing the main bullish expansion toward the Major Supply Zone in the $305.00 – $360.00 range.
Trading Signal (Swing Long Setup)
Bias: Bullish (Buy / Long)
Buy Zone (Entry): $143.50 – $165.00 (Waiting for a correction/retest into the demand area)
Stop Loss (SL): $112.51 (A daily candle close below the demand zone invalidates the bullish structure)
Take Profit (TP): $359.89 (Main target at the upper supply zone)
Risk-to-Reward Ratio (RRR): ~ 1 : 3.8 (Technically very promising)
Execution Plan & Risk Management
Entry Strategy:
Perform Dollar-Cost Averaging (DCA) with staged entries in the $143.50 – $165.00 area. Do not use Full Margin / All-in at the current market price ($175.49) to anticipate a pullback.
Leverage Management & Position Sizing:
Since this is a Swing Trade scenario on the Daily Timeframe (1D), use low leverage (Spot / Futures 2x–5x) to avoid liquidation due to daily volatility.
Limit the maximum loss risk to 1% – 2% of your total portfolio equity on this position.
Stop Loss Adjustment:
If price successfully bounces and breaks through the $200.00 level, move the Stop Loss to Breakeven (BEP / entry price) to secure the main capital.
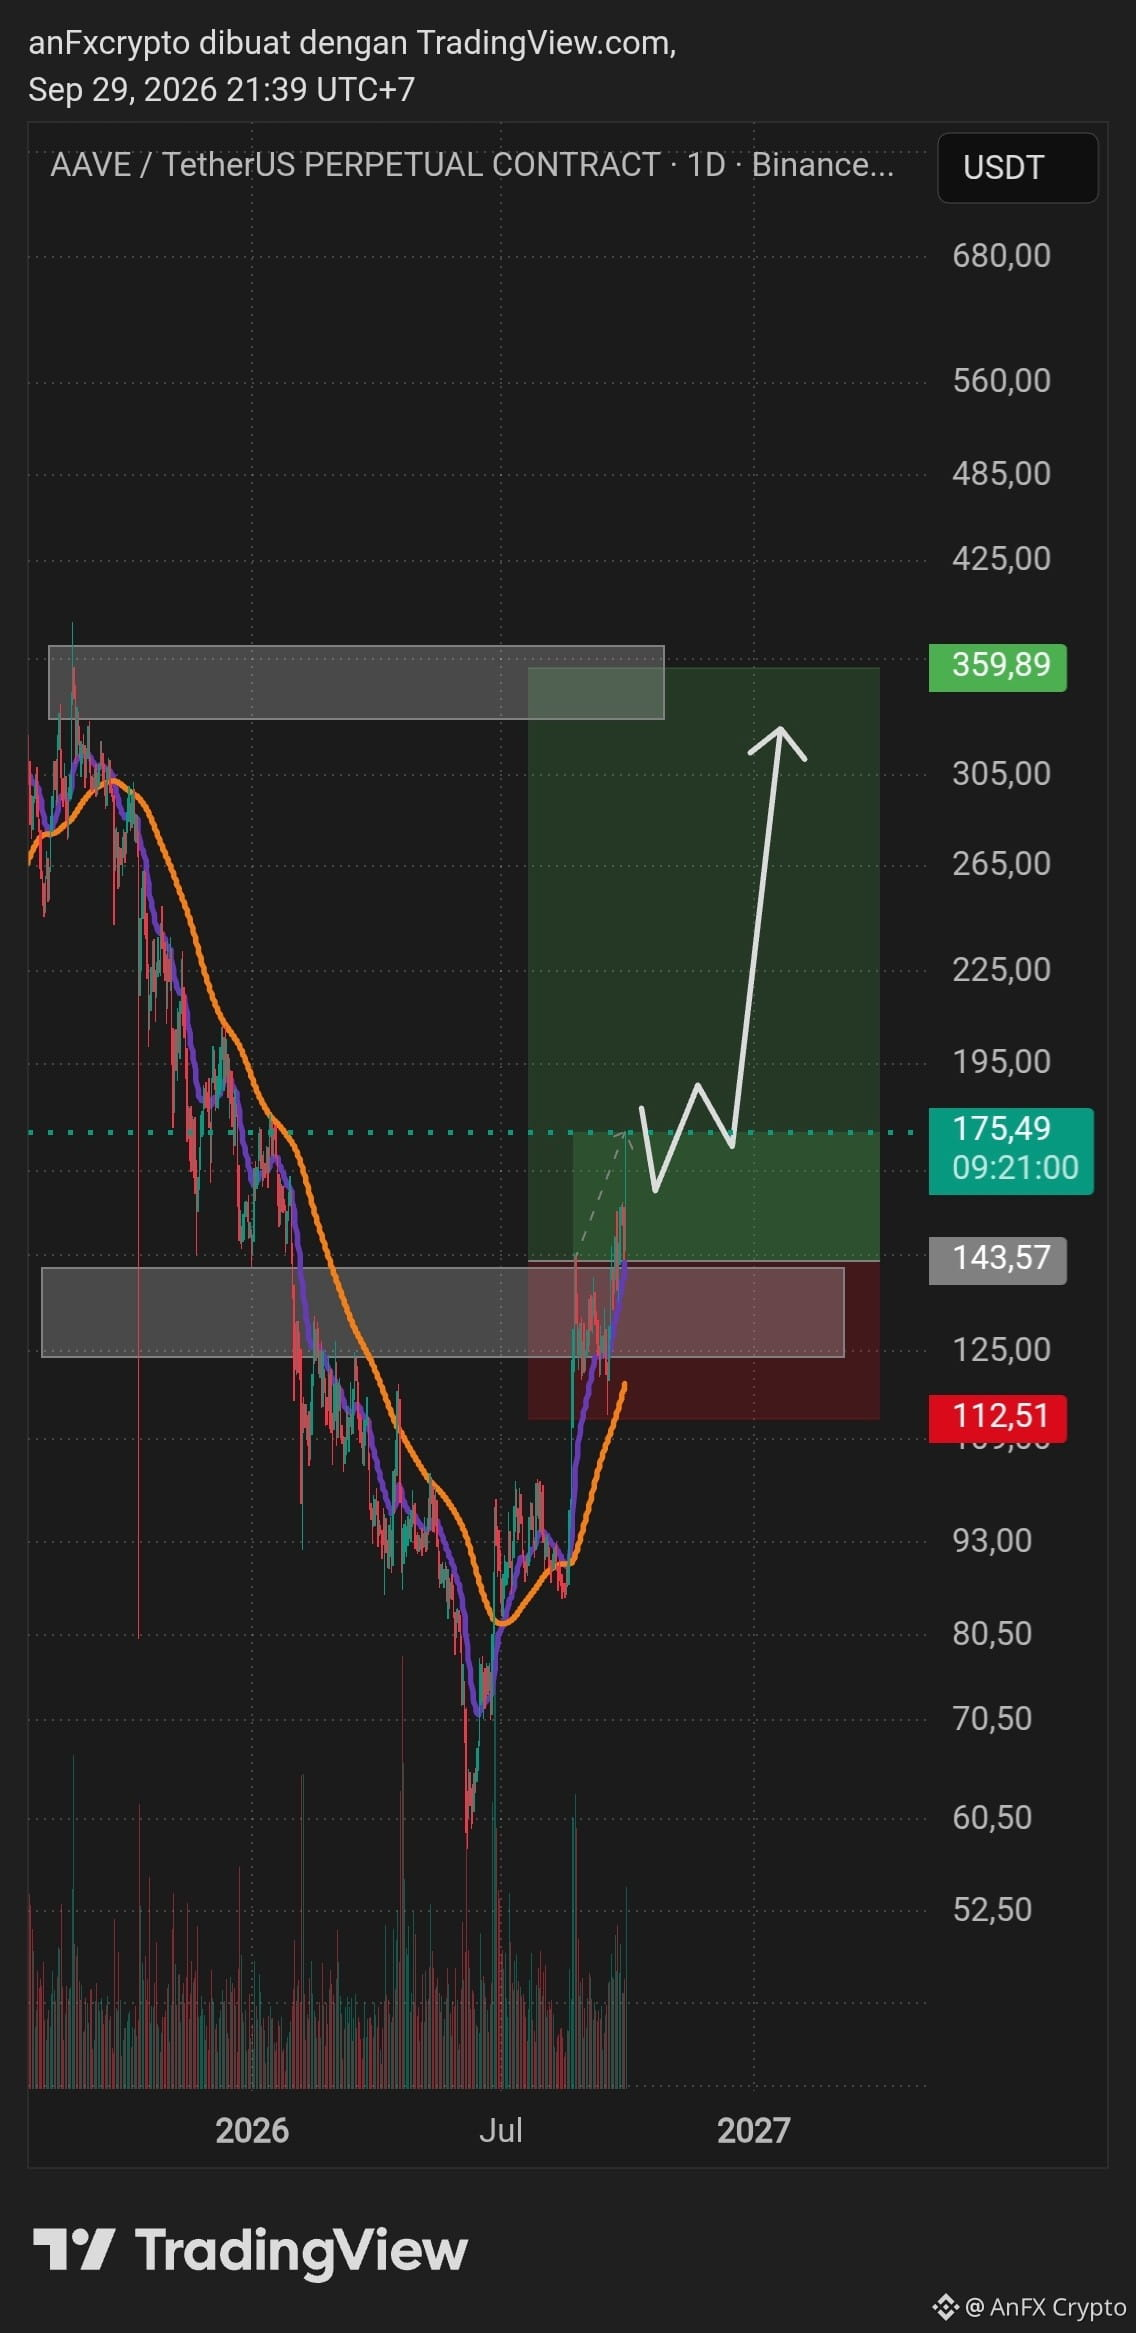
50
Log in to explore more content
Join global crypto users on Binance Square
⚡️ Get latest and useful information about crypto.
💬 Trusted by the world’s largest crypto exchange.
👍 Discover real insights from verified creators.
Email / Phone number
Trending Topics
BinanceLaunchesBinanceIntelligence
439,415 views
3,203 Discussing
#BinanceLaunchesBinanceIntelligence
⚡ AI Meets Crypto Trading: Binance Intelligence is Live! ⚡
Trading just got a massive upgrade with Binance's new AI suite:
1️⃣ Binance AI: Personalized market dashboards & 4-hour macro market audio briefings.
2️⃣ Binance AI Pro: Build and run automated strategies using simple natural language prompts.
3️⃣ Binance Agent OS: Developer framework for autonomous financial AI agents.
Describe your strategy ➔ Paper test ➔ Execute 24/7.
Are you building your next trading strategy with AI? Drop your thoughts below! 👇
#BinanceLaunchesBinanceIntelligence #BinanceSquare #CryptoAI #Trading $EDEN
Hazi BNB
·2 Likes
·974 views
BitcoinTargets2026OpenAt$87570
2,873 views
83 Discussing
BitcoinRejectedAt$87KThirdTime
2,691 views
67 Discussing