

Jack_TheAnalyst
6 Posts

Jack_TheAnalyst
Report
Block User
4 Following
4 Followers
8 Liked
Posts
PINNED
·
--
Bullish
Hello Binance Square!
Jack_TheAnalyst is Here
As a professional content creator focused on delivering clear, unbiased market intelligence.
I’m here to build a community of smart, analytical traders and investors.
Hit the Follow button to stay updated with daily market commentary, structured charts, and real-time breakdowns.
$NVDAB $AAPLB $LSK
{future}(LSKUSDT)
#BinanceWillListHyperliquid(HYPE) #FedOctoberRateHikeOddsRiseTo69.7%
Hello Binance Square!
Jack_TheAnalyst is Here
As a professional content creator focused on delivering clear, unbiased market intelligence.
I’m here to build a community of smart, analytical traders and investors.
Hit the Follow button to stay updated with daily market commentary, structured charts, and real-time breakdowns.
$NVDAB $AAPLB $LSK
#BinanceWillListHyperliquid(HYPE) #FedOctoberRateHikeOddsRiseTo69.7%
Jack_TheAnalyst is Here
As a professional content creator focused on delivering clear, unbiased market intelligence.
I’m here to build a community of smart, analytical traders and investors.
Hit the Follow button to stay updated with daily market commentary, structured charts, and real-time breakdowns.
$NVDAB $AAPLB $LSK
#BinanceWillListHyperliquid(HYPE) #FedOctoberRateHikeOddsRiseTo69.7%
2
151
Article
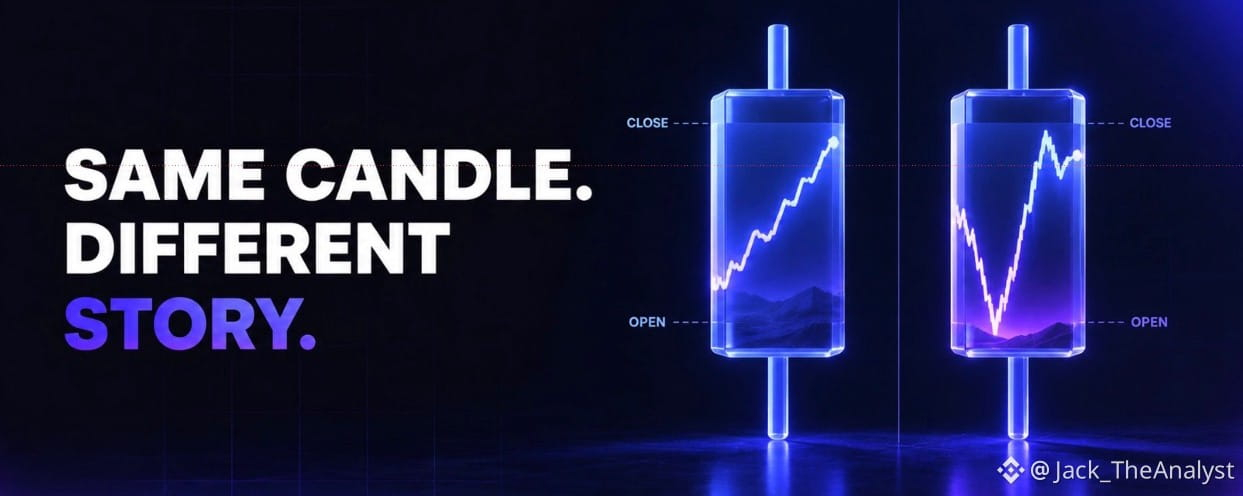
What a Candle Can Hide?Higher-timeframe candles are useful because they compress a large amount of price action into something easy to read. The problem is that two candles with almost identical opens, highs, lows and closes can be created through very different sequences of events.
That sequence can matter when evaluating what actually happened during the session.
Suppose BTC opens at $80,000 and closesat $82,000. In the first scenario, price gradually moves higher throughout the day, pullbacks remain shallow, and most of the final hours are spent near $82,000. Buyers gained ground and were able to maintain it.
Now imagine the same open and close, but BTC first drops to $77,500, aggressively recovers to $83,000 and then falls back to $82,000 before the daily close.
Both sessions finish bullish, but they tell different stories. The second contained a failed move lower, a strong recovery and then selling above the eventual closing price. None of that is fully explained by simply calling the daily candle bullish.
This becomes especially useful around important levels.
Imagine a daily candle closes slightly above resistance. Looking only at the daily chart, it may appear to be a successful breakout. But a lower timeframe might show that price broke resistance early, spent most of the session back below it and only recovered during the final hour.
Compare that with a session that breaks resistance early, retests it from above and spends the remainder of the day building higher. The daily candles could eventually look similar, but the second shows much clearer acceptance above the level.
Lower timeframes can therefore be used as a diagnostic tool rather than simply as another place to search for entries.
When a higher-timeframe candle forms at an important area, look inside it and ask a few basic questions. Which side moved first? Was that move sustained or rejected? Where did price spend most of the session? Did the close confirm the dominant behavior of the day, or did a late move dramatically change the final candle?
You do not need to dissect every daily candle.
Most of the time, the higher timeframe provides enough information on its own.
But around major breakouts, failed moves and turning points, understanding how the candle was built can reveal information that its final shape compresses away.
The candle shows the result.
Sometimes the sequence explains how meaningful that result actually was.
#BTC走势分析 $BTC #PolymarketBankFailureBetsDrawFDICConcern #BlackRockBuildsTokenizedPortfoliosForOndo
{future}(BTCUSDT)
What a Candle Can Hide?
Higher-timeframe candles are useful because they compress a large amount of price action into something easy to read. The problem is that two candles with almost identical opens, highs, lows and closes can be created through very different sequences of events.
That sequence can matter when evaluating what actually happened during the session.
Suppose BTC opens at $80,000 and closesat $82,000. In the first scenario, price gradually moves higher throughout the day, pullbacks remain shallow, and most of the final hours are spent near $82,000. Buyers gained ground and were able to maintain it.
Now imagine the same open and close, but BTC first drops to $77,500, aggressively recovers to $83,000 and then falls back to $82,000 before the daily close.
Both sessions finish bullish, but they tell different stories. The second contained a failed move lower, a strong recovery and then selling above the eventual closing price. None of that is fully explained by simply calling the daily candle bullish.
This becomes especially useful around important levels.
Imagine a daily candle closes slightly above resistance. Looking only at the daily chart, it may appear to be a successful breakout. But a lower timeframe might show that price broke resistance early, spent most of the session back below it and only recovered during the final hour.
Compare that with a session that breaks resistance early, retests it from above and spends the remainder of the day building higher. The daily candles could eventually look similar, but the second shows much clearer acceptance above the level.
Lower timeframes can therefore be used as a diagnostic tool rather than simply as another place to search for entries.
When a higher-timeframe candle forms at an important area, look inside it and ask a few basic questions. Which side moved first? Was that move sustained or rejected? Where did price spend most of the session? Did the close confirm the dominant behavior of the day, or did a late move dramatically change the final candle?
You do not need to dissect every daily candle.
Most of the time, the higher timeframe provides enough information on its own.
But around major breakouts, failed moves and turning points, understanding how the candle was built can reveal information that its final shape compresses away.
The candle shows the result.
Sometimes the sequence explains how meaningful that result actually was.
#BTC走势分析 $BTC #PolymarketBankFailureBetsDrawFDICConcern #BlackRockBuildsTokenizedPortfoliosForOndo
That sequence can matter when evaluating what actually happened during the session.
Suppose BTC opens at $80,000 and closesat $82,000. In the first scenario, price gradually moves higher throughout the day, pullbacks remain shallow, and most of the final hours are spent near $82,000. Buyers gained ground and were able to maintain it.
Now imagine the same open and close, but BTC first drops to $77,500, aggressively recovers to $83,000 and then falls back to $82,000 before the daily close.
Both sessions finish bullish, but they tell different stories. The second contained a failed move lower, a strong recovery and then selling above the eventual closing price. None of that is fully explained by simply calling the daily candle bullish.
This becomes especially useful around important levels.
Imagine a daily candle closes slightly above resistance. Looking only at the daily chart, it may appear to be a successful breakout. But a lower timeframe might show that price broke resistance early, spent most of the session back below it and only recovered during the final hour.
Compare that with a session that breaks resistance early, retests it from above and spends the remainder of the day building higher. The daily candles could eventually look similar, but the second shows much clearer acceptance above the level.
Lower timeframes can therefore be used as a diagnostic tool rather than simply as another place to search for entries.
When a higher-timeframe candle forms at an important area, look inside it and ask a few basic questions. Which side moved first? Was that move sustained or rejected? Where did price spend most of the session? Did the close confirm the dominant behavior of the day, or did a late move dramatically change the final candle?
You do not need to dissect every daily candle.
Most of the time, the higher timeframe provides enough information on its own.
But around major breakouts, failed moves and turning points, understanding how the candle was built can reveal information that its final shape compresses away.
The candle shows the result.
Sometimes the sequence explains how meaningful that result actually was.
#BTC走势分析 $BTC #PolymarketBankFailureBetsDrawFDICConcern #BlackRockBuildsTokenizedPortfoliosForOndo
71
·
--
Bullish
SOL Swing Long Trade
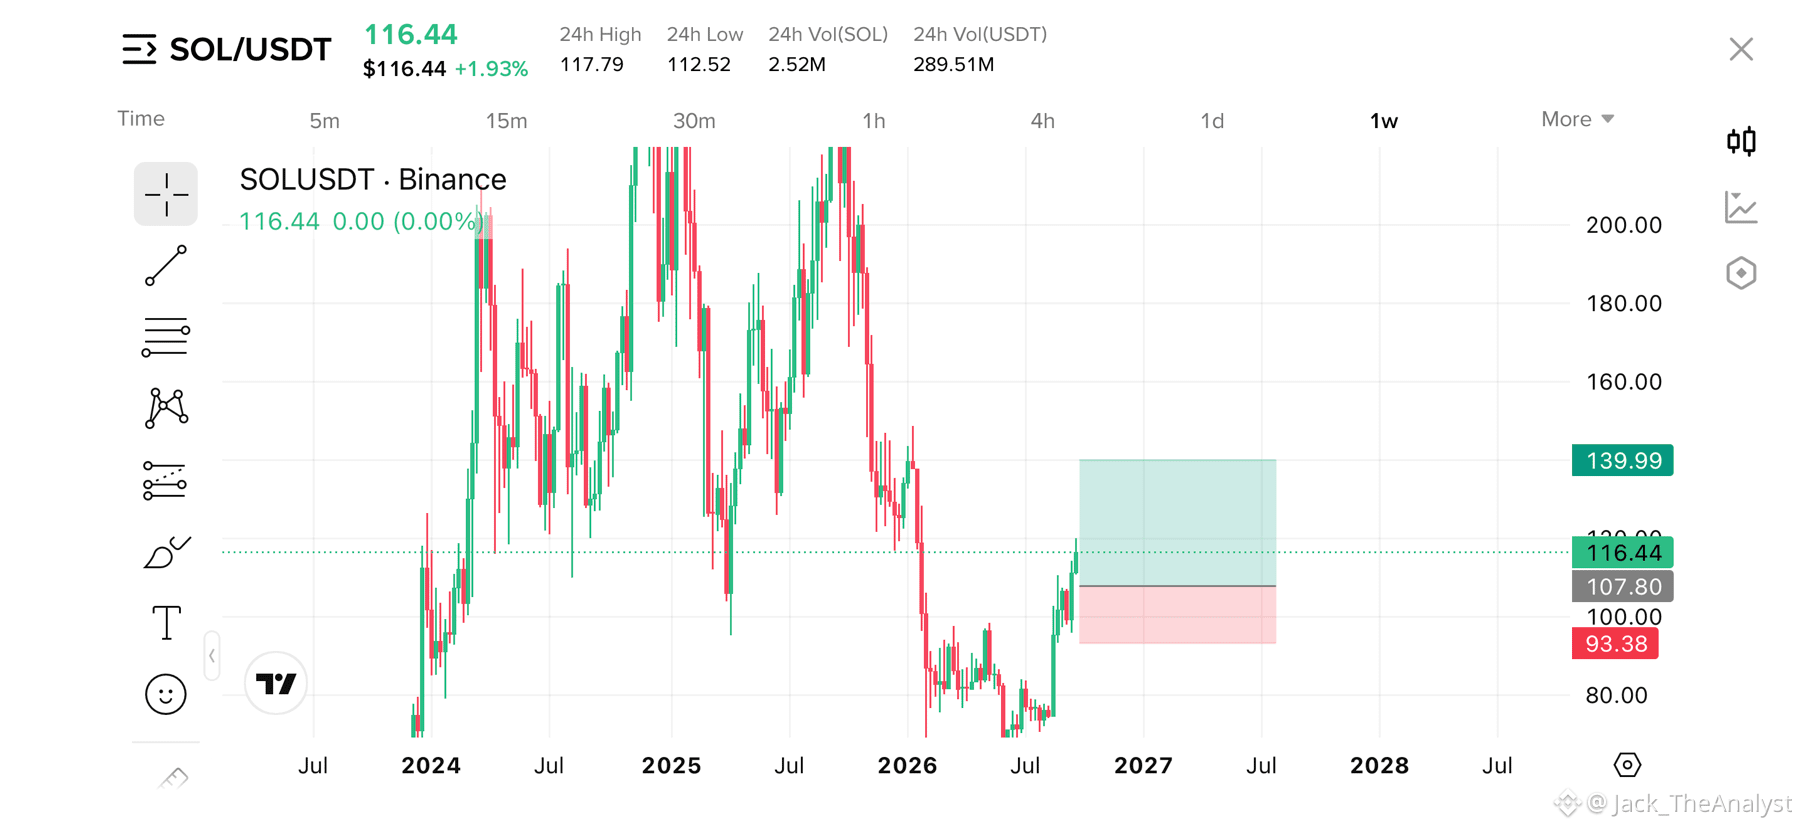
Solana ($SOL) is printing a solid structural setup on the weekly chart, defending key value areas following a prolonged correction phase.
The resistance is broked and weekly candle closed above and retested the level.
(RR): ~1 : 2.24
Entry Level: $107.80
Take Profit (TP): $140.00
Stop Loss (SL): $93.38
Partial can be booked at $140.00 then we can hold the trade till next level till $200.00 for final Take profit.
#solonapumping #sol板块 #SolanaUSTD
$NVDAB $AAPLB $AAPL.US
SOL Swing Long Trade
Solana ($SOL) is printing a solid structural setup on the weekly chart, defending key value areas following a prolonged correction phase.
The resistance is broked and weekly candle closed above and retested the level.
(RR): ~1 : 2.24
Entry Level: $107.80
Take Profit (TP): $140.00
Stop Loss (SL): $93.38
Partial can be booked at $140.00 then we can hold the trade till next level till $200.00 for final Take profit.
#solonapumping #sol板块 #SolanaUSTD
$NVDAB $AAPLB $AAPL.US
Solana ($SOL) is printing a solid structural setup on the weekly chart, defending key value areas following a prolonged correction phase.
The resistance is broked and weekly candle closed above and retested the level.
(RR): ~1 : 2.24
Entry Level: $107.80
Take Profit (TP): $140.00
Stop Loss (SL): $93.38
Partial can be booked at $140.00 then we can hold the trade till next level till $200.00 for final Take profit.
#solonapumping #sol板块 #SolanaUSTD
$NVDAB $AAPLB $AAPL.US
1
78
·
--
Bullish
#dodgecoin DOGE/USDT
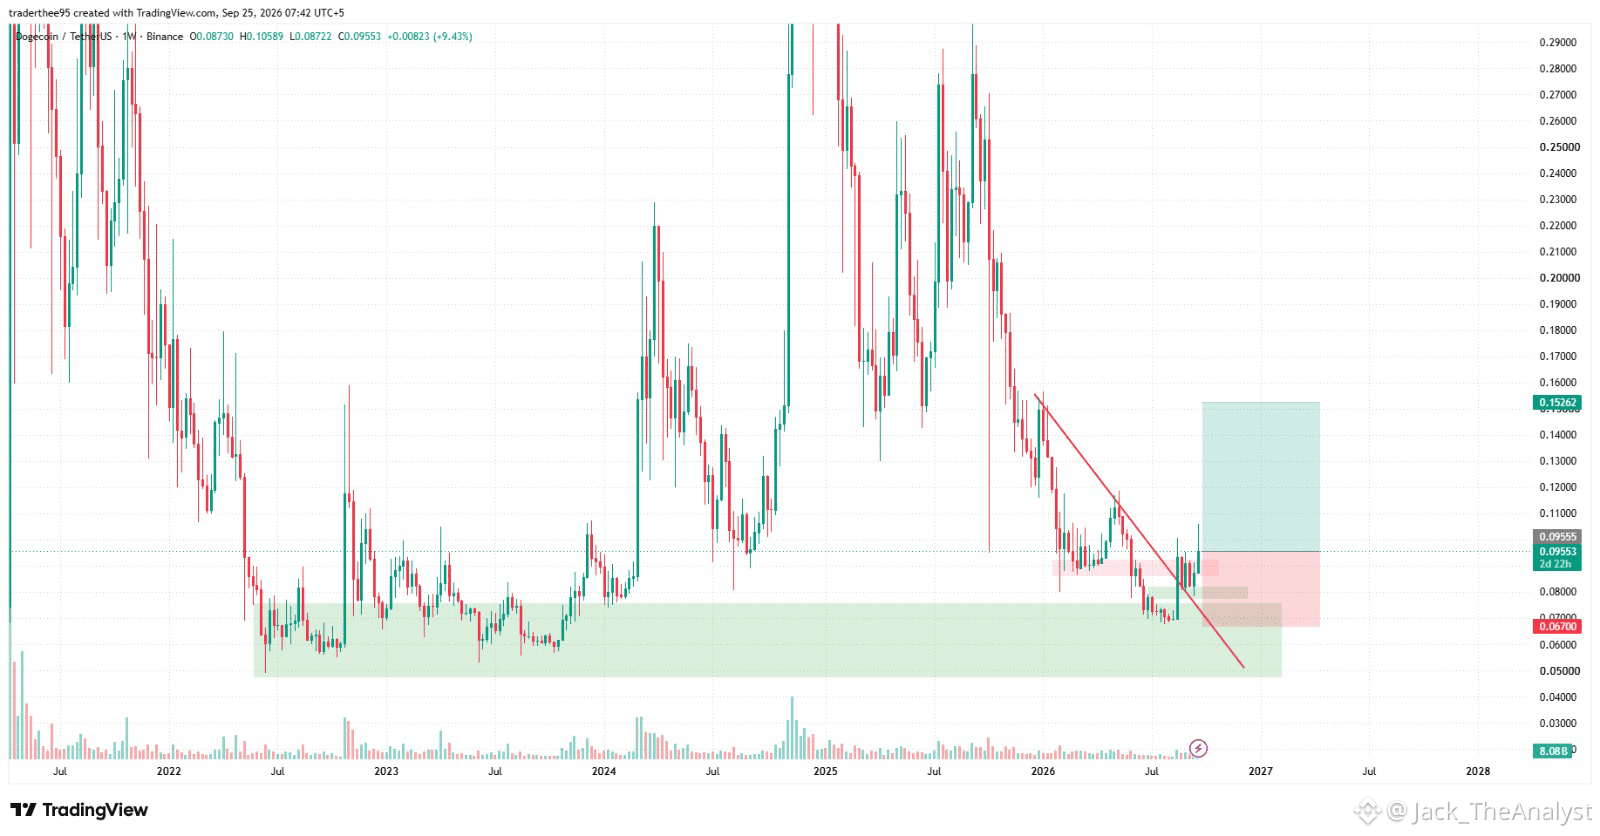
DOGE retested a key macro support zone (ranging from $0.0500 - $0.0700) originating back from early 2021.
Following the bounce from this major support area, price broke through the initial Resistance-turned-Support (RBS) level around $0.08892, coinciding with a clean breakout above the primary descending trendline.
After reclaiming the breakout trendline, DOGE pushed further to break its recent resistance zone, confirming a structural shift toward a strong bullish continuation scenario.
Entry Point: ~$0.09508 (Current market price or minor pullback).
Stop Loss (SL): $0.06700 (Placed safely below the key structural support).
Take Profit (TP): $0.15262 (Primary target at key swing high resistance).
#Dogecoin #doge⚡ #DOGEUSDT
$AAPL.US $AAPLB $GOOGL.US
#dodgecoin DOGE/USDT
DOGE retested a key macro support zone (ranging from $0.0500 - $0.0700) originating back from early 2021.
Following the bounce from this major support area, price broke through the initial Resistance-turned-Support (RBS) level around $0.08892, coinciding with a clean breakout above the primary descending trendline.
After reclaiming the breakout trendline, DOGE pushed further to break its recent resistance zone, confirming a structural shift toward a strong bullish continuation scenario.
Entry Point: ~$0.09508 (Current market price or minor pullback).
Stop Loss (SL): $0.06700 (Placed safely below the key structural support).
Take Profit (TP): $0.15262 (Primary target at key swing high resistance).
#Dogecoin #doge⚡ #DOGEUSDT
$AAPL.US $AAPLB $GOOGL.US
DOGE retested a key macro support zone (ranging from $0.0500 - $0.0700) originating back from early 2021.
Following the bounce from this major support area, price broke through the initial Resistance-turned-Support (RBS) level around $0.08892, coinciding with a clean breakout above the primary descending trendline.
After reclaiming the breakout trendline, DOGE pushed further to break its recent resistance zone, confirming a structural shift toward a strong bullish continuation scenario.
Entry Point: ~$0.09508 (Current market price or minor pullback).
Stop Loss (SL): $0.06700 (Placed safely below the key structural support).
Take Profit (TP): $0.15262 (Primary target at key swing high resistance).
#Dogecoin #doge⚡ #DOGEUSDT
$AAPL.US $AAPLB $GOOGL.US
1
195
·
--
Bullish
#Litecoin Major Multi-Year Accumulation Breakdown & Rebound — Long Setup
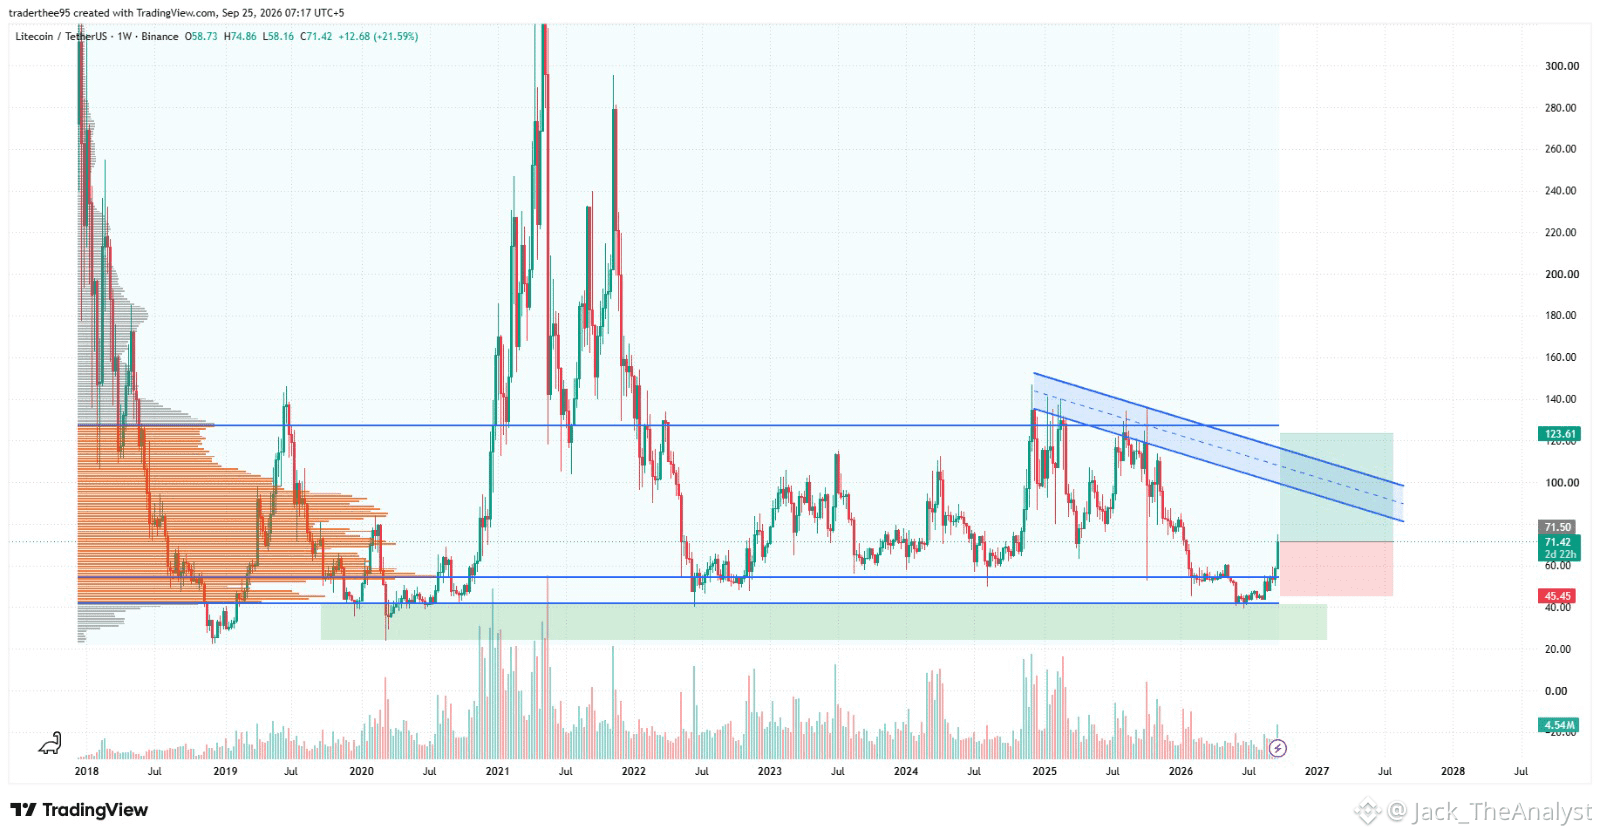
Litecoin price action has recently crossed a key resistance level around $60.47, which is now acting as an important support area. This shift in market structure is worth monitoring because maintaining price above this region could support the possibility that the recent move below the previous range was a deviation rather than a sustained breakdown.
Volume Profile: Solid accumulation build-up at lower levels indicates long-term buyers defending this region.
Entry Zone: Current Market Price (71.04) or on minor pullbacks towards $60.00 - $65.00
Take Profit (TP): $123.60 (Upper Resistance & Channel Target)
Stop Loss (SL): $45.45 (Below key structural support)
#Litecoin #LitecoinUpdate #LitecoinRevolution
$NVDAB $AAPLB $AAPL.US
#Litecoin Major Multi-Year Accumulation Breakdown & Rebound — Long Setup
Litecoin price action has recently crossed a key resistance level around $60.47, which is now acting as an important support area. This shift in market structure is worth monitoring because maintaining price above this region could support the possibility that the recent move below the previous range was a deviation rather than a sustained breakdown.
Volume Profile: Solid accumulation build-up at lower levels indicates long-term buyers defending this region.
Entry Zone: Current Market Price (71.04) or on minor pullbacks towards $60.00 - $65.00
Take Profit (TP): $123.60 (Upper Resistance & Channel Target)
Stop Loss (SL): $45.45 (Below key structural support)
#Litecoin #LitecoinUpdate #LitecoinRevolution
$NVDAB $AAPLB $AAPL.US
Litecoin price action has recently crossed a key resistance level around $60.47, which is now acting as an important support area. This shift in market structure is worth monitoring because maintaining price above this region could support the possibility that the recent move below the previous range was a deviation rather than a sustained breakdown.
Volume Profile: Solid accumulation build-up at lower levels indicates long-term buyers defending this region.
Entry Zone: Current Market Price (71.04) or on minor pullbacks towards $60.00 - $65.00
Take Profit (TP): $123.60 (Upper Resistance & Channel Target)
Stop Loss (SL): $45.45 (Below key structural support)
#Litecoin #LitecoinUpdate #LitecoinRevolution
$NVDAB $AAPLB $AAPL.US
1
135
·
--
Bullish
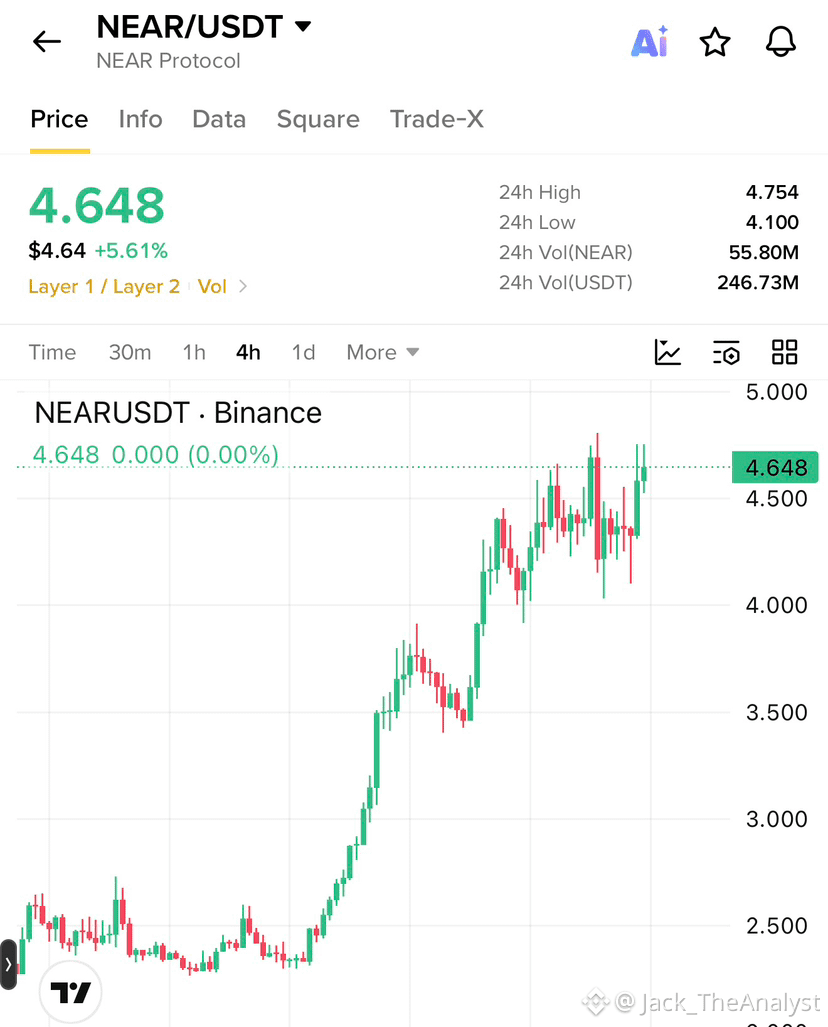
NEAR Protocol ($NEAR) is demonstrating massive bullish momentum on the 4-hour chart breaking out from multi-month consolidation levels to reach $4.65.
For Buys: A confirmed 4-hour candle close above $4.75 opens the path to $5.00, with secondary swing targets at $5.50 and $6.00.
Bearish / Pullback Case: Failure to clear $4.75 may prompt short-term profit-taking down toward the $4.10 – $4.20 support zone before another attempt upward.
#Near #NEARUSDT #NEAR🚀🚀🚀 $NEAR
{spot}(NEARUSDT)
NEAR Protocol ($NEAR ) is demonstrating massive bullish momentum on the 4-hour chart breaking out from multi-month consolidation levels to reach $4.65.
For Buys: A confirmed 4-hour candle close above $4.75 opens the path to $5.00, with secondary swing targets at $5.50 and $6.00.
Bearish / Pullback Case: Failure to clear $4.75 may prompt short-term profit-taking down toward the $4.10 – $4.20 support zone before another attempt upward.
#Near #NEARUSDT #NEAR🚀🚀🚀 $NEAR
For Buys: A confirmed 4-hour candle close above $4.75 opens the path to $5.00, with secondary swing targets at $5.50 and $6.00.
Bearish / Pullback Case: Failure to clear $4.75 may prompt short-term profit-taking down toward the $4.10 – $4.20 support zone before another attempt upward.
#Near #NEARUSDT #NEAR🚀🚀🚀 $NEAR
3
717
Log in to explore more content
Join global crypto users on Binance Square
⚡️ Get latest and useful information about crypto.
💬 Trusted by the world’s largest crypto exchange.
👍 Discover real insights from verified creators.
Email / Phone number
Trending Topics
CircleMints500MUSDCOnSolana
4,233 views
274 Discussing
💰 MASSIVE: Circle Mints $500M $USDC on Solana!
Circle just minted 500 Million $USDC on Solana in 2 transactions ($250M + $250M) on Sept 25, in just 5.5 hours! 🚀
Solana now holds $7.48B+ $USDC dominance - over 50% of its $14.7B stablecoin supply.
Why Solana?
⚡️ Speed: 65k TPS
💸 Low Fees: $0.00025
🔥 DeFi Hub: Jupiter, Raydium pumping
This is one of the largest single-day mints & signals HUGE institutional demand for Solana ecosystem.
Bullish for $SOL? 👇
#Circle #USDC #Solana #Stablecoin #DeFi#circlemints500musdconsolana
True News
·8 Likes
·3.6k views
PolymarketBankFailureBetsDrawFDICConcern
17,350 views
506 Discussing
BlackRockBuildsTokenizedPortfoliosForOndo
13,281 views
348 Discussing