
Introduction
Bollinger Bands is a popular technical analysis tool that was developed by John Bollinger in the 1980s. It is used to analyze price volatility and identify potential overbought or oversold conditions in financial markets. Bollinger Bands consist of three lines plotted on a price chart, which dynamically adapt to market conditions. Traders use Bollinger Bands to gain insights into price movements and make informed trading decisions. In this article, we will explore the concept of Bollinger Bands, how to interpret them, and their significance in technical analysis.
1. What are Bollinger Bands?
Bollinger Bands consist of three lines plotted on a price chart:
The middle line is the Simple Moving Average (SMA) of the asset's price over a specific period (commonly 20 periods).
The upper band is the SMA plus a certain number of standard deviations of the price (commonly 2 standard deviations).
The lower band is the SMA minus the same number of standard deviations.
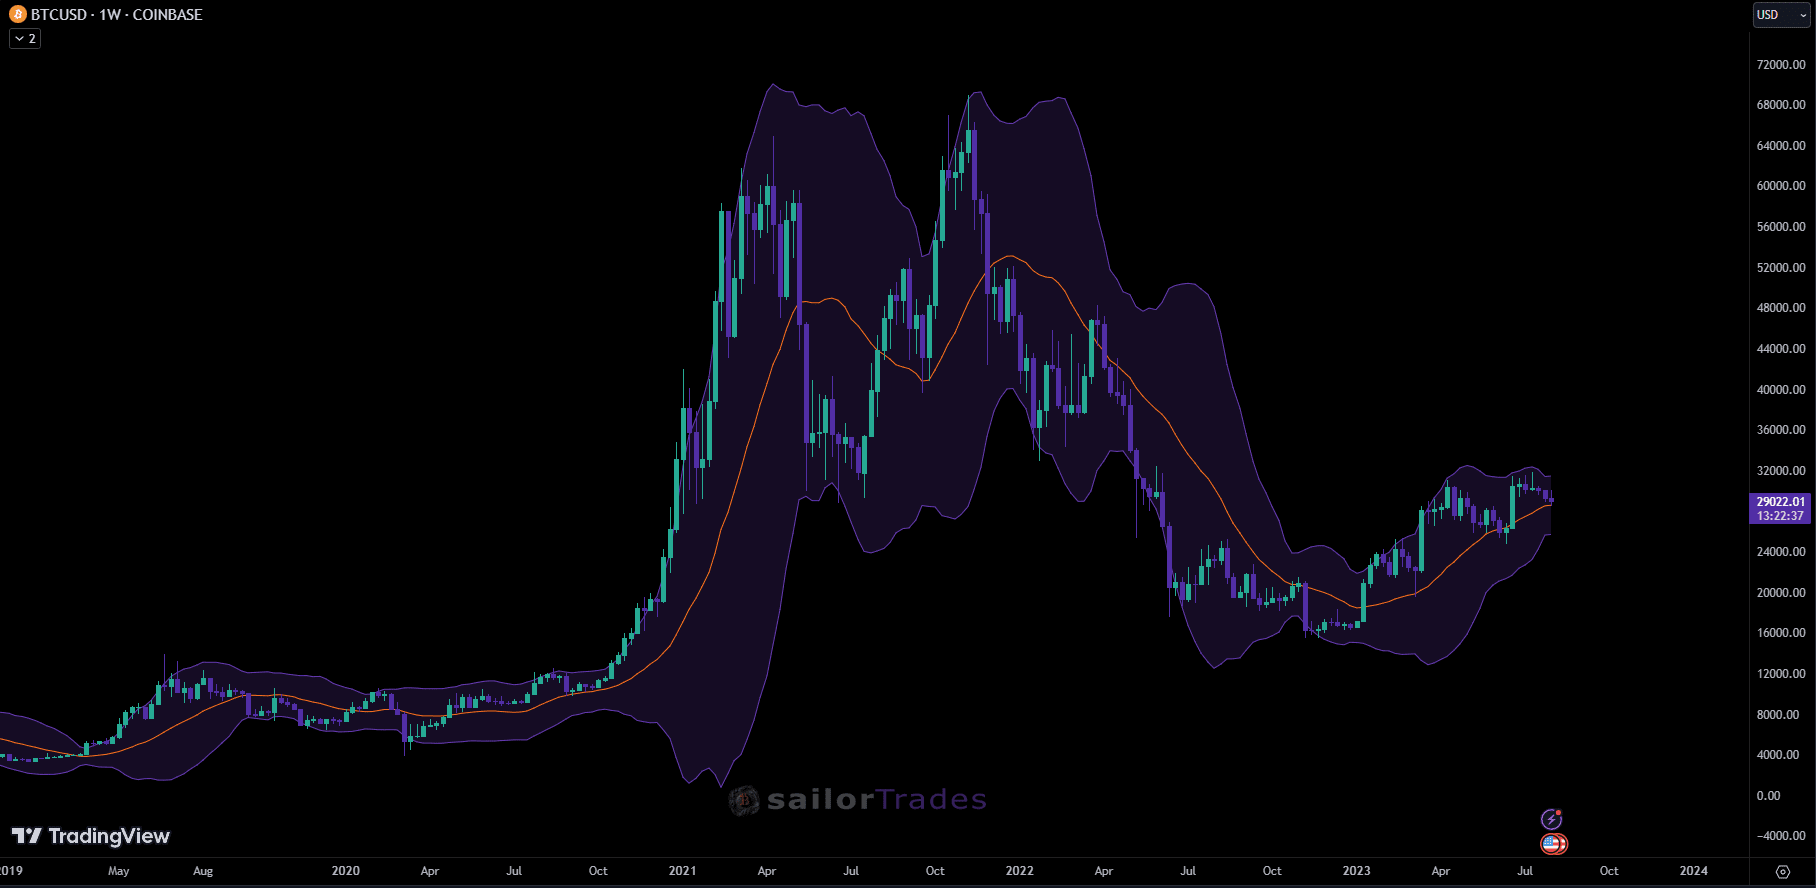
2. Volatility and Width of Bollinger Bands
Bollinger Bands dynamically adjust to market conditions, which means they expand or contract depending on the asset's price volatility. In periods of high volatility, the bands widen, while in periods of low volatility, the bands narrow. This property makes Bollinger Bands useful for assessing the market's relative volatility.
3. Identifying Overbought and Oversold Conditions
Bollinger Bands can be used to identify potential overbought and oversold conditions in the market. When the price moves close to the upper band, it may be considered overbought, suggesting that the asset's price might be due for a correction. Conversely, when the price approaches the lower band, it may be considered oversold, indicating a potential upward price reversal.
4. Bollinger Squeeze
The Bollinger Squeeze is a phenomenon that occurs when the bands contract significantly. It suggests a period of low volatility and is often followed by a substantial price move. Traders use the Bollinger Squeeze to anticipate potential breakout or trend reversal opportunities.
5. Trading Strategies with Bollinger Bands
Bollinger Bands can be used in various trading strategies, including:
Bollinger Bounce: Traders look for the price to touch or move close to the lower band and then bounce back up, using it as a support level. Conversely, they can look for the price to touch or move close to the upper band and then bounce back down, using it as a resistance level.
Bollinger Breakout: Traders watch for a Bollinger Squeeze, which indicates low volatility, and anticipate a breakout when the price moves significantly beyond one of the bands.
6. Limitations of Bollinger Bands
While Bollinger Bands are a useful tool, they are not foolproof and have certain limitations. Markets can remain in overbought or oversold conditions for extended periods, leading to potential false signals. Traders should use Bollinger Bands in conjunction with other technical indicators and analysis methods for confirmation.
Conclusion
Bollinger Bands are a versatile and widely used technical analysis tool that provides valuable insights into price volatility and potential market reversals. Traders and investors can use Bollinger Bands to identify overbought or oversold conditions, spot potential breakouts, and make informed trading decisions. However, as with any technical analysis tool, it should be used in combination with other indicators and analysis methods to increase the probability of successful trading outcomes. Understanding Bollinger Bands and their dynamic relationship with price movements can empower traders to navigate financial markets with greater confidence and accuracy.
Trading in futures and cryptocurrencies involves considerable risk. Always consider these risks before starting to trade.