
Summary
Despite Bitcoin temporarily hitting a yearly high of $31,700, the market remains stable, with the price range of the Bollinger Bands (BOLL indicator, which measures the volatility of Bitcoin prices) currently only differing by 4.2%.
Bitcoin's "realized market value" hovers just below $400 billion, and capital is slowly flowing into the crypto market, driven mainly by two mainstream assets, BTC and ETH.
Overall, the Bitcoin market is in a profitable state, but the total realized value is at a cycle low, indicating that holders are still reluctant to sell their Bitcoin.
Some of the indicators in the current market are similar to those of the extremely volatile 2016 and 2019-2020 cycles.
Capital is flowing into the Bitcoin market
Although Bitcoin temporarily hit a yearly high of $31,700, its gains could not be sustained and the price of Bitcoin returned to sideways above $30,000.
The current volatility of the Bitcoin market is still very small, with the upper and lower ranges of the "Bollinger Bands" of Bitcoin prices differing by only 4.2%. It can be said that this is the most stable Bitcoin market since early January this year.

Capital is still flowing into the crypto market at a steady and slow pace. "Realized market value" is one of the most commonly used on-chain indicators that can be used to observe the real capital flowing into the Bitcoin market. It is considered the "on-chain market value" and reflects the cumulative sum of all previous realized gains and losses.
Bitcoin’s “realized market cap” is currently just under $400 billion and growing, indicating that Bitcoin is trading at higher prices and demand for Bitcoin is increasing.

Usually during a bear market, a large amount of capital will flow out of the Bitcoin market. In 2022, Bitcoin's "realized market value" fell by 18.8%, which shows how weak the bear market was last year. In previous cycles, it took 239, 193, and 95 days for "realized market value" to recover from the low point to the historical high (ATH), respectively, and it has been 188 days since the current low point in 2022.

Next we analyze the NRPL indicator (the difference between realized profits and losses), which is a derivative indicator of realized market value.
For most of this year, the NRPL indicator was greater than 0 (that is, most of the Bitcoin traded was profitable), with a daily net inflow (profit minus losses) of about $270 million. This is the first time since April 2022 that it has entered a sustained profitable state, similar to the first half of 2019 and the end of 2020.
However, 270 million is nothing compared to the bull market in 2021. After all, the average daily net inflow in the bull market in 2021 exceeded 3.68 billion US dollars.

We can see that the realized profit-loss ratio has maintained a stable upward trend since 2023, steadily breaking through the break-even level of 1.0 in early January.
This week, the ratio reached a new, less dramatic high, suggesting that capital inflows are actually slowing. If sustained at this high, market volatility similar to that seen in 2019-2020 and the second half of 2021 could occur.

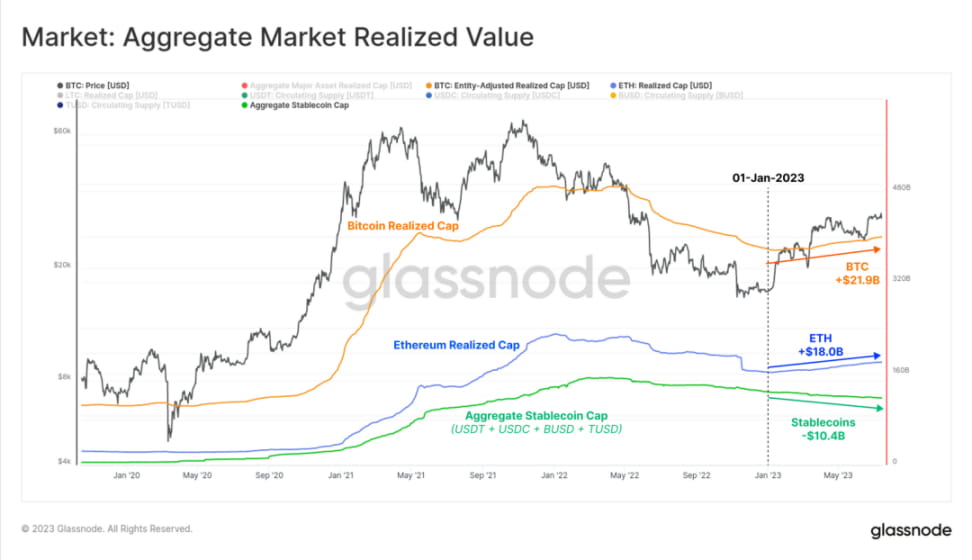
We can also estimate the trend of the entire crypto market by comparing the "realized market value" of BTC and ETH with the supply of major stablecoins. Using this metric, we see that most capital has flowed in through the two major crypto assets BTC and ETH, with inflows of $21.9 billion and $18 billion respectively since the beginning of the year.
The total supply of stablecoins decreased by a net of $10.4 billion, mainly due to the redemption of USDC and BUSD. The above analysis shows that the market has a clear preference for the two major crypto assets.
Bitcoin Market in a Profitable State
SOPR (cost-to-profit ratio) is also a useful indicator that can be used to track the size of the profit and loss of the entire market. We usually use this indicator to judge the market status:
Loss Dominant State: A SOPR sustained below 1.0 indicates that investors are stuck in losses and will typically sell at the breakeven point (creating price resistance).
Profit-led state: SOPR consistently above 1.0 indicates that investors are profitable, and the breakeven level is often considered a short-term value point (forming price support).
Currently, the SOPR indicator is 1.06, which is in a profit-dominated state, indicating that Bitcoin transactions have achieved an average profit of 6%. This again has similar characteristics to the periods of 2016 and 2019.

With this in mind, we found that short-term holders (STHs, or investors who have been actively trading since early February) are the main group active in the market by looking at the inflows of Bitcoin into exchanges. Of the 39,600 BTC inflows into exchanges per day, 78% are associated with short-term holders.

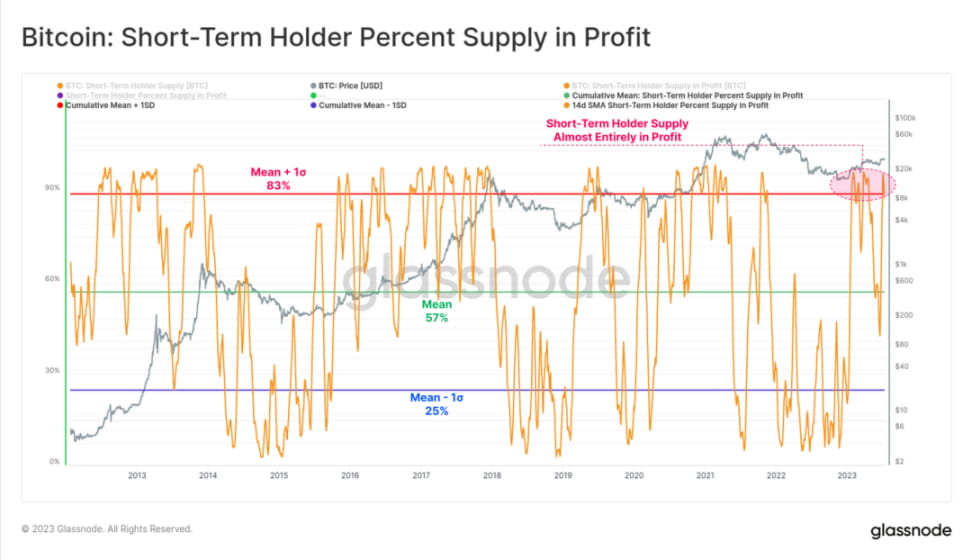
When we look at the percentage of STH holdings in profitable Bitcoin, we understand why STH is the main group active in the market - currently over 88%. In historical cycles, this percentage is associated with macro uptrends, so Bitcoin prices may continue to rise.
As the price rises, the STH group becomes increasingly likely to sell their Bitcoin holdings at a profit.
Relatively speaking, the proportion of Bitcoin held by long-term holders (LTH) in a profitable state is not that high, about a little over 73%. This means that about a quarter of the Bitcoin held by LTH was acquired at a price above $30,000 during the 2021-2022 cycle.

Currently in the Bitcoin market, the vast majority of Bitcoins held by LTH and STH (at least 73%) remain profitable. From this we can see the strength of the market recovery since 2023.
The current Bitcoin market is a marked improvement compared to the market weakness experienced after the FTX debacle, where 90% of all Bitcoin trades were at a loss (the worst sell-off ever experienced).

The market’s total realized value (profit plus loss) remains near cycle lows at just $290 million per day. While that seems like a high amount, it’s still not comparable to October 2019 and 2020, when Bitcoin was 50% lower than it is now.
This suggests that despite the current market value of Bitcoin being roughly double its original value, holders with higher levels of profits and losses are unwilling to trade their Bitcoin.

Overall, the vast majority of Bitcoin holders are holding onto their Bitcoins and not adding to them. The percentage of BTC floating in the market is still very small.
Short-term holders dominate
It is not common for LTH to be bought above STH in general. However, such events have occurred in previous cycles and have been associated with sell-offs during deep bear markets. During these periods, even experienced buyers will sell Bitcoin and exit the market, especially those who bought near the top of the cycle and have been through the entire downtrend.
With Bitcoin’s strong performance so far in 2023 and STH’s dominance strengthening, the SOPR ratio has begun its second decline, providing us with a macro perspective of a reversal in investor behavior. There was a rebound in the indicator in March 2020, which first rose above 1.0, and then remained below 1.0 for the next two years.

Summary and Conclusion
Despite a temporary yearly high of $31,700, Bitcoin remains confined to a narrow price range. The Bollinger Bands are extremely tight, with only a 4.2% difference between the upper and lower price ranges, low volatility and low realized value.
Currently, short-term holders dominate inflows to trading platforms, with more than 88% of Bitcoin in profit. However, from a macro perspective, investors seem very reluctant to sell their Bitcoin. Multiple indicators are similar to the 2016 and 2019-2020 cycles, both of which were extremely volatile.