
What is a transaction?
Transaction is a basic concept in economics involving the sale and purchase of assets. The object of the transaction can be goods or services, and the buyer needs to pay the seller. In some cases, transactions may also include the exchange of goods and services.
In financial markets, assets that are traded are called financial instruments. There are many types of financial instruments, including stocks, bonds, currency pairs in the foreign exchange market, options, futures, margin products, digital currencies, etc. If you're not familiar with these terms, there's no need to worry. We will go into details in this article.
Typically, the term trading refers to short-term trading, where traders actively enter and exit the market within a relatively short period of time. But this definition is somewhat misleading. In fact, trading can have many different strategies, such as day trading, swing trading, trend trading, etc. We will introduce these in detail below.
What is investment?
Investment is the allocation of resources (such as capital) with the expectation of earning a certain profit. This can take the form of using funds to finance and operate a business, or purchasing land and reselling it at a higher price after it appreciates in value. In financial markets, it often involves investing in a financial instrument with the intention of selling it at a higher price at a later date.
Expected rate of return is a core concept in investing (also known as ROI). As opposed to trading, investing typically takes a long-term approach to wealth accumulation. The goal of investors is to build wealth over a long period of time (years or even decades). There are many ways to achieve your goals, but investors often look for potential investment opportunities based on some fundamental factors.
Long-term investment determines that investors generally do not worry about short-term price fluctuations. They will maintain a relatively passive mentality and rarely worry about short-term losses.
What are the differences between trading and investing?
Traders and investors alike want to make profits in the financial markets. But their methods of achieving this are very different.
In general, investors expect returns over a longer period of time, spanning years or even decades. Due to the larger time span, investors have correspondingly higher return targets for various investments.
Instead, traders actively take advantage of market volatility to make profits: they move in and out of the market more frequently, often making multiple trades at the same time that yield relatively small returns.
So which one is better and which one is more suitable for you? It's up to you to decide. You can start by understanding the market and learn by doing. Over time, you'll get a better idea of which method is more suitable for your financial goals, personal needs, and trading situation.
Find out now about the latest price of Bitcoin (BTC).
What is fundamental analysis (FA)?
Fundamental analysis is a method of assessing the value of financial assets. Fundamental analysis looks at both economic and financial factors to determine whether current asset prices are reasonable. The assessment content includes considering the overall economic performance, industry conditions or asset-related business conditions (if any) from a macroeconomic perspective. These data are often tracked through leading and lagging indicators in macroeconomics.
After completing fundamental analysis, the goal of the analysis changes to determining whether the asset is undervalued or overvalued, providing the necessary reference for investors to make decisions.
For digital currencies, fundamental analysis may also involve the emerging field of data science, based on on-chain metrics in public blockchains. These metrics include network hash rate, holder ranking, number of addresses, transaction analysis, and more. Leveraging the vast amounts of data provided by public blockchains, analysts can create sophisticated technical indicators that measure the overall health of the network.
Although fundamental analysis is widely used in the stock or foreign exchange markets, it is not necessarily suitable for digital currencies in their current state. This asset is an emerging category and a comprehensive standardized framework for assessing its market value has not yet been established. What's more, most markets are influenced by speculative trading and public opinion. Therefore, fundamental factors often have a negligible impact on digital currency prices. However, as the market matures, more precise methods of assessing the value of digital currency assets may emerge.
What is Technical Analysis (TA)?
Technical analysts take a different approach. The core idea of technical analysis is that the future trend of the market can be predicted through historical price trends.
Technical analysts do not determine the intrinsic value of an asset. Instead, they look at historical trading activity as a basis for identifying trading opportunities. This includes analyzing price action and volume, chart patterns, the application of technical indicators, and many other charting tools to assess the strength of a given market state.
Therefore, technical analysis is not only a tool for predicting the probability of future price movements, but also a practical framework for performing risk management. Technical analysis provides a market structure analysis model that improves clarity and measurability in trade management. In this case, measuring risk is the first step to managing it. Therefore, some technical analysts would not be considered traders in the strict sense of the word. They may use technical analysis purely as a risk management framework.
The practice of technical analysis can be applied to all financial markets and is also favored by many digital currency traders. However, does technical analysis really work? As mentioned earlier, the valuation of digital currency markets is largely driven by speculation. Cryptocurrencies have therefore become fertile ground for technical analysts, as they can produce excellent answers simply by considering technical factors.
Which one is better, fundamental analysis or technical analysis?
It all depends on which trading strategy you adopt. In fact, you can definitely use both. Most market analysis methods are most effective when combined with other methods and indicators, and the probability of finding more reliable investment opportunities is greatly increased. Using a combination of different trading strategies can also help you eliminate mistakes from your decision-making process.
This idea is sometimes called convergence. Fusion traders organically combine multiple strategies to give full play to the advantages of all strategies. The idea behind this is that the trading opportunities created by the combined strategy may be better than the continuous execution of a certain strategy.
Want to start your cryptocurrency journey? Buy Bitcoin on Binance today!
What are the drivers of financial markets?
The price of an asset is determined by the balance of supply and demand. In other words, the price is determined by both buyers and sellers. If there is supply and demand, there is a market. So what other factors affect the value of financial assets?
As mentioned in the previous discussion, we need to focus on fundamental factors such as the state of the economy. Technical factors such as the market value of digital currencies also deserve attention. Additional factors such as market sentiment or recent news cannot be ignored.
However, these factors are only for consideration. What really determines the price of an asset at a certain moment is the balance of supply and demand.
What are market trends?
Market trends refer to the general movement of asset prices. Price action, trend lines, and even key moving averages are often used in technical analysis to determine market trends.
Market trends are generally divided into two main types: bull markets and bear markets. A bull market is a continuous upward trend in which prices continue to rise. A bear market is a continuous downward trend in which prices continue to fall. Additionally, we can identify "consolidating" or "consolidating" markets, where the price direction is unclear.

Bitcoin has been in a bull run since its inception.
It is worth noting that market trends do not mean that prices always develop in the direction of the trend. Long-term bull markets also lurk within small-scale bear trends, and vice versa. Such is the nature of market trends. It's about the perspective from which you look at the problem, and it all depends on how long the time span you're looking at is. Long-term market trends are always more meaningful than short-term trends.
The special thing about market trends is that they are difficult to predict, and we often only have the benefit of hindsight. You may have heard of "hindsight bias," which refers to people's tendency to believe they have accurately predicted an event before it occurs. As hypothesized, hindsight bias can have a significant impact on identifying market trends and making trading decisions.
What is a market cycle?
You may have heard the saying before that “markets move in cycles.” A cycle refers to a pattern or trend that occurs over time, with market cycles on longer time frames being more reliable than those on shorter time frames. Even so, you can find small market cycles even by looking at hourly charts, just as you can by looking at decades-long data.
Markets are cyclical in nature. Cyclical changes can cause some asset classes to outperform others. In other market segments under the same market cycle, the performance of these asset classes may not be as good as that of other asset classes due to different market conditions.
It’s worth noting that it’s almost impossible to decide where we are in the market cycle at any given time. It is only after a period of time in the cycle has elapsed that the analysis carried out is likely to be highly accurate. Market cycles rarely have specific starting points and ending points. It turns out that "living in the moment" is a highly biased view in financial markets.
To learn more about market cycles, read "The Psychology of Market Cycles."
Chapter 2 – Financial Markets and Trading Instruments
Table of contents
What are financial instruments?
What is the spot market?
What is margin trading?
What is a derivatives market?
What are forward and futures contracts?
What is a perpetual futures contract?
What is an options contract?
What is the foreign exchange (Forex) market?
What are leveraged tokens?
What are financial instruments?
Simply put, a financial instrument is a tradable asset. Typical examples include cash, precious metals (gold or silver), documentation of ownership (such as ownership of a business or resource), and rights to deliver or receive cash. Financial instruments are indeed very complex, but they all share a basic idea: no matter what they are or what they represent, all financial instruments can be traded.
Financial instruments can be divided into various types according to different classification methods. One classification method is to look at whether the financial instrument is a cash instrument or a derivative instrument. As the name suggests, derivatives derive their value from other financial assets (such as cryptocurrencies). Financial instruments can also be classified as either debt instruments or equity instruments.
So, which category does digital currency fall into? We can look at digital currencies from a variety of perspectives without classifying them as a specific type. They are all digital assets, which is the simplest way to classify them. But the potential of digital currencies is based on creating a completely new financial and economic system.
In this sense, digital currency constitutes a completely new class of digital assets. As the ecosystem continues to evolve, other new asset classes will continue to emerge in the future. Corresponding early examples are already emerging in the field of decentralized finance (DeFi).
What is the spot market?
The spot market is a platform for "instant delivery" of financial instruments. In this market, "delivery" means the exchange of a financial instrument for cash. This distinction may seem trivial, but some markets do not settle immediately in cash. For example, in the futures market, assets are delivered at a later date (the expiry date of the futures contract).
Simply put, the spot market can be thought of as a place where transactions are completed “immediately”. Because trades settle immediately, the current market price of an asset is often called the spot price.
What does this mean for the digital currency market? How can I operate in the Binance spot market? Traders can exchange various currencies with each other. To exchange Binance Coin (BNB) for Binance Stablecoin (BUSD), go to the BNB/BUSD spot market and trade! Similarly, if you need to exchange Binance Coin (BNB) for Bitcoin (BTC), you can go to the BNB/BTC spot market. After the order is completed, the currency exchange can be completed. This is one of the easiest ways to trade digital currencies.
What is margin trading?
Margin trading uses third-party funds to conduct transactions. Whether it is a profit or a loss, this trading method will amplify the results. A margin account increases a trader's access to funds while reducing counterparty risk. Why is this? This is because traders can deposit less money on a digital currency trading platform while trading the same position size.
In margin trading, you will often hear the terms margin and leverage. Margin is the total amount of money you invest (i.e. personal investment), and leverage refers to how many times you magnify the margin amount. For example, setting the leverage to 2x means opening a position that is twice the margin. If 4x leverage is used, the position opened is four times the margin, and so on.
However, one must always be wary of forced liquidations. The higher the leverage selected, the closer the liquidation price will be to the entry price. If you are liquidated, you risk losing all your margin. Therefore, before you start trading, you must understand the huge risks associated with margin trading. Please read the "Binance Margin Trading Guide" carefully to obtain necessary analysis and guidance.
Margin trading is widely used in stocks, commodities, foreign exchange transactions, and digital currency markets such as Bitcoin. Under the traditional model, borrowed funds are provided by investment brokers. In the field of digital currency, the source of funds is usually the trading platform, which earns funding fees in return for borrowing money. In some cases, borrowed funds may be provided directly by other traders on the same platform. Interest rates are determined by the open market, so variable rates (funding charges) are often expected.
At this point, we have briefly covered margin trading, but there are still many concepts to learn. For more information, please read "What is Margin Trading?" 》.
What is a derivatives market?
Derivatives are financial instruments that base their value on something else, including an underlying asset or portfolio of assets. The most common types are stocks, bonds, commodities, market indexes or digital currencies, etc.
The essence of derivatives is a contract entered into by multiple parties, which obtains a price from an underlying asset as a benchmark. No matter what asset is used as the base point, the core concept of derivatives is always to derive value from the asset. Common examples of derivatives include futures contracts, options contracts, and swaps.
Statistics show that the derivatives market is one of the largest financial markets. Why is this? Derivatives appear in almost all financial products. Derivatives themselves can also generate new derivatives, and these "newborns" will continue to create more derivatives. Does this sound like a crumbling house of cards? That may be the case: some believe that derivatives markets played an important role in enabling the 2008 financial crisis.
What are forward and futures contracts?
Futures contracts are derivatives that allow traders to speculate on the future price of an asset. It involves an agreement made between parties that settlement of the transaction will occur on the maturity date. As discussed in the derivatives chapter, any asset can serve as the underlying asset for such a contract. Common examples include digital currencies, commodities, stocks, and bonds.
The expiration date of a futures contract is the last day on which the contract undergoes trading activity. The contract expires at the end of the day and will be delivered at the final transaction price. Settlement of the contract is predetermined and can be either cash settlement or physical delivery.
When physical delivery occurs, the underlying assets of the contract are exchanged directly. For example, transporting a barrel of oil. When settling in cash, the underlying assets are not exchanged directly, only their corresponding value is exchanged in the form of cash or digital currency.
If you want to trade futures on Binance, please read the "Ultimate Guide to Binance Futures Trading" carefully.
What is a perpetual futures contract?
Futures products are an excellent way for traders to predict asset prices. But what if they want to keep their position past the expiry date?
Perpetual futures contracts meet their needs. Compared with regular futures contracts, the main feature of this type of contract is that it never expires. In this way, traders can continue to speculate based on the price of the underlying asset without worrying about contract expiration.
However, this itself presents another problem: What if the price of the perpetual futures contract is far away from the price of the underlying asset? Because there is no expiration date, there may continue to be significant differences between the perpetual futures market and the spot market.
Therefore, perpetual futures contracts set up a mechanism for traders to pay funding fees. Assume that the perpetual futures market trades at a higher price than the spot market. In this case, the funding rate will be a positive number, indicating that long positions (buyers) pay short positions (sellers) a funding fee. This encourages buyers to sell the asset, causing the contract price to fall, bringing it closer to the spot price. On the contrary, if the trading price of the perpetual futures market is lower than that of the spot market, the funding rate will be negative, and the short position will continue to pay funding fees to the long position, stimulating the contract price to rise.
In summary, if the funding rate is positive, longs pay shorts a funding rate. If the funding rate is negative, shorts pay the funding rate to longs.
Perpetual futures contracts are popular in Bitcoin and digital currency trading. To learn more about perpetual futures contracts, please read "What is a perpetual futures contract?" 》.
Want to start your cryptocurrency journey? Buy Bitcoin on Binance today!
What is an options contract?
An options contract is a financial derivative that gives a trader the right, but no obligation, to buy or sell an asset at a specific price in the future. The main difference between futures contracts and options contracts is that traders have no obligation to settle options contracts.
Traders predict price movements when they purchase options contracts.
There are two types of options contracts: calls and puts. A call option is a belief that the price will rise, and a put option is a belief that the price will fall.
Like other derivatives, options contracts can be based on a variety of financial assets: market indices, commodities, stocks, digital currencies, etc.
Options contracts make it possible to implement extremely complex trading strategies and risk management methods, such as two-way positions. In the world of digital currencies, options are ideal for miners looking to hedge large amounts of their digital currency assets. In this way, miners can more effectively avoid having their funds adversely affected.
To learn more about options contracts, please read "What is an Options Contract?" 》. To trade options on Binance, please first read our Options Guide for iOS and Android Users.
What is the foreign exchange (Forex) market?
The foreign exchange (Forex, abbreviation: FX) market is a market that exchanges the currency of one country with the currency of another country. Essentially, the foreign exchange market determines the exchange rates for currencies around the world.
We may often think of currencies as “safe haven” assets, even coining terms like “stablecoins.” In theory, this asset is somewhat safe from market fluctuations. While this view holds true to some extent, currencies can still be subject to significant market volatility. why? This is because the value of a currency depends on supply and demand, and may also be affected by inflation and other external market forces such as global trade and investment and geopolitical factors.
How does the Forex market work? Currency pairs can be traded by investment banks, central banks, commercial firms, investment firms, hedge funds and retail forex traders. The foreign exchange market also provides global currency conversion for international trade settlement.
Forex traders often use hedging trading strategies, such as position scaling using leverage, to amplify their gains. How this works is explained later in this article.
As we all know, the foreign exchange market is an important part of the modern globalized economy. In fact, the foreign exchange market is also the largest and most liquid financial market in the world.
What are leveraged tokens?
Leveraged tokens are tradable assets that provide leveraged exposure to the price of digital currencies without the need to manage leveraged positions. This means you no longer have to worry about margin, collateral, funding and liquidation issues.
Leveraged tokens are an innovative financial product that must rely on the power of the blockchain to circulate and operate. Leveraged tokens were first launched by derivatives trading platform FTX, and various alternatives have since emerged. The core idea behind it is the same – tokenize open leveraged positions. What does it mean?
Leveraged tokens tokenize unsettled perpetual futures positions. Remember how we discussed above how to use derivatives to create new derivatives? Leveraged tokens are a prime example of this, as they derive their value from futures positions (also a derivative).
Leveraged tokens are an excellent way to gain leveraged exposure to digital currencies. To trade leveraged tokens on Binance, please read the Beginner’s Guide to Binance Leveraged Tokens (BLVT).
To learn more about FTX Leveraged Tokens, please read the "Beginner's Guide to FTX Leveraged Tokens".
Chapter 3 – Trading and Investment Strategies
Table of contents
What is a trading strategy?
What is portfolio management?
What is risk management?
What is day trading?
What is swing trading?
What is position trading?
What is ultra-short-term trading?
What is asset allocation and diversification?
What is Dow Theory?
What is Elliott Band Theory?
What is Wyckoff analysis?
What is buy and hold?
What is index investing?
What is simulated trading?
What is a trading strategy?
A trading strategy refers to the plan you follow when executing a trade. There is no one right way to trade, and each strategy depends heavily on the trader's personality and preferences.
Regardless of your trading method, having a plan is a crucial step. Establishing trading goals in the plan can prevent bad emotions from triggering irrational operations that deviate from the goals. You usually have to decide what to trade, how to trade it, and the buy and sell prices.
In this chapter we will present some examples of commonly used trading strategies.
What is portfolio management?
Portfolio management is the way of creating and handling a series of investments. Portfolios themselves are groupings of assets, which may include everything from Beanie Babies toys to real estate. If you only trade digital currencies, your portfolio may consist of Bitcoin along with other digital currencies or tokens.
Before engaging in portfolio management, you should first consider your return expectations for your portfolio. Do you want a portfolio approach that is insulated from asset fluctuations or do you want to find something that is riskier but may deliver high returns in the short term?
Investors will benefit from continually thinking about and optimizing the way they manage their portfolios. Some people choose a passive strategy, making an investment plan and waiting to see what happens. Others like to take the initiative and generate profits by buying and selling assets frequently.
What is risk management?

Risk management is crucial to successful trading. First you need to understand what types of risks you may encounter:
Market risk: Potential losses suffered by investors if an asset depreciates in value.
Liquidity risk: The potential loss arising from illiquid markets. In such markets, investors may have difficulty finding a buyer for the asset.
Operational risk: potential losses caused by operational errors. The above problems may be caused by human error, software or hardware failure, or deliberate fraud by employees.
Systemic risk: Poor management of peers, resulting in potential losses and ultimately implicating all businesses in the entire industry. What happened in 2008 is a typical example of this. The collapse of the investment bank Lehman Brothers caused a chain reaction in the global financial system and ultimately triggered a financial crisis.
Risk identification must first identify the assets in the investment portfolio, but at the same time, internal and external factors must be considered to be effective. Next, you will evaluate these risks, how often do they occur? How high is the risk?
By weighing risks and determining their impact on your portfolio, you can prioritize risks so you can develop strategies accordingly. For example, systemic risks can be mitigated through diversified investments and market risks can be reduced using stop losses.
To learn more about risk management, please read "Financial Risk Explained" and "Beginner's Guide to Risk Management".
What is day trading?
Day trading refers to the trading strategy of entering and exiting a trade within the same day. The term comes from traditional markets and originally referred to trading during specific times of the day. Day traders do not hold positions outside of these hours.
The digital currency market is not restricted by opening and closing times, opening up a new model of round-the-clock trading. However, day trading in the world of digital currencies refers to traders buying and selling frequently within a 24-hour period.
In day trading, traders often rely on technical analysis to identify target assets to trade. Since profits may not be much in a short period of time, you may choose to trade a wider range of assets to maximize your profits. Despite this, some traders may continue to trade the same trading pair for many years.
This is obviously a very proactive trading strategy. It may bring high profits, but it also carries huge risks. Therefore day trading is usually more suitable for experienced traders.
Want to start your cryptocurrency journey? Buy Bitcoin on Binance today!
What is swing trading?
In swing trading, traders also try to profit from market trends, but the time period usually spans longer, usually days to months.
Swing trading generally looks for assets that are undervalued now but may increase in value in the future. You can buy the asset and sell it for a profit once the price increases. Alternatively, you could try to find overvalued assets that will lose value and sell some of them at a high price with the hope of buying them back when the price drops.
As with day trading, many swing traders use technical analysis techniques. However, swing trading strategies often require long time periods to work, so fundamental analysis can also be an extremely valuable tool.
Swing trading strategies are generally more beginner-friendly, mainly because they don't have the fast-paced stress of day trading. Day trading requires quick decisions and a lot of time staring at the trend on the screen, while swing trading can take your time.
What is position trading?
Position (or trend) trading is a long-term strategy. Traders buy assets and hold them for long periods of time (usually measured in months). Their goal is to sell it at a higher price in the future and ultimately make a profit.
The basic principles of position trading and long-term swing trading are different. Position traders are concerned with long-term trends and will try to profit from the direction of the overall market, while swing traders often try to predict the "swing effect", which is not necessarily related to the general trend of the market.
Position traders generally favor fundamental analysis purely due to their preference for long-term trading and therefore the conditions to see fundamental events materialize. However, they do not reject technical analysis. Although position traders trade under the assumption that the trend will continue, using technical indicators can also alert them to the possibility of a trend reversal.
Like swing trading, position trading is an ideal strategy for beginners. Because of the large time span, traders have ample opportunity to think things through.
What is ultra-short-term trading?
Of all the strategies we have discussed, short-term trading has the shortest time horizon. Traders complete buys and sells within minutes (or even seconds), trying to profit from small price movements. In most cases, they use technical analysis to predict price movements and exploit bid-ask spreads and other inefficiencies to generate profits. Due to the short time period, the profit rate of ultra-short-term trading is usually less than 1%. Ultra-short-term trading is actually a numbers game. Over time, small profits add up to a substantial profit.
But the ultra-short-term trading strategy is not suitable for beginners at all. You must have an in-depth understanding of the market, trading platform, and technical analysis to have a chance of success. However, for confident traders, as long as they correctly judge the waveforms, they can use short-term fluctuations to obtain high profits.
What is asset allocation and diversification?
"Asset allocation" and "diversification" are two terms that are often interchanged. “Don’t put all your eggs in one basket” embodies this principle. This proverb illustrates that concentrating risk on one point is a key factor in failure, and the same is true for wealth. Concentrating your life savings in one asset exposes you to the same risks. For example, it is not wise to invest in just one company's stock. If the company goes bankrupt, you'll lose everything.
This principle applies not only to individual assets but also to other asset classes. If a financial crisis occurs, it is expected that the stocks held will depreciate across the board. These stocks are closely correlated, meaning that all stocks lose money and follow the same trend.
Good diversification is more than just growing a portfolio with hundreds of different cryptocurrencies. For example, what if governments around the world banned digital currencies or quantum computers broke their built-in public-key cryptography schemes. Both events can have profound negative consequences for all digital assets. Like stocks, they all belong to the same asset class.
The ideal situation is to allocate wealth among different investment portfolios. This way if a single asset underperforms, there won't be a knock-on effect on the rest of your portfolio. Nobel Prize winner Harry Markowitz introduced this idea in Modern Portfolio Theory (MPT). The idea states that volatility and risk in a portfolio can be reduced by combining uncorrelated assets.
To learn more about this topic, read Asset Allocation and Diversification by Binance Academy or Discover the Diversification Benefits of Bitcoin by Binance Research.
What is Dow Theory?

The Dow Theory is a financial framework modeled on the ideas of Charles Dow. Dolph was the founder of the Wall Street Journal and helped create the U.S. stock indexes, the Dow Jones Transportation Average (DJTA) and the Dow Jones Industrial Average (DJIA).
Although Dow himself never officially published the Dow Theory, he put forward many market principles in his works, which we can collectively call Dow Theory. The key points are as follows:
Everything has a price - Dow Theory is a big believer in the efficient market hypothesis (EMH), which believes that the market reflects all information related to assets through prices.
Market Trends - One of the merits of the Dow Theory is the creation of what are now known to the public as market trends, divided into primary trends, secondary trends and tertiary trends.
Major Trend Phases - The Dow Theory divides major trends into three distinct phases: Accumulation, Large Retail Entry, and Excess and Distribution.
Cross-Index Correlation - The Dow Theory states that the true trend in one index cannot be determined unless a corresponding pattern can be observed in another index.
Importance of Volume - Trending directions must be confirmed by high volume.
Trends persist until reversed - if a trend is confirmed, the market trend will remain unchanged until reversed.
It is worth noting that this is not an exact subject, it is only a theory at present, and it may not be true. Despite this, the theory remains hugely influential and many trading investors consider it an integral part of their methodology.
For more information, please read "Introduction to Dow Theory".
What is Elliott Band Theory?
Elliott Band Theory (EWT) believes that the rules of market activities conform to the psychology of market participants. Although this theory is used in many technical analysis strategies, it is not an indicator or a specific trading technique, but simply a method of market structure analysis.
The Elliott waveform usually consists of eight waves, which can be subdivided into two types: impulsive and corrective waves. Five of the impulsive waves will conform to the general market trend, and the other three corrective waves will develop in the opposite direction.

Elliott Band cycles are divided into impulsive waves (blue) and corrective waves (yellow).
The graphs of these bands also have fractal properties, meaning that if you zoom in on a band, you'll see another Elliott waveform in it. Conversely, if you zoom out on a band, you will now see that the band is part of a larger Elliott Band cycle.
Elliott Waves have received mixed reviews, with some arguing that the method is too subjective as traders can identify wave patterns in a variety of ways without breaking the rules. Like Dow Theory, Elliott Band Theory is not foolproof and should not be considered an exact discipline. Many traders have achieved great success by combining Elliott Band Theory with other technical analysis tools.
To learn more about this topic, read Introduction to Elliott Band Theory.
What is Wyckoff analysis?
Wyckoff analysis is a trading investment strategy developed by Charles Wyckoff in the 1930s. His work is widely regarded as the cornerstone of modern analytical techniques across many financial markets.
Wyckoff proposed three basic laws: the law of supply and demand, the law of cause and effect, and the law of input-output. He also developed the Market Force Theory, which has clear similarities to Charles Dow's major trend breakdown. His research results in this area are also extremely valuable to digital currency traders.
From a practical perspective, Wyckoff analysis itself is a five-step trading method. It can be broken down as follows:
Identify trends: Analyze the current market situation and future development trends.
Determine asset strength: Does the asset move with market trends or against them?
Look for assets with good reasons to buy: Are there enough reasons to convince yourself to buy at the current price point? Are the potential rewards worth the risk?
Assessing the probability of an asset price change: Do indicators like the Wyckoff Buy-Sell Test price point to potential price changes? What do price and volume say? Is the price trend about to change for this asset?
Time to Enter: How are these assets doing relative to the broader market? When is the best time to enter?
The Wyckoff method was developed nearly a century ago and is still widely used today. The scope of Wyckoff's research is very broad, and the above is only a very brief overview. It is recommended that everyone study his research results in depth, which contains a lot of indispensable technical analysis knowledge. You can check out our Wyckoff Method Explained to learn the basics.
What is buy and hold?
The “buy and hold” strategy is actually not uncommon and involves buying and holding an asset. This is a passive strategy with a long time horizon. Investors can purchase assets without taking any action regardless of how market conditions change. In the field of digital currency, there is also a typical phenomenon, namely long-term holding (HODLing), which usually refers to investors buying and holding digital currencies for a long time without actively participating in transactions.
This is an advantageous investing approach for those who prefer to "hands off" their investments, as they do not need to worry about short-term fluctuations or changes in capital. On the other hand, investors adopting this strategy need to be patient and assume that the asset will not eventually become worthless.
To learn more about applying this strategy to Bitcoin, read DCA Explained.
What is index investing?
We can think of index investing as a form of “buy and hold.” As the name suggests, investors try to generate income from the activity of assets within a specific index. You can achieve your goals by purchasing assets on your own or investing in index funds.
This is also a passive strategy. Investors can benefit from diversification across various asset classes without the pressure of active trading.
What is simulated trading?
Paper trading can be applied to any strategy, except that traders are only simulating buying and selling assets. As a beginner (or even an experienced trader), this might be a good way to test your trading skills without investing real money.
For example, you might have discovered a strategy for predicting when Bitcoin will fall and want to profit from it before the price drops. In order to avoid risks to actual funds, you can choose to conduct simulated trading at this time, which is very simple, just like entering the price at the beginning of "short selling" and then entering it again at the end. You can use some simulators that simulate common trading interfaces.
The main advantage of paper trading is that it allows you to test your trading strategy without causing losses if something goes wrong with the strategy. You can test various transactions with zero risk. Of course, you also need to realize that simulated trading has limited understanding of the real environment, and your mentality will be different after you actually invest money. Simulators that fail to simulate real-life conditions may also cause you to misperceive the associated costs and fees unless you consider the above factors when operating on a specific platform.
Binance offers a variety of paper trading options. For example, the Binance Futures testnet provides a complete interface. If you need to build a dedicated trading robot or program, you can access the spot trading test network through the API.
Chapter 4 - Basics of Technical Analysis
Table of contents
What is a long position?
What is a short position?
What is an order book?
What is order book depth?
What is a market order?
What is a sliding spread in trading?
What is a limit order?
What is a stop loss order?
What are placing orders and taking orders?
What is the bid-ask spread?
What is a K-line chart?
What does the K-line chart look like?
What is a trend line?
What are support and resistance levels?
What is a long position?
A long position (referred to as "long") involves buying an asset that is expected to appreciate in value. Long positions are commonly used in derivatives or foreign exchange transactions and can be applied to basically any asset class or market type. Purchasing an asset in the spot market with the expectation that the price will rise also constitutes a long position.
Going long on financial products is the most common way to invest, especially for those who are just starting out. Long-term trading strategies such as buy and hold are based on the assumption that assets will appreciate in value. In this sense, buying and holding is a way to go long.
However, going long does not necessarily mean that the trader hopes to profit from rising prices. Take leveraged tokens as an example: BTCDOWN is inversely proportional to the price of Bitcoin. If the price of Bitcoin increases, the price of BTCDOWN will decrease. On the contrary, if the price of Bitcoin falls, the price of BTCDOWN rises accordingly. Opening a long position in BTCDOWN is equivalent to anticipating a decline in the price of Bitcoin.
What is a short position?
A short position ("short") is the sale of an asset that can be repurchased at a lower price in the future. Shorting is closely related to margin trading, as traders may short borrowed assets. However, shorting is also widely used in derivatives markets and can be done through a simple spot position. So, how does short selling work?
The approach to shorting the spot market is simple: Let's say you hold Bitcoin and expect the price to fall. You sell your Bitcoin for USD with the hope of buying it back at a lower price in the future. This strategy of selling at a high price and buying at a low price in the future is actually shorting Bitcoin. very simple. But what about shorting borrowed assets? Let's understand how it works.
You borrow an asset (such as a stock or digital currency) that you think will lose value in the future and then immediately sell it. If the transaction is successfully completed and the asset price drops as expected, it can be repurchased at the value of the borrowed asset. You can then repay the borrowed asset with interest, thus successfully earning a profit from the difference between the original price and the buy-back price.
So, how do you borrow money to short Bitcoin? The specific example is as follows: we borrow 1 Bitcoin through collateral and then immediately sell it for $10,000. Right now, we hold $10,000 in cash. Suppose the price of Bitcoin drops to $8,000, we buy back 1 Bitcoin and then repay the debt with interest. The initial purchase price of this Bitcoin was $10,000, and the current repurchase price is $8,000, so the gain reaches $2,000 (minus interest and transaction fees).
What is an order book?
The order book is a collection of currently unfilled orders, sorted by price. When the order you place is not executed immediately, it will be entered into the order book. An order will remain in the order book until filled by another order or canceled.
Each platform's order book will differ, but usually contains roughly the same information: you'll see the number of orders at a specific price level.
In digital currency trading and online trading, orders in the order book will be matched through the matching engine system. This system ensures smooth execution of trades and can be considered the hub of all trading platforms. This system, along with the order book, is at the heart of the electronic trading platform concept.
What is order book depth?
Order book depth (or market depth) is a visualization of the current open orders in the order book. It usually displays buy orders on one side and sell orders on the other, with their cumulative depth displayed on the chart.
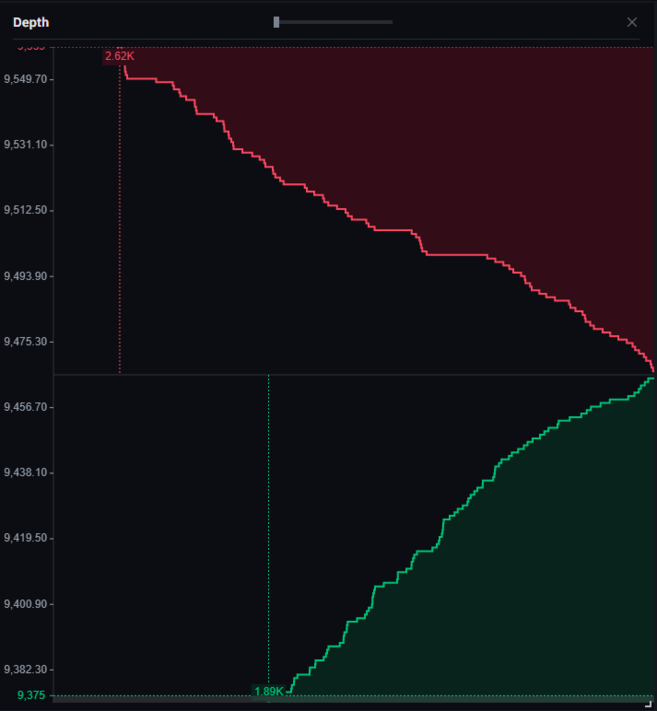
Order book depth for the Binance BTC/USDT market pair.
In a more conventional sense, order book depth can also represent the liquidity that the order book is able to absorb. The greater the "depth" of the market, the greater the liquidity in the order book. Liquid markets can absorb large orders without significant impact on price. However, if the market is illiquid, a large backlog of orders could have a significant impact on prices.
What is a market order?
A market order is an order to buy or sell quickly at the best price currently available in the market. Basically the fastest way to get in and out of the market.
After placing a market order, it is equivalent to conveying this message: "I hope to complete the order immediately at the current best price."
Your market order will continue to fill the order book until the entire order is filled. Therefore, large traders (aka whales) can have a significant impact on price if they use market orders. High-value market orders can effectively soak up liquidity in the order book. Why is this? We’ll elaborate on this when we discuss sliding spreads.
Want to know more? Please read "What is a Market Order?" 》.
What is a sliding spread in trading?
While we're talking about market orders, you need to understand what a sliding spread is. Market orders being filled at the best price means they will continue to fill the order book until the entire order is filled.
However, what happens if there is not enough liquidity around the target price to drive large market orders? At this time, there may be a huge difference between your expected order transaction price and the actual transaction price. This difference is called a "slip spread."
Let's say you want to open a long position in an altcoin worth 10 Bitcoins. However, this altcoin has a relatively small market capitalization and low market liquidity. Your market order will continue to fill the order book until the order for 10 Bitcoins is fully filled. In a highly liquid market, you can execute an order for 10 Bitcoins without significantly affecting the price. However, a lack of liquidity means there may not be enough sell orders in the order book at the current price range.
So when your entire 10 BTC order is filled, you may find that the average price paid is much higher than expected. In other words, the lack of a sell order will cause your market order to be placed at a higher price in the order book, so that the matched order price will be more expensive than the original price.
It is important to be aware of sliding spreads when trading altcoins as some trading pairs may lack liquidity to satisfy market orders.
What is a limit order?
A limit order is an order to buy or sell at a specific or better price. This price is called the limit price. A buy limit order will execute a purchase at a price not exceeding the limit price, while a sell limit order will execute a sale at a price not lower than the limit price.
After placing a limit order, it is equivalent to conveying this message: "I hope to complete the order immediately at a price not lower than/not higher than a specific price."
Using limit orders gives you more control over when you enter and exit the market. It ensures that your order is never lower than the price you want. But there's a downside: the market may never reach the price you want, rendering the order unexecutable. In many cases, this can mean a potential trading opportunity is lost.
Every trader uses limit or market orders differently, and some traders are only used to using one or the other, while others may be used to using both. It's important that you understand how they work so you can make a good decision.
Want to know more? Please read "What is a limit order?" 》.
What is a stop loss order?
We have just learned what market orders and limit orders are, let’s talk about what stop loss orders are. A stop-loss order is a combination of a limit and market order that is triggered only when a certain price is reached. This price is called the stop loss price.
The main purpose of a stop loss order is to control losses. Every trade requires a set failure point, which is a price level that you should set in advance. This price level indicates that you realize that your initial idea was wrong and that you should execute a sell at this level to prevent further losses. Therefore, the failure point is usually the price point at which the stop loss order is set.
How does a stop loss order work? As we mentioned earlier, stop orders can be in the form of limit orders or market orders, and these types are also known as stop limit orders and stop market orders. The key is that the stop loss only activates when a certain price (stop price) is reached. When the stop price is reached, it will trigger a market or limit order. In other words, the stop loss price you set is the trigger condition for market orders or limit orders.
However, you must keep in mind: We know that limit orders can only be filled at the limit price or a better price, and will never be lower than your expectations. If you use a stop-loss limit order as a stop-loss method, when the market collapses rapidly, the price will immediately deviate from your limit price, resulting in the order being unable to be filled. In other words, the stop price will trigger a stop limit order, but the limit order may still not be filled due to a sharp price drop. Therefore, stop-market orders are safer than stop-limit orders, ensuring an immediate exit from the market if the price reaches the point of failure, even in extreme market conditions.
Want to know more? Please read "What is a stop-loss limit order?" 》
Want to start your cryptocurrency journey? Buy Bitcoin on Binance today!
What are placing orders and taking orders?
When the posted order fails to be filled immediately and enters the order book, you will become the pending order party. Your order adds liquidity to the order book and therefore performs a "pending order" operation that increases liquidity.
Limit orders are usually executed as Maker orders, but this is not the case in all cases. For example, you set a limit buy order, and the limit price is much higher than the current market price. Then, because you specified that the order be executed at the limit price or better, your order will execute at the market price (because it is lower than the limit price you set).
If you place an order that is executed immediately, you become the taker. Your order is not added to the order book but is immediately matched with an existing order in the order book. Because you absorb the liquidity in the order book, you are called a taker. Market orders are always "takers" because the trader is executing the order at the current best market price.
Some trading platforms adopt a multi-tier charging model to encourage traders to provide liquidity. After all, high trading volume is in the trading platform's self-interest, and increased liquidity will attract greater liquidity. In this type of system, the maker adds liquidity to the trading platform and therefore usually pays less transaction fees than the taker. In some cases, the trading platform even rebates the placing order. This page allows you to view your current trading fee level on Binance.
For more information, please read "What are pending orders and taker orders?" 》
What is the bid-ask spread?
The bid-ask spread is the difference between the highest buy order (buy) and the lowest sell order (sell) in the market. It is the difference between the highest selling price of a seller and the lowest buying price of a buyer.
The bid-ask spread is a measure of market liquidity. The smaller the bid-ask spread, the stronger the market liquidity. The bid-ask spread can also be thought of as a measure of supply and demand for a given asset. At this time, the seller represents the supply and the buyer represents the demand.
When you place a market buy order, it will be executed at the current lowest bid price. On the contrary, when you place a market sell order, it will be executed at the highest sell price.
What is a K-line chart?
A candlestick chart graphically presents the price of an asset within a given time frame. It consists of many candlestick patterns, each representing the same period of time. For example, on a 1-hour candlestick chart, each candlestick pattern represents 1 hour. A candlestick pattern on a 1-day candlestick chart represents 1 day, and so on.
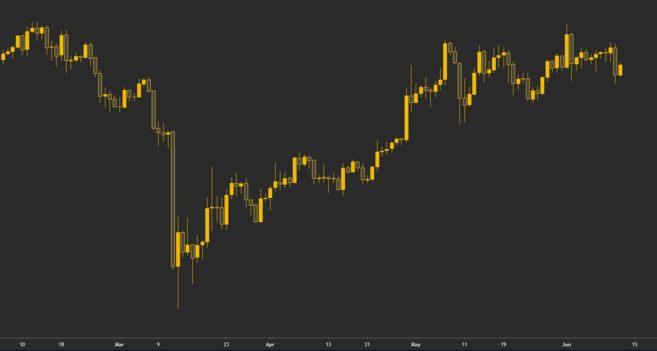
Bitcoin’s daily candlestick pattern, with each candlestick pattern representing a day’s trading.
A candlestick pattern consists of four data points: open, high, low, and close (also known as OHLC value). Opening and closing prices are the first and last traded prices within a given time frame, while low and high are the lowest and highest traded prices recorded, respectively.
K-line chart is one of the most important tools for analyzing financial data. The history of K-line charts can be traced back to Japan in the 17th century. It was improved upon by trading pioneer Charles Dow in the early 20th century.
Candlestick chart analysis is one of the most common ways to view the Bitcoin market using technical analysis. Want to learn how to read candlestick charts? Please read the "Beginner's Guide to K-line Charts".
What does the K-line chart look like?
Technical analysis is primarily based on the assumption that future price movements can be discerned from historical price trends. So, in this context, how to use K-line chart? The way to do this is to identify candlestick charts and develop a trading strategy based on them.
K-line charts help traders analyze the market structure and determine whether they are in a bull market or a bear market. They can also be used to identify target areas on a chart, such as support, resistance, or potential reversal points. Many locations on the chart often correspond to significant increases in trading activity.
Referring to candlestick patterns is also an excellent way to implement risk management because they can present a clear and accurate trading pattern that is already established. Why is this? This is because candlestick charts can identify clear price targets and failure points, and traders can precisely control how they trade. Therefore, K-line charts are favored by the majority of foreign exchange and digital currency traders.
The most common K-line chart patterns include flags, triangles, wedges, hammers, stars, and dojis. If you want to learn how to interpret these patterns, please read "12 Common K-line Chart Patterns" and "Beginner's Guide to Classic Chart Patterns".
What is a trend line?
Trendlines are a widely used tool by traders and technical analysts. They are lines formed by connecting certain data points in a chart. These figures generally represent prices, but there are exceptions. Some traders also draw trend lines based on technical indicators and oscillators.
The main purpose of drawing trend lines is to present price movements in a visual form to facilitate traders to identify the overall trend and market structure.

Bitcoin’s price has hit the trend line multiple times, indicating an upward trend.
Some traders rely on trend lines alone to understand market structure. Others may use the interaction of trend lines with price to develop viable trade ideas.
Trendlines can be used on charts on almost any time frame, but like any other market analysis tool, trendlines on long-term horizons tend to be more reliable than those on short-term horizons.
The strength of the trend line also needs to be considered. According to the conventional definition of a trend line, a trend line must touch the price at least two to three times to be valid. Generally speaking, the more times price hits a (tested) trendline, the more reliable the trend is.
If you want to learn more about how to draw trend lines, please read "Detailed Explanation of Trend Lines".
What are support and resistance levels?
Support and resistance levels are basic concepts related to trading and technical analysis.
Support refers to the "lower limit" of price. In other words, support levels correspond to areas of high demand where buyers can enter the market and push the price higher.
Resistance refers to the "ceiling" of price. Resistance levels correspond to areas of high supply where sellers can enter the market and bring the price down.

Support levels (red) are tested and broken, forming resistance levels.
Now you know that support and resistance levels correspond to locations of increased demand and supply respectively. But there are many other factors at play when considering support and resistance levels.
Technical indicators such as trend lines, moving averages, Bollinger Bands, Ichimoku charts, and Fibonacci retracements can also indicate potential support and resistance levels. In fact, knowledge of market psychology is sometimes even used. Because of this, traders and investors have very different approaches to incorporating support and resistance levels into their trading strategies.
Want to learn how to draw support and resistance levels on a chart? Please read "Detailed Explanation of the Basic Principles of Support and Resistance".
Chapter 5 – Technical Analysis Indicators
Table of contents
What are technical analysis indicators?
What are leading and lagging indicators?
What is a momentum indicator?
What is transaction volume?
What is the Relative Strength Index (RSI)?
What is a moving average (MA)?
What is the exponential moving average (MACD)?
What is the Fibonacci Retracement Tool?
What is the Stochastic Relative Strength Index (StochRSI)?
What are Bollinger Bands (BB)?
What is Volume Weighted Average Price (VWAP)?
What is the Parabolic Indicator?
What is an Ichimoku balance diagram?
What are technical analysis indicators?
Using technical indicators it is possible to calculate indicators related to financial instruments. Calculations can be based on price, volume, on-chain data, open interest, social factors and even other indicators.
As discussed earlier, technical analysis methods are often based on the assumption that historical price patterns may influence future price direction. In this way, traders using technical analysis can use a range of technical indicators to identify potential buy and sell prices on the chart.
Technical indicators can be classified in a variety of ways, including pointing to future trends (leading indicators), confirming patterns that have already occurred (lagging indicators), or illustrating ongoing events (concurrent indicators).
Other classifications may be related to how the indicator presents information. Classified in this way, they can be divided into overlay indicators, which are superimposed on price and data, and some which are oscillators, which oscillate between minimum and maximum values.
There is also a category of indicators designed to measure specific aspects of the market, such as momentum indicators. As the name suggests, they are designed to measure and display market momentum.
So, which is the best technical analysis indicator? There is no easy answer to this question. There are many different types of technical indicators available to traders, and their choice largely depends on each individual's trading strategy. However, in order to make a choice, they need to first understand what technical indicators are available, which is what we will cover in this chapter.
What are leading and lagging indicators?
As we introduced before, different indicators have different standards and should be used for specific purposes. Leading indicators are used to predict trends in future events. Lagging indicators serve to confirm what has already happened. So, when should you use these indicators?
Leading indicators are often ideal for short- to medium-term analysis. Analysts use this indicator when they want to predict trends and look for statistical tools to support their assumptions. Especially in economics, leading indicators are particularly useful in predicting recessions.
When it comes to trading and technical analysis, leading indicators are also used due to their predictive nature. However, there is no particular indicator that can accurately predict the future, so there is no need to take these predictions too seriously.
Lagging indicators are used to confirm events and trends that have occurred or are currently occurring. It sounds redundant, but it can be very useful. Lagging indicators may reveal otherwise hidden market conditions, bringing them to the public's attention. Therefore, lagging indicators are often used in long-term chart analysis.
Want to know more? Please read "Detailed Explanation of Leading and Lagging Indicators".
What is a momentum indicator?
Momentum indicators are designed to measure and display market momentum. What is market momentum? Simply put, it is a measure of how quickly prices change. The momentum indicator is designed to measure how quickly prices rise and fall. Therefore, traders who wish to profit from severe market fluctuations often apply it to short-term analysis.
Momentum traders aim to enter trades when market volatility is high and exit when market momentum begins to wane. Typically, if volatility is low, prices tend to move within a smaller range. As the volatility trend intensifies, prices tend to change within a larger range and eventually exceed the range. This is also the stage when momentum traders are most active.
After the trade is completed and the trader exits the position, they move on to invest in another asset with strong momentum and try to repeat the same trading strategy. Therefore, the momentum indicator is widely used by day traders, day traders, and short-term traders looking for quick trading opportunities.
What is transaction volume?
Volume is a classic indicator. It shows the number of units of an asset traded within a given period of time, which can basically reflect the trading volume within a certain period of time.
Some traders believe that volume is the most important technical indicator. “Volume precedes price” is a famous saying in the trading world. This sentence shows that before the price fluctuates significantly (whether up or down), huge trading volume can become a leading indicator.
By analyzing this indicator, traders can gauge the strength of the underlying trend. If high volatility is accompanied by high volume, it can be viewed as validation of a trend. This makes sense because many traders and investors are active in certain price ranges, so high trading activity equates to high trading volume. However, if volatility occurs without high volume, it is a sign that the underlying trend may be weakening.
Price levels associated with high volume in the past can also provide traders with ideal buying or selling levels. This is because history often repeats itself, so increased trading activity is more likely to occur at these price levels. Ideally, support and resistance levels should also be accompanied by increased volume, thus confirming the strength of that price level.
What is the Relative Strength Index (RSI)?
The Relative Strength Index (RSI) is an indicator used to indicate whether an asset is overbought or oversold. This is a momentum oscillator that shows how quickly prices are changing. This oscillator varies between 0 and 100, and the data is usually represented as a line chart.

RSI indicator applied to Bitcoin trading charts.
Why measure market momentum? If momentum increases when price rises, the uptrend can be considered strong. Conversely, if momentum is weakening while prices are rising, the uptrend can be considered weak and a reversal is likely.
Let’s see how the RSI indicator is generally interpreted. An RSI indicator of 30 or below indicates that the asset may be oversold; conversely, an indicator above 70 indicates that the asset is overbought.
Nonetheless, the RSI indicator results should still be viewed with a certain amount of skepticism. Under abnormal market conditions, RSI can reach extremely high values. Even so, market trends are likely to continue for some time.
RSI is one of the easiest technical indicators to understand, making it one of the best technical indicators often used by beginners. For more information, please read "What is the RSI indicator?" 》.
What is a moving average (MA)?
Moving averages smooth price action to help determine market trends. Because moving averages rely on historical price data and are not predictive, they are considered lagging indicators.
There are many different types of moving averages, the two most common being the simple moving average (SMA or MA) and the exponential moving average (EMA). What's the difference between the two?
The simple moving average is calculated by taking n periods of price data and calculating the average. For example, the 10-day simple moving average (SMA) calculates the average price of the last 10 days and displays the result on a chart.

Based on the 200-week moving average of Bitcoin price.
Exponential moving averages are a little more complicated. It uses a different calculation formula and focuses more on the latest price data. Therefore, the EMA reacts more quickly to recent events in price action, while the SMA takes longer to catch up with the trend.
As mentioned before, moving averages are lagging indicators, and the longer the time span, the stronger the lag. Therefore, the 200-day moving average responds to price action more slowly than the 100-day moving average.
Moving averages help identify market trends easily. For more information, please read "Moving Averages Detailed".
What is the exponential moving average (MACD)?
MACD is an oscillator that uses two moving averages to show market momentum. This indicator tracks price action that has already occurred and is a lagging indicator.
MACD consists of two lines: MACD line and signal line. The calculation method is very simple. Subtract the 26-period EMA from the 12-period EMA to get the MACD line. The signal line is the average of the 9-period EMA index based on the MACD line. In addition, many charting tools also use histograms to represent the difference between the MACD line and the signal line.

MACD indicator applied to Bitcoin charts.
The way traders use the MACD indicator is to observe the relationship between the MACD line and the signal line. When using MACD, you usually want to focus on the crossover between the two lines. If the MACD line crosses the signal line upwards, it can be interpreted as a bullish signal. On the contrary, if the MACD line crosses the signal line downward, it can be interpreted as a bearish signal.
MACD is one of the most popular technical indicators for measuring market momentum. For more information, please read "Detailed Explanation of MACD Indicator".
Want to start your cryptocurrency journey? Buy Bitcoin on Binance today!
What is the Fibonacci Retracement Tool?
The Fibonacci Retracement tool is a popular indicator based on a series of numbers, the Fibonacci Sequence. The sequence was discovered in the 13th century by an Italian mathematician named Leonardo Fibonacci.
Today, the Fibonacci Sequence is an integral part of many technical analysis indicators, with Fibonacci Retracements being one of the most popular. The numbers in the Fibonacci sequence have a corresponding ratio relationship, which is expressed as a percentage. Traders can use these percentages to determine potential support and resistance levels.
Fibonacci ratios are divided into:
0%
23.6%
38.2%
61.8%
78.6%
100%
Technically speaking, 50% is not a Fibonacci ratio, but some traders still consider it when using this tool. In addition, Fibonacci ratios other than 0-100% are sometimes used, such as 161.8%, 261.8%, and 423.6%.

Fibonacci retracement on Bitcoin chart.
So, how do traders use Fibonacci retracements? The main purpose of drawing a percentage chart is to find the target study area. Traders typically select two important price points on the chart and fix the 0 and 100 numbers in the Fibonacci Retracement tool at those two points. The areas outlined by these points highlight potential buy and sell prices, helping traders determine where to place their stops.
The Fibonacci Retracement tool is a versatile indicator suitable for a variety of trading strategies. To learn more, read the Fibonacci Retracement Study Guide.
What is the Stochastic Relative Strength Index (StochRSI)?
Stochastic RSI (or StochRSI) is a derivative index of RSI. Similar to the standard Relative Strength Index (RSI), its main goal is to determine whether an asset is overbought or oversold. However, contrary to RSI, StochRSI is not derived from price data but is derived from RSI values. In most charting tools, StochRSI has a value between 0 and 1 (or 0 and 100).
The StochRSI is often most useful to traders when it is near the upper or lower limits of its range. However, because it is faster and more sensitive, it can produce many false signals that are difficult to interpret.
The traditional interpretation of StochRSI is somewhat similar to RSI. When the indicator exceeds 0.8, it means that the asset may be overbought. When the indicator is below 0.2, it means that the asset may be oversold. But it’s worth mentioning that the above should not be taken as a direct signal to buy or sell. Although this information may indeed reflect the actual situation, there may be many reasons behind it. Therefore, most technical analysis tools are best used in conjunction with other market analysis techniques.
Want to learn more about StochRSI? Please read "Detailed Explanation of Stochastic Relative Strength Index".
What are Bollinger Bands (BB)?
Named after John Bollinger, Bollinger Bands are a measure of market volatility and are often used to identify overbought and oversold conditions. This indicator consists of three lines or "bands", namely the SMA (middle track) and the upper and lower tracks. These three tracks will be displayed on the chart along with the price action. The idea is that as market volatility increases or decreases, the distance between these trajectories will expand or contract.

Bollinger Bands on Bitcoin chart.
Let’s take a look at the introduction of Bollinger Bands. The closer the price is to the upper limit, the closer the asset is to overbought status. Likewise, the closer the price is to the lower bands, the more likely the asset is approaching oversold conditions.
It is important to note that prices usually move within the range of the price range, but sometimes they can break through or fall below the price range. Does this mean a buy or sell signal has been generated? Not so, this signal just tells us that the market is moving away from the mid-line SMA and gradually developing towards extreme conditions.
With the help of Bollinger Bands, traders can also try to predict market contractions and expansions, known as the Bollinger Bands Squeeze Indicator. This indicator refers to periods of lower volatility. During this period, the two tracks moved close to each other, compressing the price into a small range. As "stress" builds within this range, the market eventually breaks out of this trajectory, causing volatility to intensify for a period of time. Since markets can move up and down, we consider squeeze strategies to be neutral (neither bearish nor bullish). It is therefore worth using Bollinger Bands in conjunction with other trading tools such as support and resistance levels.
Want to learn more about Bollinger Bands? Please read "Detailed Explanation of Bollinger Bands".
What is Volume Weighted Average Price (VWAP)?
As mentioned in the previous discussion, many traders consider volume to be the most important indicator. So, are there volume-based indicators?
Volume Weighted Average Price (abbreviated as VWAP) combines volume with price action. Specifically, it is the average price of an asset over a given period, weighted by volume. This indicator takes into account the price level corresponding to the maximum trading volume, so it is more practical than simply calculating the average price.
How do traders use VWAP? VWAP is often used as a benchmark for evaluating current market prospects. In this case, when the market is above the VWAP line, it can be considered bullish. On the contrary, if the market is below the VWAP line, it can be considered bearish. Have you noticed any similarities with moving averages? VWAP is actually comparable to moving averages, at least the methods of use are similar. As we can see, the main difference between these two indicators is that VWAP takes volume into account.
In addition, VWAP can also be used to identify areas with strong liquidity. Many traders consider prices above or below the VWAP line as trading signals. However, they will also consider other indicators in their trading strategies in an effort to reduce risk.
Want to learn more about how to use VWAP? Please read "Detailed Explanation of Volume Weighted Average Price (VWAP)".
What is the Parabolic Indicator?
The Parabolic Indicator (SAR) is used to determine the direction of a trend and potential reversals. The full English name of "SAR" is Stop and Reverse. At this price, long positions are closed and short positions are opened, and vice versa.
Parabolic SAR is represented by a series of points on a chart, some above and some below the price. Generally, if the price is below the price, it means that the price is in an upward trend. On the contrary, if the price is above the price, it means that the price is in a downward trend. A price reversal occurs when the point flips to the "other side" of price.

Parabolic indicator on Bitcoin chart.
Parabolic SAR provides insights into where the market is trending and helps identify trend reversal price points. Some traders may also use the Parabolic SAR indicator as a basis for trailing stops. This special order type will change as the market develops, ensuring investors can protect their profits during strong upward trends.
Parabolic SAR performs best during strong market trends. During market consolidation, it can set off many false potential reversal signals. Want to learn how to use the Parabolic SAR indicator? Please read "A Concise Guide to the Parabolic SAR Indicator".
What is an Ichimoku balance diagram?
The Ichimoku chart is a technical analysis (TA) indicator that integrates multiple indicators onto the same chart. Of the indicators we have discussed, the Ichimoku chart is undoubtedly the most complex. At first glance, it may be difficult to understand its formula and how it works. But actual use is not as complicated as it seems. Many traders use the Ichimoku chart because it can produce very unique and well-defined trading signals.
As mentioned earlier, the Ichimoku balance chart is not just one indicator, but a collection of a series of indicators. This provides insight into market momentum, support and resistance levels, and the direction of the trend. This indicator calculates five averages and plots them on the same chart. These averages are also used to create "cloud bands" that predict potential areas of support and resistance.
While the average plays an important role, the cloud bands themselves are a key part of the indicator. Generally, if the price is above the cloud band, the market can be considered to be in an uptrend, and conversely, if the price is below the cloud band, the market can be considered to be in a downtrend.

The cloud bands of the Ichimoku equilibrium chart on the Bitcoin chart have successively played a role of support and resistance.
Ichimoku charts can also enhance other trading signals.
It is true that the Ichimoku balance chart is difficult to learn, but once you successfully master how it works, it can be of great help. For more details, please read "Detailed Explanation of Ichimoku Balance Chart".
Chapter 6 – Cryptocurrency Trading Tips
Table of contents
How to trade cryptocurrencies?
How to trade cryptocurrencies on Binance?
What is a trading journal and should I use one?
How should I calculate the position size in a trade?
Which online trading software should I use?
Should I join a paid group to trade?
What is Price Driving (P&D)?
Should I register for a cryptocurrency airdrop?
How to trade cryptocurrencies?
If you decide to start trading, please consider the following points first.
First you need to have start-up capital to trade. If you have no savings, trading with money you can't afford to lose can have serious adverse effects on your life. Trading is not easy, and most novice traders lose money. You need to be prepared to lose your trading capital quickly, and you may never be able to recoup your losses, so it is recommended that you start testing the waters with a small amount of money.
You also need to consider your overall trading strategy. There are many ways to make money in the financial markets, and you can choose from a variety of different strategies based on the time and energy you can invest to achieve your financial goals.
One last thing to note. Many traders only reach their best when trading is not their main source of income. At this time, they are more likely to bear the burden of mental fluctuations. If their daily livelihood depends entirely on trading, it will be difficult to maintain a stable mood. Being immune to emotions is a core trait of successful traders. If you gamble with your livelihood, you will inevitably be unable to maintain a good mood and mentality. Therefore, you can consider trading and investing as a side hustle, especially in the early stages. And remember, you should start with a small amount of money to learn and practice. Researching how to earn passive income through cryptocurrencies is also an effective way to earn income.
To learn how to avoid common mistakes in trading and technical analysis, read "7 Common Mistakes in Technical Analysis (TA)".
How to trade cryptocurrencies on Binance?
Now, you have decided to enter the world of digital currency trading. What else needs to be done next?
First, fiat currency needs to be converted into digital currency. The easiest way is to visit Binance’s Buy Cryptocurrency page, where there are numerous cryptocurrencies to choose from. You can buy cryptocurrencies via debit and credit cards, via bank account transfers on P2P trading platforms, and with the help of third-party solutions such as Simplex, Paxful or Koinal. Once you're done, you'll be part of a new financial system!
Once you own digital currency, the potential options are many. You can instantly access the Binance spot trading platform to trade digital currencies in real time. If you have some trading experience, you can also check out Binance Margin Trading Platform or Binance Futures. In addition, you can also try some passive income opportunities, including staking, depositing assets into Binance Savings, or joining the Binance mining pool.
All of the above investment options can be experienced and used through centralized trading platforms like Binance. You can store digital currencies to such trading platforms and conduct financial activities within their internal systems. Thanks to the amazing blockchain technology, there are many other so-called decentralized exchanges (DEX) to choose from. On these platforms, funds never leave an individual’s digital currency wallet and users always have complete control over their funds. You can also connect a hardware wallet and conduct transactions directly through it.
Centralized trading platforms are the mainstream in the field of digital currency. But many traders and blockchain enthusiasts believe that a sizeable portion of digital currency trading volume in the future will come from decentralized exchanges (DEX). Please visit Binance’s decentralized exchange (DEX) to experience digital currency trading for yourself!
What is a trading journal and should I use one?
A trading diary is a document that records your trading activities. Do you need one? Still, you can use a simple Excel spreadsheet, or subscribe to a dedicated service.
Especially when trading is more active, traders consider keeping a trading diary crucial to continued profitability. After all, how can you determine your strengths and weaknesses if you don't record your trading activity? Without a trading journal, you have no way of knowing exactly how you're performing.
Remember, bias can play a large role in your trading decisions, and a trading journal can help mitigate some of it. Why does this help reduce prejudice? Because the data is there, irrefutable! Trading performance will eventually be reflected in the form of numbers, and if you are not doing well, the performance will be clear at a glance. By using a trading journal consistently, you can also see which strategies perform best.
How should I calculate the position size in a trade?
The most important aspect of trading is risk management. In fact, some traders consider risk management to be a top priority. Therefore, a standardized formula must be used to calculate position size. The calculation process is as follows.
First, you need to determine how much risk you are willing to take on an individual trade. Assume that the risk you can take is 1%. Does this mean you enter 1% of your account balance as your position size? No, it means that if you hit your stop loss point, you will not lose more than 1% of your account funds.
This ratio may seem a little too small, but it is done to ensure that the few inevitable bad trades do not cause irreparable damage to the account. Therefore, after setting the tolerable loss, the stop loss point must be defined. Depending on the specific trading strategy, you can set stop loss points individually for each trade. Assume that you determine to set the stop loss point at 5% of the initial purchase price. When the preset stop loss point is reached, you sell at a price of 5% of the initial amount, and the funds in your account lose exactly 1%.
Let's assume our account size is 1000 USDT. We risk 1% on every trade. Our stop loss is 5% when entering the market. What size of capital should we use?
1000*0.01/0.05=200If we only want to lose up to 10 USDT, which is a 1% loss on the account, then we can invest 200 USDT.
This process may seem complex at first, but it is critical to properly implementing risk management. Don’t worry, we explain it in detail in our article How to Calculate Position Size in Trading.
Which online trading software should I use?
Chart analysis is a core trading tool for all technical analysts. But what's the best way to learn this tool? Binance has integrated TradingView charts, so you can analyze them directly through the platform whether you access the web interface or use the mobile app. You can also create a TradingView account to view all Binance markets through its platform.
There are many other online charting software providers on the market, each with their own unique features. Typically you have to pay a monthly subscription fee. Coinigy, TradingLite, Exocharts, and Tensorcharts are also some companies dedicated to cryptocurrency trading.
Should I join a paid group to trade?
Usually not used. There is already an abundance of free information about trading, enough to learn from? Practicing trading on your own can also be a useful way to learn from your mistakes and find the trading style that works best for you.
Joining a paid group can be an effective way to learn, but always be wary of scams and false advertising. After all, it’s easy to trick followers into purchasing paid services with fake transaction results.
Why would successful traders want to build a paid group? This question is worth pondering. Of course, there’s nothing wrong with making a side income, but why charge exorbitant fees if they’re already doing so well?
Nonetheless, there are high-quality paid groups run by successful traders that offer additional services (such as providing special market data). But you must be careful and examine who you are collecting money from, because most paid transaction groups are just "cutting leeks."
What is Price Driving (P&D)?
Price gouging is the practice of deliberately raising asset prices by spreading false information. When prices rise sharply ("pump"), speculators sell ("dump") assets purchased cheaply at high prices.

The picture above is a typical price gouging pattern.
The digital currency market is the hardest hit area by price gouging, and it is even more common in bull markets. During a bull market there is an influx of inexperienced investors who are more likely to be exploited. This type of fraud is most common in digital currencies with smaller market capitalizations, where markets lack liquidity and prices are more susceptible to manipulation.
Price gouging is often orchestrated by private groups. They promise easy rewards for joining (often requiring a fee). But often, these entrants are exploited by a small group of people who have already established positions.
In the traditional trading market, if price gouging is discovered, huge fines will be imposed.
Want to start your cryptocurrency journey? Buy Bitcoin on Binance today!
Should I register for a cryptocurrency airdrop?
Yes, but be extremely careful! Airdrops are a new way of distributing digital currency to a broad audience. It can effectively prevent digital currencies from being concentrated in the hands of a few holders. For a healthy decentralized network, the diversity of the holder group is crucial.
But there is no free lunch. Maybe good luck will happen to you occasionally, but this is very rare! Usually the initiator of the airdrop will try to take advantage of you, or want to get something in return.
What will the airdropper ask for in return? One of the most common “assets” returned is personal information. Is personal information more important than a highly speculative digital currency worth $10 to $50? It depends on how you choose. There may be better ways to make money on the side that avoid the risk of personal privacy and data being leaked and misused. Therefore, you need to be extra careful when registering for a digital currency airdrop.
Summarize
So far, we have introduced a lot of useful information. However, getting started with digital currency trading is still a daunting task and there are many concepts to learn. I hope this guide can provide effective help and make you more comfortable with digital currency trading.
Life-long learning! Therefore, we created a Q&A platform specifically about digital currencies: Ask Academy. If you have any questions about digital currency trading, blockchain technology, cryptography or other related topics, please feel free to post on the platform and members of the Binance community will patiently answer your questions! Sincerely looking forward to your arrival!


