
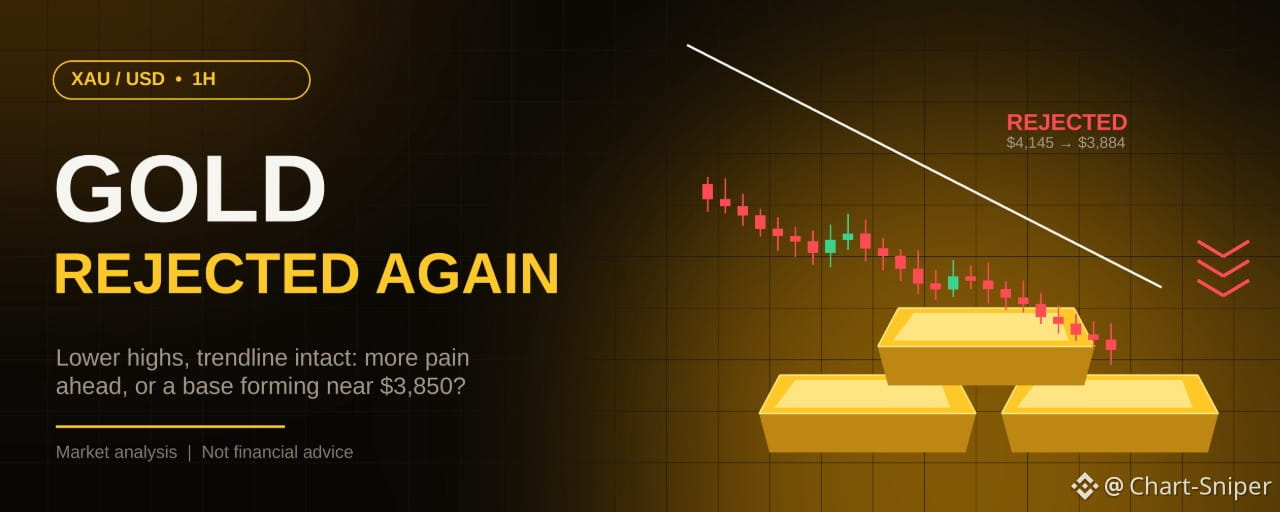


XAU/USD · 1H Chart · Analysis dated 15 Nov 2026
Gold keeps getting turned away. After the push to a higher high, XAU/USD printed a lower high near $4,145 and has been sliding along a descending trendline ever since. The latest close on the chart is $3,883.98. That puts gold about 6% below its early-October level, when spot gold was quoted at roughly $4,160 per troy ounce. The chart’s slide is consistent with recent coverage: analysts flagged gold falling below $4,100 with sellers threatening another breakdown.
What the chart is showing
Structure. The label sequence reads HH → LH → LL → LH → LH → HL. Every bounce has failed at a lower level than the one before. The one detail bulls can point to is the HL near $3,852, which is a slightly higher low after the flush, so selling pressure may be slowing.
The trendline. The white descending line has capped every rally since the peak, and price is pressing against it again. A clean 1H close above it would be the first real sign of a trend change.
The rejection zone. The large grey box, roughly $4,020–$4,108, was the old range. Gold broke down through it and it is now overhead supply.
Fibonacci. Measured from the ~$4,145 high down to the ~$3,852 low, the levels are approximately:
38.2% ≈ $3,965
50% ≈ $4,000
61.8% ≈ $4,033
These are my approximations read from the image, so verify them on your own chart.
Fair value gaps. A cluster of FVGs sits between roughly $3,905 and $4,060, so any bounce runs into stacked supply.
Bias: bearish while price stays below the trendline and the $3,935 area.
Scenario A: Bearish continuation (primary)
Entry: Short on a rejection in the $3,890–$3,920 zone, at the trendline and the lower-high FVG. Wait for a 1H candle to close back down.
Stop-loss: $3,935, above the last lower high.
Take profit 1: $3,852 (the HL, which is also the 0% fib)
Take profit 2: $3,820
Take profit 3: $3,772, the lowest level visible on the chart
From a $3,895 entry, risk is about $40 per ounce against about $75 to TP2 (roughly 1.9R) and about $123 to TP3 (roughly 3R). Take partial profit at TP1 and move the stop to breakeven.
Breakdown alternative: A 1H close below $3,850 confirms a lower low. Enter on the close or on a retest of $3,850 from below, with a stop at $3,880, and aim for $3,820 and then $3,772.
Scenario B: Reversal bounce (counter-trend)
Entry: Long only after a 1H close above the trendline and $3,935, ideally on a retest that holds.
Stop-loss: $3,895
Take profit 1: $3,965 (38.2%)
Take profit 2: $4,000 (50%)
Take profit 3: $4,033 (61.8%)
Notice that the stop is wider than TP1. Prefer waiting for the retest over chasing the breakout candle.
Risk management
Risk 1–2% of your account per trade.
Gold can move $20–$40 in minutes around US data, so use stop-losses, especially on leveraged contracts.
Use low leverage. Gold’s moves are large in dollar terms.
Weekend gap risk: the chart was captured on Sunday, before the weekly open. The market can open away from Friday’s close, which can skip past your entry or stop.
Trade the candle close, not the wick.
Key levels at a glance
Resistance: $3,935, $3,965, $4,000, $4,033, then the $4,020–$4,108 zone
Current price: about $3,884
Support: $3,852, $3,820, $3,772
⚠️ Disclaimer: This article is for educational and informational purposes only and is not financial advice. Trading gold and other leveraged instruments carries a high level of risk, including the loss of your entire capital. The levels above are technical scenarios, not guarantees or recommendations. Do your own research and consult a licensed financial advisor before trading.
@Binance Square Official #CryptoSelloffTriggersMultipleWhaleLiquidations #USSpotXRPETFsSeeLargestWeeklyOutflowIn8Months #WillFOMCMinutesReinforceRateHikeExpectations? #Binance #ChartSniper