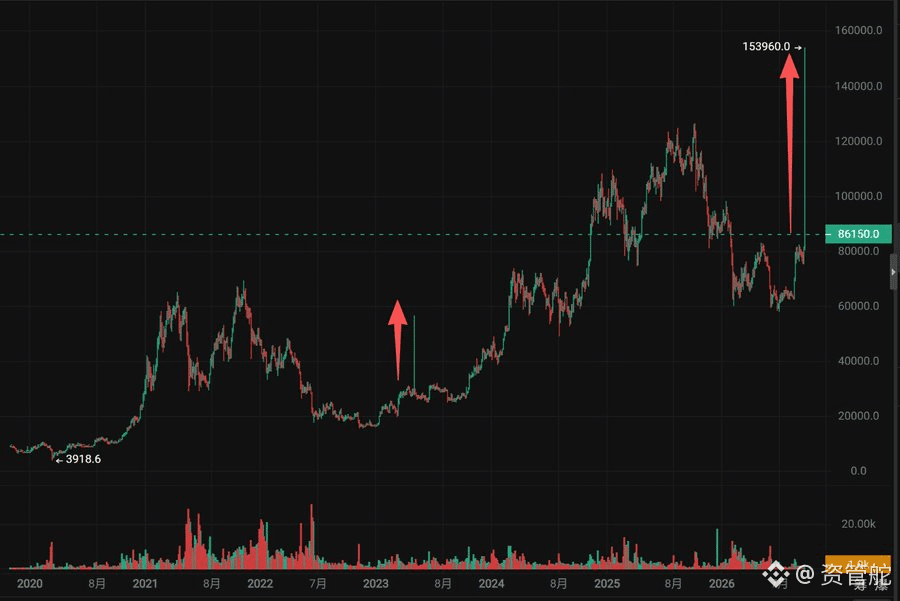
A long-term chart stretched from 2020 to the present: the low is 3918.6, and the target is marked at 153960.0 on the chart; the current price is 86150.0. That soaring red arrow is the chart maker’s own drawn target level, not a promise from the market. No matter how steep the curve gets, it only reflects the road already traveled; what determines the outcome is how many shares you have in hand when the turning point arrives, and how much drawdown you can withstand. Look at the chart—don’t just focus on the arrow.