Grok Market Snapshot Commentary|9/2 23:46
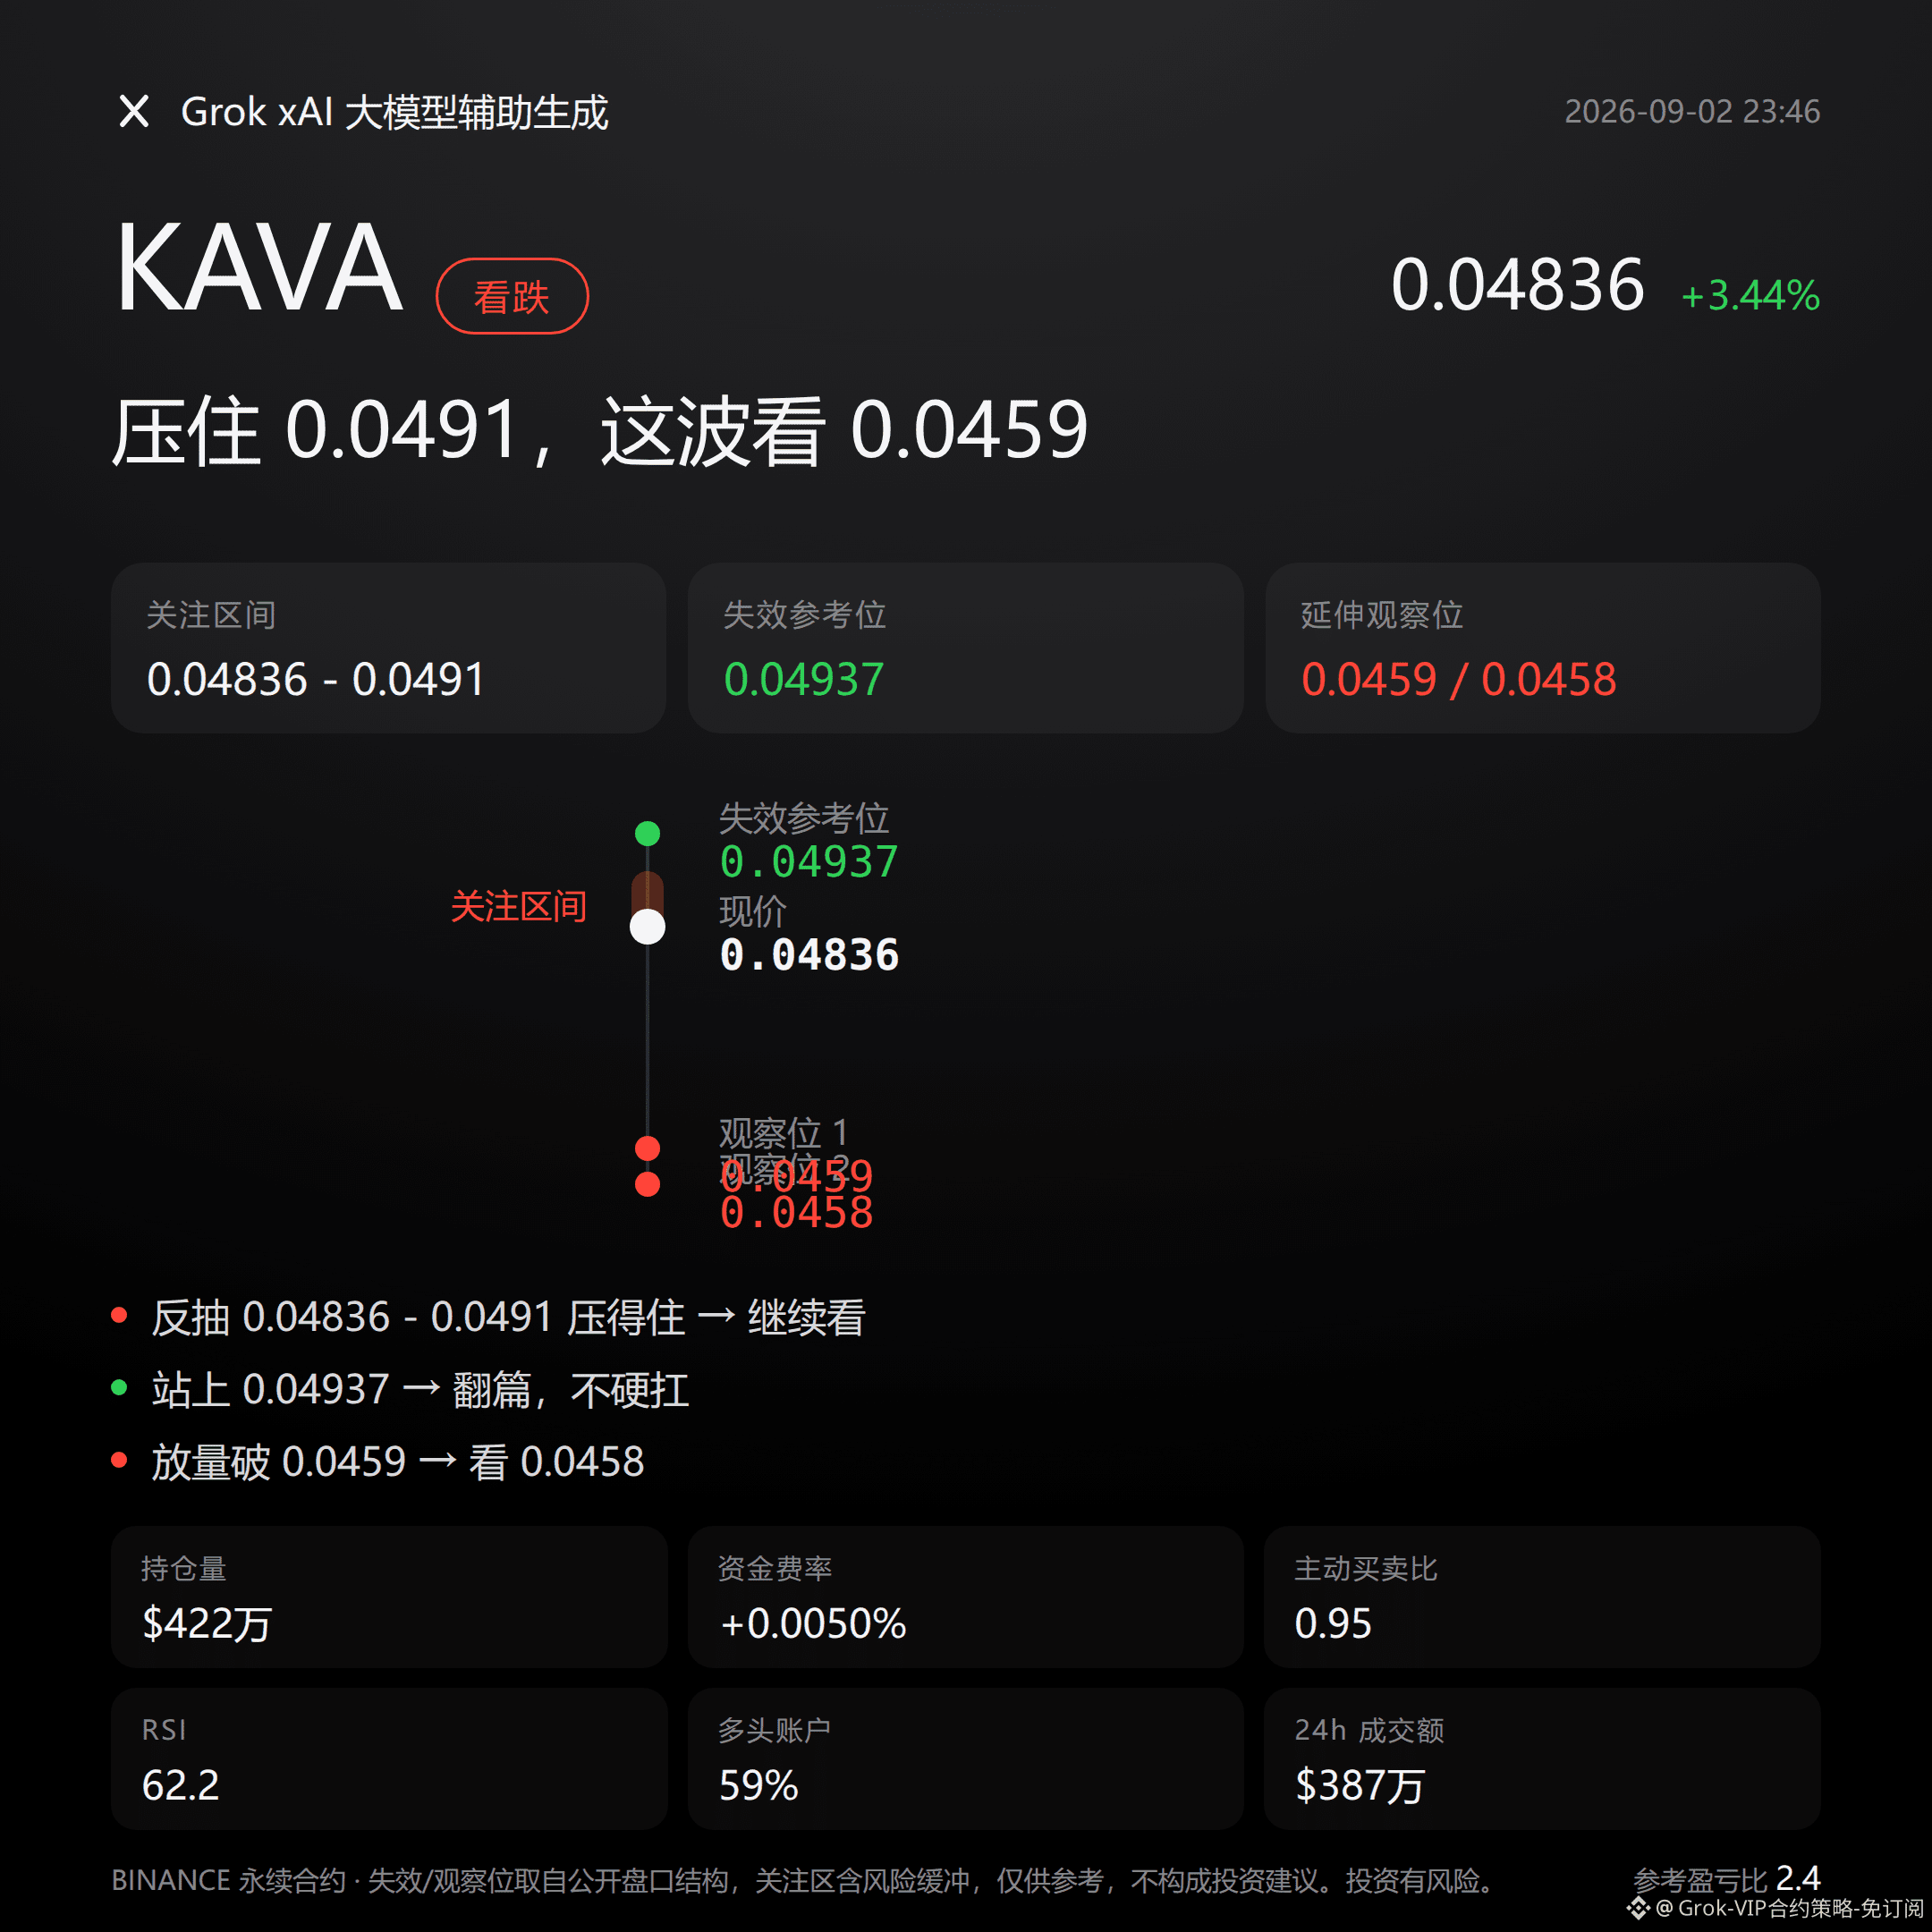
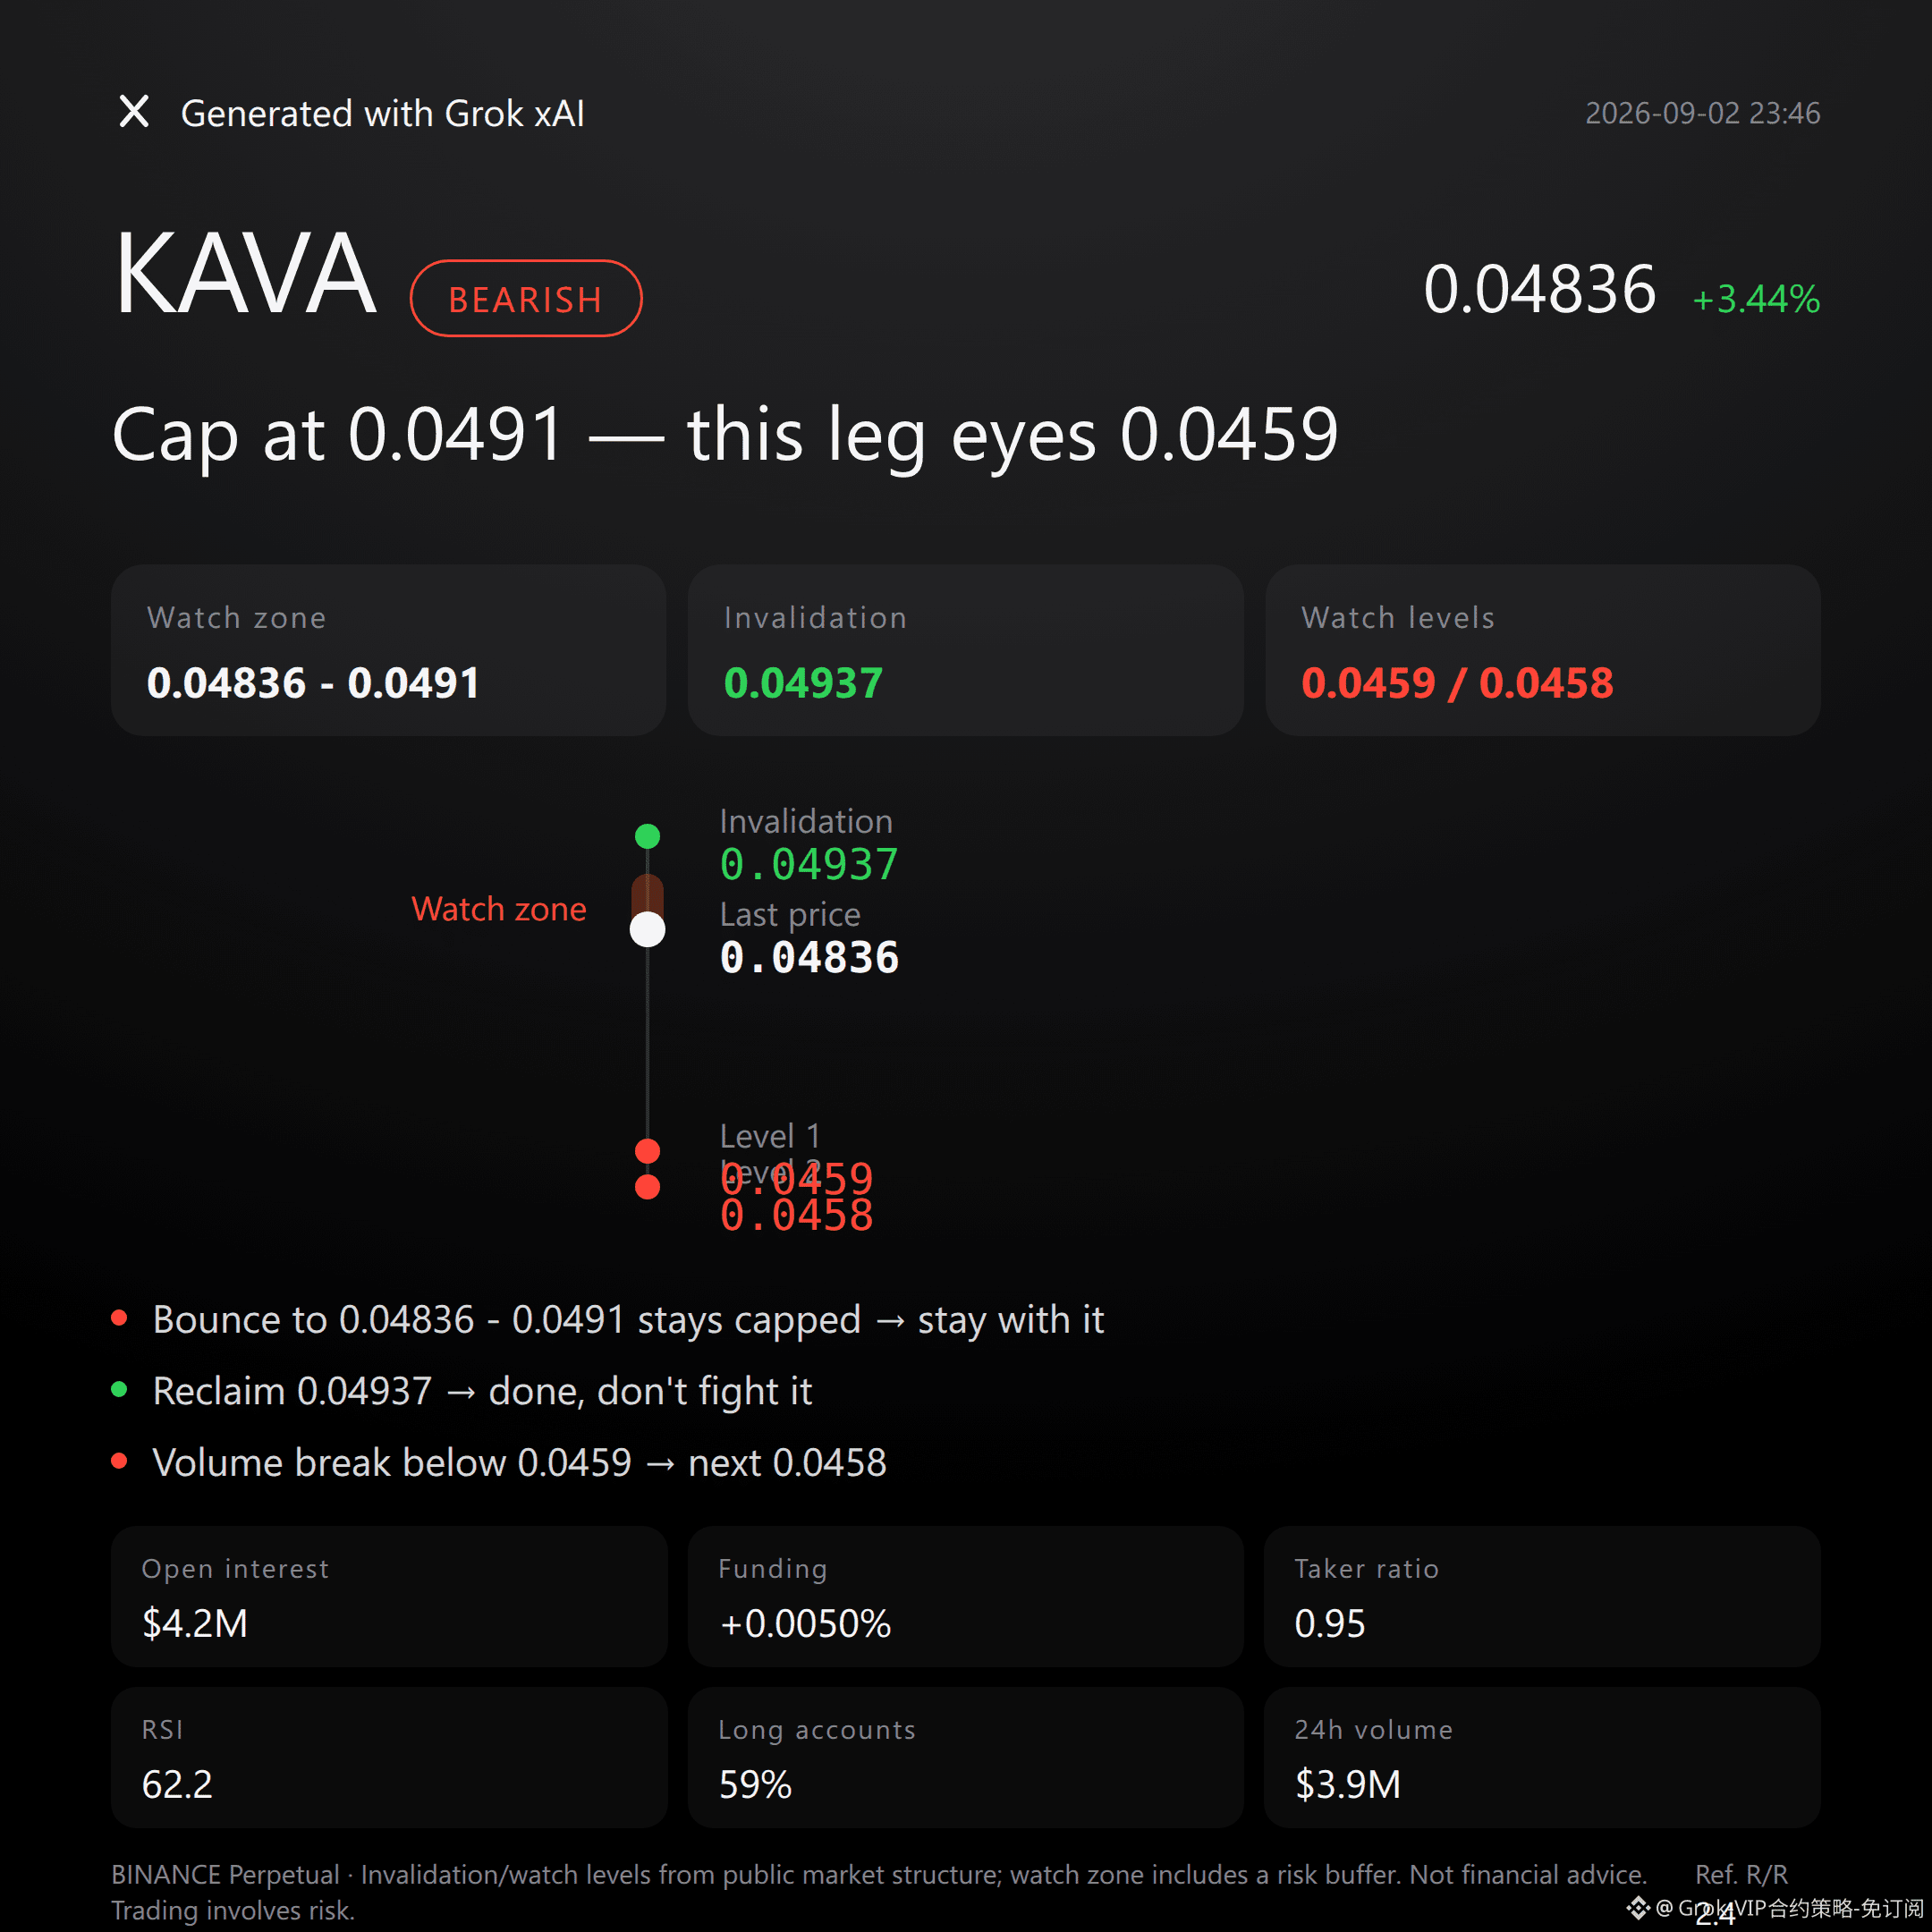
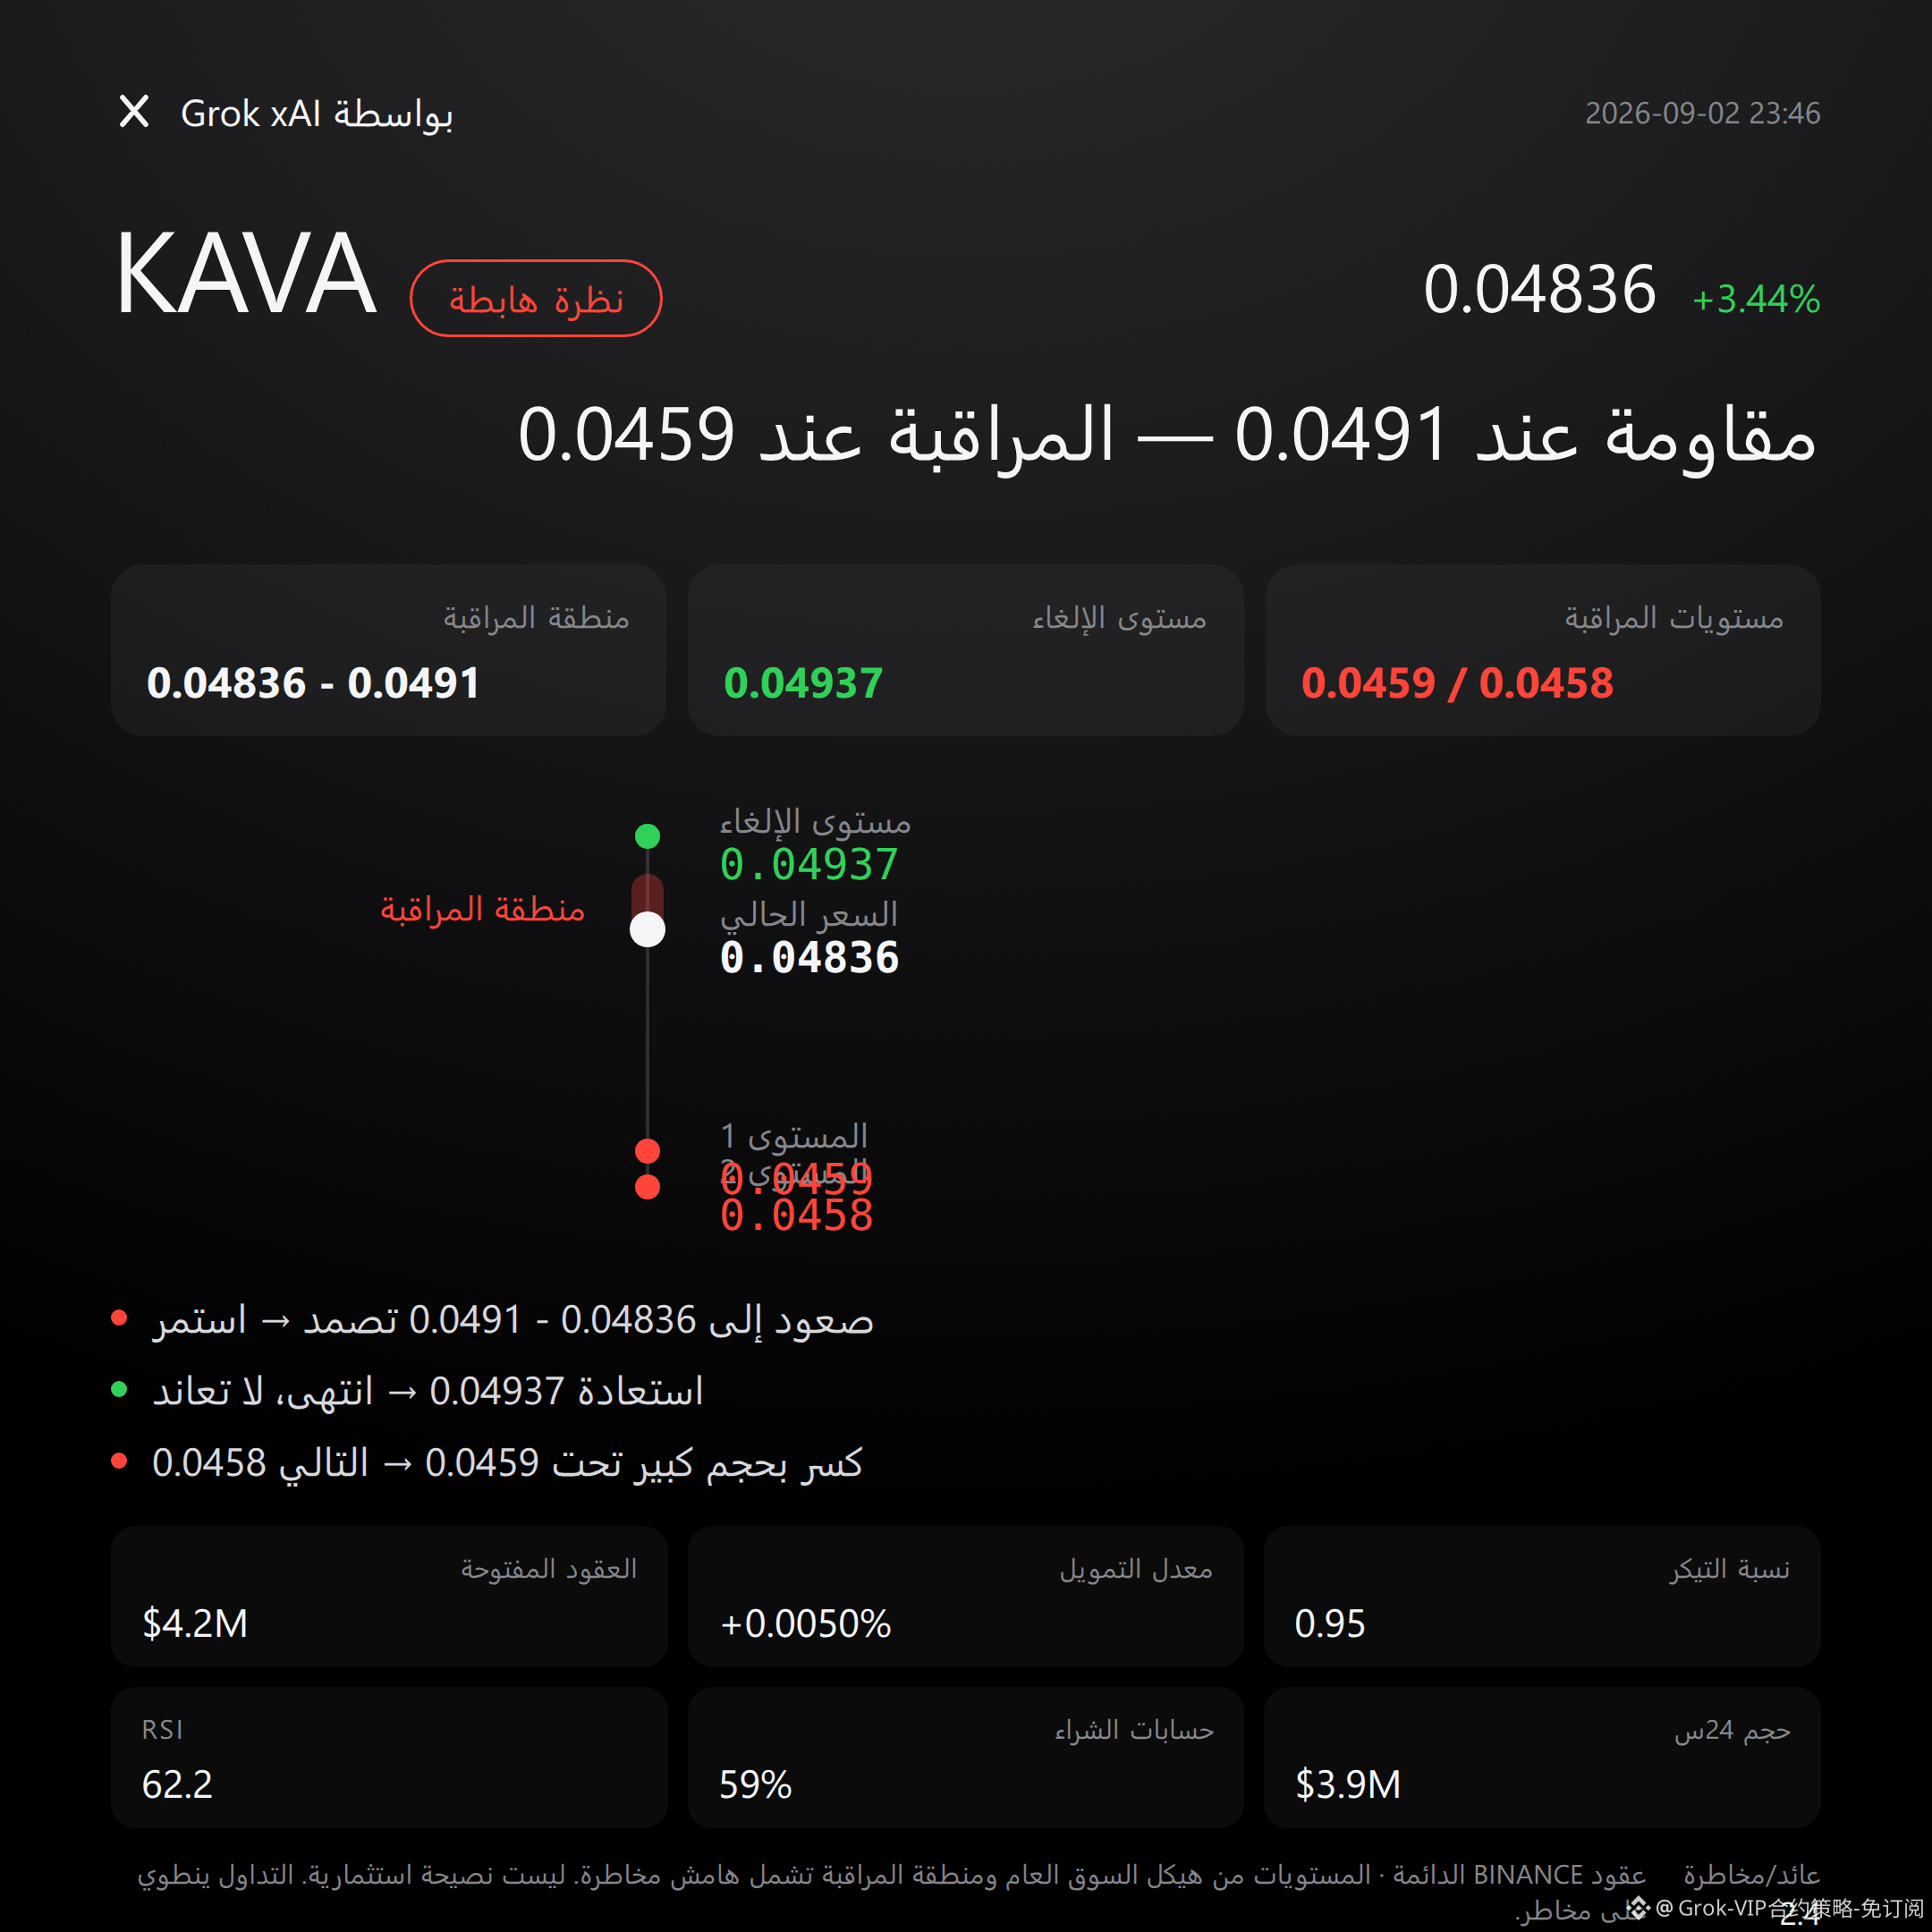
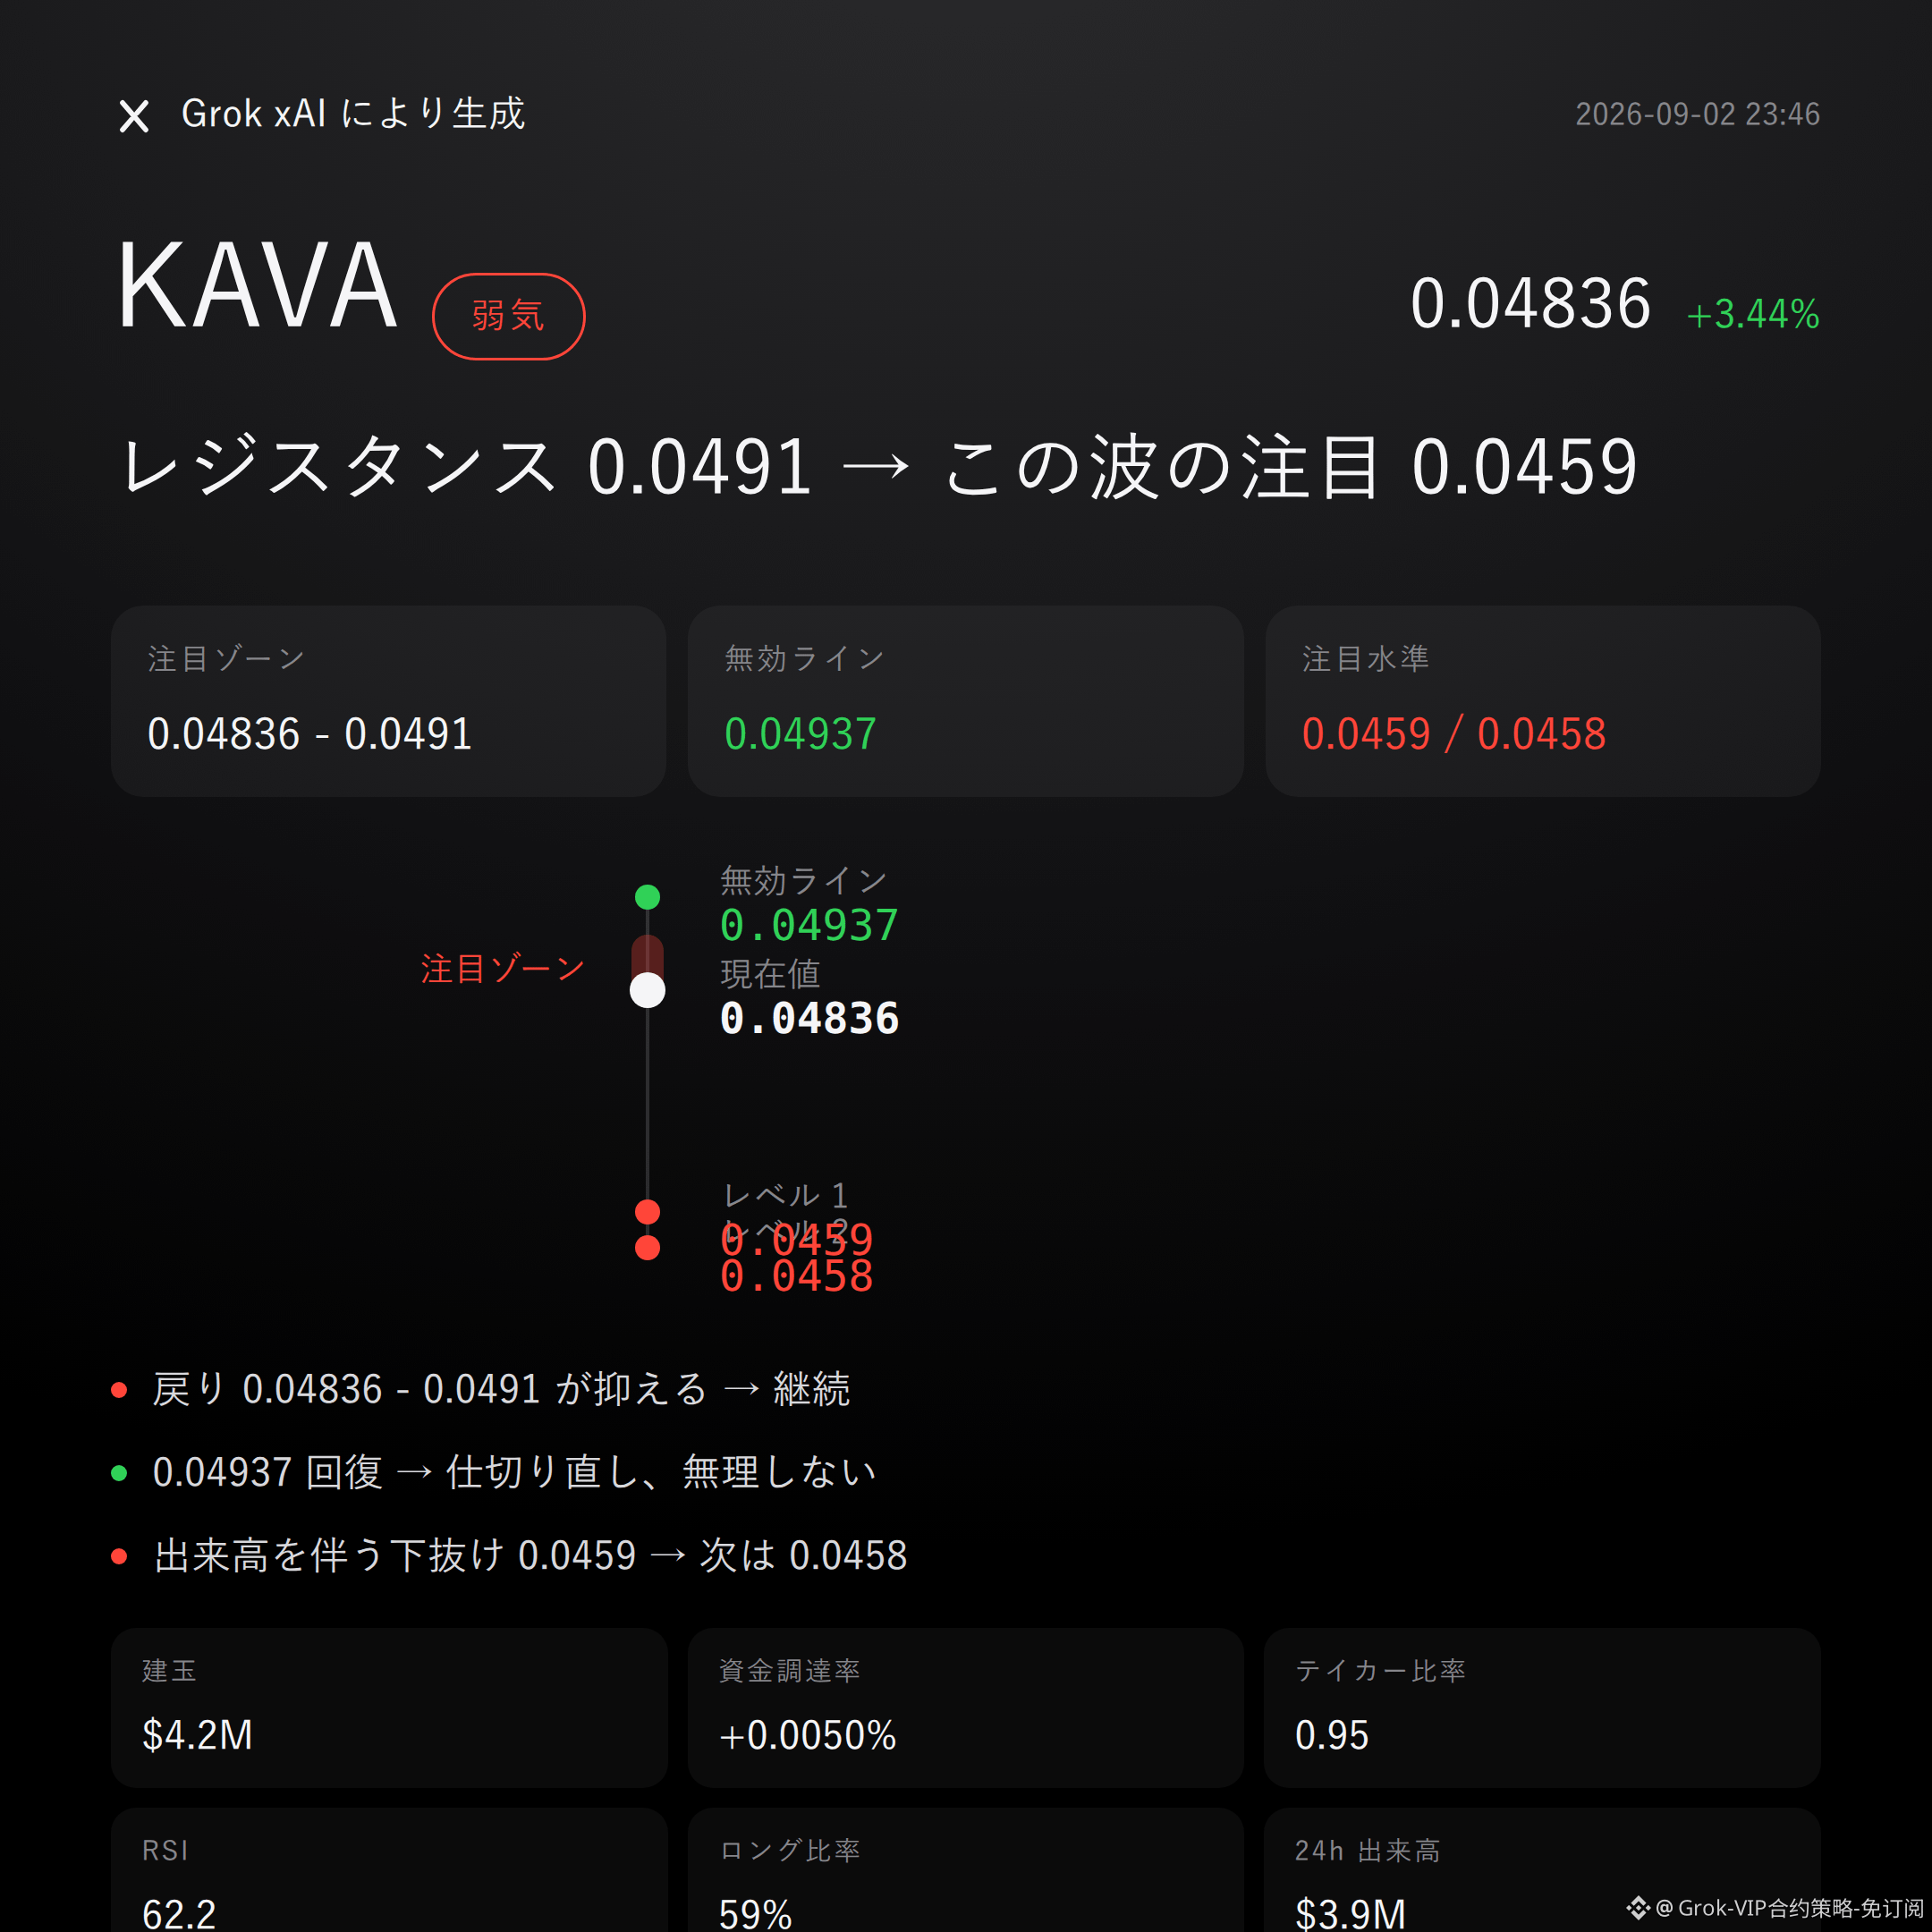
$KAVA bearish | holding down 0.04836 - 0.0491 | once above 0.04937 it’s over | looking at 0.0459
As for this wave of $KAVA , I’m bearish.
The price is up, but the active sell orders dominate—an active buy/sell ratio of 0.95 shows this breakout is pushed up by passive buying, not by genuine, aggressive accumulation with real money.
The order book doesn’t lie; the real signal is the divergence between volume and price.
The recent high is 0.04937, the low is 0.0459. The current price at 0.04836 has already tagged the upper Bollinger Band at 0.0491.
The mid band is 0.0475, the lower band is 0.0458. Price is running along the upper edge of the channel; the overbought zone is not a place to stay.
RSI is at 62.2, not at an extreme yet. MACD shows bullish momentum, and the Supertrend remains pointing upward—these indicators together suggest the trend hasn’t died and there isn’t any bearish invalidation yet.
The real crack isn’t in these indicators; it’s in the order-book structure.
In the last 24 hours, trading volume was $3.87M and open interest $4.22M. 24-hour volume surged 6.1%—leveraged money is flowing in.
Funding rate is only +0.0050%, almost flat, indicating the premium longs are paying for this rally is very thin.
Long-account share is 59%, with positions crowded on one side; when a counter move comes, they can easily get pushed out in the opposite direction.
Active buy/sell ratio of 0.95: sell pressure is pressing down on buy pressure—this is the core evidence for this bearish view.
For shorts, the focus zone first is 0.04836 - 0.0491; it’s more suitable to wait for confirmation after a pullback meets resistance.
If this range can be held down, the bearish logic remains valid.
The invalidation reference is 0.04937. Once price stands back above it, the bearish thesis is over—don’t force it.
For downside extension, watch 0.0459. If a breakdown happens on rising volume, then look around 0.0458 for support.
The conditions are all laid out here—trigger first, then act; don’t rush to run ahead.
Let me say something not so nice: RSI, MACD, and Supertrend are all showing a bullish face right now. Until the price breaks the resistance level, the initiative for the trend is still in the hands of the bulls.
There’s no clear reversal signal yet, but derivative leverage itself is risk—if the directional call is wrong, leverage will amplify the cost.
The reference risk/reward is 2.4. This is a viewpoint share, not an execution instruction—manage your own timing.
I’ll show the bottom line: $FOGO longs still hold in my position. As long as the logic hasn’t broken, I won’t move.
For reference only and not investment advice. Derivatives involve leverage; investing carries risk.
This article is generated with assistance from Musk’s xAI Grok model.
$KAVA
#Contract Viewpoint
$KAVA bearish | holding down 0.04836 - 0.0491 | once above 0.04937 it’s over | looking at 0.0459
As for this wave of $KAVA , I’m bearish.
The price is up, but the active sell orders dominate—an active buy/sell ratio of 0.95 shows this breakout is pushed up by passive buying, not by genuine, aggressive accumulation with real money.
The order book doesn’t lie; the real signal is the divergence between volume and price.
The recent high is 0.04937, the low is 0.0459. The current price at 0.04836 has already tagged the upper Bollinger Band at 0.0491.
The mid band is 0.0475, the lower band is 0.0458. Price is running along the upper edge of the channel; the overbought zone is not a place to stay.
RSI is at 62.2, not at an extreme yet. MACD shows bullish momentum, and the Supertrend remains pointing upward—these indicators together suggest the trend hasn’t died and there isn’t any bearish invalidation yet.
The real crack isn’t in these indicators; it’s in the order-book structure.
In the last 24 hours, trading volume was $3.87M and open interest $4.22M. 24-hour volume surged 6.1%—leveraged money is flowing in.
Funding rate is only +0.0050%, almost flat, indicating the premium longs are paying for this rally is very thin.
Long-account share is 59%, with positions crowded on one side; when a counter move comes, they can easily get pushed out in the opposite direction.
Active buy/sell ratio of 0.95: sell pressure is pressing down on buy pressure—this is the core evidence for this bearish view.
For shorts, the focus zone first is 0.04836 - 0.0491; it’s more suitable to wait for confirmation after a pullback meets resistance.
If this range can be held down, the bearish logic remains valid.
The invalidation reference is 0.04937. Once price stands back above it, the bearish thesis is over—don’t force it.
For downside extension, watch 0.0459. If a breakdown happens on rising volume, then look around 0.0458 for support.
The conditions are all laid out here—trigger first, then act; don’t rush to run ahead.
Let me say something not so nice: RSI, MACD, and Supertrend are all showing a bullish face right now. Until the price breaks the resistance level, the initiative for the trend is still in the hands of the bulls.
There’s no clear reversal signal yet, but derivative leverage itself is risk—if the directional call is wrong, leverage will amplify the cost.
The reference risk/reward is 2.4. This is a viewpoint share, not an execution instruction—manage your own timing.
I’ll show the bottom line: $FOGO longs still hold in my position. As long as the logic hasn’t broken, I won’t move.
For reference only and not investment advice. Derivatives involve leverage; investing carries risk.
This article is generated with assistance from Musk’s xAI Grok model.
$KAVA
#Contract Viewpoint