The 15-minute K-line strategy introduced in this article belongs to the trend school in terms of technical type. When the upward trend is basically established, buy quickly, and when the downward trend is basically established, sell quickly.
This article provides clear reference indicators for the establishment of an upward or downward trend. Investors can buy or sell according to the different signal indicators. It is especially important to remind you that when a short-term buy or sell signal appears, you must decisively follow the operating discipline regardless of profit or loss, and never wait and see with a fluke mentality.
Fifteen-minute candlestick chart strategy
The 15-minute K-line strategy is actually a method of operating by looking at the K-line chart that forms a K-line in 15 minutes. It is a smaller version of the daily operation and a short-term strategy. The same method is equally effective when enlarged to the daily line.
The purpose of the 15-minute K-line strategy: This method is not a way for you to make a lot of money through trading. It only plays a role in situations where the overall environment is full of variables. And through small-band operations, you can earn a small price difference.
Key points of the 15-minute candlestick chart strategy
1 For this kind of operation, the probability of buying and selling on the same day is not high, but if it happens, you must resolutely stop loss and leave the market the next day.
2This method is only suitable for you to operate with a small part of your total funds.
3This method is only used when the market is unstable.
4 This method is generally used for products that you have been working on for a long time. Even if the price is higher than when you sold when a buy signal is given, you must buy.
5 The operating discipline of this method is very important, and you cannot violate the discipline you set. Otherwise, the consequences will be serious.
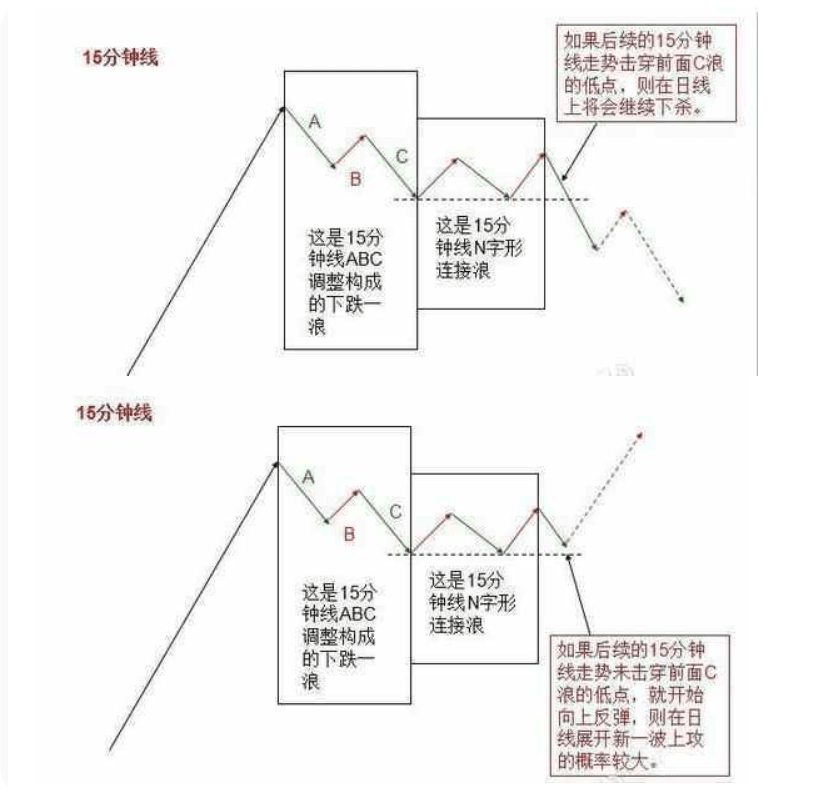
The following is a clear deconstruction and definition of the 15-minute trend
This includes a 15-minute ABC adjustment and an N-shaped connecting wave trend.
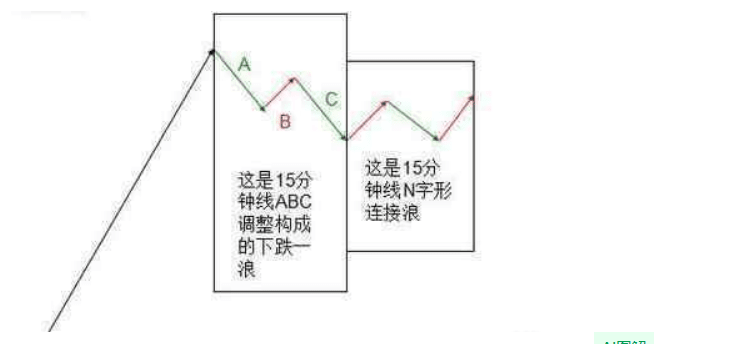
This trend tells us that the subsequent 15-minute line trend is particularly critical and can be used to analyze and judge the subsequent daily line trend.
15-minute K-line tactics improvement
After a lot of actual combat, we have concluded that the ascending triangle or platform has been broken through after finishing, which is one of the main profit models in precise trading. This model mainly selects the varieties when the 20-day moving average turns from downward to flat (the 60-day moving average cannot go downward), and when the 5-day and 20-day moving averages cross, the stock price rushes through the 60-day moving average with large volume, then shrinks and falls back to the 20-day or 60-day moving average to stop falling (the 5-day and 20-day moving averages cannot cross), and then buy more when the volume starts to rise again.
The characteristics of the second large-scale start are: the bullish divergence of the 15-minute moving average system, and the mid-line auxiliary indicators such as MACD send out buy signals. At the same time, large aggressive buy orders appear on the market. During the movement, the main force mostly adopts the splinting method and enters the lifting stage in one go. This is the ideal mode of operation of the main force.