
A bearish Ethereum fractal is combined with lower network activity as the Ethereum price attempts to break above $2,000.

Ethereum price is up around 35% so far in 2023. But its attempts to overcome psychological resistance above $2,000 have been met with strong bearish rejections on multiple occasions.
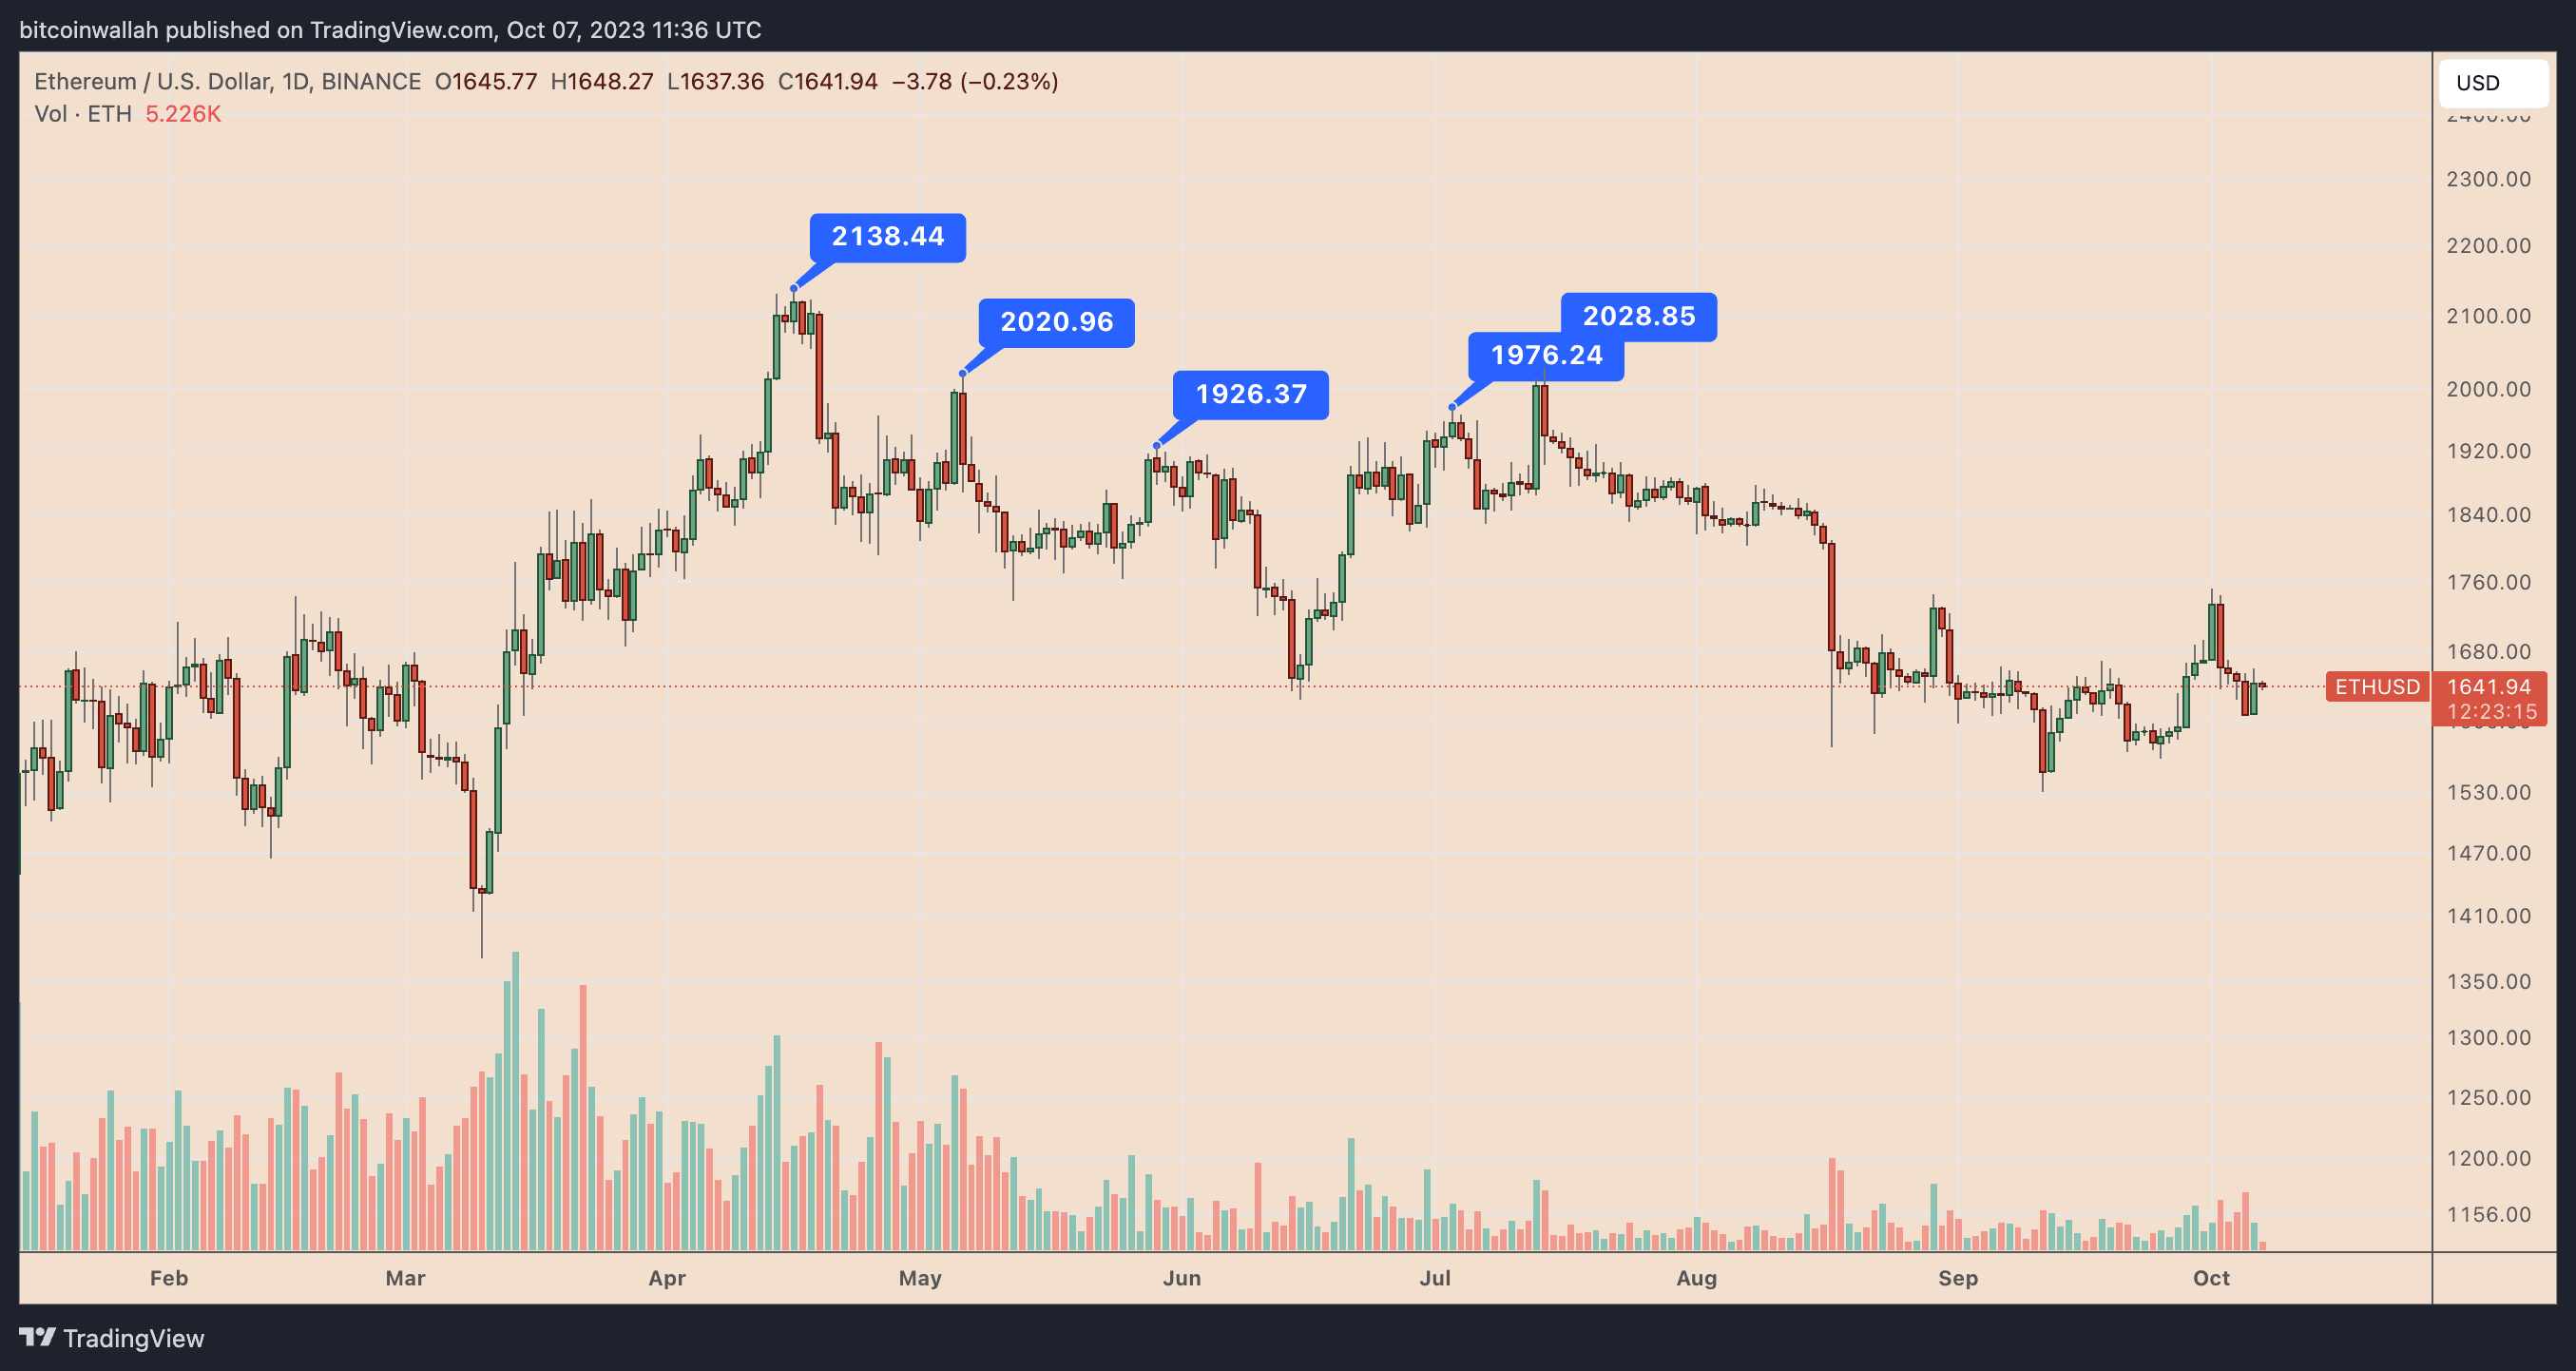 Daily ETH/USD price chart.
Let’s take a closer look at three possible reasons why the Ethereum price cannot decisively reclaim $2,000 from May 2022 onwards.
Ethereum price charts a fractal of a bearish cycle
Ethereum’s inability to break above $2,000 by 2023 would be similar to the bearish rejection near $425 in 2018-2019.
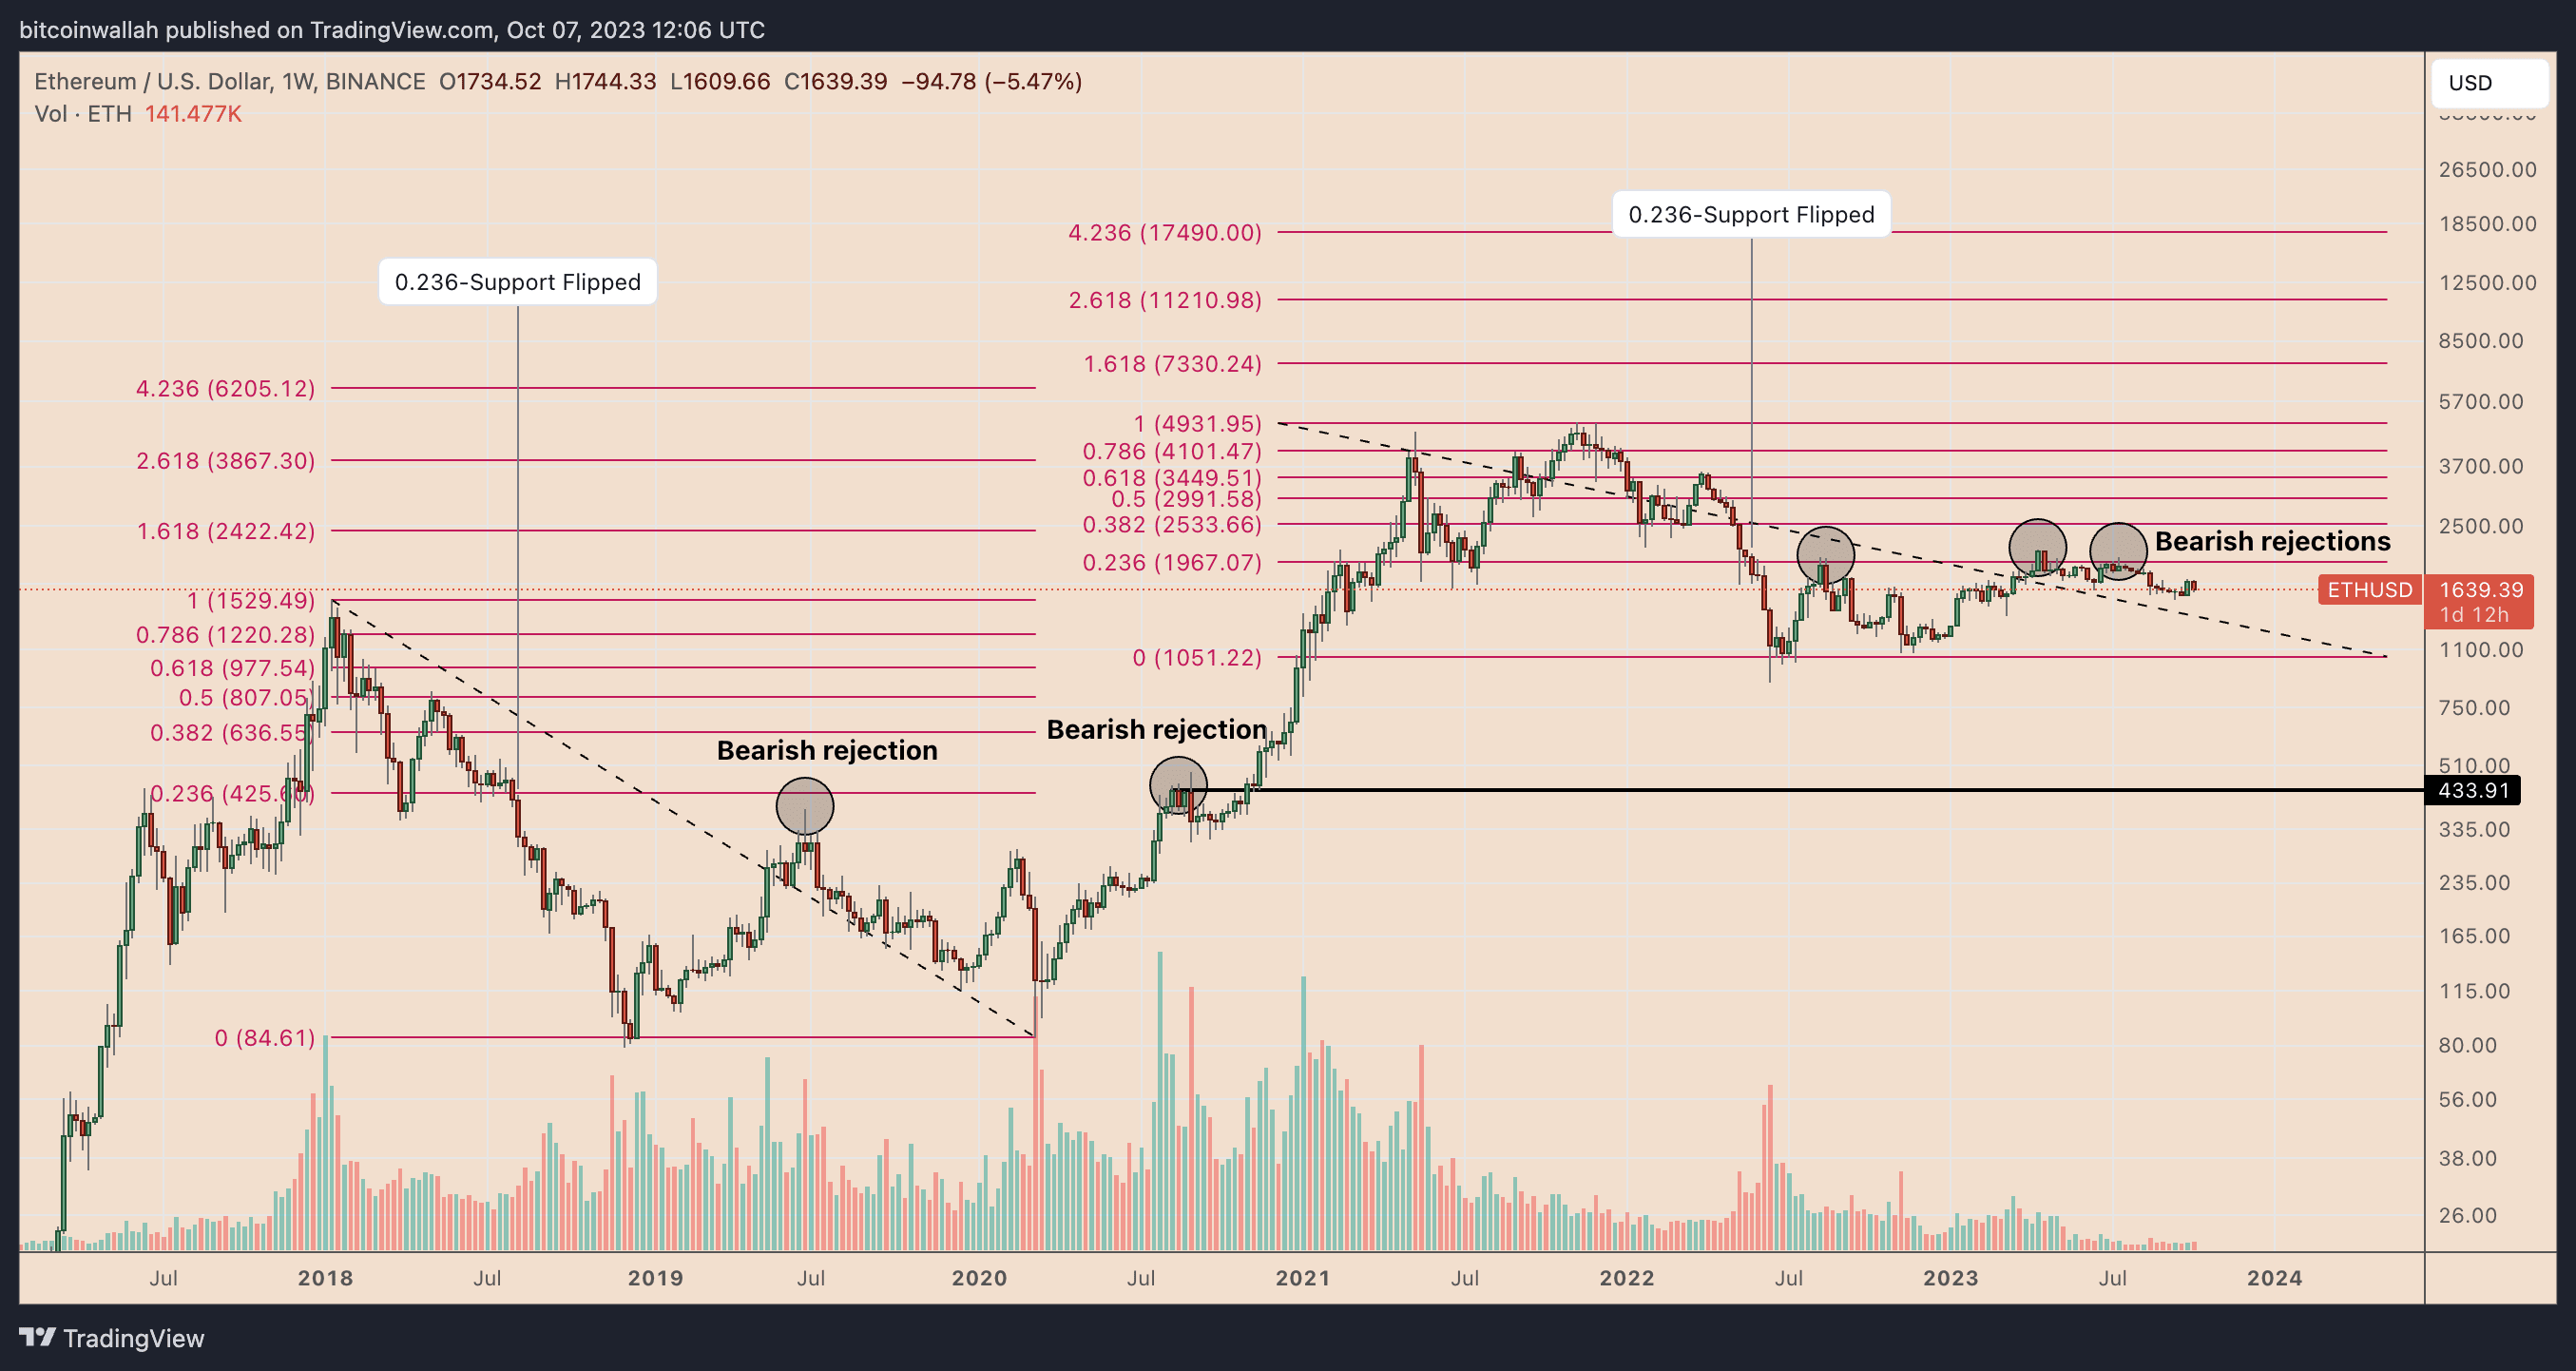 ETH/USD weekly price chart.
In both cases, Ether appears to be in a recovery phase while closing above the 0.236 Fib level on the Fibonacci retracement chart.
In 2018-2019, the 0.236 Fib line near $425 helped limit Ethereum’s recovery efforts. In 2023, this level will approach $2,000, which will once again become a selling zone, thus depressing ETH prices.
A stronger dollar
A rising U.S. dollar has reduced demand for Ethereum in recent months, reducing the likelihood of it closing above $2,000.
The prevailing negative correlation between major cryptocurrencies and the U.S. dollar is to blame. Notably, the weekly correlation coefficient between Ethereum and the U.S. Dollar Index (DXY) has been consistently negative in 2023, as shown in the chart below.
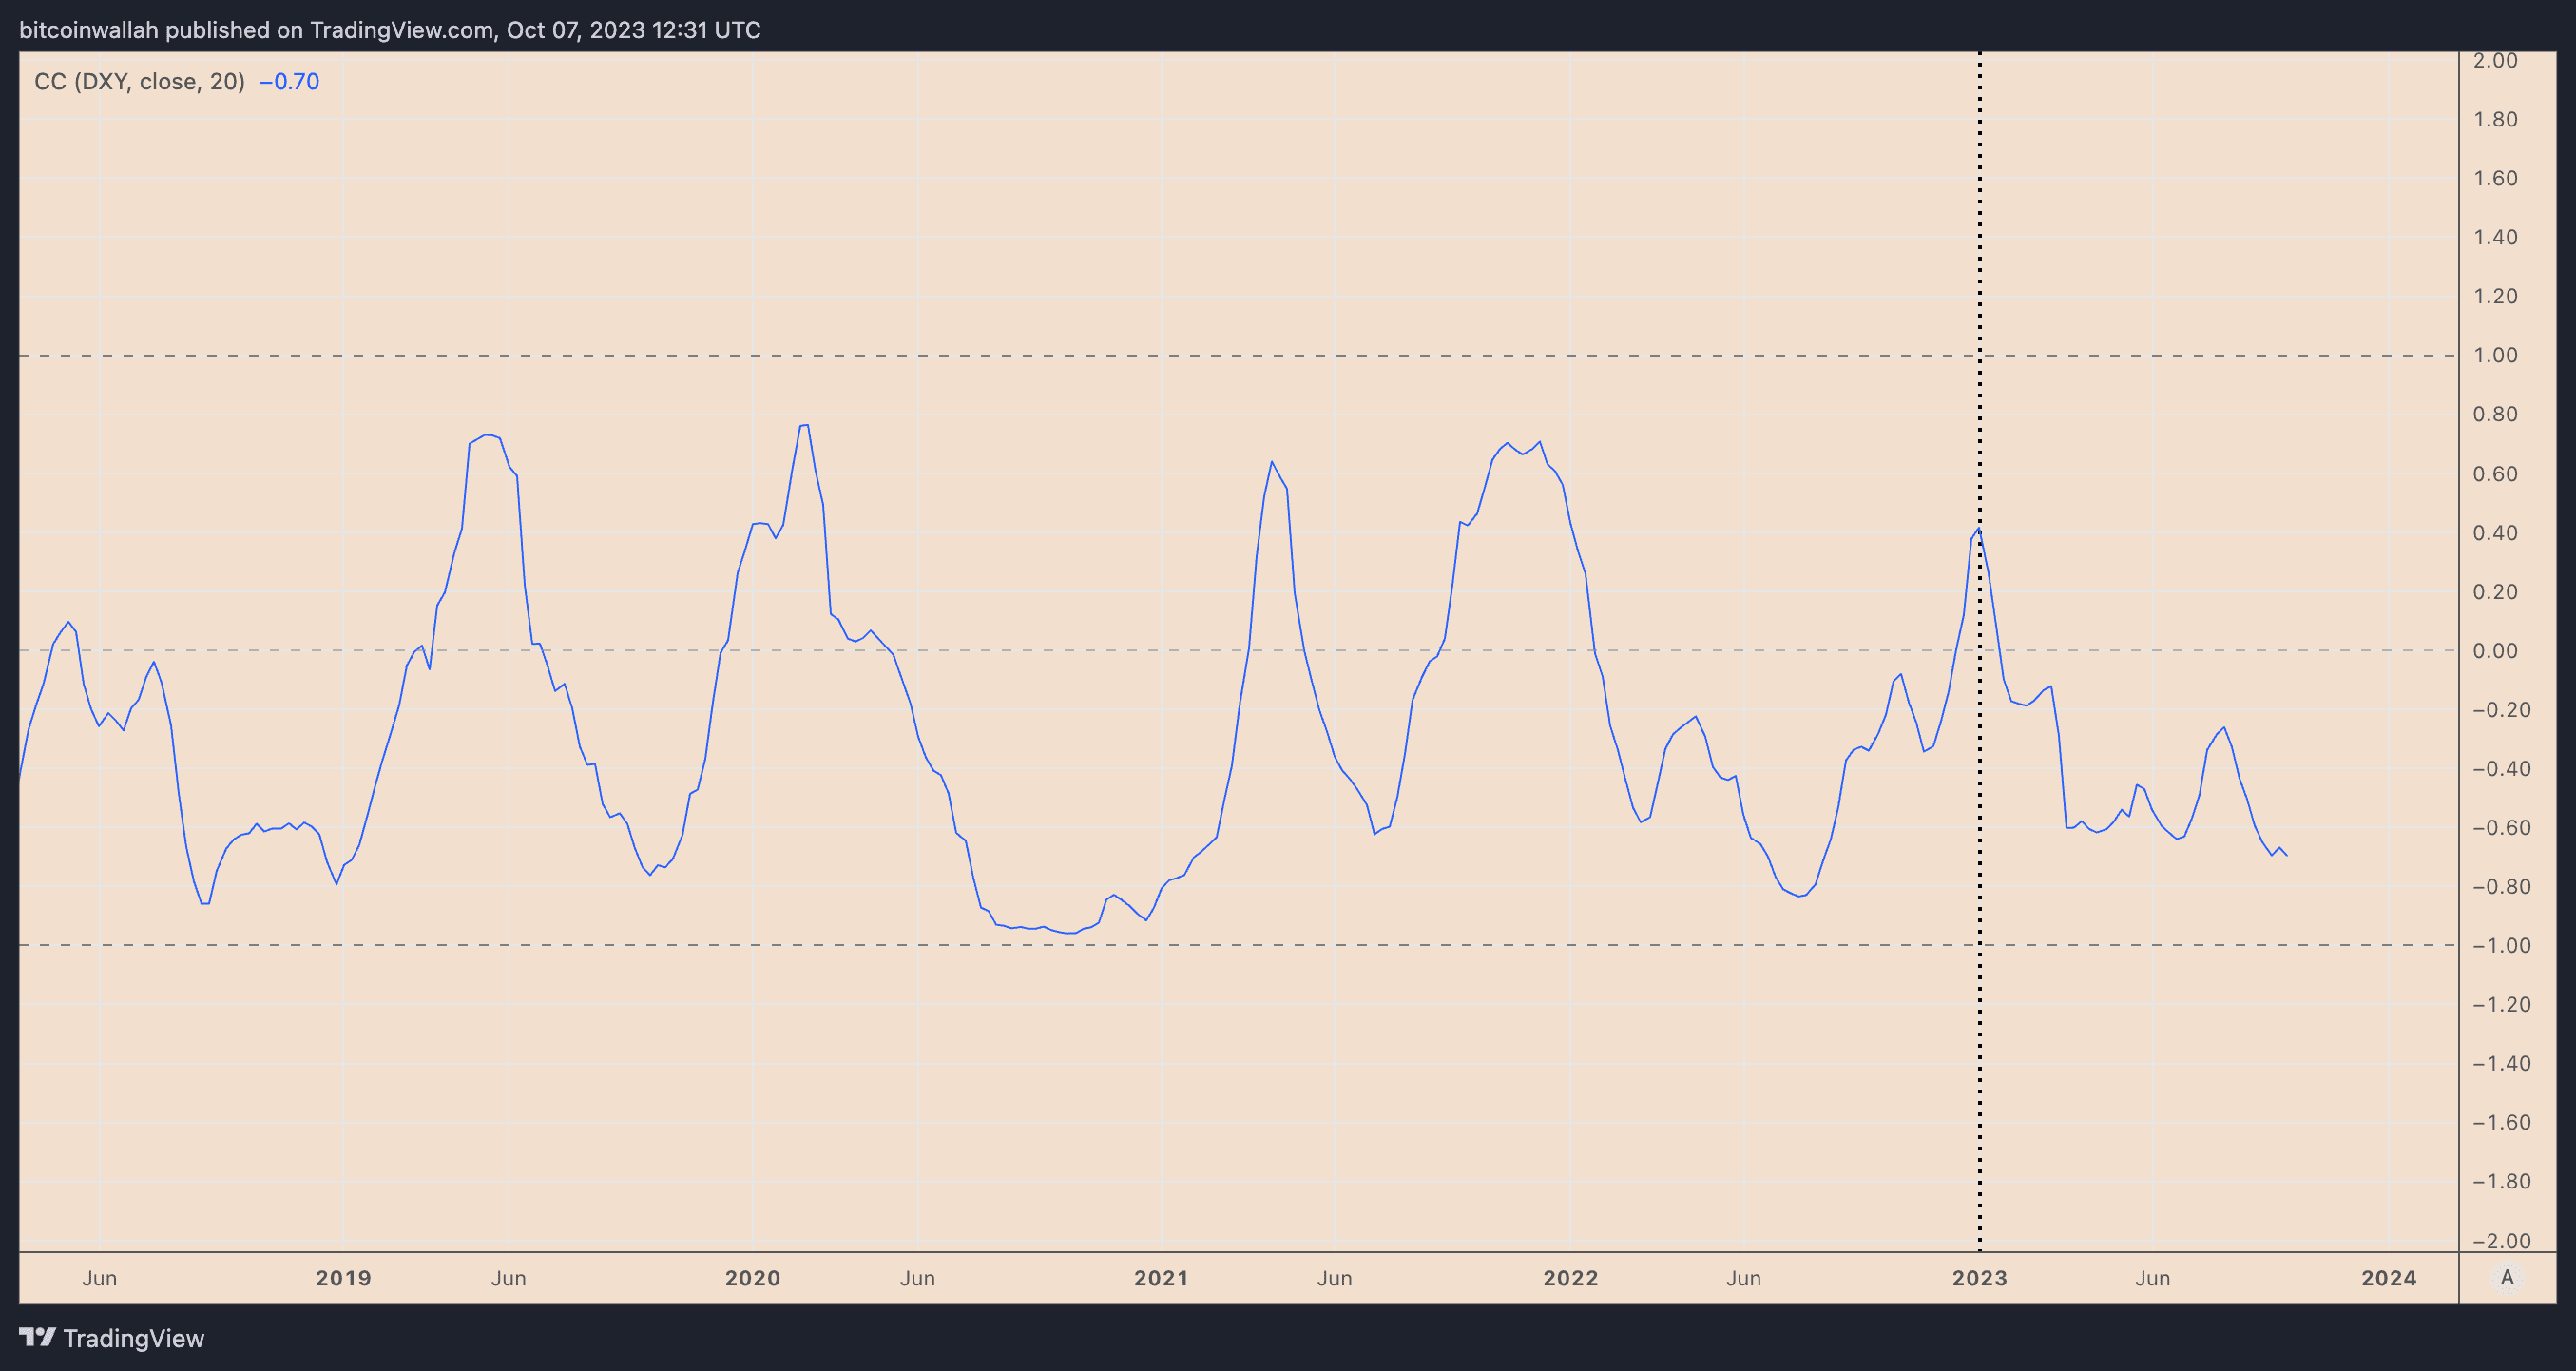 ETH/USD and DXY weekly correlation chart.
Meanwhile, Ethereum has largely underperformed Bitcoin in 2023, thanks to the continued hype surrounding Bitcoin spot ETFs. For example, the widely followed ETH/BTC pair is down 20% year to date.
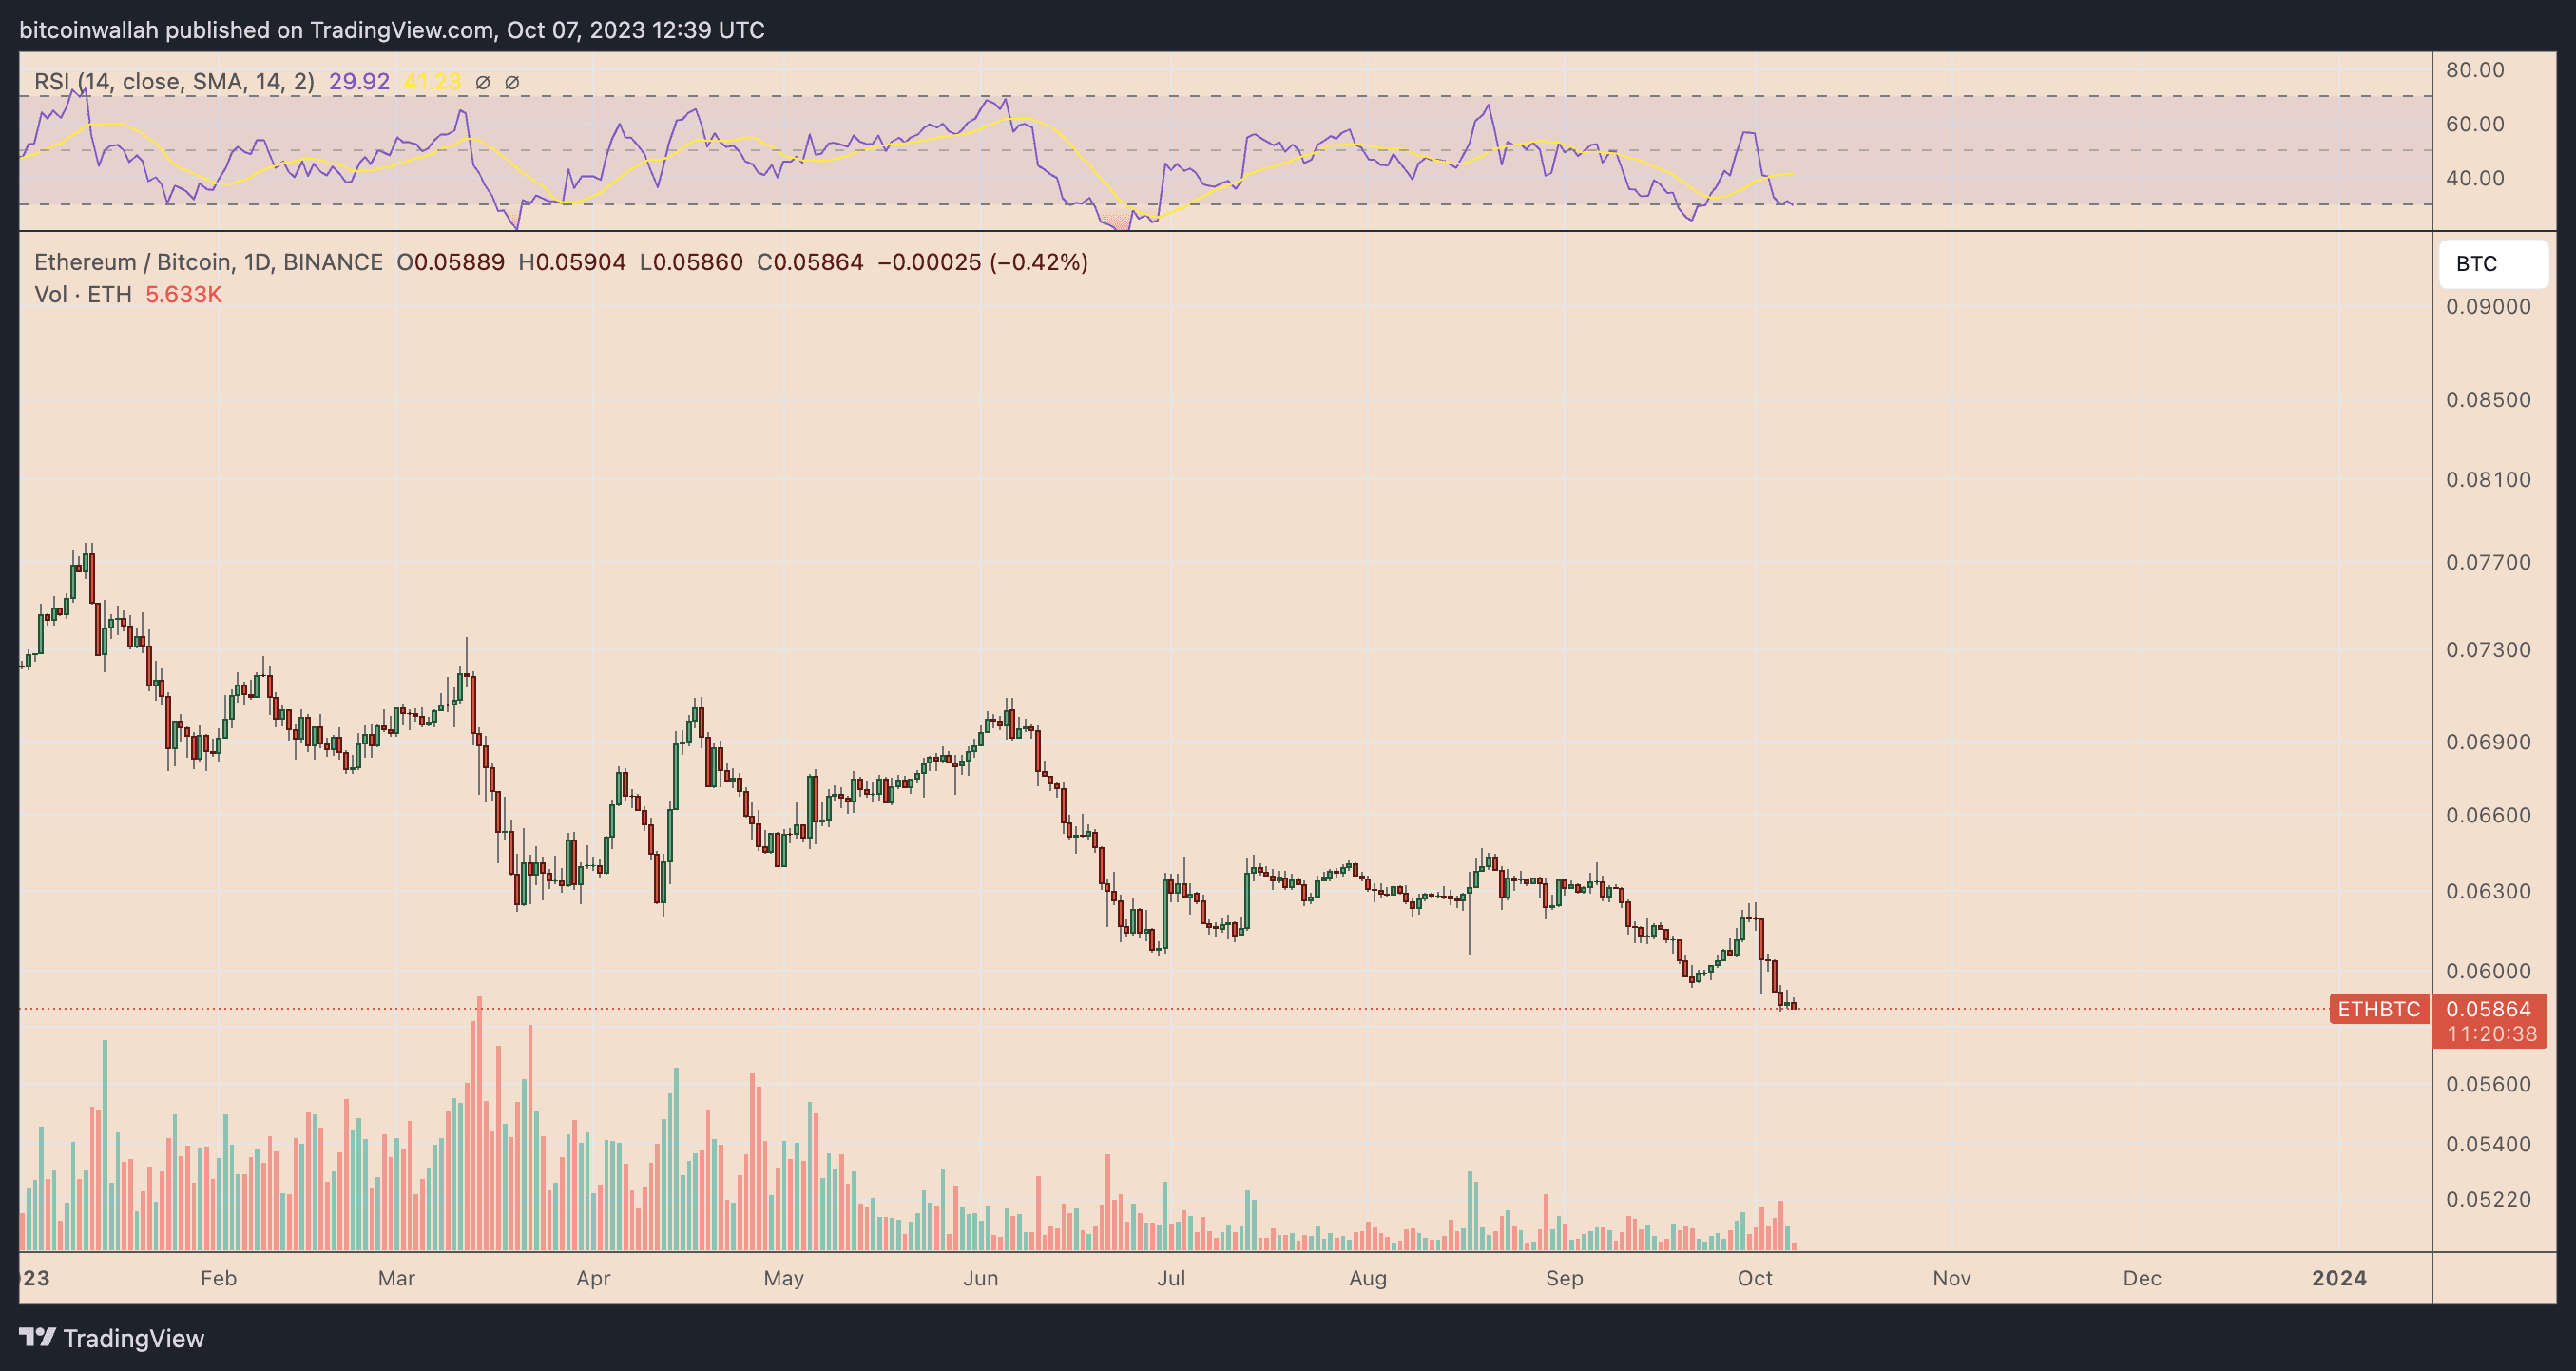 Daily ETH/BTC price chart.
Furthermore, according to the CoinShares weekly report, net capital held by Ethereum-related investment funds has fallen by $114 million by 2023. In contrast, Bitcoin-based funds attracted $168 million during the same period.
Ethereum network activity drops
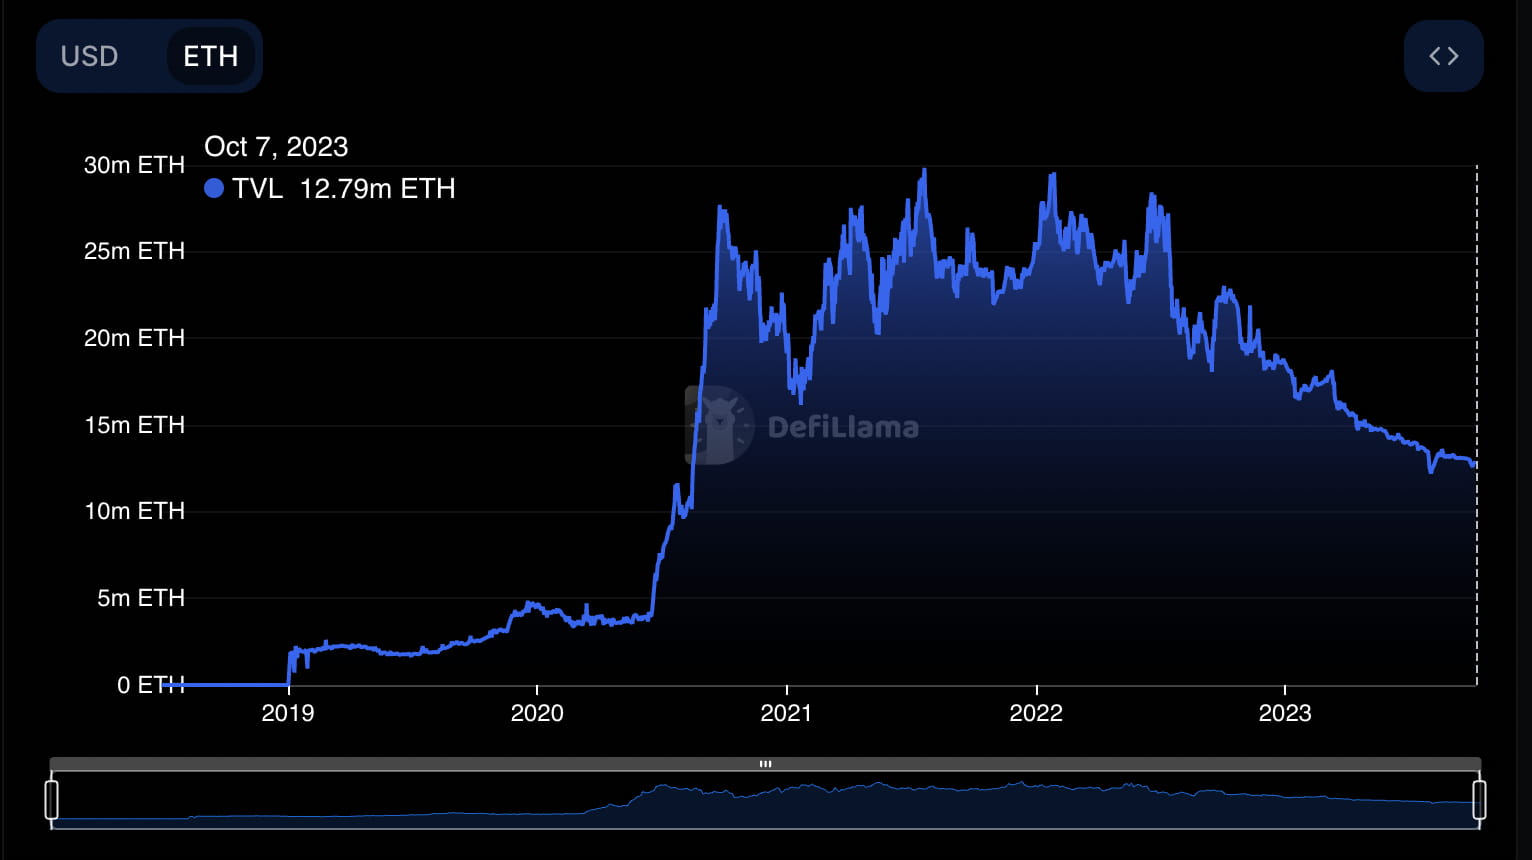
The total value locked (TVL) across the Ethereum ecosystem will decrease from 18.41 million ETH to 12.79 million ETH by 2023. As JPMorgan analysts also recently warned, this highlights a reduction in available capital, leading to lower profits for investors.
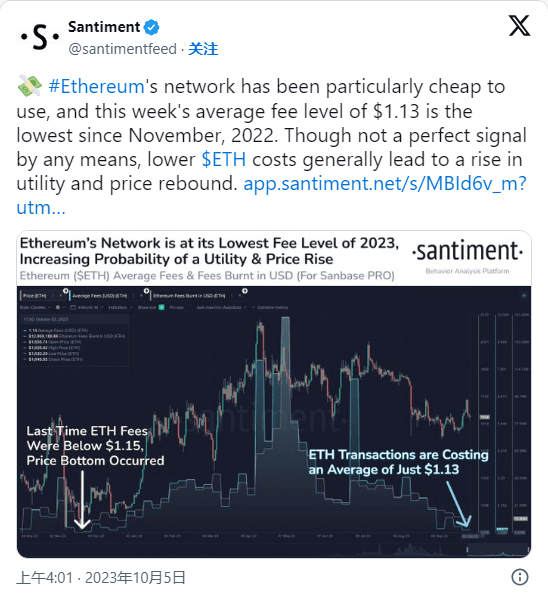
As TVL fell, Ethereum network gas fees also fell, reaching a year-low on October 5.
According to Dapp Radar, NFT transaction volume and Ethereum’s unique active wallets have also fallen by 30% and 16.5% respectively in the past 30 days.
These include drops in key metrics for popular applications including decentralized exchange Uniswap V2, DEX aggregator network 1inch, Ethereum staking provider Lido, and more.
Ethereum Technical Analysis
Meanwhile, technical indicators for Ethereum price suggest a possible recovery to the 50-day exponential moving average (50-EMA; red wave) near $1,665.
More broadly, however, ETH/USD is forming a bearish continuation pattern known as an ascending triangle.
Therefore, a break below the lower trendline of the triangle could lead to a drop to the maximum height of the pattern. In this case, ETH price could drop to $1,465 and $1,560 by October 2023, depending on the breakdown point.
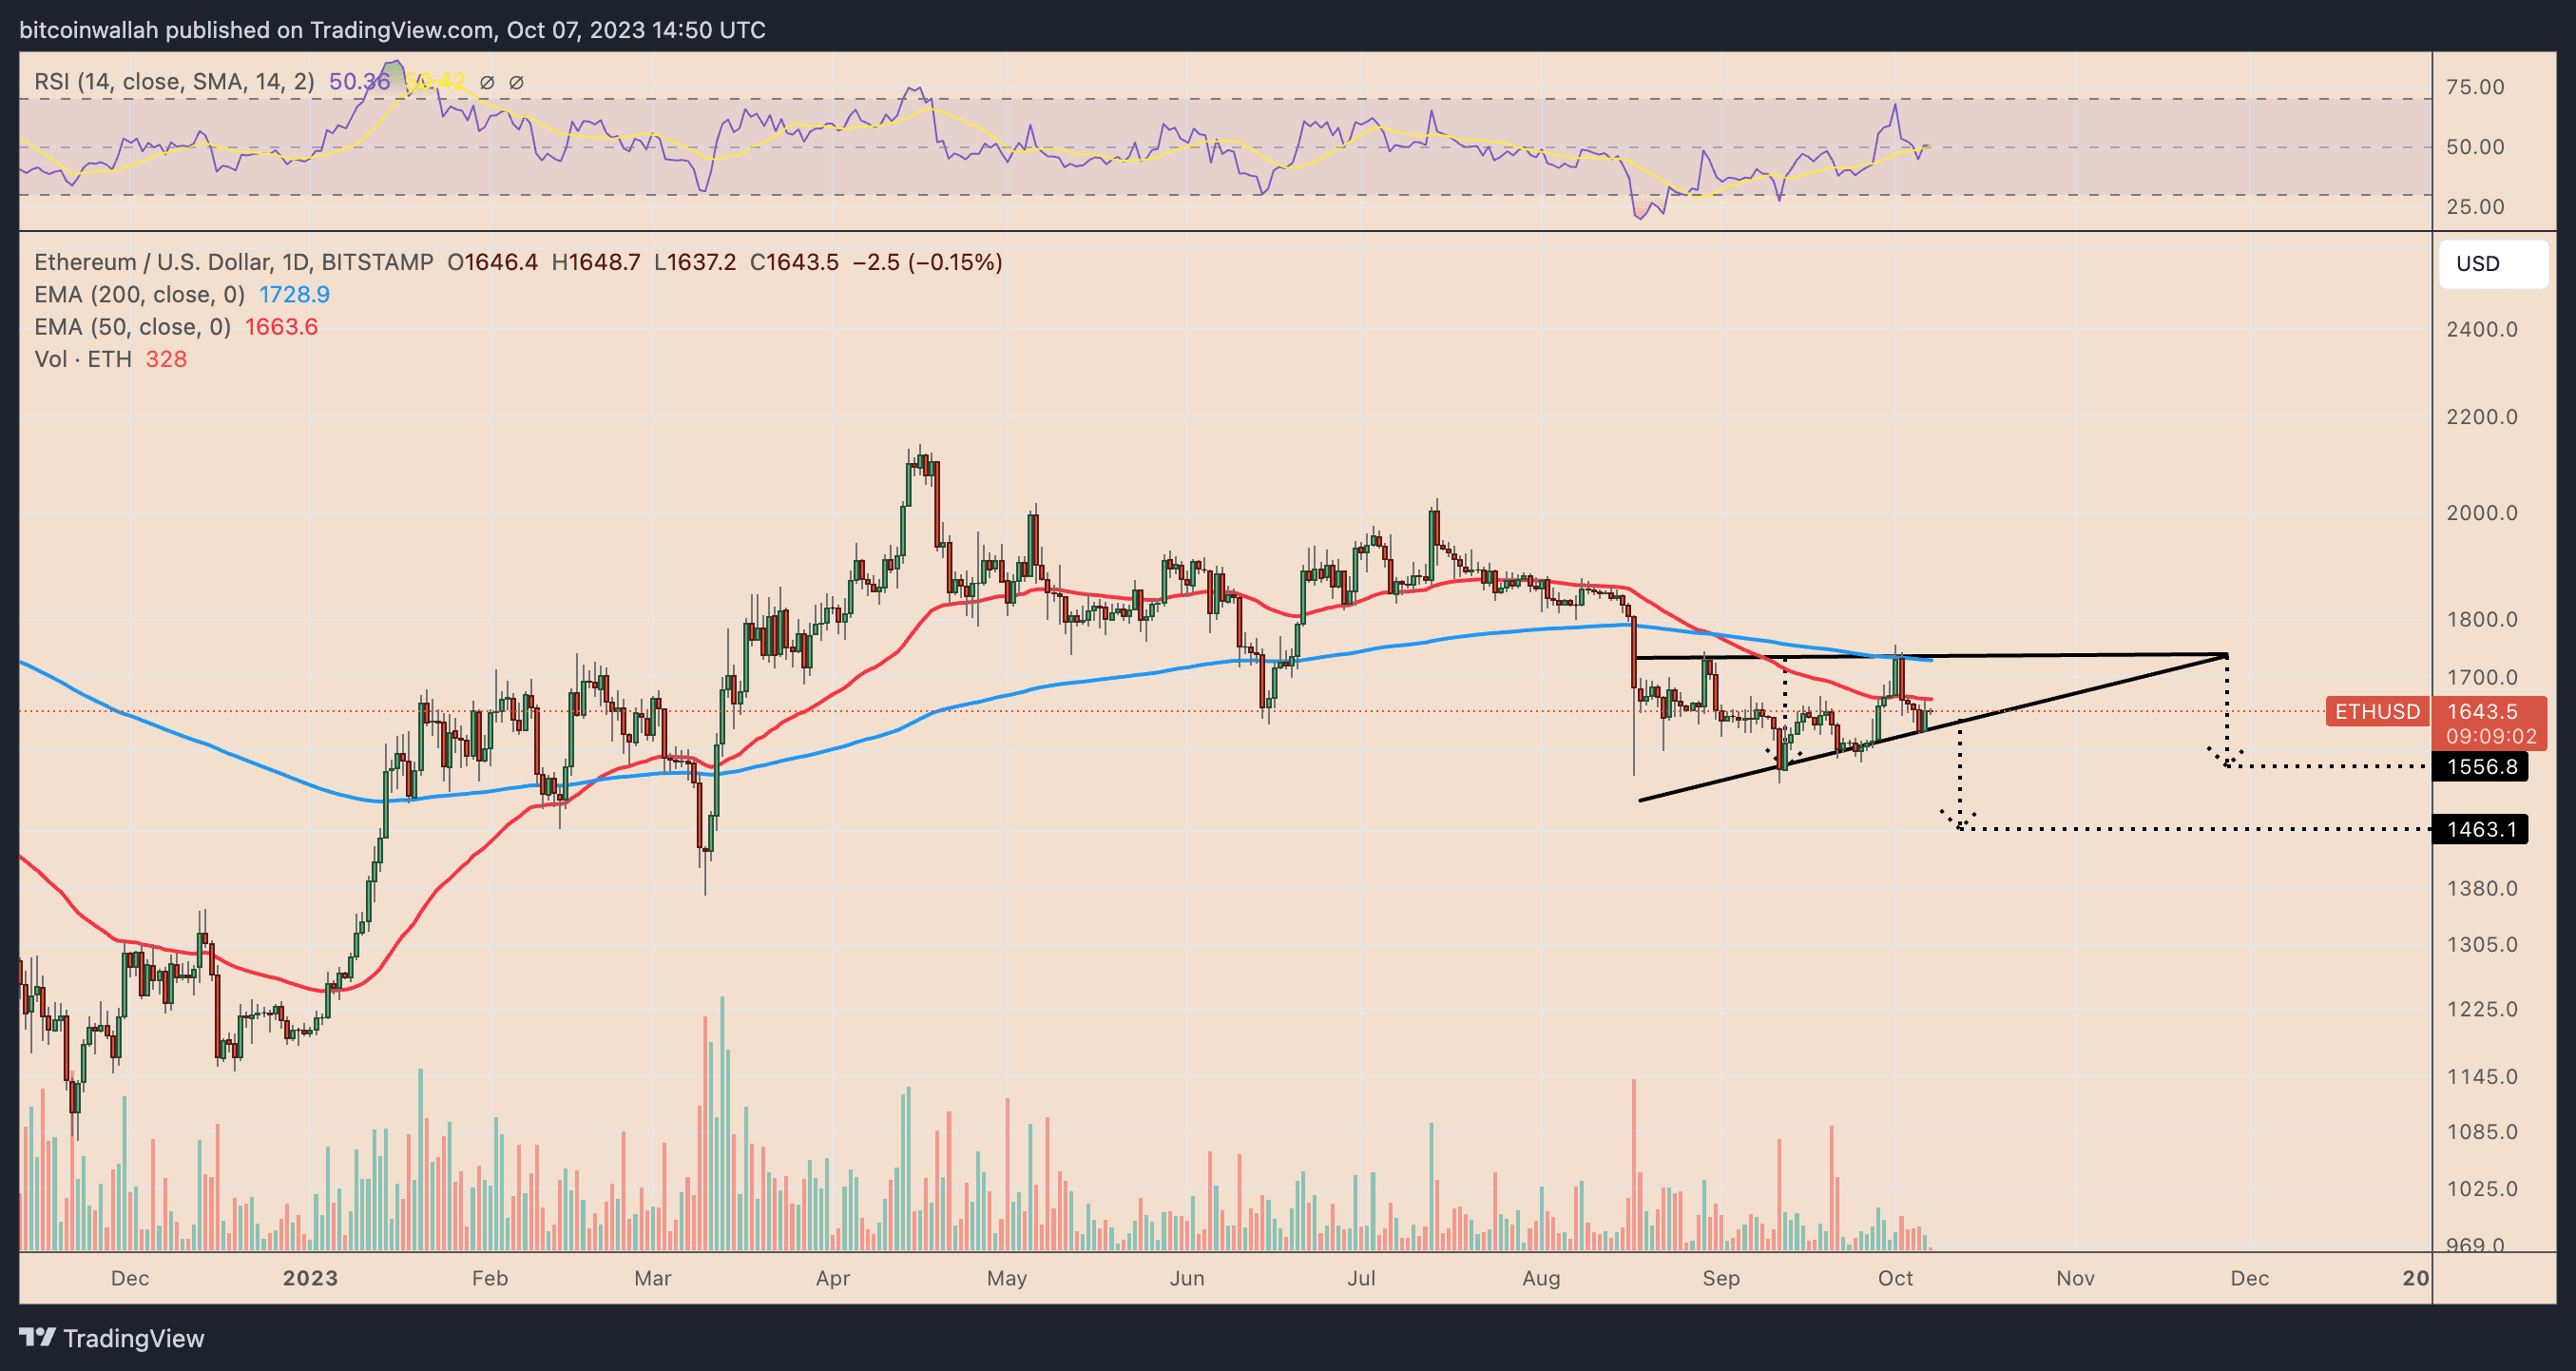 Daily ETH/USD price chart.
In the short term, a breakout above the 50-day MA could lead to a rally in ETH prices to the upper trendline of the triangle near $1,730 in October 2023, which coincides with the 200-day MA (blue wave).
#注意资金安全 #ETH #一起来跟单 #DeFiChallenge #美联储是否加息?
【Disclaimer】The market is risky, so be cautious when investing. This article does not constitute investment advice, and users should consider whether any opinions, views or conclusions in this article are suitable for their specific circumstances. Investing based on this information is at your own risk.