

#steem
steem
666,691 views
3,182 Discussing
Hot
Latest

·
--
$STEEM: Two days ago, shorts were paying 1.09%. Checking again the next day, shorts were still paying, but it was down to just 0.15%—that pressure had pretty much eased.
$BABY: Shorts were paying 0.29% at the time. The next day, shorts were still paying, but it was down to just 0.13%. I noticed the pressure had pretty much eased.
$MTL: Shorts had been paying 0.34%. The next day, shorts were still paying, but it had dropped to 0.017%. I kept an eye on it, and the pressure had basically subsided.
Funding rates are always moving. I keep track of each change, so when I look back a couple of days later, I can see just how much they’ve changed.
#STEEM #BABY #MTL #Funding Rate
Data is from publicly available market information and is for reference only.
$STEEM : Two days ago, shorts were paying 1.09%. Checking again the next day, shorts were still paying, but it was down to just 0.15%—that pressure had pretty much eased.
$BABY : Shorts were paying 0.29% at the time. The next day, shorts were still paying, but it was down to just 0.13%. I noticed the pressure had pretty much eased.
$MTL : Shorts had been paying 0.34%. The next day, shorts were still paying, but it had dropped to 0.017%. I kept an eye on it, and the pressure had basically subsided.
Funding rates are always moving. I keep track of each change, so when I look back a couple of days later, I can see just how much they’ve changed.
#STEEM #BABY #MTL #Funding Rate
Data is from publicly available market information and is for reference only.
265

·
--
STEEM: A STRONG STORY, BUT THE MARKET HASN'T PICKED A SIDE.
THE MARKET READ
0.04905 | 24H -24.45%
4H STRUCTURE: RANGE
1H CONFIRMATION: BEARISH
RELATIVE VOLUME: 0.98x
THE NARRATIVE
Steem: Steem is a cryptocurrency that rewards users for community building by posting and upvoting valuable content for others. Steem was inspired from the success of Reddit where the community helped enrich the shareholders.
MY VIEW — NEUTRAL
Neutral. The narrative may attract attention, but price structure has not yet shown which side is in control.
WHAT WOULD CONFIRM IT
Technical confirmation is weak: wait for cleaner structure and stronger participation before drawing a firm conclusion.
This is narrative analysis, not a trade signal. Verify current market data and project claims before acting.
#STEEM #Crypto #MarketStructure
71

·
--
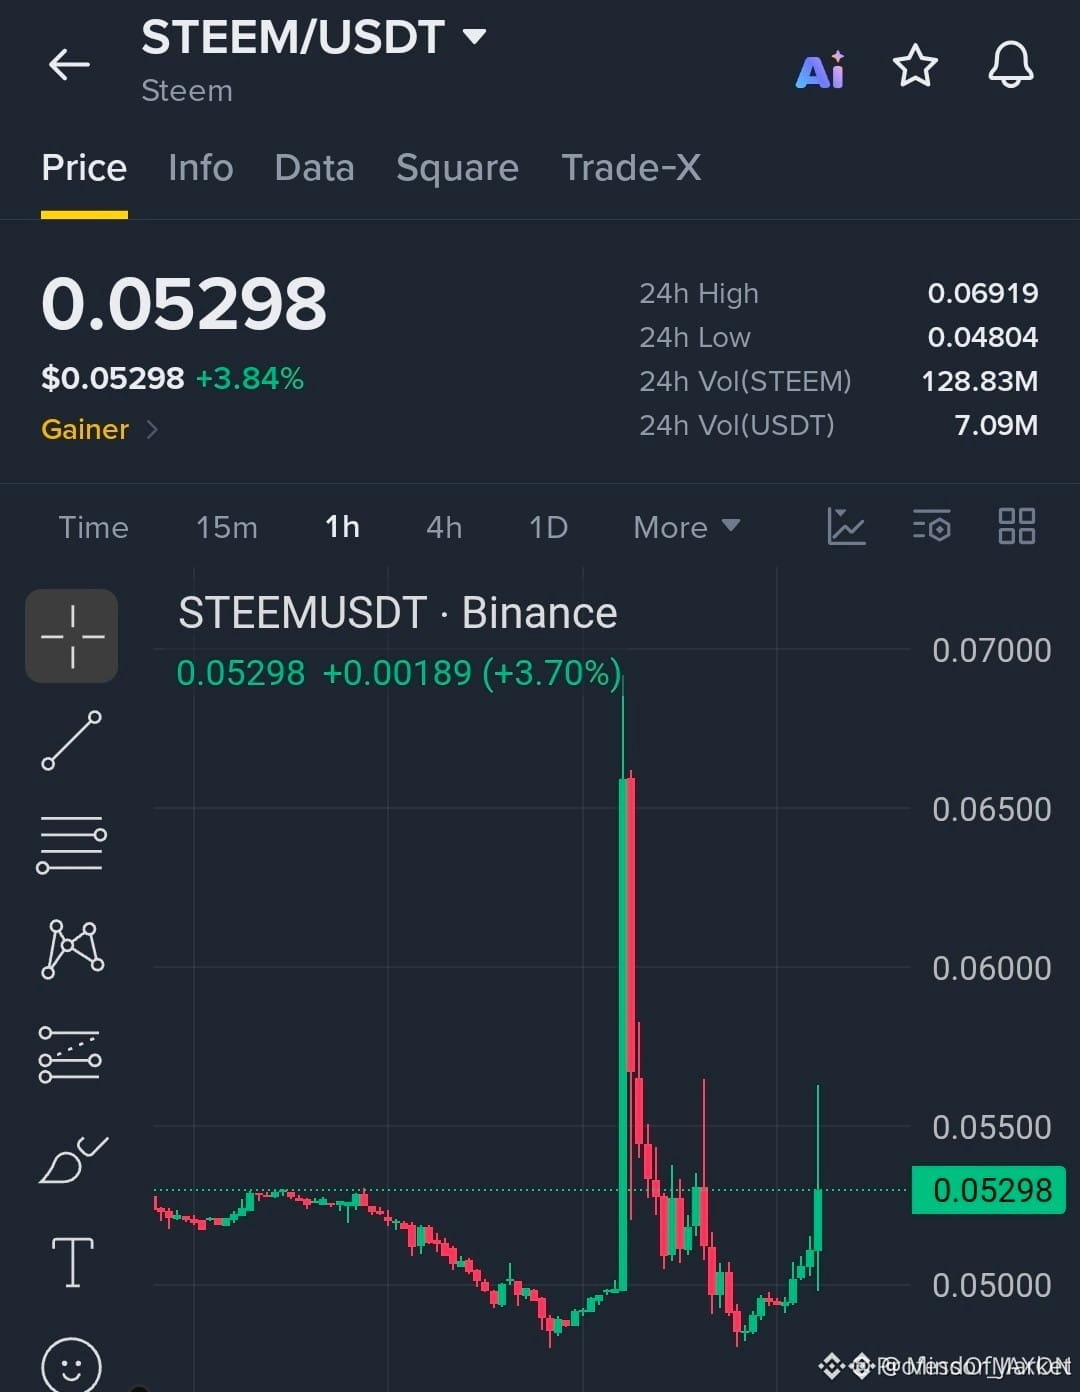
🚨 $STEEM REBOUND TARGETING $0.05500 – BULLISH SWEEP IN PLAY! 💥
Entry: 0.05200-0.05300 ⚡
Target: 0.05400 🚀
Stop Loss: 0.05000 ⚠️
📊 Fresh bullish pressure is swallowing the $0.04900 demand zone, turning it into a springboard for higher highs. 🦈 The order block between 0.05200‑0.05300 has already absorbed three aggressive sell‑offs, hinting that smart money is re‑allocating liquidity upward. ⚡ A decisive close above 0.05300 would unlock the next resistance cluster near 0.05500, while a slip back under 0.05000 would invalidate the recovery narrative. 📌 Expect volume to expand on the 4‑hour chart as institutions chase the remaining upside. 💬 Are you ready to ride the next liquidity wave? 👇
⚠️ Not financial advice. Always manage your risk. 🛡️
🏷️ #STEEM #LongSetup #Recovery #Crypto
🔥 💎
93

·
--
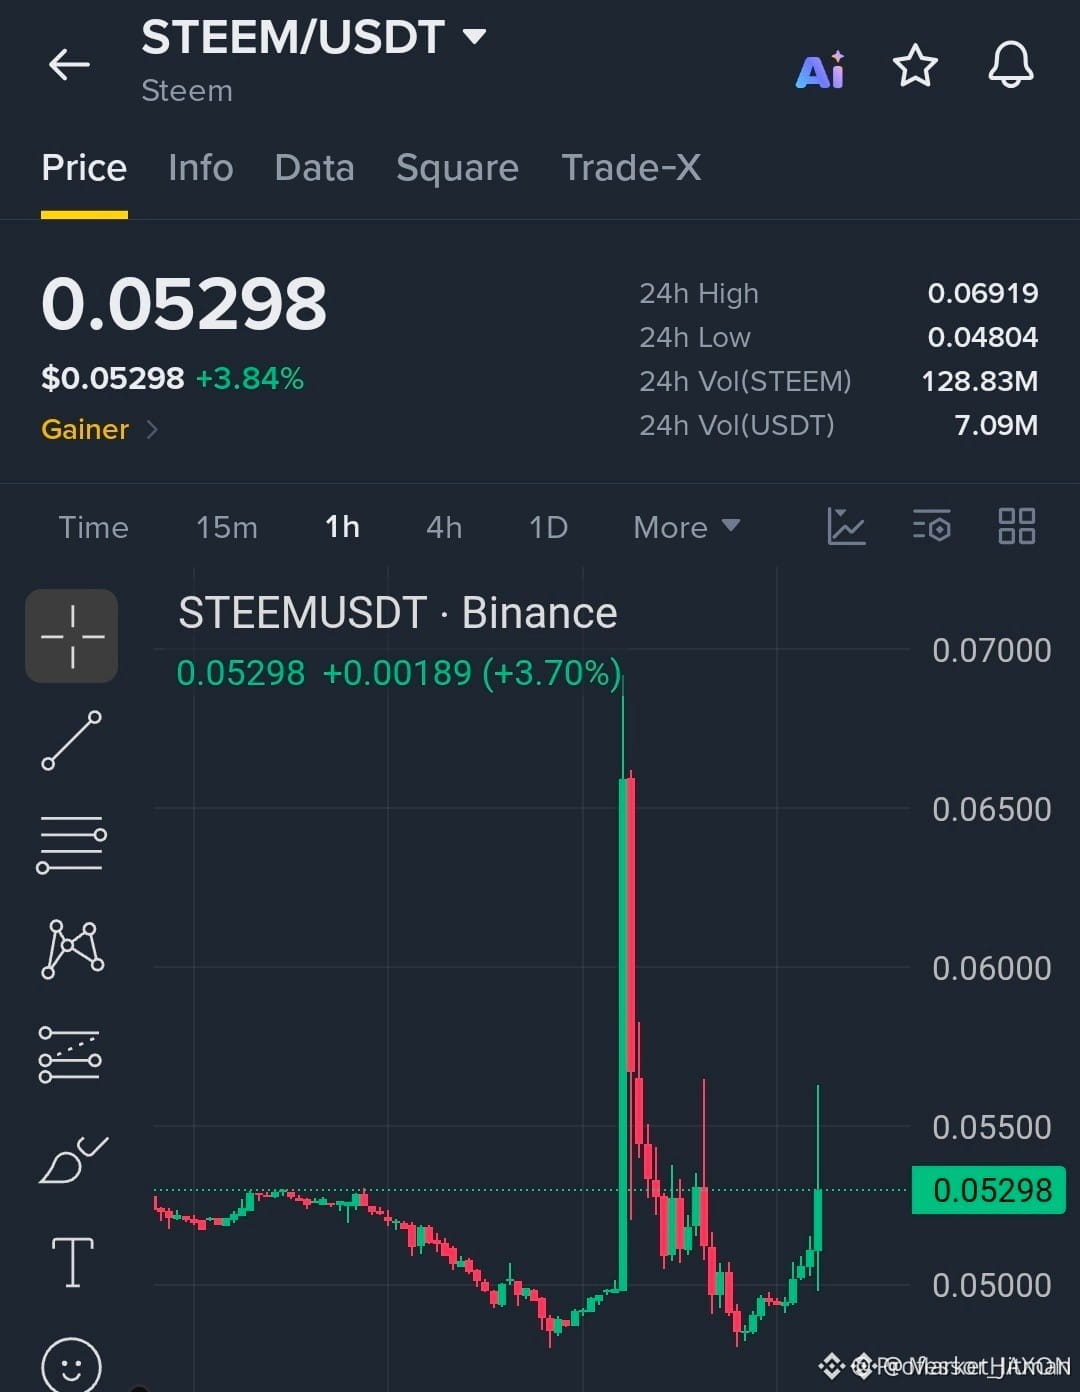
🚀 $STEEM SURGES FROM SUPPORT, AIMING FOR $0.05500 BREAKOUT! 🟢
Entry: 0.0525 ⚡
Target: 0.05400 🚀
Target: 0.05550 🚀
Target: 0.05700 🚀
Stop Loss: 0.05000 ⚠️
📊 Fresh bullish pressure snapped the sell‑off after the $0.04900 floor absorbed heavy liquidity. Buyers are now loading the order block between 0.0520‑0.0530, and every uptick is carving out a tighter supply wall. 🌊 A clean close above 0.0530 would unleash a wave toward the next resistance cluster at $0.0555, with the next leg eyeing $0.0570 if volume stays aggressive. ⚡
💬 Who’s ready to ride the recovery swing before the next liquidity sweep? 👇
⚠️ Not financial advice. Always manage your risk. 🛡️
🏷️ #STEEM #LongSetup #Recovery #Crypto
🔥 💎
31

·
--
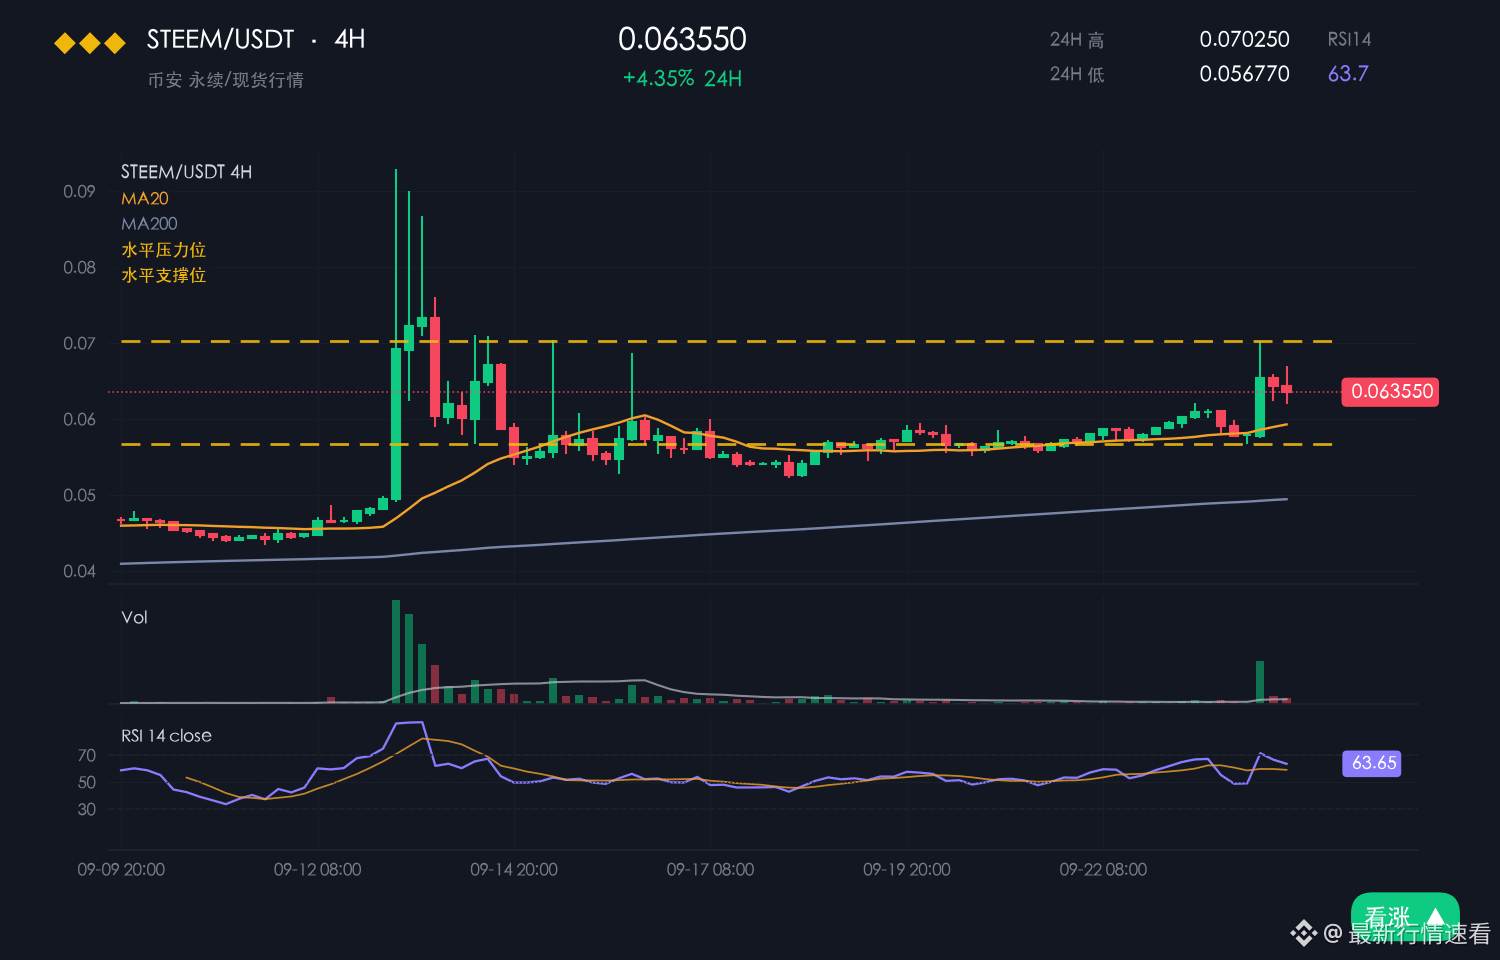
STEEM is currently at 0.0485, down 12.31% in 24 hours and still down 6.95% over 7 days. The intraday range is 0.0478–0.0565, with an amplitude of 18.2%.
【Market】
A signal shared across coins: major coins are moving more and more in sync.
Among these major coins, STEEM is in the weaker group.
STEEM trended lower throughout the day, from 0.0478 to 0.0565, and its rebound was clearly unsupported by volume.
The 0.0478 support level has not been tested with real buying pressure, so confidence is low.
The broader market was down 1.52% over the same period, while STEEM fell 12.31%, underperforming the market average.
【Macro】 U.S. stocks fell overnight: Nasdaq -1.88%, S&P 500 -1.11% (close on 2026-10-14). Spot BTC ETFs have seen net outflows of about $45.2 billion this month, U.S. CPI came in above expectations at 3.7% year over year, and the probability of a rate hike at the 2026-10-27/28 meeting is around 47%. Spot BTC ETFs have seen net outflows of about $45.2 billion this month, as institutional buying has cooled.
The short-term outlook leans bearish.
【Bearish reasons】
With the same range width, STEEM has the widest amplitude among major coins, at 18.2%.
The 12.31% drop over 24 hours speaks for itself: sellers have the upper hand in the short term.
Stay patient until the direction becomes clear; the outlier is often the first to turn.
A 12.31% drop doesn’t mean it has bottomed. Check volume before looking for buying support.
$STEEM #STEEM
94

·
--
$STEEM
$STEEM Funding rate: -0.138%, shorts pay. Trading sideways in a range, with resistance at the top and support at the bottom—sell high and buy low. Tap $STEEM to see how many people are lined up waiting to buy in #STEEM #FundingRate
$STEEM
$STEEM Funding rate: -0.138%, shorts pay. Trading sideways in a range, with resistance at the top and support at the bottom—sell high and buy low. Tap $STEEM to see how many people are lined up waiting to buy in #STEEM #FundingRate
$STEEM Funding rate: -0.138%, shorts pay. Trading sideways in a range, with resistance at the top and support at the bottom—sell high and buy low. Tap $STEEM to see how many people are lined up waiting to buy in #STEEM #FundingRate
11


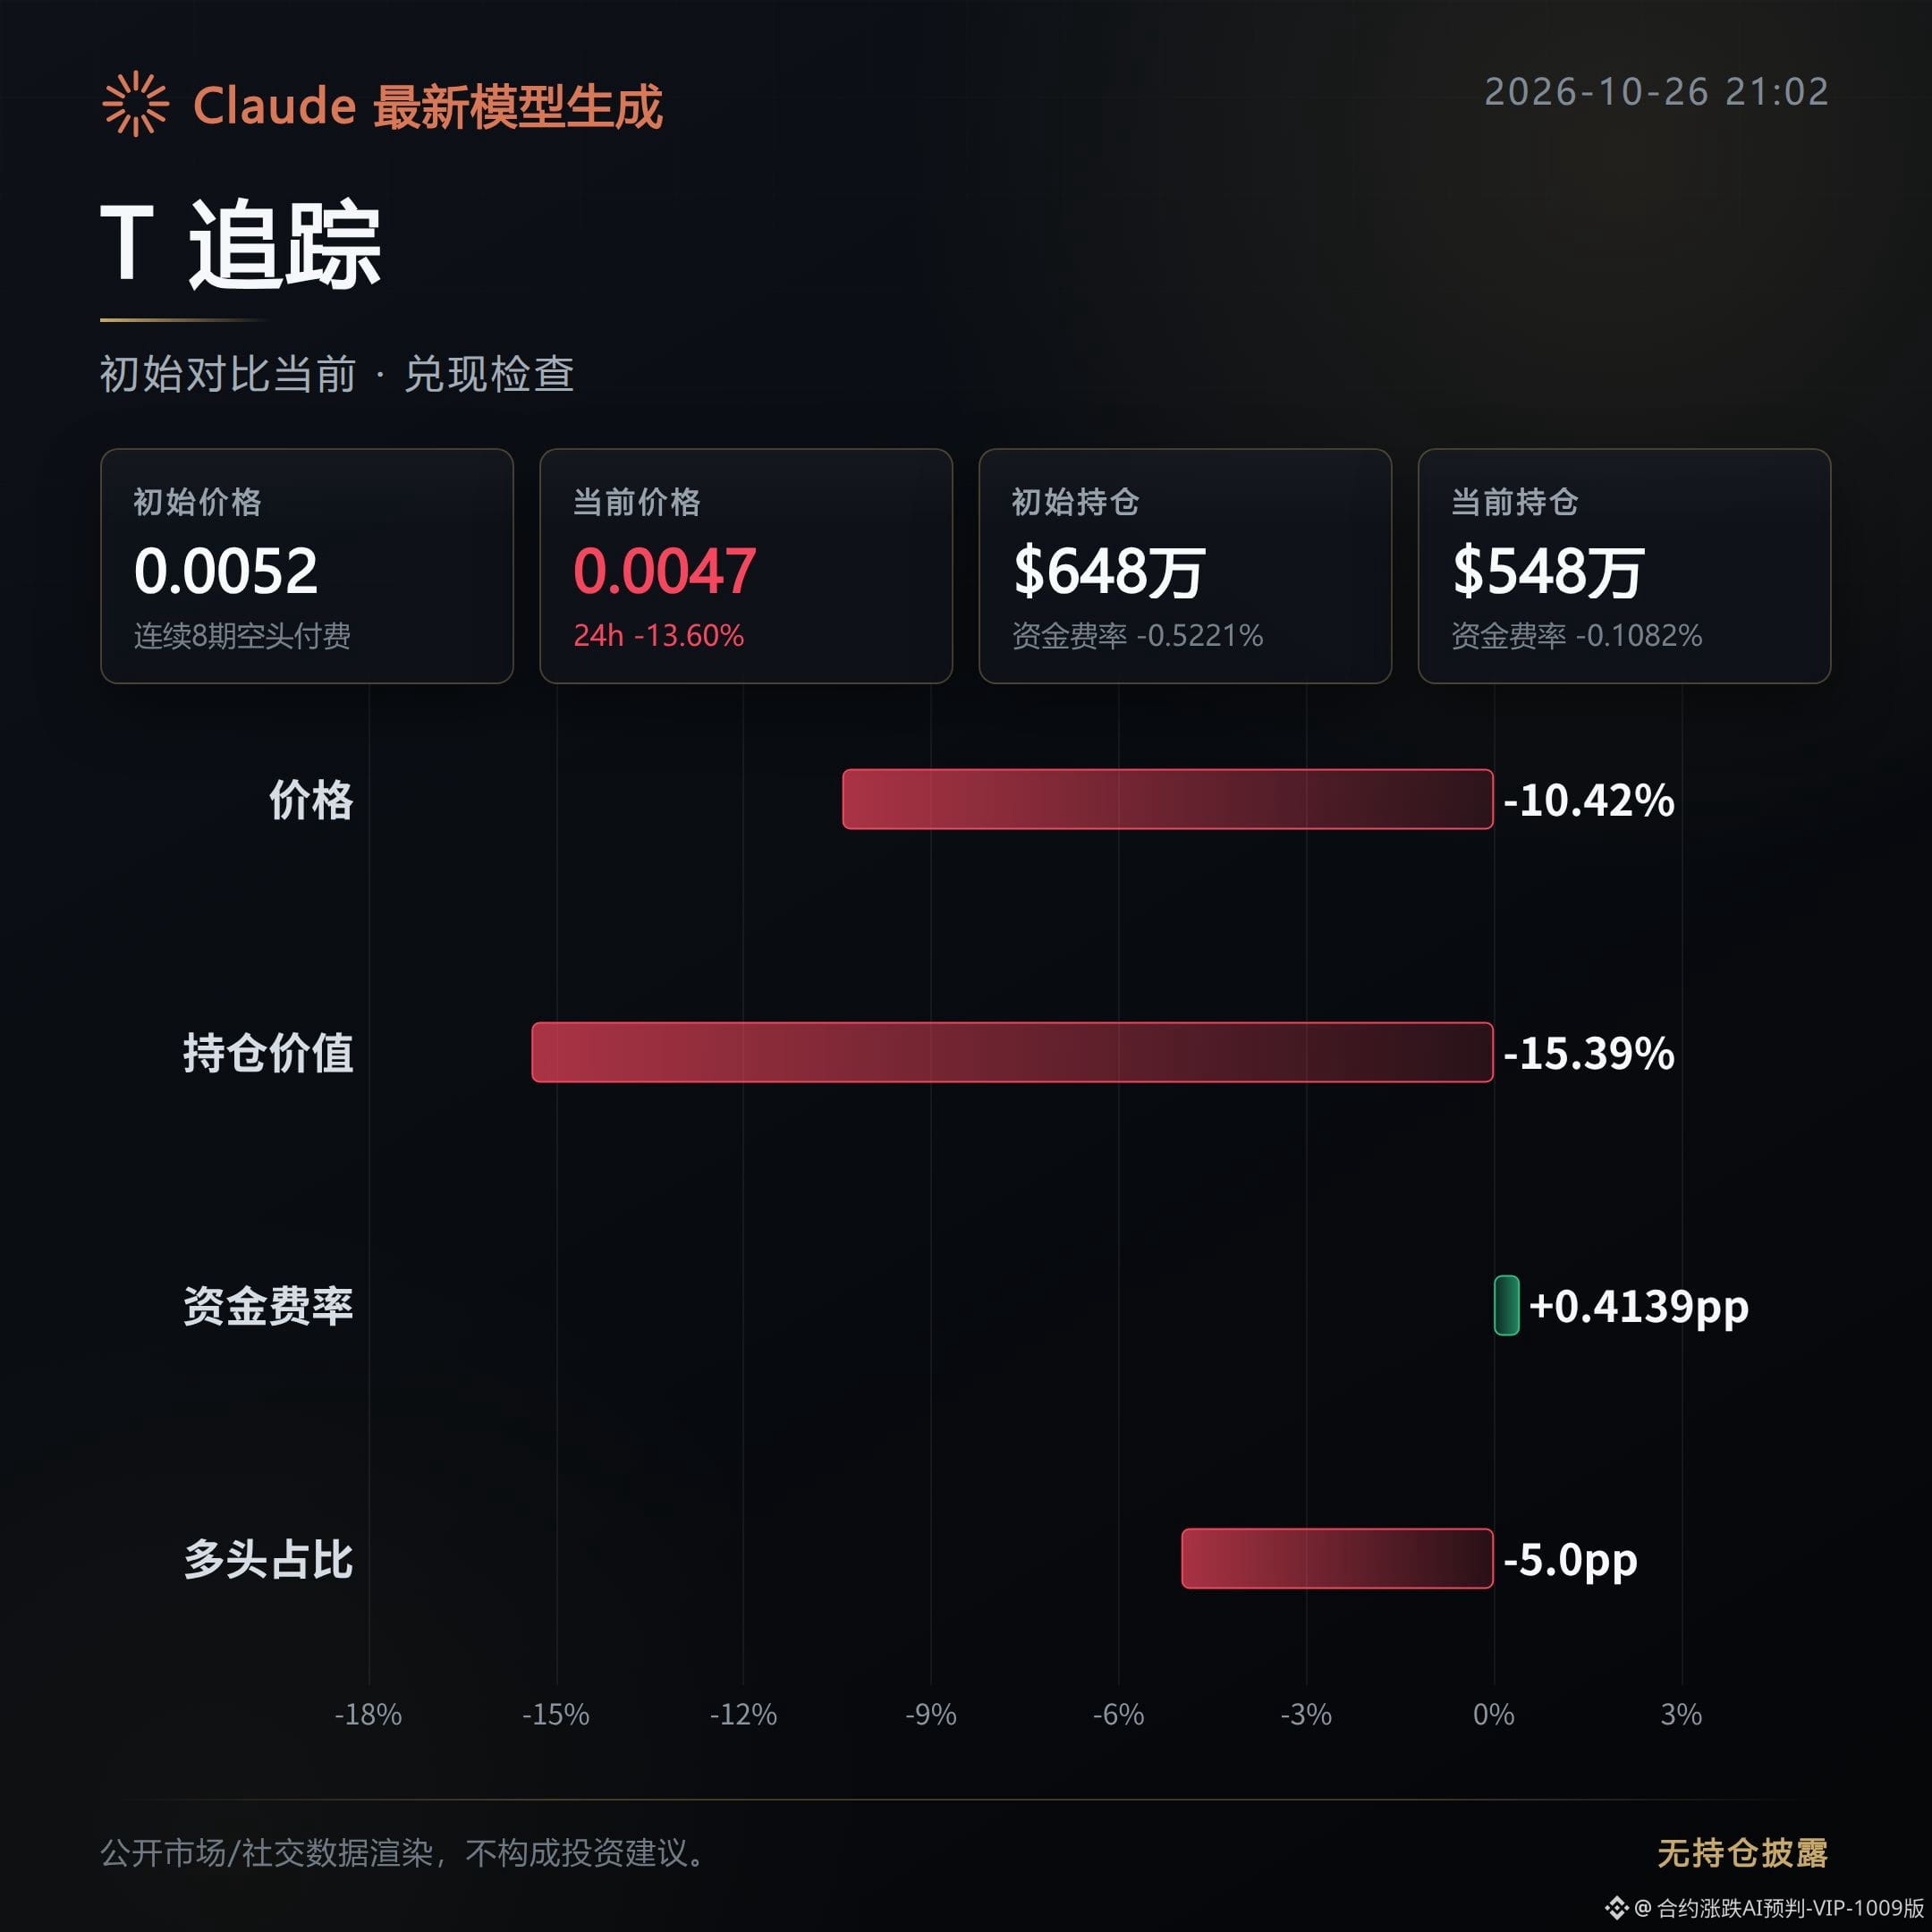
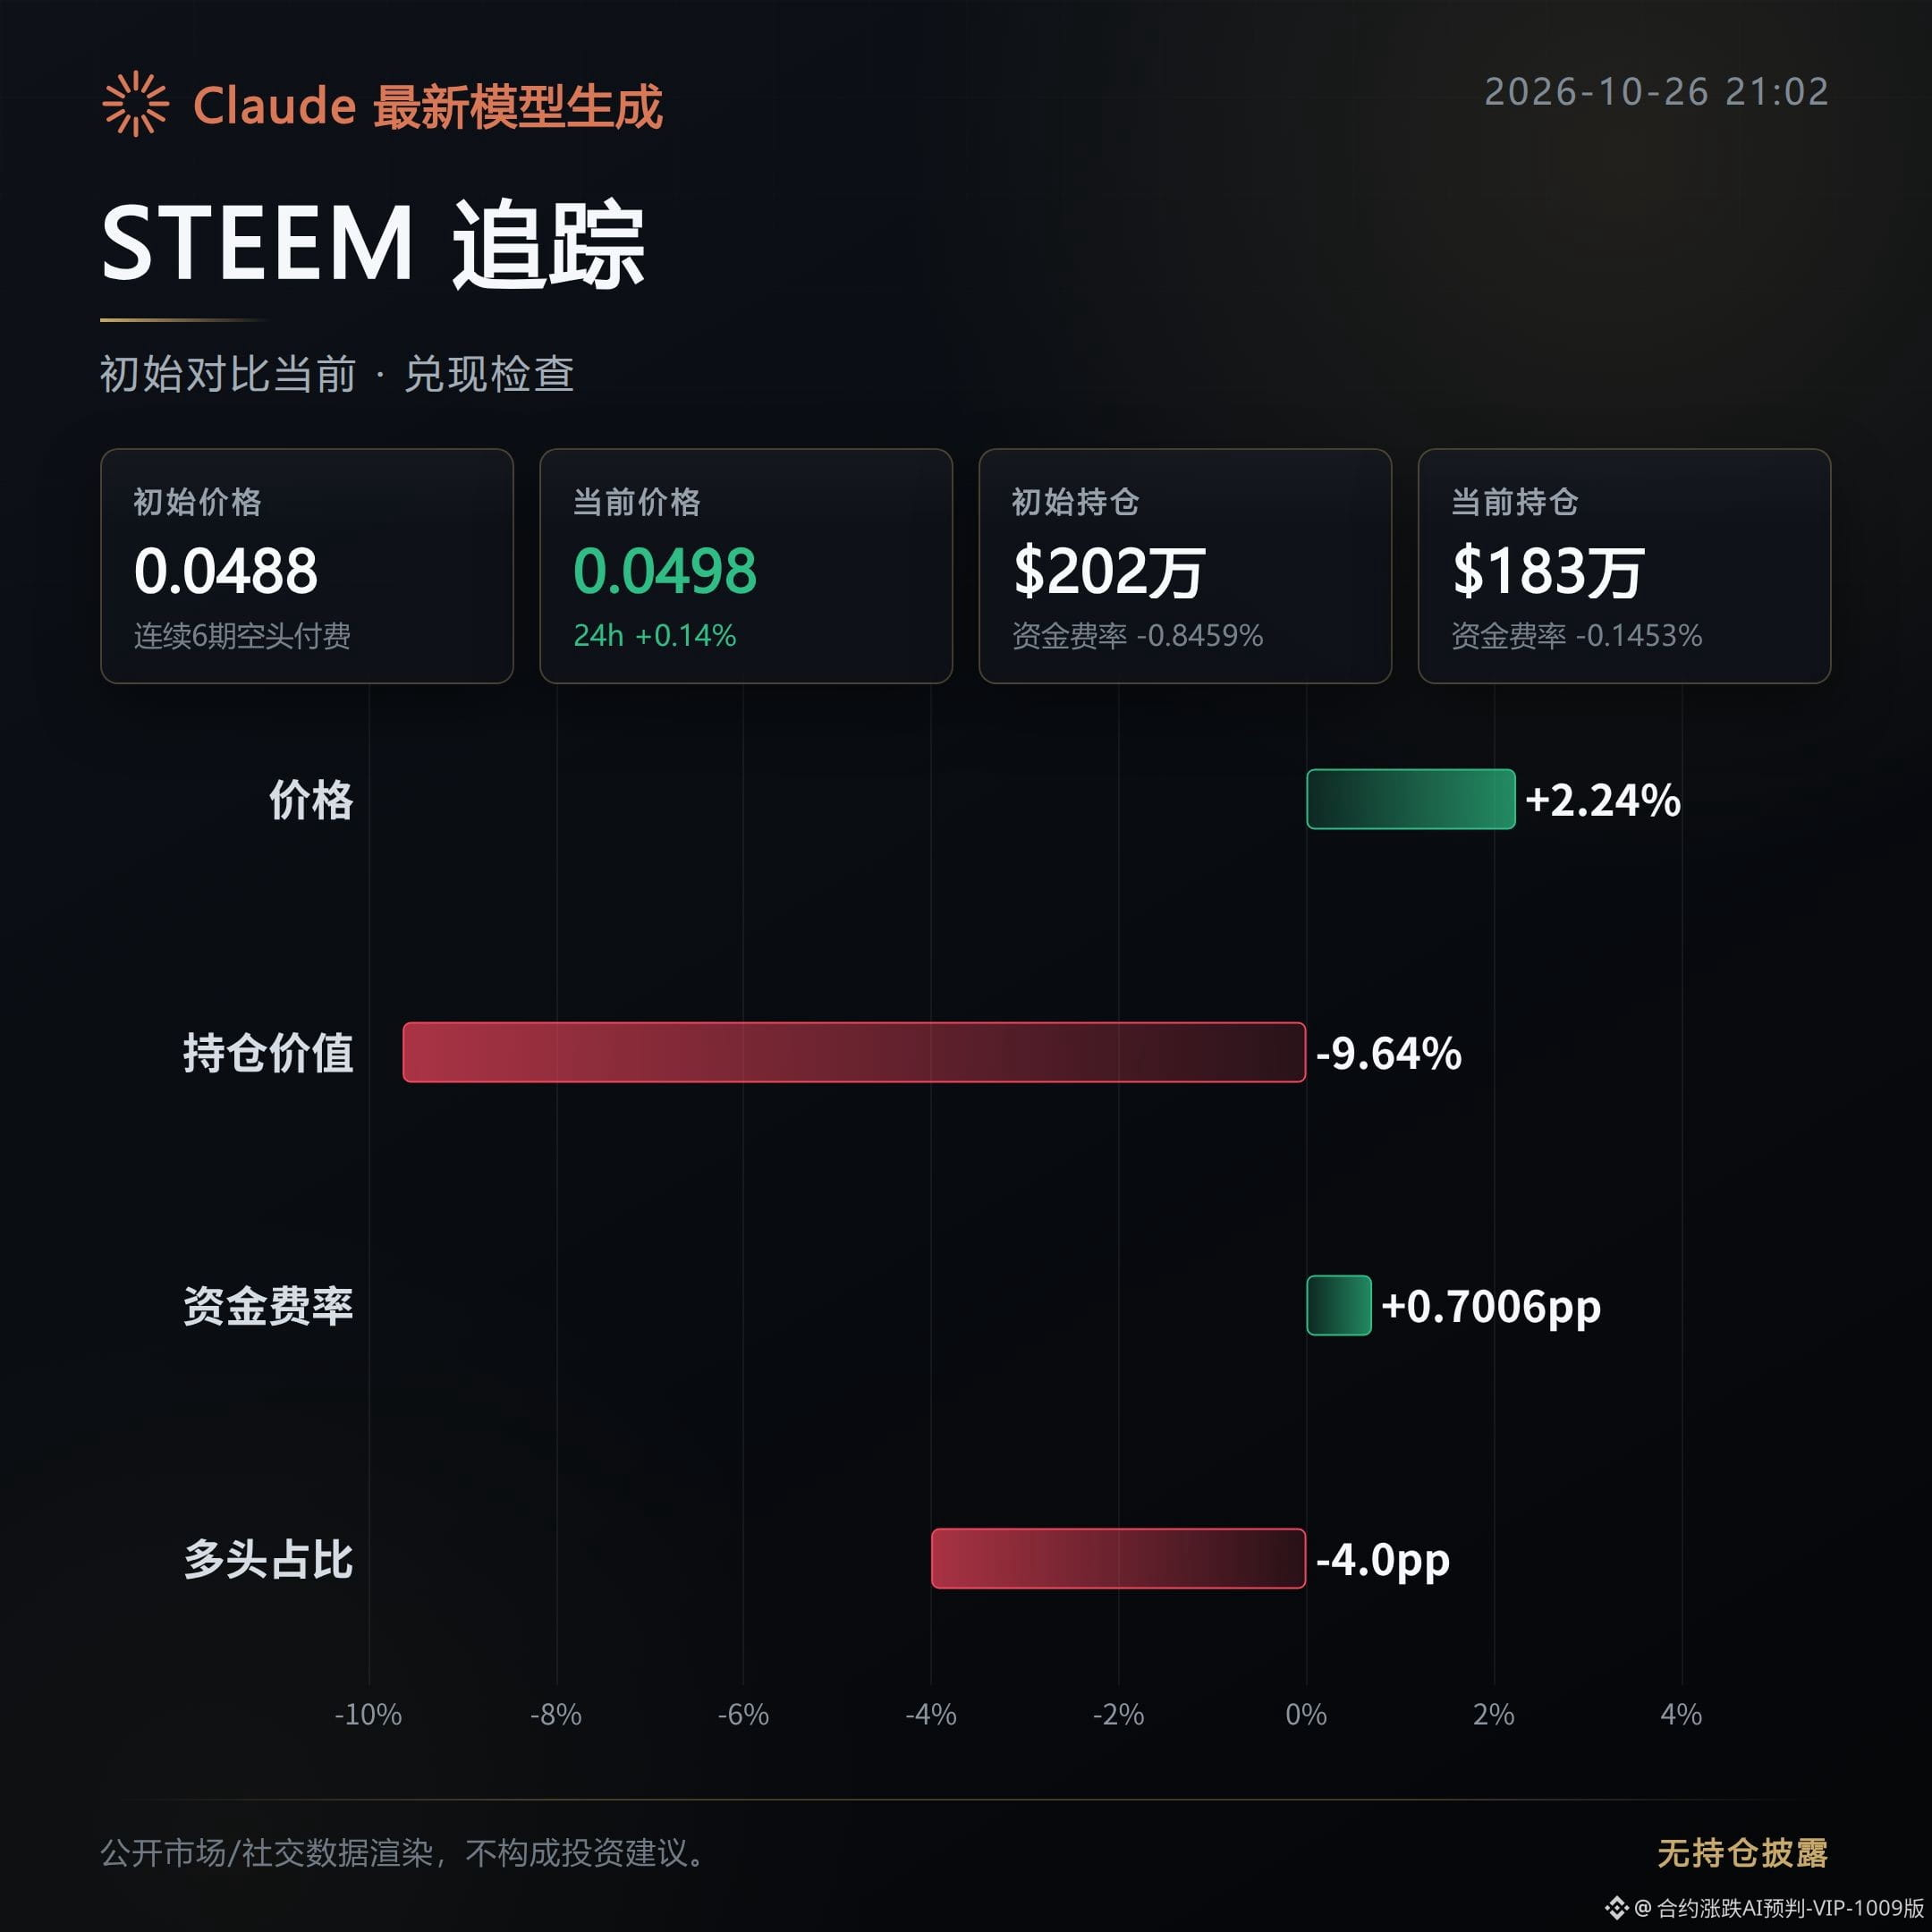
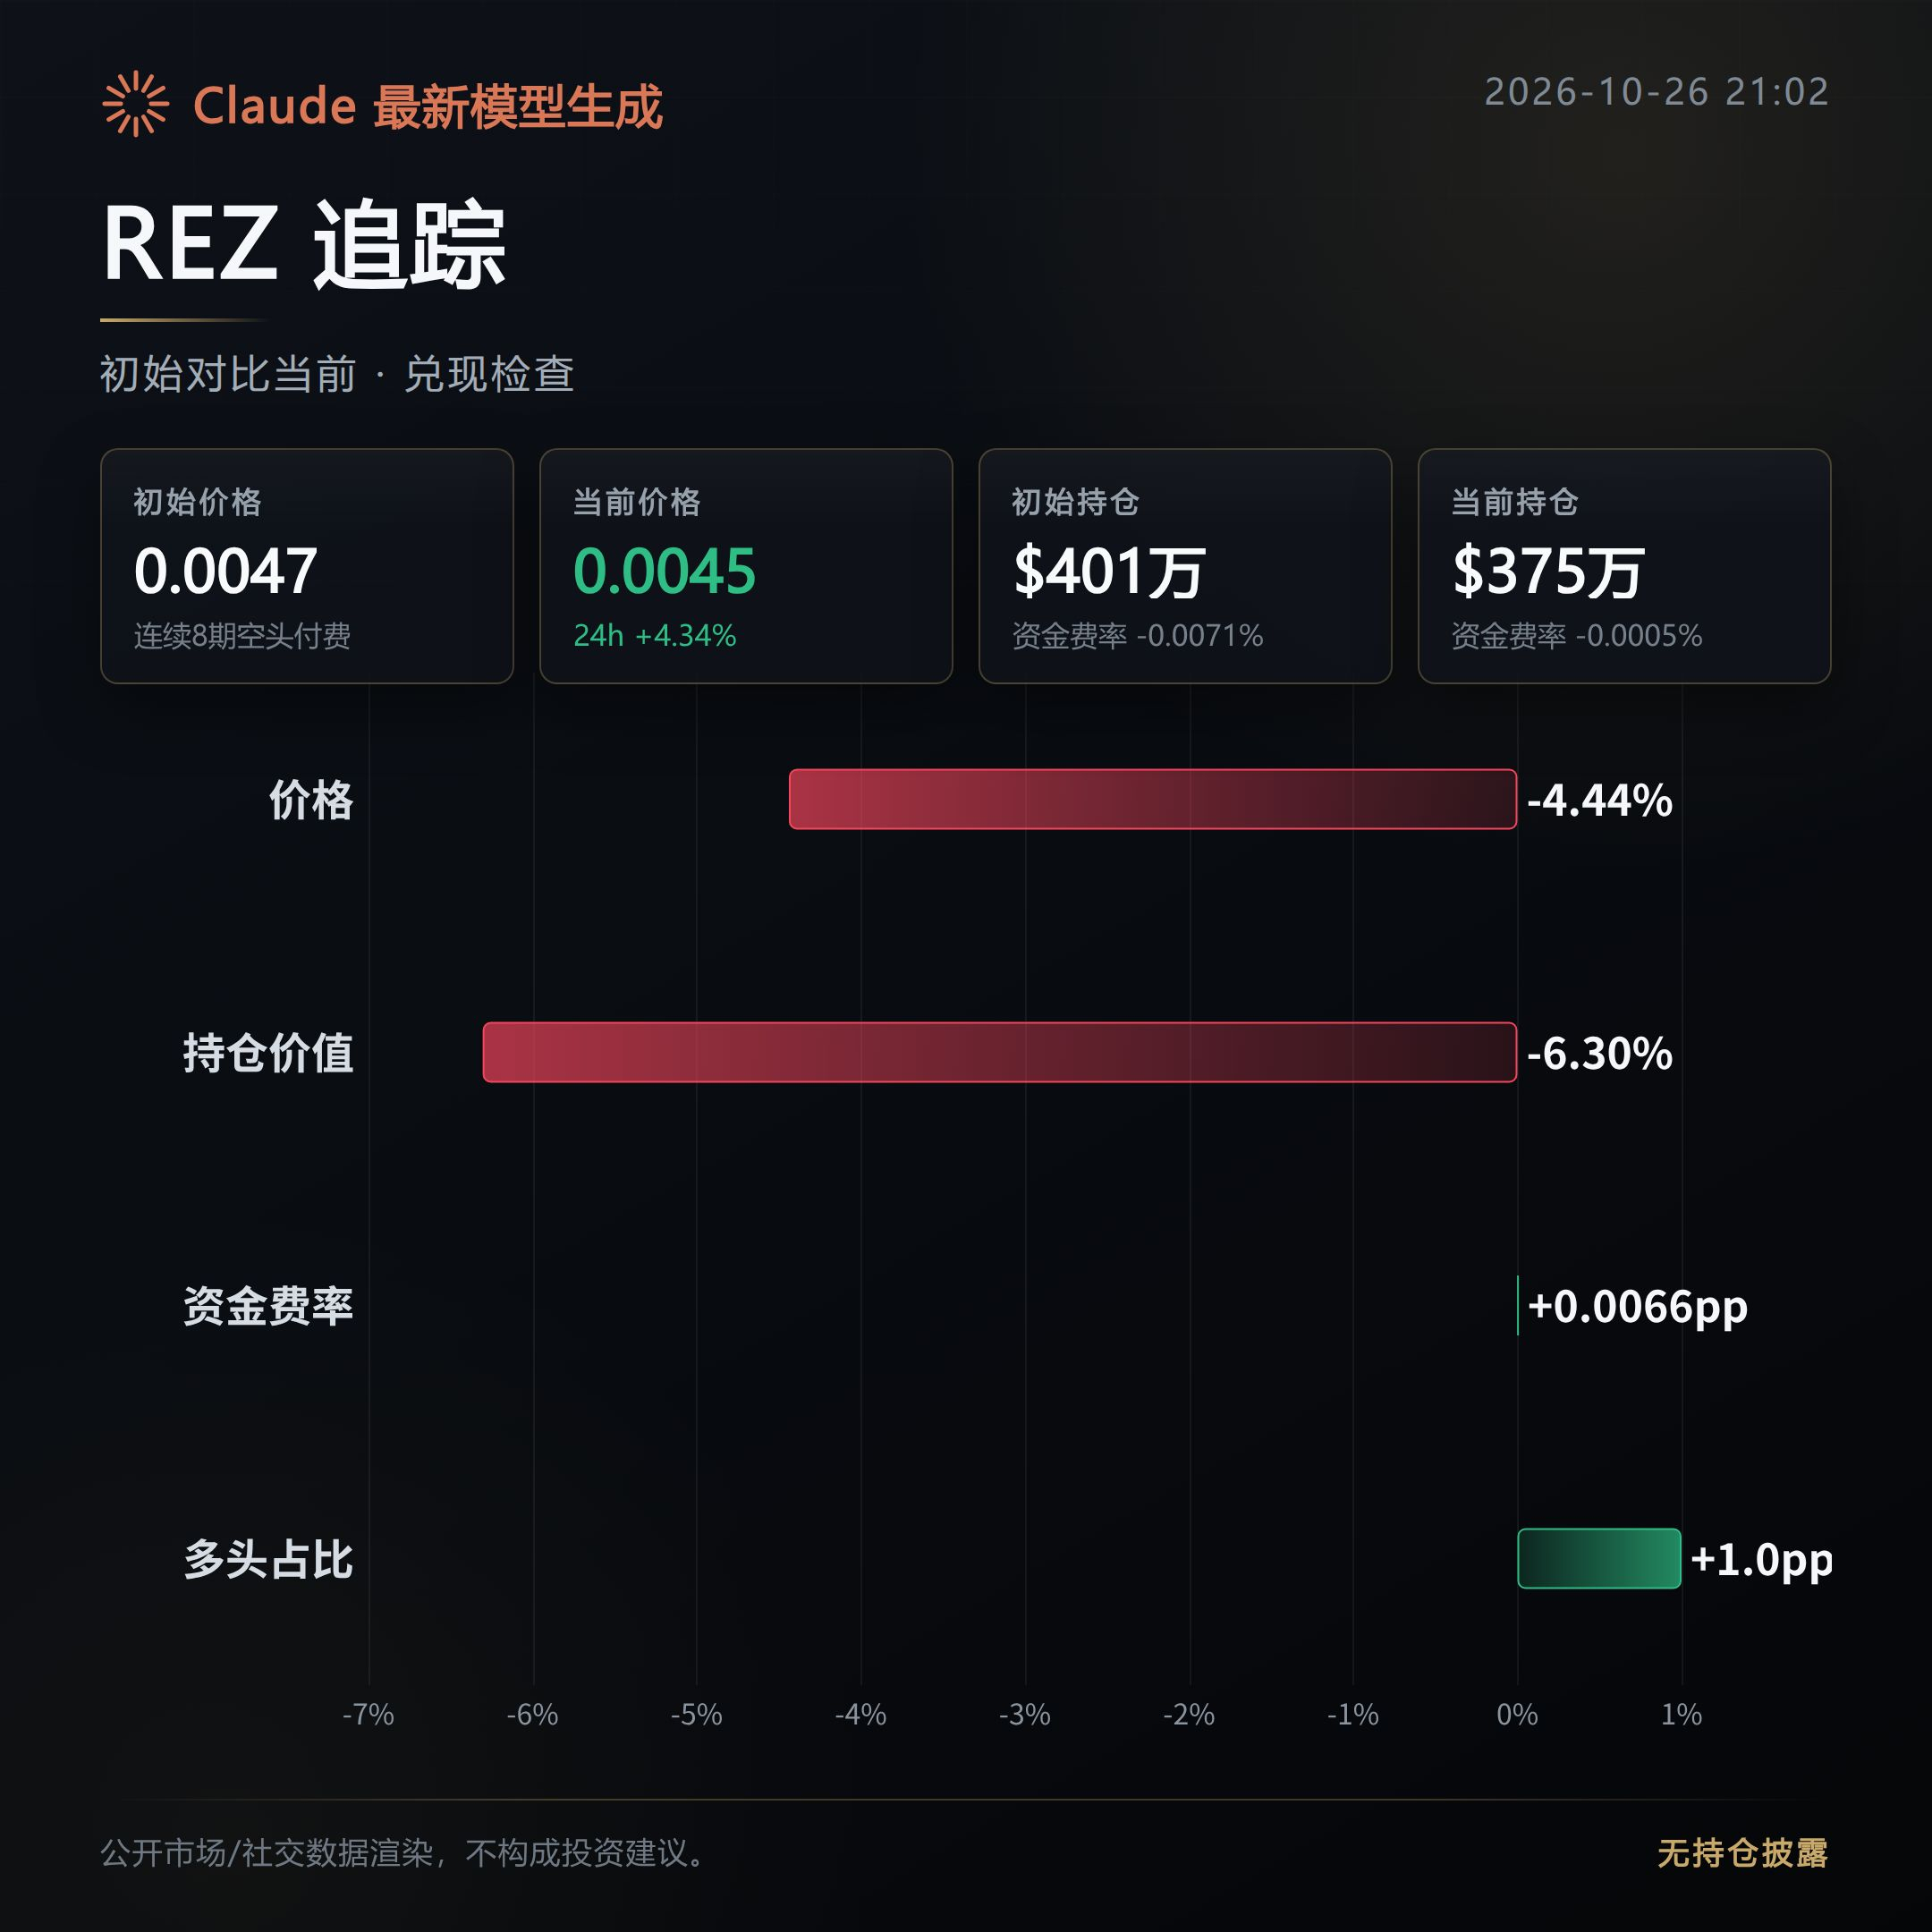
Review of the morning bearish call and high-level distribution warning issued about 13 hours ago: Of the three contracts, T and REZ weakened as expected, while STEEM remains caught in a tug-of-war, with no sustained one-way decline so far.
Positions are unwinding.
T: Played out. The morning bearish move has materialized.
Since the initial post, the price has continued to weaken, down 10.42%, directly confirming the pullback.
Open interest fell by 15.39% at the same time, while the active buy/sell indicator dropped to 0.80. This suggests that support is thin and positions in the market are also being closed.
STEEM: Still caught in a tug-of-war; the morning bearish call has not yet led to a one-way decline.
Since the initial post, the price has instead risen 2.24%, directly weakening the original outlook.
However, open interest fell by 9.64% and the active buy/sell indicator declined by 0.09, suggesting that additional buying support remains limited during the rebound.
REZ: Played out. Price action since the initial post has continued in line with the morning bearish outlook.
The price weakened by 4.44%, while trading volume increased by 53%, so the pullback was not simply a low-volume fluctuation.
The active buy/sell indicator fell by 0.44 to 0.85, indicating a clear retreat in aggressive buying, with pressure still present in the order book.
Next, keep an eye on whether volume continues to confirm price weakness, and whether active buying recovers.
If T and REZ stabilize in price and open interest starts to rise again, or STEEM sees volume pick up during its rebound and active buying recover, this high-level distribution warning should be reassessed.
#T #STEEM #REZ #Contract Review
Compiled with the assistance of Claude Fable 5 using contract data. For informational purposes only; please verify independently.
223

·
--
STEEM down about 14%: With an obscure coin’s pullback, check your entry point firstSTEEM is down about 14% in 24 hours, with a current price of around 0.04911 and trading volume of about 5.8 million USDT. It’s not a headline coin, but the pullback already hurts enough. When obscure coins fall, there’s less information, liquidity is more fragile, and stop-loss slippage becomes all too real.
The biggest mistake at a point like this is “buying halfway down and then adding to the position.” A tempting drop doesn’t mean the risk-reward is good enough. First ask yourself whether you can stomach another leg down that cuts the price in half; only then think about your average cost. A better-looking average doesn’t necessarily mean a better-looking account.
Having fewer than $ tags doesn’t mean it’s safer; I just don’t want to waste my attention on more than three tags. Position sizing matters more than tags. Tags are for readers; risk is mine to bear.
STEEM down about 14%: With an obscure coin’s pullback, check your entry point first
STEEM is down about 14% in 24 hours, with a current price of around 0.04911 and trading volume of about 5.8 million USDT. It’s not a headline coin, but the pullback already hurts enough. When obscure coins fall, there’s less information, liquidity is more fragile, and stop-loss slippage becomes all too real.
The biggest mistake at a point like this is “buying halfway down and then adding to the position.” A tempting drop doesn’t mean the risk-reward is good enough. First ask yourself whether you can stomach another leg down that cuts the price in half; only then think about your average cost. A better-looking average doesn’t necessarily mean a better-looking account.
Having fewer than $ tags doesn’t mean it’s safer; I just don’t want to waste my attention on more than three tags. Position sizing matters more than tags. Tags are for readers; risk is mine to bear.
11

·
--
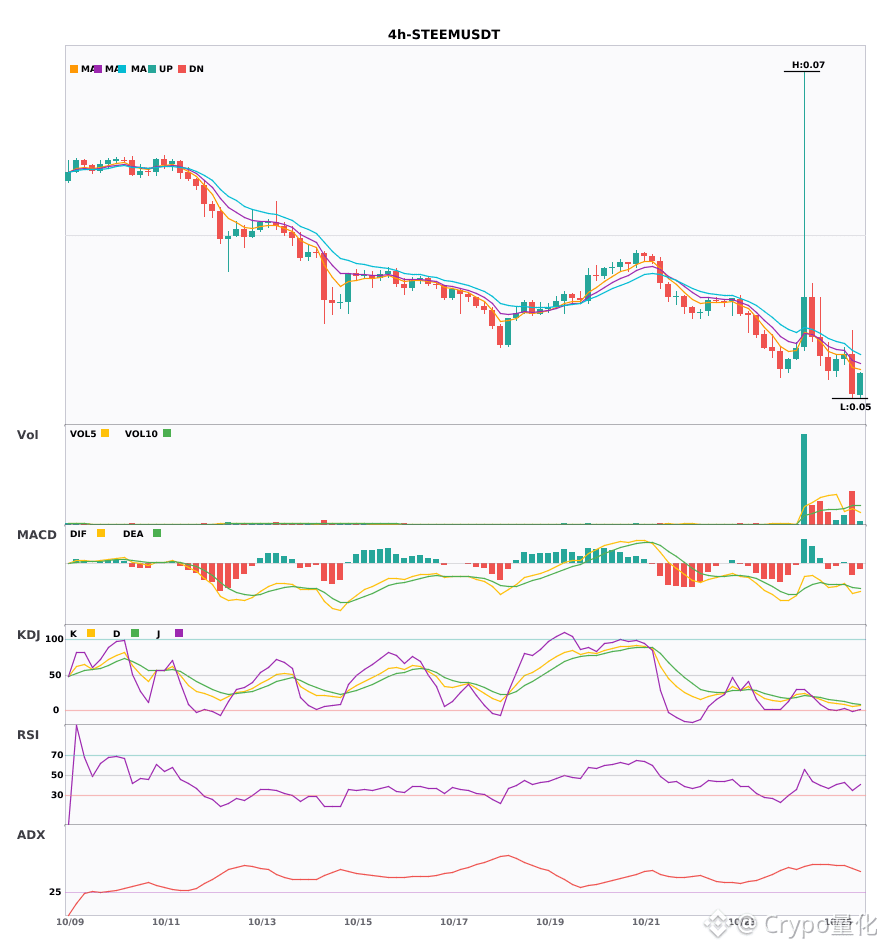
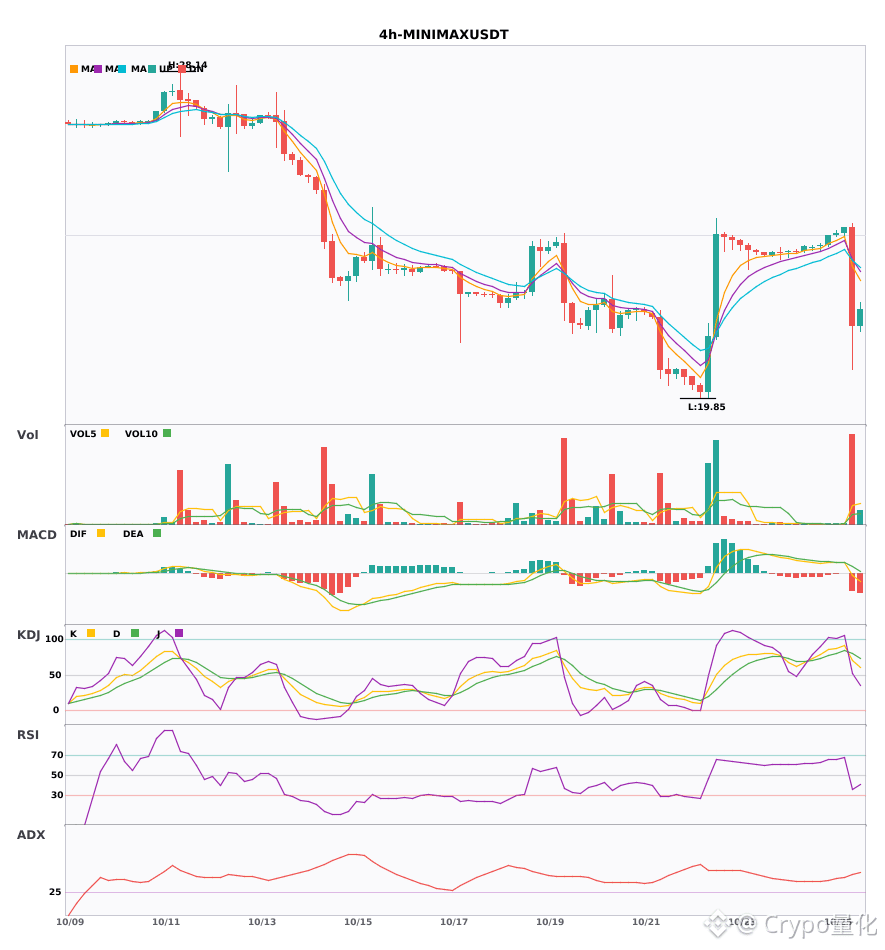
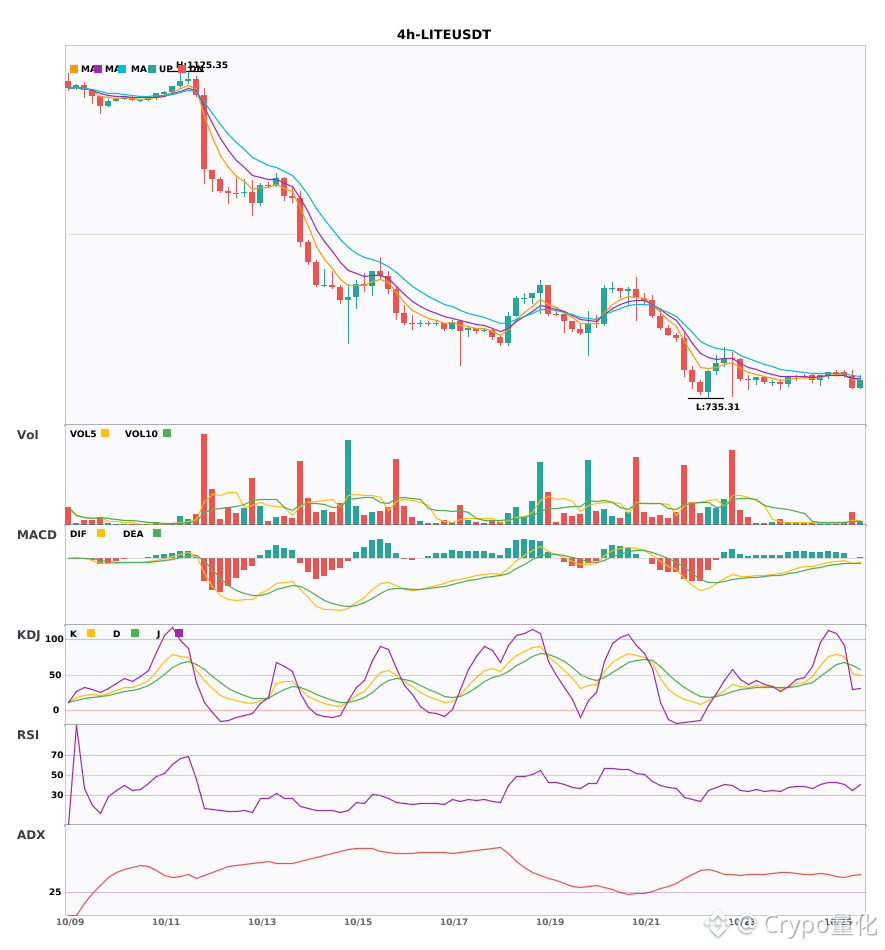
$STEEM / $MINIMAX / $LITE 4-hour technical indicators are weakening in sync. Watch out for risk🔥
════════════════════
🟢 $STEEM 4-hour bearish signal
⚠️Technical analysis: ADX (52): very strong trend (beware of an overheated pullback) | MACD bearish crossover below zero, bearish momentum accelerating | EMA5 < EMA8 < EMA13: bearish alignment | KDJ in oversold territory; watch for a rebound (K: 6.5, D: 10.4) | Trading volume increased (1.7x)
════════════════════
🟢 $MINIMAX 4-hour bearish signal
⚠️Technical analysis: ADX (49): very strong trend (beware of an overheated pullback) | MACD DIF fell below zero, trend turned bearish | EMA5 crossed below EMA8, short-term outlook turned bearish | KDJ bearish crossover, short-term outlook bearish (K: 70.6, D: 79.5) | Trading volume surged (9.1x)
════════════════════
🟢 $LITE 4-hour bearish signal
⚠️Technical analysis: ADX (42): clear trending market | MACD bearish crossover below zero, bearish momentum accelerating | EMA5 crossed below EMA8, short-term outlook turned bearish | KDJ bearish crossover, short-term outlook bearish (K: 51.8, D: 62.7) | Trading volume surged (3.7x)
════════════════════
🔔 Follow for the latest market-moving updates 🔔
#技术分析 #STEEM #MINIMAX #LITE
📌 When trading, pay attention to whether the candlestick pattern confirms the signal
════════════════════
🟢 $STEEM 4-hour bearish signal
⚠️Technical analysis: ADX (52): very strong trend (beware of an overheated pullback) | MACD bearish crossover below zero, bearish momentum accelerating | EMA5 < EMA8 < EMA13: bearish alignment | KDJ in oversold territory; watch for a rebound (K: 6.5, D: 10.4) | Trading volume increased (1.7x)
════════════════════
🟢 $MINIMAX 4-hour bearish signal
⚠️Technical analysis: ADX (49): very strong trend (beware of an overheated pullback) | MACD DIF fell below zero, trend turned bearish | EMA5 crossed below EMA8, short-term outlook turned bearish | KDJ bearish crossover, short-term outlook bearish (K: 70.6, D: 79.5) | Trading volume surged (9.1x)
════════════════════
🟢 $LITE 4-hour bearish signal
⚠️Technical analysis: ADX (42): clear trending market | MACD bearish crossover below zero, bearish momentum accelerating | EMA5 crossed below EMA8, short-term outlook turned bearish | KDJ bearish crossover, short-term outlook bearish (K: 51.8, D: 62.7) | Trading volume surged (3.7x)
════════════════════
🔔 Follow for the latest market-moving updates 🔔
#技术分析 #STEEM #MINIMAX #LITE
📌 When trading, pay attention to whether the candlestick pattern confirms the signal
11

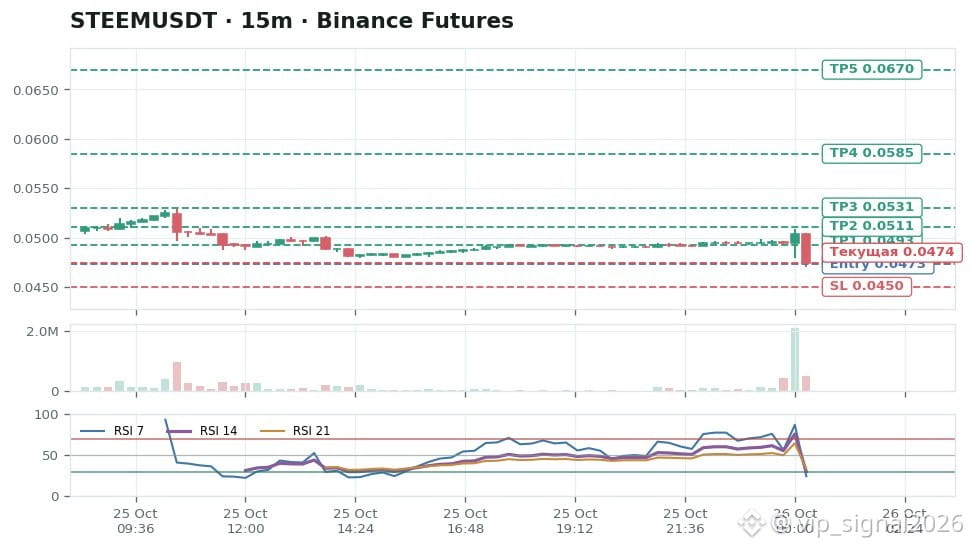
$STEEM LONG
Will this reference point hold? The plan calls for a wave-like climb toward the intended growth targets, relying on a protective level to keep unnecessary anxiety in check. If the tailwind weakens, the asset risks slipping toward the control boundary.
🔹Entry zone: 0.0473$
✅Take profit 1: 0.04931119$
✅Take profit 2: 0.0511029$
✅Take profit 3: 0.05305762$
✅Take profit 4: 0.05849451$
✅Take profit 5: 0.06700388$
🛡Protection: 0.0450296$
📈 RSI14: m1 30.0 • m5 27.3 • m15 29.3 • m30 31.1
📊 VOL: m1 $65.6K • m5 $503.7K • m15 $500.3K • m30 $2.6M
🧲 OI: now $2M • 5m +0.9% • 15m +5.9% • 30m +9.9%
⚠️ This is not financial advice. Trade at your own risk. DYOR.
#STEEM #BinanceSquare #скальпинг 📈
$STEEM
18

·
--
$STEEM +2.70% | $RNDR +2.58% | $INIT +2.54%
#STEEM is trading at $0.0513, up +2.70% with $5.6 M of volume. Its reward‑for‑content model keeps community activity flowing, which may support the modest rally.
#RNDR sits at $7.03, gaining +2.58% on $1.6 M of volume. The GPU‑rendering token’s steady climb hints at continued interest in decentralized graphics, though broader market sentiment could sway it.
#INIT moves to $0.1499, up +2.54% and sees $4.0 M of volume. Its optimistic rollup network aims to reshape multichain interactions, a niche that could attract developers if scalability proofs hold.
👀 Watch the volume disparity: STEEM’s higher turnover may give it more price resilience than RNDR’s thinner flow.
#Write2Earn #Binance
4

·
--
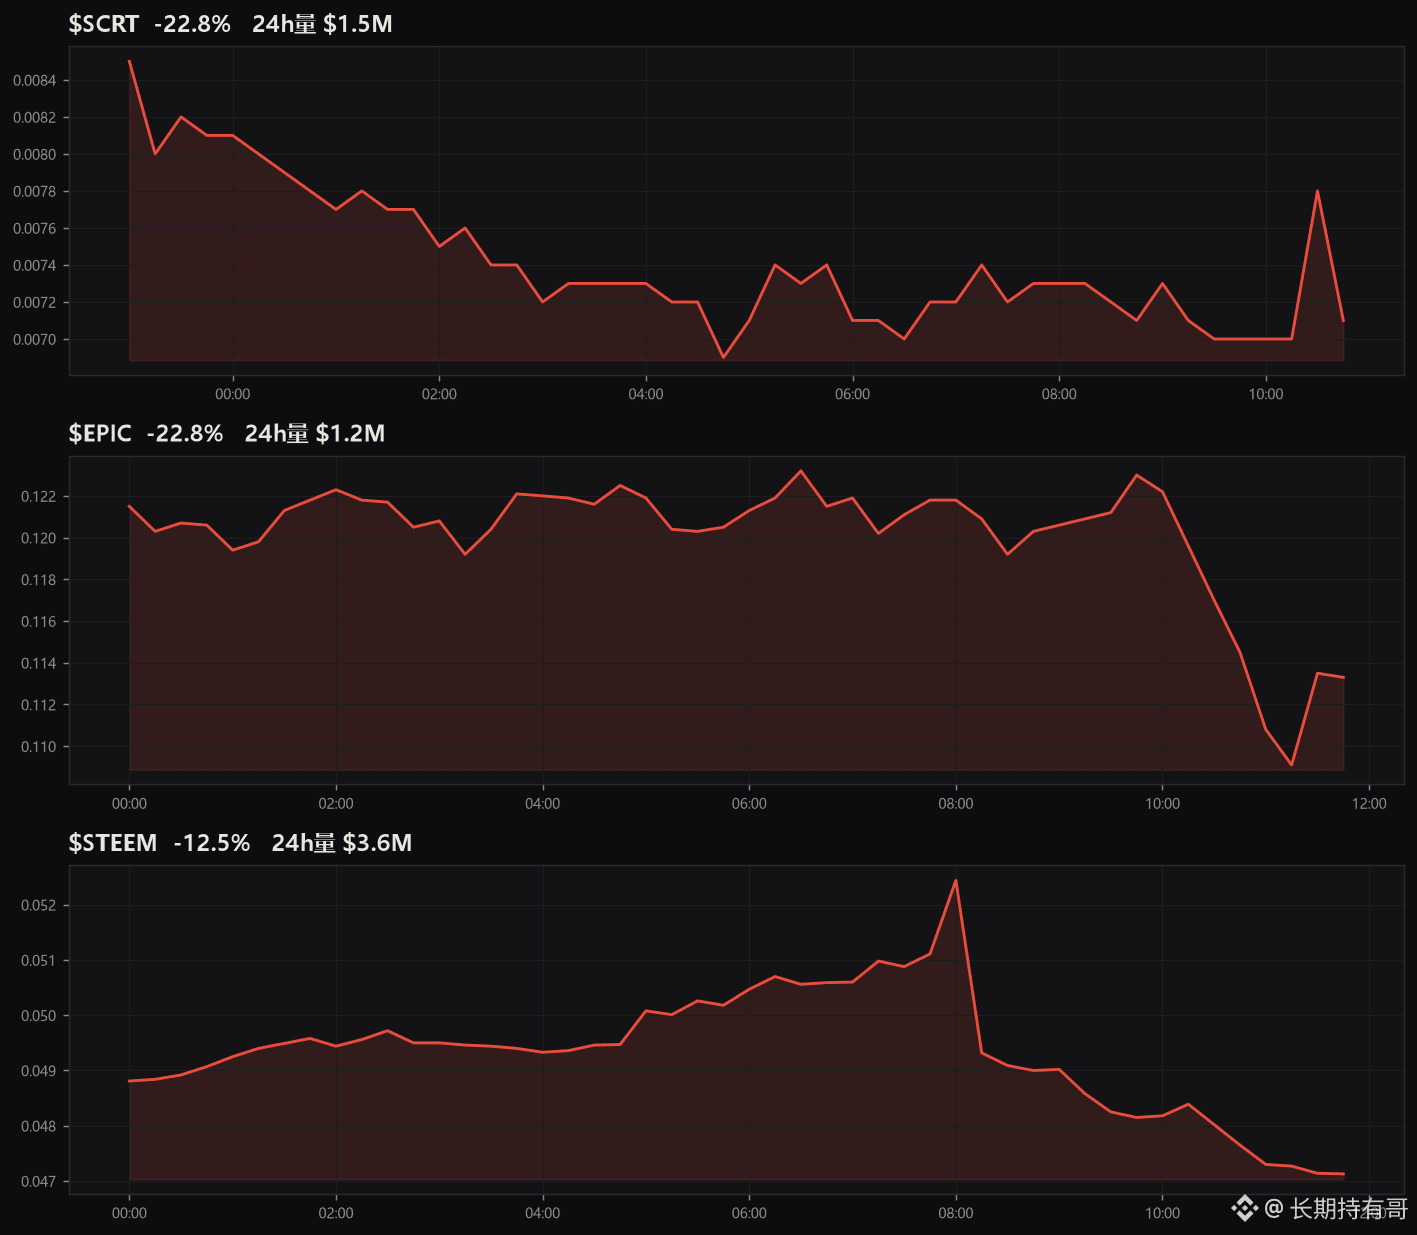
$SCRT currently $0.007100 | ▼22.8%
Support: 0.006700 (support at the 24h low)
💬 Down 22.8% in a single day, with the price approaching the 0.0067 low support level as panic selling unfolds. A high-volume break below this level could open up more downside; if it holds, watch for an oversold bounce. Would you dare to buy the dip?
$EPIC currently $0.1133 | ▼22.8%
Support: 0.1081 (strong support in the lower range)
💬 Also down more than 22%, the current price is just one step away from the strong 0.1081 support. Beware of continued momentum from high-volume selling at these lows; avoid blindly catching a falling knife until signs of stabilization appear. Would you wait for confirmation before acting?
$STEEM currently $0.0471 | ▼12.5%
Support: 0.0470 (near support; beware of a breakdown)
💬 After falling 12.5%, the price is now almost sitting on the 0.0470 support, where buyers and sellers are battling fiercely. If this level gives way, the decline could accelerate; if it bounces, the first thing to watch is whether it can reclaim the $0.05 mark. Which side are you on?
#SCRT #EPIC #STEEM
Click the $ tag above to view real-time prices
75

·
--
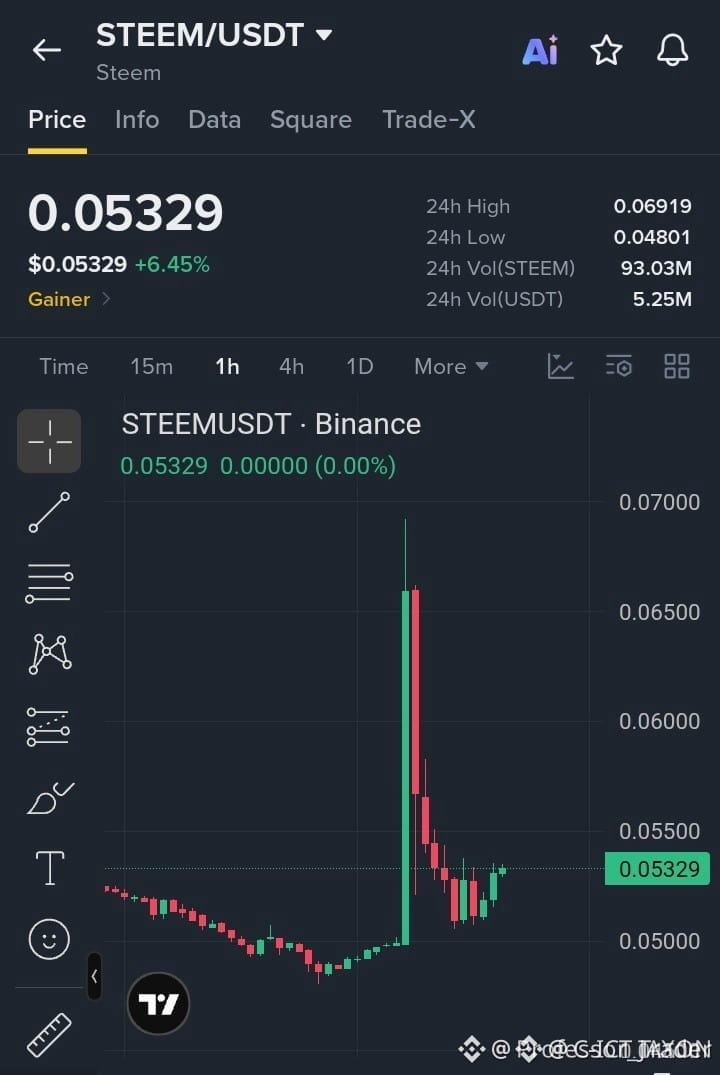
🚨 $STEEM REBOUND ZONE CALLING FOR BULLISH SURGE! 📈
Entry: 0.05250-0.05330 ⚡
Target: 0.05450 🚀
Target: 0.05600 🚀
Target: 0.05800 🚀
Stop Loss: 0.05080 ⚠️
📊 After a sharp spike and disciplined pullback, the 0.05300 hub is now swallowing liquidity, hinting at a smart‑money re‑entry. 🦈 A clean break above 0.05450 would unlock the next resistance cluster, while a dip under 0.05080 would invalidate the bullish premise. 💡 Volume on the 4‑hour chart is expanding, reinforcing the institutional push.
💬 How are you positioning around this recovery zone? 👇
⚠️ Not financial advice. Always manage your risk. 🛡️
🏷️ #STEEM #LongSetup #Recovery #Crypto
🔥 💎
5

·
--
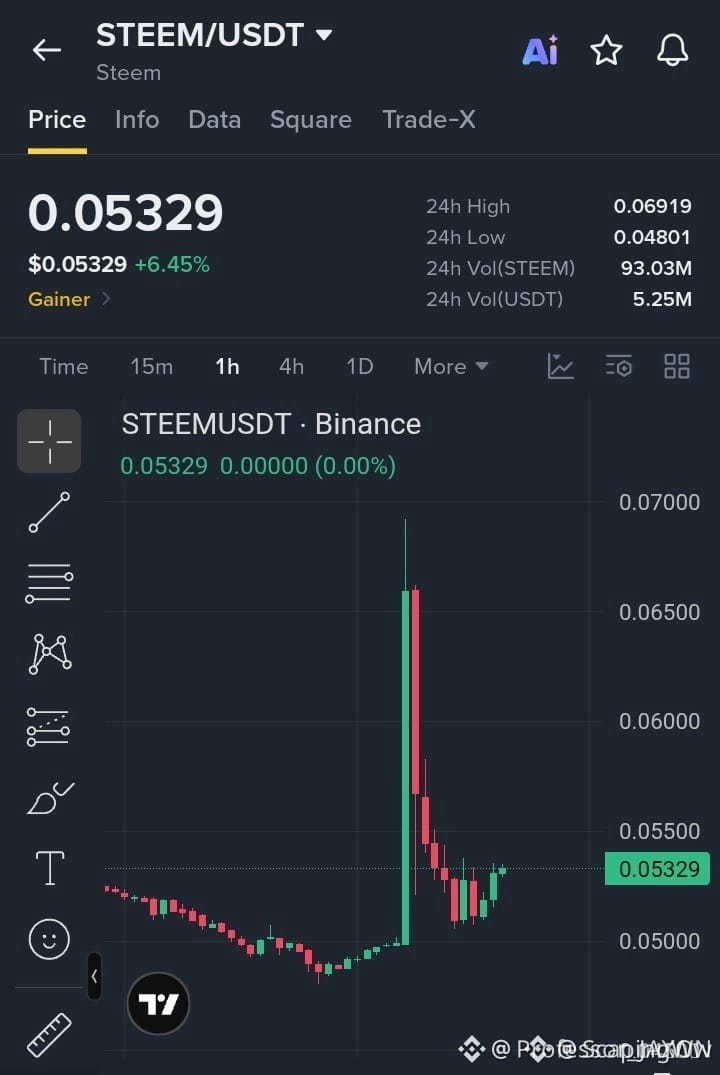
🚀 $STEEM REBOUND RUSH AHEAD OF BREAKOUT ZONE!
Entry: 0.05250-0.05330 ⚡
Target: 0.05450 🚀
Target: 0.05600 🚀
Target: 0.05800 🚀
Stop Loss: 0.05080 ⚠️
Buyers are clawing back the 0.05300 sweet spot, snapping up liquidity left by the recent pullback. 📊 Volume spikes on the 1H chart show a clear surge, hinting that smart money is re‑stacking positions.
If the price punches through 0.05450, the next resistance ladder at 0.05600 and 0.05800 lights up, delivering a clean upside ladder. ⚡ Keep an eye on the order block at 0.05280 as a defensive moat. 💡
💬 Who’s ready to ride this bounce or waiting for the next liquidity sweep? 👇
⚠️ Not financial advice. Always manage your risk. 🛡️
🏷️ #STEEM #LongSetup #Crypto #Bullish #SteemRecovery
🔥 💎
4

·
--
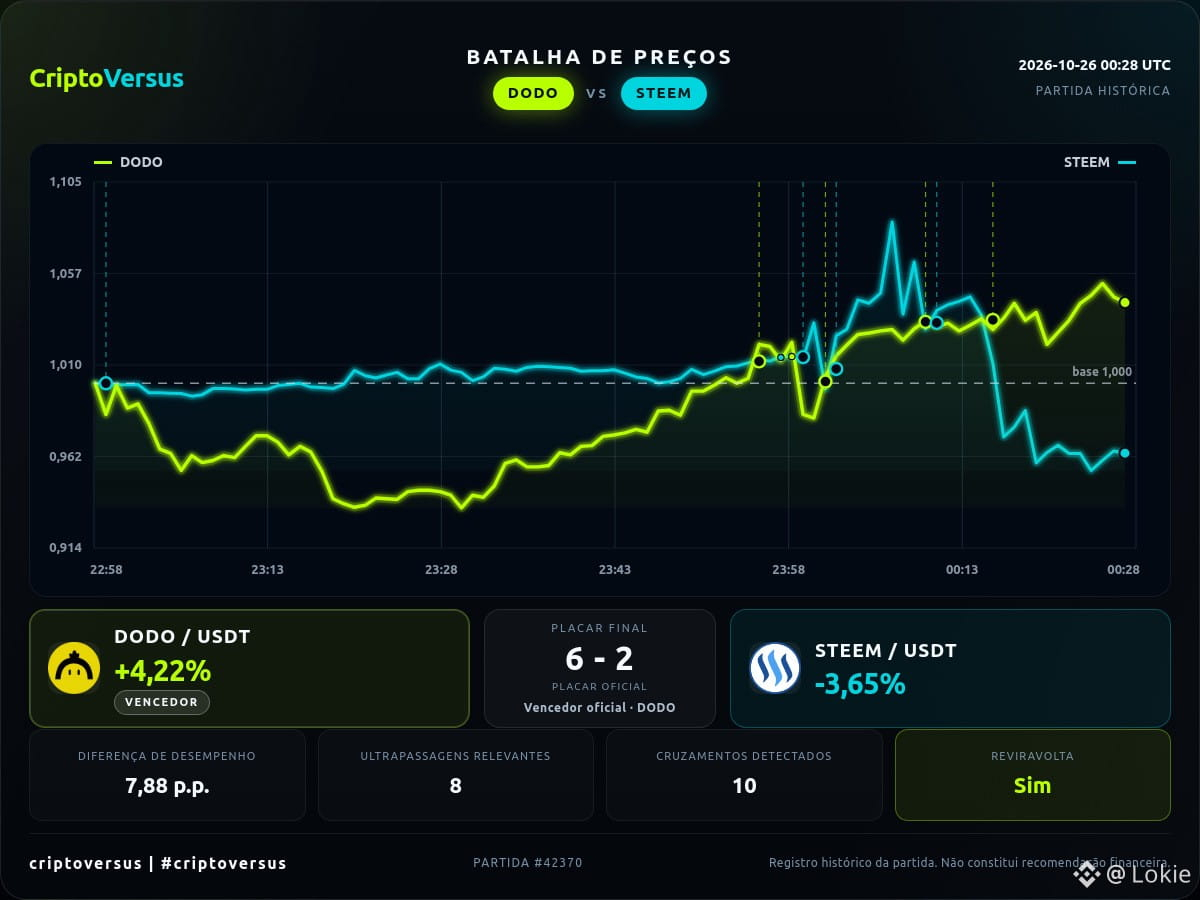
Two price series, one relative comparison.
More than the result: the journey of DODO and STEEM
A turnaround in the Price Battle: DODO was trailing in relative performance, took the lead, and finished the match ahead of STEEM. DODO: +4.2% | STEEM: -3.7%.
Which curve was more interesting to follow?
#CriptoVersus #PriceBattle #DODO #STEEM
Historical and informational content; not financial advice.
1
190

·
--
$STEEM #STEEM
Unusual Activity Alert: Short Signal | STEEM
15m: Monitoring unusual bearish activity on the 1h timeframe
1h: Rising volume / weakening structure
4h: GMMA bearish
pump_score: 10/12
Current price: 0.04759
Breakdown level: 0.04681
Invalidation level: 0.05235
Levels to watch below: 0.04283 / 0.03807
Funding rate: -0.7581% (shorts pay, longs receive)
For technical observation only; not investment advice.
240

·
--
STEEM has two answers; first, wait for selling pressure to set the direction.
Binance USDⓈ-M Perpetuals | STEEM is down 11.14% over the past 24 hours. Weakness persists, and any recovery depends first on whether selling pressure subsides. Current price is around 0.0481, with 24h trading volume of about 21.0677 million; the 30m volume ratio is 4.9x, indicating rising participation. Market flows: 60% of accounts are short; the taker buy/sell ratio is 0.87 (taker selling dominates); 30m open interest is down 2.5%; funding rate is -1.0062%.
Reference indicators: The 30m RSI is 25.75, deep in oversold territory, suggesting short-term panic is elevated. The 30m ATR trend-band reference level is 0.050876. Price has fallen below it, indicating that the trend support level is coming under pressure.
Which would you wait for first: whether price can stabilize after the 30m open interest change of -2.5%, or whether the 30m RSI at 25.8 can climb back above 30?
#STEEM #Unusual-Movement Alert
54

·
--
🚨 MAJOR ORDER FLOW IMBALANCE: $STEEM
Institutional accumulation is evident. We are seeing a clear Change of Character (CHOCH) on the lower timeframes, signaling a structural shift from bearish to bullish. Price has swept the sell-side liquidity, creating a strong foundation for a reversal. I am entering here because the risk-to-reward is mathematically skewed in our favor, focusing on a disciplined Market Structure Break.
EXECUTION:
ENTRY: 0.05114 $STEEM
SL: 0.05002
TP1: 0.05303
RR: 1:1.8
Risk management is non-negotiable; we protect capital first. Do you see this as a genuine structural flip or just a liquidity grab before another leg down?
#STEEM #BinanceSquare #SlowSclap #TradingAnalysis
51

·
--
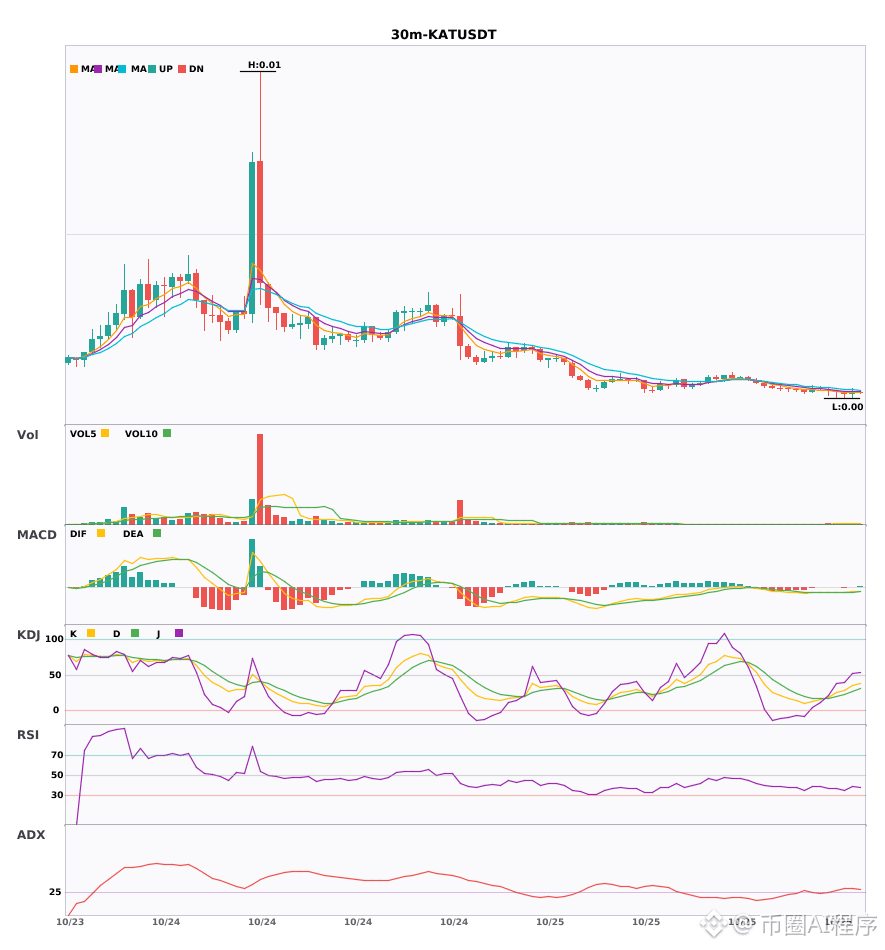
$BERA / $STEEM / $KAT 30-minute bearish signals, 4-hour bearish trend confirmed 🔥
════════════════════
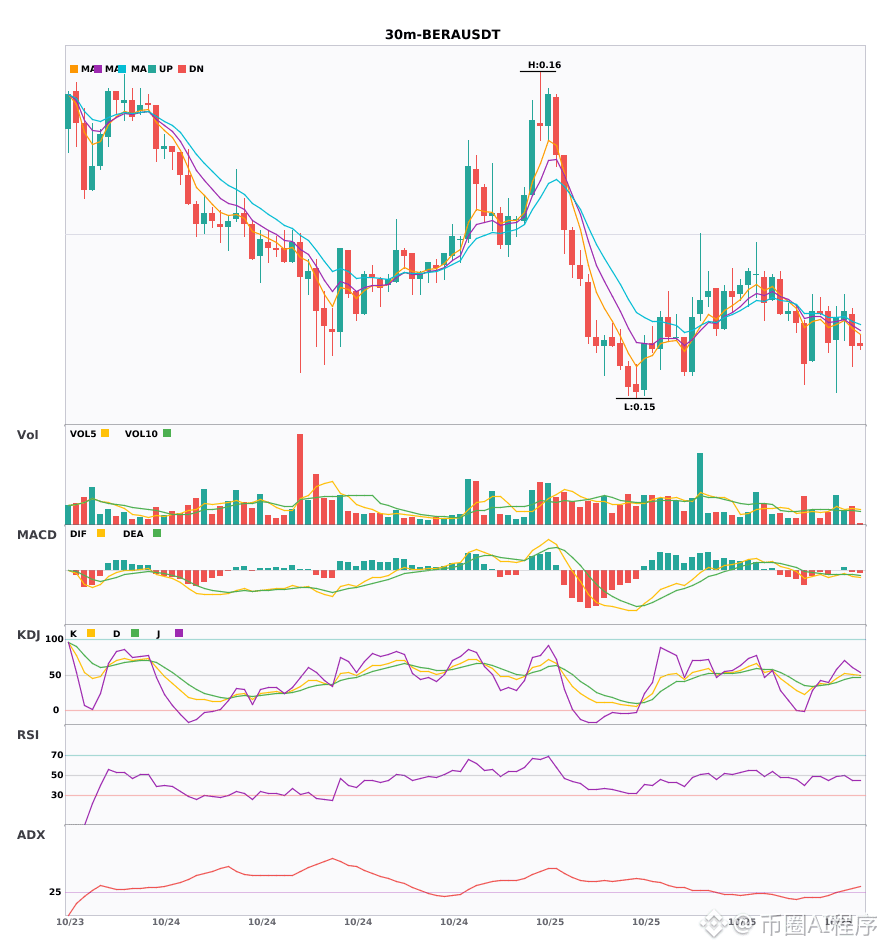
🟢 $BERA 30-minute bearish signal
⚠️ Technical analysis: 4-hour bearish confluence confirmed | 30-minute entry: MACD bearish cross below zero, bearish momentum accelerating | EMA5 < EMA8 < EMA13, bearish alignment | Normal volume (1.2x)
════════════════════
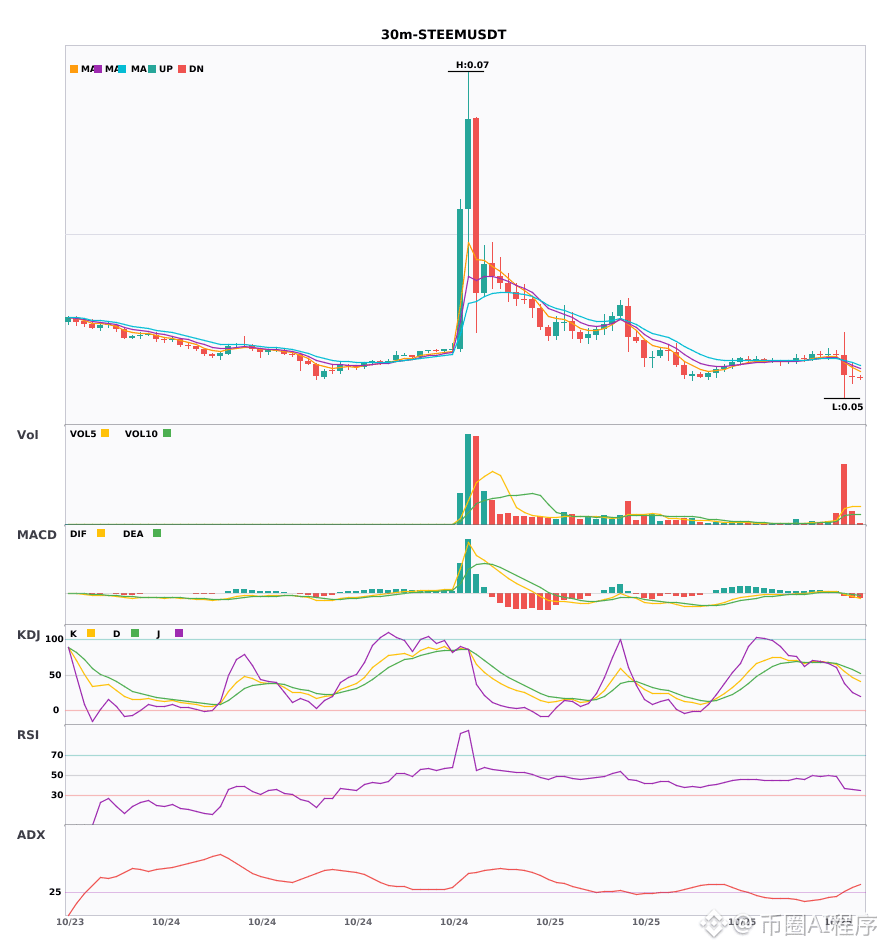
🟢 $STEEM 30-minute bearish signal
⚠️ Technical analysis: 4-hour bearish confluence confirmed | 30-minute entry: MACD bearish cross below zero, bearish momentum accelerating | EMA5 crosses below EMA8, short-term outlook turns bearish | KDJ moving strongly, bulls have the advantage (K: 54.4, D: 62.6) | Volume surge (6.6x)
════════════════════
🟢 $KAT 30-minute bearish signal
⚠️ Technical analysis: 4-hour bearish confluence confirmed | 30-minute entry: MACD bearish cross below zero, bearish momentum accelerating | EMA5 < EMA8 < EMA13, bearish alignment | KDJ moving weakly, bears have the advantage (K: 28.6, D: 23.1) | Increased volume (2.3x)
════════════════════
🔔 Follow for first-hand market alerts 🔔
#多周期共振 #BERA #STEEM #KAT
📌 When trading, pay attention to whether the candlestick patterns align
════════════════════
🟢 $BERA 30-minute bearish signal
⚠️ Technical analysis: 4-hour bearish confluence confirmed | 30-minute entry: MACD bearish cross below zero, bearish momentum accelerating | EMA5 < EMA8 < EMA13, bearish alignment | Normal volume (1.2x)
════════════════════
🟢 $STEEM 30-minute bearish signal
⚠️ Technical analysis: 4-hour bearish confluence confirmed | 30-minute entry: MACD bearish cross below zero, bearish momentum accelerating | EMA5 crosses below EMA8, short-term outlook turns bearish | KDJ moving strongly, bulls have the advantage (K: 54.4, D: 62.6) | Volume surge (6.6x)
════════════════════
🟢 $KAT 30-minute bearish signal
⚠️ Technical analysis: 4-hour bearish confluence confirmed | 30-minute entry: MACD bearish cross below zero, bearish momentum accelerating | EMA5 < EMA8 < EMA13, bearish alignment | KDJ moving weakly, bears have the advantage (K: 28.6, D: 23.1) | Increased volume (2.3x)
════════════════════
🔔 Follow for first-hand market alerts 🔔
#多周期共振 #BERA #STEEM #KAT
📌 When trading, pay attention to whether the candlestick patterns align
35

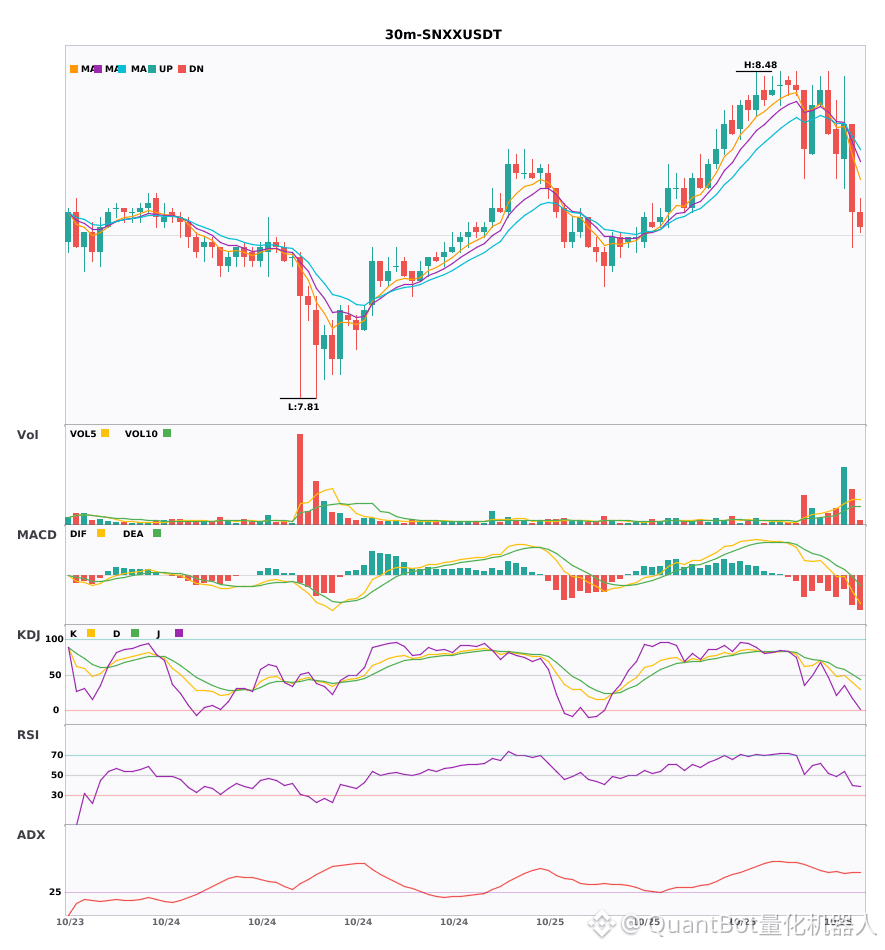
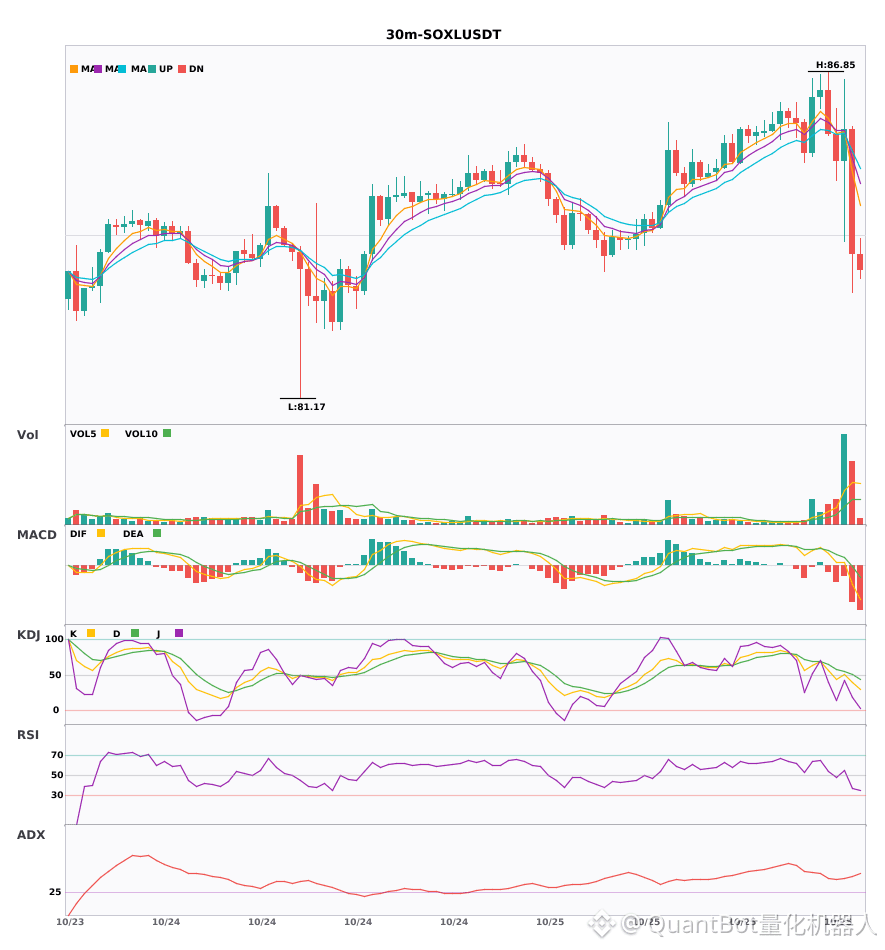
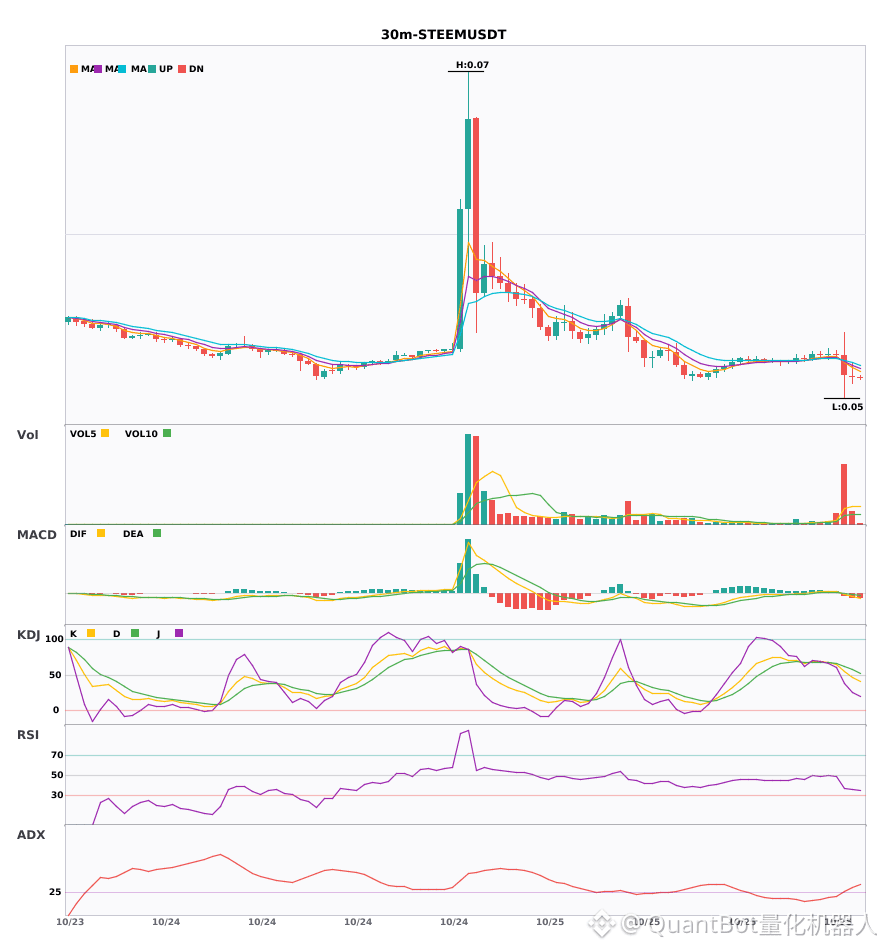
$SNXX / $SOXL / $STEEM 30-minute technical indicators are weakening in tandem; beware of risk
📉 $SNXX | 30-minute bearish signal
━━━━━━━━━━━━━━━━━━
Technical analysis: ADX(50) Very strong trend (watch out for an overheated pullback) | MACD is bearish, trend is weak, momentum is strengthening | EMA5 < EMA8 < EMA13, bearish alignment | Volume surge (3.9x)
Price change: -2.1500%
📉 $SOXL | 30-minute bearish signal
━━━━━━━━━━━━━━━━━━
Technical analysis: ADX(45) Clear trending market | MACD DIF has fallen below zero, trend has turned bearish | EMA5 < EMA8 < EMA13, bearish alignment | Volume surge (4.8x)
Price change: -2.5300%
📉 $STEEM | 30-minute bearish signal
━━━━━━━━━━━━━━━━━━
Technical analysis: ADX(31) Clear trending market | MACD bearish crossover below zero, bearish momentum accelerating | EMA5 has crossed below EMA8, short-term trend has turned bearish | KDJ is strong, bulls have the upper hand (K: 54.4, D: 62.6) | Volume surge (6.6x)
Price change: -2.4900%
━━━━━━━━━━━━━━━━━━
#技术分析 #SNXX #SOXL #STEEM
📌 The above content is for reference only and does not constitute investment advice
65
Log in to explore more content
Join global crypto users on Binance Square
⚡️ Get latest and useful information about crypto.
💬 Trusted by the world’s largest crypto exchange.
👍 Discover real insights from verified creators.
Email / Phone number
Trending Topics
1
#CanMicrosoftDeliverOnAI
152,540 views
1,204 Discussing
2
#CanGoogleDefindItsCore
75,909 views
833 Discussing
3
#FOMCWatch
9.1M views
28,483 Discussing
4
#SKHynixUnveils$45BShareholderReturns
87 views
5 Discussing
5
#OSMOPlansToBurn100MTokensFromCommunityPool
3,363 views
119 Discussing
6
#EthereumDropsBelow$2300
12,592 views
167 Discussing
7
#BitcoinSlipsBelow$80KAgain
35,763 views
133 Discussing
8
#ThailandLaunchesWORPTStablecoinToQRPaymentApp
79,671 views
942 Discussing
9
#StrategySkipsBitcoinPurchasesSpends$205MOnSTRCBuybacks
14,223 views
101 Discussing
10
#BitmineAdds10452ETH
132,501 views
1,366 Discussing