

#rsi
rsi
1.5M views
4,565 Discussing
Hot
Latest

·
--
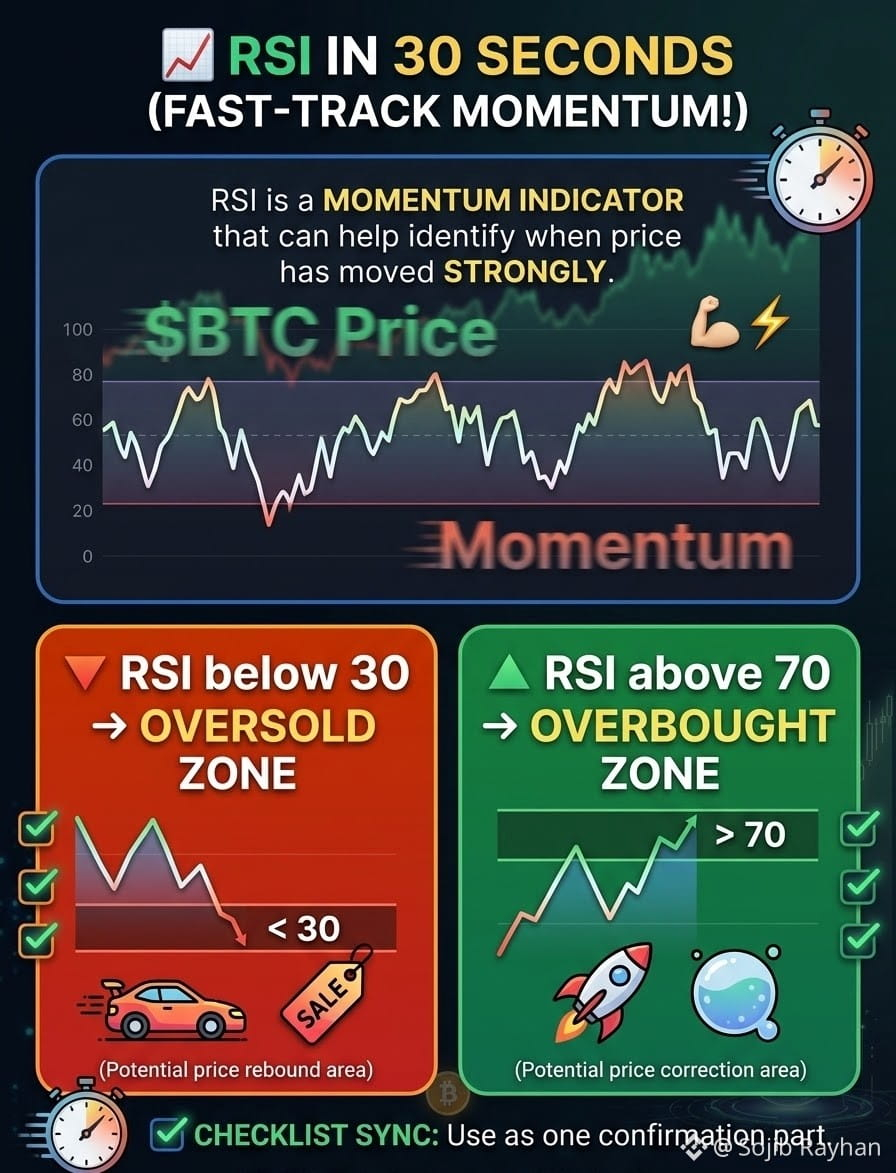
📈 RSI in 30 Seconds
RSI is a momentum indicator that can help identify when price has moved strongly.
🔻 RSI below 30 → oversold zone
🔺 RSI above 70 → overbought zone
But RSI can stay overbought or oversold during strong trends. Don't use RSI alone combine it with price structure and support/resistance.
Do you use RSI 14?
#BinanceSquare #Crypto #RSI #trading
📈 RSI in 30 Seconds
RSI is a momentum indicator that can help identify when price has moved strongly.
🔻 RSI below 30 → oversold zone
🔺 RSI above 70 → overbought zone
But RSI can stay overbought or oversold during strong trends. Don't use RSI alone combine it with price structure and support/resistance.
Do you use RSI 14?
#BinanceSquare #Crypto #RSI #trading
RSI is a momentum indicator that can help identify when price has moved strongly.
🔻 RSI below 30 → oversold zone
🔺 RSI above 70 → overbought zone
But RSI can stay overbought or oversold during strong trends. Don't use RSI alone combine it with price structure and support/resistance.
Do you use RSI 14?
#BinanceSquare #Crypto #RSI #trading
75

·
--
🚨 BREAKING: $BTW WEEKLY RSI HITS EXTREME ZONE ⚠️
📊 Weekly RSI ≈ 95
Momentum is officially in an extreme overbought area. That puts $BTW on a major reversal-watch.
🔴 BEARISH SETUP: RSI rolls over + support breaks → pullback risk accelerates
🟢 BULLISH INVALIDATION: Price keeps making higher highs while RSI stays elevated → squeeze risk remains
⚠️ A 100X short can get liquidated fast if momentum continues. Don’t confuse an extreme RSI with a guaranteed top.
🔥 Will $BTW finally dump from here — or squeeze even higher before the reversal?
DYOR. Not financial advice.
#BTW #Crypto #RSI #Altcoins
🚨 BREAKING: $BTW WEEKLY RSI HITS EXTREME ZONE ⚠️
📊 Weekly RSI ≈ 95
Momentum is officially in an extreme overbought area. That puts $BTW on a major reversal-watch.
🔴 BEARISH SETUP: RSI rolls over + support breaks → pullback risk accelerates
🟢 BULLISH INVALIDATION: Price keeps making higher highs while RSI stays elevated → squeeze risk remains
⚠️ A 100X short can get liquidated fast if momentum continues. Don’t confuse an extreme RSI with a guaranteed top.
🔥 Will $BTW finally dump from here — or squeeze even higher before the reversal?
DYOR. Not financial advice.
#BTW #Crypto #RSI #Altcoins
📊 Weekly RSI ≈ 95
Momentum is officially in an extreme overbought area. That puts $BTW on a major reversal-watch.
🔴 BEARISH SETUP: RSI rolls over + support breaks → pullback risk accelerates
🟢 BULLISH INVALIDATION: Price keeps making higher highs while RSI stays elevated → squeeze risk remains
⚠️ A 100X short can get liquidated fast if momentum continues. Don’t confuse an extreme RSI with a guaranteed top.
🔥 Will $BTW finally dump from here — or squeeze even higher before the reversal?
DYOR. Not financial advice.
#BTW #Crypto #RSI #Altcoins
111
·
--
Article
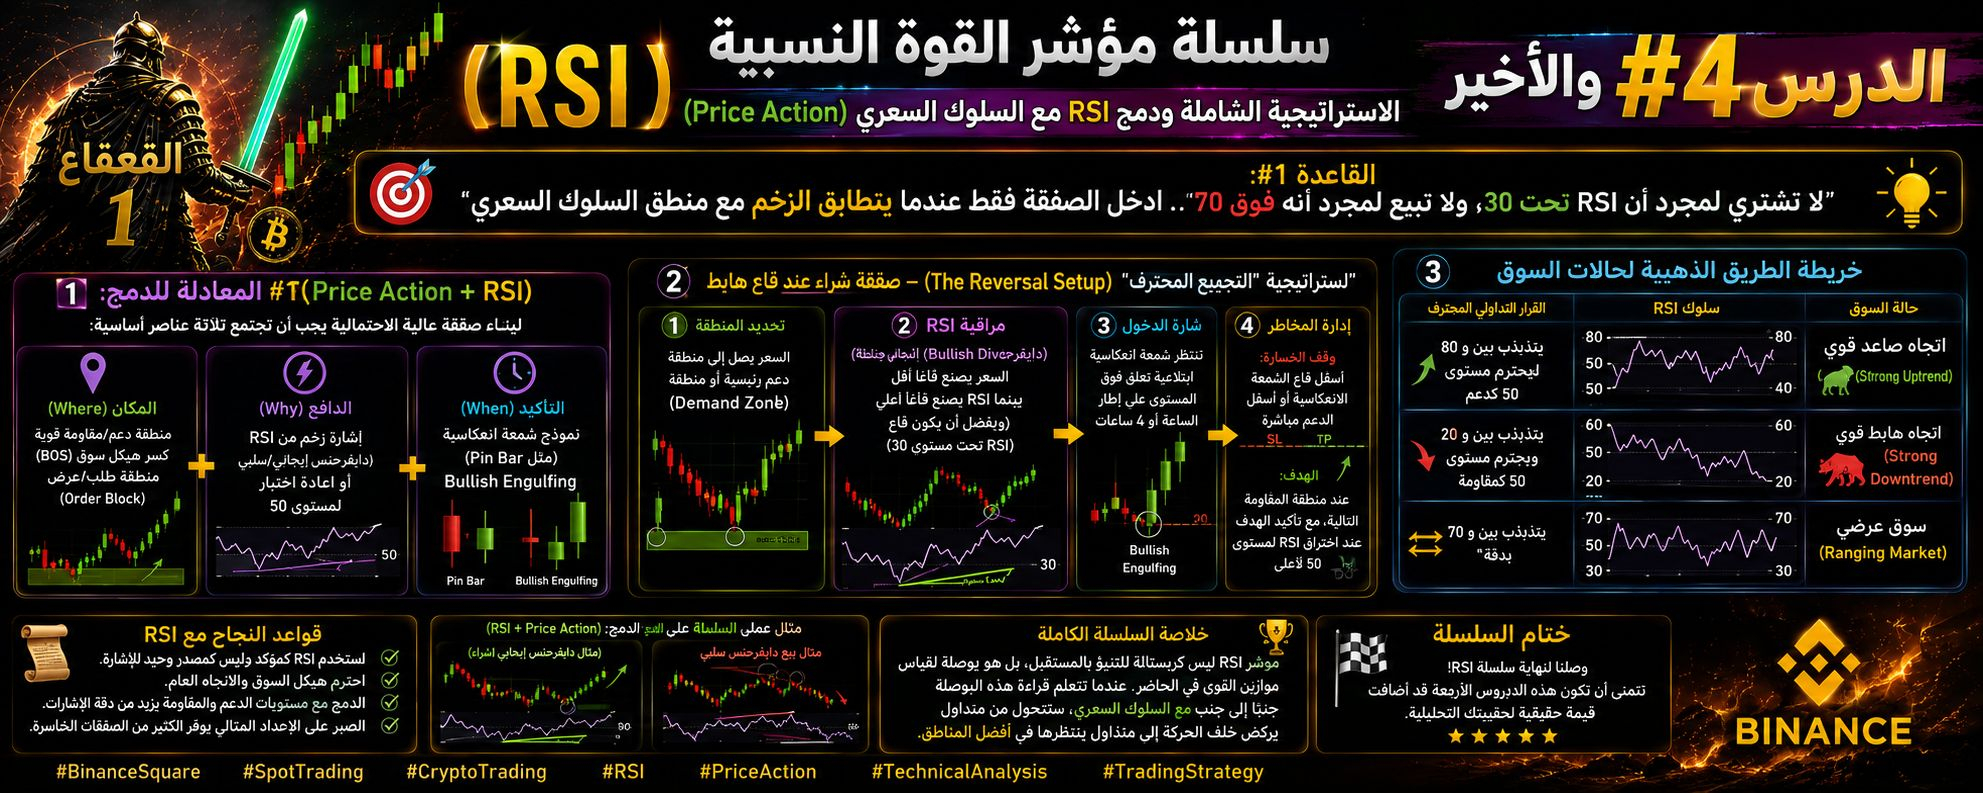
📌 Relative Strength Index (RSI) Series | Lesson #4 (Final) The comprehensive strategy and combining RSI with price action
Hello, fellow traders, at the conclusion of our educational series about the RSI indicator!
Today we reached the most important stage: how do we gather all the threads we learned into a practical trading approach and tactic?
The beginner trader uses RSI alone as a magic tool, while the professional trader uses it as a "Confluence Factor" that strengthens their analysis based on price action and market structure.
📌 Relative Strength Index (RSI) Series | Lesson #4 (Final)
The comprehensive strategy and combining RSI with price action
Hello, fellow traders, at the conclusion of our educational series about the RSI indicator!
Today we reached the most important stage: how do we gather all the threads we learned into a practical trading approach and tactic?
The beginner trader uses RSI alone as a magic tool, while the professional trader uses it as a "Confluence Factor" that strengthens their analysis based on price action and market structure.
Hello, fellow traders, at the conclusion of our educational series about the RSI indicator!
Today we reached the most important stage: how do we gather all the threads we learned into a practical trading approach and tactic?
The beginner trader uses RSI alone as a magic tool, while the professional trader uses it as a "Confluence Factor" that strengthens their analysis based on price action and market structure.
abumotaz:
👍👍👍👍
1
1
3
390

·
--
Article
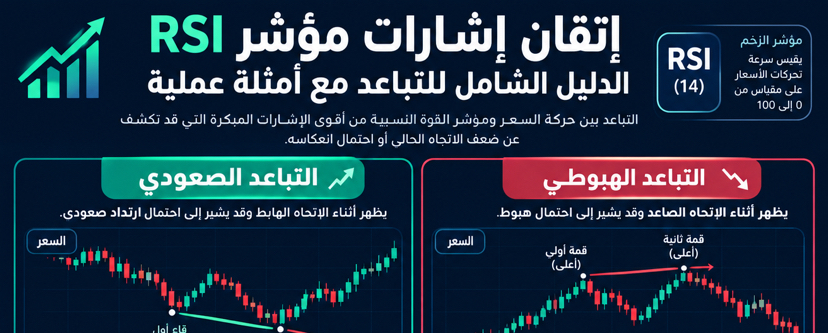
Mastering RSI Indicator Signals: A Complete Guide to Divergence with Practical ExamplesIntroduction: What is the RSI indicator?
The Relative Strength Index (RSI) is one of the most important momentum indicators in the market
Digital currencies. It measures the speed of price movements and how much they change on a scale ranging from 0 to 100.
According to the traditional rule of thumb, an indicator reading above 70 suggests that the asset is in the overbought zone, while a reading below 30 indicates the oversold zone. However, the true strength of this indicator lies in analyzing the divergence between price movement and the indicator’s movement itself.
Mastering RSI Indicator Signals: A Complete Guide to Divergence with Practical Examples
Introduction: What is the RSI indicator?
The Relative Strength Index (RSI) is one of the most important momentum indicators in the market
Digital currencies. It measures the speed of price movements and how much they change on a scale ranging from 0 to 100.
According to the traditional rule of thumb, an indicator reading above 70 suggests that the asset is in the overbought zone, while a reading below 30 indicates the oversold zone. However, the true strength of this indicator lies in analyzing the divergence between price movement and the indicator’s movement itself.
The Relative Strength Index (RSI) is one of the most important momentum indicators in the market
Digital currencies. It measures the speed of price movements and how much they change on a scale ranging from 0 to 100.
According to the traditional rule of thumb, an indicator reading above 70 suggests that the asset is in the overbought zone, while a reading below 30 indicates the oversold zone. However, the true strength of this indicator lies in analyzing the divergence between price movement and the indicator’s movement itself.
1
1
80
·
--
Article
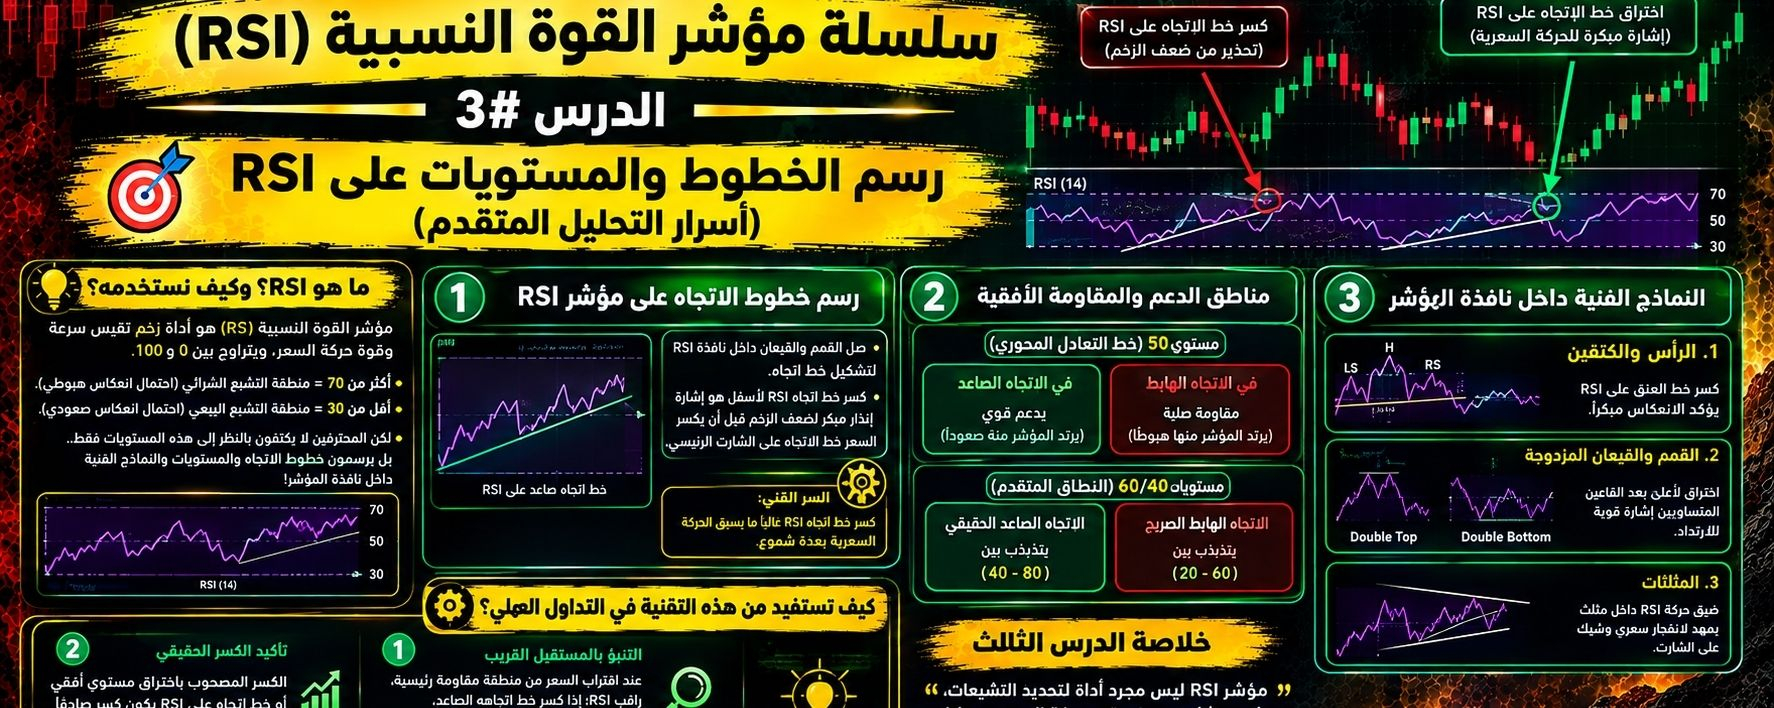
📌 Relative Strength Index (RSI) Series | Lesson #3: Drawing Trendlines and Levels on RSI (Advanced Analysis Secrets)Welcome back, fellow traders, to the third station of our series!
Most traders limit themselves to looking at the RSI indicator line oscillating between 30 and 70. But professionals treat the indicator window exactly the way they treat the main chart: they draw trendlines on it, support and resistance zones, and even technical patterns!
📌 Relative Strength Index (RSI) Series | Lesson #3: Drawing Trendlines and Levels on RSI (Advanced Analysis Secrets)
Welcome back, fellow traders, to the third station of our series!
Most traders limit themselves to looking at the RSI indicator line oscillating between 30 and 70. But professionals treat the indicator window exactly the way they treat the main chart: they draw trendlines on it, support and resistance zones, and even technical patterns!
Most traders limit themselves to looking at the RSI indicator line oscillating between 30 and 70. But professionals treat the indicator window exactly the way they treat the main chart: they draw trendlines on it, support and resistance zones, and even technical patterns!
3
174

·
--
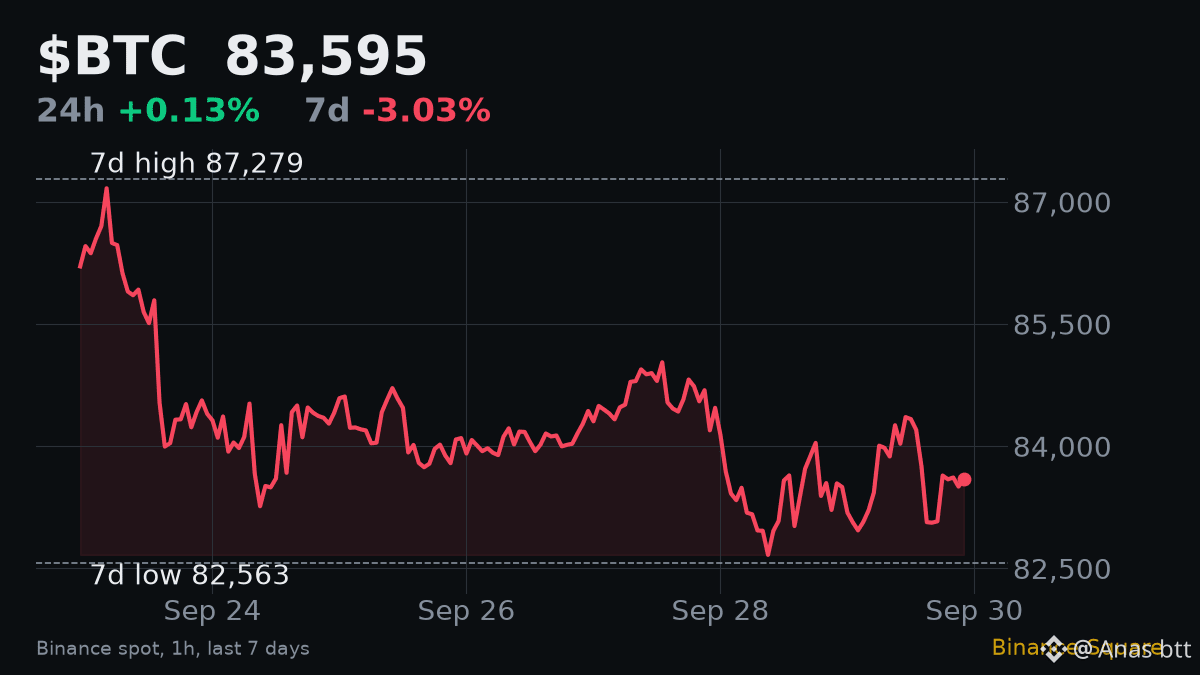
Hourly RSI on $BTC reads 49.7 right now. Most people would call that "nothing". It is actually a useful reading, if you know what RSI can and cannot tell you.
What it is: RSI compares the size of recent up moves with recent down moves and puts the result on a 0 to 100 scale. Above 70 is called overbought, below 30 oversold. Around 50, buyers and sellers are roughly balanced.
Trap 1: treating 70 as a sell signal. In a strong trend RSI can stay above 70 for a long time while price keeps climbing. High RSI means strong momentum, not a top.
Trap 2: ignoring the timeframe. The 49.7 here is on 1-hour candles. It describes roughly the last 14 hours, not the bigger picture.
Trap 3: reading RSI alone. Look at the context. BTC is at 83,595, down 3.0% on the week and 4.2% under its 7-day high of 87,279. After that drop, an hourly RSI near 50 tells me the selling pressure has faded. It does not tell me buyers have taken over. Volume at 0.81 times its weekly average agrees: nobody is pushing hard either way.
Practical takeaway: use RSI to measure how strong a move is, then confirm with price levels and volume before acting. Here, a break of the 87,279 high or the 82,563 low on rising volume would matter far more than any RSI number.
#RSI #TechnicalAnalysis
Hourly RSI on $BTC reads 49.7 right now. Most people would call that "nothing". It is actually a useful reading, if you know what RSI can and cannot tell you.
What it is: RSI compares the size of recent up moves with recent down moves and puts the result on a 0 to 100 scale. Above 70 is called overbought, below 30 oversold. Around 50, buyers and sellers are roughly balanced.
Trap 1: treating 70 as a sell signal. In a strong trend RSI can stay above 70 for a long time while price keeps climbing. High RSI means strong momentum, not a top.
Trap 2: ignoring the timeframe. The 49.7 here is on 1-hour candles. It describes roughly the last 14 hours, not the bigger picture.
Trap 3: reading RSI alone. Look at the context. BTC is at 83,595, down 3.0% on the week and 4.2% under its 7-day high of 87,279. After that drop, an hourly RSI near 50 tells me the selling pressure has faded. It does not tell me buyers have taken over. Volume at 0.81 times its weekly average agrees: nobody is pushing hard either way.
Practical takeaway: use RSI to measure how strong a move is, then confirm with price levels and volume before acting. Here, a break of the 87,279 high or the 82,563 low on rising volume would matter far more than any RSI number.
#RSI #TechnicalAnalysis
What it is: RSI compares the size of recent up moves with recent down moves and puts the result on a 0 to 100 scale. Above 70 is called overbought, below 30 oversold. Around 50, buyers and sellers are roughly balanced.
Trap 1: treating 70 as a sell signal. In a strong trend RSI can stay above 70 for a long time while price keeps climbing. High RSI means strong momentum, not a top.
Trap 2: ignoring the timeframe. The 49.7 here is on 1-hour candles. It describes roughly the last 14 hours, not the bigger picture.
Trap 3: reading RSI alone. Look at the context. BTC is at 83,595, down 3.0% on the week and 4.2% under its 7-day high of 87,279. After that drop, an hourly RSI near 50 tells me the selling pressure has faded. It does not tell me buyers have taken over. Volume at 0.81 times its weekly average agrees: nobody is pushing hard either way.
Practical takeaway: use RSI to measure how strong a move is, then confirm with price levels and volume before acting. Here, a break of the 87,279 high or the 82,563 low on rising volume would matter far more than any RSI number.
#RSI #TechnicalAnalysis
1
66
·
--
Article
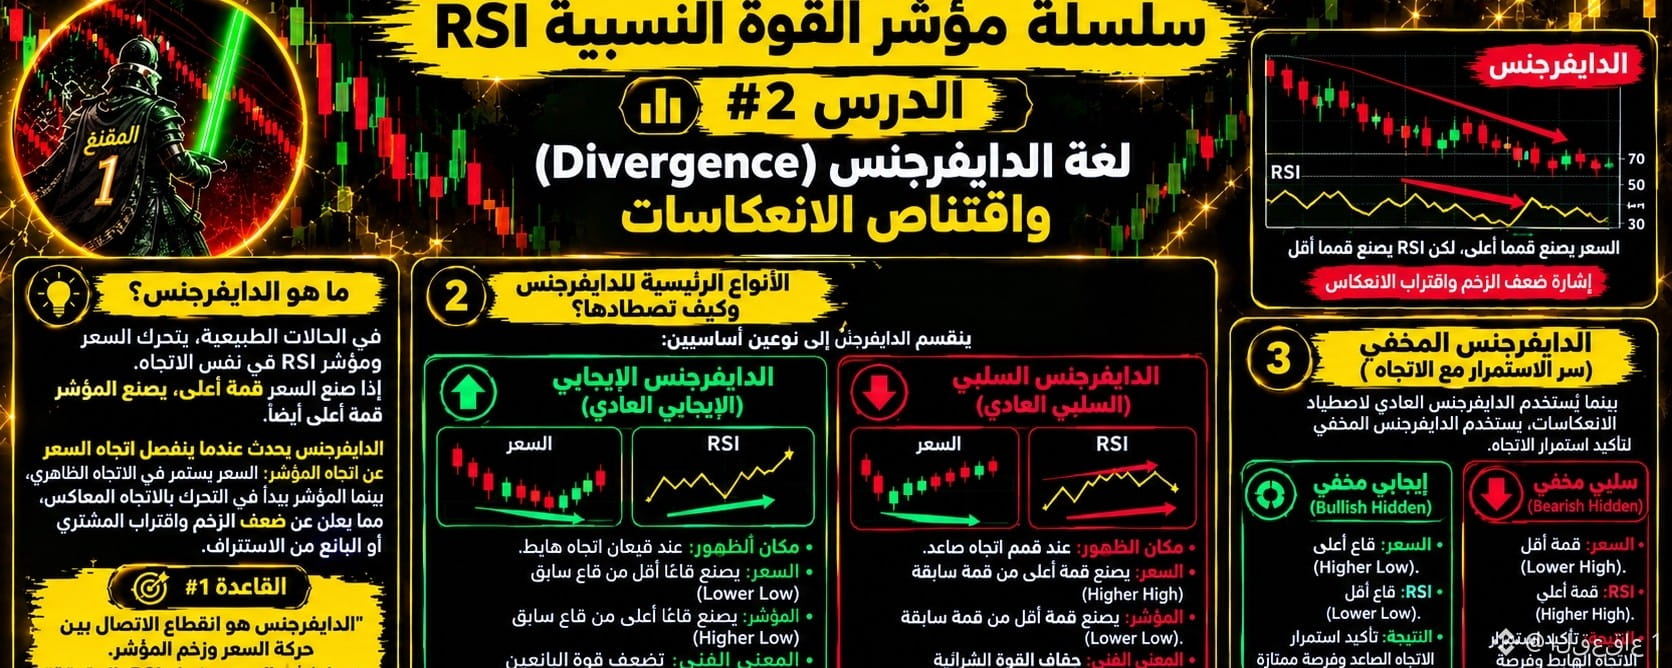
📌 Relative Strength Index (RSI) Series | Lesson #2: The Language of Divergence and Capturing ReversalsHello again, my fellow traders! After we understood in the first lesson the math and philosophy behind the RSI indicator, today we move on to one of the strongest professional trading tools: divergence (the difference/contradiction).
If price reflects what appears on the surface, divergence allows you to see what’s happening beneath it and read the intentions of the market maker before the price explosion.
📌 Relative Strength Index (RSI) Series | Lesson #2: The Language of Divergence and Capturing Reversals
Hello again, my fellow traders! After we understood in the first lesson the math and philosophy behind the RSI indicator, today we move on to one of the strongest professional trading tools: divergence (the difference/contradiction).
If price reflects what appears on the surface, divergence allows you to see what’s happening beneath it and read the intentions of the market maker before the price explosion.
If price reflects what appears on the surface, divergence allows you to see what’s happening beneath it and read the intentions of the market maker before the price explosion.
2
235

·
--
📚 Crypto Education — RSI
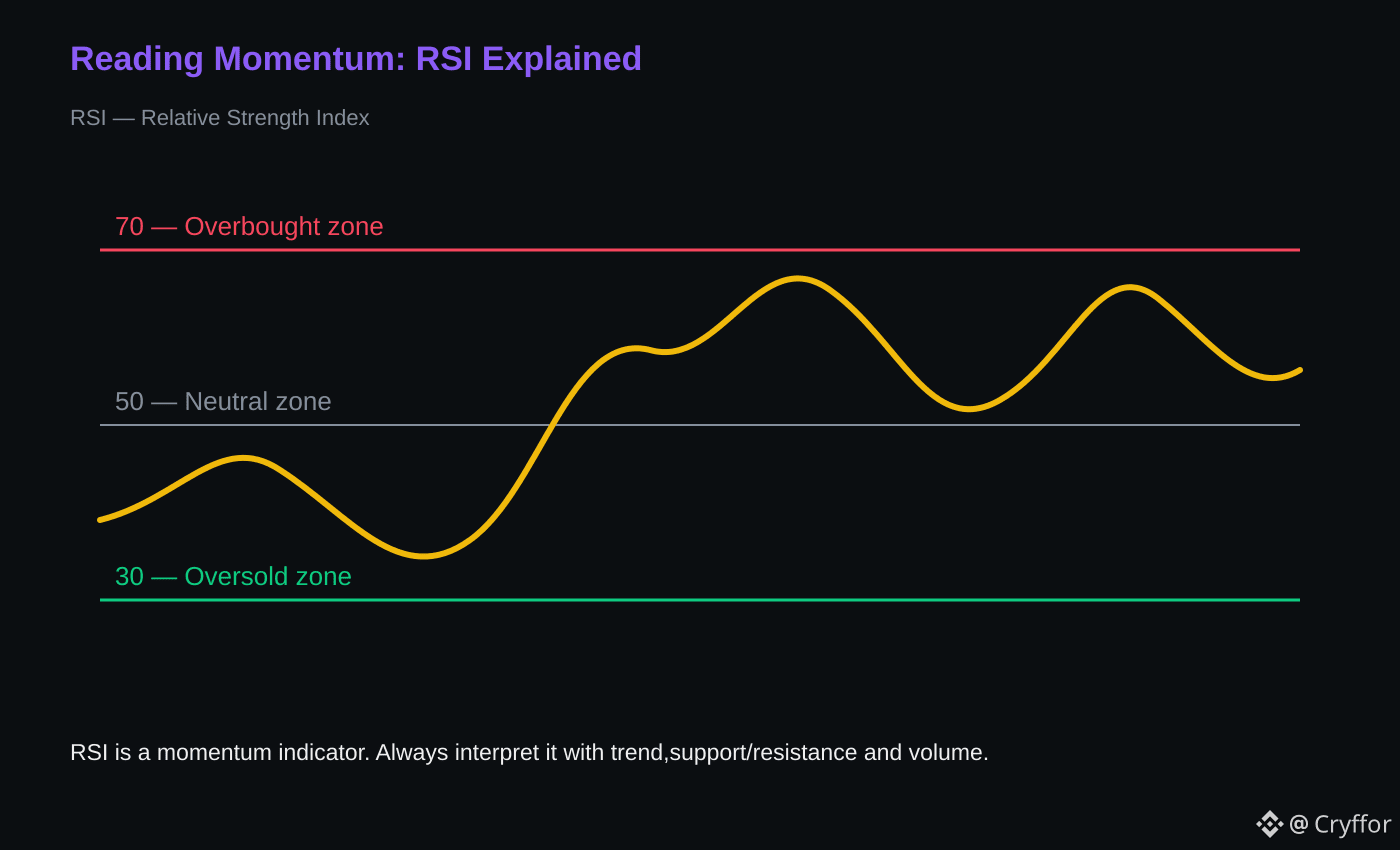
⚡ RSI measures momentum.
🟢 Above 70: strong momentum / potentially overextended
🟡 Around 50: balanced momentum
🔴 Below 30: weak momentum / potentially oversold
📊 RSI should not be used alone.
🔎 Price structure, volume and trend can provide confirmation.
👀 Context matters.
🤔 Do you combine RSI with another indicator?
#CryptoEducation #Binance #RSI #TechnicalAnalysis
📚 Crypto Education — RSI
⚡ RSI measures momentum.
🟢 Above 70: strong momentum / potentially overextended
🟡 Around 50: balanced momentum
🔴 Below 30: weak momentum / potentially oversold
📊 RSI should not be used alone.
🔎 Price structure, volume and trend can provide confirmation.
👀 Context matters.
🤔 Do you combine RSI with another indicator?
#CryptoEducation #Binance #RSI #TechnicalAnalysis
⚡ RSI measures momentum.
🟢 Above 70: strong momentum / potentially overextended
🟡 Around 50: balanced momentum
🔴 Below 30: weak momentum / potentially oversold
📊 RSI should not be used alone.
🔎 Price structure, volume and trend can provide confirmation.
👀 Context matters.
🤔 Do you combine RSI with another indicator?
#CryptoEducation #Binance #RSI #TechnicalAnalysis
·
--
Article
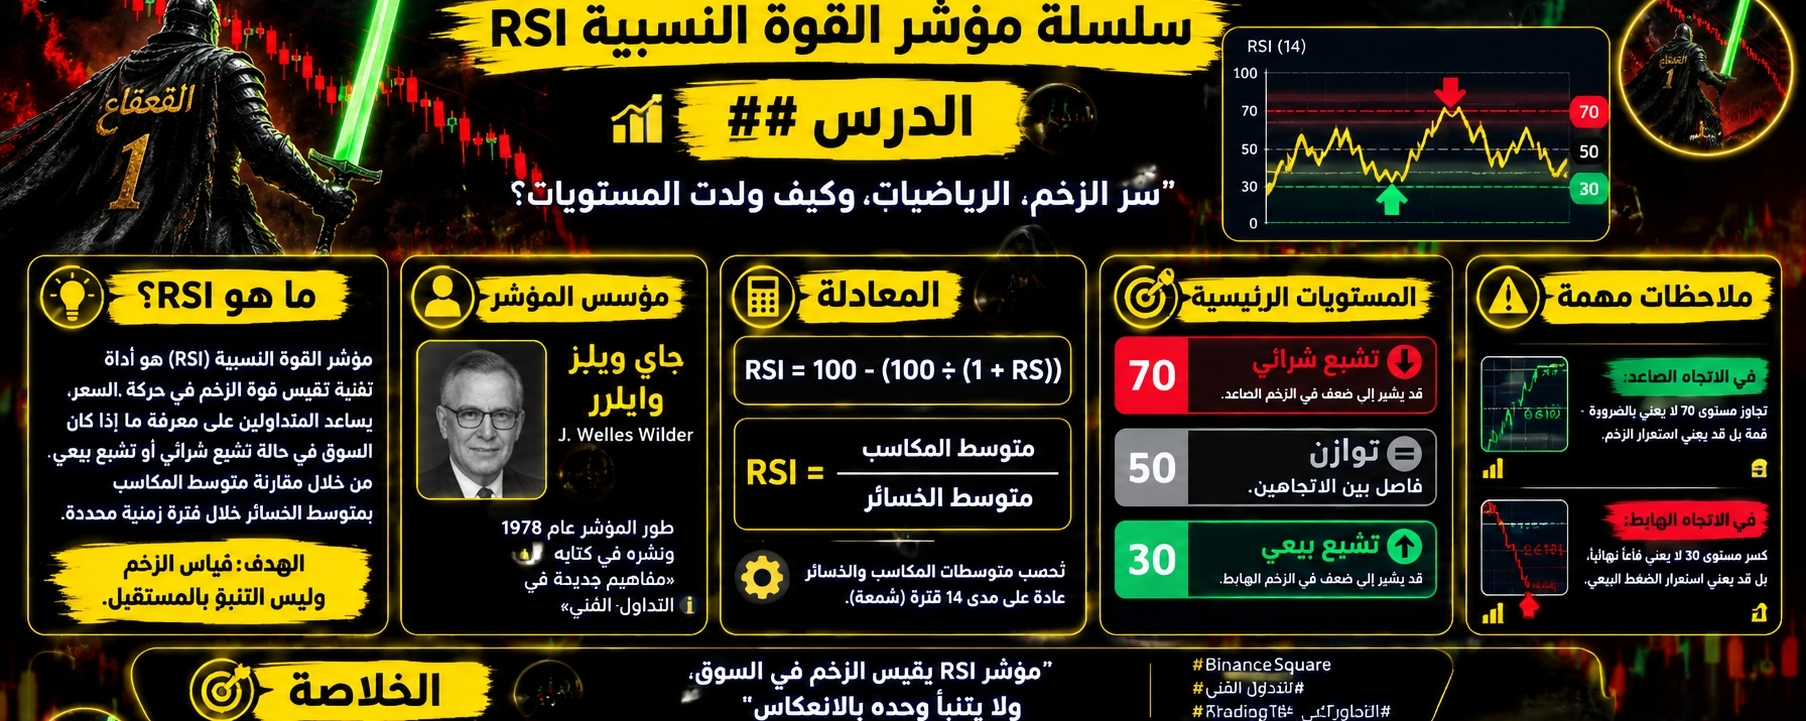
📌 Relative Strength Index (RSI) Indicator Series | Lesson #1: The Secret of Momentum, the Math, and How the Levels Were Born?Hello traders! Welcome to the first stop of our new series. To trade with the Relative Strength Index (RSI) like a professional, it’s not enough to place it on the chart and wait for its crossovers; you must understand where these numbers come from, and what mathematical magic and behavioral law lie behind them.
---
🎯 Rule #1: "The RSI indicator is not just a line moving up and down the chart.. it is a momentum scale that translates price acceleration and traders’ psychology into precise numerical values"
📌 Relative Strength Index (RSI) Indicator Series | Lesson #1: The Secret of Momentum, the Math, and How the Levels Were Born?
Hello traders! Welcome to the first stop of our new series. To trade with the Relative Strength Index (RSI) like a professional, it’s not enough to place it on the chart and wait for its crossovers; you must understand where these numbers come from, and what mathematical magic and behavioral law lie behind them.
---
🎯 Rule #1: "The RSI indicator is not just a line moving up and down the chart.. it is a momentum scale that translates price acceleration and traders’ psychology into precise numerical values"
---
🎯 Rule #1: "The RSI indicator is not just a line moving up and down the chart.. it is a momentum scale that translates price acceleration and traders’ psychology into precise numerical values"
2
305


Article
Mastering the RSI Indicator: How to Spot Overbought and Oversold Zones in Crypto TradingIn the fast-paced world of cryptocurrency trading, timing your market entries and exits is crucial. Whether you are a spot trader aiming to stack satoshis or a futures trader looking for quick scalp opportunities, relying on intuition alone can be risky.
This is where technical analysis tools come in—and among them, the Relative Strength Index (RSI) stands out as one of the most popular and versatile momentum indicators.
In this guide, we will break down what the RSI indicator is, how it works, and how to effectively use its overbought and oversold zones to make smarter trading decisions on platforms like Binance.
1. What is the RSI Indicator?
Developed by J. Welles Wilder Jr. in 1978, the Relative Strength Index (RSI) is a momentum oscillator that measures the speed and change of price movements.
The Scale: RSI moves on a scale from 0 to 100.
Default Setting: The standard lookback period is 14 periods (e.g., 14 hours on a 1H chart, or 14 days on a Daily chart).Core Purpose: It tells you whether an asset is gaining upside momentum or succumbing to selling pressure relative to its recent history.
2. Understanding Overbought and Oversold Zones
The primary way traders utilize RSI is by looking at fixed thresholds that indicate extreme price movements:
A. The Overbought Zone (RSI > 70)
What it means: When the RSI crosses above 70, the asset has experienced rapid upward price momentum. The market may be overheating, driven by FOMO (Fear of Missing Out).
Trader Action: An RSI above 70 does not mean you should short immediately. Instead, it serves as a warning sign that momentum might be stretching thin, signaling a potential pullback or consolidation phase. It is often a good time to take partial profits or tighten stop-losses.
B. The Oversold Zone (RSI < 30)
What it means: When the RSI drops below 30, the asset has suffered heavy selling pressure in a short period. Panic selling may have pushed the price below its intrinsic short-term value.
Trader Action: An RSI below 30 signals that the selling momentum may be weakening, opening the door for a potential bounce or relief rally. Traders monitor this zone for potential buy setups.
3. Key Rules for Trading RSI Reversals
To avoid falling into common market traps, follow these essential rules when trading RSI signals:
Rule 1: Wait for the Exit Cross
Never enter a trade just because RSI touches 70 or 30. During strong trend moves, RSI can stay overbought or oversold for extended periods.
Buy Signal: Wait for RSI to dip below 30 and then cross back above 30.
Sell/Take-Profit Signal: Wait for RSI to rise above 70 and then cross back below 70.
Rule 2: Adjust Thresholds Based on Market Conditions
Market context matters. Standard 70/30 levels work best in range-bound (sideways) markets.
In Strong Uptrends (Bull Market): RSI tends to stay between 40 and 80. Look for buying opportunities when RSI pulls back to 40–50 instead of waiting for 30.
In Strong Downtrends (Bear Market): RSI tends to stay between 20 and 60. Resistance often forms near 50–60, rather than 70.
Rule 3: Look for Divergences (Advanced Confirmation)
Divergences occur when price action and the RSI indicator move in opposite directions, offering high-probability reversal signals:
Bullish Divergence: The price makes a Lower Low, but the RSI makes a Higher Low. This shows selling pressure is fading—a strong buy signal.
Bearish Divergence: The price makes a Higher High, but the RSI makes a Lower High. This shows buying pressure is fading—a strong exit or short signal.
4. Common RSI Mistakes to Avoid
Blindly Buying/Selling Extreme Levels: Entering a short trade simply because RSI hit 75 in a strong bull run can blow up your account. Always wait for confirmation.
Ignoring Lower Timeframe Noise: On 1-minute or 5-minute charts, RSI frequently spikes into overbought or oversold territory. Stick to higher timeframes (1H, 4H, 1D) for reliable signals.
Using RSI in Isolation: RSI should never be your sole decision maker. Always combine it with key support/resistance levels, candlestick patterns, or volume indicators on Binance charts.
#RSI #TechnicalAnalysis #CryptoTrading #Binance e #CryptoEducation #TradingTips #bitcoin #Altcoins #BinanceSquare
Mastering the RSI Indicator: How to Spot Overbought and Oversold Zones in Crypto Trading
In the fast-paced world of cryptocurrency trading, timing your market entries and exits is crucial. Whether you are a spot trader aiming to stack satoshis or a futures trader looking for quick scalp opportunities, relying on intuition alone can be risky.
This is where technical analysis tools come in—and among them, the Relative Strength Index (RSI) stands out as one of the most popular and versatile momentum indicators.
In this guide, we will break down what the RSI indicator is, how it works, and how to effectively use its overbought and oversold zones to make smarter trading decisions on platforms like Binance.
1. What is the RSI Indicator?
Developed by J. Welles Wilder Jr. in 1978, the Relative Strength Index (RSI) is a momentum oscillator that measures the speed and change of price movements.
The Scale: RSI moves on a scale from 0 to 100.
Default Setting: The standard lookback period is 14 periods (e.g., 14 hours on a 1H chart, or 14 days on a Daily chart).Core Purpose: It tells you whether an asset is gaining upside momentum or succumbing to selling pressure relative to its recent history.
2. Understanding Overbought and Oversold Zones
The primary way traders utilize RSI is by looking at fixed thresholds that indicate extreme price movements:
A. The Overbought Zone (RSI > 70)
What it means: When the RSI crosses above 70, the asset has experienced rapid upward price momentum. The market may be overheating, driven by FOMO (Fear of Missing Out).
Trader Action: An RSI above 70 does not mean you should short immediately. Instead, it serves as a warning sign that momentum might be stretching thin, signaling a potential pullback or consolidation phase. It is often a good time to take partial profits or tighten stop-losses.
B. The Oversold Zone (RSI < 30)
What it means: When the RSI drops below 30, the asset has suffered heavy selling pressure in a short period. Panic selling may have pushed the price below its intrinsic short-term value.
Trader Action: An RSI below 30 signals that the selling momentum may be weakening, opening the door for a potential bounce or relief rally. Traders monitor this zone for potential buy setups.
3. Key Rules for Trading RSI Reversals
To avoid falling into common market traps, follow these essential rules when trading RSI signals:
Rule 1: Wait for the Exit Cross
Never enter a trade just because RSI touches 70 or 30. During strong trend moves, RSI can stay overbought or oversold for extended periods.
Buy Signal: Wait for RSI to dip below 30 and then cross back above 30.
Sell/Take-Profit Signal: Wait for RSI to rise above 70 and then cross back below 70.
Rule 2: Adjust Thresholds Based on Market Conditions
Market context matters. Standard 70/30 levels work best in range-bound (sideways) markets.
In Strong Uptrends (Bull Market): RSI tends to stay between 40 and 80. Look for buying opportunities when RSI pulls back to 40–50 instead of waiting for 30.
In Strong Downtrends (Bear Market): RSI tends to stay between 20 and 60. Resistance often forms near 50–60, rather than 70.
Rule 3: Look for Divergences (Advanced Confirmation)
Divergences occur when price action and the RSI indicator move in opposite directions, offering high-probability reversal signals:
Bullish Divergence: The price makes a Lower Low, but the RSI makes a Higher Low. This shows selling pressure is fading—a strong buy signal.
Bearish Divergence: The price makes a Higher High, but the RSI makes a Lower High. This shows buying pressure is fading—a strong exit or short signal.
4. Common RSI Mistakes to Avoid
Blindly Buying/Selling Extreme Levels: Entering a short trade simply because RSI hit 75 in a strong bull run can blow up your account. Always wait for confirmation.
Ignoring Lower Timeframe Noise: On 1-minute or 5-minute charts, RSI frequently spikes into overbought or oversold territory. Stick to higher timeframes (1H, 4H, 1D) for reliable signals.
Using RSI in Isolation: RSI should never be your sole decision maker. Always combine it with key support/resistance levels, candlestick patterns, or volume indicators on Binance charts.
#RSI #TechnicalAnalysis #CryptoTrading #Binance e #CryptoEducation #TradingTips #bitcoin #Altcoins #BinanceSquare
This is where technical analysis tools come in—and among them, the Relative Strength Index (RSI) stands out as one of the most popular and versatile momentum indicators.
In this guide, we will break down what the RSI indicator is, how it works, and how to effectively use its overbought and oversold zones to make smarter trading decisions on platforms like Binance.
1. What is the RSI Indicator?
Developed by J. Welles Wilder Jr. in 1978, the Relative Strength Index (RSI) is a momentum oscillator that measures the speed and change of price movements.
The Scale: RSI moves on a scale from 0 to 100.
Default Setting: The standard lookback period is 14 periods (e.g., 14 hours on a 1H chart, or 14 days on a Daily chart).Core Purpose: It tells you whether an asset is gaining upside momentum or succumbing to selling pressure relative to its recent history.
2. Understanding Overbought and Oversold Zones
The primary way traders utilize RSI is by looking at fixed thresholds that indicate extreme price movements:
A. The Overbought Zone (RSI > 70)
What it means: When the RSI crosses above 70, the asset has experienced rapid upward price momentum. The market may be overheating, driven by FOMO (Fear of Missing Out).
Trader Action: An RSI above 70 does not mean you should short immediately. Instead, it serves as a warning sign that momentum might be stretching thin, signaling a potential pullback or consolidation phase. It is often a good time to take partial profits or tighten stop-losses.
B. The Oversold Zone (RSI < 30)
What it means: When the RSI drops below 30, the asset has suffered heavy selling pressure in a short period. Panic selling may have pushed the price below its intrinsic short-term value.
Trader Action: An RSI below 30 signals that the selling momentum may be weakening, opening the door for a potential bounce or relief rally. Traders monitor this zone for potential buy setups.
3. Key Rules for Trading RSI Reversals
To avoid falling into common market traps, follow these essential rules when trading RSI signals:
Rule 1: Wait for the Exit Cross
Never enter a trade just because RSI touches 70 or 30. During strong trend moves, RSI can stay overbought or oversold for extended periods.
Buy Signal: Wait for RSI to dip below 30 and then cross back above 30.
Sell/Take-Profit Signal: Wait for RSI to rise above 70 and then cross back below 70.
Rule 2: Adjust Thresholds Based on Market Conditions
Market context matters. Standard 70/30 levels work best in range-bound (sideways) markets.
In Strong Uptrends (Bull Market): RSI tends to stay between 40 and 80. Look for buying opportunities when RSI pulls back to 40–50 instead of waiting for 30.
In Strong Downtrends (Bear Market): RSI tends to stay between 20 and 60. Resistance often forms near 50–60, rather than 70.
Rule 3: Look for Divergences (Advanced Confirmation)
Divergences occur when price action and the RSI indicator move in opposite directions, offering high-probability reversal signals:
Bullish Divergence: The price makes a Lower Low, but the RSI makes a Higher Low. This shows selling pressure is fading—a strong buy signal.
Bearish Divergence: The price makes a Higher High, but the RSI makes a Lower High. This shows buying pressure is fading—a strong exit or short signal.
4. Common RSI Mistakes to Avoid
Blindly Buying/Selling Extreme Levels: Entering a short trade simply because RSI hit 75 in a strong bull run can blow up your account. Always wait for confirmation.
Ignoring Lower Timeframe Noise: On 1-minute or 5-minute charts, RSI frequently spikes into overbought or oversold territory. Stick to higher timeframes (1H, 4H, 1D) for reliable signals.
Using RSI in Isolation: RSI should never be your sole decision maker. Always combine it with key support/resistance levels, candlestick patterns, or volume indicators on Binance charts.
#RSI #TechnicalAnalysis #CryptoTrading #Binance e #CryptoEducation #TradingTips #bitcoin #Altcoins #BinanceSquare
60

O RSI DA PEPE MOSTRA O MOMENTO ATUAL!
On the 4-hour chart:
🔥 RSI(14): 45.6
The RSI is near the neutral zone of 50 and still remains well above the oversold region.
This shows that:
📊 Momentum is in an intermediate range.
📊 The RSI has not yet entered oversold.
📊 The move continues to be closely monitored by the market.
$PEPE continues showing an RSI reading far from the extremes.
Now is the time!
{spot}(PEPEUSDT)
#PEPE #RSI #alcoinseason
O RSI DA PEPE MOSTRA O MOMENTO ATUAL!
On the 4-hour chart:
🔥 RSI(14): 45.6
The RSI is near the neutral zone of 50 and still remains well above the oversold region.
This shows that:
📊 Momentum is in an intermediate range.
📊 The RSI has not yet entered oversold.
📊 The move continues to be closely monitored by the market.
$PEPE continues showing an RSI reading far from the extremes.
Now is the time!
#PEPE #RSI #alcoinseason
On the 4-hour chart:
🔥 RSI(14): 45.6
The RSI is near the neutral zone of 50 and still remains well above the oversold region.
This shows that:
📊 Momentum is in an intermediate range.
📊 The RSI has not yet entered oversold.
📊 The move continues to be closely monitored by the market.
$PEPE continues showing an RSI reading far from the extremes.
Now is the time!
#PEPE #RSI #alcoinseason

2
702
·
--
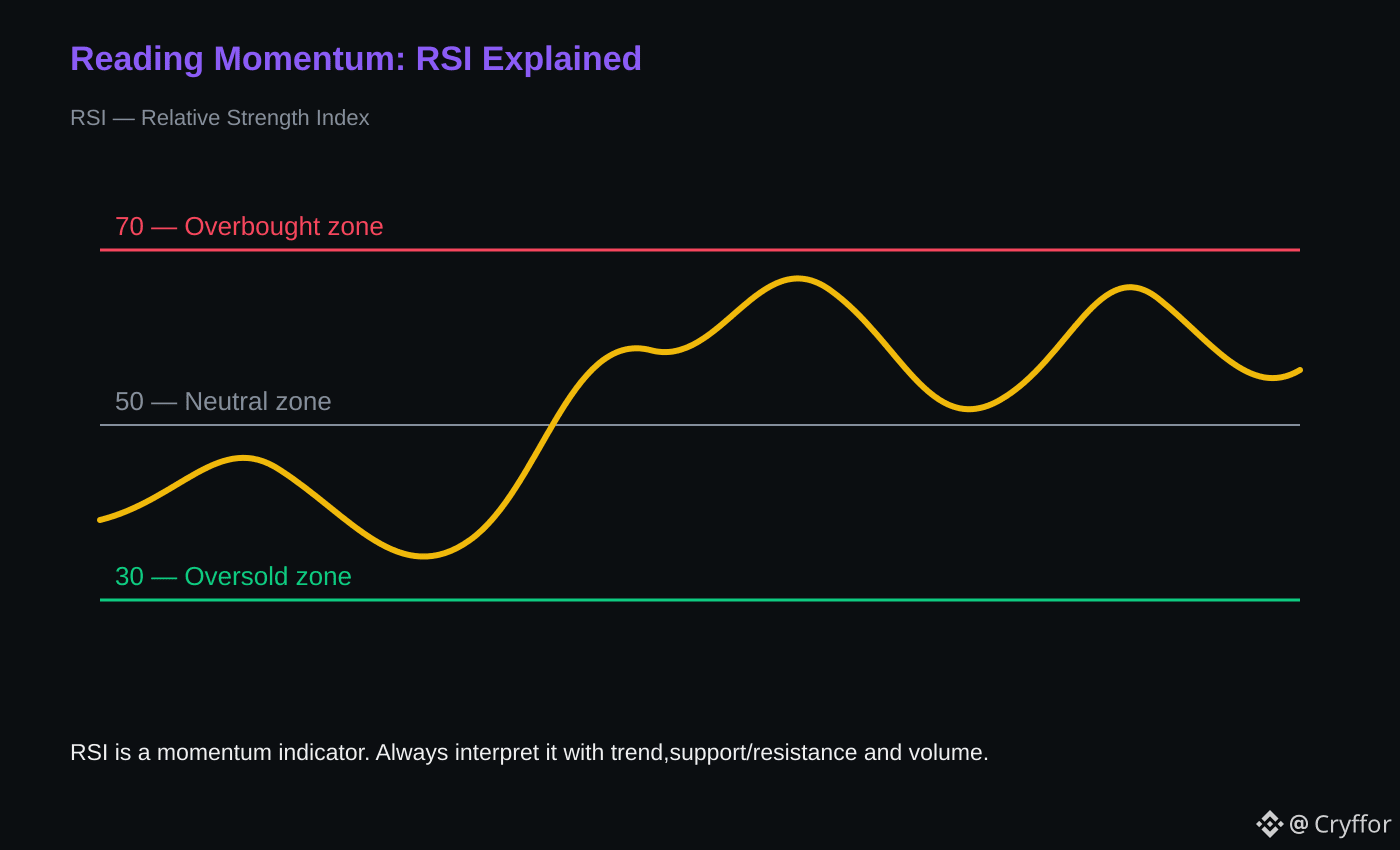
📚 Crypto Education — RSI
⚡ RSI measures momentum.
🟢 Above 70: strong momentum / potentially overextended
🟡 Around 50: balanced momentum
🔴 Below 30: weak momentum / potentially oversold
📊 RSI should not be used alone.
🔎 Price structure, volume and trend can provide confirmation.
👀 Context matters.
🤔 Do you combine RSI with another indicator?
#CryptoEducation #Binance #RSI #TechnicalAnalysis
📚 Crypto Education — RSI
⚡ RSI measures momentum.
🟢 Above 70: strong momentum / potentially overextended
🟡 Around 50: balanced momentum
🔴 Below 30: weak momentum / potentially oversold
📊 RSI should not be used alone.
🔎 Price structure, volume and trend can provide confirmation.
👀 Context matters.
🤔 Do you combine RSI with another indicator?
#CryptoEducation #Binance #RSI #TechnicalAnalysis
⚡ RSI measures momentum.
🟢 Above 70: strong momentum / potentially overextended
🟡 Around 50: balanced momentum
🔴 Below 30: weak momentum / potentially oversold
📊 RSI should not be used alone.
🔎 Price structure, volume and trend can provide confirmation.
👀 Context matters.
🤔 Do you combine RSI with another indicator?
#CryptoEducation #Binance #RSI #TechnicalAnalysis
4

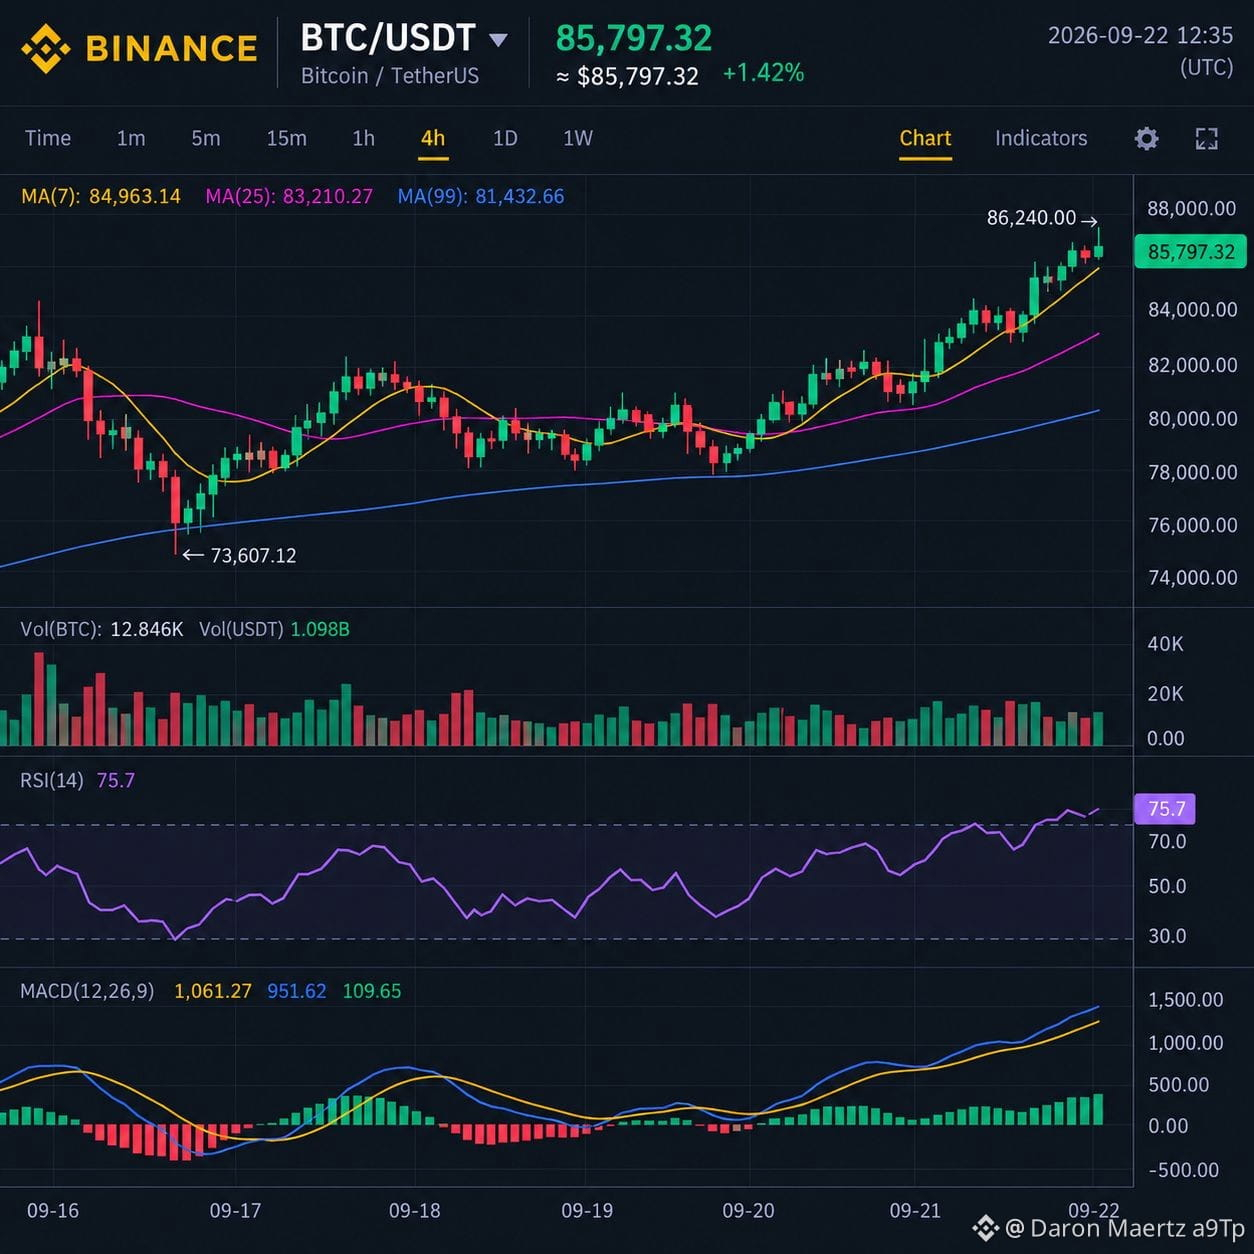
🚀BITCOIN TO THE MOON? $BTC 86,000 BREAKOUT + RSI & MACD ALIGNMENT! 🔥
Is it really the end of Crypto Winter for everyone? Or is this just a bull trap? 🤔
Friends, Bitcoin has broken through the highest level of the last 8 months—an 8-month high at $BTC 86,000. Right now, more than $648M worth of shorts have already been liquidated in the market. But before placing a trade, let’s see what the indicators are saying:
📊 Technical Analysis (RSI & MACD Update):
RSI (Relative Strength Index): On the daily chart, RSI is currently in the 72–74 zone (overbought). This shows that buying momentum is very strong, but at the same time, a short-term cooldown or minor profit-taking correction may also come.
MACD (Moving Average Convergence Divergence): The MACD line has formed a strong bullish crossover above the signal line. At the same time, the histogram bars are continuously turning green, confirming that buyers fully control the market and the trend is currently building upward momentum.
📈 Key Levels to Watch:
Current Price: ~$85,600
Target/Resistance: The next major resistance target is straight at $89,800.
Support Zone: In case of a pullback, $81,200 and $76,500 will act as strong support.
💡 Expert Strategy:
The indicators clearly suggest momentum is very bullish, but don’t fall into blind FOMO because RSI is overbought. The smarter strategy is to wait for small pullbacks instead of buying directly at the top—and always trade with a Stop-Loss!
👇 What’s your plan? Are you going long at this level or short? Share your technical view in the comments below!
#BTC☀️ #RSI #MACD #BinanceSquare
$BTC
{spot}(BTCUSDT)
🚀BITCOIN TO THE MOON? $BTC 86,000 BREAKOUT + RSI & MACD ALIGNMENT! 🔥
Is it really the end of Crypto Winter for everyone? Or is this just a bull trap? 🤔
Friends, Bitcoin has broken through the highest level of the last 8 months—an 8-month high at $BTC 86,000. Right now, more than $648M worth of shorts have already been liquidated in the market. But before placing a trade, let’s see what the indicators are saying:
📊 Technical Analysis (RSI & MACD Update):
RSI (Relative Strength Index): On the daily chart, RSI is currently in the 72–74 zone (overbought). This shows that buying momentum is very strong, but at the same time, a short-term cooldown or minor profit-taking correction may also come.
MACD (Moving Average Convergence Divergence): The MACD line has formed a strong bullish crossover above the signal line. At the same time, the histogram bars are continuously turning green, confirming that buyers fully control the market and the trend is currently building upward momentum.
📈 Key Levels to Watch:
Current Price: ~$85,600
Target/Resistance: The next major resistance target is straight at $89,800.
Support Zone: In case of a pullback, $81,200 and $76,500 will act as strong support.
💡 Expert Strategy:
The indicators clearly suggest momentum is very bullish, but don’t fall into blind FOMO because RSI is overbought. The smarter strategy is to wait for small pullbacks instead of buying directly at the top—and always trade with a Stop-Loss!
👇 What’s your plan? Are you going long at this level or short? Share your technical view in the comments below!
#BTC☀️ #RSI #MACD #BinanceSquare
$BTC
Is it really the end of Crypto Winter for everyone? Or is this just a bull trap? 🤔
Friends, Bitcoin has broken through the highest level of the last 8 months—an 8-month high at $BTC 86,000. Right now, more than $648M worth of shorts have already been liquidated in the market. But before placing a trade, let’s see what the indicators are saying:
📊 Technical Analysis (RSI & MACD Update):
RSI (Relative Strength Index): On the daily chart, RSI is currently in the 72–74 zone (overbought). This shows that buying momentum is very strong, but at the same time, a short-term cooldown or minor profit-taking correction may also come.
MACD (Moving Average Convergence Divergence): The MACD line has formed a strong bullish crossover above the signal line. At the same time, the histogram bars are continuously turning green, confirming that buyers fully control the market and the trend is currently building upward momentum.
📈 Key Levels to Watch:
Current Price: ~$85,600
Target/Resistance: The next major resistance target is straight at $89,800.
Support Zone: In case of a pullback, $81,200 and $76,500 will act as strong support.
💡 Expert Strategy:
The indicators clearly suggest momentum is very bullish, but don’t fall into blind FOMO because RSI is overbought. The smarter strategy is to wait for small pullbacks instead of buying directly at the top—and always trade with a Stop-Loss!
👇 What’s your plan? Are you going long at this level or short? Share your technical view in the comments below!
#BTC☀️ #RSI #MACD #BinanceSquare
$BTC
71
·
--
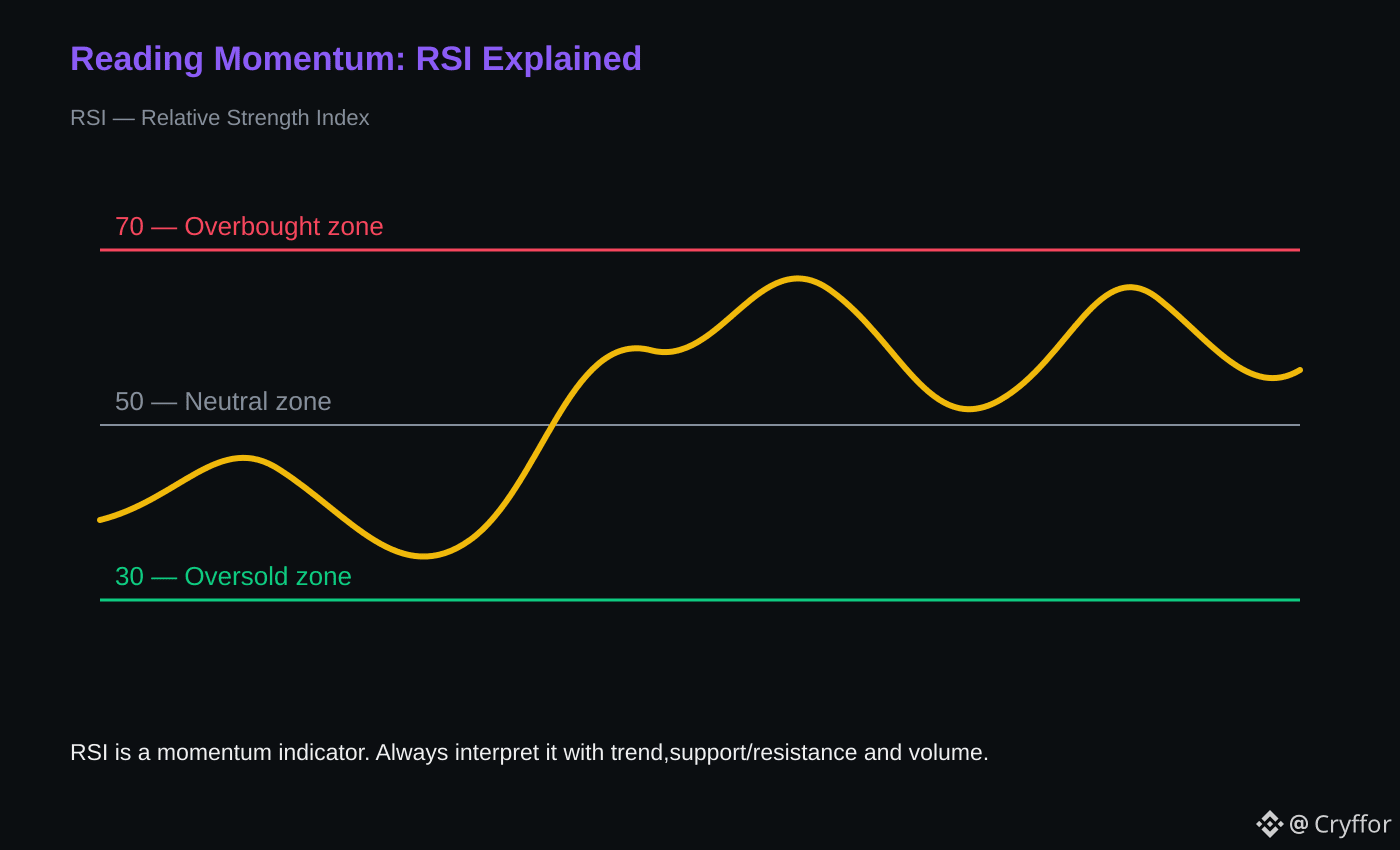
Relying on a single line to predict crypto moves is one of the fastest ways to get wrecked. Enter the Relative Strength Index (RSI), an indicator that measures momentum on a 0-100 scale.
Here is how to read the levels:
• Above 70: Typically signals strong or potentially overextended momentum. ⚡
• Around 50: Indicates balanced momentum.
• Below 30: Typically signals weak or potentially oversold momentum.
The biggest trap? Using it in isolation. 🚨 An RSI reading should never be used alone. To get proper confirmation, you must always combine RSI with price structure, volume, and the trend before making a move. 🧠
What is your favorite indicator to pair alongside RSI?
#CryptoTrading #RSI #TechnicalAnalysis #BinanceSquare
Relying on a single line to predict crypto moves is one of the fastest ways to get wrecked. Enter the Relative Strength Index (RSI), an indicator that measures momentum on a 0-100 scale.
Here is how to read the levels:
• Above 70: Typically signals strong or potentially overextended momentum. ⚡
• Around 50: Indicates balanced momentum.
• Below 30: Typically signals weak or potentially oversold momentum.
The biggest trap? Using it in isolation. 🚨 An RSI reading should never be used alone. To get proper confirmation, you must always combine RSI with price structure, volume, and the trend before making a move. 🧠
What is your favorite indicator to pair alongside RSI?
#CryptoTrading #RSI #TechnicalAnalysis #BinanceSquare
Here is how to read the levels:
• Above 70: Typically signals strong or potentially overextended momentum. ⚡
• Around 50: Indicates balanced momentum.
• Below 30: Typically signals weak or potentially oversold momentum.
The biggest trap? Using it in isolation. 🚨 An RSI reading should never be used alone. To get proper confirmation, you must always combine RSI with price structure, volume, and the trend before making a move. 🧠
What is your favorite indicator to pair alongside RSI?
#CryptoTrading #RSI #TechnicalAnalysis #BinanceSquare
1

·
--
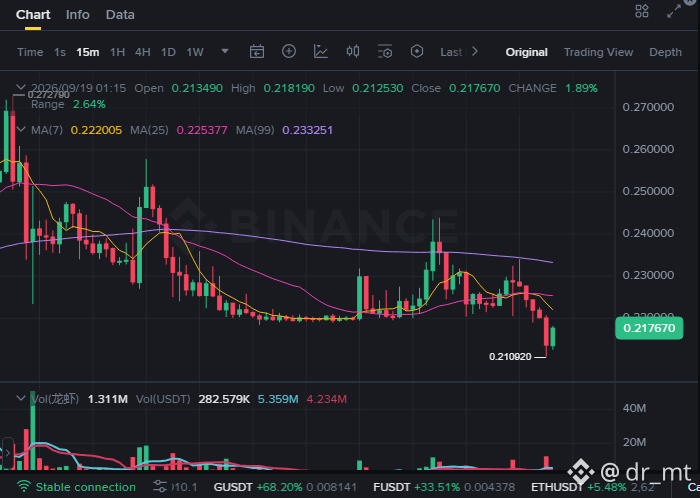
$龙虾USDT just got flushed — and now the tape is trying to bounce 🚨
This is the kind of 15M move I respect: heavy selloff first, then a strong reaction off the lows. RSI is deeply oversold, and price is trying to stabilize after tagging the lower end of the range. Not a hero call here — just a tactical long if buyers can keep defending this bounce.
ENTRY: 0.215050
That’s the area where the bounce stays actionable while price holds above the recent flush.
TP1: 0.217200
First spot to lock something in if the rebound keeps moving.
TP2: 0.219351
If momentum holds, this is the next push zone.
TP3: 0.221501
Stretch continuation target if the squeeze extends.
STOP LOSS: 0.210749
Lose that level and the long thesis is damaged.
Risk reminder: this is a fast bounce setup, not a guaranteed reversal — manage size and respect the stop ⚠️
$龙虾USDT is trying to breathe. Do you take the bounce here or wait for more confirmation? 👇
#CryptoTrading #RSI #BinanceSquare #Altcoins
$龙虾USDT just got flushed — and now the tape is trying to bounce 🚨
This is the kind of 15M move I respect: heavy selloff first, then a strong reaction off the lows. RSI is deeply oversold, and price is trying to stabilize after tagging the lower end of the range. Not a hero call here — just a tactical long if buyers can keep defending this bounce.
ENTRY: 0.215050
That’s the area where the bounce stays actionable while price holds above the recent flush.
TP1: 0.217200
First spot to lock something in if the rebound keeps moving.
TP2: 0.219351
If momentum holds, this is the next push zone.
TP3: 0.221501
Stretch continuation target if the squeeze extends.
STOP LOSS: 0.210749
Lose that level and the long thesis is damaged.
Risk reminder: this is a fast bounce setup, not a guaranteed reversal — manage size and respect the stop ⚠️
$龙虾USDT is trying to breathe. Do you take the bounce here or wait for more confirmation? 👇
#CryptoTrading #RSI #BinanceSquare #Altcoins
This is the kind of 15M move I respect: heavy selloff first, then a strong reaction off the lows. RSI is deeply oversold, and price is trying to stabilize after tagging the lower end of the range. Not a hero call here — just a tactical long if buyers can keep defending this bounce.
ENTRY: 0.215050
That’s the area where the bounce stays actionable while price holds above the recent flush.
TP1: 0.217200
First spot to lock something in if the rebound keeps moving.
TP2: 0.219351
If momentum holds, this is the next push zone.
TP3: 0.221501
Stretch continuation target if the squeeze extends.
STOP LOSS: 0.210749
Lose that level and the long thesis is damaged.
Risk reminder: this is a fast bounce setup, not a guaranteed reversal — manage size and respect the stop ⚠️
$龙虾USDT is trying to breathe. Do you take the bounce here or wait for more confirmation? 👇
#CryptoTrading #RSI #BinanceSquare #Altcoins
514

·
--
📊 Quick technical read for $BABY
• RSI (1-hour): 90.6
• Price at the time of observation: 0.01234
• Market condition: extremely overbought
• Probability of a pullback or decline: 71%
No strong upper rejection signal yet, so confirmation remains important.
The price may continue rising temporarily, so selling directly is not recommended. The best confirmation would be when signs of a downturn appear.
Price at the time of observation: 0.01234
👈 Press $BABY to follow the coin
Fisherman
Note: The probability score is an estimate and not a guarantee of price movement.
$BABY #BABY #RSI #Futures #BinanceSquare
📊 Quick technical read for $BABY
• RSI (1-hour): 90.6
• Price at the time of observation: 0.01234
• Market condition: extremely overbought
• Probability of a pullback or decline: 71%
No strong upper rejection signal yet, so confirmation remains important.
The price may continue rising temporarily, so selling directly is not recommended. The best confirmation would be when signs of a downturn appear.
Price at the time of observation: 0.01234
👈 Press $BABY to follow the coin
Fisherman
Note: The probability score is an estimate and not a guarantee of price movement.
$BABY #BABY #RSI #Futures #BinanceSquare
• RSI (1-hour): 90.6
• Price at the time of observation: 0.01234
• Market condition: extremely overbought
• Probability of a pullback or decline: 71%
No strong upper rejection signal yet, so confirmation remains important.
The price may continue rising temporarily, so selling directly is not recommended. The best confirmation would be when signs of a downturn appear.
Price at the time of observation: 0.01234
👈 Press $BABY to follow the coin
Fisherman
Note: The probability score is an estimate and not a guarantee of price movement.
$BABY #BABY #RSI #Futures #BinanceSquare
222
·
--
🎓 What happens when the RSI crosses above 90?
Here’s what’s happening right now with $GENIUS, as the RSI has reached 92.5.
There is currently no strong upward rejection signal, so confirmation remains important.
A rise in RSI doesn’t mean the price will drop immediately, but it makes it important to watch for signs of correction.
📊 Probability of correction or decline: 75%
The price may continue rising temporarily, so selling immediately is not recommended. The best confirmation is when signs of a downturn appear.
Price at the time of observation: 0.3773
👈 Press $GENIUS to follow the coin
The Fisherman
Alert: The probability score is an estimate and not a guarantee of price movement.
$GENIUS #GENIUS #RSI #Futures #BinanceSquare
🎓 What happens when the RSI crosses above 90?
Here’s what’s happening right now with $GENIUS , as the RSI has reached 92.5.
There is currently no strong upward rejection signal, so confirmation remains important.
A rise in RSI doesn’t mean the price will drop immediately, but it makes it important to watch for signs of correction.
📊 Probability of correction or decline: 75%
The price may continue rising temporarily, so selling immediately is not recommended. The best confirmation is when signs of a downturn appear.
Price at the time of observation: 0.3773
👈 Press $GENIUS to follow the coin
The Fisherman
Alert: The probability score is an estimate and not a guarantee of price movement.
$GENIUS #GENIUS #RSI #Futures #BinanceSquare
Here’s what’s happening right now with $GENIUS , as the RSI has reached 92.5.
There is currently no strong upward rejection signal, so confirmation remains important.
A rise in RSI doesn’t mean the price will drop immediately, but it makes it important to watch for signs of correction.
📊 Probability of correction or decline: 75%
The price may continue rising temporarily, so selling immediately is not recommended. The best confirmation is when signs of a downturn appear.
Price at the time of observation: 0.3773
👈 Press $GENIUS to follow the coin
The Fisherman
Alert: The probability score is an estimate and not a guarantee of price movement.
$GENIUS #GENIUS #RSI #Futures #BinanceSquare
54
·
--
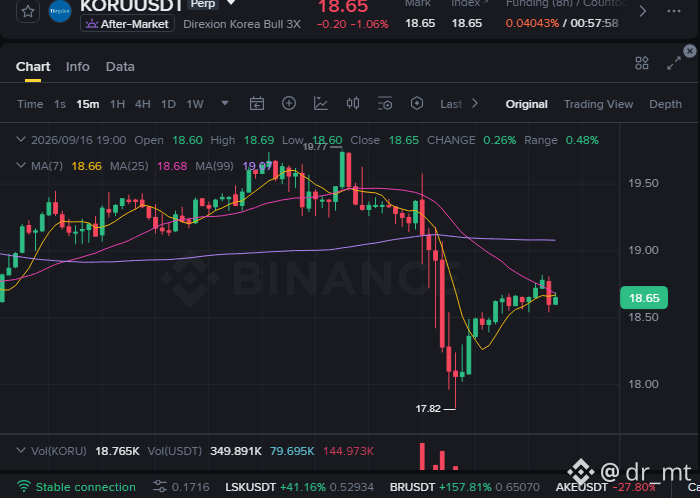
$KORU update...
RSI trade is doing its job.
Entry: 18.2900
TP1: 18.4729 ✅
TP2: 18.6558 ✅
Second target hit — nice follow-through here.
Current price: 18.6700
That’s the kind of move we want to see after an RSI setup.
Now we let the chart decide if it wants to keep extending toward TP3: 18.8387.
Manage risk. Stay sharp.
Follow for more live trade updates, and drop a comment if you’re still in this one.
#KORU #RSI #CryptoTrading
$KORU update...
RSI trade is doing its job.
Entry: 18.2900
TP1: 18.4729 ✅
TP2: 18.6558 ✅
Second target hit — nice follow-through here.
Current price: 18.6700
That’s the kind of move we want to see after an RSI setup.
Now we let the chart decide if it wants to keep extending toward TP3: 18.8387.
Manage risk. Stay sharp.
Follow for more live trade updates, and drop a comment if you’re still in this one.
#KORU #RSI #CryptoTrading
RSI trade is doing its job.
Entry: 18.2900
TP1: 18.4729 ✅
TP2: 18.6558 ✅
Second target hit — nice follow-through here.
Current price: 18.6700
That’s the kind of move we want to see after an RSI setup.
Now we let the chart decide if it wants to keep extending toward TP3: 18.8387.
Manage risk. Stay sharp.
Follow for more live trade updates, and drop a comment if you’re still in this one.
#KORU #RSI #CryptoTrading
1
200
·
--
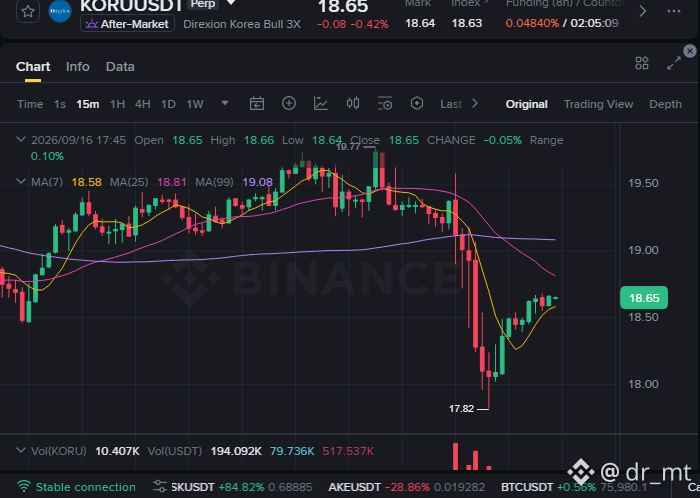
$KORU update...
TP1 at 18.4729 has been hit ✅
Entry was 18.2900
Current price: 18.6500
Nice move for the RSI setup, but now the job changes:
protect what the market has already paid you.
Some traders will scale out here...
some will move stops up...
either way, don’t let a winning trade turn into a round trip.
TP2 is 18.6558
TP3 is 18.8387
Stop loss remains 17.9242
Stay disciplined. Lock in. Let the rest run if the chart gives it to you.
Follow for more updates, and drop a comment if you’re in this one.
#KORU #CryptoTrading #RSI #BinanceSquare
$KORU update...
TP1 at 18.4729 has been hit ✅
Entry was 18.2900
Current price: 18.6500
Nice move for the RSI setup, but now the job changes:
protect what the market has already paid you.
Some traders will scale out here...
some will move stops up...
either way, don’t let a winning trade turn into a round trip.
TP2 is 18.6558
TP3 is 18.8387
Stop loss remains 17.9242
Stay disciplined. Lock in. Let the rest run if the chart gives it to you.
Follow for more updates, and drop a comment if you’re in this one.
#KORU #CryptoTrading #RSI #BinanceSquare
TP1 at 18.4729 has been hit ✅
Entry was 18.2900
Current price: 18.6500
Nice move for the RSI setup, but now the job changes:
protect what the market has already paid you.
Some traders will scale out here...
some will move stops up...
either way, don’t let a winning trade turn into a round trip.
TP2 is 18.6558
TP3 is 18.8387
Stop loss remains 17.9242
Stay disciplined. Lock in. Let the rest run if the chart gives it to you.
Follow for more updates, and drop a comment if you’re in this one.
#KORU #CryptoTrading #RSI #BinanceSquare
114
·
--
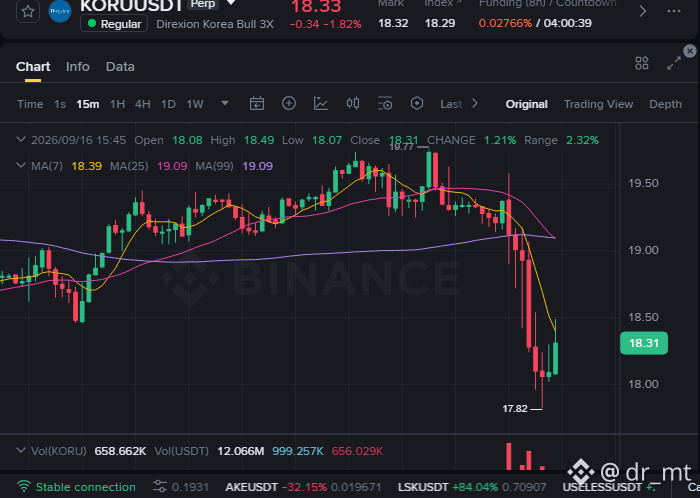
$KORU just got slammed into the floor... and buyers finally stepped in 💥
That dump to 17.82 looked heavy, but the rebound candle back into 18.30 tells me selling pressure may be cooling off here. With RSI(6) at 11.11 on the 15M, this is the kind of oversold flush where a sharp bounce can happen fast — BUT only if price keeps holding the recovery.
ENTRY: 18.2900
This is the actionable zone as the bounce tries to build.
TP1: 18.4729
First area to take some profit off the table.
TP2: 18.6558
If momentum extends, this is the next push zone.
TP3: 18.8387
Stretch target if buyers keep pressing.
STOP LOSS: 17.9242
If price loses this level, the rebound idea is broken.
Risk it properly — oversold doesn’t mean guaranteed reversal. Let the chart prove it ⚡
#KORU #CryptoTrading #RSI #Long
Are you taking the bounce or waiting for more confirmation?
$KORU just got slammed into the floor... and buyers finally stepped in 💥
That dump to 17.82 looked heavy, but the rebound candle back into 18.30 tells me selling pressure may be cooling off here. With RSI(6) at 11.11 on the 15M, this is the kind of oversold flush where a sharp bounce can happen fast — BUT only if price keeps holding the recovery.
ENTRY: 18.2900
This is the actionable zone as the bounce tries to build.
TP1: 18.4729
First area to take some profit off the table.
TP2: 18.6558
If momentum extends, this is the next push zone.
TP3: 18.8387
Stretch target if buyers keep pressing.
STOP LOSS: 17.9242
If price loses this level, the rebound idea is broken.
Risk it properly — oversold doesn’t mean guaranteed reversal. Let the chart prove it ⚡
#KORU #CryptoTrading #RSI #Long
Are you taking the bounce or waiting for more confirmation?
That dump to 17.82 looked heavy, but the rebound candle back into 18.30 tells me selling pressure may be cooling off here. With RSI(6) at 11.11 on the 15M, this is the kind of oversold flush where a sharp bounce can happen fast — BUT only if price keeps holding the recovery.
ENTRY: 18.2900
This is the actionable zone as the bounce tries to build.
TP1: 18.4729
First area to take some profit off the table.
TP2: 18.6558
If momentum extends, this is the next push zone.
TP3: 18.8387
Stretch target if buyers keep pressing.
STOP LOSS: 17.9242
If price loses this level, the rebound idea is broken.
Risk it properly — oversold doesn’t mean guaranteed reversal. Let the chart prove it ⚡
#KORU #CryptoTrading #RSI #Long
Are you taking the bounce or waiting for more confirmation?
146
Log in to explore more content
Join global crypto users on Binance Square
⚡️ Get latest and useful information about crypto.
💬 Trusted by the world’s largest crypto exchange.
👍 Discover real insights from verified creators.
Email / Phone number
Trending Topics
1
#SECApproves3xLongCryptoCommodityETPs
11 views
10 Discussing
2
#G7PlansToReleaseUpTo100MBarrelsOilDiesel
917 views
56 Discussing
3
#ICBASuesOCCOverCryptoBankCharters
558 views
38 Discussing
4
#USStocksCloseHigherOnWeakJobsData
356 views
31 Discussing
5
#NFPWatch
10.9M views
19,466 Discussing
6
#BlastToGraduallyShutDownItsL2Network
133 views
18 Discussing
7
#BitcoinFundingRateTriplesTo10%
198,806 views
1,324 Discussing
8
#BitcoinSurpasses$86KUp2.99%
65,415 views
122 Discussing
9
#ZcashFalls21%FromSeptemberPeak
105,138 views
924 Discussing
10
#USSeptemberPayrollsAdd29KUnemploymentRises4.2%
81,352 views
568 Discussing