
#orderbook
orderbook
56,799 views
357 Discussing
Hot
Latest

·
--
Most retail traders look at order books and assume visible bids will protect their downside, yet over seventy percent of surface liquidity gets pulled before price even touches it.
We have all felt the sting of buying what looks like strong support, only to watch the order book evaporate and trigger painful cascades of stop-outs. It is an exhausting cycle of catching falling knives simply because market depth appeared safer on the surface than it actually was.
Looking at current order flow, $BTC shows scattered liquidity around $80K, but this is largely thin air compared to where patient capital is positioned. The heavy bid clusters and real structural buy walls are stacked much lower down the ladder, waiting for late leverage to wash out.
I watched this exact dynamic play out across past market cycles with Bitcoin and major assets like $ETH before sustained trend reversals. Smart money rarely defends intermediate levels when they can allow impatient sellers to exhaust themselves directly into deep resting limit orders.
Are you setting bids at visible support or waiting for the deeper liquidity pools to fill?
#Bitcoin #CryptoTrading #OrderBook
Most retail traders look at order books and assume visible bids will protect their downside, yet over seventy percent of surface liquidity gets pulled before price even touches it.
We have all felt the sting of buying what looks like strong support, only to watch the order book evaporate and trigger painful cascades of stop-outs. It is an exhausting cycle of catching falling knives simply because market depth appeared safer on the surface than it actually was.
Looking at current order flow, $BTC shows scattered liquidity around $80K, but this is largely thin air compared to where patient capital is positioned. The heavy bid clusters and real structural buy walls are stacked much lower down the ladder, waiting for late leverage to wash out.
I watched this exact dynamic play out across past market cycles with Bitcoin and major assets like $ETH before sustained trend reversals. Smart money rarely defends intermediate levels when they can allow impatient sellers to exhaust themselves directly into deep resting limit orders.
Are you setting bids at visible support or waiting for the deeper liquidity pools to fill?
#Bitcoin #CryptoTrading #OrderBook
We have all felt the sting of buying what looks like strong support, only to watch the order book evaporate and trigger painful cascades of stop-outs. It is an exhausting cycle of catching falling knives simply because market depth appeared safer on the surface than it actually was.
Looking at current order flow, $BTC shows scattered liquidity around $80K, but this is largely thin air compared to where patient capital is positioned. The heavy bid clusters and real structural buy walls are stacked much lower down the ladder, waiting for late leverage to wash out.
I watched this exact dynamic play out across past market cycles with Bitcoin and major assets like $ETH before sustained trend reversals. Smart money rarely defends intermediate levels when they can allow impatient sellers to exhaust themselves directly into deep resting limit orders.
Are you setting bids at visible support or waiting for the deeper liquidity pools to fill?
#Bitcoin #CryptoTrading #OrderBook

11

·
--
Why is nobody talking about the liquidity trap currently forming above $80K?
Most traders keep FOMO buying every single bounce, only to get trapped when order books reveal where the real capital is actually positioned.
Look at the current order book depth for $BTC. Everyone is fixated on the thin layer of liquidity sitting around the $80,000 level, treating it as a guaranteed springboard. But if you analyze the depth charts, those bids are surprisingly fragile and look more like spoof orders than high-conviction accumulation.
The real institutional buy walls are actually stacked much deeper down the ladder. When major liquidity pulls back, market makers tend to let price slide directly into these heavier demand zones before any meaningful trend reversal can take place. We saw the exact same distribution behavior happen across large caps like $ETH and $SOL during previous local corrections.
Are you placing bids at current levels or waiting for the real liquidity pool to get tapped?
#Bitcoin #CryptoTrading #OrderBook
Why is nobody talking about the liquidity trap currently forming above $80K?
Most traders keep FOMO buying every single bounce, only to get trapped when order books reveal where the real capital is actually positioned.
Look at the current order book depth for $BTC . Everyone is fixated on the thin layer of liquidity sitting around the $80,000 level, treating it as a guaranteed springboard. But if you analyze the depth charts, those bids are surprisingly fragile and look more like spoof orders than high-conviction accumulation.
The real institutional buy walls are actually stacked much deeper down the ladder. When major liquidity pulls back, market makers tend to let price slide directly into these heavier demand zones before any meaningful trend reversal can take place. We saw the exact same distribution behavior happen across large caps like $ETH and $SOL during previous local corrections.
Are you placing bids at current levels or waiting for the real liquidity pool to get tapped?
#Bitcoin #CryptoTrading #OrderBook
Most traders keep FOMO buying every single bounce, only to get trapped when order books reveal where the real capital is actually positioned.
Look at the current order book depth for $BTC . Everyone is fixated on the thin layer of liquidity sitting around the $80,000 level, treating it as a guaranteed springboard. But if you analyze the depth charts, those bids are surprisingly fragile and look more like spoof orders than high-conviction accumulation.
The real institutional buy walls are actually stacked much deeper down the ladder. When major liquidity pulls back, market makers tend to let price slide directly into these heavier demand zones before any meaningful trend reversal can take place. We saw the exact same distribution behavior happen across large caps like $ETH and $SOL during previous local corrections.
Are you placing bids at current levels or waiting for the real liquidity pool to get tapped?
#Bitcoin #CryptoTrading #OrderBook
11

Tools & Features: Understand the depth of the order book
Title: How to read the Order Book (Order Book) like a pro 📖🔍
Content:
The order book displays in real time the buying intentions (green) and selling intentions (red) of market participants.
📌 3 key elements to watch:
1️⃣ Liquidity Walls: Large blocks of orders concentrated at a specific level can serve as temporary support or resistance.
2️⃣ The Spread: The difference between the highest buy price and the lowest sell price. The tighter the spread, the more liquid the pair.
3️⃣ Imbalance: A strong buy order pressure compared to sells indicates a bullish dynamic in the short term.
Observing available liquidity helps you place your Limit orders better!
#OrderBook #BinanceAcademy #TradingTips #TechnicalAnalysis #Crypto
Tools & Features: Understand the depth of the order book
Title: How to read the Order Book (Order Book) like a pro 📖🔍
Content:
The order book displays in real time the buying intentions (green) and selling intentions (red) of market participants.
📌 3 key elements to watch:
1️⃣ Liquidity Walls: Large blocks of orders concentrated at a specific level can serve as temporary support or resistance.
2️⃣ The Spread: The difference between the highest buy price and the lowest sell price. The tighter the spread, the more liquid the pair.
3️⃣ Imbalance: A strong buy order pressure compared to sells indicates a bullish dynamic in the short term.
Observing available liquidity helps you place your Limit orders better!
#OrderBook #BinanceAcademy #TradingTips #TechnicalAnalysis #Crypto
Title: How to read the Order Book (Order Book) like a pro 📖🔍
Content:
The order book displays in real time the buying intentions (green) and selling intentions (red) of market participants.
📌 3 key elements to watch:
1️⃣ Liquidity Walls: Large blocks of orders concentrated at a specific level can serve as temporary support or resistance.
2️⃣ The Spread: The difference between the highest buy price and the lowest sell price. The tighter the spread, the more liquid the pair.
3️⃣ Imbalance: A strong buy order pressure compared to sells indicates a bullish dynamic in the short term.
Observing available liquidity helps you place your Limit orders better!
#OrderBook #BinanceAcademy #TradingTips #TechnicalAnalysis #Crypto
42

·
--
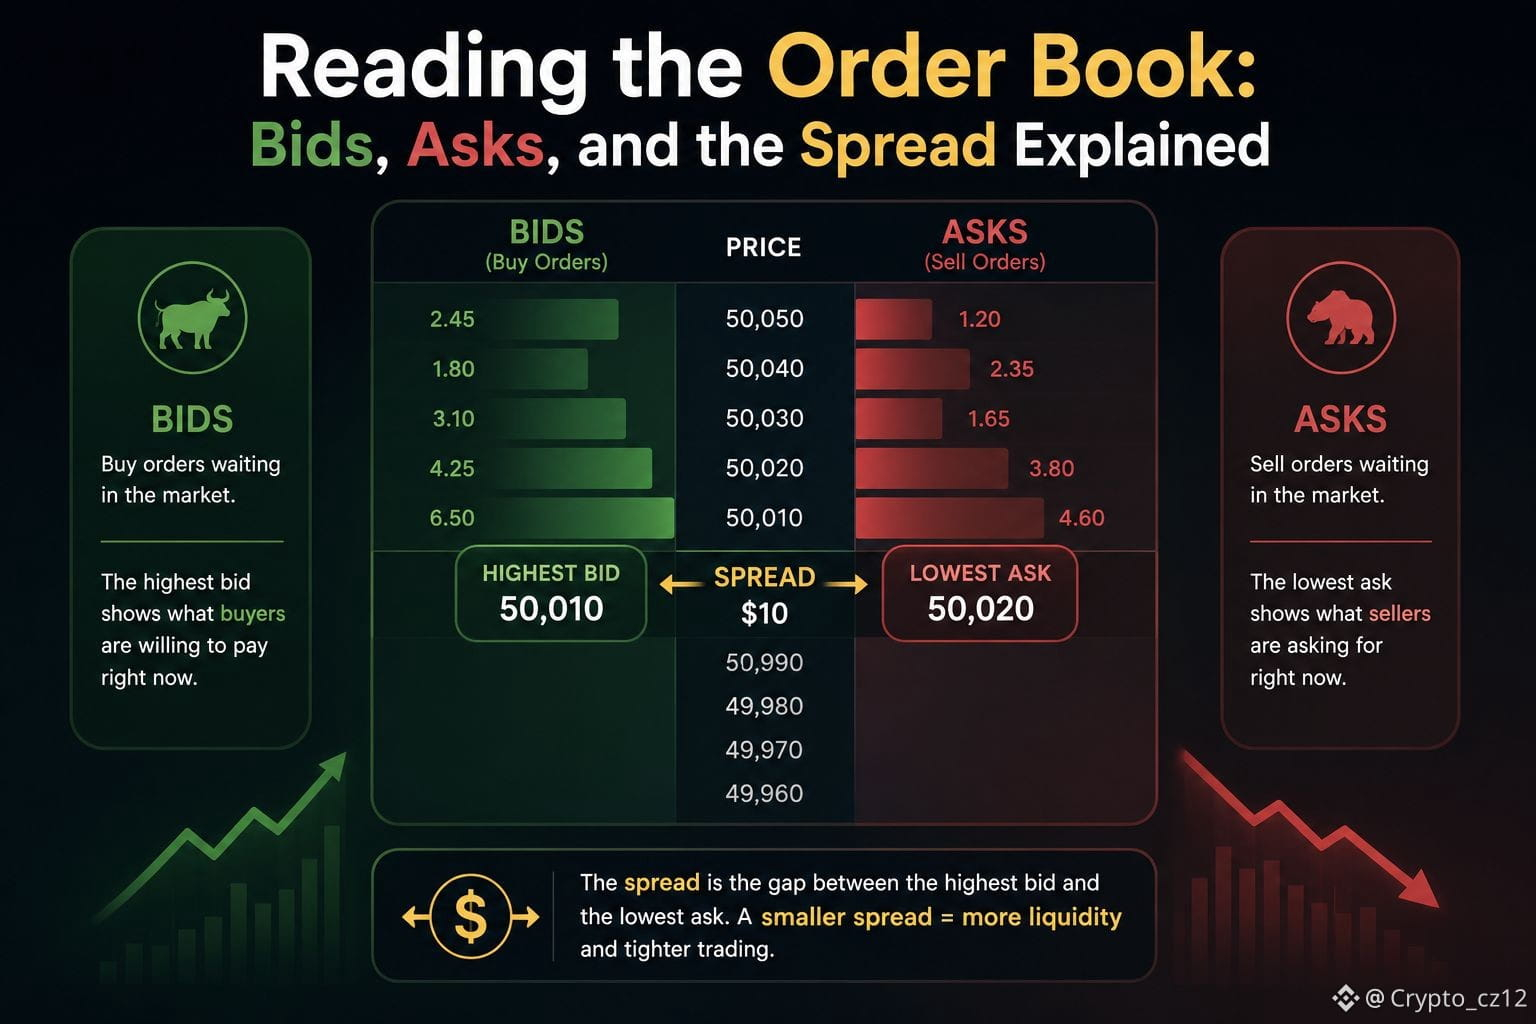
Reading the Order Book: Bids, Asks, and the Spread Explained
Bids = buy orders below price, asks = sell orders above; spread/depth show real liquidity before you click buy
#OrderBook #TradingBasics
$SOL $ETH
{future}(ETHUSDT)
{future}(SOLUSDT)
Reading the Order Book: Bids, Asks, and the Spread Explained
Bids = buy orders below price, asks = sell orders above; spread/depth show real liquidity before you click buy
#OrderBook #TradingBasics
$SOL $ETH
Bids = buy orders below price, asks = sell orders above; spread/depth show real liquidity before you click buy
#OrderBook #TradingBasics
$SOL $ETH
62

·
--
Seeing $BTC sit at $79,437 while the 24‑hour band narrows between $79,001 and $80,560 tells me the market’s patience is being tested. One way to read that patience is the order‑book imbalance metric. Binance Spot shows the total bid volume versus ask volume at each price level; a simple imbalance = (Bid – Ask) / (Bid + Ask). When the value is positive, buying pressure dominates; a negative reading signals sellers in control.
Right now the top 5 % of the book for $BTC has roughly $12 M on the bid side and $10 M on the ask side, giving an imbalance of +0.09. That modest bullish tilt aligns with the price hovering just above the lower half of its range. If the imbalance flips to –0.1, you’d expect the price to drift toward the lower bound, prompting tighter risk controls.
Applying the same lens to $ETH, the imbalance sits near zero, reflecting its flat 24‑hour movement. Monitoring these shifts in real time can help you decide when to tighten stops or add to a position without chasing price.
How do you incorporate order‑book imbalance into your own routine? #CryptoEducation #BinanceTips #OrderBook #GAMERXERO
Seeing $BTC sit at $79,437 while the 24‑hour band narrows between $79,001 and $80,560 tells me the market’s patience is being tested. One way to read that patience is the order‑book imbalance metric. Binance Spot shows the total bid volume versus ask volume at each price level; a simple imbalance = (Bid – Ask) / (Bid + Ask). When the value is positive, buying pressure dominates; a negative reading signals sellers in control.
Right now the top 5 % of the book for $BTC has roughly $12 M on the bid side and $10 M on the ask side, giving an imbalance of +0.09. That modest bullish tilt aligns with the price hovering just above the lower half of its range. If the imbalance flips to –0.1, you’d expect the price to drift toward the lower bound, prompting tighter risk controls.
Applying the same lens to $ETH , the imbalance sits near zero, reflecting its flat 24‑hour movement. Monitoring these shifts in real time can help you decide when to tighten stops or add to a position without chasing price.
How do you incorporate order‑book imbalance into your own routine? #CryptoEducation #BinanceTips #OrderBook #GAMERXERO
Right now the top 5 % of the book for $BTC has roughly $12 M on the bid side and $10 M on the ask side, giving an imbalance of +0.09. That modest bullish tilt aligns with the price hovering just above the lower half of its range. If the imbalance flips to –0.1, you’d expect the price to drift toward the lower bound, prompting tighter risk controls.
Applying the same lens to $ETH , the imbalance sits near zero, reflecting its flat 24‑hour movement. Monitoring these shifts in real time can help you decide when to tighten stops or add to a position without chasing price.
How do you incorporate order‑book imbalance into your own routine? #CryptoEducation #BinanceTips #OrderBook #GAMERXERO
25
·
--
Article
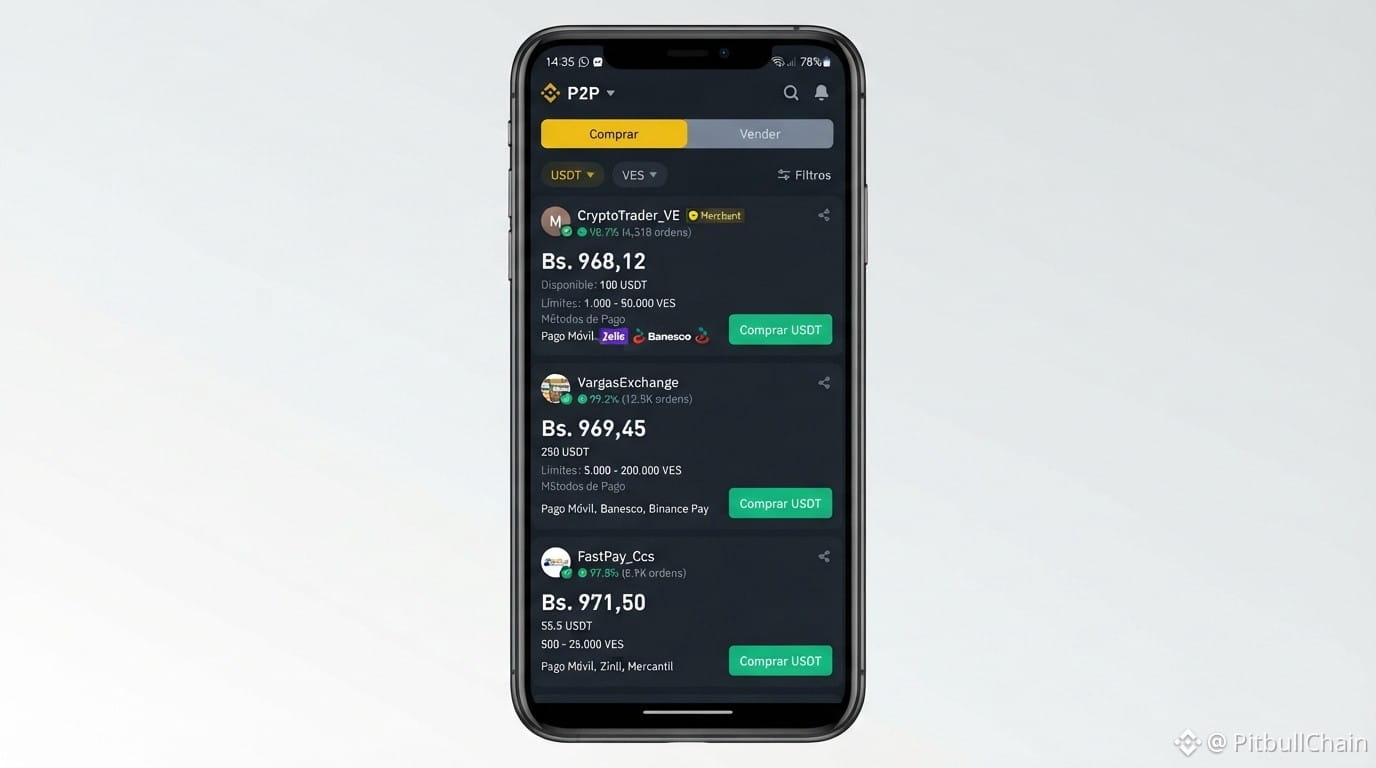
87% imbalance in P2P: Order book and bank liquidity x-rayA simple view, the USDT/VES peer-to-peer (P2P) market in Venezuela shows consistent volume and a sufficient presence of active ads on major platforms such as Binance, other platforms, and other platforms. However, when inspecting the internal layers of the order book, real-time data reveals a structural asymmetry: there is a marked imbalance between the liquidity accumulated on the buy side and the available depth on the sell side. According to Radar P2P monitoring captured on September 7, 2026, the depth imbalance (imbalance) stands at 87.03%. While the accumulated buy volume in the bid books totals 862,774.20 USDT across 42 open orders, the sell volume barely reaches 59,823.29 USDT spread across 40 offers. This difference conditions execution speed and the price friction users face depending on which side of the market they trade on. The illusion of liquidity: USDT/VES order book X-ray A frequent mistake when evaluating Venezuelan P2P is assuming that a high count of active traders equals balanced liquidity in both directions. The granular analysis of the order levels disproves this premise: Dominant buyer volume: Demand to convert bolívares into digital assets concentrates 93.5% of the total visible capital at the analyzed tips (862,774.20 USDT), with significant walls such as the 965.00 VES level (374,997.34 USDT across 5 orders) and 967.00 VES (78,080.98 USDT). Atomized and shallow selling: The orders to sell USDT and obtain bolívares total less than 60,000 USDT overall. The individual orders at the first levels range from 50 to 1,500 USDT, meaning medium or large placements can quickly consume the most competitive quotes and generate slippage. Market “traffic light” signals: The PitbullChain indicator shows a score of 69/100 (yellow status / moderate caution). Although the bank availability score (95) and overall liquidity (95) are solid, the depth metric drops to 45/100 and the spread score to 20/100, confirming the tightness of the sell book. Real spread and FX premium versus the official rate The average P2P buy price is 968.54 VES per digital dollar, while the average selling rate falls to 941.17 VES. This gap creates a gross spread of 27.37 VES (2.91%) in the overall Radar P2P consolidation, though within the competitive books between the best bid (972.90 VES) and best ask (949.44 VES), the direct spread is around 23.46 VES (2.41%). When these values are compared with the exchange rate of the Central Bank of Venezuela (BCV), set at 813.74 VES, the P2P market premium is established at 19.02%. Meanwhile, the parallel dollar reference reports 965.97 VES with a more compressed spread of 0.45% (buy at 968.14 VES vs. sell at 963.80 VES). The distance of nearly 155 bolívares per dollar between the BCV and the P2P ecosystem keeps constant pressure on demand for synthetic FX in bolívares. Performance by financial entity: Where is it executed with less friction? The banking channel used determines both counterparty availability and the price differential. The recorded data shows clear fragmentation in the conditions of each gateway: Mobile Payment (Volume leader): It groups 22.1% of total liquidity with 27 active ads. It presents an average buy price of 966.74 VES and selling at 962.79 VES, with a narrow spread of 3.95 VES (0.41%) and an execution score of 89/100. Banesco (Highest overall score): It captures 19.7% of liquidity with 24 ads. Its average buy price is 967.91 VES versus 962.70 VES for selling, yielding a spread of 5.21 VES (0.54%) and the best overall balance (score 93/100). Bank of Venezuela: It concentrates 13.9% of liquidity with 17 ads. It records average buying at 968.04 VES and selling at 964.64 VES, achieving one of the system’s lowest spreads: 3.39 VES (0.35%). Bancamiga: Although it contributes a smaller share of liquidity (4.9% and 6 ads), it offers the lowest differential between buy (967.39 VES) and sell (965.61 VES), with only 1.78 VES (0.18%) of spread. Mercantile and direct PagoMovil: They show active buy quotes (967.56 VES and 967.25 VES respectively), but with an absence of direct sell orders in the main sampling, reflecting one-sided liquidity. Practical calculations for immediate conversion To gauge the impact of these levels on everyday operations: Settlement of 100 USDT to bolívares: At the effective selling rate of 941.1685 VES, the user receives 94,116.85 VES. If accessing competitive books in Banesco or Bank of Venezuela around 964.50 VES, the effective return rises to approximately 96,450.00 VES. Acquisition of USDT with 1,000,000 VES: Using the reference buy rate of 941.17 VES, one million bolívares yields 1,062.51 USDT on the selling end, while at the taker rate of 968.54 VES the amount decreases to 1,032.48 USDT. Operational considerations for P2P users Given an 87% asymmetry scenario and an elevated spread in the overall market, participants should prioritize execution management before placing orders: Filter by specific banking channel: Trading through methods with spreads lower than 0.50% (such as Bancamiga, Bank of Venezuela, or Mobile Payment) significantly reduces friction loss compared with the overall average of 2.91%. Review minimum and maximum limits: Selling depth is fragmented. When selling amounts above 500 USDT, it is essential to verify whether the trader covers the full amount or whether they will split the order across multiple tranches. Monitor the FX premium: With a 19.02% gap versus the official dollar, changes in BCV FX intervention or adjustments to banking liquidity can quickly alter rates on Binance and other platforms.
87% imbalance in P2P: Order book and bank liquidity x-ray
A simple view, the USDT/VES peer-to-peer (P2P) market in Venezuela shows consistent volume and a sufficient presence of active ads on major platforms such as Binance, other platforms, and other platforms. However, when inspecting the internal layers of the order book, real-time data reveals a structural asymmetry: there is a marked imbalance between the liquidity accumulated on the buy side and the available depth on the sell side. According to Radar P2P monitoring captured on September 7, 2026, the depth imbalance (imbalance) stands at 87.03%. While the accumulated buy volume in the bid books totals 862,774.20 USDT across 42 open orders, the sell volume barely reaches 59,823.29 USDT spread across 40 offers. This difference conditions execution speed and the price friction users face depending on which side of the market they trade on. The illusion of liquidity: USDT/VES order book X-ray A frequent mistake when evaluating Venezuelan P2P is assuming that a high count of active traders equals balanced liquidity in both directions. The granular analysis of the order levels disproves this premise: Dominant buyer volume: Demand to convert bolívares into digital assets concentrates 93.5% of the total visible capital at the analyzed tips (862,774.20 USDT), with significant walls such as the 965.00 VES level (374,997.34 USDT across 5 orders) and 967.00 VES (78,080.98 USDT). Atomized and shallow selling: The orders to sell USDT and obtain bolívares total less than 60,000 USDT overall. The individual orders at the first levels range from 50 to 1,500 USDT, meaning medium or large placements can quickly consume the most competitive quotes and generate slippage. Market “traffic light” signals: The PitbullChain indicator shows a score of 69/100 (yellow status / moderate caution). Although the bank availability score (95) and overall liquidity (95) are solid, the depth metric drops to 45/100 and the spread score to 20/100, confirming the tightness of the sell book. Real spread and FX premium versus the official rate The average P2P buy price is 968.54 VES per digital dollar, while the average selling rate falls to 941.17 VES. This gap creates a gross spread of 27.37 VES (2.91%) in the overall Radar P2P consolidation, though within the competitive books between the best bid (972.90 VES) and best ask (949.44 VES), the direct spread is around 23.46 VES (2.41%). When these values are compared with the exchange rate of the Central Bank of Venezuela (BCV), set at 813.74 VES, the P2P market premium is established at 19.02%. Meanwhile, the parallel dollar reference reports 965.97 VES with a more compressed spread of 0.45% (buy at 968.14 VES vs. sell at 963.80 VES). The distance of nearly 155 bolívares per dollar between the BCV and the P2P ecosystem keeps constant pressure on demand for synthetic FX in bolívares. Performance by financial entity: Where is it executed with less friction? The banking channel used determines both counterparty availability and the price differential. The recorded data shows clear fragmentation in the conditions of each gateway: Mobile Payment (Volume leader): It groups 22.1% of total liquidity with 27 active ads. It presents an average buy price of 966.74 VES and selling at 962.79 VES, with a narrow spread of 3.95 VES (0.41%) and an execution score of 89/100. Banesco (Highest overall score): It captures 19.7% of liquidity with 24 ads. Its average buy price is 967.91 VES versus 962.70 VES for selling, yielding a spread of 5.21 VES (0.54%) and the best overall balance (score 93/100). Bank of Venezuela: It concentrates 13.9% of liquidity with 17 ads. It records average buying at 968.04 VES and selling at 964.64 VES, achieving one of the system’s lowest spreads: 3.39 VES (0.35%). Bancamiga: Although it contributes a smaller share of liquidity (4.9% and 6 ads), it offers the lowest differential between buy (967.39 VES) and sell (965.61 VES), with only 1.78 VES (0.18%) of spread. Mercantile and direct PagoMovil: They show active buy quotes (967.56 VES and 967.25 VES respectively), but with an absence of direct sell orders in the main sampling, reflecting one-sided liquidity. Practical calculations for immediate conversion To gauge the impact of these levels on everyday operations: Settlement of 100 USDT to bolívares: At the effective selling rate of 941.1685 VES, the user receives 94,116.85 VES. If accessing competitive books in Banesco or Bank of Venezuela around 964.50 VES, the effective return rises to approximately 96,450.00 VES. Acquisition of USDT with 1,000,000 VES: Using the reference buy rate of 941.17 VES, one million bolívares yields 1,062.51 USDT on the selling end, while at the taker rate of 968.54 VES the amount decreases to 1,032.48 USDT. Operational considerations for P2P users Given an 87% asymmetry scenario and an elevated spread in the overall market, participants should prioritize execution management before placing orders: Filter by specific banking channel: Trading through methods with spreads lower than 0.50% (such as Bancamiga, Bank of Venezuela, or Mobile Payment) significantly reduces friction loss compared with the overall average of 2.91%. Review minimum and maximum limits: Selling depth is fragmented. When selling amounts above 500 USDT, it is essential to verify whether the trader covers the full amount or whether they will split the order across multiple tranches. Monitor the FX premium: With a 19.02% gap versus the official dollar, changes in BCV FX intervention or adjustments to banking liquidity can quickly alter rates on Binance and other platforms.
10
Understanding Liquidity and Order Books
📊 Understanding the Order Book (Order Book) to execute better trades
The order book is the real-time map of liquidity in a market. It brings together all buy orders (Bids) and sell orders (Asks).
💡 What to watch for:
Order Book walls (Buy/Sell Walls): Large blocks of orders concentrated at a specific price level. They can act as temporary supports or psychological resistance levels.
Spread: The difference between the highest buy price and the lowest sell price. A tight spread indicates excellent liquidity.
Limit Order vs Market Order: Prefer Limit orders to precisely control your execution price and reduce slippage.
Monitoring the depth of the order book helps you anticipate areas where the market may become “sticky.”
#OrderBook #Liquidity #TradingEducation #BinanceSquare #SpotTrading @Square-Creator-e2b3a3399b3d
Understanding Liquidity and Order Books
📊 Understanding the Order Book (Order Book) to execute better trades
The order book is the real-time map of liquidity in a market. It brings together all buy orders (Bids) and sell orders (Asks).
💡 What to watch for:
Order Book walls (Buy/Sell Walls): Large blocks of orders concentrated at a specific price level. They can act as temporary supports or psychological resistance levels.
Spread: The difference between the highest buy price and the lowest sell price. A tight spread indicates excellent liquidity.
Limit Order vs Market Order: Prefer Limit orders to precisely control your execution price and reduce slippage.
Monitoring the depth of the order book helps you anticipate areas where the market may become “sticky.”
#OrderBook #Liquidity #TradingEducation #BinanceSquare #SpotTrading @ ACE
📊 Understanding the Order Book (Order Book) to execute better trades
The order book is the real-time map of liquidity in a market. It brings together all buy orders (Bids) and sell orders (Asks).
💡 What to watch for:
Order Book walls (Buy/Sell Walls): Large blocks of orders concentrated at a specific price level. They can act as temporary supports or psychological resistance levels.
Spread: The difference between the highest buy price and the lowest sell price. A tight spread indicates excellent liquidity.
Limit Order vs Market Order: Prefer Limit orders to precisely control your execution price and reduce slippage.
Monitoring the depth of the order book helps you anticipate areas where the market may become “sticky.”
#OrderBook #Liquidity #TradingEducation #BinanceSquare #SpotTrading @ ACE
49
·
--
Article
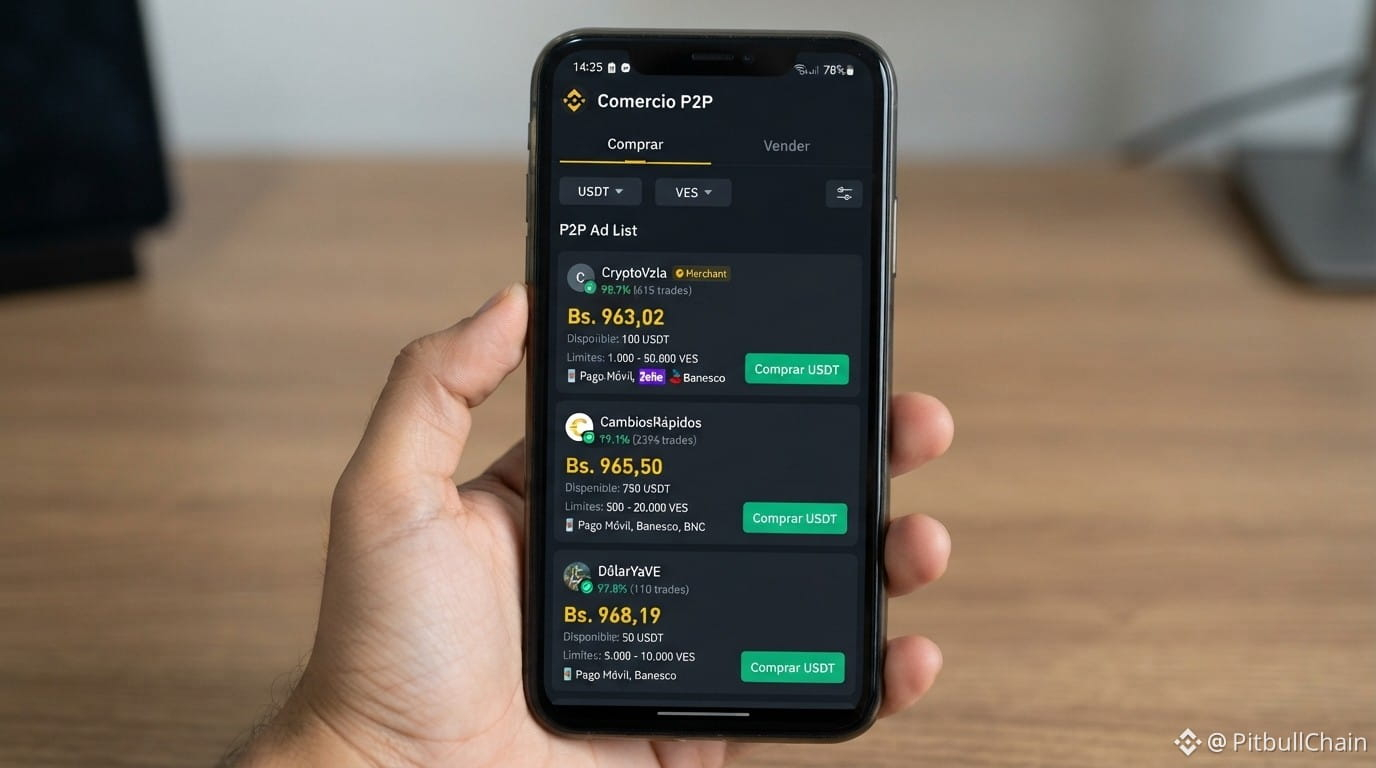
How to Use the P2P Order Book to Avoid Overpaying When Buying USDTAcquiring stablecoins in the Venezuelan peer-to-peer (P2P) market requires going beyond taking the first visible offer in the app. The spread of quotes, the premium versus the official exchange rate of the Central Bank of Venezuela (BCV), and liquidity variations across payment methods can significantly increase the cost of each transaction. As of September 6, 2026, with an official BCV rate of 813.74 VES and a P2P market whose buy range peaks at 982.30 VES (a 20.72% premium), examining the Order Book or consolidated order book is the essential tool to avoid paying extra bolivars. 1. Anatomy of the P2P Order Book: Asks, Bids, and Real Spread The order book consolidates in real time all buy intentions (Bids) and sell intentions (Asks) available across the different exchange platforms: Asks (USDT Sale / What you pay when buying): These represent offers from merchants willing to deliver USDT to you in exchange for your bolivars. According to the live record, the best sell offer stands at 960.00 VES on other platforms (390.82 USDT available) and at 960.88 VES on Binance (5,833.58 USDT accumulated between Mercantil and Banesco). Bids (USDT Purchase / What you receive when selling): These represent demand from users buying USDT by delivering bolivars, led by a 955.31 VES offer for Mercantil on Binance with 16,950.60 USDT. Direct spread from the book: The immediate gap between the best ask (960.00 VES) and the best bid (955.31 VES) is only 4.69 VES (0.49%). However, if a user buys without reviewing depth and ends up in scattered ads or indicative rates of 982.30 VES, they ultimately take on a differential of up to 5.90%, paying an avoidable markup. 2. Multiexchange Comparison: Binance vs. other platforms vs. other platforms Liquidity distribution is not homogeneous across exchanges. Analyzing depth by platform makes it possible to choose where to place or take an order depending on the required volume: Binance P2P: Concentrates the largest institutional and commercial volume. In the levels between 960.88 and 963.90 VES, it accumulates massive blocks above 13,000 and 20,000 USDT per level, especially for Banesco, Banco de Venezuela, and Mercantil. other platforms: Offers competitive entry points on the buy side (from 960.00 VES), but with smaller order sizes in the first rungs (orders of 390.82 USDT or 127.85 USDT), extending toward higher levels such as 969.90 VES for medium amounts (6,700.80 USDT). other platforms: Registers higher quotes and lower depth in bolivars, with offers starting at 964.11 VES for limited volumes (60.33 USDT) and 967.34 VES (50.00 USDT), making it less efficient for direct volume purchases. 3. Banking Liquidity: How to Select the Most Efficient Payment Method The price you pay for USDT in Venezuela depends directly on the financial institution used. The comparison data reflect marked differences in average price and operational friction: Banco de Venezuela: Shows one of the tightest structures, with an average buy price of 962.84 VES and sell price of 953.60 VES, generating a spread of only 0.97% and concentrating 12.4% of total liquidity. Mercantil: Offers the narrowest spread among the main private banks (0.82%), with an average buy price of 963.17 VES and sell price of 955.31 VES, although with a smaller liquidity share (4.4%). Banesco: Leads private banking in volume (17.5% liquidity and 24 active listings), with an average buy price of 965.42 VES and a spread of 2.47%. Pago Móvil: Despite having the highest number of offers (19% liquidity), it usually penalizes price with a higher average buy price of 970.30 VES and a spread of 2.94%, due to immediacy and high turnover of microtransactions. 4. Interpreting the Yellow Traffic Light: Step-by-Step Strategy The P2P Radar rates market conditions with a score of 69/100 (Yellow State: Moderate Caution). This diagnosis is due to the fact that overall liquidity is solid (liquidity score of 95/100 with 576,444.81 USDT in buy volume and 155,668.14 USDT in sell volume), but the overall market spread shows distortions (spread score of 20/100) caused by atypical listings. To execute safe and efficient purchases under these conditions, follow this procedure: Check the consolidated Order Book: Identify the Best Ask level (currently around 960.00 - 961.50 VES) and discard any offer above the median percentile (963.00 VES). Filter by your preferred bank: If you have accounts at Banco de Venezuela or Mercantil, prioritize direct transfers over Pago Móvil to save between 4 and 8 bolivars per USDT acquired. Verify minimum and maximum limits: Check that the order volume matches the merchant's range. In the first levels of Binance, minimum limits range from the equivalent of 100 to 1,800 USDT in VES. Evaluate the merchant's reputation: Make sure the counterparty has a completion rate above 98% and a verified history of recent operations. Operational Considerations and Risk Management The Venezuelan P2P market reflects a structural buying pressure against the official currency, with a depth imbalance of 57.47% in favor of demand. Using the order book makes it possible to isolate artificial price noise, protect purchasing power, and execute trades backed by real and verifiable liquidity.
How to Use the P2P Order Book to Avoid Overpaying When Buying USDT
Acquiring stablecoins in the Venezuelan peer-to-peer (P2P) market requires going beyond taking the first visible offer in the app. The spread of quotes, the premium versus the official exchange rate of the Central Bank of Venezuela (BCV), and liquidity variations across payment methods can significantly increase the cost of each transaction. As of September 6, 2026, with an official BCV rate of 813.74 VES and a P2P market whose buy range peaks at 982.30 VES (a 20.72% premium), examining the Order Book or consolidated order book is the essential tool to avoid paying extra bolivars. 1. Anatomy of the P2P Order Book: Asks, Bids, and Real Spread The order book consolidates in real time all buy intentions (Bids) and sell intentions (Asks) available across the different exchange platforms: Asks (USDT Sale / What you pay when buying): These represent offers from merchants willing to deliver USDT to you in exchange for your bolivars. According to the live record, the best sell offer stands at 960.00 VES on other platforms (390.82 USDT available) and at 960.88 VES on Binance (5,833.58 USDT accumulated between Mercantil and Banesco). Bids (USDT Purchase / What you receive when selling): These represent demand from users buying USDT by delivering bolivars, led by a 955.31 VES offer for Mercantil on Binance with 16,950.60 USDT. Direct spread from the book: The immediate gap between the best ask (960.00 VES) and the best bid (955.31 VES) is only 4.69 VES (0.49%). However, if a user buys without reviewing depth and ends up in scattered ads or indicative rates of 982.30 VES, they ultimately take on a differential of up to 5.90%, paying an avoidable markup. 2. Multiexchange Comparison: Binance vs. other platforms vs. other platforms Liquidity distribution is not homogeneous across exchanges. Analyzing depth by platform makes it possible to choose where to place or take an order depending on the required volume: Binance P2P: Concentrates the largest institutional and commercial volume. In the levels between 960.88 and 963.90 VES, it accumulates massive blocks above 13,000 and 20,000 USDT per level, especially for Banesco, Banco de Venezuela, and Mercantil. other platforms: Offers competitive entry points on the buy side (from 960.00 VES), but with smaller order sizes in the first rungs (orders of 390.82 USDT or 127.85 USDT), extending toward higher levels such as 969.90 VES for medium amounts (6,700.80 USDT). other platforms: Registers higher quotes and lower depth in bolivars, with offers starting at 964.11 VES for limited volumes (60.33 USDT) and 967.34 VES (50.00 USDT), making it less efficient for direct volume purchases. 3. Banking Liquidity: How to Select the Most Efficient Payment Method The price you pay for USDT in Venezuela depends directly on the financial institution used. The comparison data reflect marked differences in average price and operational friction: Banco de Venezuela: Shows one of the tightest structures, with an average buy price of 962.84 VES and sell price of 953.60 VES, generating a spread of only 0.97% and concentrating 12.4% of total liquidity. Mercantil: Offers the narrowest spread among the main private banks (0.82%), with an average buy price of 963.17 VES and sell price of 955.31 VES, although with a smaller liquidity share (4.4%). Banesco: Leads private banking in volume (17.5% liquidity and 24 active listings), with an average buy price of 965.42 VES and a spread of 2.47%. Pago Móvil: Despite having the highest number of offers (19% liquidity), it usually penalizes price with a higher average buy price of 970.30 VES and a spread of 2.94%, due to immediacy and high turnover of microtransactions. 4. Interpreting the Yellow Traffic Light: Step-by-Step Strategy The P2P Radar rates market conditions with a score of 69/100 (Yellow State: Moderate Caution). This diagnosis is due to the fact that overall liquidity is solid (liquidity score of 95/100 with 576,444.81 USDT in buy volume and 155,668.14 USDT in sell volume), but the overall market spread shows distortions (spread score of 20/100) caused by atypical listings. To execute safe and efficient purchases under these conditions, follow this procedure: Check the consolidated Order Book: Identify the Best Ask level (currently around 960.00 - 961.50 VES) and discard any offer above the median percentile (963.00 VES). Filter by your preferred bank: If you have accounts at Banco de Venezuela or Mercantil, prioritize direct transfers over Pago Móvil to save between 4 and 8 bolivars per USDT acquired. Verify minimum and maximum limits: Check that the order volume matches the merchant's range. In the first levels of Binance, minimum limits range from the equivalent of 100 to 1,800 USDT in VES. Evaluate the merchant's reputation: Make sure the counterparty has a completion rate above 98% and a verified history of recent operations. Operational Considerations and Risk Management The Venezuelan P2P market reflects a structural buying pressure against the official currency, with a depth imbalance of 57.47% in favor of demand. Using the order book makes it possible to isolate artificial price noise, protect purchasing power, and execute trades backed by real and verifiable liquidity.
38

·
--
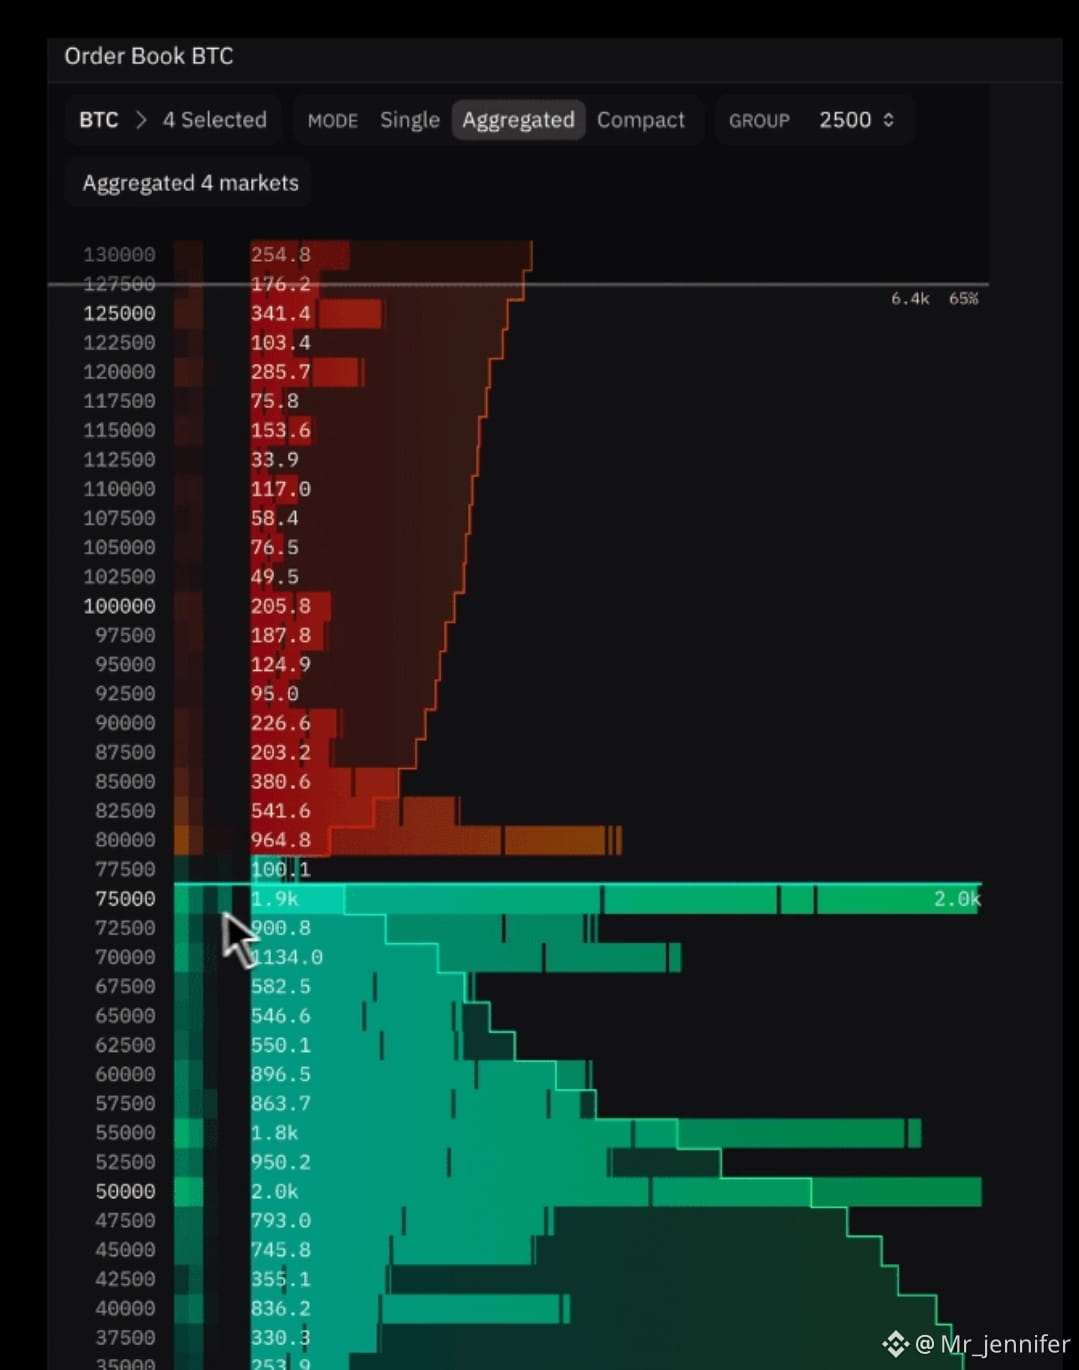
POST — BTC ORDER BOOK ANALYSIS
🚨 BTC ORDER BOOK ALERT 🚨
Bitcoin’s order book is showing strong liquidity around key price levels. 👀
🟢 Major Bid Support:
$80,000 — 541.6 BTC
$77,500 — 964.8 BTC
$75,000 — 1.9K BTC
🔴 Major Sell Liquidity:
$82,500 — 380.6 BTC
$85,000 — 203.2 BTC
$87,500 — 226.6 BTC
The large buy orders around $75K–$80K could provide an important support zone, while $82.5K–$87.5K remains an area to watch for selling pressure.
📈 A strong breakout above the sell-side liquidity could strengthen bullish momentum.
What do you see next for BTC — $85K 🚀 or a pullback 📉?
$BTC #Bitcoin #BTC #Crypto #Binance #Trading #orderbook #USWeeklyInitialJoblessClaimsRiseTo206000 #CLARITYActFacesDelaySenateLoses8VotingDays
POST — BTC ORDER BOOK ANALYSIS
🚨 BTC ORDER BOOK ALERT 🚨
Bitcoin’s order book is showing strong liquidity around key price levels. 👀
🟢 Major Bid Support:
$80,000 — 541.6 BTC
$77,500 — 964.8 BTC
$75,000 — 1.9K BTC
🔴 Major Sell Liquidity:
$82,500 — 380.6 BTC
$85,000 — 203.2 BTC
$87,500 — 226.6 BTC
The large buy orders around $75K–$80K could provide an important support zone, while $82.5K–$87.5K remains an area to watch for selling pressure.
📈 A strong breakout above the sell-side liquidity could strengthen bullish momentum.
What do you see next for BTC — $85K 🚀 or a pullback 📉?
$BTC #Bitcoin #BTC #Crypto #Binance #Trading #orderbook #USWeeklyInitialJoblessClaimsRiseTo206000 #CLARITYActFacesDelaySenateLoses8VotingDays
🚨 BTC ORDER BOOK ALERT 🚨
Bitcoin’s order book is showing strong liquidity around key price levels. 👀
🟢 Major Bid Support:
$80,000 — 541.6 BTC
$77,500 — 964.8 BTC
$75,000 — 1.9K BTC
🔴 Major Sell Liquidity:
$82,500 — 380.6 BTC
$85,000 — 203.2 BTC
$87,500 — 226.6 BTC
The large buy orders around $75K–$80K could provide an important support zone, while $82.5K–$87.5K remains an area to watch for selling pressure.
📈 A strong breakout above the sell-side liquidity could strengthen bullish momentum.
What do you see next for BTC — $85K 🚀 or a pullback 📉?
$BTC #Bitcoin #BTC #Crypto #Binance #Trading #orderbook #USWeeklyInitialJoblessClaimsRiseTo206000 #CLARITYActFacesDelaySenateLoses8VotingDays
28
·
--
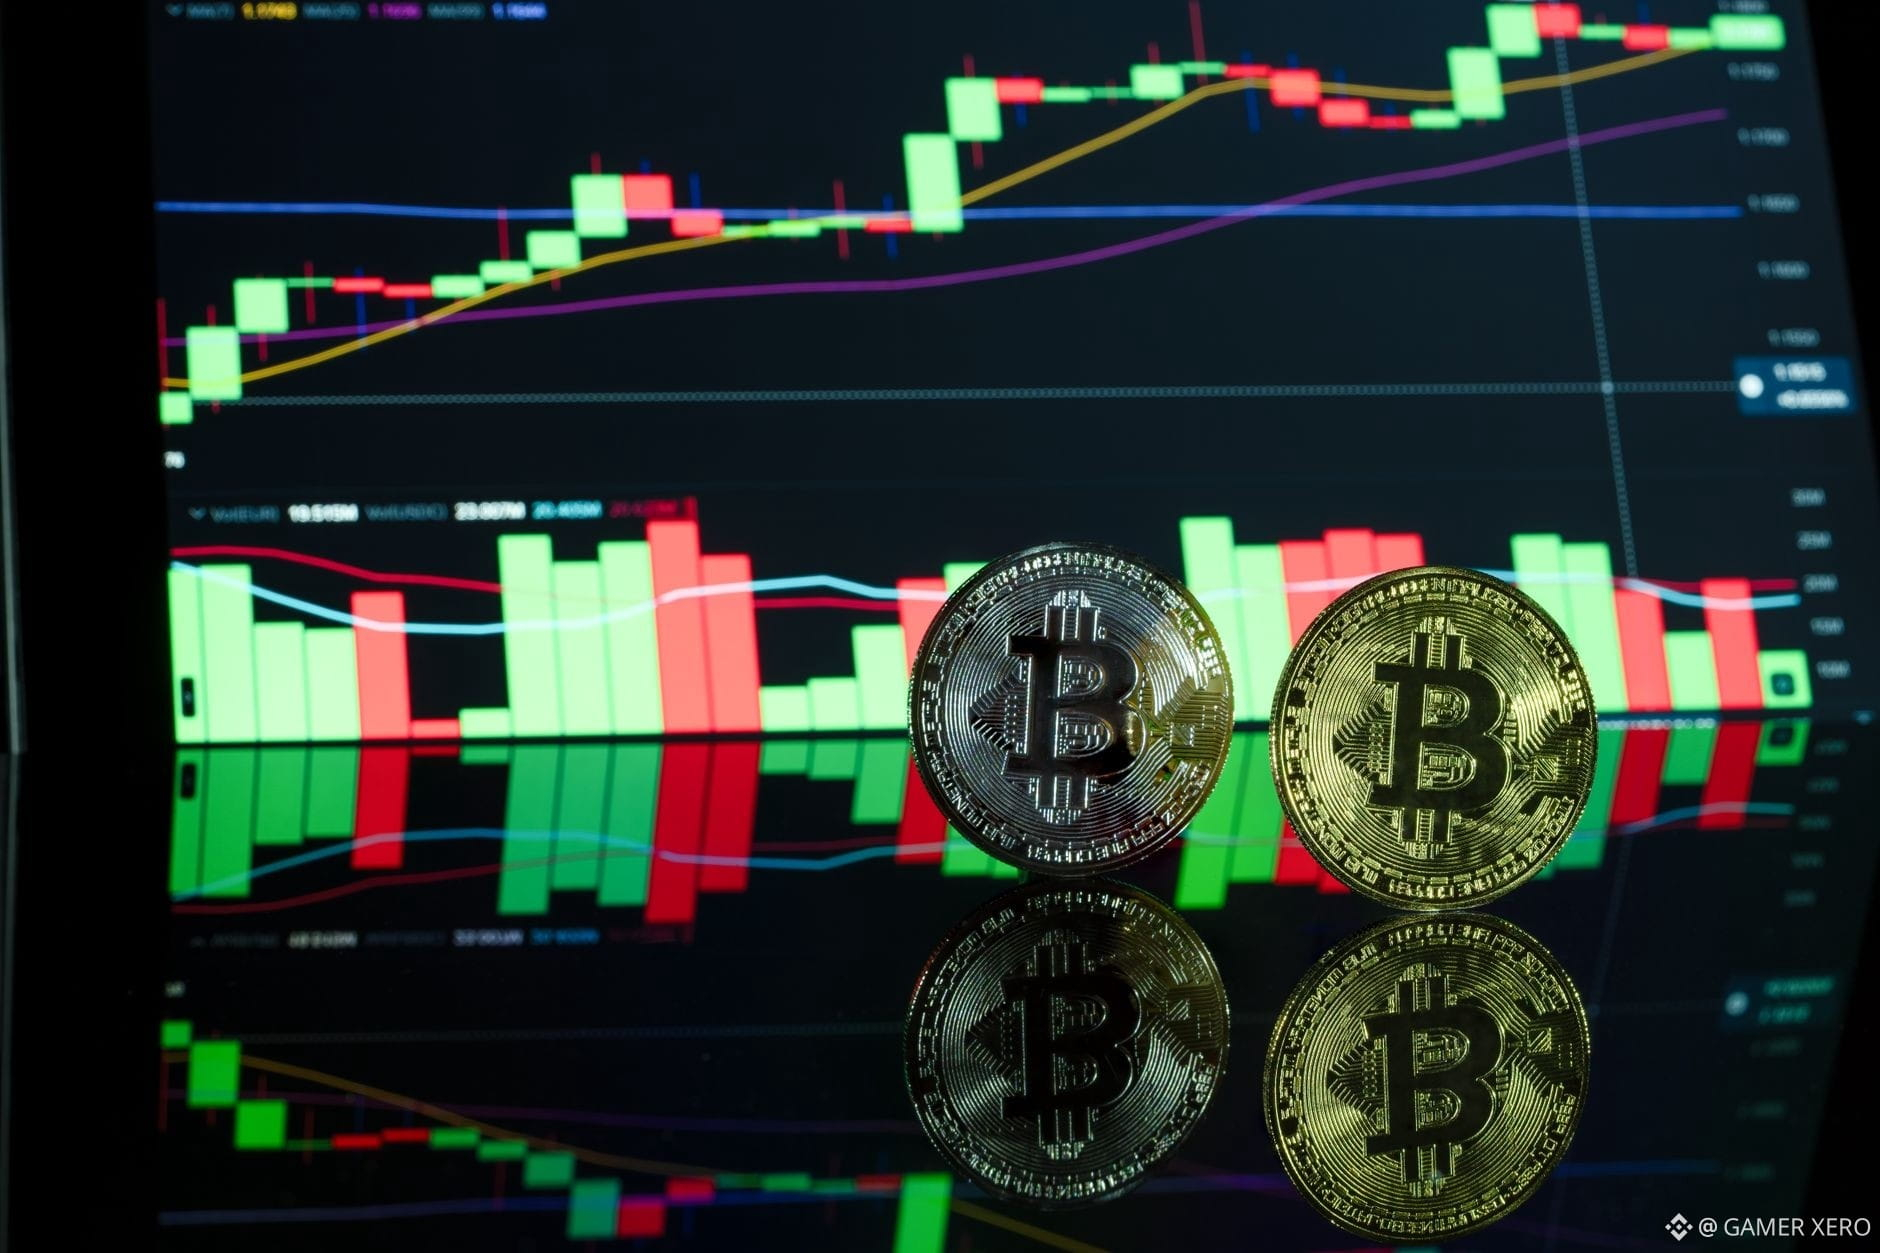
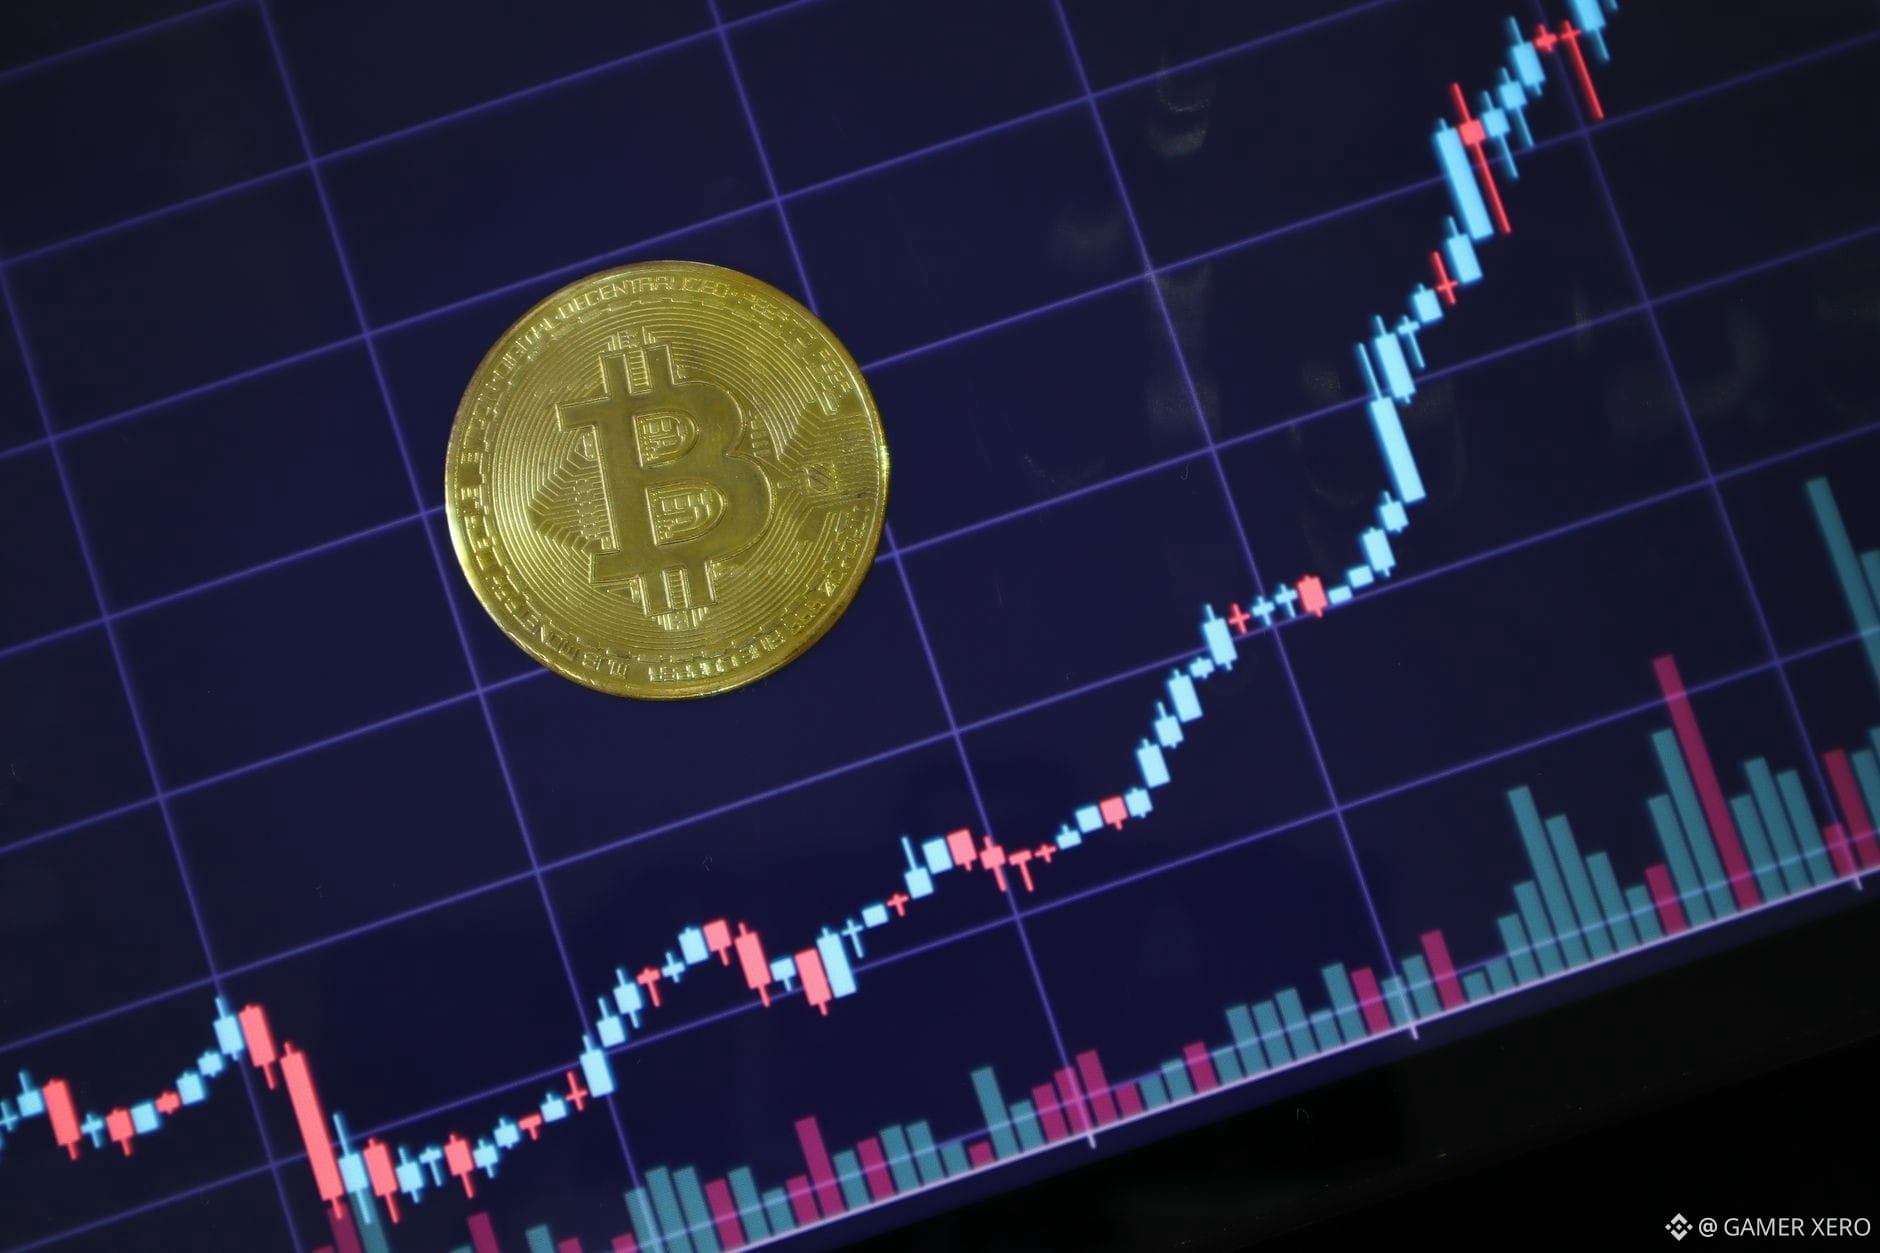
Spotting an order‑book imbalance can reveal short‑term pressure before the next candle. On Binance, the depth view shows the best bid and ask for $BTC at $81,155.34 and $81,263 respectively. If the total volume on the ask side within the first five price levels is 30 % higher than the bid side, sellers are stacking, hinting at possible downside resistance. Conversely, a larger bid volume suggests buying interest and potential support. To quantify, add up the quantity column for each level and compute the ratio: Ask Volume ÷ Bid Volume. A ratio above 1.2 often flags a bearish tilt, while below 0.8 leans bullish. Watching how this ratio shifts across sessions helps you decide whether to tighten stops or look for a breakout. The same principle applies to $ETH, where the current spread sits around $2,527.02‑$2,531, and a tight order‑book can mean the market is waiting for a catalyst. Have you ever used order‑book imbalance to time your entry or exit? #CryptoEducation #OrderBook #TradingTools #GAMERXERO
Spotting an order‑book imbalance can reveal short‑term pressure before the next candle. On Binance, the depth view shows the best bid and ask for $BTC at $81,155.34 and $81,263 respectively. If the total volume on the ask side within the first five price levels is 30 % higher than the bid side, sellers are stacking, hinting at possible downside resistance. Conversely, a larger bid volume suggests buying interest and potential support. To quantify, add up the quantity column for each level and compute the ratio: Ask Volume ÷ Bid Volume. A ratio above 1.2 often flags a bearish tilt, while below 0.8 leans bullish. Watching how this ratio shifts across sessions helps you decide whether to tighten stops or look for a breakout. The same principle applies to $ETH , where the current spread sits around $2,527.02‑$2,531, and a tight order‑book can mean the market is waiting for a catalyst. Have you ever used order‑book imbalance to time your entry or exit? #CryptoEducation #OrderBook #TradingTools #GAMERXERO
11

·
--
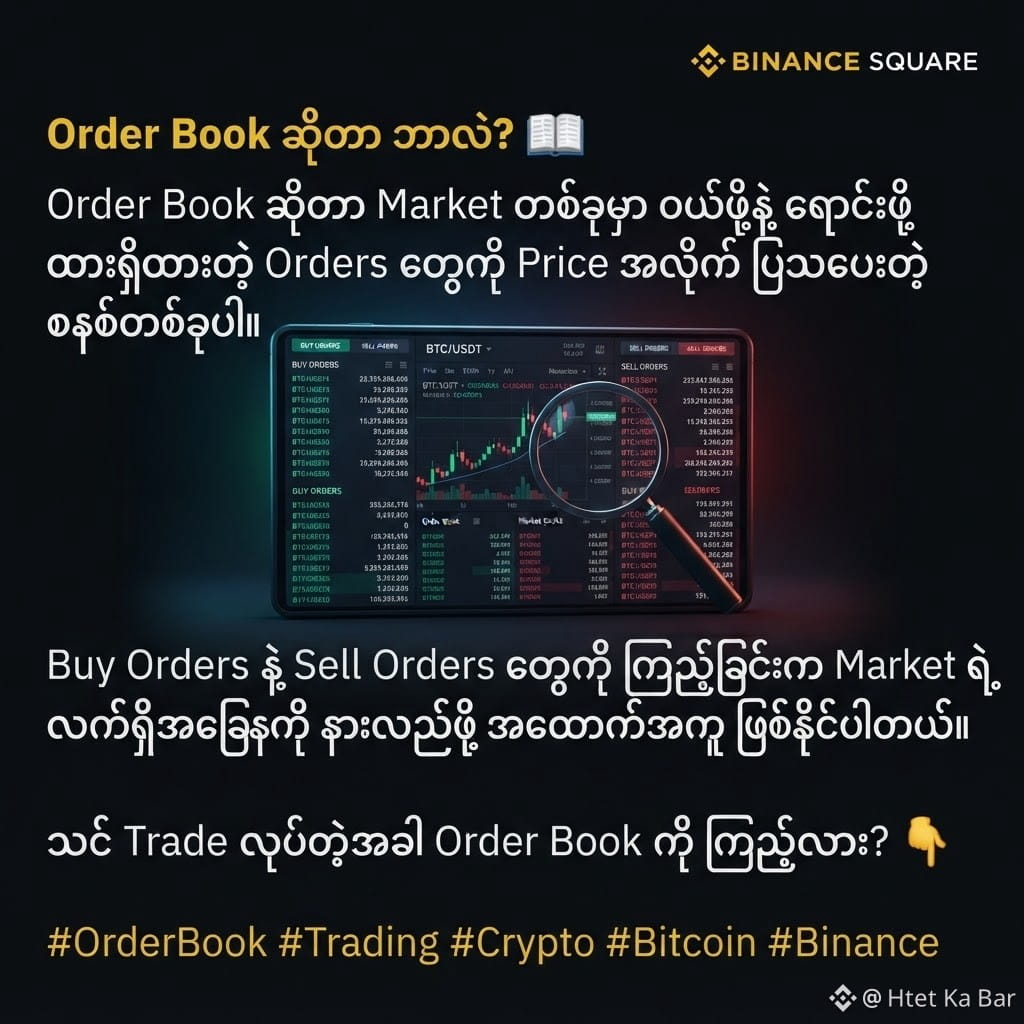
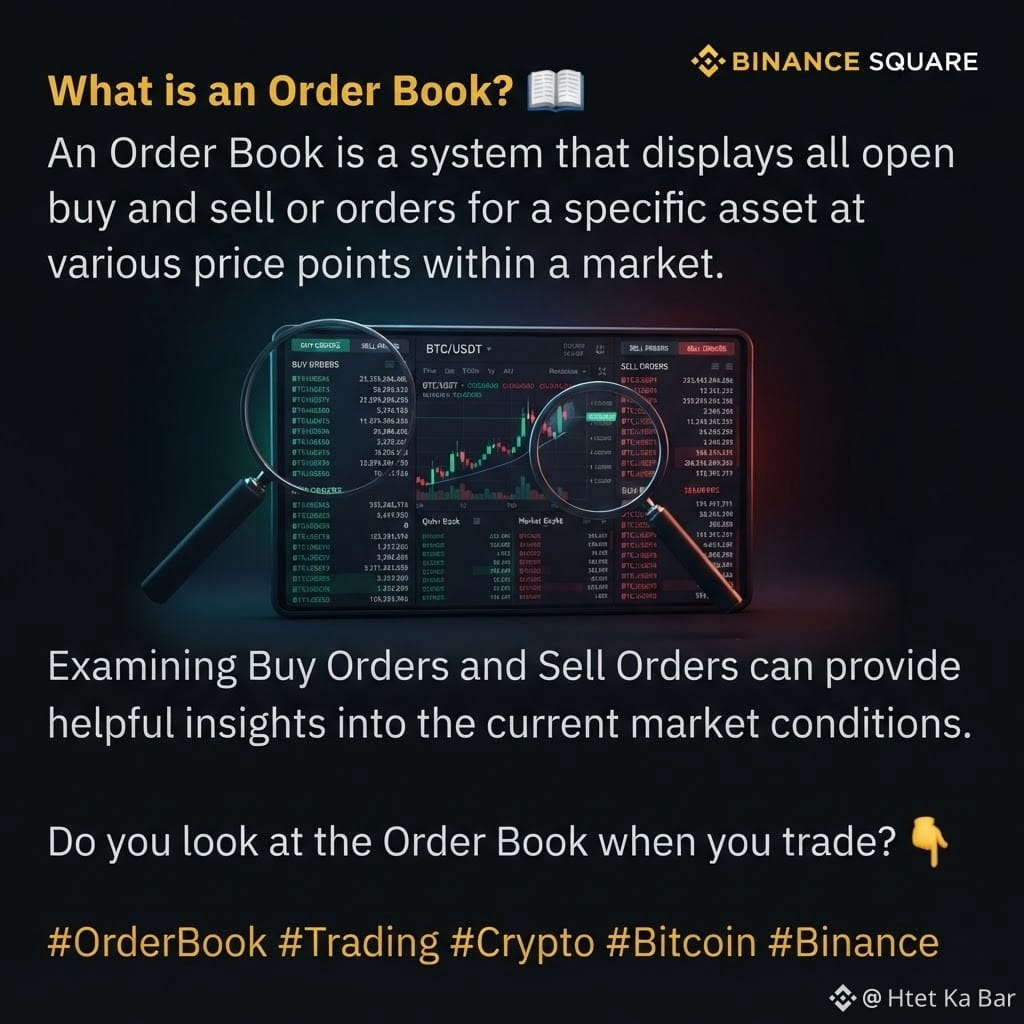
What is an Order Book?
📖 An Order Book is a system that displays the Orders placed for buying and selling in a market, organized by price.
By looking at both Buy Orders and Sell Orders, you can better understand the current state of the market.
When you trade, do you check the Order Book? 👇
#OrderBook #Trading #Crypto #Bitcoin #Binance $BTC $BNB $DOGE
What is an Order Book?
📖 An Order Book is a system that displays the Orders placed for buying and selling in a market, organized by price.
By looking at both Buy Orders and Sell Orders, you can better understand the current state of the market.
When you trade, do you check the Order Book? 👇
#OrderBook #Trading #Crypto #Bitcoin #Binance $BTC $BNB $DOGE
📖 An Order Book is a system that displays the Orders placed for buying and selling in a market, organized by price.
By looking at both Buy Orders and Sell Orders, you can better understand the current state of the market.
When you trade, do you check the Order Book? 👇
#OrderBook #Trading #Crypto #Bitcoin #Binance $BTC $BNB $DOGE
97

Your portfolio balance is a mathematical illusion until the sell order actually fills.
Most traders stare at unrealized gains with pure euphoria, only to watch that life-changing wealth evaporate into thin air the second they try to exit. It is one of the most painful lessons in crypto: making money on screen is easy, but actually taking it off the table is where accounts get crushed.
I have seen this movie play out in every bull run since 2017. Someone sees an $8M headline profit on an illiquid altcoin, but attempting to unload a bag that size instantly chews through every bid on the book. Massive slippage kicks in, execution prices plummet far below the screen price, and that paper fortune vanishes before the transaction even confirms.
Liquid assets like $BTC and $ETH can absorb serious volume, but the moment you step out on the risk curve with low-cap pairs like $PEPE, order books dry up fast. Paper gains do not pay the bills; actual market depth decides what you truly keep.
How do you manage your liquidity and exit strategy when a position goes parabolic?
#CryptoTrading #OrderBook #RiskManagement
Your portfolio balance is a mathematical illusion until the sell order actually fills.
Most traders stare at unrealized gains with pure euphoria, only to watch that life-changing wealth evaporate into thin air the second they try to exit. It is one of the most painful lessons in crypto: making money on screen is easy, but actually taking it off the table is where accounts get crushed.
I have seen this movie play out in every bull run since 2017. Someone sees an $8M headline profit on an illiquid altcoin, but attempting to unload a bag that size instantly chews through every bid on the book. Massive slippage kicks in, execution prices plummet far below the screen price, and that paper fortune vanishes before the transaction even confirms.
Liquid assets like $BTC and $ETH can absorb serious volume, but the moment you step out on the risk curve with low-cap pairs like $PEPE , order books dry up fast. Paper gains do not pay the bills; actual market depth decides what you truly keep.
How do you manage your liquidity and exit strategy when a position goes parabolic?
#CryptoTrading #OrderBook #RiskManagement
Most traders stare at unrealized gains with pure euphoria, only to watch that life-changing wealth evaporate into thin air the second they try to exit. It is one of the most painful lessons in crypto: making money on screen is easy, but actually taking it off the table is where accounts get crushed.
I have seen this movie play out in every bull run since 2017. Someone sees an $8M headline profit on an illiquid altcoin, but attempting to unload a bag that size instantly chews through every bid on the book. Massive slippage kicks in, execution prices plummet far below the screen price, and that paper fortune vanishes before the transaction even confirms.
Liquid assets like $BTC and $ETH can absorb serious volume, but the moment you step out on the risk curve with low-cap pairs like $PEPE , order books dry up fast. Paper gains do not pay the bills; actual market depth decides what you truly keep.
How do you manage your liquidity and exit strategy when a position goes parabolic?
#CryptoTrading #OrderBook #RiskManagement
21

·
--
Picture this: a trader watches an $8M unrealized gain flash across their screen, convinced they just secured a life-changing exit.
Most investors obsess over entry points and portfolio screenshots, forgetting that paper gains mean nothing until cash hits the account. When market depth dries up, that winning position turns into an aggressive drawdown before the sell order even finishes routing.
Here is what actually happens beneath the surface. The quoted ticker price only reflects the very top of the order book. When someone attempts to dump millions into an illiquid asset compared to deep markets like $BTC, the sell order rapidly exhausts every existing bid.
Slippage multiplies in seconds. As the trade chews through thin depth, the execution price collapses well below the initial market quote. That celebrated $8M headline shrinks to a fraction of its perceived value the moment liquidity is tested on tokens like $SOL or momentum plays like $PEPE.
Paper gains create the illusion of safety, but order book depth determines the actual payout.
How do you manage your exit strategy when scaling out of illiquid positions?
#CryptoTrading #RiskManagement #OrderBook
Picture this: a trader watches an $8M unrealized gain flash across their screen, convinced they just secured a life-changing exit.
Most investors obsess over entry points and portfolio screenshots, forgetting that paper gains mean nothing until cash hits the account. When market depth dries up, that winning position turns into an aggressive drawdown before the sell order even finishes routing.
Here is what actually happens beneath the surface. The quoted ticker price only reflects the very top of the order book. When someone attempts to dump millions into an illiquid asset compared to deep markets like $BTC , the sell order rapidly exhausts every existing bid.
Slippage multiplies in seconds. As the trade chews through thin depth, the execution price collapses well below the initial market quote. That celebrated $8M headline shrinks to a fraction of its perceived value the moment liquidity is tested on tokens like $SOL or momentum plays like $PEPE .
Paper gains create the illusion of safety, but order book depth determines the actual payout.
How do you manage your exit strategy when scaling out of illiquid positions?
#CryptoTrading #RiskManagement #OrderBook
Most investors obsess over entry points and portfolio screenshots, forgetting that paper gains mean nothing until cash hits the account. When market depth dries up, that winning position turns into an aggressive drawdown before the sell order even finishes routing.
Here is what actually happens beneath the surface. The quoted ticker price only reflects the very top of the order book. When someone attempts to dump millions into an illiquid asset compared to deep markets like $BTC , the sell order rapidly exhausts every existing bid.
Slippage multiplies in seconds. As the trade chews through thin depth, the execution price collapses well below the initial market quote. That celebrated $8M headline shrinks to a fraction of its perceived value the moment liquidity is tested on tokens like $SOL or momentum plays like $PEPE .
Paper gains create the illusion of safety, but order book depth determines the actual payout.
How do you manage your exit strategy when scaling out of illiquid positions?
#CryptoTrading #RiskManagement #OrderBook

1
31
·
--
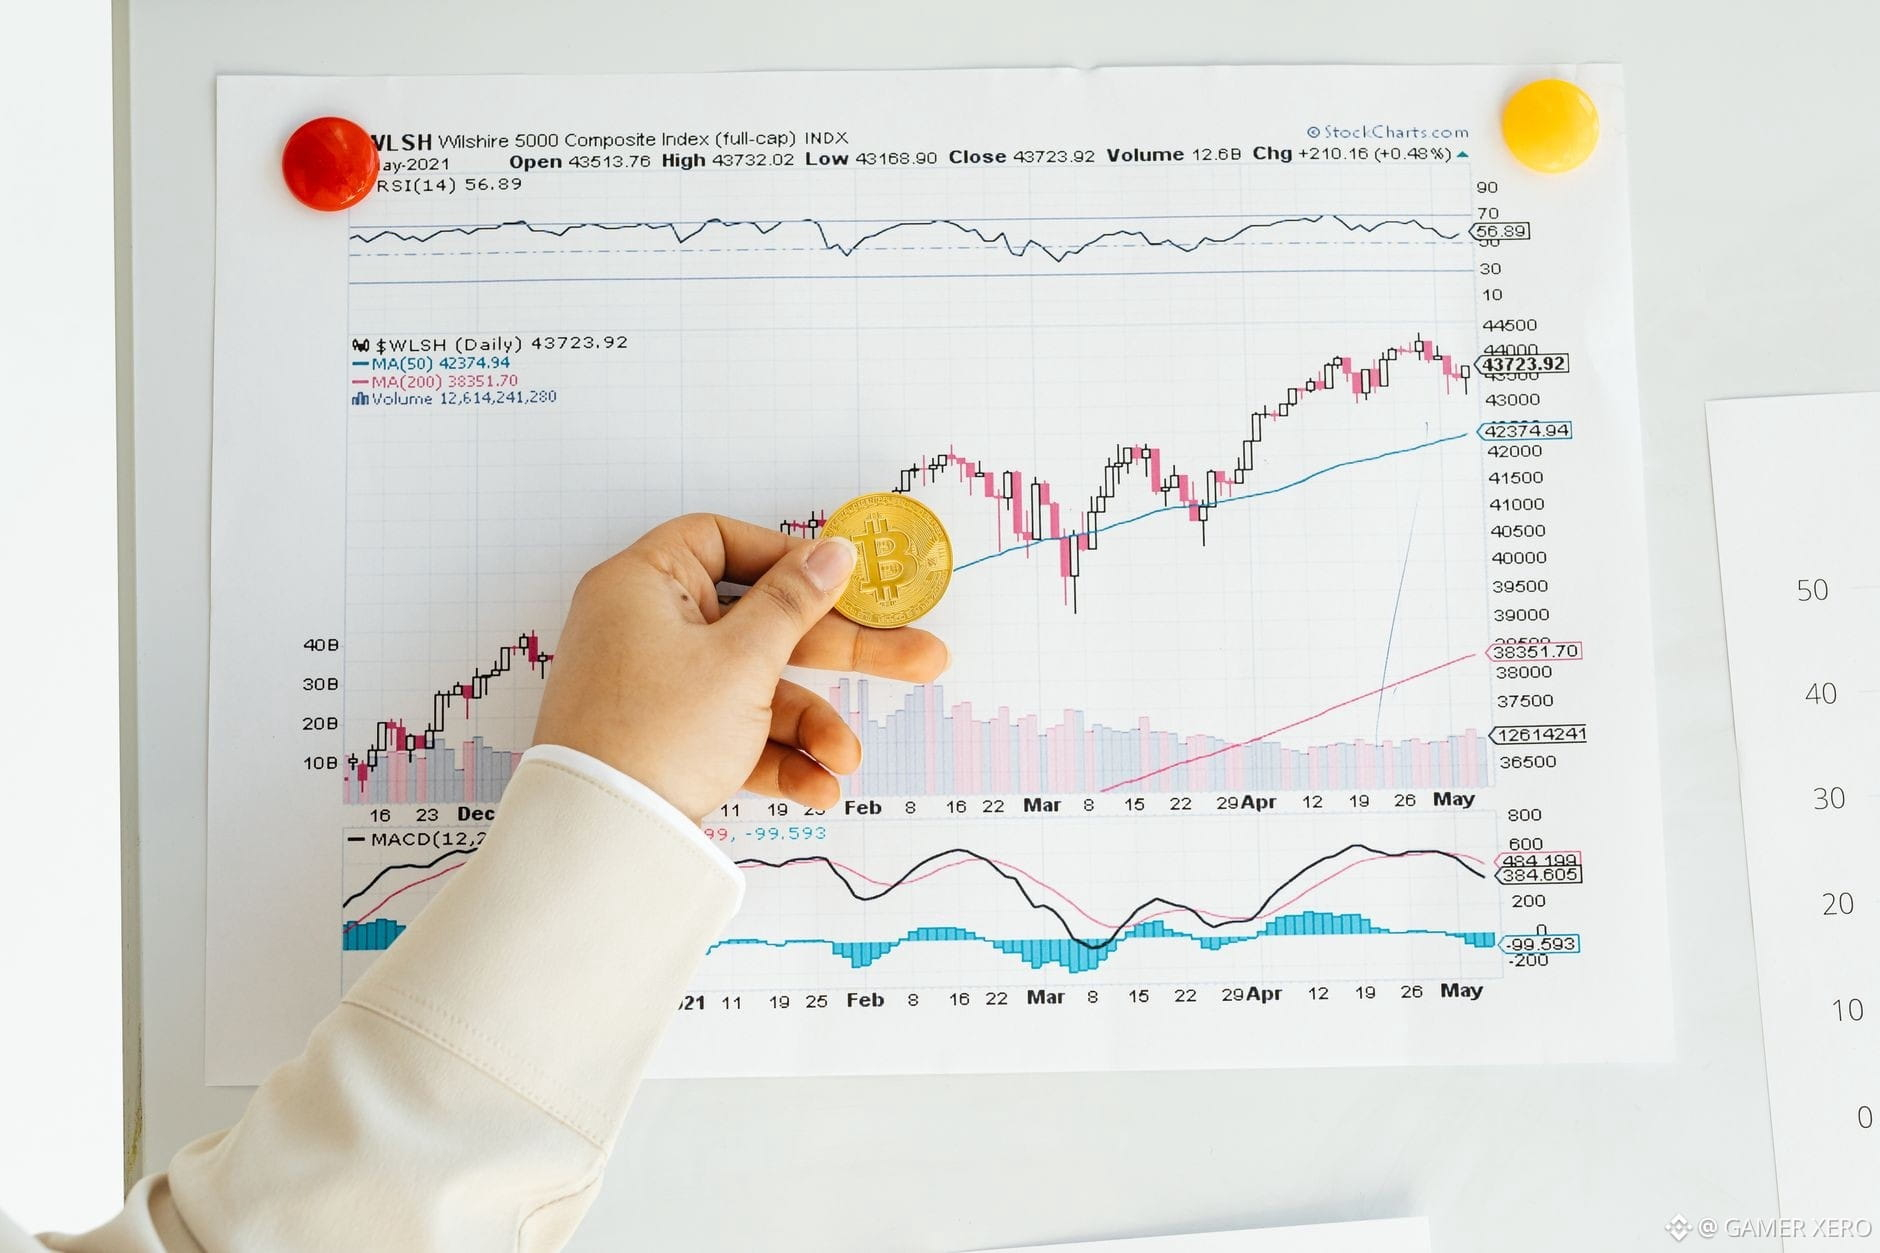
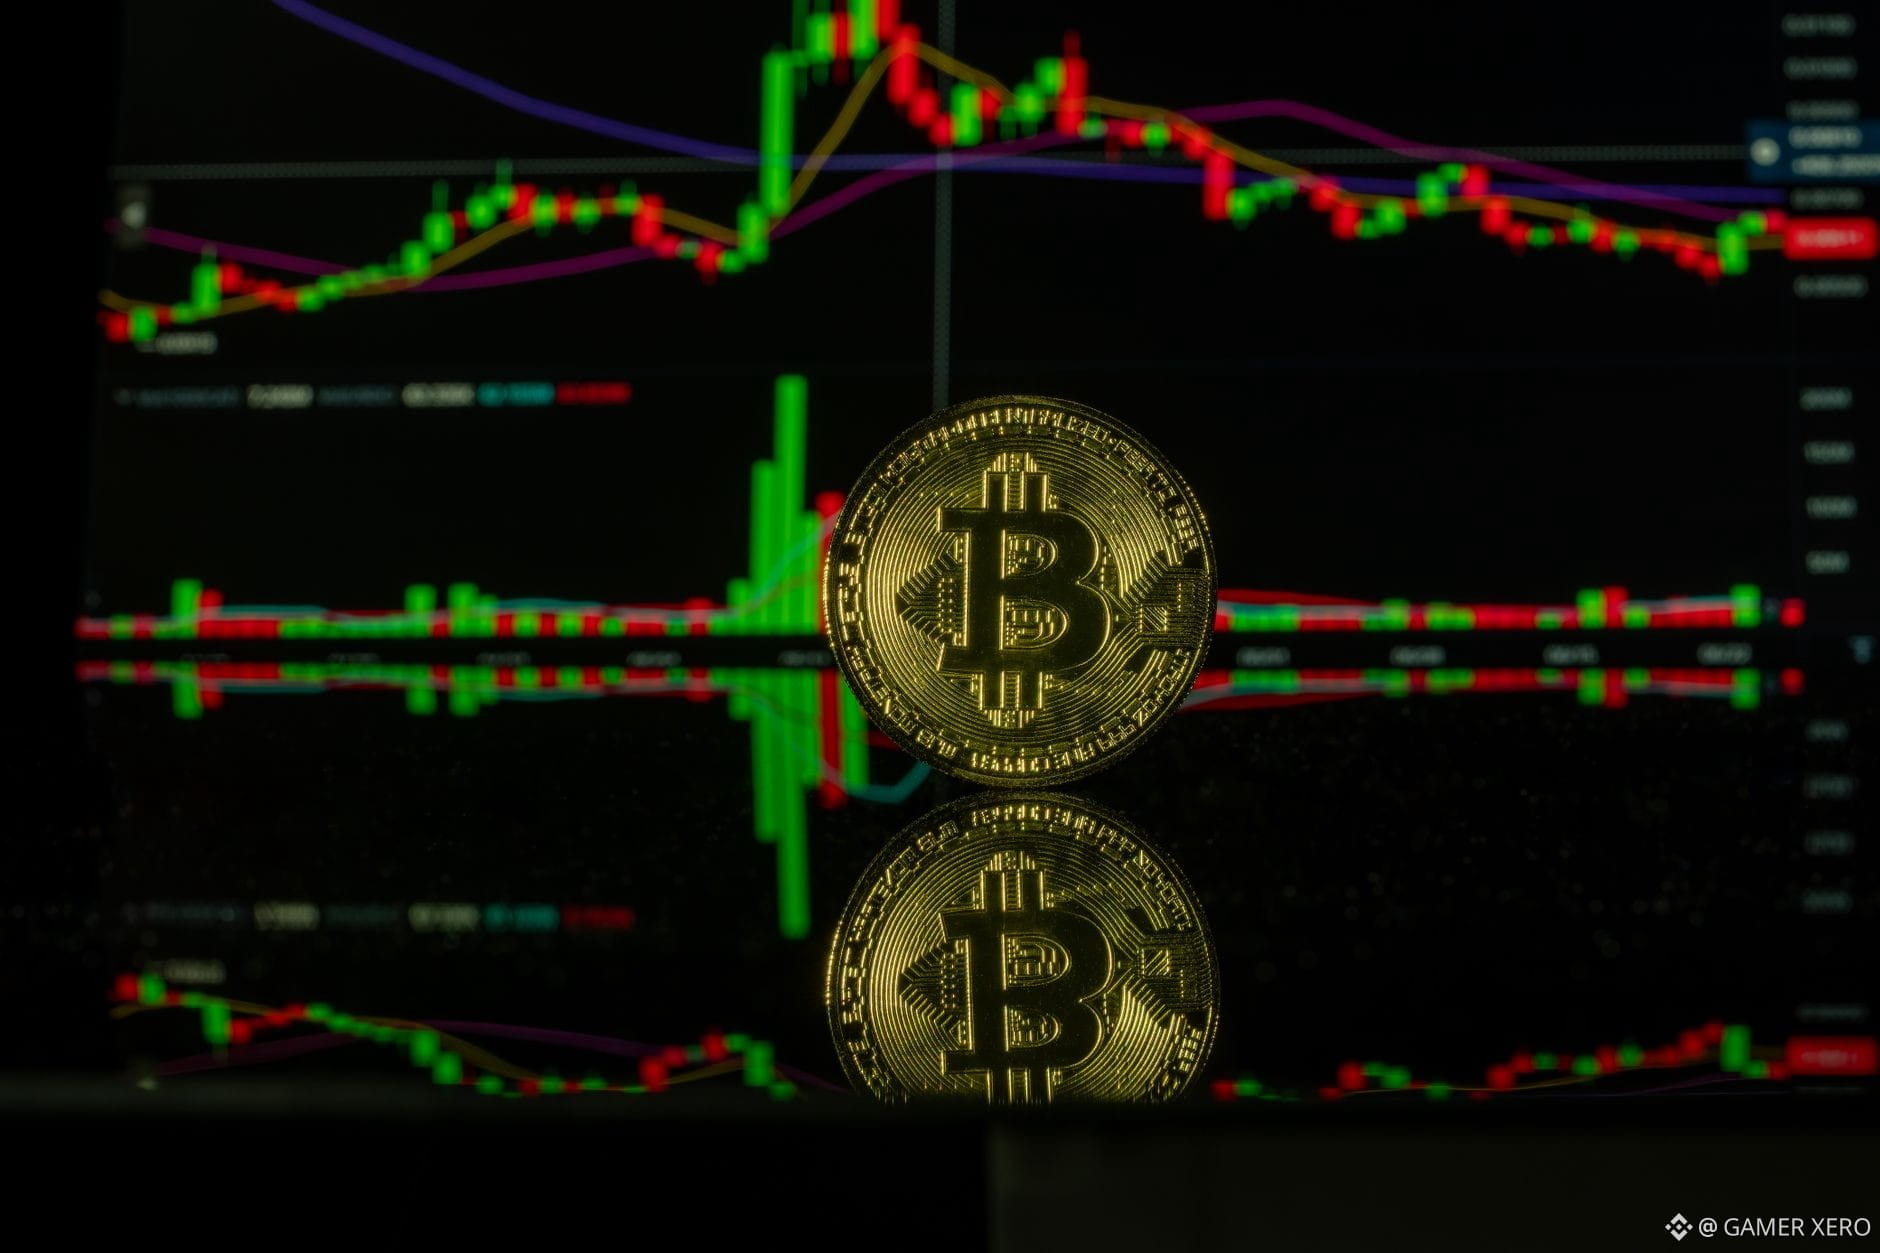
Watching the live order book on Binance can reveal where real‑time buying and selling pressure sits. Take $BTC right now: the best bid hovers just below the 24‑hour low at $76,264, while the best ask is near the high of $77,792. If you pull the depth view, you’ll see roughly 1 M BTC clustered between $76,200 and $76,300 on the bid side, but only a few hundred thousand on the ask side in the same range. That imbalance suggests sellers are defending the upper band, while buyers are gathering near the lower edge.
By monitoring these ratios alongside price action, you can spot when liquidity is shifting before the candle does. Have you used order‑book depth ratios in your own trade planning, and what window size works best for you?
#CryptoEducation #BinanceTips #OrderBook #GAMERXERO
Watching the live order book on Binance can reveal where real‑time buying and selling pressure sits. Take $BTC right now: the best bid hovers just below the 24‑hour low at $76,264, while the best ask is near the high of $77,792. If you pull the depth view, you’ll see roughly 1 M BTC clustered between $76,200 and $76,300 on the bid side, but only a few hundred thousand on the ask side in the same range. That imbalance suggests sellers are defending the upper band, while buyers are gathering near the lower edge.
By monitoring these ratios alongside price action, you can spot when liquidity is shifting before the candle does. Have you used order‑book depth ratios in your own trade planning, and what window size works best for you?
#CryptoEducation #BinanceTips #OrderBook #GAMERXERO
By monitoring these ratios alongside price action, you can spot when liquidity is shifting before the candle does. Have you used order‑book depth ratios in your own trade planning, and what window size works best for you?
#CryptoEducation #BinanceTips #OrderBook #GAMERXERO
27

Demystifying Market Depth: How Order Books Shape Price Action and Trade ExecutionWhen trading cryptocurrencies, most beginners focus exclusively on the primary price chart—watching candlesticks move up or down in real time. However, the current spot price displayed on an exchange screen is merely the result of the most recent executed transaction. It tells you where the market was a moment ago, but it reveals very little about how much trading volume the market can handle right now without moving significantly.
To understand how easily an asset's price can move, how orders are filled, and why large transactions sometimes trigger sudden price spikes, traders must look under the hood at market depth.
Market depth is a foundational concept in market structure and liquidity analysis. It reflects an asset's ability to absorb large market orders without experiencing significant, abrupt price changes. In this guide, we will break down what market depth is, how order books function, how to interpret depth charts, and how intermediate traders can use this knowledge to improve trade execution while avoiding common structural pitfalls.
---
### Understanding Order Books and the Bid-Ask Spread
To comprehend market depth, one must first master the structure of an electronic order book. An order book is a real-time, continuously updated list of open limit buy and sell orders for a specific trading pair, organized by price level.
An order book consists of three primary components:
1. **The Bid Side (Buyers):** The bid side displays all active limit buy orders. These represent market participants who want to purchase the asset at a specified price or lower. The highest bid is the best available price for anyone looking to sell immediately.
2. **The Ask Side (Sellers):** The ask side (also known as the offer side) displays all active limit sell orders. These represent participants who want to sell the asset at a specified price or higher. The lowest ask is the best available price for anyone looking to buy immediately.
3. **The Bid-Ask Spread:** The numerical difference between the lowest ask price and the highest bid price is known as the bid-ask spread. In highly liquid markets, this spread is extremely narrow—often just a fraction of a cent or dollar. In illiquid markets, the spread can be wide.
When a trader submits a **market order**, it executes immediately against the best available limit orders resting in the order book. A market buy order sweeps through the ask side starting from the lowest ask price, while a market sell order sweeps through the bid side starting from the highest bid price.
---
### What is Market Depth and Why Does It Matter?
Market depth measures the volume of outstanding limit buy and sell orders at various price levels above and below the current mark price.
If a market has **high depth** (or "deep liquidity"), there are substantial volumes of limit orders residing close to the market price on both sides of the book. In such an environment, a trader can execute a large market order with minimal impact on the overall price.
Conversely, if a market has **shallow depth**, even a relatively modest market order can exhaust the available limit orders at the top level of the order book and force execution into higher or lower price tiers. This difference between the expected execution price and the actual executed price is known as **slippage**.
#### A Practical Example of Slippage and Depth
Imagine a scenario where the current displayed price of Bitcoin on an exchange is $60,000. A trader wants to purchase 10 Bitcoin immediately using a market buy order.
Suppose the order book's ask side looks like this:
* **Level 1:** 2 Bitcoin available at $60,000
* **Level 2:** 3 Bitcoin available at $60,050
* **Level 3:** 5 Bitcoin available at $60,100
When the market buy order for 10 Bitcoin is placed, the exchange order matching engine fills it progressively across available liquidity:
* 2 Bitcoin are bought at $60,000 (Cost: $120,000)
* 3 Bitcoin are bought at $60,050 (Cost: $180,150)
* 5 Bitcoin are bought at $60,100 (Cost: $300,500)
The total expenditure to acquire 10 Bitcoin is $600,650. The effective average purchase price per Bitcoin becomes **$60,065**, rather than the initial mark price of $60,000. The $65 per unit average difference is the direct result of consuming available market depth across multiple price tiers.
---
### Reading Depth Charts and Spotting "Order Walls"
Most visual trading interfaces provide a **Depth Chart** alongside traditional candlestick charts. A depth chart plots cumulative order volume on the Y-axis against price on the X-axis, divided into two colored regions: green for buy orders (bids) and red for sell orders (asks).
* **The Mid-Price:** The center point where the green and red shapes meet represents the current mid-market price.
* **Slope and Volume:** A shallow, gradual slope indicates that limit orders are distributed evenly across price levels. A steep, vertical wall indicates a heavy concentration of limit orders at a single price point.
#### Buy Walls and Sell Walls
* **Buy Wall:** A buy wall occurs when a massive limit buy order (or a dense cluster of orders) rests at a specific price level below the market price. On a depth chart, this appears as a tall green vertical step. Traders often view large buy walls as potential temporary support levels, as price cannot drop further until that entire aggregate buy volume is filled.
* **Sell Wall:** A sell wall occurs when a massive limit sell order rests at a price level above the current market price, appearing as a tall red vertical step. Sell walls represent potential short-term resistance, as buying pressure must absorb all that inventory before price can advance higher.
---
### The Role of Market Makers in Maintaining Depth
Where does market depth actually come from? While individual retail traders contribute limit orders, the bulk of market depth in modern digital asset markets is provided by **Market Makers**.
Market makers are specialized institutional entities or automated high-frequency trading algorithms that continuously place limit buy and limit sell orders on both sides of the book. Their primary objective is to earn small profits from the bid-ask spread while capturing exchange rebates for supplying liquidity.
Market makers play critical roles in market stability:
* **Reducing Slippage:** By placing orders at close intervals, market makers cushion the impact of incoming market orders.
* **Maintaining Efficiency:** Automated market maker bots continuously cross-reference prices across multiple exchanges. If Bitcoin trades at $60,000 on Exchange A and $60,100 on Exchange B, arbitrage algorithms buy on Exchange A and sell on Exchange B, quickly keeping prices and depth synchronized across global venues.
---
### Risks, Limitations, and Manipulative Tactics
While monitoring market depth provides valuable insights into order flow, relying strictly on visible order book data carries distinct risks and limitations:
1. **Spoofing and Fake Depth:** Limit orders are non-binding until filled and can be canceled instantly. Predatory traders sometimes place massive limit orders (e.g., a huge fake buy wall) to manipulate market sentiment and trick retail traders into buying, only to cancel the wall before price reaches it. This illegal tactic is known as spoofing.
2. **Iceberg Orders:** Institutional traders looking to move large positions often use "iceberg orders." These are algorithmic orders split into smaller displayed tranches. For instance, an institutional seller might place an order for 500 Ethereum, but only display 5 Ethereum at a time in the public order book. Once one tranche fills, the next automatically populates. Consequently, real market depth may be significantly larger than what is visible on screen.
3. **Off-Exchange Liquidity (OTC Desks):** Massive trades executed by institutions rarely go through public spot order books to prevent market impact. Instead, they occur Over-The-Counter (OTC). Therefore, exchange depth charts do not reflect total global supply and demand.
4. **Dynamic Liquidity Withdrawal:** During periods of sharp market volatility or macroeconomic announcements, market-making algorithms frequently cancel their limit orders in real time to avoid severe losses. As a result, order book depth can evaporate in milliseconds, leaving the market vulnerable to sharp slippage right when liquidity is needed most.
---
### Practical Execution Strategies for Traders
Understanding order book dynamics allows intermediate traders to make smarter execution decisions:
* **Match Order Types to Market Depth:** For major assets like Bitcoin or Ethereum on high-volume platforms, market orders may experience negligible slippage for small position sizes. However, for lower-capitalization altcoins with shallow order books, traders should rely primarily on **limit orders** or continuous execution algorithms (such as TWAP) to maintain price control.
* **Verify Walls Before Assuming Support:** Do not assume a buy or sell wall will hold as support or resistance simply because it appears on a depth chart. Observe how the wall behaves as price approaches: if the order volume rapidly shrinks or disappears entirely, it may have been a temporary or manipulative wall.
* **Account for Fee Structures:** Exchanges often charge lower fees to "makers" (those who add limit orders to the book) than to "takers" (those who remove orders with market orders). Using limit orders to add depth not only prevents slippage but can also lower transaction costs over time.
---
### Conclusion
Market depth offers a clear window into the real-time mechanics of asset pricing and trading volume distribution. By learning to interpret order books and depth charts, intermediate traders can better evaluate market structure, minimize execution costs, and recognize the structural realities behind rapid price moves.
However, order book analysis should never be viewed as an isolated forecasting tool. Because limit orders can be modified, canceled, or hidden within fractions of a second, market depth analysis must always be paired with prudent risk management, realistic positioning, and a broader analysis of market context.
#CryptoTrading #MarketDepth #OrderBook
Demystifying Market Depth: How Order Books Shape Price Action and Trade Execution
When trading cryptocurrencies, most beginners focus exclusively on the primary price chart—watching candlesticks move up or down in real time. However, the current spot price displayed on an exchange screen is merely the result of the most recent executed transaction. It tells you where the market was a moment ago, but it reveals very little about how much trading volume the market can handle right now without moving significantly.
To understand how easily an asset's price can move, how orders are filled, and why large transactions sometimes trigger sudden price spikes, traders must look under the hood at market depth.
Market depth is a foundational concept in market structure and liquidity analysis. It reflects an asset's ability to absorb large market orders without experiencing significant, abrupt price changes. In this guide, we will break down what market depth is, how order books function, how to interpret depth charts, and how intermediate traders can use this knowledge to improve trade execution while avoiding common structural pitfalls.
---
### Understanding Order Books and the Bid-Ask Spread
To comprehend market depth, one must first master the structure of an electronic order book. An order book is a real-time, continuously updated list of open limit buy and sell orders for a specific trading pair, organized by price level.
An order book consists of three primary components:
1. **The Bid Side (Buyers):** The bid side displays all active limit buy orders. These represent market participants who want to purchase the asset at a specified price or lower. The highest bid is the best available price for anyone looking to sell immediately.
2. **The Ask Side (Sellers):** The ask side (also known as the offer side) displays all active limit sell orders. These represent participants who want to sell the asset at a specified price or higher. The lowest ask is the best available price for anyone looking to buy immediately.
3. **The Bid-Ask Spread:** The numerical difference between the lowest ask price and the highest bid price is known as the bid-ask spread. In highly liquid markets, this spread is extremely narrow—often just a fraction of a cent or dollar. In illiquid markets, the spread can be wide.
When a trader submits a **market order**, it executes immediately against the best available limit orders resting in the order book. A market buy order sweeps through the ask side starting from the lowest ask price, while a market sell order sweeps through the bid side starting from the highest bid price.
---
### What is Market Depth and Why Does It Matter?
Market depth measures the volume of outstanding limit buy and sell orders at various price levels above and below the current mark price.
If a market has **high depth** (or "deep liquidity"), there are substantial volumes of limit orders residing close to the market price on both sides of the book. In such an environment, a trader can execute a large market order with minimal impact on the overall price.
Conversely, if a market has **shallow depth**, even a relatively modest market order can exhaust the available limit orders at the top level of the order book and force execution into higher or lower price tiers. This difference between the expected execution price and the actual executed price is known as **slippage**.
#### A Practical Example of Slippage and Depth
Imagine a scenario where the current displayed price of Bitcoin on an exchange is $60,000. A trader wants to purchase 10 Bitcoin immediately using a market buy order.
Suppose the order book's ask side looks like this:
* **Level 1:** 2 Bitcoin available at $60,000
* **Level 2:** 3 Bitcoin available at $60,050
* **Level 3:** 5 Bitcoin available at $60,100
When the market buy order for 10 Bitcoin is placed, the exchange order matching engine fills it progressively across available liquidity:
* 2 Bitcoin are bought at $60,000 (Cost: $120,000)
* 3 Bitcoin are bought at $60,050 (Cost: $180,150)
* 5 Bitcoin are bought at $60,100 (Cost: $300,500)
The total expenditure to acquire 10 Bitcoin is $600,650. The effective average purchase price per Bitcoin becomes **$60,065**, rather than the initial mark price of $60,000. The $65 per unit average difference is the direct result of consuming available market depth across multiple price tiers.
---
### Reading Depth Charts and Spotting "Order Walls"
Most visual trading interfaces provide a **Depth Chart** alongside traditional candlestick charts. A depth chart plots cumulative order volume on the Y-axis against price on the X-axis, divided into two colored regions: green for buy orders (bids) and red for sell orders (asks).
* **The Mid-Price:** The center point where the green and red shapes meet represents the current mid-market price.
* **Slope and Volume:** A shallow, gradual slope indicates that limit orders are distributed evenly across price levels. A steep, vertical wall indicates a heavy concentration of limit orders at a single price point.
#### Buy Walls and Sell Walls
* **Buy Wall:** A buy wall occurs when a massive limit buy order (or a dense cluster of orders) rests at a specific price level below the market price. On a depth chart, this appears as a tall green vertical step. Traders often view large buy walls as potential temporary support levels, as price cannot drop further until that entire aggregate buy volume is filled.
* **Sell Wall:** A sell wall occurs when a massive limit sell order rests at a price level above the current market price, appearing as a tall red vertical step. Sell walls represent potential short-term resistance, as buying pressure must absorb all that inventory before price can advance higher.
---
### The Role of Market Makers in Maintaining Depth
Where does market depth actually come from? While individual retail traders contribute limit orders, the bulk of market depth in modern digital asset markets is provided by **Market Makers**.
Market makers are specialized institutional entities or automated high-frequency trading algorithms that continuously place limit buy and limit sell orders on both sides of the book. Their primary objective is to earn small profits from the bid-ask spread while capturing exchange rebates for supplying liquidity.
Market makers play critical roles in market stability:
* **Reducing Slippage:** By placing orders at close intervals, market makers cushion the impact of incoming market orders.
* **Maintaining Efficiency:** Automated market maker bots continuously cross-reference prices across multiple exchanges. If Bitcoin trades at $60,000 on Exchange A and $60,100 on Exchange B, arbitrage algorithms buy on Exchange A and sell on Exchange B, quickly keeping prices and depth synchronized across global venues.
---
### Risks, Limitations, and Manipulative Tactics
While monitoring market depth provides valuable insights into order flow, relying strictly on visible order book data carries distinct risks and limitations:
1. **Spoofing and Fake Depth:** Limit orders are non-binding until filled and can be canceled instantly. Predatory traders sometimes place massive limit orders (e.g., a huge fake buy wall) to manipulate market sentiment and trick retail traders into buying, only to cancel the wall before price reaches it. This illegal tactic is known as spoofing.
2. **Iceberg Orders:** Institutional traders looking to move large positions often use "iceberg orders." These are algorithmic orders split into smaller displayed tranches. For instance, an institutional seller might place an order for 500 Ethereum, but only display 5 Ethereum at a time in the public order book. Once one tranche fills, the next automatically populates. Consequently, real market depth may be significantly larger than what is visible on screen.
3. **Off-Exchange Liquidity (OTC Desks):** Massive trades executed by institutions rarely go through public spot order books to prevent market impact. Instead, they occur Over-The-Counter (OTC). Therefore, exchange depth charts do not reflect total global supply and demand.
4. **Dynamic Liquidity Withdrawal:** During periods of sharp market volatility or macroeconomic announcements, market-making algorithms frequently cancel their limit orders in real time to avoid severe losses. As a result, order book depth can evaporate in milliseconds, leaving the market vulnerable to sharp slippage right when liquidity is needed most.
---
### Practical Execution Strategies for Traders
Understanding order book dynamics allows intermediate traders to make smarter execution decisions:
* **Match Order Types to Market Depth:** For major assets like Bitcoin or Ethereum on high-volume platforms, market orders may experience negligible slippage for small position sizes. However, for lower-capitalization altcoins with shallow order books, traders should rely primarily on **limit orders** or continuous execution algorithms (such as TWAP) to maintain price control.
* **Verify Walls Before Assuming Support:** Do not assume a buy or sell wall will hold as support or resistance simply because it appears on a depth chart. Observe how the wall behaves as price approaches: if the order volume rapidly shrinks or disappears entirely, it may have been a temporary or manipulative wall.
* **Account for Fee Structures:** Exchanges often charge lower fees to "makers" (those who add limit orders to the book) than to "takers" (those who remove orders with market orders). Using limit orders to add depth not only prevents slippage but can also lower transaction costs over time.
---
### Conclusion
Market depth offers a clear window into the real-time mechanics of asset pricing and trading volume distribution. By learning to interpret order books and depth charts, intermediate traders can better evaluate market structure, minimize execution costs, and recognize the structural realities behind rapid price moves.
However, order book analysis should never be viewed as an isolated forecasting tool. Because limit orders can be modified, canceled, or hidden within fractions of a second, market depth analysis must always be paired with prudent risk management, realistic positioning, and a broader analysis of market context.
#CryptoTrading #MarketDepth #OrderBook
To understand how easily an asset's price can move, how orders are filled, and why large transactions sometimes trigger sudden price spikes, traders must look under the hood at market depth.
Market depth is a foundational concept in market structure and liquidity analysis. It reflects an asset's ability to absorb large market orders without experiencing significant, abrupt price changes. In this guide, we will break down what market depth is, how order books function, how to interpret depth charts, and how intermediate traders can use this knowledge to improve trade execution while avoiding common structural pitfalls.
---
### Understanding Order Books and the Bid-Ask Spread
To comprehend market depth, one must first master the structure of an electronic order book. An order book is a real-time, continuously updated list of open limit buy and sell orders for a specific trading pair, organized by price level.
An order book consists of three primary components:
1. **The Bid Side (Buyers):** The bid side displays all active limit buy orders. These represent market participants who want to purchase the asset at a specified price or lower. The highest bid is the best available price for anyone looking to sell immediately.
2. **The Ask Side (Sellers):** The ask side (also known as the offer side) displays all active limit sell orders. These represent participants who want to sell the asset at a specified price or higher. The lowest ask is the best available price for anyone looking to buy immediately.
3. **The Bid-Ask Spread:** The numerical difference between the lowest ask price and the highest bid price is known as the bid-ask spread. In highly liquid markets, this spread is extremely narrow—often just a fraction of a cent or dollar. In illiquid markets, the spread can be wide.
When a trader submits a **market order**, it executes immediately against the best available limit orders resting in the order book. A market buy order sweeps through the ask side starting from the lowest ask price, while a market sell order sweeps through the bid side starting from the highest bid price.
---
### What is Market Depth and Why Does It Matter?
Market depth measures the volume of outstanding limit buy and sell orders at various price levels above and below the current mark price.
If a market has **high depth** (or "deep liquidity"), there are substantial volumes of limit orders residing close to the market price on both sides of the book. In such an environment, a trader can execute a large market order with minimal impact on the overall price.
Conversely, if a market has **shallow depth**, even a relatively modest market order can exhaust the available limit orders at the top level of the order book and force execution into higher or lower price tiers. This difference between the expected execution price and the actual executed price is known as **slippage**.
#### A Practical Example of Slippage and Depth
Imagine a scenario where the current displayed price of Bitcoin on an exchange is $60,000. A trader wants to purchase 10 Bitcoin immediately using a market buy order.
Suppose the order book's ask side looks like this:
* **Level 1:** 2 Bitcoin available at $60,000
* **Level 2:** 3 Bitcoin available at $60,050
* **Level 3:** 5 Bitcoin available at $60,100
When the market buy order for 10 Bitcoin is placed, the exchange order matching engine fills it progressively across available liquidity:
* 2 Bitcoin are bought at $60,000 (Cost: $120,000)
* 3 Bitcoin are bought at $60,050 (Cost: $180,150)
* 5 Bitcoin are bought at $60,100 (Cost: $300,500)
The total expenditure to acquire 10 Bitcoin is $600,650. The effective average purchase price per Bitcoin becomes **$60,065**, rather than the initial mark price of $60,000. The $65 per unit average difference is the direct result of consuming available market depth across multiple price tiers.
---
### Reading Depth Charts and Spotting "Order Walls"
Most visual trading interfaces provide a **Depth Chart** alongside traditional candlestick charts. A depth chart plots cumulative order volume on the Y-axis against price on the X-axis, divided into two colored regions: green for buy orders (bids) and red for sell orders (asks).
* **The Mid-Price:** The center point where the green and red shapes meet represents the current mid-market price.
* **Slope and Volume:** A shallow, gradual slope indicates that limit orders are distributed evenly across price levels. A steep, vertical wall indicates a heavy concentration of limit orders at a single price point.
#### Buy Walls and Sell Walls
* **Buy Wall:** A buy wall occurs when a massive limit buy order (or a dense cluster of orders) rests at a specific price level below the market price. On a depth chart, this appears as a tall green vertical step. Traders often view large buy walls as potential temporary support levels, as price cannot drop further until that entire aggregate buy volume is filled.
* **Sell Wall:** A sell wall occurs when a massive limit sell order rests at a price level above the current market price, appearing as a tall red vertical step. Sell walls represent potential short-term resistance, as buying pressure must absorb all that inventory before price can advance higher.
---
### The Role of Market Makers in Maintaining Depth
Where does market depth actually come from? While individual retail traders contribute limit orders, the bulk of market depth in modern digital asset markets is provided by **Market Makers**.
Market makers are specialized institutional entities or automated high-frequency trading algorithms that continuously place limit buy and limit sell orders on both sides of the book. Their primary objective is to earn small profits from the bid-ask spread while capturing exchange rebates for supplying liquidity.
Market makers play critical roles in market stability:
* **Reducing Slippage:** By placing orders at close intervals, market makers cushion the impact of incoming market orders.
* **Maintaining Efficiency:** Automated market maker bots continuously cross-reference prices across multiple exchanges. If Bitcoin trades at $60,000 on Exchange A and $60,100 on Exchange B, arbitrage algorithms buy on Exchange A and sell on Exchange B, quickly keeping prices and depth synchronized across global venues.
---
### Risks, Limitations, and Manipulative Tactics
While monitoring market depth provides valuable insights into order flow, relying strictly on visible order book data carries distinct risks and limitations:
1. **Spoofing and Fake Depth:** Limit orders are non-binding until filled and can be canceled instantly. Predatory traders sometimes place massive limit orders (e.g., a huge fake buy wall) to manipulate market sentiment and trick retail traders into buying, only to cancel the wall before price reaches it. This illegal tactic is known as spoofing.
2. **Iceberg Orders:** Institutional traders looking to move large positions often use "iceberg orders." These are algorithmic orders split into smaller displayed tranches. For instance, an institutional seller might place an order for 500 Ethereum, but only display 5 Ethereum at a time in the public order book. Once one tranche fills, the next automatically populates. Consequently, real market depth may be significantly larger than what is visible on screen.
3. **Off-Exchange Liquidity (OTC Desks):** Massive trades executed by institutions rarely go through public spot order books to prevent market impact. Instead, they occur Over-The-Counter (OTC). Therefore, exchange depth charts do not reflect total global supply and demand.
4. **Dynamic Liquidity Withdrawal:** During periods of sharp market volatility or macroeconomic announcements, market-making algorithms frequently cancel their limit orders in real time to avoid severe losses. As a result, order book depth can evaporate in milliseconds, leaving the market vulnerable to sharp slippage right when liquidity is needed most.
---
### Practical Execution Strategies for Traders
Understanding order book dynamics allows intermediate traders to make smarter execution decisions:
* **Match Order Types to Market Depth:** For major assets like Bitcoin or Ethereum on high-volume platforms, market orders may experience negligible slippage for small position sizes. However, for lower-capitalization altcoins with shallow order books, traders should rely primarily on **limit orders** or continuous execution algorithms (such as TWAP) to maintain price control.
* **Verify Walls Before Assuming Support:** Do not assume a buy or sell wall will hold as support or resistance simply because it appears on a depth chart. Observe how the wall behaves as price approaches: if the order volume rapidly shrinks or disappears entirely, it may have been a temporary or manipulative wall.
* **Account for Fee Structures:** Exchanges often charge lower fees to "makers" (those who add limit orders to the book) than to "takers" (those who remove orders with market orders). Using limit orders to add depth not only prevents slippage but can also lower transaction costs over time.
---
### Conclusion
Market depth offers a clear window into the real-time mechanics of asset pricing and trading volume distribution. By learning to interpret order books and depth charts, intermediate traders can better evaluate market structure, minimize execution costs, and recognize the structural realities behind rapid price moves.
However, order book analysis should never be viewed as an isolated forecasting tool. Because limit orders can be modified, canceled, or hidden within fractions of a second, market depth analysis must always be paired with prudent risk management, realistic positioning, and a broader analysis of market context.
#CryptoTrading #MarketDepth #OrderBook
105

🔥 Same volume. Different risk.
A coin can print $500M in volume and still wreck your order if the book is thin.
Volume = how much traded. Liquidity = how much size the market can absorb without blowing up.
$500M volume + deep book = your order barely moves price. $500M volume + thin book = your own $1M order becomes the candle.
Before trusting a volume number, check the order book depth, the spread, and whether that volume actually holds up over time — not just a one-off spike.
High volume + strong liquidity = healthy market. High volume + weak liquidity = a trap waiting for size to walk in.
Don't chase the loud number. Chase the one that protects your exit.
#Liquidity #CryptoTrading #OrderBook
$BTC $ETH $BNB
🔥 Same volume. Different risk.
A coin can print $500M in volume and still wreck your order if the book is thin.
Volume = how much traded. Liquidity = how much size the market can absorb without blowing up.
$500M volume + deep book = your order barely moves price. $500M volume + thin book = your own $1M order becomes the candle.
Before trusting a volume number, check the order book depth, the spread, and whether that volume actually holds up over time — not just a one-off spike.
High volume + strong liquidity = healthy market. High volume + weak liquidity = a trap waiting for size to walk in.
Don't chase the loud number. Chase the one that protects your exit.
#Liquidity #CryptoTrading #OrderBook
$BTC $ETH $BNB
A coin can print $500M in volume and still wreck your order if the book is thin.
Volume = how much traded. Liquidity = how much size the market can absorb without blowing up.
$500M volume + deep book = your order barely moves price. $500M volume + thin book = your own $1M order becomes the candle.
Before trusting a volume number, check the order book depth, the spread, and whether that volume actually holds up over time — not just a one-off spike.
High volume + strong liquidity = healthy market. High volume + weak liquidity = a trap waiting for size to walk in.
Don't chase the loud number. Chase the one that protects your exit.
#Liquidity #CryptoTrading #OrderBook
$BTC $ETH $BNB
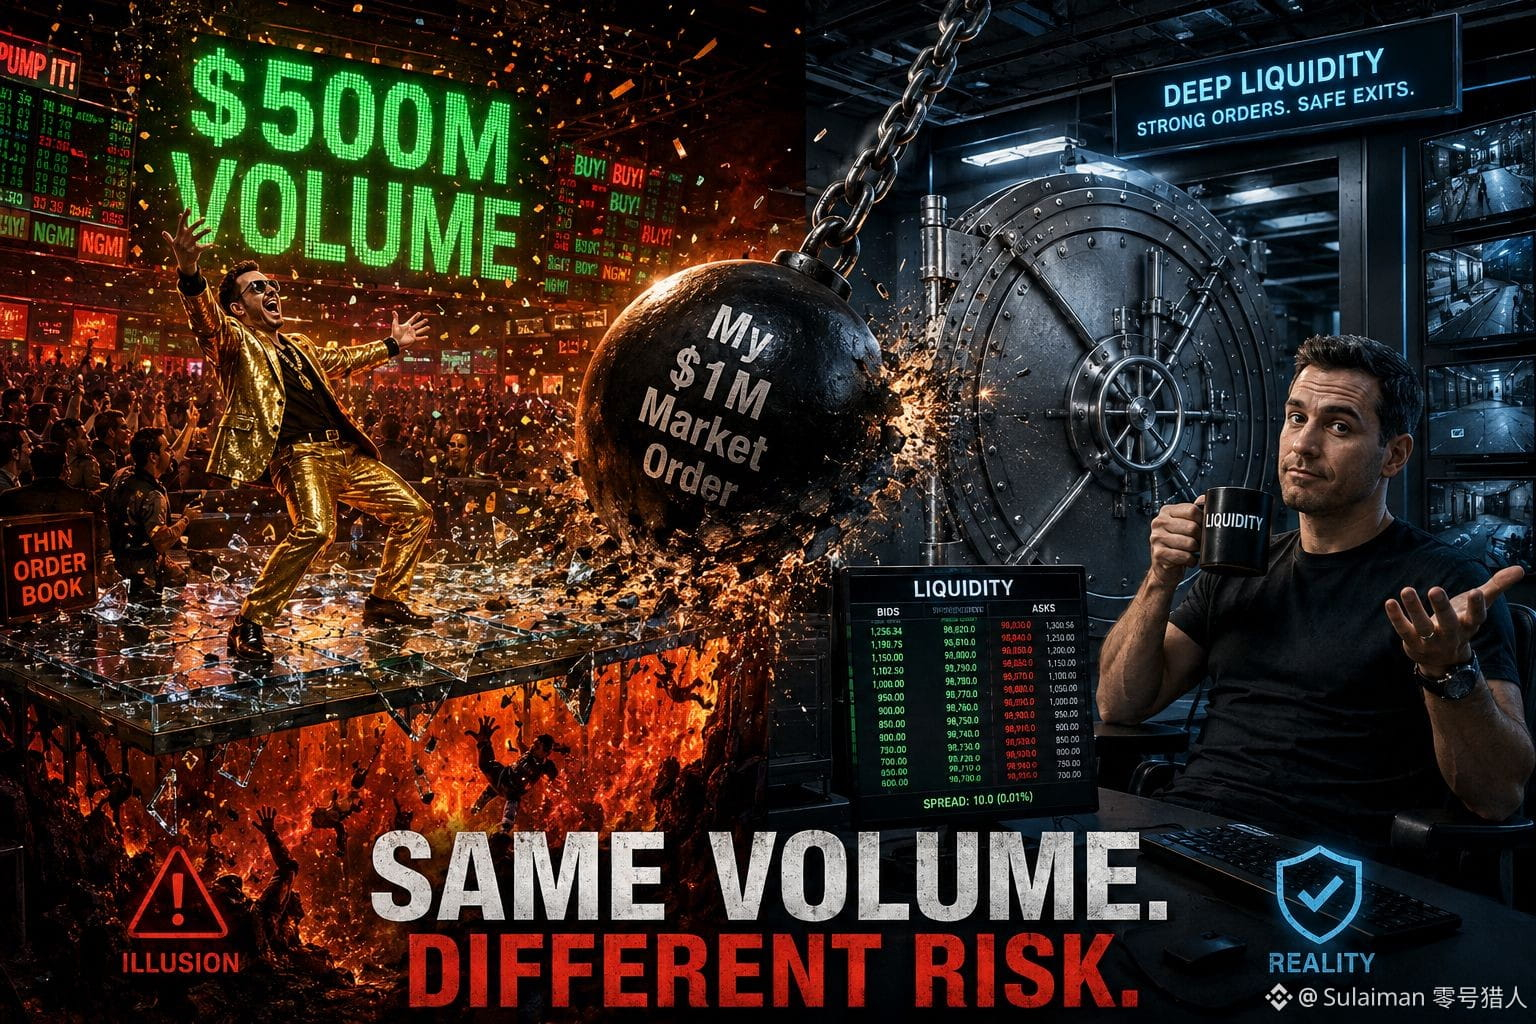
2
3
156
·
--
When the market hovers in a tight 24‑hour range, the best way to improve your entry price isn’t chasing the ticker—it’s using the order‑book. On Binance you can switch to “Depth” view and see the cumulative volume at each price level. If the bid side (green) builds up just a few dollars below the current price, that zone often acts as a temporary floor. Placing a limit buy just inside that cluster means you get filled as soon as the price tests the support, instead of entering at the market price and paying the spread.
Try this on the next swing: open the depth view, identify a clear bid wall a few dollars below the current price, and place a small limit order inside it. How do you decide the size of that order relative to your overall position?
#CryptoEducation #BinanceTips #OrderBook #GAMERXERO
When the market hovers in a tight 24‑hour range, the best way to improve your entry price isn’t chasing the ticker—it’s using the order‑book. On Binance you can switch to “Depth” view and see the cumulative volume at each price level. If the bid side (green) builds up just a few dollars below the current price, that zone often acts as a temporary floor. Placing a limit buy just inside that cluster means you get filled as soon as the price tests the support, instead of entering at the market price and paying the spread.
Try this on the next swing: open the depth view, identify a clear bid wall a few dollars below the current price, and place a small limit order inside it. How do you decide the size of that order relative to your overall position?
#CryptoEducation #BinanceTips #OrderBook #GAMERXERO
Try this on the next swing: open the depth view, identify a clear bid wall a few dollars below the current price, and place a small limit order inside it. How do you decide the size of that order relative to your overall position?
#CryptoEducation #BinanceTips #OrderBook #GAMERXERO
19
·
--
Spot the order‑book pressure before it shows up on the chart. On Binance you can toggle the depth view and see the cumulative volume at each price level. If the total bids just below the current price outweigh the asks above it, the market is in a short‑side imbalance and may hold or bounce higher; the opposite hints at downward pressure.
Right now $BTC sits at $77,888 with a 24‑hour range of $77,600‑$79,250. Pull up the depth chart – you’ll notice roughly 35 % more bid volume between $77,800 and $77,850 than ask volume in the same band. That 1.3 :1 bid‑to‑ask ratio suggests buying interest is building near the current level. For $ETH, trading at $2,448.68, the depth shows a tighter balance, with bids and asks almost equal, which aligns with its flat 0.10 % move.
Monitoring these ratios helps you decide whether to tighten stops, add to a position, or stay on the sidelines. How do you integrate order‑book imbalances into your own trade‑setup routine?
#CryptoTools #OrderBook #TradingTips #GAMERXERO
Spot the order‑book pressure before it shows up on the chart. On Binance you can toggle the depth view and see the cumulative volume at each price level. If the total bids just below the current price outweigh the asks above it, the market is in a short‑side imbalance and may hold or bounce higher; the opposite hints at downward pressure.
Right now $BTC sits at $77,888 with a 24‑hour range of $77,600‑$79,250. Pull up the depth chart – you’ll notice roughly 35 % more bid volume between $77,800 and $77,850 than ask volume in the same band. That 1.3 :1 bid‑to‑ask ratio suggests buying interest is building near the current level. For $ETH , trading at $2,448.68, the depth shows a tighter balance, with bids and asks almost equal, which aligns with its flat 0.10 % move.
Monitoring these ratios helps you decide whether to tighten stops, add to a position, or stay on the sidelines. How do you integrate order‑book imbalances into your own trade‑setup routine?
#CryptoTools #OrderBook #TradingTips #GAMERXERO
Right now $BTC sits at $77,888 with a 24‑hour range of $77,600‑$79,250. Pull up the depth chart – you’ll notice roughly 35 % more bid volume between $77,800 and $77,850 than ask volume in the same band. That 1.3 :1 bid‑to‑ask ratio suggests buying interest is building near the current level. For $ETH , trading at $2,448.68, the depth shows a tighter balance, with bids and asks almost equal, which aligns with its flat 0.10 % move.
Monitoring these ratios helps you decide whether to tighten stops, add to a position, or stay on the sidelines. How do you integrate order‑book imbalances into your own trade‑setup routine?
#CryptoTools #OrderBook #TradingTips #GAMERXERO
23
·
--
Seeing $BTC sit at $78,644 with a 24‑hour range of $77,000‑$79,400, the order book offers a quick health check. Pull the depth view on Binance and compare the total bid volume at the best‑price levels to the total ask volume – that’s the Order‑Book Imbalance (OBI). If bids outweigh asks, the OBI is positive and traders often interpret it as short‑term buying pressure; a negative OBI suggests sellers are in control.
Right now the top 5 price levels on the bid side hold roughly $1.2 B of BTC, while the same depth on the ask side shows about $950 M. That translates to an OBI of (+12 %). In practice, a modest positive imbalance like this can nudge the price toward the upper edge of the range, especially when the market is otherwise quiet. Conversely, a sudden swing to a negative OBI would typically precede a pull‑back toward the lower bound.
Tracking OBI day‑to‑day helps you gauge whether the market’s current posture is demand‑heavy or supply‑heavy without relying on price action alone. Have you spotted any OBI shifts that lined up with short‑term moves in your own trading?
#CryptoTools #OrderBook #TradingInsights #GAMERXERO
Seeing $BTC sit at $78,644 with a 24‑hour range of $77,000‑$79,400, the order book offers a quick health check. Pull the depth view on Binance and compare the total bid volume at the best‑price levels to the total ask volume – that’s the Order‑Book Imbalance (OBI). If bids outweigh asks, the OBI is positive and traders often interpret it as short‑term buying pressure; a negative OBI suggests sellers are in control.
Right now the top 5 price levels on the bid side hold roughly $1.2 B of BTC, while the same depth on the ask side shows about $950 M. That translates to an OBI of (+12 %). In practice, a modest positive imbalance like this can nudge the price toward the upper edge of the range, especially when the market is otherwise quiet. Conversely, a sudden swing to a negative OBI would typically precede a pull‑back toward the lower bound.
Tracking OBI day‑to‑day helps you gauge whether the market’s current posture is demand‑heavy or supply‑heavy without relying on price action alone. Have you spotted any OBI shifts that lined up with short‑term moves in your own trading?
#CryptoTools #OrderBook #TradingInsights #GAMERXERO
Right now the top 5 price levels on the bid side hold roughly $1.2 B of BTC, while the same depth on the ask side shows about $950 M. That translates to an OBI of (+12 %). In practice, a modest positive imbalance like this can nudge the price toward the upper edge of the range, especially when the market is otherwise quiet. Conversely, a sudden swing to a negative OBI would typically precede a pull‑back toward the lower bound.
Tracking OBI day‑to‑day helps you gauge whether the market’s current posture is demand‑heavy or supply‑heavy without relying on price action alone. Have you spotted any OBI shifts that lined up with short‑term moves in your own trading?
#CryptoTools #OrderBook #TradingInsights #GAMERXERO
15
·
--
Seeing $BTC trade around $78,008 with the 24‑hour range squeezed between $77,000 and $79,400 highlights a classic “range‑bound” market. In that environment, the order‑book imbalance (OBI) becomes a useful signal: it measures the net volume on the bid side versus the ask side at the best price levels. When bids out‑size asks, buying pressure builds and the price often nudges upward; the opposite suggests a short‑term pullback.
Using OBI lets you let the market’s own supply‑demand dynamics guide your trade, rather than guessing price direction. Have you tried reading the depth chart before making a move, and what did you notice about its reliability?
#CryptoEducation #OrderBook #TradingTips #GAMERXERO
Seeing $BTC trade around $78,008 with the 24‑hour range squeezed between $77,000 and $79,400 highlights a classic “range‑bound” market. In that environment, the order‑book imbalance (OBI) becomes a useful signal: it measures the net volume on the bid side versus the ask side at the best price levels. When bids out‑size asks, buying pressure builds and the price often nudges upward; the opposite suggests a short‑term pullback.
Using OBI lets you let the market’s own supply‑demand dynamics guide your trade, rather than guessing price direction. Have you tried reading the depth chart before making a move, and what did you notice about its reliability?
#CryptoEducation #OrderBook #TradingTips #GAMERXERO
Using OBI lets you let the market’s own supply‑demand dynamics guide your trade, rather than guessing price direction. Have you tried reading the depth chart before making a move, and what did you notice about its reliability?
#CryptoEducation #OrderBook #TradingTips #GAMERXERO
50
Log in to explore more content
Join global crypto users on Binance Square
⚡️ Get latest and useful information about crypto.
💬 Trusted by the world’s largest crypto exchange.
👍 Discover real insights from verified creators.
Email / Phone number
Trending Topics
1
#USContinuingJoblessClaims1.774M
468 views
66 Discussing
2
#USAugustPPIYoYRisesTo5.4%
518 views
52 Discussing
3
#AppleDebutsFoldablePhone
56,361 views
1,102 Discussing
4
#TSMCAugustRevenueUp53.3%YoY
14,292 views
411 Discussing
5
#IranSaysReadyToEscalateWarWithUS
18,833 views
415 Discussing
6
#EUExtendsCentralContactPointToCASPs
17,145 views
442 Discussing
7
#US10YTreasuryYieldHitsHighestSinceNov2023
42,014 views
661 Discussing
8
#USTreasuryToBuyBackUpTo$6BLongDatedDebt
23,486 views
191 Discussing
9
#BitcoinSurpasses$79K
79,665 views
301 Discussing
10
#BrentCrudeTops$100
138,853 views
429 Discussing