
#multitimeframe
multitimeframe
2,703 views
59 Discussing
Hot
Latest

Article
Multi-Timeframe Analysis: Master the Market Structure 📊📉Most traders make the mistake of relying on a single timeframe (like 5m or 15m) and end up getting trapped. Professional traders always utilize a Top-Down Approach through multi-timeframe analysis.
Understand this strategy and elevate your trading game today:
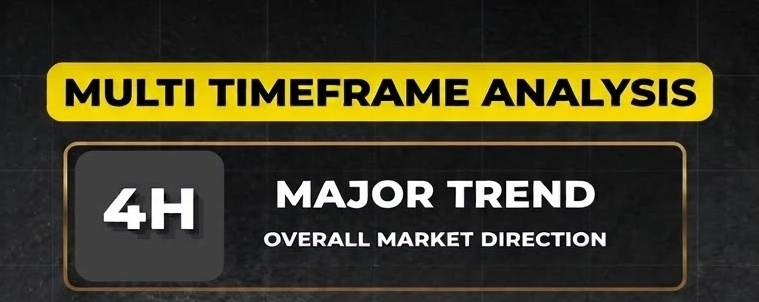
1️⃣ 4H (Major Trend): To determine the overall market direction and macro trend.
2️⃣ 1H (Key Levels): To identify major support, resistance, and liquidity zones.
3️⃣ 15m (Structure Shift): To spot market structure shifts or trend reversals.
4️⃣ 5m (Setup Formation): To locate Order Blocks and Fair Value Gaps (FVG).
5️⃣ 3m (Precise Entry): To secure precise entries with a tight stop loss (SL) and high risk-to-reward ratio (R:R).
💡 Golden Rule: Always trade in the direction of the Higher Timeframe (HTF) and execute your entries with confirmation on the Lower Timeframe (LTF)!
Which timeframe do you check first before taking a trade? Let me know in the comments below! 👇
#tradingtips #MultiTimeFrame #cryptotrading #smartmoney #BinanceSquare
Multi-Timeframe Analysis: Master the Market Structure 📊📉
Most traders make the mistake of relying on a single timeframe (like 5m or 15m) and end up getting trapped. Professional traders always utilize a Top-Down Approach through multi-timeframe analysis.
Understand this strategy and elevate your trading game today:
1️⃣ 4H (Major Trend): To determine the overall market direction and macro trend.
2️⃣ 1H (Key Levels): To identify major support, resistance, and liquidity zones.
3️⃣ 15m (Structure Shift): To spot market structure shifts or trend reversals.
4️⃣ 5m (Setup Formation): To locate Order Blocks and Fair Value Gaps (FVG).
5️⃣ 3m (Precise Entry): To secure precise entries with a tight stop loss (SL) and high risk-to-reward ratio (R:R).
💡 Golden Rule: Always trade in the direction of the Higher Timeframe (HTF) and execute your entries with confirmation on the Lower Timeframe (LTF)!
Which timeframe do you check first before taking a trade? Let me know in the comments below! 👇
#tradingtips #MultiTimeFrame #cryptotrading #smartmoney #BinanceSquare
Understand this strategy and elevate your trading game today:
1️⃣ 4H (Major Trend): To determine the overall market direction and macro trend.
2️⃣ 1H (Key Levels): To identify major support, resistance, and liquidity zones.
3️⃣ 15m (Structure Shift): To spot market structure shifts or trend reversals.
4️⃣ 5m (Setup Formation): To locate Order Blocks and Fair Value Gaps (FVG).
5️⃣ 3m (Precise Entry): To secure precise entries with a tight stop loss (SL) and high risk-to-reward ratio (R:R).
💡 Golden Rule: Always trade in the direction of the Higher Timeframe (HTF) and execute your entries with confirmation on the Lower Timeframe (LTF)!
Which timeframe do you check first before taking a trade? Let me know in the comments below! 👇
#tradingtips #MultiTimeFrame #cryptotrading #smartmoney #BinanceSquare
27

$SHELL | Why Timeframes Can Tell Different Stories
A technical summary dated October 27 showed a more positive bias on the 4-hour chart, while the weekly outlook remained neutral to weak. Some calculations also placed the 50-day average below the 200-day average.
Short-term strength does not automatically confirm a long-term trend change.
#MultiTimeframe #TrendAnalysis #PriceAction
$SHELL | Why Timeframes Can Tell Different Stories
A technical summary dated October 27 showed a more positive bias on the 4-hour chart, while the weekly outlook remained neutral to weak. Some calculations also placed the 50-day average below the 200-day average.
Short-term strength does not automatically confirm a long-term trend change.
#MultiTimeframe #TrendAnalysis #PriceAction
A technical summary dated October 27 showed a more positive bias on the 4-hour chart, while the weekly outlook remained neutral to weak. Some calculations also placed the 50-day average below the 200-day average.
Short-term strength does not automatically confirm a long-term trend change.
#MultiTimeframe #TrendAnalysis #PriceAction

30
·
--
Article
Multi-Timeframe Analysis: Explained Simply📘 What is Multi-Timeframe Analysis?
Multi-timeframe analysis means reading the same coin on three charts before you trade: a big one, a middle one and a small one. Each chart answers a different question.
Most beginners stare at one chart only. Then a "breakout" on the 15-minute chart runs straight into a wall that was obvious on the daily chart. Looking higher first saves you from that.
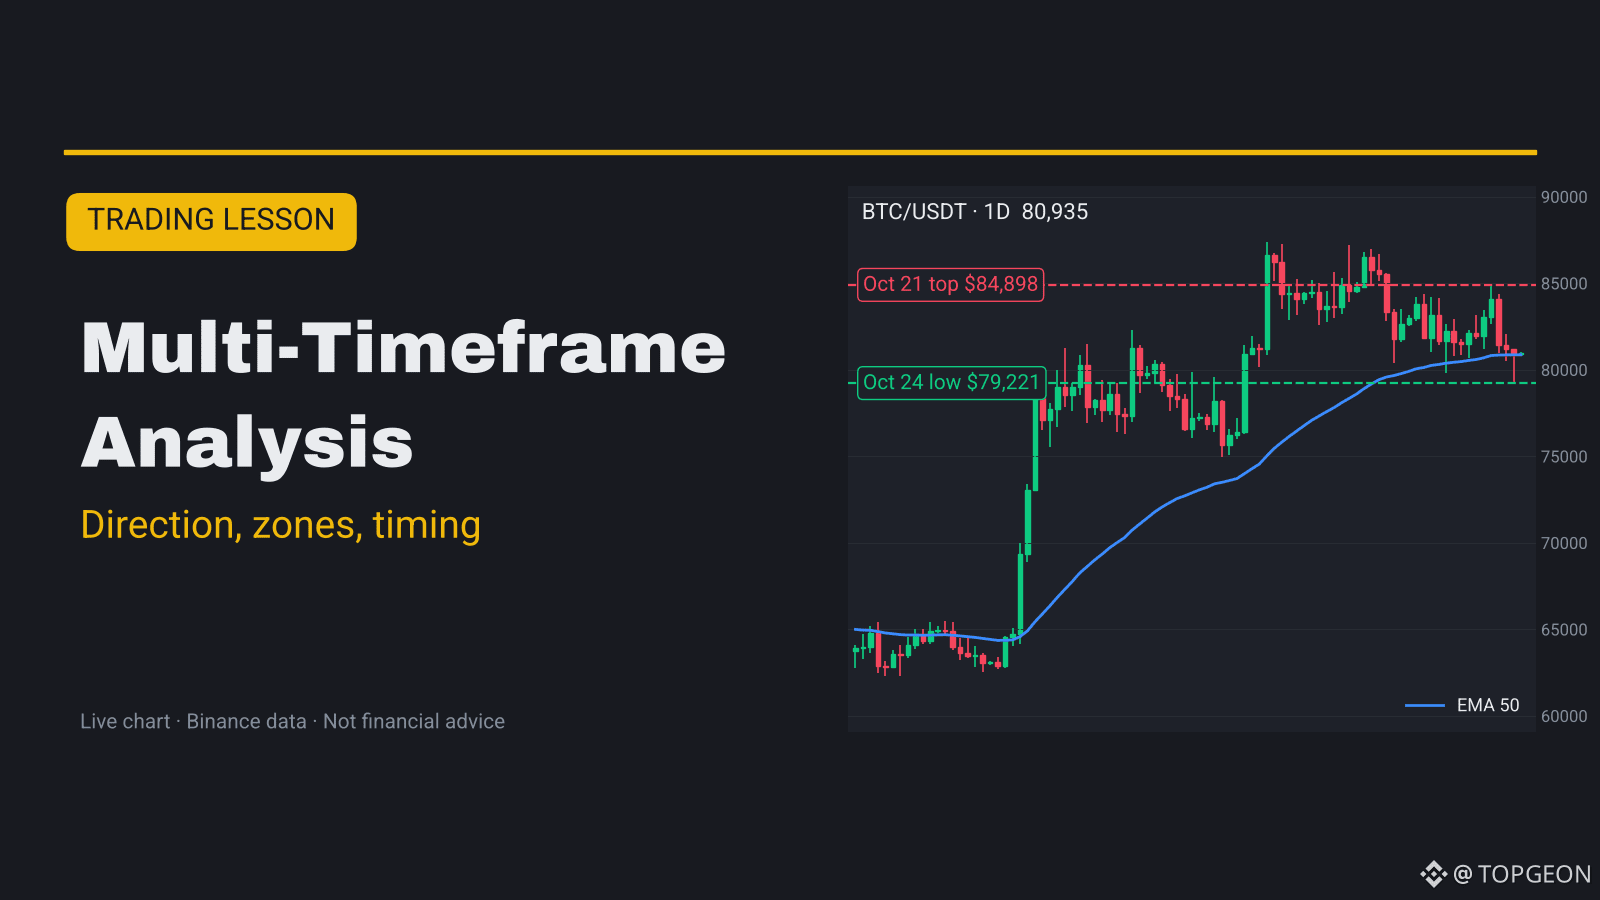
📊 Live chart in the cover and in the image post below.
🔍 How to spot it
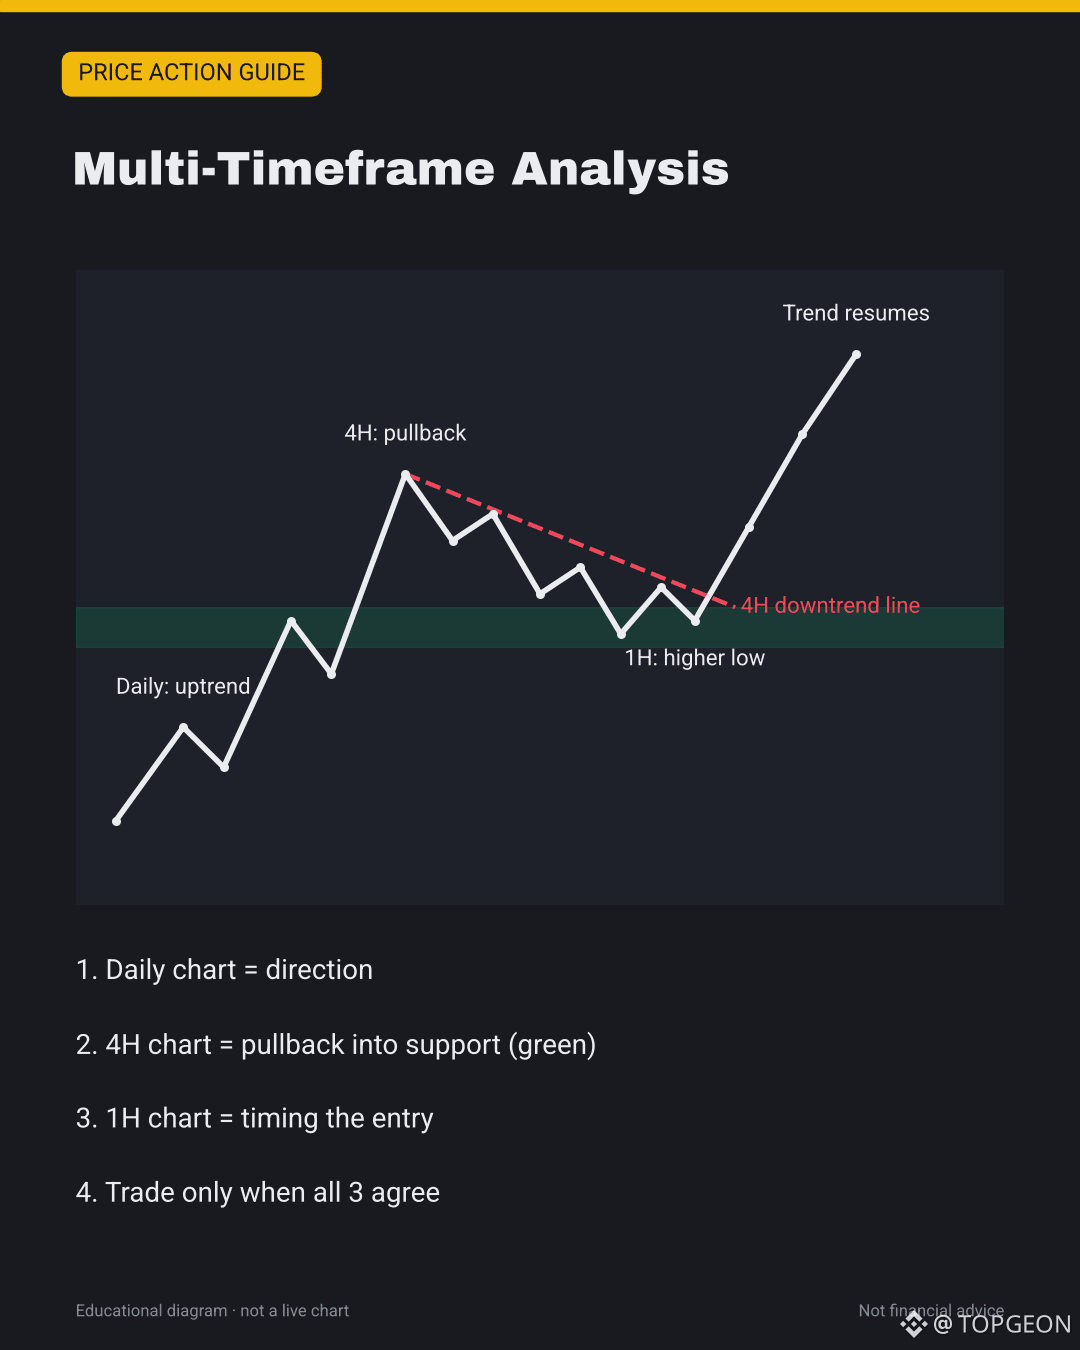
• Pick a set where each chart is about 4-6x the next one. Swing traders: Daily, 4H, 1H. Day traders: 4H, 1H, 15m
• Higher timeframe (Daily): what is the main trend? Higher highs and higher lows, or lower highs and lower lows?
• Middle timeframe (4H): where are the key zones? Mark the nearest floor and ceiling
• Lower timeframe (1H): is price turning at that zone right now?
• If all three point the same way, the setup is strong. If they disagree, it is a warning
📈 How traders use it
• Entry: trade in the direction of the higher timeframe, at a middle-timeframe zone, when the lower timeframe turns (for example, a 1H higher low at 4H support in a daily uptrend)
• Stop-loss: beyond the zone you used on the middle chart, not just beyond the last small candle
• Target: the next ceiling or floor on the middle or higher chart
• Higher timeframe always wins a conflict. A 1H buy signal inside a daily downtrend is a counter-trend trade: size down or skip it
🧪 Live example: $BTC right now
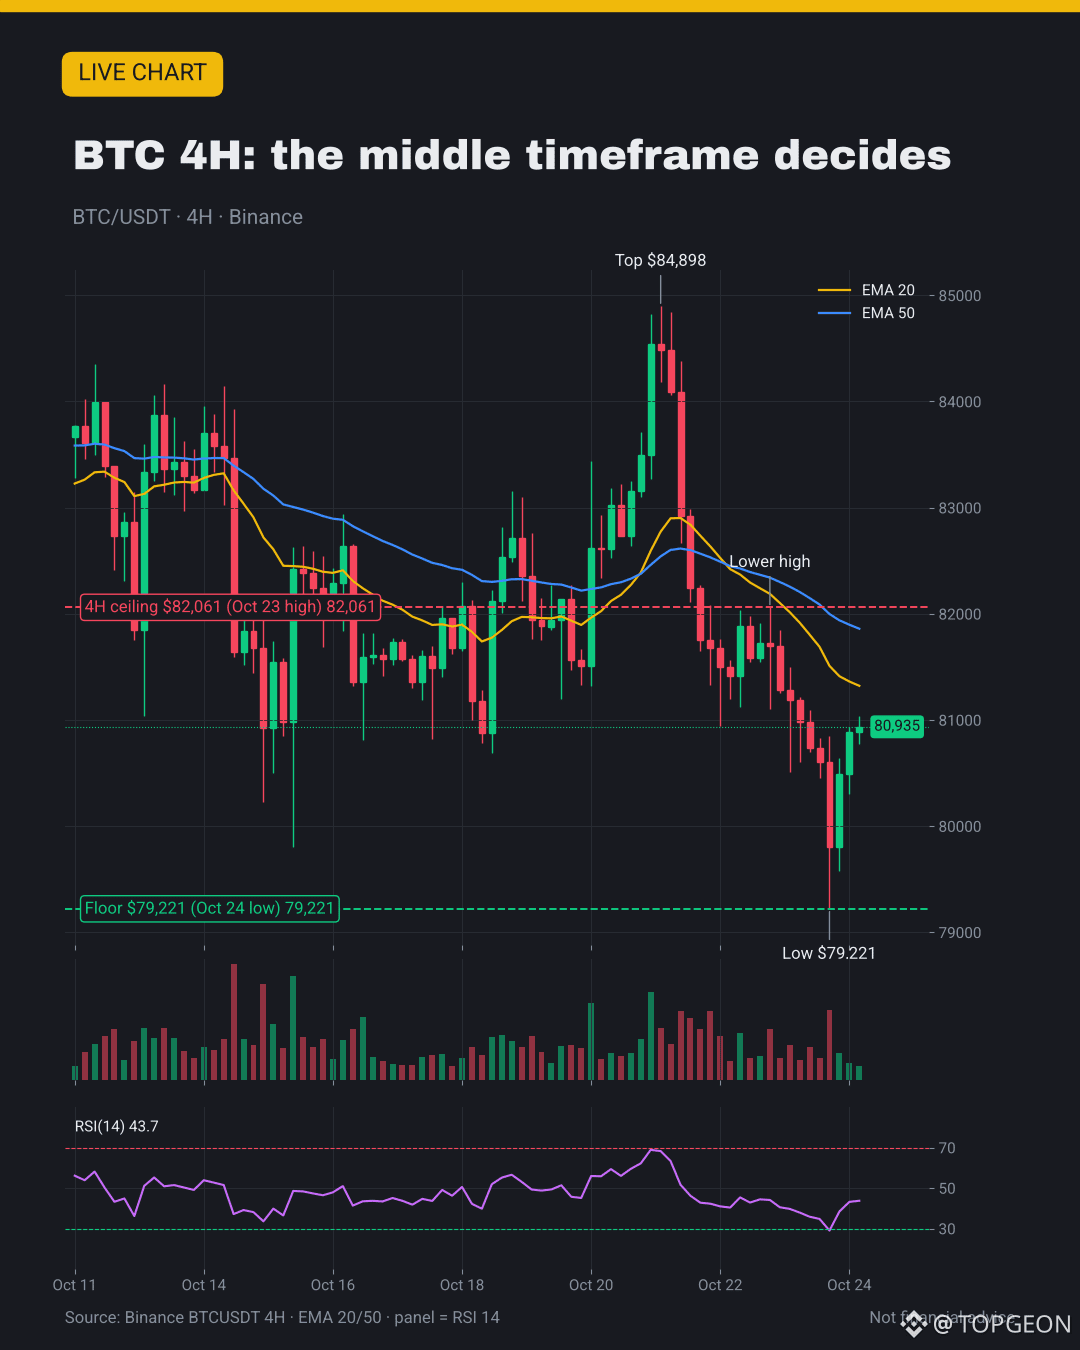
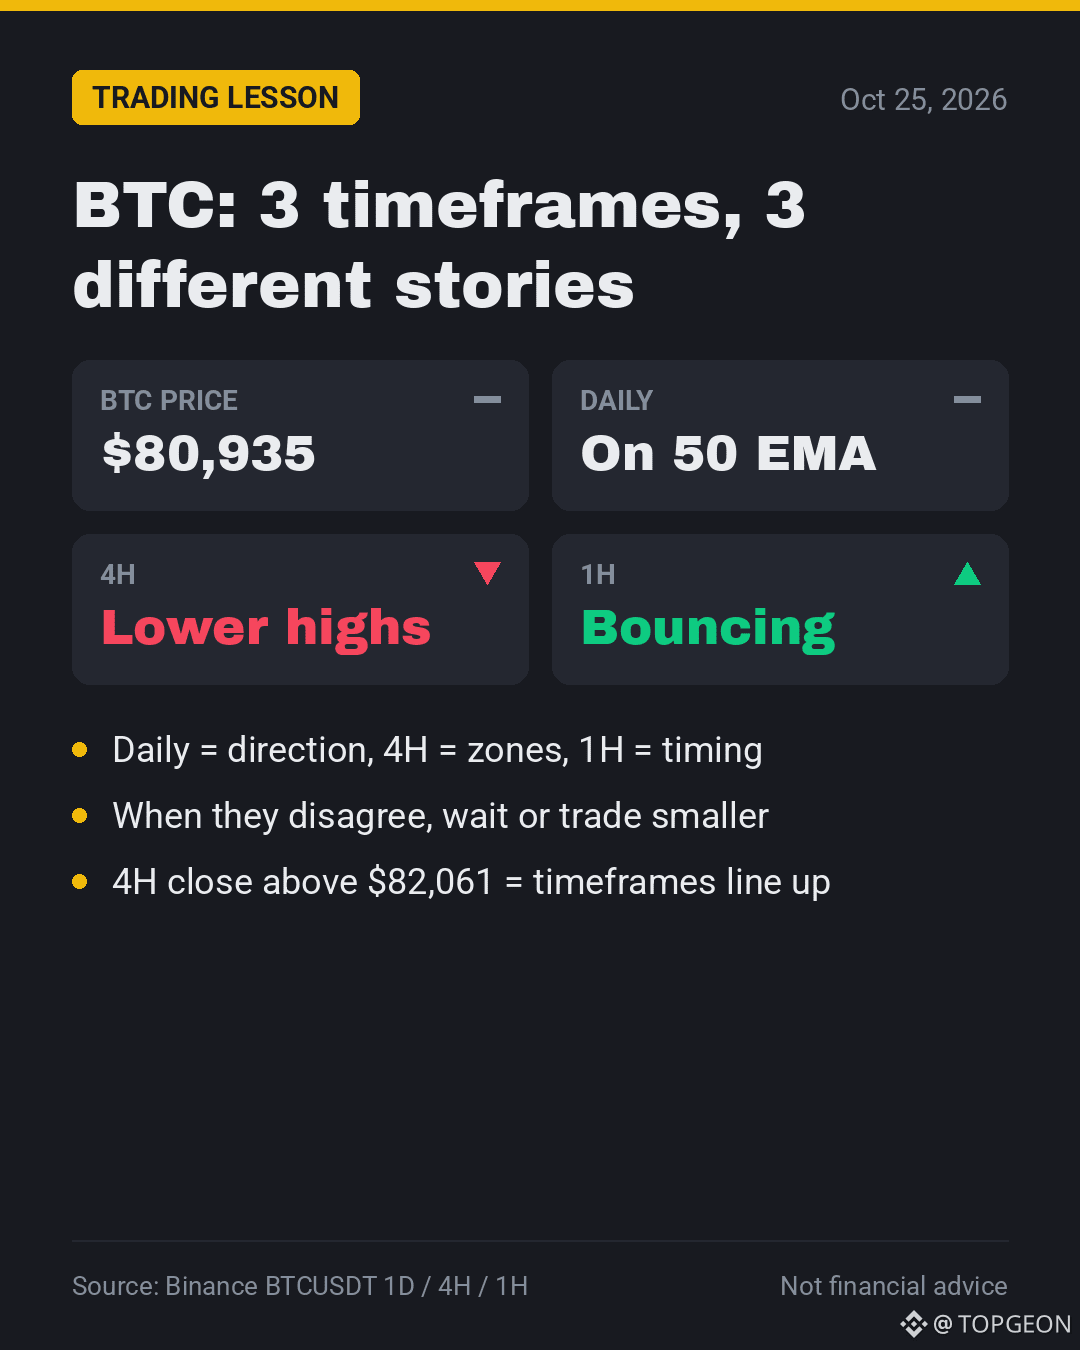
• Daily: the big picture is still up. BTC sits far above the 200 EMA (~$76.5K) after the summer run from the low $60Ks. But daily tops are getting lower: $87,396 (Sep 21), $87,000 (Oct 5), $84,898 (Oct 21). Price is now testing the daily 50 EMA (~$80.9K), RSI 44.5. So: uptrend, but losing steam
• 4H: clearly down. Lower highs since the $84,898 top: $82,061 (Oct 23), then $81,097 (Oct 24). Price is under the 4H 20 and 50 EMA (~$81.3K / ~$81.9K), RSI 44
• 1H: bouncing. After the $79,221 low (Oct 24, 15:00 UTC) it made higher lows at $79,580 and $80,305 and is now near $80.9K, above the 1H 20 EMA, RSI 54
• Verdict: the timeframes do NOT agree. The 1H bounce is going up into a 4H downtrend. A multi-timeframe trader waits
• What would line them up: a 4H close above $82,061 (breaks the lower-high chain) while the daily holds its 50 EMA. A drop back under $79,221 would turn the daily bearish too
⚠️ Common mistakes
• Using timeframes that are too close (5m and 15m tell the same story)
• Using too many charts and freezing. Three is enough
• Letting the small chart override the big one because a candle looks exciting
• Switching timeframes after entering to find a reason to stay in a losing trade
✅ Quick checklist
• Daily first: write down the trend in one word
• 4H next: mark one floor and one ceiling
• 1H last: wait for a turn at that zone
• Trade only when all three agree, or cut your size
• Stop beyond the 4H zone, risk 1-2% per trade
💬 Which timeframe do you check first before a trade? 👇
Not financial advice. DYOR.
#TradingTips #MultiTimeframe #Bitcoin
Multi-Timeframe Analysis: Explained Simply
📘 What is Multi-Timeframe Analysis?
Multi-timeframe analysis means reading the same coin on three charts before you trade: a big one, a middle one and a small one. Each chart answers a different question.
Most beginners stare at one chart only. Then a "breakout" on the 15-minute chart runs straight into a wall that was obvious on the daily chart. Looking higher first saves you from that.
📊 Live chart in the cover and in the image post below.
🔍 How to spot it
• Pick a set where each chart is about 4-6x the next one. Swing traders: Daily, 4H, 1H. Day traders: 4H, 1H, 15m
• Higher timeframe (Daily): what is the main trend? Higher highs and higher lows, or lower highs and lower lows?
• Middle timeframe (4H): where are the key zones? Mark the nearest floor and ceiling
• Lower timeframe (1H): is price turning at that zone right now?
• If all three point the same way, the setup is strong. If they disagree, it is a warning
📈 How traders use it
• Entry: trade in the direction of the higher timeframe, at a middle-timeframe zone, when the lower timeframe turns (for example, a 1H higher low at 4H support in a daily uptrend)
• Stop-loss: beyond the zone you used on the middle chart, not just beyond the last small candle
• Target: the next ceiling or floor on the middle or higher chart
• Higher timeframe always wins a conflict. A 1H buy signal inside a daily downtrend is a counter-trend trade: size down or skip it
🧪 Live example: $BTC right now
• Daily: the big picture is still up. BTC sits far above the 200 EMA (~$76.5K) after the summer run from the low $60Ks. But daily tops are getting lower: $87,396 (Sep 21), $87,000 (Oct 5), $84,898 (Oct 21). Price is now testing the daily 50 EMA (~$80.9K), RSI 44.5. So: uptrend, but losing steam
• 4H: clearly down. Lower highs since the $84,898 top: $82,061 (Oct 23), then $81,097 (Oct 24). Price is under the 4H 20 and 50 EMA (~$81.3K / ~$81.9K), RSI 44
• 1H: bouncing. After the $79,221 low (Oct 24, 15:00 UTC) it made higher lows at $79,580 and $80,305 and is now near $80.9K, above the 1H 20 EMA, RSI 54
• Verdict: the timeframes do NOT agree. The 1H bounce is going up into a 4H downtrend. A multi-timeframe trader waits
• What would line them up: a 4H close above $82,061 (breaks the lower-high chain) while the daily holds its 50 EMA. A drop back under $79,221 would turn the daily bearish too
⚠️ Common mistakes
• Using timeframes that are too close (5m and 15m tell the same story)
• Using too many charts and freezing. Three is enough
• Letting the small chart override the big one because a candle looks exciting
• Switching timeframes after entering to find a reason to stay in a losing trade
✅ Quick checklist
• Daily first: write down the trend in one word
• 4H next: mark one floor and one ceiling
• 1H last: wait for a turn at that zone
• Trade only when all three agree, or cut your size
• Stop beyond the 4H zone, risk 1-2% per trade
💬 Which timeframe do you check first before a trade? 👇
Not financial advice. DYOR.
#TradingTips #MultiTimeframe #Bitcoin
Multi-timeframe analysis means reading the same coin on three charts before you trade: a big one, a middle one and a small one. Each chart answers a different question.
Most beginners stare at one chart only. Then a "breakout" on the 15-minute chart runs straight into a wall that was obvious on the daily chart. Looking higher first saves you from that.
📊 Live chart in the cover and in the image post below.
🔍 How to spot it
• Pick a set where each chart is about 4-6x the next one. Swing traders: Daily, 4H, 1H. Day traders: 4H, 1H, 15m
• Higher timeframe (Daily): what is the main trend? Higher highs and higher lows, or lower highs and lower lows?
• Middle timeframe (4H): where are the key zones? Mark the nearest floor and ceiling
• Lower timeframe (1H): is price turning at that zone right now?
• If all three point the same way, the setup is strong. If they disagree, it is a warning
📈 How traders use it
• Entry: trade in the direction of the higher timeframe, at a middle-timeframe zone, when the lower timeframe turns (for example, a 1H higher low at 4H support in a daily uptrend)
• Stop-loss: beyond the zone you used on the middle chart, not just beyond the last small candle
• Target: the next ceiling or floor on the middle or higher chart
• Higher timeframe always wins a conflict. A 1H buy signal inside a daily downtrend is a counter-trend trade: size down or skip it
🧪 Live example: $BTC right now
• Daily: the big picture is still up. BTC sits far above the 200 EMA (~$76.5K) after the summer run from the low $60Ks. But daily tops are getting lower: $87,396 (Sep 21), $87,000 (Oct 5), $84,898 (Oct 21). Price is now testing the daily 50 EMA (~$80.9K), RSI 44.5. So: uptrend, but losing steam
• 4H: clearly down. Lower highs since the $84,898 top: $82,061 (Oct 23), then $81,097 (Oct 24). Price is under the 4H 20 and 50 EMA (~$81.3K / ~$81.9K), RSI 44
• 1H: bouncing. After the $79,221 low (Oct 24, 15:00 UTC) it made higher lows at $79,580 and $80,305 and is now near $80.9K, above the 1H 20 EMA, RSI 54
• Verdict: the timeframes do NOT agree. The 1H bounce is going up into a 4H downtrend. A multi-timeframe trader waits
• What would line them up: a 4H close above $82,061 (breaks the lower-high chain) while the daily holds its 50 EMA. A drop back under $79,221 would turn the daily bearish too
⚠️ Common mistakes
• Using timeframes that are too close (5m and 15m tell the same story)
• Using too many charts and freezing. Three is enough
• Letting the small chart override the big one because a candle looks exciting
• Switching timeframes after entering to find a reason to stay in a losing trade
✅ Quick checklist
• Daily first: write down the trend in one word
• 4H next: mark one floor and one ceiling
• 1H last: wait for a turn at that zone
• Trade only when all three agree, or cut your size
• Stop beyond the 4H zone, risk 1-2% per trade
💬 Which timeframe do you check first before a trade? 👇
Not financial advice. DYOR.
#TradingTips #MultiTimeframe #Bitcoin
90
·
--
🤔 Is this $BTC bounce real, or is just the small chart talking?
📈 Hourly chart: bouncing nicely off $79.2K.
📉 4-hour chart: still lower tops since $84.9K.
🧭 Daily chart: big uptrend, but running out of steam.
🎯 My take: wait for a 4-hour close above $82K so all three agree.
💬 Which chart do you check first? 👇
📖 Full lesson: https://app.binance.com/uni-qr/cart/380963969114151
#MultiTimeframe #Bitcoin
🤔 Is this $BTC bounce real, or is just the small chart talking?
📈 Hourly chart: bouncing nicely off $79.2K.
📉 4-hour chart: still lower tops since $84.9K.
🧭 Daily chart: big uptrend, but running out of steam.
🎯 My take: wait for a 4-hour close above $82K so all three agree.
💬 Which chart do you check first? 👇
📖 Full lesson: https://app.binance.com/uni-qr/cart/380963969114151
#MultiTimeframe #Bitcoin
📈 Hourly chart: bouncing nicely off $79.2K.
📉 4-hour chart: still lower tops since $84.9K.
🧭 Daily chart: big uptrend, but running out of steam.
🎯 My take: wait for a 4-hour close above $82K so all three agree.
💬 Which chart do you check first? 👇
📖 Full lesson: https://app.binance.com/uni-qr/cart/380963969114151
#MultiTimeframe #Bitcoin
86
SHELLUSDT.P | October 13, 2026: Rebound or Trend Reversal?
The supplied analysis describes a mixed timeframe picture: the daily chart is bullish, while the weekly and 4H charts remain bearish. These conditions can coexist because each timeframe reflects a different window of market activity.
A rebound on the 4H chart would not automatically mean that the short-term trend has reversed. In the supplied snapshot, SHELL is at $0.02261, below EMA20 and EMA200, while RSI stands at 41.4. These readings do not yet provide clear confirmation of stronger short-term momentum.
The first resistance zone is $0.02307–$0.02314, with 0.02468 as the more significant swing-high reference. If price approaches these levels, its reaction can help assess the strength of the rebound. A few rising candles alone would not be enough to establish a durable reversal.
A rebound describes a move upward; a reversal requires evidence that the prior market structure is changing. Keeping those concepts separate helps make the analysis more disciplined.
#SHELL #TrendAnalysis #MultiTimeframe PriceAction SHELLUSDT CryptoMarkets BinanceSquare
SHELLUSDT.P | October 13, 2026: Rebound or Trend Reversal?
The supplied analysis describes a mixed timeframe picture: the daily chart is bullish, while the weekly and 4H charts remain bearish. These conditions can coexist because each timeframe reflects a different window of market activity.
A rebound on the 4H chart would not automatically mean that the short-term trend has reversed. In the supplied snapshot, SHELL is at $0.02261, below EMA20 and EMA200, while RSI stands at 41.4. These readings do not yet provide clear confirmation of stronger short-term momentum.
The first resistance zone is $0.02307–$0.02314, with 0.02468 as the more significant swing-high reference. If price approaches these levels, its reaction can help assess the strength of the rebound. A few rising candles alone would not be enough to establish a durable reversal.
A rebound describes a move upward; a reversal requires evidence that the prior market structure is changing. Keeping those concepts separate helps make the analysis more disciplined.
#SHELL #TrendAnalysis #MultiTimeframe PriceAction SHELLUSDT CryptoMarkets BinanceSquare
The supplied analysis describes a mixed timeframe picture: the daily chart is bullish, while the weekly and 4H charts remain bearish. These conditions can coexist because each timeframe reflects a different window of market activity.
A rebound on the 4H chart would not automatically mean that the short-term trend has reversed. In the supplied snapshot, SHELL is at $0.02261, below EMA20 and EMA200, while RSI stands at 41.4. These readings do not yet provide clear confirmation of stronger short-term momentum.
The first resistance zone is $0.02307–$0.02314, with 0.02468 as the more significant swing-high reference. If price approaches these levels, its reaction can help assess the strength of the rebound. A few rising candles alone would not be enough to establish a durable reversal.
A rebound describes a move upward; a reversal requires evidence that the prior market structure is changing. Keeping those concepts separate helps make the analysis more disciplined.
#SHELL #TrendAnalysis #MultiTimeframe PriceAction SHELLUSDT CryptoMarkets BinanceSquare
32
SHELLUSDT.P | 13/10/2026: A rebound is different from a trend reversal
The analysis you provided describes SHELL as bullish on the daily timeframe, while the weekly and 4H timeframes remain bearish. This is noteworthy because trends across different timeframes do not necessarily have to be fully aligned.
A rebound on the 4H timeframe can occur while the short-term structure remains weak. At the reference price of 0.02261, the price is currently below the EMA20 and EMA200, and the RSI is 41.4. These data points do not yet confirm a clear bullish reversal.
The 0.02307–0.02314 zone is identified as nearby resistance in the analysis, while 0.02468 is a more significant swing high. If the price moves toward these levels, its actual reaction will help assess the strength of the rebound. A few bullish candles alone should not be enough to conclude that the trend has reversed.
A rebound describes the price rising from a lower area; a reversal requires evidence that the previous trend structure is changing. Distinguishing between these two concepts helps avoid getting ahead of yourself.
#SHELLUSDT #TrendAnalysis #MultiTimeframe PriceAction CryptoMarket PhanTichKyThuat BinanceSquare
SHELLUSDT.P | 13/10/2026: A rebound is different from a trend reversal
The analysis you provided describes SHELL as bullish on the daily timeframe, while the weekly and 4H timeframes remain bearish. This is noteworthy because trends across different timeframes do not necessarily have to be fully aligned.
A rebound on the 4H timeframe can occur while the short-term structure remains weak. At the reference price of 0.02261, the price is currently below the EMA20 and EMA200, and the RSI is 41.4. These data points do not yet confirm a clear bullish reversal.
The 0.02307–0.02314 zone is identified as nearby resistance in the analysis, while 0.02468 is a more significant swing high. If the price moves toward these levels, its actual reaction will help assess the strength of the rebound. A few bullish candles alone should not be enough to conclude that the trend has reversed.
A rebound describes the price rising from a lower area; a reversal requires evidence that the previous trend structure is changing. Distinguishing between these two concepts helps avoid getting ahead of yourself.
#SHELLUSDT #TrendAnalysis #MultiTimeframe PriceAction CryptoMarket PhanTichKyThuat BinanceSquare
The analysis you provided describes SHELL as bullish on the daily timeframe, while the weekly and 4H timeframes remain bearish. This is noteworthy because trends across different timeframes do not necessarily have to be fully aligned.
A rebound on the 4H timeframe can occur while the short-term structure remains weak. At the reference price of 0.02261, the price is currently below the EMA20 and EMA200, and the RSI is 41.4. These data points do not yet confirm a clear bullish reversal.
The 0.02307–0.02314 zone is identified as nearby resistance in the analysis, while 0.02468 is a more significant swing high. If the price moves toward these levels, its actual reaction will help assess the strength of the rebound. A few bullish candles alone should not be enough to conclude that the trend has reversed.
A rebound describes the price rising from a lower area; a reversal requires evidence that the previous trend structure is changing. Distinguishing between these two concepts helps avoid getting ahead of yourself.
#SHELLUSDT #TrendAnalysis #MultiTimeframe PriceAction CryptoMarket PhanTichKyThuat BinanceSquare
26

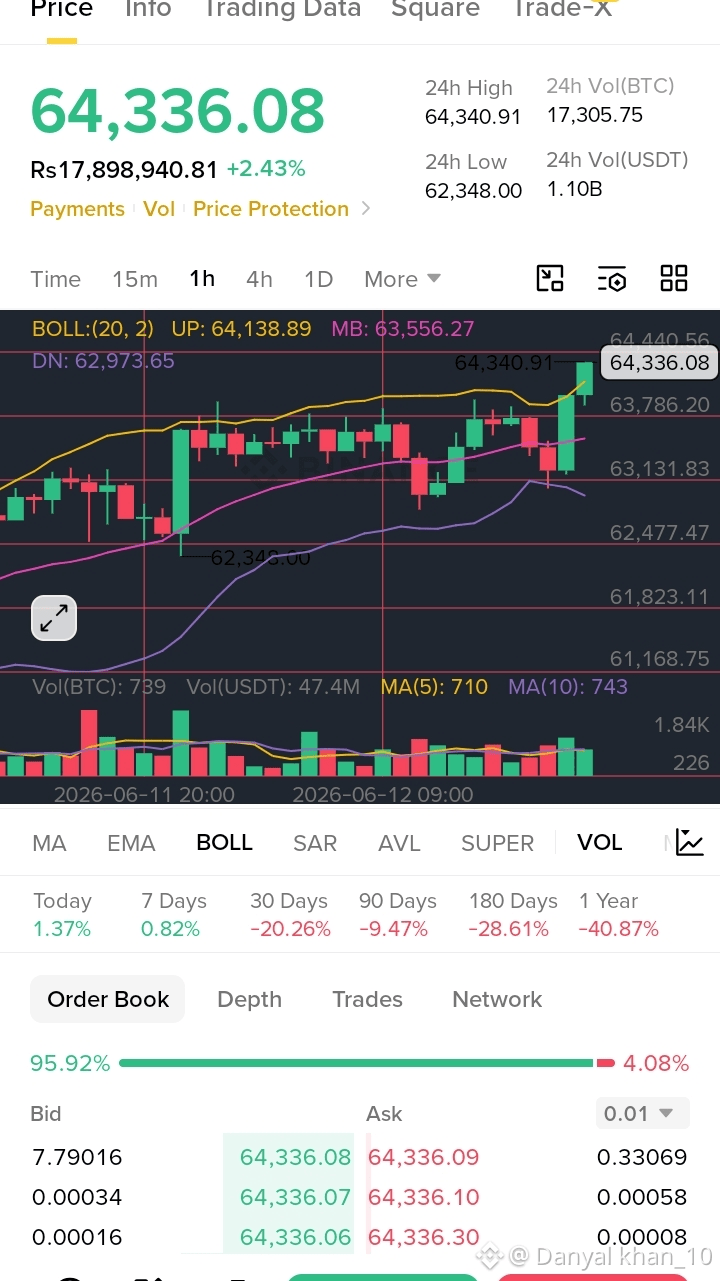
$BTC /USDT – 15m / 1h / 1D Multi-Timeframe Analysis 🔥
Current Price: $64,336 | +2.43%
24h High: $64,340 | 24h Low: $62,973
🔹 15m Chart
Bollinger Bands: UP 64,138 / MB 63,556 / DN 62,973
Price above upper band – overextended. Small pullback likely.
Support: 64,100 | Resistance: 64,340
🔹 1h Chart
Trend: Bullish. Price holding above MB 63,556.
Volume: 739 BTC (avg). Break above 64,350 = next leg up to 64,800.
🔹 1D Chart (Daily)
Bollinger Bands widening – momentum increasing.
Price near upper band. Major resistance at 65,000.
Support: 63,500 (MB) | Strong support: 62,900 (DN)
📊 Order Book: 95.9% Buy | 4.1% Sell – extremely bullish sentiment.
📅 Performance Today: +1.37% | 30 Days: -20.26% | 1 Year: -40.87%
💡 Trade Idea:
✅ Short-term (15m/1h): Long on dip to 64,100–64,200
🎯 Target: 64,800 / 65,000
🛑 SL: 63,900
⏳ Long-term (Daily): Wait for confirmation above 65,000.
Use 2x leverage max for futures. Spot: hold if you believe in uptrend.
#BTCUSDT #Bitcoin #MultiTimeframe #BinanceSquare
$BTC
{spot}(BTCUSDT)
$BTC /USDT – 15m / 1h / 1D Multi-Timeframe Analysis 🔥
Current Price: $64,336 | +2.43%
24h High: $64,340 | 24h Low: $62,973
🔹 15m Chart
Bollinger Bands: UP 64,138 / MB 63,556 / DN 62,973
Price above upper band – overextended. Small pullback likely.
Support: 64,100 | Resistance: 64,340
🔹 1h Chart
Trend: Bullish. Price holding above MB 63,556.
Volume: 739 BTC (avg). Break above 64,350 = next leg up to 64,800.
🔹 1D Chart (Daily)
Bollinger Bands widening – momentum increasing.
Price near upper band. Major resistance at 65,000.
Support: 63,500 (MB) | Strong support: 62,900 (DN)
📊 Order Book: 95.9% Buy | 4.1% Sell – extremely bullish sentiment.
📅 Performance Today: +1.37% | 30 Days: -20.26% | 1 Year: -40.87%
💡 Trade Idea:
✅ Short-term (15m/1h): Long on dip to 64,100–64,200
🎯 Target: 64,800 / 65,000
🛑 SL: 63,900
⏳ Long-term (Daily): Wait for confirmation above 65,000.
Use 2x leverage max for futures. Spot: hold if you believe in uptrend.
#BTCUSDT #Bitcoin #MultiTimeframe #BinanceSquare
$BTC
Current Price: $64,336 | +2.43%
24h High: $64,340 | 24h Low: $62,973
🔹 15m Chart
Bollinger Bands: UP 64,138 / MB 63,556 / DN 62,973
Price above upper band – overextended. Small pullback likely.
Support: 64,100 | Resistance: 64,340
🔹 1h Chart
Trend: Bullish. Price holding above MB 63,556.
Volume: 739 BTC (avg). Break above 64,350 = next leg up to 64,800.
🔹 1D Chart (Daily)
Bollinger Bands widening – momentum increasing.
Price near upper band. Major resistance at 65,000.
Support: 63,500 (MB) | Strong support: 62,900 (DN)
📊 Order Book: 95.9% Buy | 4.1% Sell – extremely bullish sentiment.
📅 Performance Today: +1.37% | 30 Days: -20.26% | 1 Year: -40.87%
💡 Trade Idea:
✅ Short-term (15m/1h): Long on dip to 64,100–64,200
🎯 Target: 64,800 / 65,000
🛑 SL: 63,900
⏳ Long-term (Daily): Wait for confirmation above 65,000.
Use 2x leverage max for futures. Spot: hold if you believe in uptrend.
#BTCUSDT #Bitcoin #MultiTimeframe #BinanceSquare
$BTC
1
121
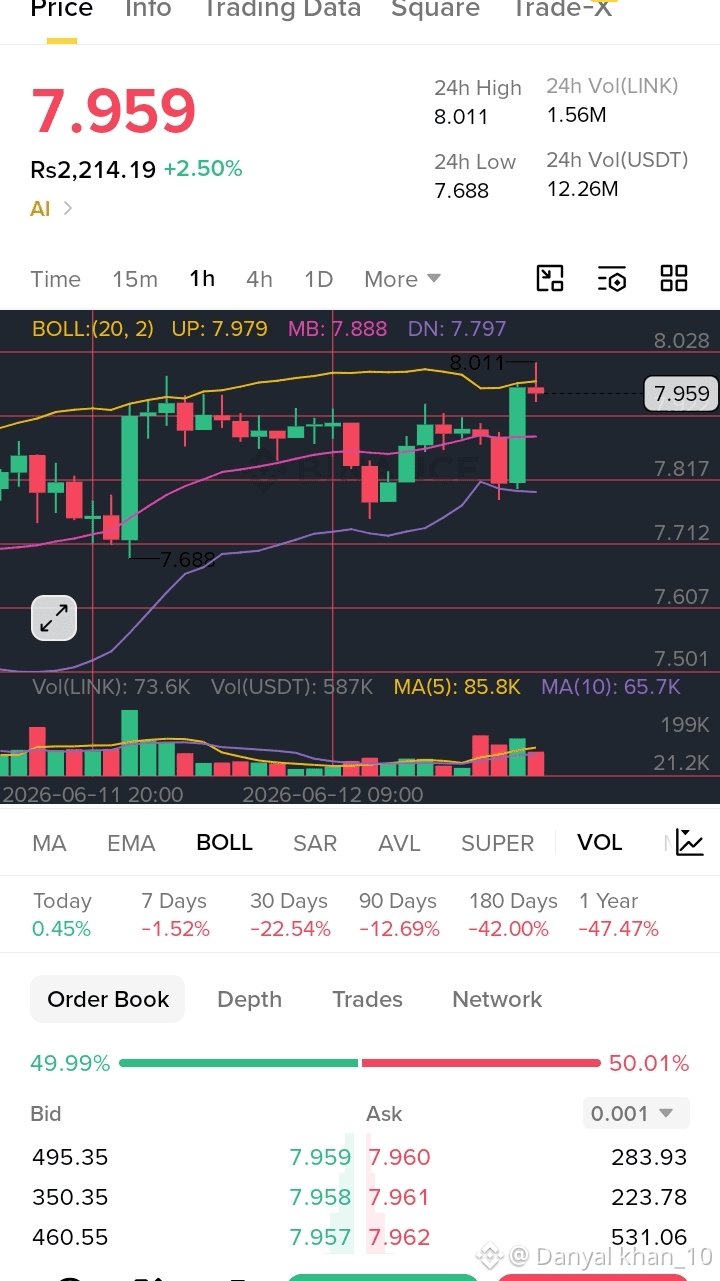
$LINK /USDT – 15m / 1h / 1D Multi-Timeframe Analysis 🔗
Current Price: $7.959 | +2.50%
24h High: $8.011 | 24h Low: $7.688
🔹 15m Chart
Bollinger Bands: UP 7.979 / MB 7.888 / DN 7.797
Price near upper band – slight resistance at $8.00.
Volume: 73.6K LINK (below MA5) – momentum slowing.
🔹 1h Chart
Trend: Mild bullish. Price above MB 7.888.
Support: 7.88 | Resistance: 8.01 (24h high)
Break above 8.01 = target 8.15.
🔹 1D Chart (Daily)
Bollinger Bands: Price trading above MB after downtrend.
30-Day: -22.54% | 90-Day: -12.69% (still recovering).
Major resistance: 8.30 | Strong support: 7.50
📊 Order Book: 49.99% Buy | 50.01% Sell – perfectly balanced (no clear bias).
💡 Trade Idea:
✅ Short-term: Small long above 7.98, SL 7.87, T1 8.01, T2 8.15
❌ Long-term: Wait for breakout above 8.30 or dip to 7.70.
Use 2% risk only – low volatility right now.
#LINKUSDT #Chainlink #MultiTimeframe #BinanceSquare
$LINK
{spot}(LINKUSDT)
$LINK /USDT – 15m / 1h / 1D Multi-Timeframe Analysis 🔗
Current Price: $7.959 | +2.50%
24h High: $8.011 | 24h Low: $7.688
🔹 15m Chart
Bollinger Bands: UP 7.979 / MB 7.888 / DN 7.797
Price near upper band – slight resistance at $8.00.
Volume: 73.6K LINK (below MA5) – momentum slowing.
🔹 1h Chart
Trend: Mild bullish. Price above MB 7.888.
Support: 7.88 | Resistance: 8.01 (24h high)
Break above 8.01 = target 8.15.
🔹 1D Chart (Daily)
Bollinger Bands: Price trading above MB after downtrend.
30-Day: -22.54% | 90-Day: -12.69% (still recovering).
Major resistance: 8.30 | Strong support: 7.50
📊 Order Book: 49.99% Buy | 50.01% Sell – perfectly balanced (no clear bias).
💡 Trade Idea:
✅ Short-term: Small long above 7.98, SL 7.87, T1 8.01, T2 8.15
❌ Long-term: Wait for breakout above 8.30 or dip to 7.70.
Use 2% risk only – low volatility right now.
#LINKUSDT #Chainlink #MultiTimeframe #BinanceSquare
$LINK
Current Price: $7.959 | +2.50%
24h High: $8.011 | 24h Low: $7.688
🔹 15m Chart
Bollinger Bands: UP 7.979 / MB 7.888 / DN 7.797
Price near upper band – slight resistance at $8.00.
Volume: 73.6K LINK (below MA5) – momentum slowing.
🔹 1h Chart
Trend: Mild bullish. Price above MB 7.888.
Support: 7.88 | Resistance: 8.01 (24h high)
Break above 8.01 = target 8.15.
🔹 1D Chart (Daily)
Bollinger Bands: Price trading above MB after downtrend.
30-Day: -22.54% | 90-Day: -12.69% (still recovering).
Major resistance: 8.30 | Strong support: 7.50
📊 Order Book: 49.99% Buy | 50.01% Sell – perfectly balanced (no clear bias).
💡 Trade Idea:
✅ Short-term: Small long above 7.98, SL 7.87, T1 8.01, T2 8.15
❌ Long-term: Wait for breakout above 8.30 or dip to 7.70.
Use 2% risk only – low volatility right now.
#LINKUSDT #Chainlink #MultiTimeframe #BinanceSquare
$LINK
1
30

·
--
Bearish
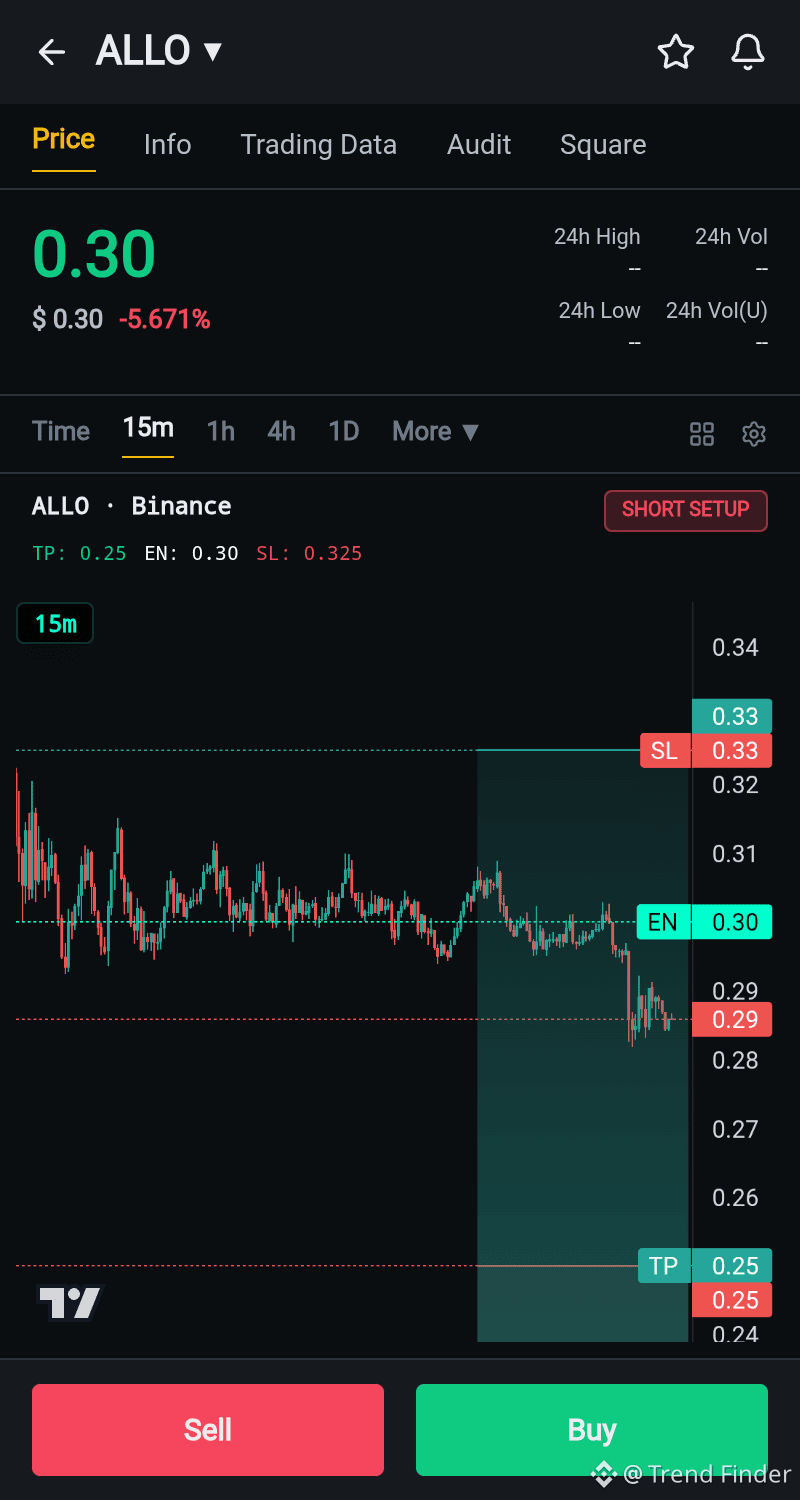
🚨 $ALLO shows strong multi-timeframe bearish signals. While 1D EMAs are bullish, price is correcting hard below 20-EMA. Daily MACD just crossed bearish with high ADX! 📉 4H, 1H, 15M charts confirm bearish momentum. Current price at critical 1D 50-EMA support.
We're eyeing a SHORT setup on a bounce to retest resistance around 0.30.
Entry: 0.30
SL: 0.325
TP1: 0.25 (1:2 RR)
TP2: 0.225 (1:3 RR)
Trade smart & follow the trend! #ALLO #TradingSignals #ShortSetup #MultiTimeframe
{future}(ALLOUSDT)
🚨 $ALLO shows strong multi-timeframe bearish signals. While 1D EMAs are bullish, price is correcting hard below 20-EMA. Daily MACD just crossed bearish with high ADX! 📉 4H, 1H, 15M charts confirm bearish momentum. Current price at critical 1D 50-EMA support.
We're eyeing a SHORT setup on a bounce to retest resistance around 0.30.
Entry: 0.30
SL: 0.325
TP1: 0.25 (1:2 RR)
TP2: 0.225 (1:3 RR)
Trade smart & follow the trend! #ALLO #TradingSignals #ShortSetup #MultiTimeframe
We're eyeing a SHORT setup on a bounce to retest resistance around 0.30.
Entry: 0.30
SL: 0.325
TP1: 0.25 (1:2 RR)
TP2: 0.225 (1:3 RR)
Trade smart & follow the trend! #ALLO #TradingSignals #ShortSetup #MultiTimeframe
1
372
·
--
Bullish
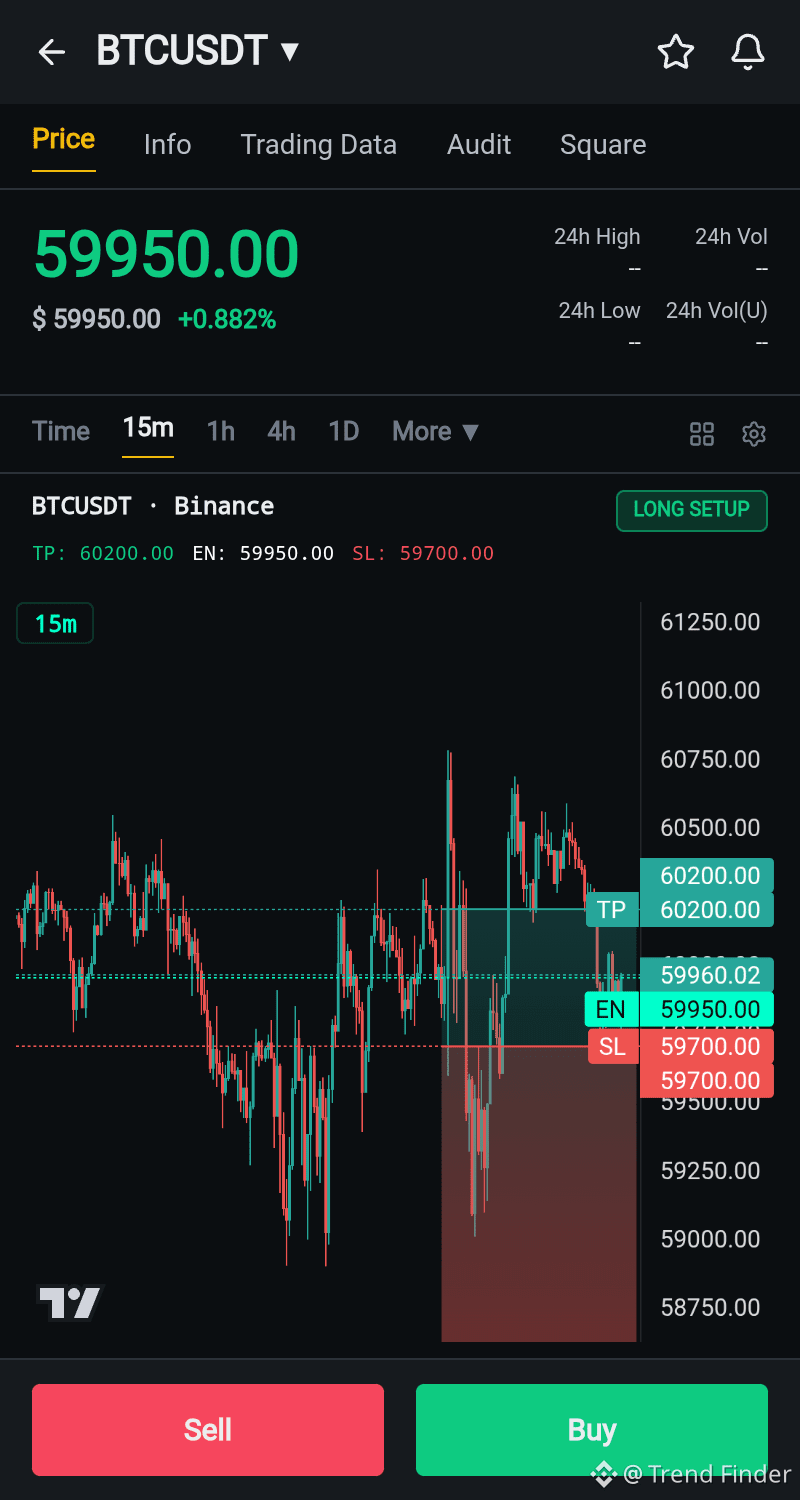
$BTC 🚨 Macro trend is still bearish, but we're seeing STRONG signals for a potential relief rally! 📈 1D RSI is oversold & MACD just flashed bullish crosses on 1D/4H from extreme lows. This indicates a potential bounce. Micro TFs are catching up. Time for a calculated LONG!
Setup: LONG BTCUSDT around current levels, targeting key EMA resistances. Don't miss the bounce! #BTC #CryptoTrading #LongSetup #MultiTimeframe
{spot}(BTCUSDT)
$BTC 🚨 Macro trend is still bearish, but we're seeing STRONG signals for a potential relief rally! 📈 1D RSI is oversold & MACD just flashed bullish crosses on 1D/4H from extreme lows. This indicates a potential bounce. Micro TFs are catching up. Time for a calculated LONG!
Setup: LONG BTCUSDT around current levels, targeting key EMA resistances. Don't miss the bounce! #BTC #CryptoTrading #LongSetup #MultiTimeframe
Setup: LONG BTCUSDT around current levels, targeting key EMA resistances. Don't miss the bounce! #BTC #CryptoTrading #LongSetup #MultiTimeframe
1
153
·
--
Bullish
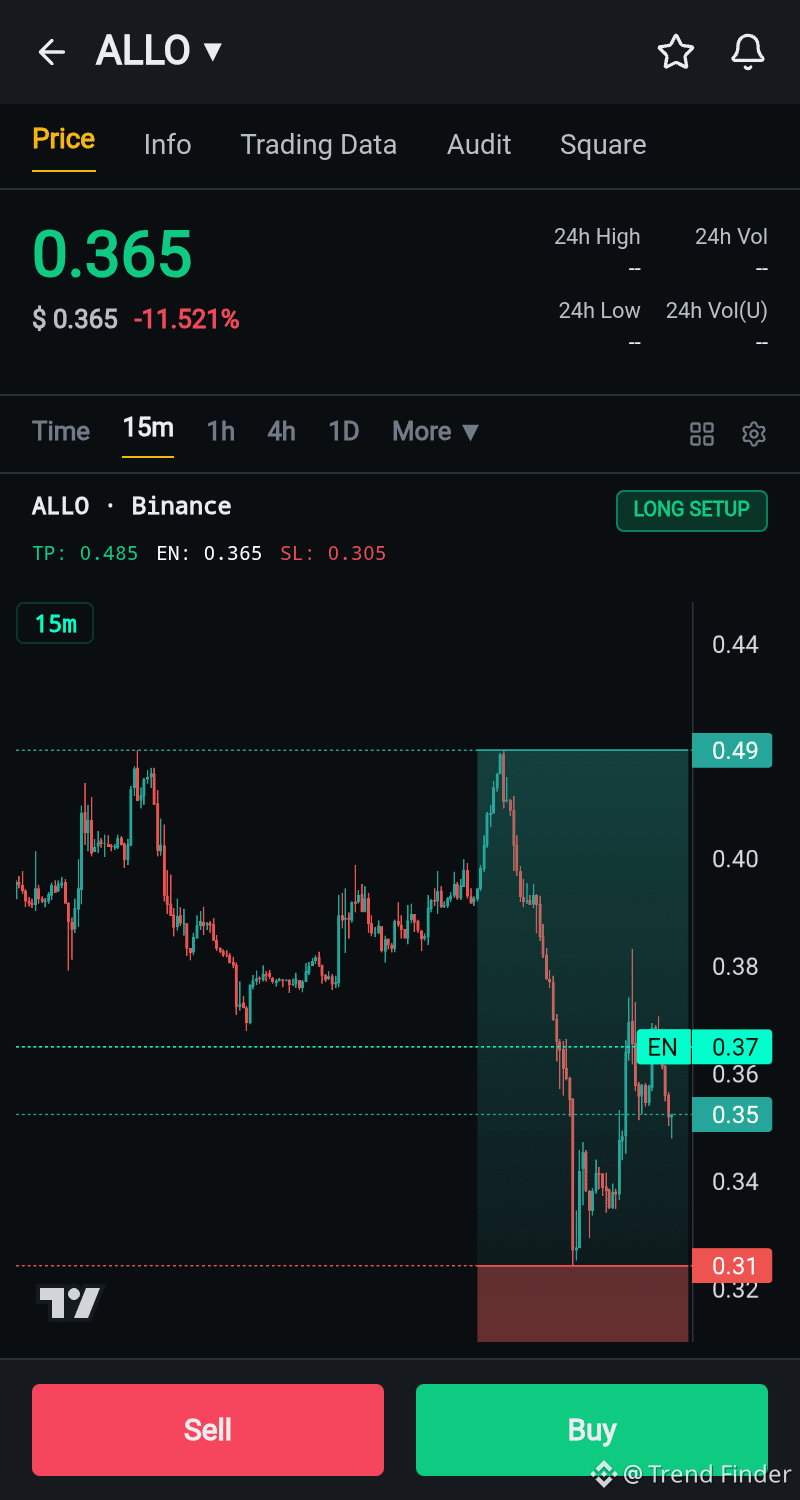
Alert! 🚨 $ALLO shows a strong daily uptrend (ADX 52.04!) but is currently in a deep pullback on shorter timeframes. We're watching for a bounce confirmation! 👀 Waiting for price to reclaim key EMAs to go #LONG.
Entry @ $0.365,
SL @ $0.305,
TP1 @ $0.485 (1:2 RR) &
TP2 @ $0.545 (1:3 RR).
Don't miss the potential reversal!
#TradingSetup #CryptoTrading #MultiTimeframe
{future}(ALLOUSDT)
Alert! 🚨 $ALLO shows a strong daily uptrend (ADX 52.04!) but is currently in a deep pullback on shorter timeframes. We're watching for a bounce confirmation! 👀 Waiting for price to reclaim key EMAs to go #LONG.
Entry @ $0.365,
SL @ $0.305,
TP1 @ $0.485 (1:2 RR) &
TP2 @ $0.545 (1:3 RR).
Don't miss the potential reversal!
#TradingSetup #CryptoTrading #MultiTimeframe
Entry @ $0.365,
SL @ $0.305,
TP1 @ $0.485 (1:2 RR) &
TP2 @ $0.545 (1:3 RR).
Don't miss the potential reversal!
#TradingSetup #CryptoTrading #MultiTimeframe
1
283
$SHELL — Before the end of the week, the timeframes are giving conflicting signals
$SHELL is trading around 0.0196 and Binance data shows performance changes significantly depending on the timeframe.
📊 Today (UTC+7): -2.00%
📊 Rolling 24H: -1.51%
📊 Rolling 7D: +3.16%
📊 This week: Open 0.0212 → 0.0196 -7.55%
📊 Current August: Open 0.0180 → 0.0196 +8.89%
Short-term is weaker, while the 7-day and monthly charts are still in the green.
With the weekend approaching, the week candle’s close level will be the next crucial data point to assess whether the 0.019x zone is acting as a balance area or just a temporary pause after a big move.
#SHELL #MultiTimeframe #CryptoAnalysis #Binance
$SHELL — Before the end of the week, the timeframes are giving conflicting signals
$SHELL is trading around 0.0196 and Binance data shows performance changes significantly depending on the timeframe.
📊 Today (UTC+7): -2.00%
📊 Rolling 24H: -1.51%
📊 Rolling 7D: +3.16%
📊 This week: Open 0.0212 → 0.0196 -7.55%
📊 Current August: Open 0.0180 → 0.0196 +8.89%
Short-term is weaker, while the 7-day and monthly charts are still in the green.
With the weekend approaching, the week candle’s close level will be the next crucial data point to assess whether the 0.019x zone is acting as a balance area or just a temporary pause after a big move.
#SHELL #MultiTimeframe #CryptoAnalysis #Binance
$SHELL is trading around 0.0196 and Binance data shows performance changes significantly depending on the timeframe.
📊 Today (UTC+7): -2.00%
📊 Rolling 24H: -1.51%
📊 Rolling 7D: +3.16%
📊 This week: Open 0.0212 → 0.0196 -7.55%
📊 Current August: Open 0.0180 → 0.0196 +8.89%
Short-term is weaker, while the 7-day and monthly charts are still in the green.
With the weekend approaching, the week candle’s close level will be the next crucial data point to assess whether the 0.019x zone is acting as a balance area or just a temporary pause after a big move.
#SHELL #MultiTimeframe #CryptoAnalysis #Binance
49
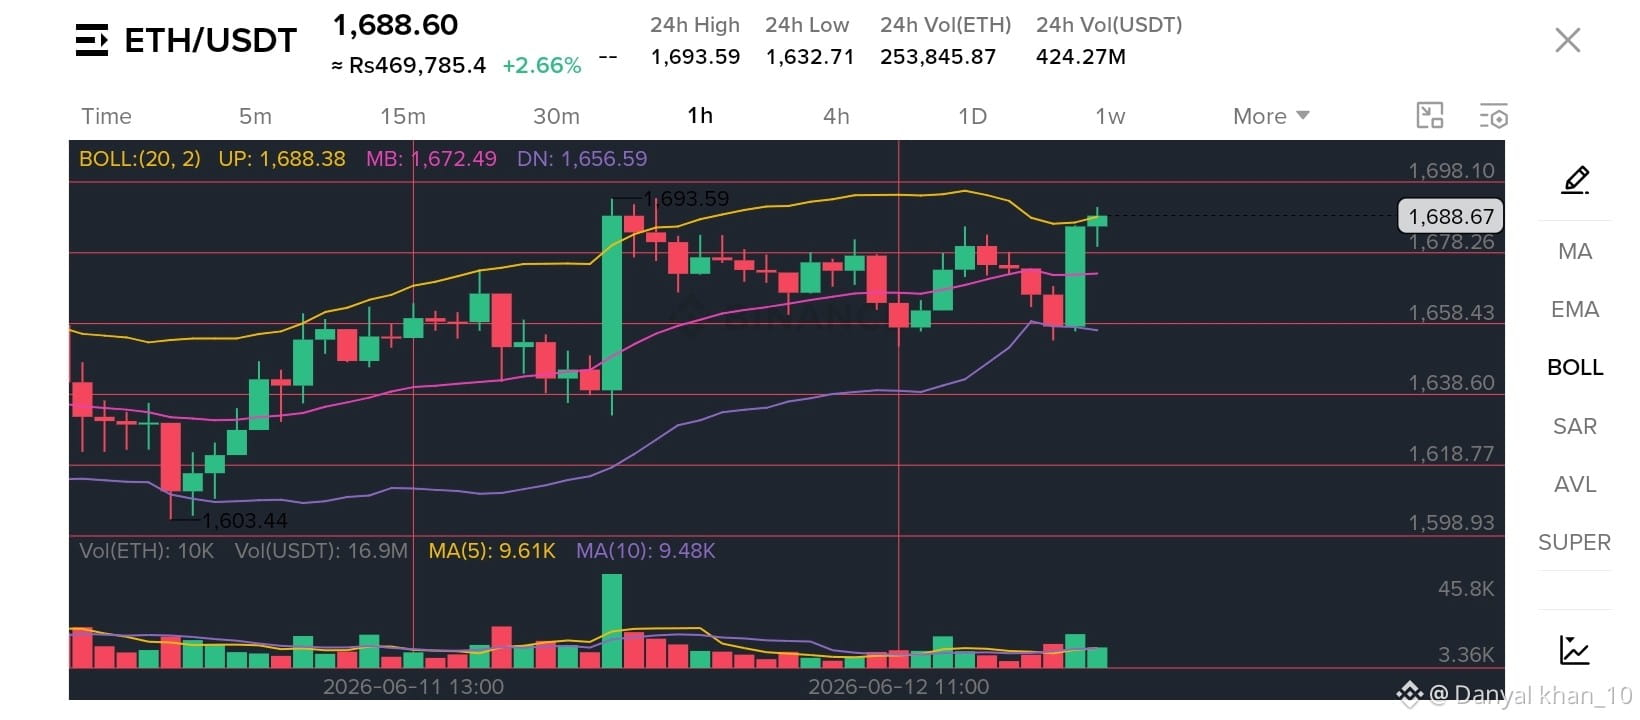
$ETH /USDT – 15m / 1h / 1D Analysis 💎
Current Price: $1,688.60 | +2.66%
24h High: $1,693.59 | 24h Low: $1,632.71
🔹 15m Chart
Bollinger Bands: UP 1,688 / MB 1,672 / DN 1,656
Price at upper band – testing resistance.
Volume: 10K ETH (above avg). Break above 1,693 = move to 1,700.
🔹 1h Chart
Trend: Bullish. Price above MB 1,672.
Support: 1,672 | Resistance: 1,693
Hold above 1,680 = continuation.
🔹 1D Chart (Daily)
Bollinger Bands: UP 1,688 / MB 1,672 / DN 1,656
Price breaking above upper band after consolidation.
Major resistance: 1,720 | Strong support: 1,650
📊 Volume (24h): ETH 253K | USDT 424M – healthy buying.
📅 Performance: +2.66% today | Down -20-40% in longer timeframes.
💡 Trade Idea:
✅ Short-term: Long above 1,693, SL 1,675, T1 1,710
✅ Long-term: Accumulate on dip to 1,650–1,660
Use 2-3% risk only. Spot preferred.
#ETHUSDT #Ethereum #MultiTimeframe #BinanceSquare
$ETH
{spot}(ETHUSDT)
$ETH /USDT – 15m / 1h / 1D Analysis 💎
Current Price: $1,688.60 | +2.66%
24h High: $1,693.59 | 24h Low: $1,632.71
🔹 15m Chart
Bollinger Bands: UP 1,688 / MB 1,672 / DN 1,656
Price at upper band – testing resistance.
Volume: 10K ETH (above avg). Break above 1,693 = move to 1,700.
🔹 1h Chart
Trend: Bullish. Price above MB 1,672.
Support: 1,672 | Resistance: 1,693
Hold above 1,680 = continuation.
🔹 1D Chart (Daily)
Bollinger Bands: UP 1,688 / MB 1,672 / DN 1,656
Price breaking above upper band after consolidation.
Major resistance: 1,720 | Strong support: 1,650
📊 Volume (24h): ETH 253K | USDT 424M – healthy buying.
📅 Performance: +2.66% today | Down -20-40% in longer timeframes.
💡 Trade Idea:
✅ Short-term: Long above 1,693, SL 1,675, T1 1,710
✅ Long-term: Accumulate on dip to 1,650–1,660
Use 2-3% risk only. Spot preferred.
#ETHUSDT #Ethereum #MultiTimeframe #BinanceSquare
$ETH
Current Price: $1,688.60 | +2.66%
24h High: $1,693.59 | 24h Low: $1,632.71
🔹 15m Chart
Bollinger Bands: UP 1,688 / MB 1,672 / DN 1,656
Price at upper band – testing resistance.
Volume: 10K ETH (above avg). Break above 1,693 = move to 1,700.
🔹 1h Chart
Trend: Bullish. Price above MB 1,672.
Support: 1,672 | Resistance: 1,693
Hold above 1,680 = continuation.
🔹 1D Chart (Daily)
Bollinger Bands: UP 1,688 / MB 1,672 / DN 1,656
Price breaking above upper band after consolidation.
Major resistance: 1,720 | Strong support: 1,650
📊 Volume (24h): ETH 253K | USDT 424M – healthy buying.
📅 Performance: +2.66% today | Down -20-40% in longer timeframes.
💡 Trade Idea:
✅ Short-term: Long above 1,693, SL 1,675, T1 1,710
✅ Long-term: Accumulate on dip to 1,650–1,660
Use 2-3% risk only. Spot preferred.
#ETHUSDT #Ethereum #MultiTimeframe #BinanceSquare
$ETH
1
73

INTERNAL LEGEND: HOW THE HIGHER TIMEFRAME SAVES YOU FROM NOISE ON THE MINUTES 🛰️🔬
Trading on a 1-minute chart and wondering why you keep getting stopped out? You just can’t see the bigger picture of the market.
• The global trend is defined on the daily (1D) and 4-hour (4H) timeframes.
• The lower timeframe is needed solely for precision entries in the area of interest (POI) of the higher timeframe.
👇 Open the LINK widget. Where is the global trend heading on the daily chart?
#SmartMoney2026
{spot}(LINKUSDT)
#MultiTimeframe $LINK #CryptoFREEMEN
INTERNAL LEGEND: HOW THE HIGHER TIMEFRAME SAVES YOU FROM NOISE ON THE MINUTES 🛰️🔬
Trading on a 1-minute chart and wondering why you keep getting stopped out? You just can’t see the bigger picture of the market.
• The global trend is defined on the daily (1D) and 4-hour (4H) timeframes.
• The lower timeframe is needed solely for precision entries in the area of interest (POI) of the higher timeframe.
👇 Open the LINK widget. Where is the global trend heading on the daily chart?
#SmartMoney2026
#MultiTimeframe $LINK #CryptoFREEMEN
Trading on a 1-minute chart and wondering why you keep getting stopped out? You just can’t see the bigger picture of the market.
• The global trend is defined on the daily (1D) and 4-hour (4H) timeframes.
• The lower timeframe is needed solely for precision entries in the area of interest (POI) of the higher timeframe.
👇 Open the LINK widget. Where is the global trend heading on the daily chart?
#SmartMoney2026
#MultiTimeframe $LINK #CryptoFREEMEN
164
$SHELL — Compare July candles and the just-closed week
Two timeframes are showing two different structures of $SHELL
📊 July: Open: 0.0209 Close: 0.0180 Change: -13.88% Low: 0.0174
📊 Just-closed week: Open: 0.0181 Close: 0.0211 Change: +16.57% Low: 0.0176
July ended with a closing level lower than the month’s opening price, while the past week recorded the opposite reaction from the 0.017x zone.
However, the weekly candle also reached 0.0255 before closing at 0.0211.
The data shows a recovery on the shorter timeframe, while the July monthly structure that has completed still shows a month of decline.
#SHELL #MultiTimeframe #Binance
$SHELL — Compare July candles and the just-closed week
Two timeframes are showing two different structures of $SHELL
📊 July: Open: 0.0209 Close: 0.0180 Change: -13.88% Low: 0.0174
📊 Just-closed week: Open: 0.0181 Close: 0.0211 Change: +16.57% Low: 0.0176
July ended with a closing level lower than the month’s opening price, while the past week recorded the opposite reaction from the 0.017x zone.
However, the weekly candle also reached 0.0255 before closing at 0.0211.
The data shows a recovery on the shorter timeframe, while the July monthly structure that has completed still shows a month of decline.
#SHELL #MultiTimeframe #Binance
Two timeframes are showing two different structures of $SHELL
📊 July: Open: 0.0209 Close: 0.0180 Change: -13.88% Low: 0.0174
📊 Just-closed week: Open: 0.0181 Close: 0.0211 Change: +16.57% Low: 0.0176
July ended with a closing level lower than the month’s opening price, while the past week recorded the opposite reaction from the 0.017x zone.
However, the weekly candle also reached 0.0255 before closing at 0.0211.
The data shows a recovery on the shorter timeframe, while the July monthly structure that has completed still shows a month of decline.
#SHELL #MultiTimeframe #Binance
16
$SHELL — Timeframes are showing very different results
Binance data currently shows $SHELL has clear differentiation by time range.
📊 Today (UTC+7): +1.54% Price: 0.0198
📊 Rolling 24H: 0.00%
📊 Rolling 7D: +7.61%
📊 This week: Open 0.0212 → 0.0198 (-6.60%)
📊 This month (August): Open 0.0180 → 0.0198 (+10.00%)
At the same price level of 0.0198, the results change depending on the starting point of each timeframe.
This is also why daily, 24H, 7D, weekly, and monthly data should not be used interchangeably when describing the movement of $SHELL
#SHELL #MultiTimeframe #CryptoAnalysis #Binance
$SHELL — Timeframes are showing very different results
Binance data currently shows $SHELL has clear differentiation by time range.
📊 Today (UTC+7): +1.54% Price: 0.0198
📊 Rolling 24H: 0.00%
📊 Rolling 7D: +7.61%
📊 This week: Open 0.0212 → 0.0198 (-6.60%)
📊 This month (August): Open 0.0180 → 0.0198 (+10.00%)
At the same price level of 0.0198, the results change depending on the starting point of each timeframe.
This is also why daily, 24H, 7D, weekly, and monthly data should not be used interchangeably when describing the movement of $SHELL
#SHELL #MultiTimeframe #CryptoAnalysis #Binance
Binance data currently shows $SHELL has clear differentiation by time range.
📊 Today (UTC+7): +1.54% Price: 0.0198
📊 Rolling 24H: 0.00%
📊 Rolling 7D: +7.61%
📊 This week: Open 0.0212 → 0.0198 (-6.60%)
📊 This month (August): Open 0.0180 → 0.0198 (+10.00%)
At the same price level of 0.0198, the results change depending on the starting point of each timeframe.
This is also why daily, 24H, 7D, weekly, and monthly data should not be used interchangeably when describing the movement of $SHELL
#SHELL #MultiTimeframe #CryptoAnalysis #Binance
35

#MultiTimeframe #MarketStructure
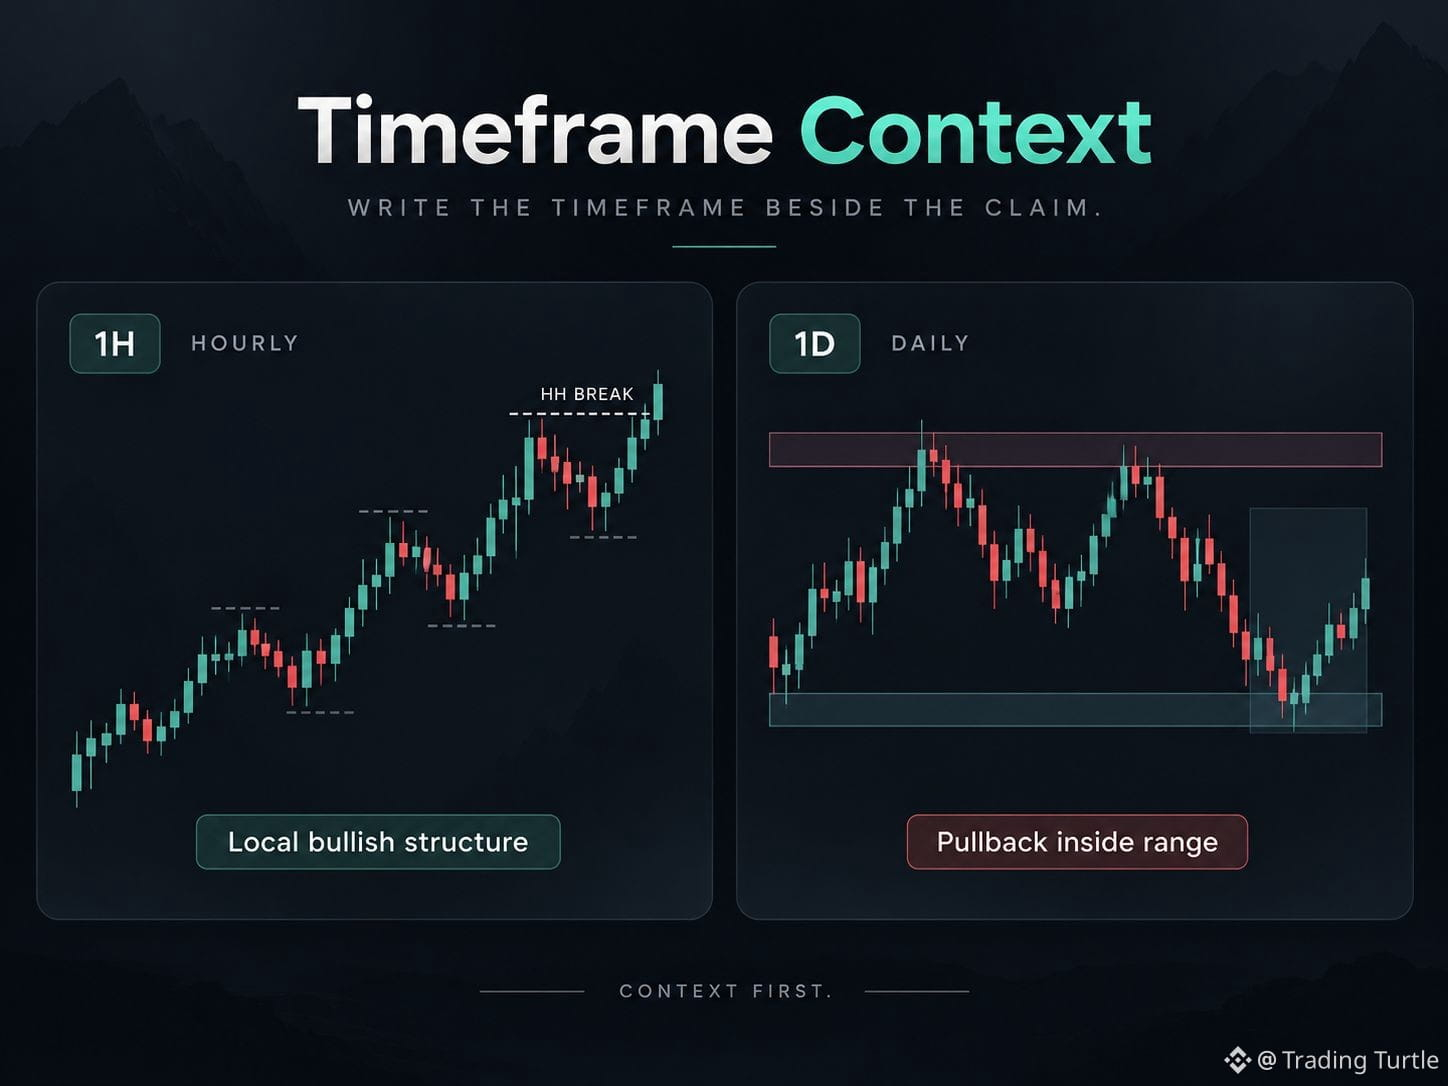
Timeframe context: An hourly chart can show a rising sequence while the daily chart is still pulling back inside a larger range. That is not automatically a contradiction: the candles describe different intervals.
Write the timeframe beside the claim. “The hourly swing high was broken” is more precise than “the trend reversed.”
Use the higher timeframe to describe context and the chosen analysis timeframe to test its own reference. Switching charts until one agrees with your prediction hides the disagreement instead of explaining it.
A higher timeframe provides context, not a guarantee that a lower-timeframe pattern will work.
#MultiTimeframe #MarketStructure
Timeframe context: An hourly chart can show a rising sequence while the daily chart is still pulling back inside a larger range. That is not automatically a contradiction: the candles describe different intervals.
Write the timeframe beside the claim. “The hourly swing high was broken” is more precise than “the trend reversed.”
Use the higher timeframe to describe context and the chosen analysis timeframe to test its own reference. Switching charts until one agrees with your prediction hides the disagreement instead of explaining it.
A higher timeframe provides context, not a guarantee that a lower-timeframe pattern will work.
Timeframe context: An hourly chart can show a rising sequence while the daily chart is still pulling back inside a larger range. That is not automatically a contradiction: the candles describe different intervals.
Write the timeframe beside the claim. “The hourly swing high was broken” is more precise than “the trend reversed.”
Use the higher timeframe to describe context and the chosen analysis timeframe to test its own reference. Switching charts until one agrees with your prediction hides the disagreement instead of explaining it.
A higher timeframe provides context, not a guarantee that a lower-timeframe pattern will work.
77
·
--
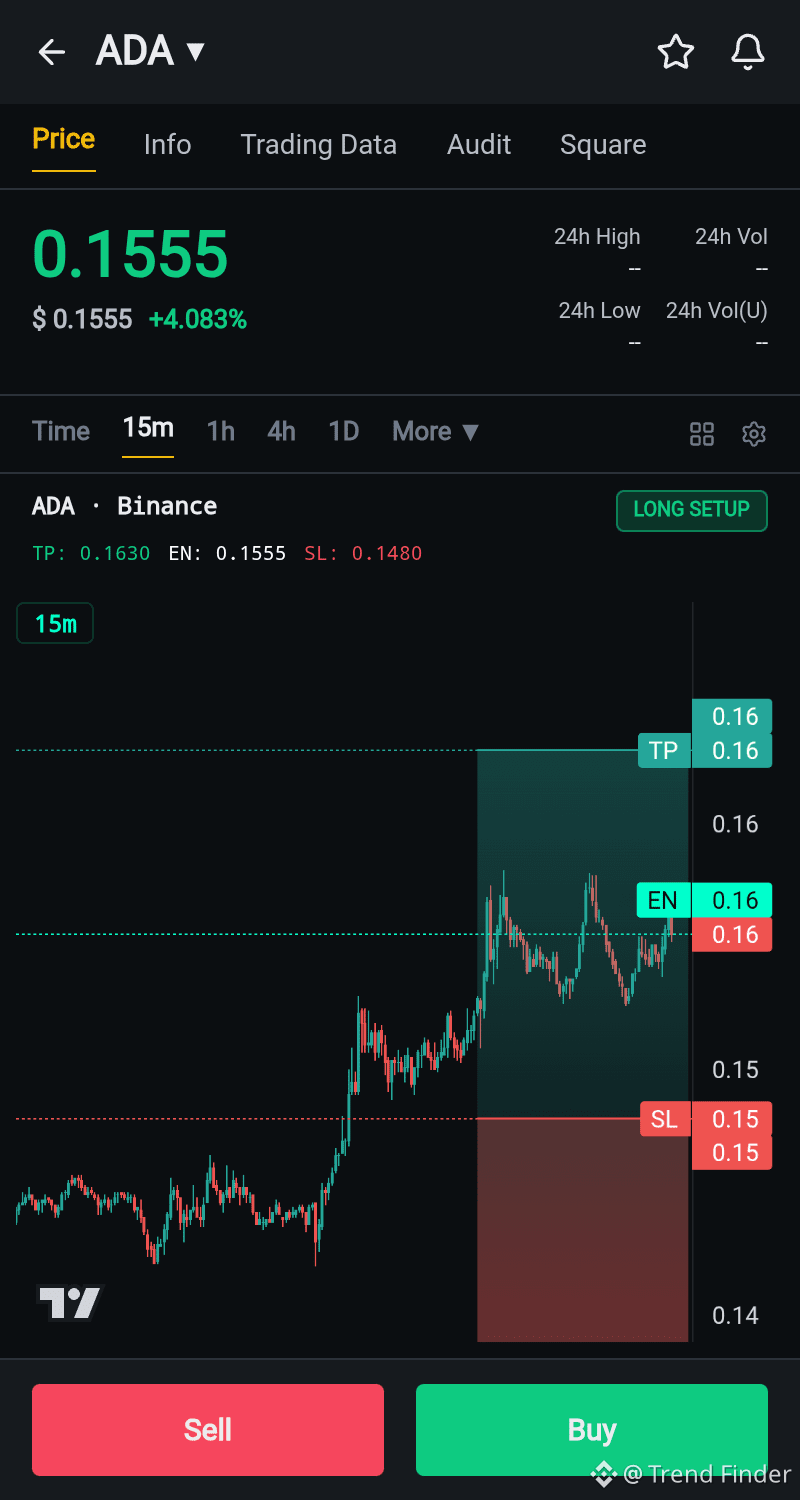
🚀 $ADA is showing strong short-term bullish momentum! Current price 0.1555 holding above key EMAs on 15m, 1h, and 4h. Daily MACD hinting at a turn too. We're looking for a LONG towards major resistance at 0.1705. Tight SL at 0.1480 for a 1:2 R:R. Don't miss out! #CryptoTrading #ADATrade #MultiTimeframe
{spot}(ADAUSDT)
🚀 $ADA is showing strong short-term bullish momentum! Current price 0.1555 holding above key EMAs on 15m, 1h, and 4h. Daily MACD hinting at a turn too. We're looking for a LONG towards major resistance at 0.1705. Tight SL at 0.1480 for a 1:2 R:R. Don't miss out! #CryptoTrading #ADATrade #MultiTimeframe
1
129
·
--
Bearish
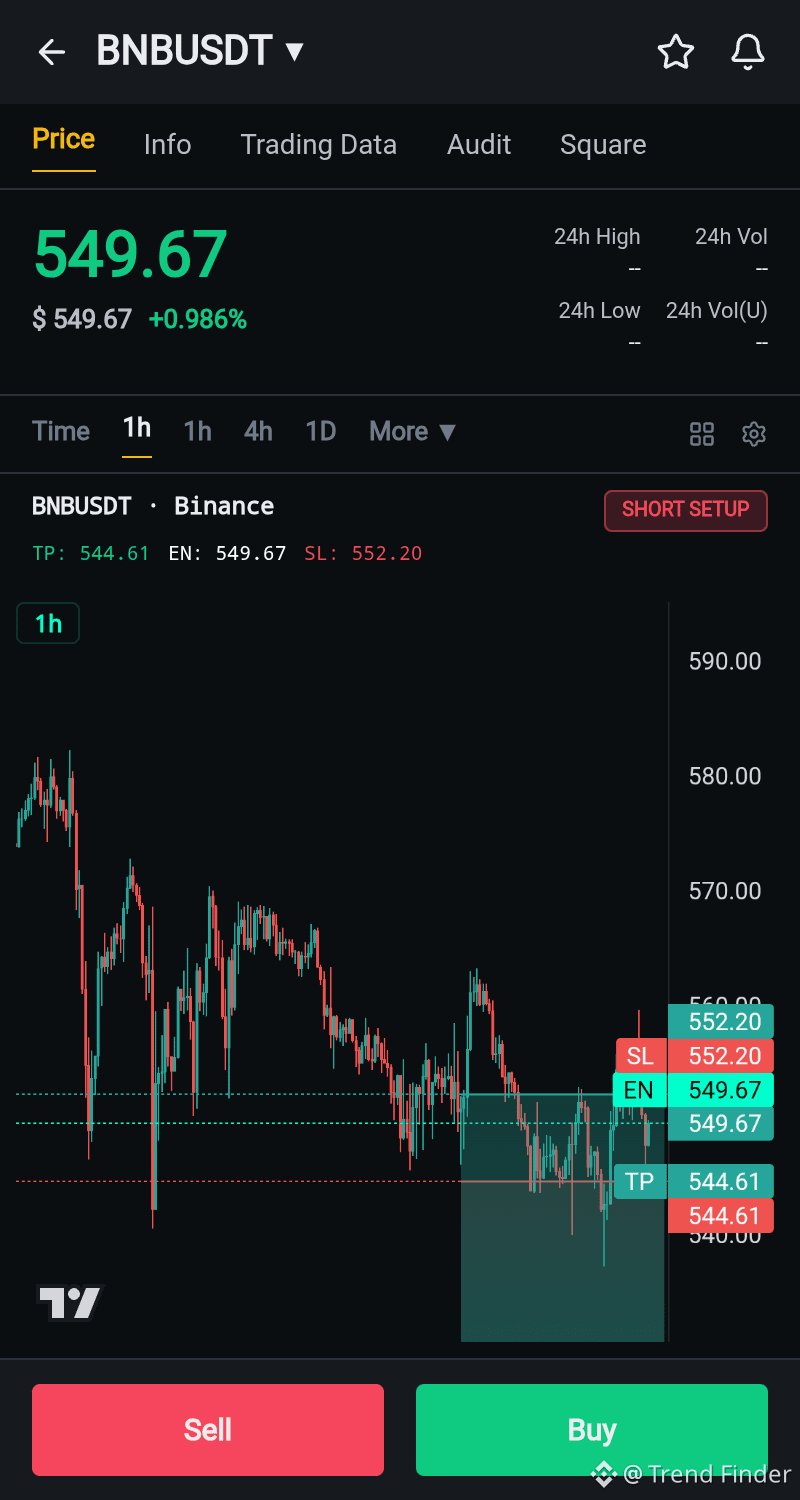
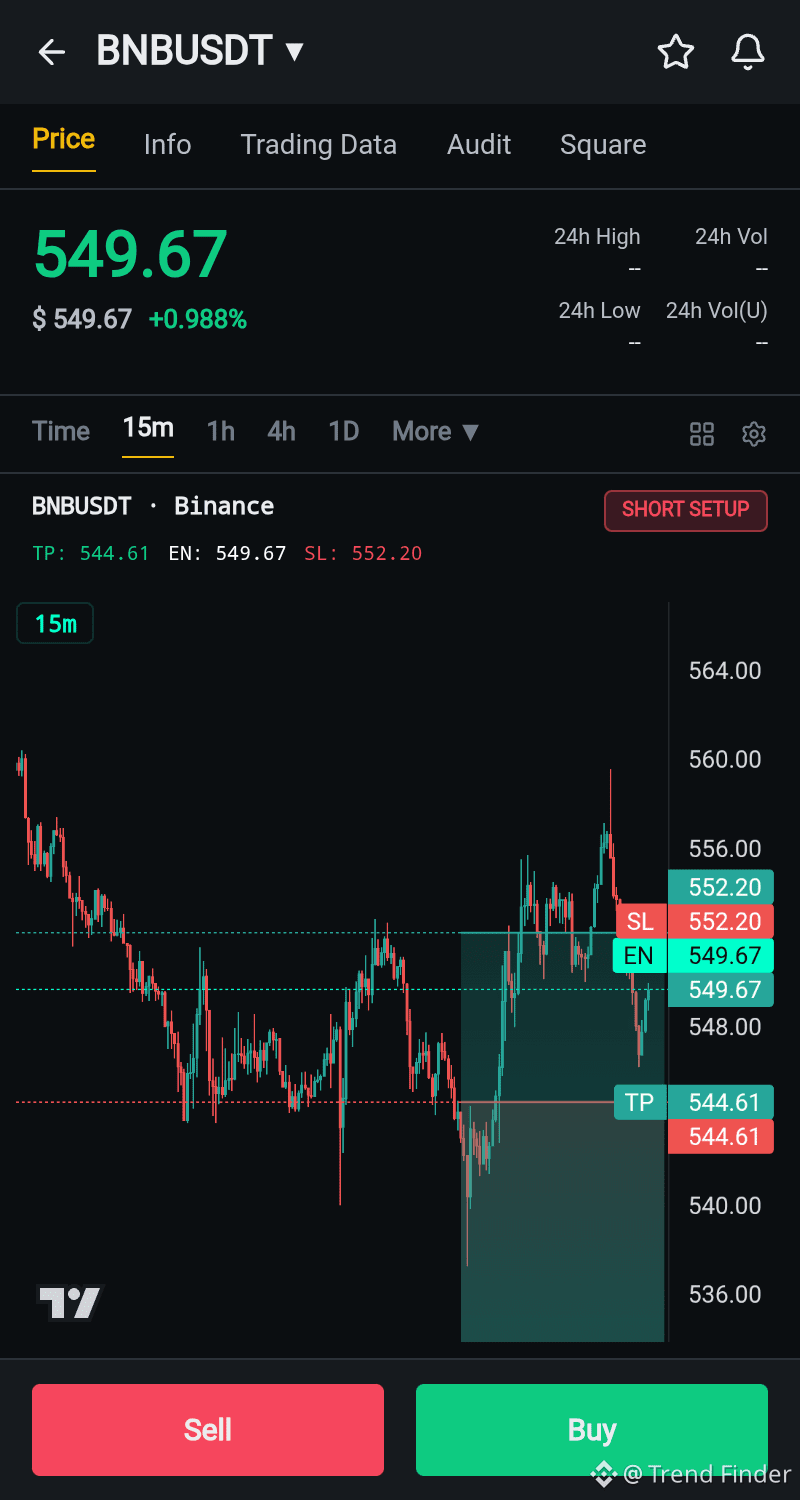
🚨 $BNB Deep Scan Alert! 📉 Macro trend is firmly #bearish across 1D & 4h timeframes, with price below all major EMAs. Current price 549.67 finding immediate resistance. Looking for continuation of the downtrend. Setup with tight SL & solid 1:2 / 1:3 RR. #BNB #CryptoTrading #ShortSetup #MultiTimeframe
{spot}(BNBUSDT)
🚨 $BNB Deep Scan Alert! 📉 Macro trend is firmly #bearish across 1D & 4h timeframes, with price below all major EMAs. Current price 549.67 finding immediate resistance. Looking for continuation of the downtrend. Setup with tight SL & solid 1:2 / 1:3 RR. #BNB #CryptoTrading #ShortSetup #MultiTimeframe
3
1
200
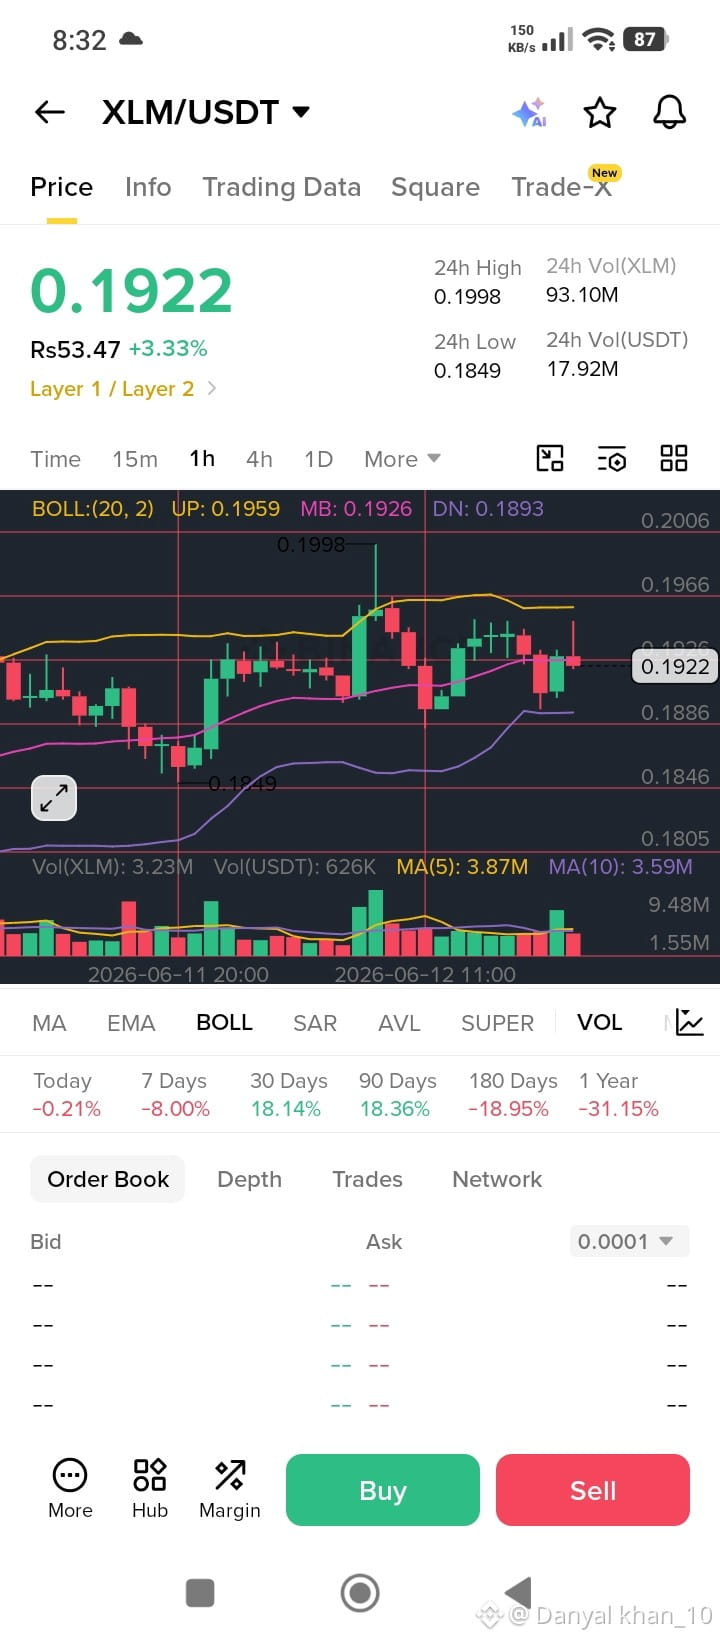
$XLM /USDT – 15m / 1h / 1D Analysis ⭐
Current Price: $0.1922 | +3.33%
24h High: $0.2006 | 24h Low: $0.1886
🔹 15m Chart
Bollinger Bands: UP 0.1959 / MB 0.1926 / DN 0.1893
Price near middle band – consolidating.
Volume: 3.23M XLM (below MA5) – low momentum.
🔹 1h Chart
Trend: Sideways to mild bullish. Price exactly at MB 0.1926.
Support: 0.1893 (DN) | Resistance: 0.1959 (UP)
Break either side = direction.
🔹 1D Chart (Daily)
Bollinger Bands: Price between MB and UP.
30-Day: +18.14% | 90-Day: +18.36% – healthy uptrend.
Major resistance: 0.2006 | Support: 0.1805
📊 Order Book: Data not fully visible, but 30-day trend is bullish.
💡 Trade Idea:
✅ Long above 0.1930, SL 0.1890, T1 0.1960, T2 0.2006
❌ Short only if breaks below 0.1880.
Patience required – low volatility right now.
#XLMUSDT #Stellar #MultiTimeframe
$XLM
{spot}(XLMUSDT)
$XLM /USDT – 15m / 1h / 1D Analysis ⭐
Current Price: $0.1922 | +3.33%
24h High: $0.2006 | 24h Low: $0.1886
🔹 15m Chart
Bollinger Bands: UP 0.1959 / MB 0.1926 / DN 0.1893
Price near middle band – consolidating.
Volume: 3.23M XLM (below MA5) – low momentum.
🔹 1h Chart
Trend: Sideways to mild bullish. Price exactly at MB 0.1926.
Support: 0.1893 (DN) | Resistance: 0.1959 (UP)
Break either side = direction.
🔹 1D Chart (Daily)
Bollinger Bands: Price between MB and UP.
30-Day: +18.14% | 90-Day: +18.36% – healthy uptrend.
Major resistance: 0.2006 | Support: 0.1805
📊 Order Book: Data not fully visible, but 30-day trend is bullish.
💡 Trade Idea:
✅ Long above 0.1930, SL 0.1890, T1 0.1960, T2 0.2006
❌ Short only if breaks below 0.1880.
Patience required – low volatility right now.
#XLMUSDT #Stellar #MultiTimeframe
$XLM
Current Price: $0.1922 | +3.33%
24h High: $0.2006 | 24h Low: $0.1886
🔹 15m Chart
Bollinger Bands: UP 0.1959 / MB 0.1926 / DN 0.1893
Price near middle band – consolidating.
Volume: 3.23M XLM (below MA5) – low momentum.
🔹 1h Chart
Trend: Sideways to mild bullish. Price exactly at MB 0.1926.
Support: 0.1893 (DN) | Resistance: 0.1959 (UP)
Break either side = direction.
🔹 1D Chart (Daily)
Bollinger Bands: Price between MB and UP.
30-Day: +18.14% | 90-Day: +18.36% – healthy uptrend.
Major resistance: 0.2006 | Support: 0.1805
📊 Order Book: Data not fully visible, but 30-day trend is bullish.
💡 Trade Idea:
✅ Long above 0.1930, SL 0.1890, T1 0.1960, T2 0.2006
❌ Short only if breaks below 0.1880.
Patience required – low volatility right now.
#XLMUSDT #Stellar #MultiTimeframe
$XLM
1
35
Log in to explore more content
Join global crypto users on Binance Square
⚡️ Get latest and useful information about crypto.
💬 Trusted by the world’s largest crypto exchange.
👍 Discover real insights from verified creators.
Email / Phone number
Trending Topics
1
#WhatWillDriveCryptoandStocks’NextRebound?
0 views
6 Discussing
2
#HuangExitNvidiaStrategyInFocus
118,690 views
1,256 Discussing
3
#AnthropicRejectsIPODelayValuationinQuestion
727,565 views
5,457 Discussing
4
#HedgeFundsCMEBitcoinNetShortsFall89%
3,271 views
77 Discussing
5
#BitMineReports$6.3BNetLossForFiscal2026
15,013 views
154 Discussing
6
#SoFiExpandsSoFiUSDStablecoinToPolygon
3,662 views
76 Discussing
7
#TetherGoldXAUTCompletesKPMGAudit
4,398 views
81 Discussing
8
#ChipStocksExtendLossesAfterNvidiaCEOChange
45,512 views
507 Discussing
9
#TrezorConfirmsMaliciousImplantsIn3Safe5Devices
1,959 views
35 Discussing
10
#TradFiForBeginners
542,022 views
3,769 Discussing