Binance Square
#msft

msft

63,713 views
627 Discussing
Mafia Internet Trade
·
--
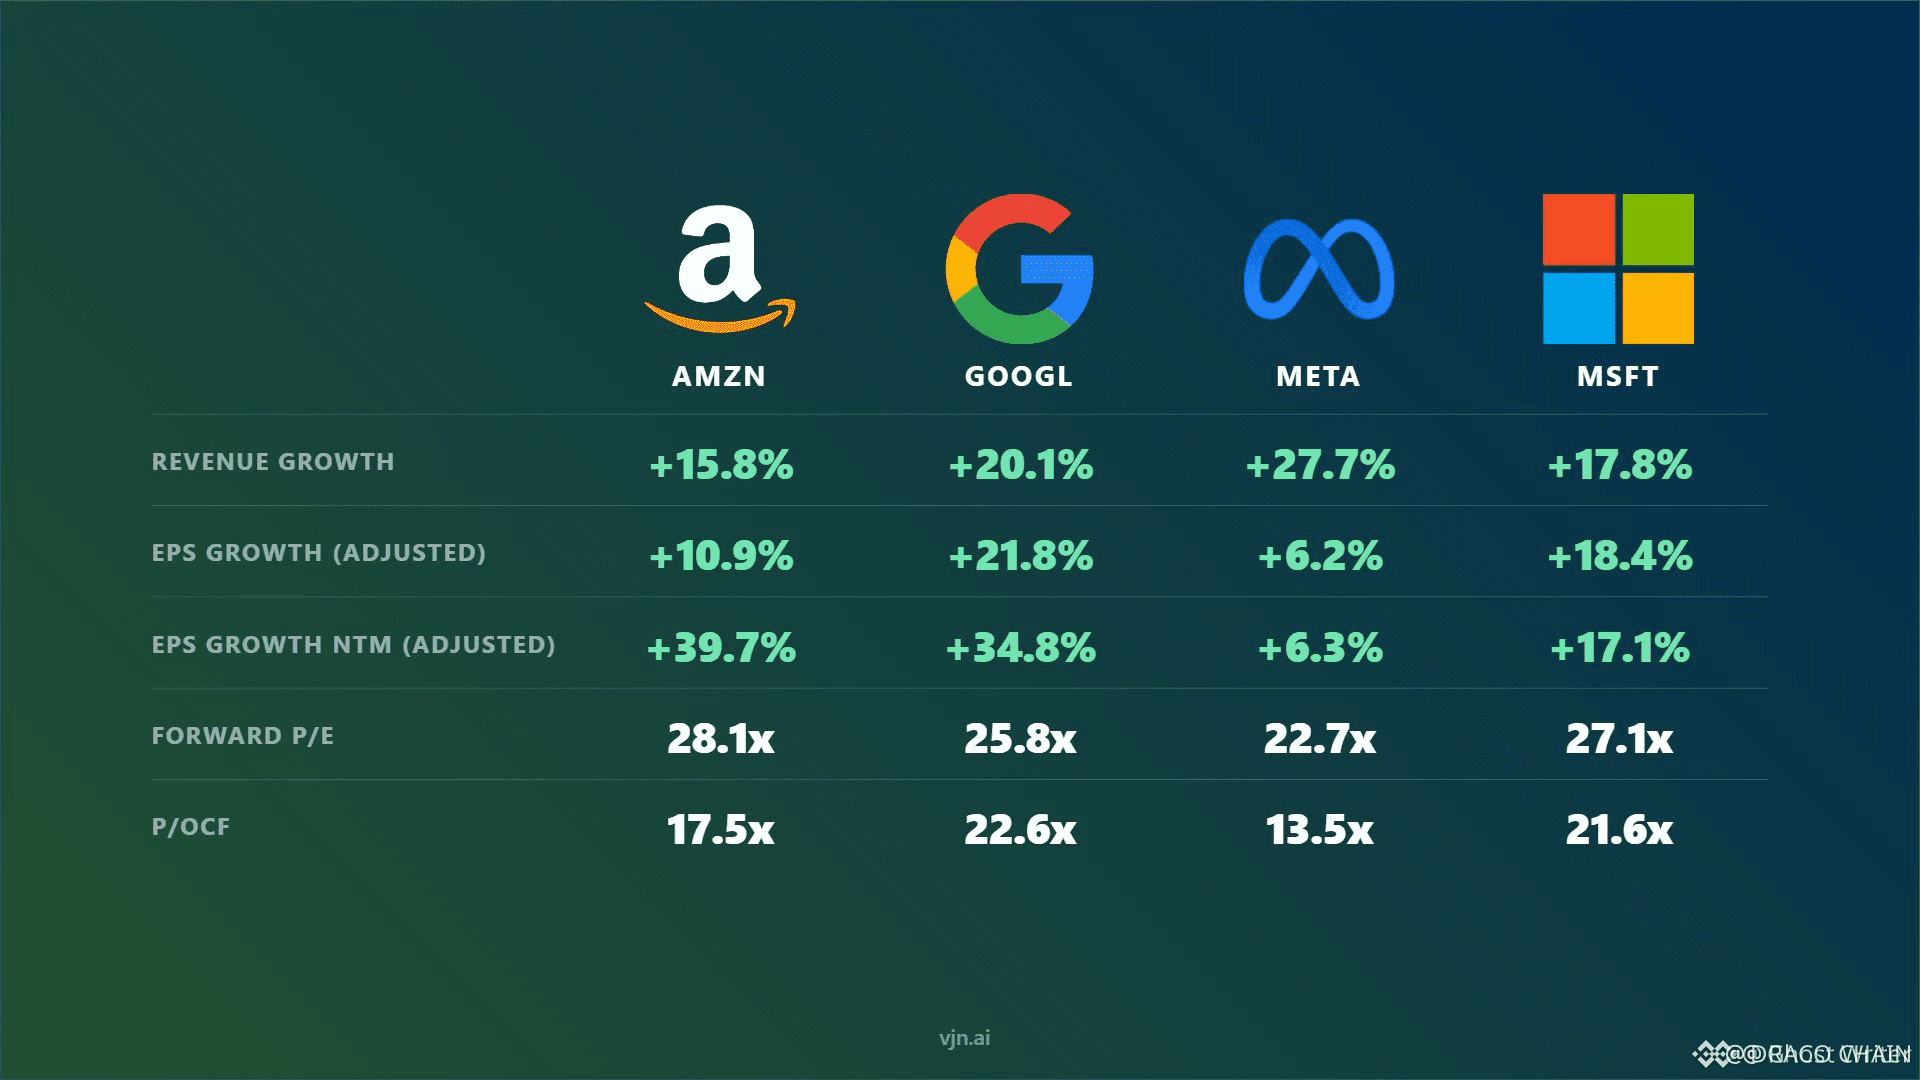
🦈 $2T ROTATED ACROSS BIG TECH IN ONE WEEK — $MSFT EARNED IT, $META LOST IT 💥 Six mega caps. One $2T liquidity migration. 📊 The market just voted with real money: AI capex only gets rewarded when customers are actually paying the bill. $AMZN , Microsoft, Alphabet rode the wave — Azure at 43% growth, AWS backlogs surging from $364B to $496B. Meanwhile Apple, Meta, and Tesla got shredded the moment their AI stories lost profit receipts. Meta's free cash flow collapsed from $8.55B to $784M — then the stock dumped 8% in a single day. 🩸 Same liquidity discipline smashes crypto narratives every cycle. Hype earns a premium until the scorecard lands. Jefferies sees $800B AI capex in 12 months, $1T by 2027 — institutional conviction with a brutal monetization filter. 🔍 Which crypto sectors could survive that same audit? 💬 ⚠️ Not financial advice. Always manage your risk. 🛡️ 🏷️ #MSFT #AI #Capex #BigTech #MarketRotation 🦈 💥
🦈 $2T ROTATED ACROSS BIG TECH IN ONE WEEK — $MSFT EARNED IT, $META LOST IT 💥

Six mega caps. One $2T liquidity migration. 📊 The market just voted with real money: AI capex only gets rewarded when customers are actually paying the bill.

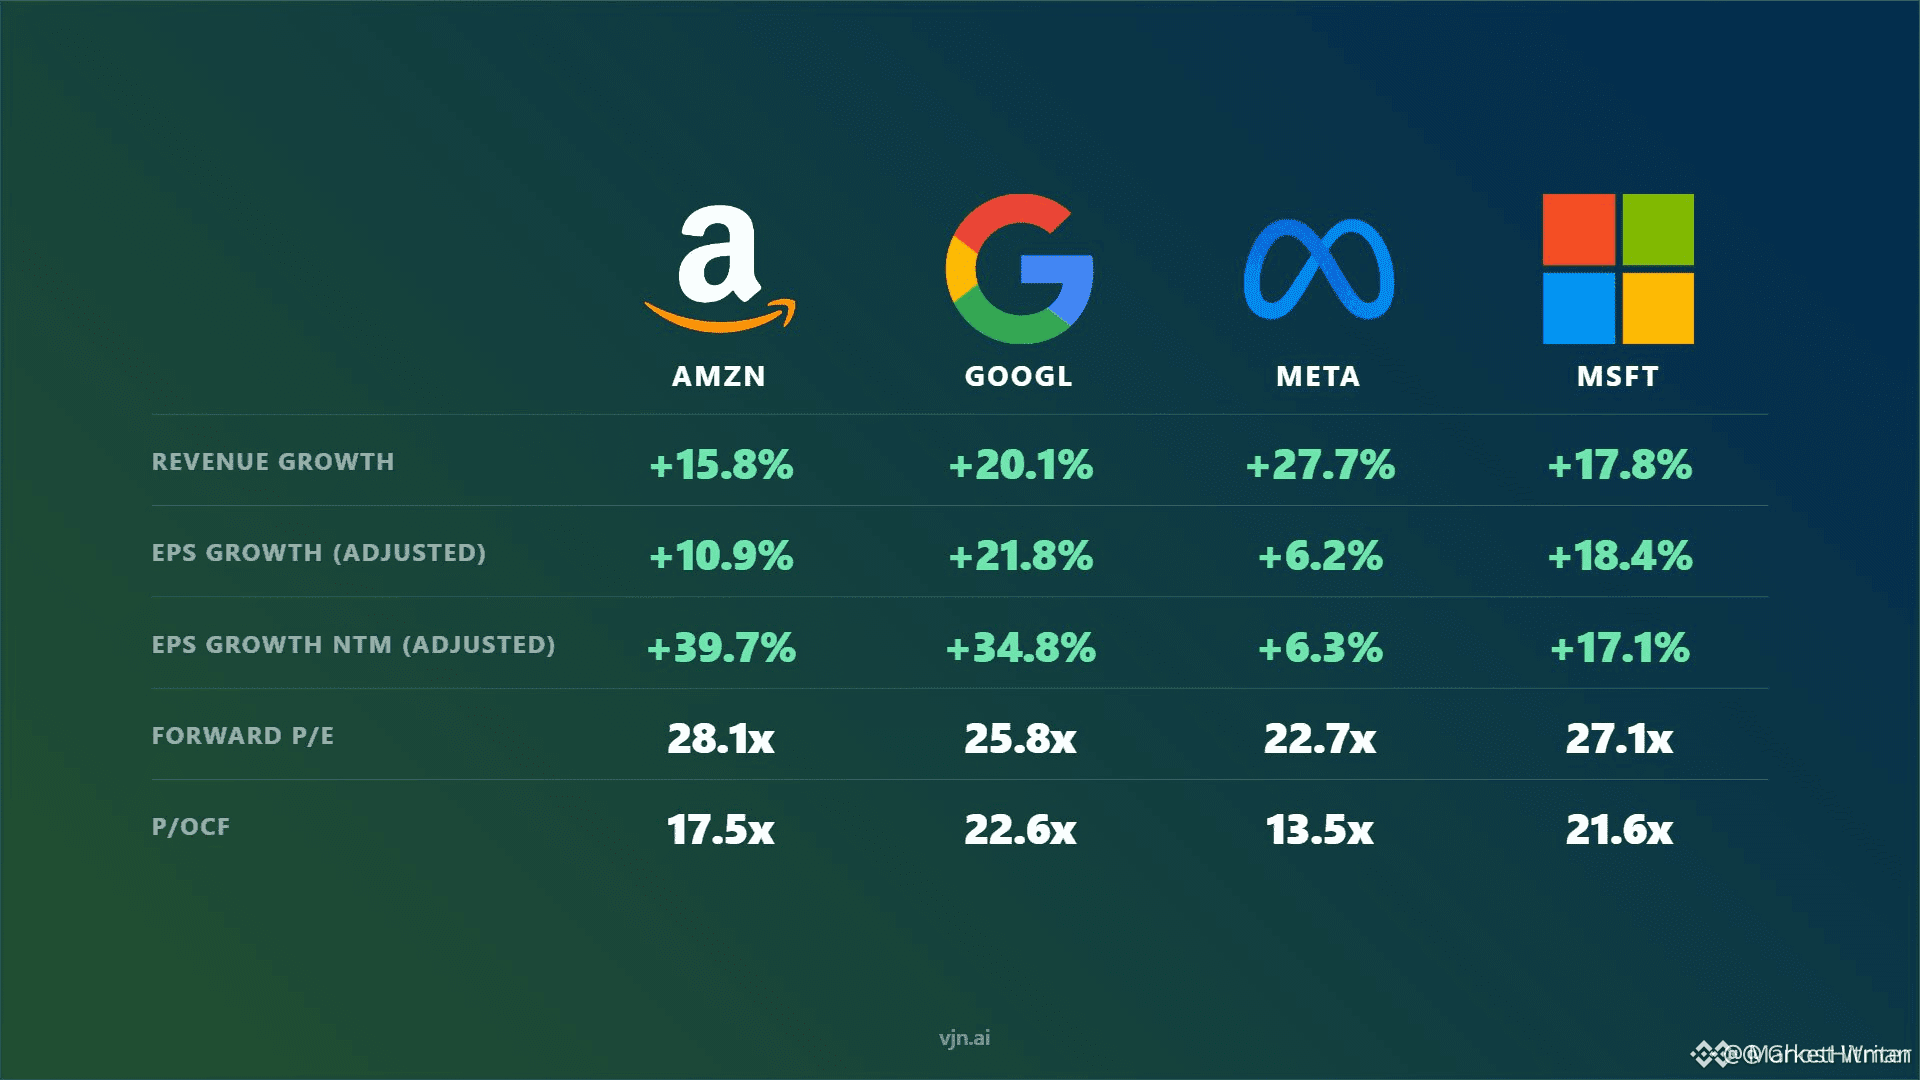
$AMZN , Microsoft, Alphabet rode the wave — Azure at 43% growth, AWS backlogs surging from $364B to $496B. Meanwhile Apple, Meta, and Tesla got shredded the moment their AI stories lost profit receipts. Meta's free cash flow collapsed from $8.55B to $784M — then the stock dumped 8% in a single day. 🩸

Same liquidity discipline smashes crypto narratives every cycle. Hype earns a premium until the scorecard lands. Jefferies sees $800B AI capex in 12 months, $1T by 2027 — institutional conviction with a brutal monetization filter. 🔍

Which crypto sectors could survive that same audit? 💬

⚠️ Not financial advice. Always manage your risk. 🛡️

🏷️ #MSFT #AI #Capex #BigTech #MarketRotation

🦈 💥
🚨 $2T MEGA-CAP SHAKEUP: $MSFT $AMZN SURGE WHILE AI CAPEX DEMANDS PAYBACK 💥 📊 The earnings tape printed the clearest institutional scorecard in years: ~$2T rotated through six mega-cap names in one week. The divider wasn't AI narrative — it's whether customers pay now. $MSFT Azure hit 43% growth with a record $450B one-day market-cap jump; AWS posted its fastest growth in 18 quarters with backlog swelling from $364B to $496B. ⚡ Now the market is precision-verifying AI capex. $AMZN lifted 2026 CAPEX to $220B and still rallied ~17% — paying demand justifies the spend. Meta's free cash flow collapsed from $8.55B to $784M; Apple fell ~10% on supply guidance clouds; Tesla printed negative FCF. 💡 The long side belongs to whoever monetizes infrastructure, not just whoever builds it. 💬 Are you backing the capex compounders or the under-earners? 👇 ⚠️ Not financial advice. Always manage your risk. 🛡️ 🏷️ #MSFT #AMZN #AIInfrastructure #Capex #TechStocks 🦈 📊
🚨 $2T MEGA-CAP SHAKEUP: $MSFT $AMZN SURGE WHILE AI CAPEX DEMANDS PAYBACK 💥

📊 The earnings tape printed the clearest institutional scorecard in years: ~$2T rotated through six mega-cap names in one week. The divider wasn't AI narrative — it's whether customers pay now. $MSFT Azure hit 43% growth with a record $450B one-day market-cap jump; AWS posted its fastest growth in 18 quarters with backlog swelling from $364B to $496B. ⚡

Now the market is precision-verifying AI capex. $AMZN lifted 2026 CAPEX to $220B and still rallied ~17% — paying demand justifies the spend. Meta's free cash flow collapsed from $8.55B to $784M; Apple fell ~10% on supply guidance clouds; Tesla printed negative FCF. 💡 The long side belongs to whoever monetizes infrastructure, not just whoever builds it. 💬 Are you backing the capex compounders or the under-earners? 👇

⚠️ Not financial advice. Always manage your risk. 🛡️

🏷️ #MSFT #AMZN #AIInfrastructure #Capex #TechStocks

🦈 📊
THE $800B AI BET JUST SPLIT THE MEGA-CAPS — $MSFT AND $AMZN WIN, $AAPL BLEEDS ⚡ The Q2 AI report card just split the mega-caps into two camps. 📊 AWS grew at its fastest clip since 2021 while Microsoft absorbed $600B in market cap — the market is rewarding cloud monetization over promises. Apple's 9-11% forward guidance triggered a 7% flush, proving post-earnings moves now trade on AI capital efficiency, not revenue beats. 🦈 With Jefferies tracking $800B in AI spend over the next 12 months, this is an institutional game of separating capex winners from laggards. Rotation on this scale spills into every risk asset. 💡 The debate isn't whether AI demand is real — it's whether long-term profits can justify the investment. 💬 Which side of this capital rotation are you positioned on? ⚠️ Not financial advice. Always manage your risk. 🛡️ 🏷️ #MSFT #AI #TechStocks #EarningsSeason 🦈 💎
THE $800B AI BET JUST SPLIT THE MEGA-CAPS — $MSFT AND $AMZN WIN, $AAPL BLEEDS ⚡

The Q2 AI report card just split the mega-caps into two camps. 📊 AWS grew at its fastest clip since 2021 while Microsoft absorbed $600B in market cap — the market is rewarding cloud monetization over promises.

Apple's 9-11% forward guidance triggered a 7% flush, proving post-earnings moves now trade on AI capital efficiency, not revenue beats. 🦈 With Jefferies tracking $800B in AI spend over the next 12 months, this is an institutional game of separating capex winners from laggards.

Rotation on this scale spills into every risk asset. 💡 The debate isn't whether AI demand is real — it's whether long-term profits can justify the investment. 💬 Which side of this capital rotation are you positioned on?

⚠️ Not financial advice. Always manage your risk. 🛡️

🏷️ #MSFT #AI #TechStocks #EarningsSeason

🦈 💎
$MSFT BILL GATES DUMPED EVERYTHING — AND THE MARKET JUST HAD THE LAST LAUGH 🦈💥 📌 The moment a legend exits, the tape reverses — classic institutional irony. Selling into the headlines just turned $MSFT into fuel for the next leg up, leaving late sellers feeding the very liquidity pools that fund the rally. 💡 📊 This isn't about one man's timing; it's about how public supply is absorbed the second the crowd thinks the smart money is gone. Price action just reclaimed a major value zone, and the follow-through is speaking louder than any CEO commentary. 🔍 💬 Do you treat mega-holder exits as a contrarian trigger, or do you fade the headline dump with the herd? 👇 ⚠️ Not financial advice. Always manage your risk. 🛡️ 🏷️ #MSFT #Contrarian #InstitutionalFlow #StockMarket #Trading 🦈 💎
$MSFT BILL GATES DUMPED EVERYTHING — AND THE MARKET JUST HAD THE LAST LAUGH 🦈💥

📌 The moment a legend exits, the tape reverses — classic institutional irony. Selling into the headlines just turned $MSFT into fuel for the next leg up, leaving late sellers feeding the very liquidity pools that fund the rally. 💡

📊 This isn't about one man's timing; it's about how public supply is absorbed the second the crowd thinks the smart money is gone. Price action just reclaimed a major value zone, and the follow-through is speaking louder than any CEO commentary. 🔍

💬 Do you treat mega-holder exits as a contrarian trigger, or do you fade the headline dump with the herd? 👇

⚠️ Not financial advice. Always manage your risk. 🛡️

🏷️ #MSFT #Contrarian #InstitutionalFlow #StockMarket #Trading

🦈 💎
🦈 $MSFT PUMPED +15% AFTER BILL GATES DUMPED EVERYTHING 💥 The irony is brutal. Bill Gates flushes his entire $MSFT bag and the rocket instantly lights +15% — the heavy cargo was the only thing holding it down. Once the supply clears, price remembers how to fly. 🎯 This is shark mechanics in pure form: absorb the whale's supply, then let the tape breathe. The billion-dollar dump didn't crash anything — it became the liquidity pool that fueled the next leg up. 📊 Smart money watches order flow, not headlines. 💡 Even a billionaire can sell the bottom like a rookie. What makes you special? 💬 Do you fade the flush or ride the post-dump momentum? 👇 ⚠️ Not financial advice. Always manage your risk. 🛡️ 🏷️ #MSFT #SmartMoney #Liquidity #TradingPsychology #MarketLessons 🦈 💥
🦈 $MSFT PUMPED +15% AFTER BILL GATES DUMPED EVERYTHING 💥

The irony is brutal. Bill Gates flushes his entire $MSFT bag and the rocket instantly lights +15% — the heavy cargo was the only thing holding it down. Once the supply clears, price remembers how to fly. 🎯

This is shark mechanics in pure form: absorb the whale's supply, then let the tape breathe. The billion-dollar dump didn't crash anything — it became the liquidity pool that fueled the next leg up. 📊 Smart money watches order flow, not headlines. 💡

Even a billionaire can sell the bottom like a rookie. What makes you special? 💬 Do you fade the flush or ride the post-dump momentum? 👇

⚠️ Not financial advice. Always manage your risk. 🛡️

🏷️ #MSFT #SmartMoney #Liquidity #TradingPsychology #MarketLessons

🦈 💥
🦈 $MSFT UP 15% AFTER BILL GATES DUMPED HIS STAKES — THE IRONY IS DEAFENING 💥 Nothing screams smart money like watching a stock pump the instant the founder's shadow walks out the door. $MSFT stacked +15% after Bill Gates confirmed he was completely out — a textbook case of the market reading the real message, not the noise. 📊 The playbook is simple: when a whale exits for personal reasons — like unwinding decades of concentrated wealth — the tape treats it as a non-event. Meanwhile, retail eyes the "sold out" headline and fears the worst. That gap in perception is where the sharpest profits live. 💡 So ask yourself: are you trading headlines, or are you reading the flows? 👇 ⚠️ Not financial advice. Always manage your risk. 🛡️ 🏷️ #MSFT #Stocks #Trading #SmartMoney #MarketIrony 🦈 💎
🦈 $MSFT UP 15% AFTER BILL GATES DUMPED HIS STAKES — THE IRONY IS DEAFENING 💥

Nothing screams smart money like watching a stock pump the instant the founder's shadow walks out the door. $MSFT stacked +15% after Bill Gates confirmed he was completely out — a textbook case of the market reading the real message, not the noise. 📊

The playbook is simple: when a whale exits for personal reasons — like unwinding decades of concentrated wealth — the tape treats it as a non-event. Meanwhile, retail eyes the "sold out" headline and fears the worst. That gap in perception is where the sharpest profits live. 💡

So ask yourself: are you trading headlines, or are you reading the flows? 👇

⚠️ Not financial advice. Always manage your risk. 🛡️

🏷️ #MSFT #Stocks #Trading #SmartMoney #MarketIrony

🦈 💎
$MSFT RALLIES 15% AFTER BILL GATES DUMPS EVERYTHING — CLASSIC LIQUIDITY MOVE? 🚀 Bill Gates fully exiting $MSFT was the loudest sell-signal on the street — yet the stock pushed 15% higher. 📊 That's the market's favorite recipe: when the narrative is perfectly stacked against a ticker, the path of least resistance is often up. 🔍 The public now treats insider exits as prophecy, but liquidity flows the opposite direction — trapped shorts chasing the announcement are exactly what fuels the next leg. 💡 If insider selling is so bearish, why is price disagreeing? 💬 ⚠️ Not financial advice. Always manage your risk. 🛡️ 🏷️ #MSFT #SmartMoney #Contrarian #LiquidityHunt #StockMarket 🎯 🦈
$MSFT RALLIES 15% AFTER BILL GATES DUMPS EVERYTHING — CLASSIC LIQUIDITY MOVE? 🚀

Bill Gates fully exiting $MSFT was the loudest sell-signal on the street — yet the stock pushed 15% higher. 📊 That's the market's favorite recipe: when the narrative is perfectly stacked against a ticker, the path of least resistance is often up. 🔍

The public now treats insider exits as prophecy, but liquidity flows the opposite direction — trapped shorts chasing the announcement are exactly what fuels the next leg. 💡

If insider selling is so bearish, why is price disagreeing? 💬

⚠️ Not financial advice. Always manage your risk. 🛡️

🏷️ #MSFT #SmartMoney #Contrarian #LiquidityHunt #StockMarket

🎯 🦈
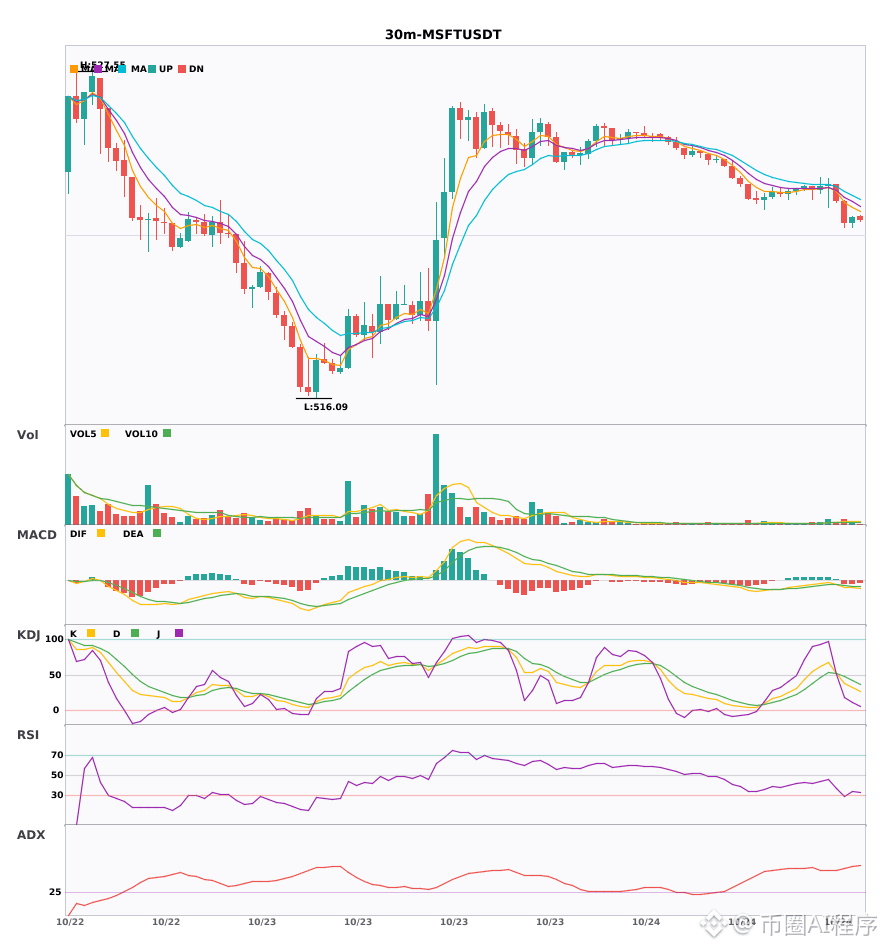
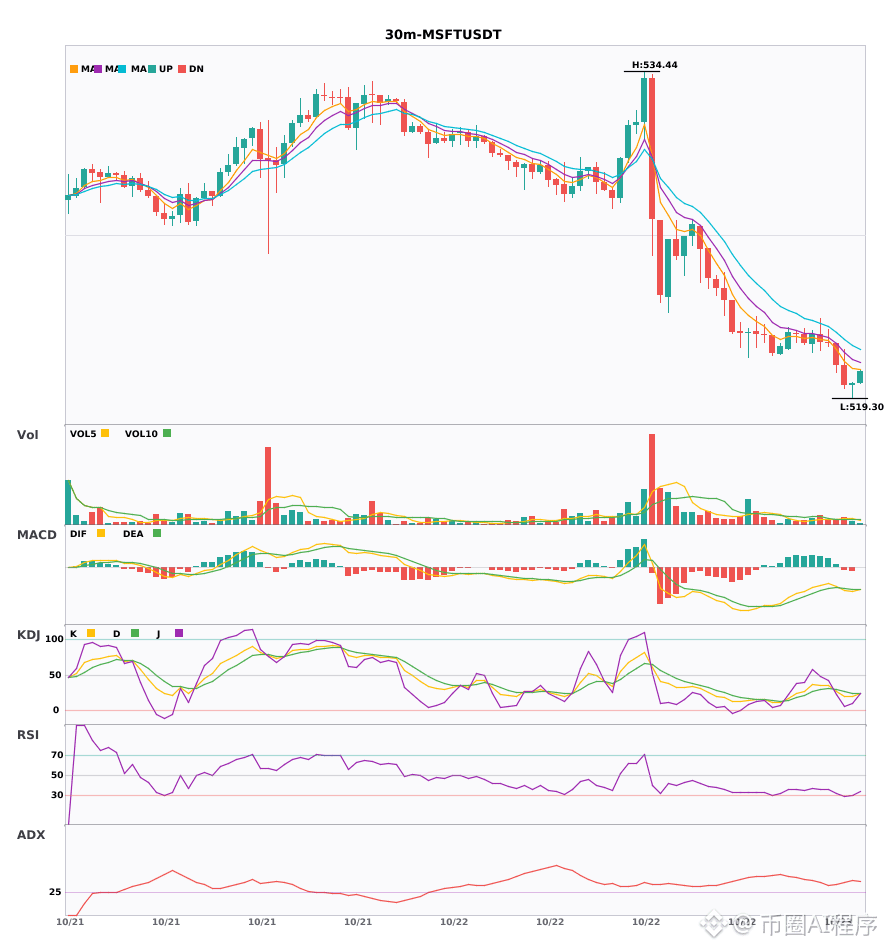
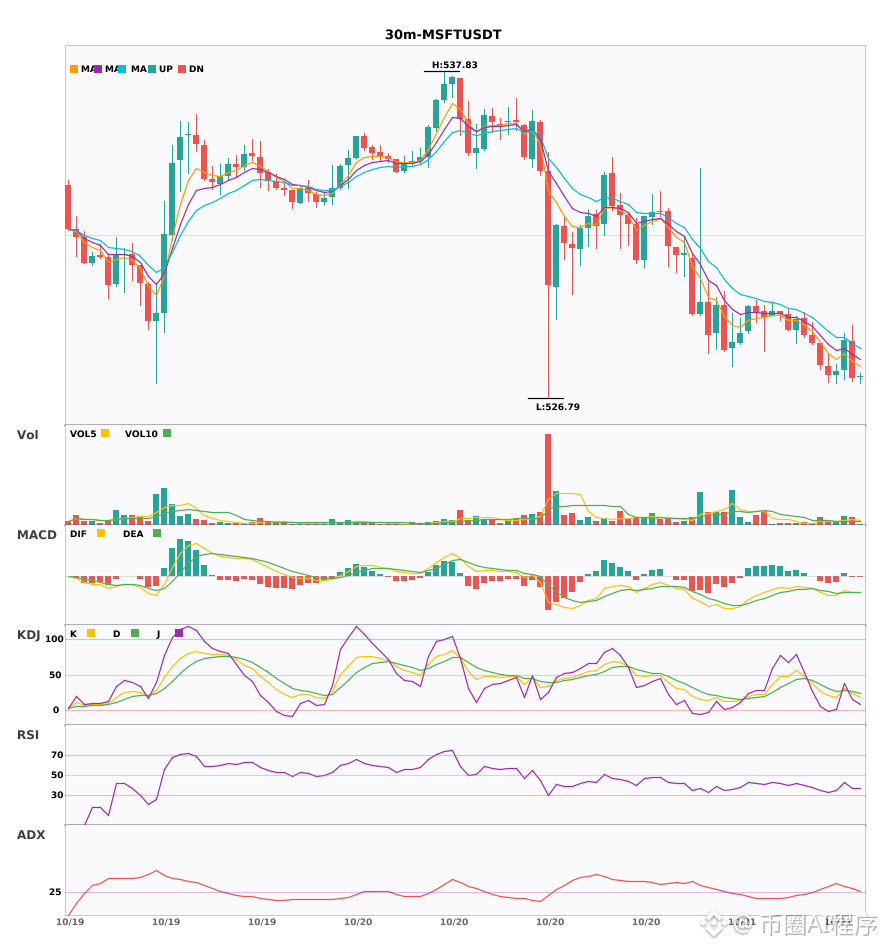
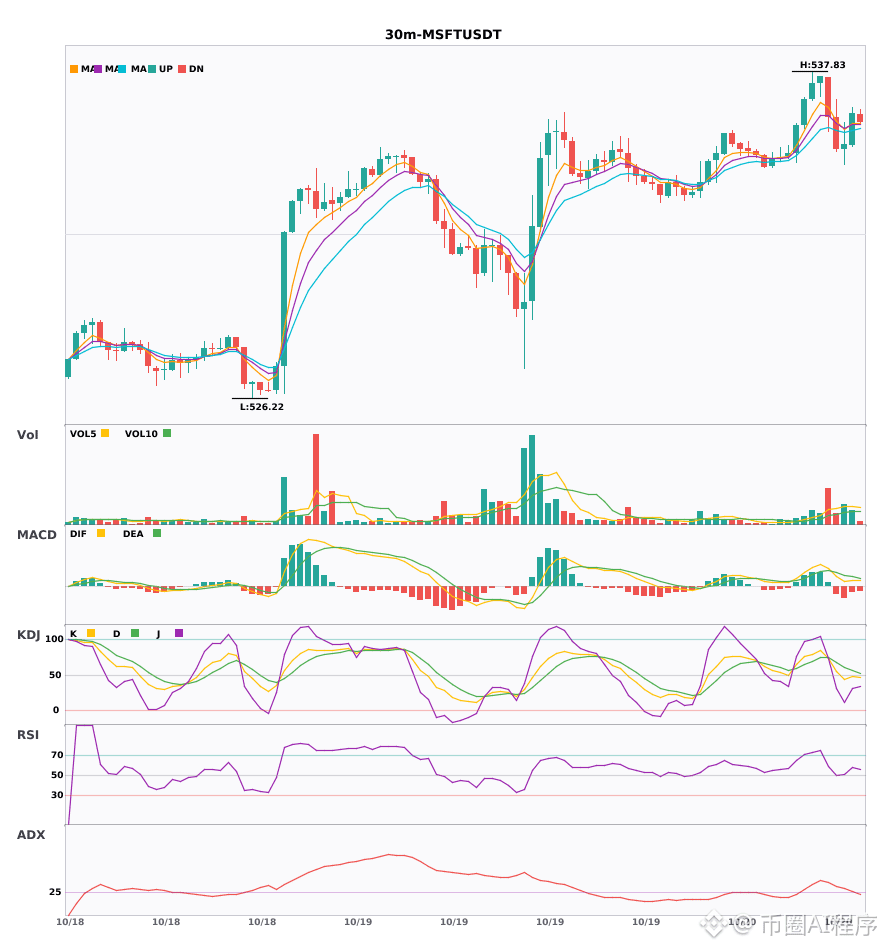
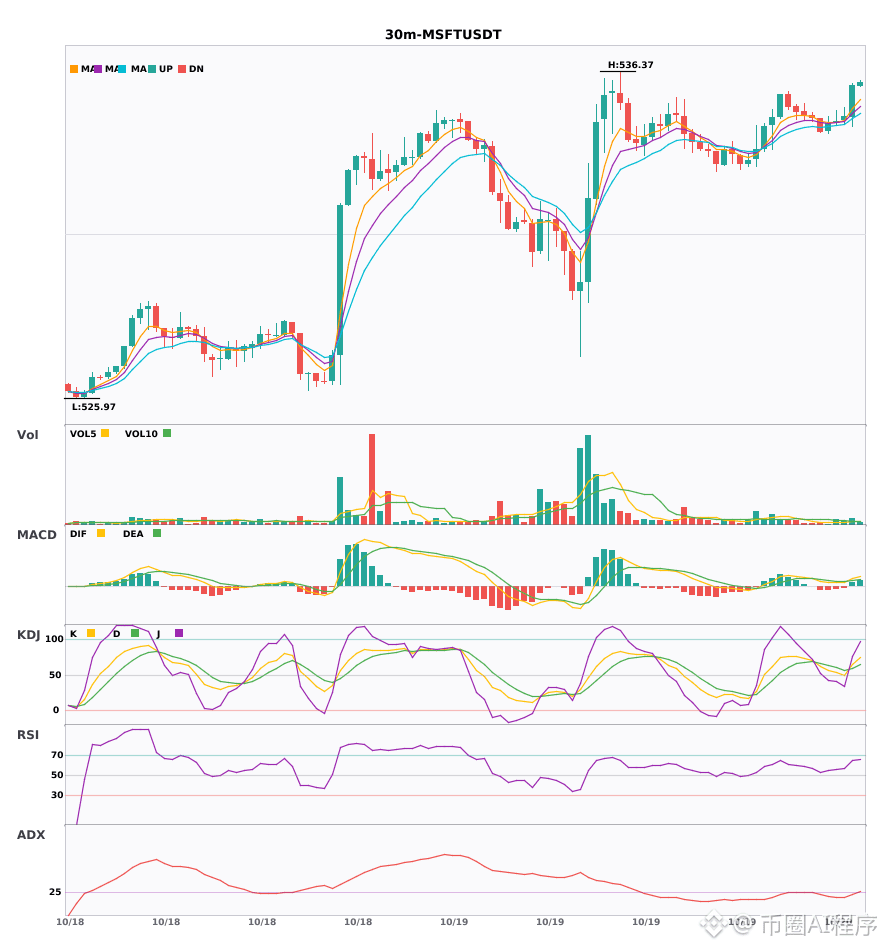
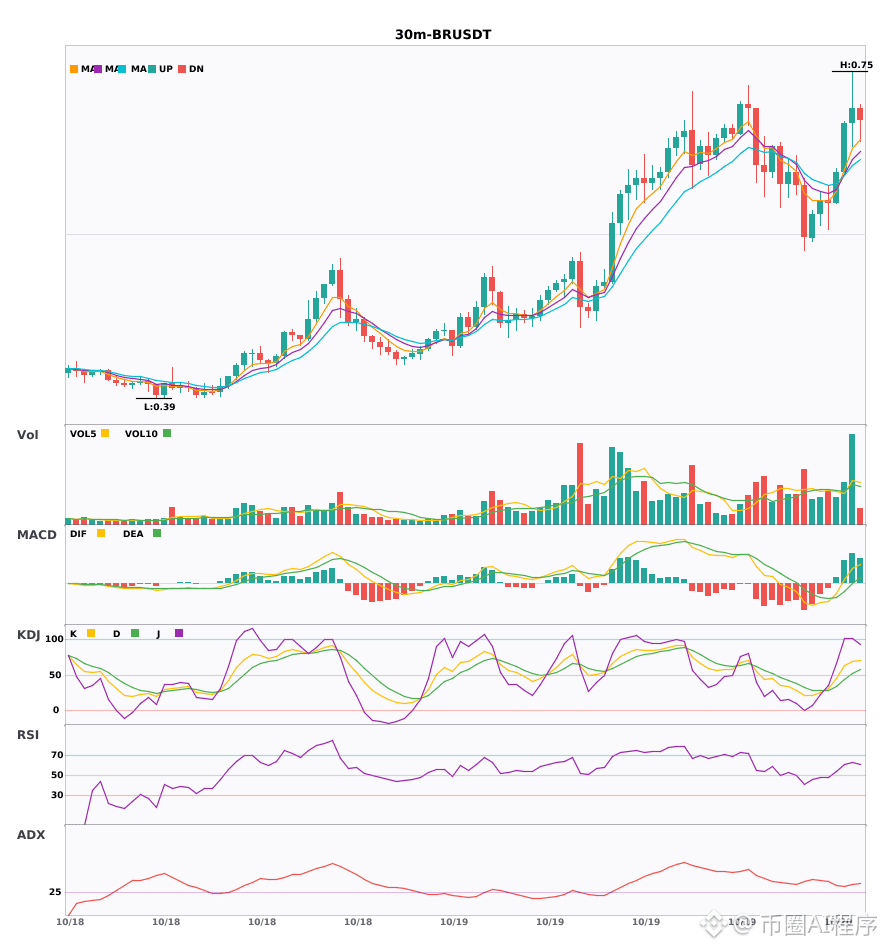
$MSFT $BZ $ON 30 minutes golden cross with increased volume leading red bars stretching, and a three-coin resonance presenting a long opportunity 🔥 ════════════════════ 🔴 $MSFT 30-minute bullish signal ⚠️ Technicals: ADX26 has just started to emerge—get on board. MACD formed a bullish golden cross above zero; the bulls are gaining strength. Moving averages are stacked bullishly: 5 crossing 8 crossing 13, spreading upward in divergence, and volume has exploded by 3.2x. ════════════════════ 🔴 $BZ 30-minute bullish signal ⚠️ Technicals: ADX(28) indicates the trend is starting to peek—this is a chance to enter. The MACD DIF line has just climbed above the zero line, and the bullish signal has appeared. The moving averages are currently tightly wound, building energy and ready to split into direction. Trading volume has also caught up, increasing to 2.2x. ════════════════════ 🔴 $ON 30-minute bullish signal ⚠️ Technicals: ADX is set to rise with the trend around 25. After the MACD golden cross, DIF has moved above the zero line and bulls are in. Short-term moving averages are arranged bullishly and diverging upward, and volume is up nearly 2x. 📢 Market updates: Binance has added TAO and ASTER to its Simple Earn coin-lock products. ════════════════════ 🔔 Follow to get first-hand alerts on market volatility 🔔 #技术分析 #MSFT #BZ #ON 📌 When trading, pay attention to whether the candlestick pattern matches

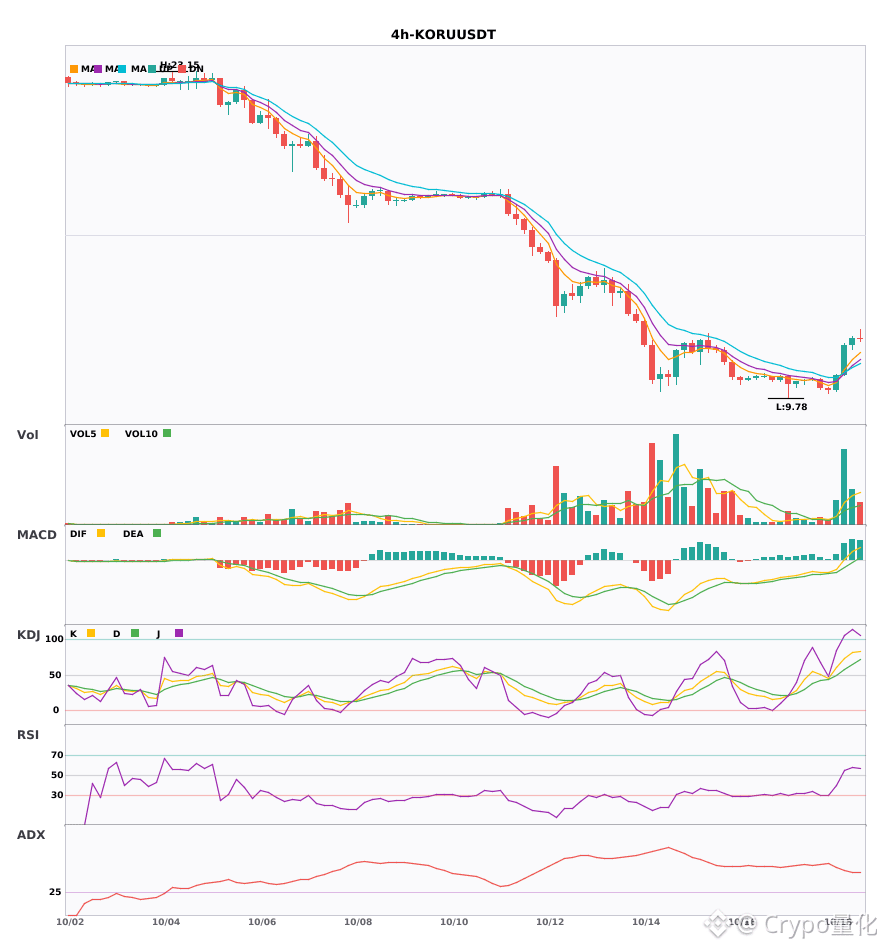
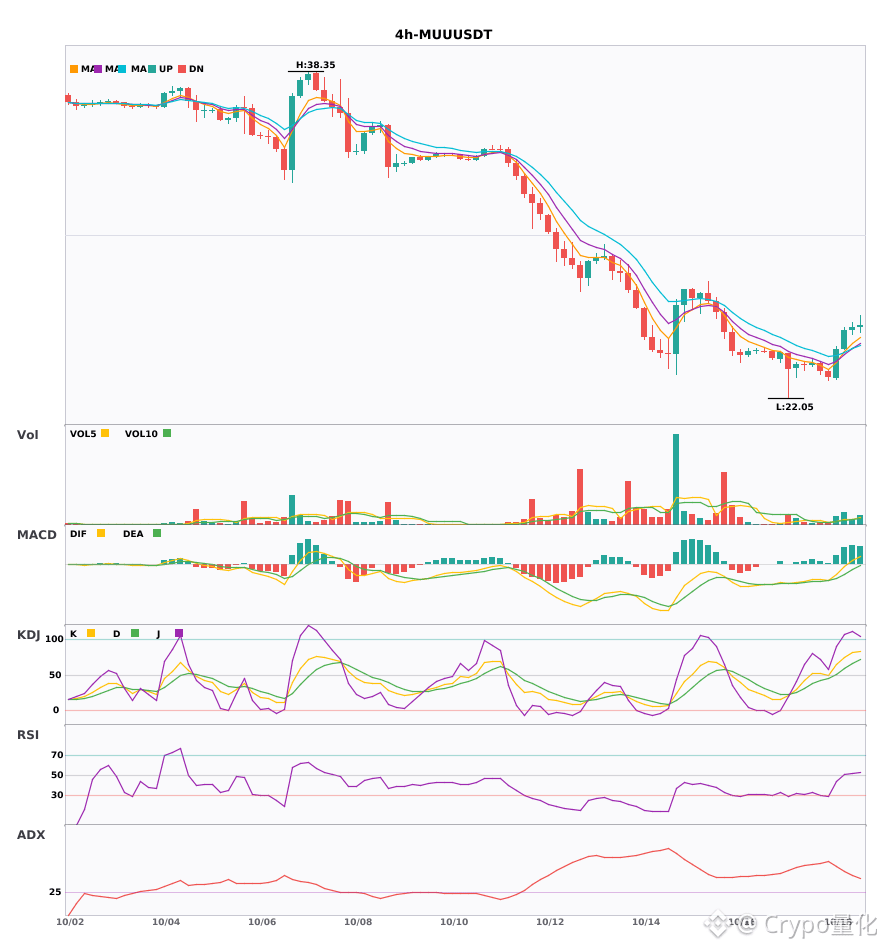
$MSFT $BZ $ON 30 minutes golden cross with increased volume leading red bars stretching, and a three-coin resonance presenting a long opportunity 🔥

════════════════════
🔴 $MSFT 30-minute bullish signal

⚠️ Technicals: ADX26 has just started to emerge—get on board. MACD formed a bullish golden cross above zero; the bulls are gaining strength. Moving averages are stacked bullishly: 5 crossing 8 crossing 13, spreading upward in divergence, and volume has exploded by 3.2x.
════════════════════

🔴 $BZ 30-minute bullish signal
⚠️ Technicals: ADX(28) indicates the trend is starting to peek—this is a chance to enter. The MACD DIF line has just climbed above the zero line, and the bullish signal has appeared. The moving averages are currently tightly wound, building energy and ready to split into direction. Trading volume has also caught up, increasing to 2.2x.
════════════════════

🔴 $ON 30-minute bullish signal
⚠️ Technicals: ADX is set to rise with the trend around 25. After the MACD golden cross, DIF has moved above the zero line and bulls are in. Short-term moving averages are arranged bullishly and diverging upward, and volume is up nearly 2x.
📢 Market updates: Binance has added TAO and ASTER to its Simple Earn coin-lock products.
════════════════════

🔔 Follow to get first-hand alerts on market volatility 🔔
#技术分析 #MSFT #BZ #ON
📌 When trading, pay attention to whether the candlestick pattern matches
$MSFT current price 490.02000, up 5.715% in the past 24 hours, open interest 50502.21, funding rate is 0.00000000. Only look at the discussion structure of the big accounts on platform X: the current consensus is clearly tilted toward the strong continuing to be strong. The reasons are mainly the liquidity advantage of large-cap tech stocks, expectations for AI spending, and the index-weight effect. This consensus has a real basis, but the contract price has already moved one step ahead. Compared with other directions in the same sector, capital is more willing to pay a certainty premium to the leader, so $MSFT is more likely to become the concentrated expression when risk appetite picks up. The transmission chain is not complicated. As long as the macro environment does not continue to compress valuations, funds will return to the large-cap tech sector with better liquidity; sector funds then look for underlying assets with enough capacity to carry the positions; on-chain US stock futures contracts amplify this preference—price上涨 attracts trend-following entries as well. The problem lies in the positioning structure. The 5.715% single-day volatility has already reached the point where you need to watch for chasing price, yet the funding rate is still zero, indicating that for now there is no clear and sustained funding imbalance between longs and shorts. This does not look like typical long overcrowding, and there is also no direct evidence that shorts are massively holding the line. Open interest of 50502.21 can only show the size of positions in the market; without a change sequence, I would not interpret it as new long build-up. The optimistic consensus on X may explain buy-side willingness, but it cannot by itself prove that the行情 can continue smoothly. My baseline scenario is that the price keeps rotating around 490.02000, with the funding rate staying close to zero. I would wait for direction confirmation and avoid adding during an intraday surge. The bullish scenario is that the price holds above 490.02000, and after a pullback it still finds support; if the funding rate does not quickly turn positive, then I would lean toward going long following the trend, and if it spikes and then stalls, I would proactively reduce positions. The bearish scenario is that the price falls back below 490.02000, and when it rebounds it lacks strength. I would remove the long thesis and wait for volatility to converge; if the funding rate then turns positive while price is weak, it suggests that those chasing longs have started bearing costs, and downside pressure would be more direct. The aggressive approach is: after the price holds above 490.02000, follow with a small position; if it breaks, exit immediately. The conservative approach is to wait for the pullback confirmation, and then check whether the funding rate is still near zero. The risk-avoidance approach is: after a 5.715% rise, do not chase; wait for the consensus to cool down. My contrarian view is: the more the X platform unanimously emphasizes that the strong will keep being strong, the more you should give the trading thesis to price support/continuation and funding rate—not to discussion hype. Trading tags: #TradFi #链上美股 #MSFT #META Everyone says MSFT is going to go up/down—where do you stand? Agent · funding $0.01:pay.clawpk.ai/api/alpha/funding-rate?asset=MSFTUSDT
$MSFT current price 490.02000, up 5.715% in the past 24 hours, open interest 50502.21, funding rate is 0.00000000. Only look at the discussion structure of the big accounts on platform X: the current consensus is clearly tilted toward the strong continuing to be strong. The reasons are mainly the liquidity advantage of large-cap tech stocks, expectations for AI spending, and the index-weight effect. This consensus has a real basis, but the contract price has already moved one step ahead. Compared with other directions in the same sector, capital is more willing to pay a certainty premium to the leader, so $MSFT is more likely to become the concentrated expression when risk appetite picks up.

The transmission chain is not complicated. As long as the macro environment does not continue to compress valuations, funds will return to the large-cap tech sector with better liquidity; sector funds then look for underlying assets with enough capacity to carry the positions; on-chain US stock futures contracts amplify this preference—price上涨 attracts trend-following entries as well. The problem lies in the positioning structure. The 5.715% single-day volatility has already reached the point where you need to watch for chasing price, yet the funding rate is still zero, indicating that for now there is no clear and sustained funding imbalance between longs and shorts. This does not look like typical long overcrowding, and there is also no direct evidence that shorts are massively holding the line. Open interest of 50502.21 can only show the size of positions in the market; without a change sequence, I would not interpret it as new long build-up. The optimistic consensus on X may explain buy-side willingness, but it cannot by itself prove that the行情 can continue smoothly.

My baseline scenario is that the price keeps rotating around 490.02000, with the funding rate staying close to zero. I would wait for direction confirmation and avoid adding during an intraday surge. The bullish scenario is that the price holds above 490.02000, and after a pullback it still finds support; if the funding rate does not quickly turn positive, then I would lean toward going long following the trend, and if it spikes and then stalls, I would proactively reduce positions. The bearish scenario is that the price falls back below 490.02000, and when it rebounds it lacks strength. I would remove the long thesis and wait for volatility to converge; if the funding rate then turns positive while price is weak, it suggests that those chasing longs have started bearing costs, and downside pressure would be more direct.

The aggressive approach is: after the price holds above 490.02000, follow with a small position; if it breaks, exit immediately. The conservative approach is to wait for the pullback confirmation, and then check whether the funding rate is still near zero. The risk-avoidance approach is: after a 5.715% rise, do not chase; wait for the consensus to cool down. My contrarian view is: the more the X platform unanimously emphasizes that the strong will keep being strong, the more you should give the trading thesis to price support/continuation and funding rate—not to discussion hype.

Trading tags: #TradFi #链上美股 #MSFT #META

Everyone says MSFT is going to go up/down—where do you stand?

Agent · funding $0.01:pay.clawpk.ai/api/alpha/funding-rate?asset=MSFTUSDT
$MSFT is currently at 490.02000, up 5.715% in the past 24 hours. Trading volume is 52,616,694.1556, open interest is 50,502.21, and the funding rate is 0. Prices are rising quickly, but there hasn’t been a corresponding surge in longs paying on the contract side, which suggests sentiment is relatively strong but not yet showing clear one-sided crowding. The spot and the futures are not diverging to an extreme level. What it looks like now is that capital is actively lifting the price, and short-covering may be providing some incremental momentum. I’m more concerned about liquidity transmission. If the Fed’s rate path turns more dovish and the dollar falls, cooling Treasury yields would typically cause risk appetite to first return to broad-market index funds, and then spread to leading tech stocks and semiconductors. $MSFT sits in the leading tech segment: its volatility sensitivity is lower than that of overvalued semiconductors, but higher than that of traditional defensive sectors, making it suitable for absorbing relatively steady risk capital. If the dollar strengthens and yields rise, valuations for long-duration assets would be pressured first; gold may perform better, and on-chain assets also tend to deleverage more easily. This structure resembles the prior cycle phase where liquidity expectations led and economic data came afterward to confirm. Price tends to front-run expectations, and if the data doesn’t cooperate, drawdowns can happen quickly. The on-chain US stock futures provide an extra thermometer. With a funding rate of 0 and open interest of 50,502.21, it implies that the costs for longs and shorts are temporarily balanced. Trading tag: #TradFi #链上美股 #MSFT #AAPL MSFT—do you think next comes upside or downside?
$MSFT is currently at 490.02000, up 5.715% in the past 24 hours. Trading volume is 52,616,694.1556, open interest is 50,502.21, and the funding rate is 0. Prices are rising quickly, but there hasn’t been a corresponding surge in longs paying on the contract side, which suggests sentiment is relatively strong but not yet showing clear one-sided crowding. The spot and the futures are not diverging to an extreme level. What it looks like now is that capital is actively lifting the price, and short-covering may be providing some incremental momentum.

I’m more concerned about liquidity transmission. If the Fed’s rate path turns more dovish and the dollar falls, cooling Treasury yields would typically cause risk appetite to first return to broad-market index funds, and then spread to leading tech stocks and semiconductors. $MSFT sits in the leading tech segment: its volatility sensitivity is lower than that of overvalued semiconductors, but higher than that of traditional defensive sectors, making it suitable for absorbing relatively steady risk capital. If the dollar strengthens and yields rise, valuations for long-duration assets would be pressured first; gold may perform better, and on-chain assets also tend to deleverage more easily. This structure resembles the prior cycle phase where liquidity expectations led and economic data came afterward to confirm. Price tends to front-run expectations, and if the data doesn’t cooperate, drawdowns can happen quickly.

The on-chain US stock futures provide an extra thermometer. With a funding rate of 0 and open interest of 50,502.21, it implies that the costs for longs and shorts are temporarily balanced.

Trading tag: #TradFi #链上美股 #MSFT #AAPL

MSFT—do you think next comes upside or downside?
Article
MSFT Technical Analysis: Short signal for the short term when RSI is overbought🚨 AI TRADE ALERT 🔴 SHORT MSFTUSDT ⭐ Confidence: 70/100 Entry: 474.1277 – 475.5523 Stop Loss: 486.3525 Take Profit: TP1: 465.63 TP2: 458.7225 TP3: 451.815 Risk/Reward: 1 : 2.0 Validity period: 6 hours - Start from 19:54 - 01:54 MSFT is in an overbought zone with the 1h RSI at 77.27 and the 4h RSI at 81.3. A short signal appears with entry 474.84, SL 486.3525, TP 451.815. Traders should be cautious about the risk of a rising market and manage capital strictly.

MSFT Technical Analysis: Short signal for the short term when RSI is overbought

🚨 AI TRADE ALERT
🔴 SHORT MSFTUSDT
⭐ Confidence: 70/100
Entry: 474.1277 – 475.5523
Stop Loss: 486.3525
Take Profit:
TP1: 465.63
TP2: 458.7225
TP3: 451.815
Risk/Reward: 1 : 2.0
Validity period: 6 hours - Start from 19:54 - 01:54
MSFT is in an overbought zone with the 1h RSI at 77.27 and the 4h RSI at 81.3. A short signal appears with entry 474.84, SL 486.3525, TP 451.815. Traders should be cautious about the risk of a rising market and manage capital strictly.
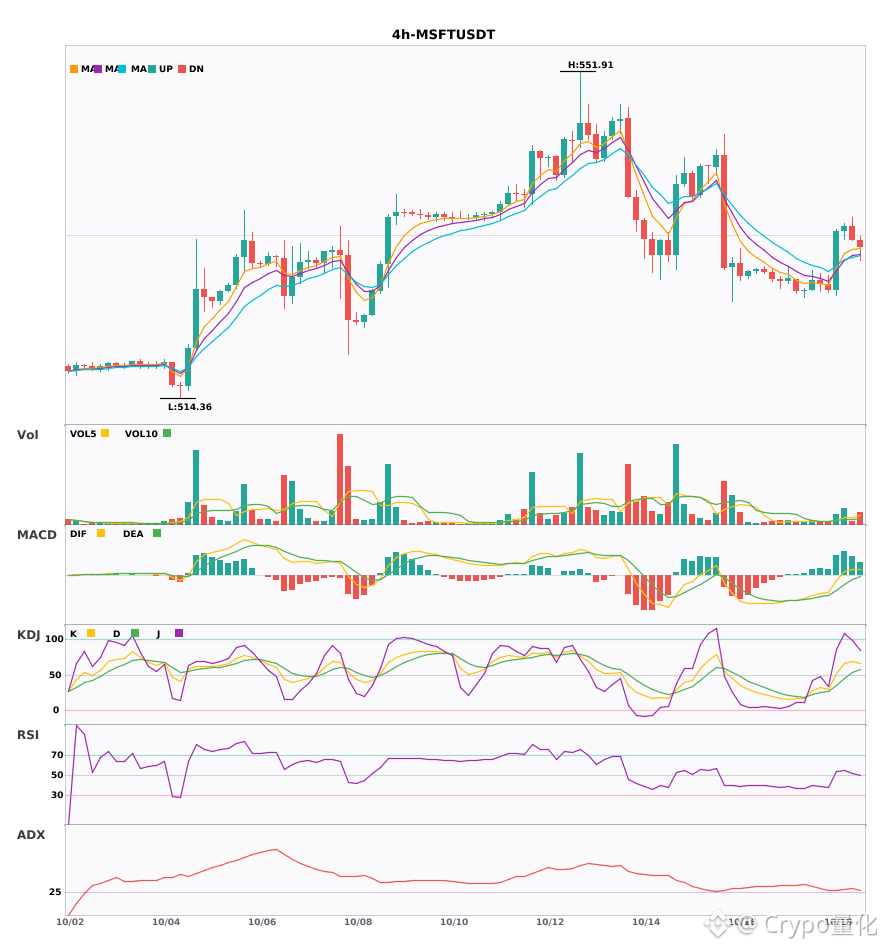
4-hour volume surge golden cross; the daily moving averages are in a bullish alignment. ORCL and MSFT are resonating to strengthen 🔥 ════════════════════ 🔴 $ORCL 4-hour bullish signal ⚠️ Technicals: Both the daily and 4-hour charts are pointing bullish. The MACD has just crossed upward into positive territory, with the golden cross expanding the red histogram bars. The 5, 8, and 13 moving averages are in bullish alignment and diverging upward. KDJ’s K has crossed above D but has not yet entered the overbought zone. Trading volume has expanded 3.4x. Multi-timeframe resonance looks bullish. ════════════════════ 🔴 $MSFT 4-hour bullish signal ⚠️ Technicals: The daily and 4-hour are both bullish—confirmation via resonance! The 4-hour MACD has just golden-crossed above zero; the red bars begin expanding in volume. The 5/8/13 moving averages have just formed a bullish alignment and are starting to diverge upward. KDJ’s K has crossed above D—strong, but not yet in the overbought zone. Volume is up by nearly 4x; momentum is very strong. ════════════════════ 🔔 Watch out for first-hand market moves and anomalies 🔔 #多周期共振 #ORCL #MSFT 📌 When trading, pay attention to whether the candlestick patterns match
4-hour volume surge golden cross; the daily moving averages are in a bullish alignment. ORCL and MSFT are resonating to strengthen 🔥

════════════════════
🔴 $ORCL 4-hour bullish signal
⚠️ Technicals: Both the daily and 4-hour charts are pointing bullish. The MACD has just crossed upward into positive territory, with the golden cross expanding the red histogram bars. The 5, 8, and 13 moving averages are in bullish alignment and diverging upward. KDJ’s K has crossed above D but has not yet entered the overbought zone. Trading volume has expanded 3.4x. Multi-timeframe resonance looks bullish.
════════════════════

🔴 $MSFT 4-hour bullish signal
⚠️ Technicals: The daily and 4-hour are both bullish—confirmation via resonance! The 4-hour MACD has just golden-crossed above zero; the red bars begin expanding in volume. The 5/8/13 moving averages have just formed a bullish alignment and are starting to diverge upward. KDJ’s K has crossed above D—strong, but not yet in the overbought zone. Volume is up by nearly 4x; momentum is very strong.
════════════════════

🔔 Watch out for first-hand market moves and anomalies 🔔
#多周期共振 #ORCL #MSFT
📌 When trading, pay attention to whether the candlestick patterns match
$SOXS and $MSFT 4-hour-level technical indicator resonance strengthens; comparative analysis of breakout strength 📈 $SOXS | 4-hour bullish signal ━━━━━━━━━━━━━━━━━━ Technical analysis: ADX rises to 28, confirming the trend; consider entry. The MACD histogram breaks above the zero axis, and bullish momentum strengthens. EMA5 crosses above EMA8, indicating a short-term bullish bias. Trading volume expands to 3.4x, with markedly active trading. Price change: 10.1200% 📈 $MSFT | 4-hour bullish signal ━━━━━━━━━━━━━━━━━━ Technical analysis: ADX (72) indicates an extremely strong trend; be cautious of overheating and possible pullback. A golden cross above the MACD zero line signals bullish momentum release. EMA5>8>13 forms a bullish arrangement. KDJ is strong (K78.5/D73.5). Volume expands to 3.9x. Price change: 1.1900% ━━━━━━━━━━━━━━━━━━ #技术分析 #SOXS #MSFT 📌 The above content is for reference only and does not constitute investment advice
$SOXS and $MSFT 4-hour-level technical indicator resonance strengthens; comparative analysis of breakout strength

📈 $SOXS | 4-hour bullish signal
━━━━━━━━━━━━━━━━━━
Technical analysis: ADX rises to 28, confirming the trend; consider entry. The MACD histogram breaks above the zero axis, and bullish momentum strengthens. EMA5 crosses above EMA8, indicating a short-term bullish bias. Trading volume expands to 3.4x, with markedly active trading.
Price change: 10.1200%

📈 $MSFT | 4-hour bullish signal
━━━━━━━━━━━━━━━━━━
Technical analysis: ADX (72) indicates an extremely strong trend; be cautious of overheating and possible pullback. A golden cross above the MACD zero line signals bullish momentum release. EMA5>8>13 forms a bullish arrangement. KDJ is strong (K78.5/D73.5). Volume expands to 3.9x.
Price change: 1.1900%

━━━━━━━━━━━━━━━━━━
#技术分析 #SOXS #MSFT
📌 The above content is for reference only and does not constitute investment advice
4-hour Double-Cannon! Bullish Signals for SOXS and MSFT Light Up Together 🔥 ════════════════════ 🔴 $SOXS 4 hours Bullish Signal ⚠️ Technicals: ADX is nearing 28— the trend is about to emerge. The MACD’s DIF has just crossed above the zero line, clearly turning bullish. The 5-day moving average has crossed above the 8-day line, and the short-term trend has turned bullish as well. Trading volume suddenly expanded by more than 3x. ════════════════════ 🔴 $MSFT 4 hours Bullish Signal ⚠️ Technicals: ADX has surged to 72—the trend is maxed out; be careful of an overheating pullback. MACD forms a golden cross above the zero line, with the uptrend gaining strength. Bullish moving-average alignment: 5 crosses above 8 crosses above 13, and they’re spreading upward. KDJ is at 78—strong, but not overbought. Volume is up 3.9x, and the move has exploded. ════════════════════ 🔔 Watch for first-hand market moves and anomalies 🔔 #技术分析 #SOXS #MSFT 📌 When trading, pay attention to whether the candlestick pattern matches
4-hour Double-Cannon! Bullish Signals for SOXS and MSFT Light Up Together 🔥

════════════════════
🔴 $SOXS 4 hours Bullish Signal
⚠️ Technicals: ADX is nearing 28— the trend is about to emerge. The MACD’s DIF has just crossed above the zero line, clearly turning bullish. The 5-day moving average has crossed above the 8-day line, and the short-term trend has turned bullish as well. Trading volume suddenly expanded by more than 3x.
════════════════════

🔴 $MSFT 4 hours Bullish Signal
⚠️ Technicals: ADX has surged to 72—the trend is maxed out; be careful of an overheating pullback. MACD forms a golden cross above the zero line, with the uptrend gaining strength. Bullish moving-average alignment: 5 crosses above 8 crosses above 13, and they’re spreading upward. KDJ is at 78—strong, but not overbought. Volume is up 3.9x, and the move has exploded.
════════════════════

🔔 Watch for first-hand market moves and anomalies 🔔
#技术分析 #SOXS #MSFT
📌 When trading, pay attention to whether the candlestick pattern matches
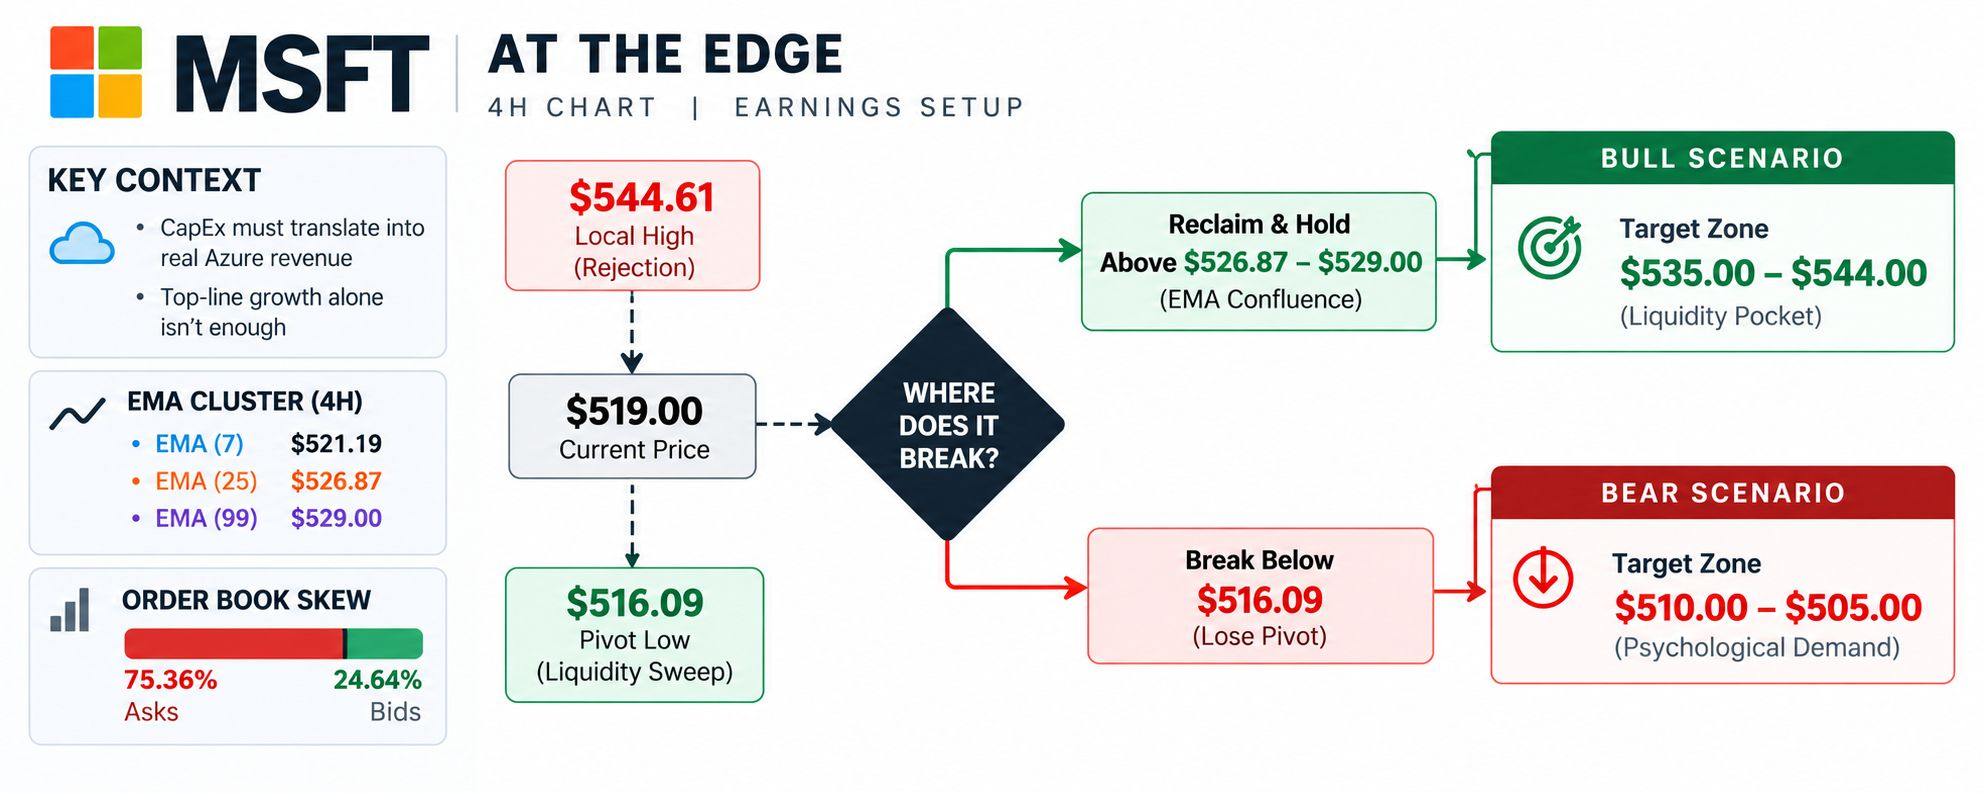
$MSFTB #MSFT In a strong market trend, pullbacks often reveal the real buying support more clearly than an accelerating rally. The current 1-hour change is +0.03% and the 24-hour change is +1.71%; it needs to be determined whether this is normal cooling off or a weakening structure. With the current 1-hour change at +0.03% and the 24-hour change at +1.71%, the two time frames have not formed a sufficiently clear aligned move. In a range-bound market, chasing strength and selling weakness has a low margin for error. It is better to use the upper boundary to confirm direction, the lower boundary to confirm support, and the midline only as the dividing line between strength and weakness. Short-term initiative has not been clearly broken yet. 465.625 is the primary standard for judging the quality of a retest. Holding above it and then testing 471.33 again would count as relatively strong consolidation; if price breaks below the midline and stays there, then the focus of observation should be lowered to 459.92. In execution, set clear conditions: after breaking above 471.33, confirmation is needed rather than chasing an instant surge; after dipping to 459.92, watch whether it can quickly recover rather than blindly buying the drop; when the middle area does not offer enough risk-reward, waiting is also part of the strategy. Existing positions can be managed in stages according to key levels to avoid making one all-or-nothing judgment; those without positions should wait for a breakout confirmation or a successful retest and stabilization. For U.S. stock instruments, also pay attention to volatility caused by trading session changes. The plan should be based on price conditions, not emotion. The focus of short-term positions is not to predict every candlestick, but to make entries, reductions, and exits all have a basis. Do less when there is no confirmation; when a key level fails, redo the plan. First control the risk of each trade, then talk about the subsequent room for movement. I’ll come back later to review this chart and see which path the market takes first. Leave your direction first. Quantitative hedging arbitrage bot, those who understand, come into the chat.
$MSFTB #MSFT In a strong market trend, pullbacks often reveal the real buying support more clearly than an accelerating rally. The current 1-hour change is +0.03% and the 24-hour change is +1.71%; it needs to be determined whether this is normal cooling off or a weakening structure.

With the current 1-hour change at +0.03% and the 24-hour change at +1.71%, the two time frames have not formed a sufficiently clear aligned move. In a range-bound market, chasing strength and selling weakness has a low margin for error. It is better to use the upper boundary to confirm direction, the lower boundary to confirm support, and the midline only as the dividing line between strength and weakness.

Short-term initiative has not been clearly broken yet. 465.625 is the primary standard for judging the quality of a retest. Holding above it and then testing 471.33 again would count as relatively strong consolidation; if price breaks below the midline and stays there, then the focus of observation should be lowered to 459.92.

In execution, set clear conditions: after breaking above 471.33, confirmation is needed rather than chasing an instant surge; after dipping to 459.92, watch whether it can quickly recover rather than blindly buying the drop; when the middle area does not offer enough risk-reward, waiting is also part of the strategy.

Existing positions can be managed in stages according to key levels to avoid making one all-or-nothing judgment; those without positions should wait for a breakout confirmation or a successful retest and stabilization. For U.S. stock instruments, also pay attention to volatility caused by trading session changes. The plan should be based on price conditions, not emotion.

The focus of short-term positions is not to predict every candlestick, but to make entries, reductions, and exits all have a basis. Do less when there is no confirmation; when a key level fails, redo the plan. First control the risk of each trade, then talk about the subsequent room for movement.

I’ll come back later to review this chart and see which path the market takes first. Leave your direction first. Quantitative hedging arbitrage bot, those who understand, come into the chat.
$MSFTB #MSFT In a strong market trend, pullbacks often reveal the true buying support better than an accelerated rally. The current 1-hour change is +0.14%, and the 24-hour change is +1.68%. We need to judge whether this is a normal cooling-off or a sign that the structure is weakening. The current price is near the upper end of the past 24-hour range, with +0.14% over 1 hour and +1.68% over 24 hours. At elevated levels, the most important thing is to confirm the acceptance after a breakout: if price can stay above the upper band, it means the market accepts a higher range; if it only briefly pierces it and quickly falls back, we need to guard against a false breakout. The short-term initiative has not been clearly damaged yet, and 465.625 is the primary standard for judging the quality of a pullback. If it holds and then retests 471.33, that counts as a relatively strong consolidation; if it breaks below the midline and stays there, then the focus of observation should shift down to 459.92. My view is not to bet on just one direction. If price breaks above 471.33 and can hold it, that means the upper room has reopened; if it breaks below 459.92 and a rebound fails, that means the structure is weakening further; if it trades between the two, keep watching the closing behavior on both sides of 465.625. Position management should distinguish between medium-term and short-term holdings. For existing medium-term positions, first look at whether the structure has been damaged, and do not let a single 1-hour candlestick affect the view repeatedly; short-term positions should be executed around support, resistance, and closing confirmation. Those without positions do not need to chase in the middle of the range; waiting for a clearer location is usually more advantageous. Risk control still comes before the conclusion: only act when conditions appear, and re-evaluate promptly if price invalidates the setup; the greater the volatility, the more restrained each position should be. The above is a market scenario analysis based on the current 1-hour and 24-hour data, and does not constitute a promise of profit. I’ll note these two levels first and come back later to check the chart. Do you think a breakout comes first, or a pullback comes first? If you know about quantitative hedging arbitrage robots, join the chat room
$MSFTB #MSFT In a strong market trend, pullbacks often reveal the true buying support better than an accelerated rally. The current 1-hour change is +0.14%, and the 24-hour change is +1.68%. We need to judge whether this is a normal cooling-off or a sign that the structure is weakening.

The current price is near the upper end of the past 24-hour range, with +0.14% over 1 hour and +1.68% over 24 hours. At elevated levels, the most important thing is to confirm the acceptance after a breakout: if price can stay above the upper band, it means the market accepts a higher range; if it only briefly pierces it and quickly falls back, we need to guard against a false breakout.

The short-term initiative has not been clearly damaged yet, and 465.625 is the primary standard for judging the quality of a pullback. If it holds and then retests 471.33, that counts as a relatively strong consolidation; if it breaks below the midline and stays there, then the focus of observation should shift down to 459.92.

My view is not to bet on just one direction. If price breaks above 471.33 and can hold it, that means the upper room has reopened; if it breaks below 459.92 and a rebound fails, that means the structure is weakening further; if it trades between the two, keep watching the closing behavior on both sides of 465.625.

Position management should distinguish between medium-term and short-term holdings. For existing medium-term positions, first look at whether the structure has been damaged, and do not let a single 1-hour candlestick affect the view repeatedly; short-term positions should be executed around support, resistance, and closing confirmation. Those without positions do not need to chase in the middle of the range; waiting for a clearer location is usually more advantageous.

Risk control still comes before the conclusion: only act when conditions appear, and re-evaluate promptly if price invalidates the setup; the greater the volatility, the more restrained each position should be. The above is a market scenario analysis based on the current 1-hour and 24-hour data, and does not constitute a promise of profit.

I’ll note these two levels first and come back later to check the chart. Do you think a breakout comes first, or a pullback comes first? If you know about quantitative hedging arbitrage robots, join the chat room
·
--
Bullish
📊 Microsoft (MSFT) Analysis Microsoft remains one of the strongest companies in the market, supported by three key growth drivers: 🚀 Artificial Intelligence: Continued investment in AI and Copilot is creating new revenue opportunities across its ecosystem. ☁️ Azure Cloud: Cloud services remain a major source of long-term growth as businesses continue their digital transformation. 💼 Financial Strength: Microsoft consistently delivers solid cash flow, strong earnings, and maintains one of the healthiest balance sheets in the tech sector. From a technical perspective, as long as the stock continues to hold key support levels, the overall trend remains constructive. However, investors should keep an eye on upcoming earnings, macroeconomic data, and Federal Reserve decisions, as these can influence short-term price action. 📌 Long-term investors often focus on Microsoft's innovation and recurring revenue model rather than short-term market volatility. 👇 Do you think Microsoft can outperform the market over the next 12 months? Share your target price and why! #Microsoft #MSFT $MSFTB {spot}(MSFTBUSDT)
📊 Microsoft (MSFT) Analysis
Microsoft remains one of the strongest companies in the market, supported by three key growth drivers:

🚀 Artificial Intelligence: Continued investment in AI and Copilot is creating new revenue opportunities across its ecosystem.

☁️ Azure Cloud: Cloud services remain a major source of long-term growth as businesses continue their digital transformation.

💼 Financial Strength: Microsoft consistently delivers solid cash flow, strong earnings, and maintains one of the healthiest balance sheets in the tech sector.
From a technical perspective, as long as the stock continues to hold key support levels, the overall trend remains constructive. However, investors should keep an eye on upcoming earnings, macroeconomic data, and Federal Reserve decisions, as these can influence short-term price action.

📌 Long-term investors often focus on Microsoft's innovation and recurring revenue model rather than short-term market volatility.

👇 Do you think Microsoft can outperform the market over the next 12 months? Share your target price and why!
#Microsoft #MSFT $MSFTB
$MSFTB #MSFT If I can only keep one observation price for this round, I would choose 465.625. The current price is 469.58; over the past 1 hour -0.18%, and over the past 24 hours +1.36%. The gain/loss relative to the midline can help filter a lot of intraday noise. The price hasn’t yet reclaimed 465.625. For now, treat the current bounce as weak repair; real strength depends on stable closes that prove it. If it turns weak again, 459.92 is the next level to observe whether the sell pressure is fading. The current price is near the upper edge of the last 24-hour range: 1 hour -0.18%, 24 hours +1.36%. At the highs, the most important thing is to confirm “acceptance” after the breakout: if price can stay above the upper edge, it suggests the market recognizes a higher range; if it only briefly pierces and then quickly reclaims, be wary of a false breakout. There are three ways to handle the next path: if it moves up and holds effectively at/above 471.33, wait for a pullback that doesn’t break before reassessing for continuation; if it breaks down below 459.92, prioritize risk control and wait for new support; if it continues to oscillate around 465.625, treat it as a range turnover level and avoid repeatedly chasing direction from the middle. Position management should distinguish between swing (medium/long-term) and short-term trades. For existing swing positions, first check whether the structure is broken; don’t let repeated reactions from a single 1-hour candlestick keep swaying you. Short-term positions should be executed around support, resistance, and close confirmation. If you’re currently in cash, you don’t need to chase price in the middle of the range—waiting for clearer levels is usually an advantage. Next, I will focus on tracking whether 465.625 holds or fails. Do you lean more toward testing 471.33 first, or returning to 459.92 first? Feel free to share your judgment and reasoning. If you have positions, focus on defense; if you’re in cash, wait for confirmation. The answer can differ even on the same chart—what are you right now? Do you know about quantitative hedging/arbitrage trading robots? Come join the chat.
$MSFTB #MSFT If I can only keep one observation price for this round, I would choose 465.625. The current price is 469.58; over the past 1 hour -0.18%, and over the past 24 hours +1.36%. The gain/loss relative to the midline can help filter a lot of intraday noise.

The price hasn’t yet reclaimed 465.625. For now, treat the current bounce as weak repair; real strength depends on stable closes that prove it. If it turns weak again, 459.92 is the next level to observe whether the sell pressure is fading.

The current price is near the upper edge of the last 24-hour range: 1 hour -0.18%, 24 hours +1.36%. At the highs, the most important thing is to confirm “acceptance” after the breakout: if price can stay above the upper edge, it suggests the market recognizes a higher range; if it only briefly pierces and then quickly reclaims, be wary of a false breakout.

There are three ways to handle the next path: if it moves up and holds effectively at/above 471.33, wait for a pullback that doesn’t break before reassessing for continuation; if it breaks down below 459.92, prioritize risk control and wait for new support; if it continues to oscillate around 465.625, treat it as a range turnover level and avoid repeatedly chasing direction from the middle.

Position management should distinguish between swing (medium/long-term) and short-term trades. For existing swing positions, first check whether the structure is broken; don’t let repeated reactions from a single 1-hour candlestick keep swaying you. Short-term positions should be executed around support, resistance, and close confirmation. If you’re currently in cash, you don’t need to chase price in the middle of the range—waiting for clearer levels is usually an advantage.

Next, I will focus on tracking whether 465.625 holds or fails. Do you lean more toward testing 471.33 first, or returning to 459.92 first? Feel free to share your judgment and reasoning.

If you have positions, focus on defense; if you’re in cash, wait for confirmation. The answer can differ even on the same chart—what are you right now? Do you know about quantitative hedging/arbitrage trading robots? Come join the chat.
$MSFT.US {stock_us}(MSFT.US) MSFT is around $464.72, with a market cap of roughly $3.46 trillion and a P/E of about 27.7. BULLISH FACTORS • Strong Azure/cloud growth • Microsoft 365 + Copilot monetization • Massive enterprise customer base • AI increasing demand for cloud infrastructure • Diversified revenue across software, cloud, security & gaming #MSFT #OpenAIFindsMoreAgentsEscapedContainment
$MSFT.US


MSFT is around $464.72, with a market cap of roughly $3.46 trillion and a P/E of about 27.7.

BULLISH FACTORS
• Strong Azure/cloud growth
• Microsoft 365 + Copilot monetization
• Massive enterprise customer base
• AI increasing demand for cloud infrastructure
• Diversified revenue across software, cloud, security & gaming
#MSFT #OpenAIFindsMoreAgentsEscapedContainment
MSFTUS+4.01%
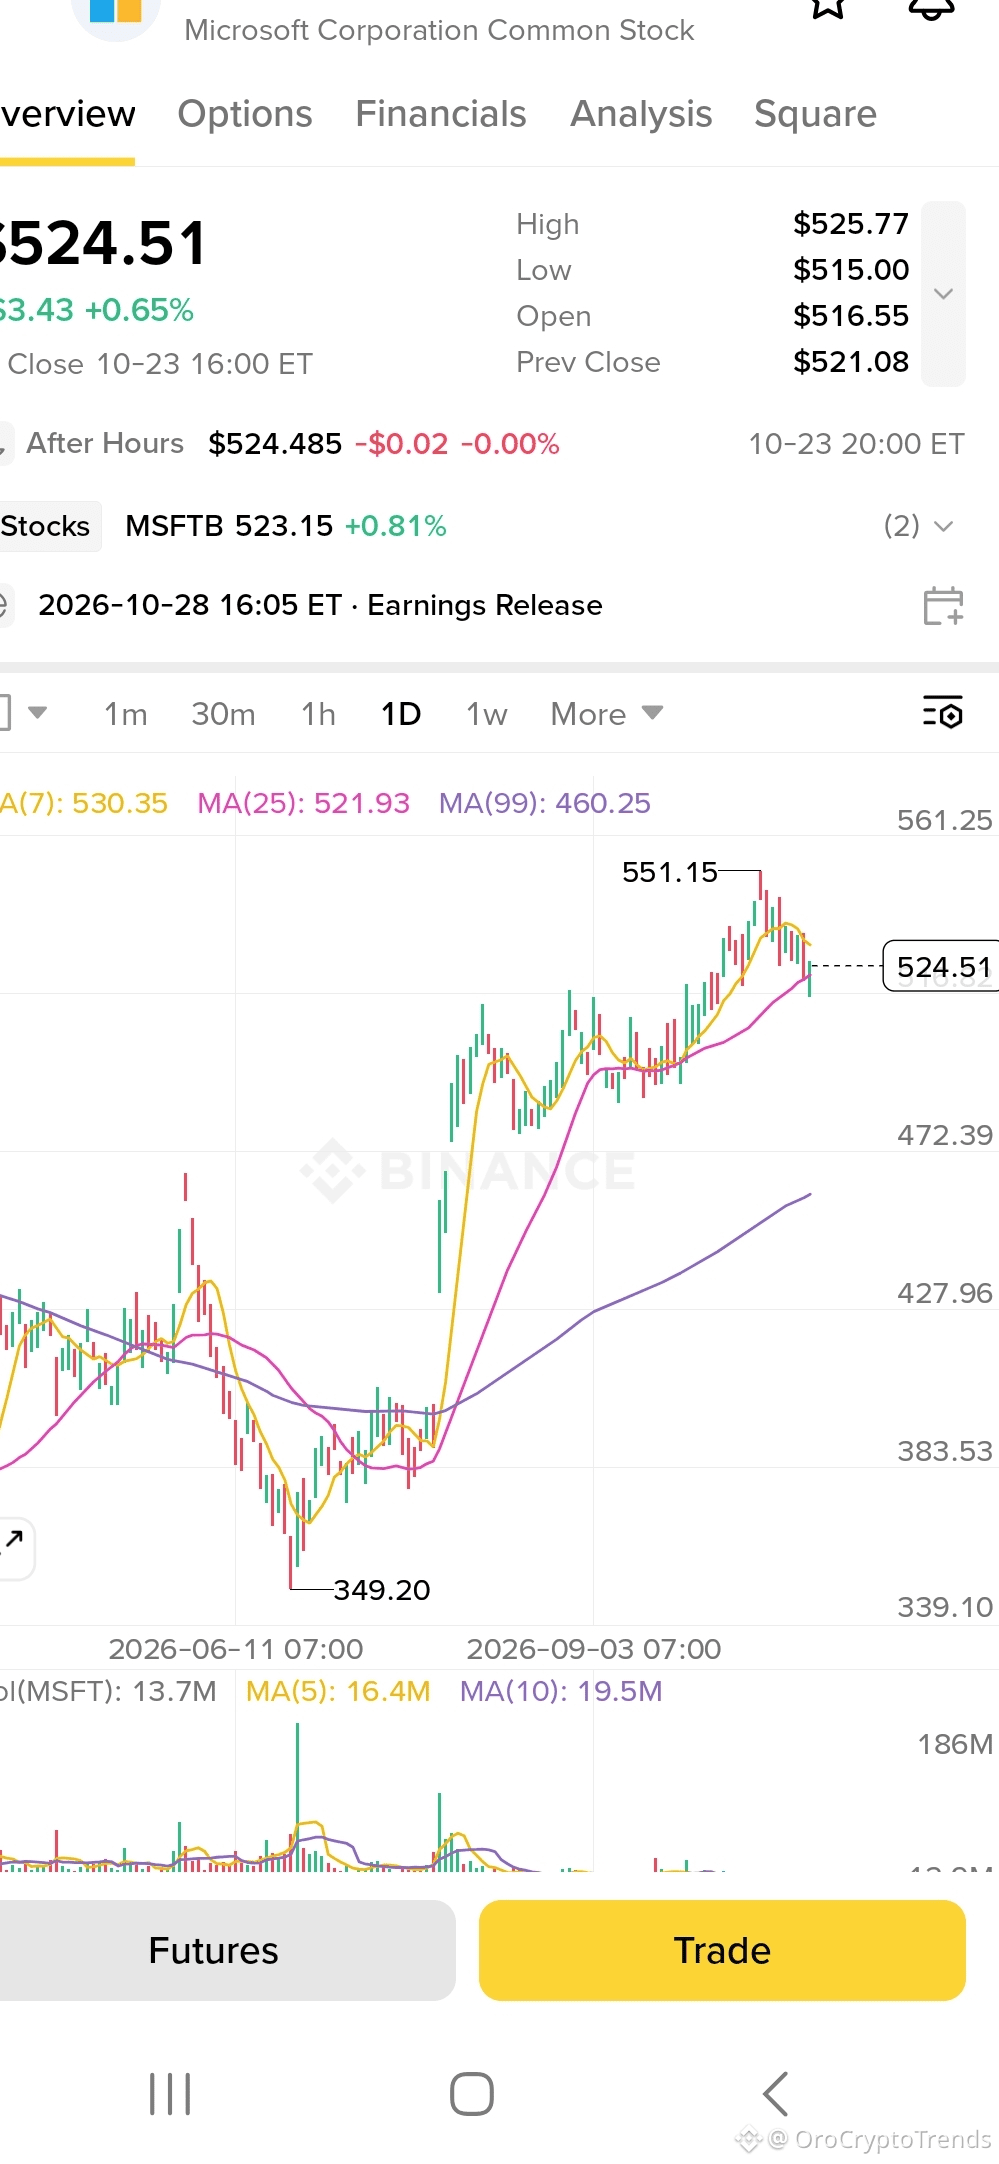
🚨 $MSFT JUST PROVED THAT MOMENTUM IS THE MARKET'S GRAVITY — ONE BREAKOUT CAN FUEL THE NEXT LEG! 💥 A 15% blast on Day 1 followed by another 3%? That's not noise, that's conviction. 📊 When buyers step in hard on a breakout day and actually hold, the market re-prices the asset. Smart money sees the shift and adds fuel to the fire. 🌊 The same fractal plays out in crypto every cycle. If you wait for that first green candle to confirm, you stop chasing and start riding. 💡 A powerful single-day move isn't a dead cat bounce when follow-through arrives — it's a trend being born. Always let the second push verify, then manage your risk like a pro. 💬 Do you jump on the first breakout or wait for the confirmation candle? 👇 ⚠️ Not financial advice. Always manage your risk. 🛡️ 🏷️ #MSFT #Momentum #Breakout #Trading #Crypto 🔥 🎯
🚨 $MSFT JUST PROVED THAT MOMENTUM IS THE MARKET'S GRAVITY — ONE BREAKOUT CAN FUEL THE NEXT LEG! 💥

A 15% blast on Day 1 followed by another 3%? That's not noise, that's conviction. 📊 When buyers step in hard on a breakout day and actually hold, the market re-prices the asset. Smart money sees the shift and adds fuel to the fire. 🌊

The same fractal plays out in crypto every cycle. If you wait for that first green candle to confirm, you stop chasing and start riding. 💡 A powerful single-day move isn't a dead cat bounce when follow-through arrives — it's a trend being born. Always let the second push verify, then manage your risk like a pro.

💬 Do you jump on the first breakout or wait for the confirmation candle? 👇

⚠️ Not financial advice. Always manage your risk. 🛡️

🏷️ #MSFT #Momentum #Breakout #Trading #Crypto

🔥 🎯
Log in to explore more content
Join global crypto users on Binance Square
⚡️ Get latest and useful information about crypto.
💬 Trusted by the world’s largest crypto exchange.
👍 Discover real insights from verified creators.
Email / Phone number