
#btc
btc
9.5G views
62M Discussing
Hot
Latest


🟡 Bitcoin price wobbles ahead of Fed’s rate decision
Bitcoin (BTC) dipped as low as $59,500 on Binance ahead of tomorrow’s Federal Open Market Committee (FOMC) meeting. Market participants are bracing for a hawkish stance from the Federal Reserve (Fed), with expectations set for unchanged interest rates.
The CME FedWatch Tool indicates a mere 4.4% of economists predict a rate cut—the first in over a decade—while a dominant 95.6% anticipate rates to hold steady between 525-550 basis points.
According to The Kobeissi Letter, current market data indicates a 36% probability that there will be no interest rate cuts this year. Four months ago, the likelihood of maintaining current rates was only about 3%.
Expectations have also shifted to just one reduction this year. Previously, the market anticipated six rate cuts. Additionally, the probability of experiencing two or more rate cuts has diminished to 31%.
🔺 Stagflation risk
Amidst this financial climate, the US grapples with stagflation risks as inflation persists and economic growth slows.
The first quarter of 2024 saw GDP growth decelerate to 1.6%, falling short of the 2.2% forecast and down from the previous quarter’s 3.4%. Concurrently, the US Core PCE inflation index climbed from 2.0% to 3.7%.
Fed Chair Jerome Powell stated that recent data does not make the Fed more confident, suggesting a longer timeline to regain economic stability. He expressed belief in the adequacy of current policies to navigate the risks at hand, hinting at sustained high-interest rates without increases.
Bitcoin’s trajectory mirrored these economic uncertainties, dropping below $62,000 earlier in the week due to renewed stagflation worries.
A brief rally above $64,000 occurred with the launch of spot Bitcoin and Ethereum ETFs in Hong Kong yesterday, but the momentum was short-lived as investor caution set in ahead of the Fed’s key decision.
$BTC #BTC #Bitcoin
🟡 Bitcoin price wobbles ahead of Fed’s rate decision
Bitcoin (BTC) dipped as low as $59,500 on Binance ahead of tomorrow’s Federal Open Market Committee (FOMC) meeting. Market participants are bracing for a hawkish stance from the Federal Reserve (Fed), with expectations set for unchanged interest rates.
The CME FedWatch Tool indicates a mere 4.4% of economists predict a rate cut—the first in over a decade—while a dominant 95.6% anticipate rates to hold steady between 525-550 basis points.
According to The Kobeissi Letter, current market data indicates a 36% probability that there will be no interest rate cuts this year. Four months ago, the likelihood of maintaining current rates was only about 3%.
Expectations have also shifted to just one reduction this year. Previously, the market anticipated six rate cuts. Additionally, the probability of experiencing two or more rate cuts has diminished to 31%.
🔺 Stagflation risk
Amidst this financial climate, the US grapples with stagflation risks as inflation persists and economic growth slows.
The first quarter of 2024 saw GDP growth decelerate to 1.6%, falling short of the 2.2% forecast and down from the previous quarter’s 3.4%. Concurrently, the US Core PCE inflation index climbed from 2.0% to 3.7%.
Fed Chair Jerome Powell stated that recent data does not make the Fed more confident, suggesting a longer timeline to regain economic stability. He expressed belief in the adequacy of current policies to navigate the risks at hand, hinting at sustained high-interest rates without increases.
Bitcoin’s trajectory mirrored these economic uncertainties, dropping below $62,000 earlier in the week due to renewed stagflation worries.
A brief rally above $64,000 occurred with the launch of spot Bitcoin and Ethereum ETFs in Hong Kong yesterday, but the momentum was short-lived as investor caution set in ahead of the Fed’s key decision.
$BTC #BTC #Bitcoin
Bitcoin (BTC) dipped as low as $59,500 on Binance ahead of tomorrow’s Federal Open Market Committee (FOMC) meeting. Market participants are bracing for a hawkish stance from the Federal Reserve (Fed), with expectations set for unchanged interest rates.
The CME FedWatch Tool indicates a mere 4.4% of economists predict a rate cut—the first in over a decade—while a dominant 95.6% anticipate rates to hold steady between 525-550 basis points.
According to The Kobeissi Letter, current market data indicates a 36% probability that there will be no interest rate cuts this year. Four months ago, the likelihood of maintaining current rates was only about 3%.
Expectations have also shifted to just one reduction this year. Previously, the market anticipated six rate cuts. Additionally, the probability of experiencing two or more rate cuts has diminished to 31%.
🔺 Stagflation risk
Amidst this financial climate, the US grapples with stagflation risks as inflation persists and economic growth slows.
The first quarter of 2024 saw GDP growth decelerate to 1.6%, falling short of the 2.2% forecast and down from the previous quarter’s 3.4%. Concurrently, the US Core PCE inflation index climbed from 2.0% to 3.7%.
Fed Chair Jerome Powell stated that recent data does not make the Fed more confident, suggesting a longer timeline to regain economic stability. He expressed belief in the adequacy of current policies to navigate the risks at hand, hinting at sustained high-interest rates without increases.
Bitcoin’s trajectory mirrored these economic uncertainties, dropping below $62,000 earlier in the week due to renewed stagflation worries.
A brief rally above $64,000 occurred with the launch of spot Bitcoin and Ethereum ETFs in Hong Kong yesterday, but the momentum was short-lived as investor caution set in ahead of the Fed’s key decision.
$BTC #BTC #Bitcoin

138
58
403
301.3k



$BTC Reclaims $60K After $2.5B Flush — Is the Worst Behind Us? 🚀
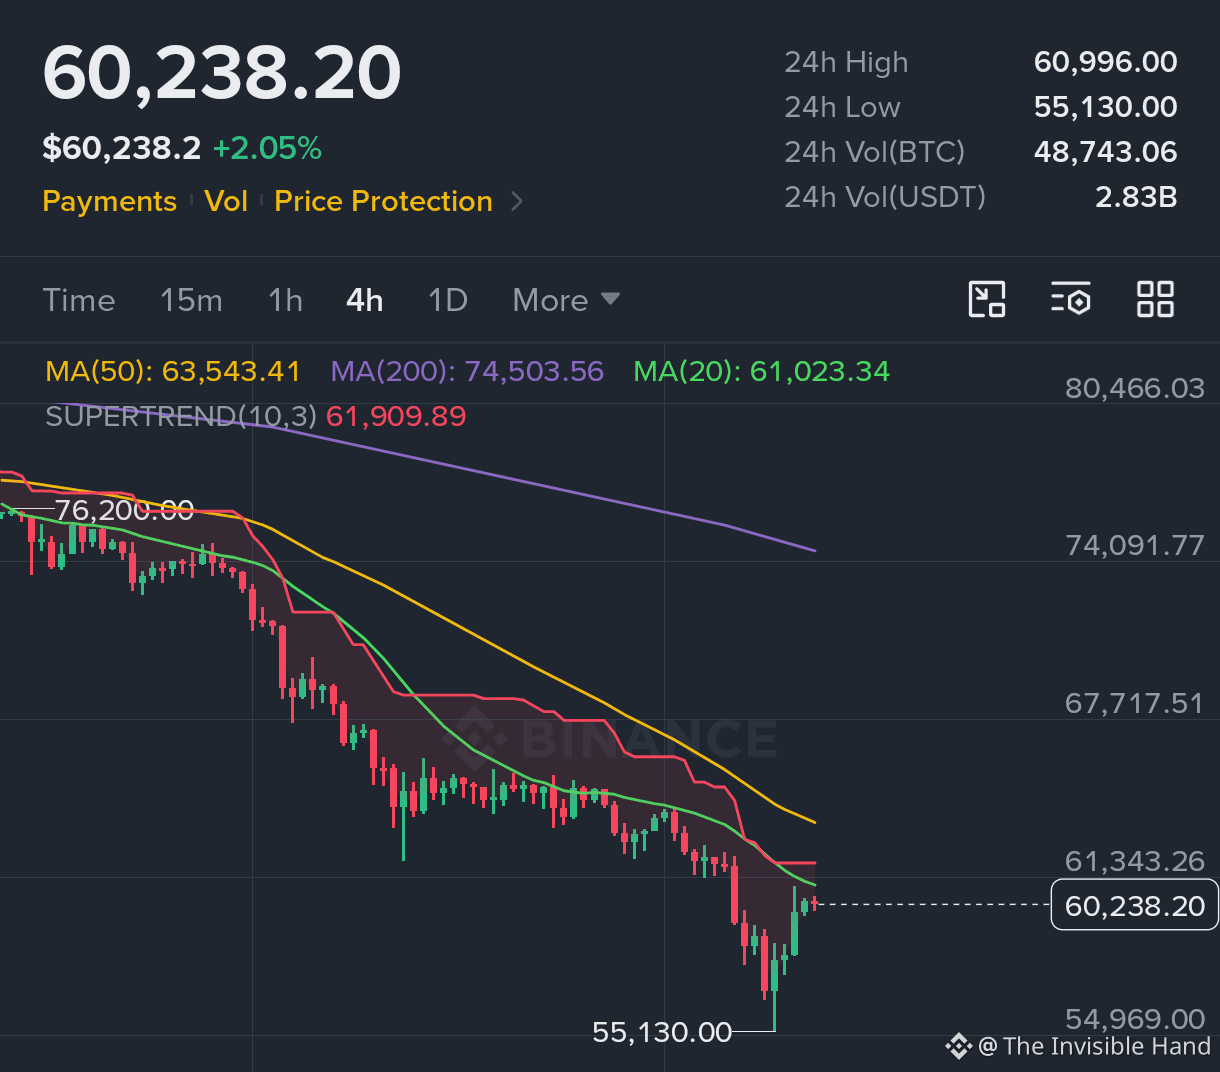
What a rollercoaster 24 hours in crypto! After dipping to a fresh 2026 low near $55,130 (levels not seen since September 2024), Bitcoin staged an impressive +9% intraday recovery to reclaim the key $60,200–$60,300 zone.
{spot}(BTCUSDT)
What triggered the shakeout?
• Heavy institutional rotation, with spot Bitcoin ETFs seeing over $3.4B in November outflows (including a record $541M single-day exit from IBIT).
• Macro headwinds and spillover from a sharp tech/AI stock correction.
Why the setup is starting to look interesting:
• Massive Leverage Flush: Over $2.5B in liquidations wiped out nearly 360,000 over-leveraged positions in 24 hours, clearing major sell-side liquidity clusters below $60K.
• Peak Capitulation: The Fear & Greed Index hit an all-time low reading of 5 earlier today. Historically, maximum pessimism and deep oversold readings mark major local bottoms.
• Altcoins Showing Strength: Leading alts like $SOL , $ETH , and $XRP are bouncing even harder than BTC today, signaling that buyers are stepping back in.
{spot}(ETHUSDT)
My Game Plan:
Clearing out excess leverage is healthy for the long-term trend. Holding above $60K is a great first step, though I want to see a confirmed daily close above $62K (estimated mining cost) and slowing ETF outflows before calling a full trend reversal.
Keep your emotions in check, scale in smartly, and stick to your risk management! 📈
Are you buying this dip or waiting for $62K? Drop your thoughts below! 👇
{spot}(SOLUSDT)
#BTC #Bitcoin #CryptoMarket #BinanceSquare #TradingStrategy
$BTC Reclaims $60K After $2.5B Flush — Is the Worst Behind Us? 🚀
What a rollercoaster 24 hours in crypto! After dipping to a fresh 2026 low near $55,130 (levels not seen since September 2024), Bitcoin staged an impressive +9% intraday recovery to reclaim the key $60,200–$60,300 zone.
What triggered the shakeout?
• Heavy institutional rotation, with spot Bitcoin ETFs seeing over $3.4B in November outflows (including a record $541M single-day exit from IBIT).
• Macro headwinds and spillover from a sharp tech/AI stock correction.
Why the setup is starting to look interesting:
• Massive Leverage Flush: Over $2.5B in liquidations wiped out nearly 360,000 over-leveraged positions in 24 hours, clearing major sell-side liquidity clusters below $60K.
• Peak Capitulation: The Fear & Greed Index hit an all-time low reading of 5 earlier today. Historically, maximum pessimism and deep oversold readings mark major local bottoms.
• Altcoins Showing Strength: Leading alts like $SOL , $ETH , and $XRP are bouncing even harder than BTC today, signaling that buyers are stepping back in.
My Game Plan:
Clearing out excess leverage is healthy for the long-term trend. Holding above $60K is a great first step, though I want to see a confirmed daily close above $62K (estimated mining cost) and slowing ETF outflows before calling a full trend reversal.
Keep your emotions in check, scale in smartly, and stick to your risk management! 📈
Are you buying this dip or waiting for $62K? Drop your thoughts below! 👇
#BTC #Bitcoin #CryptoMarket #BinanceSquare #TradingStrategy
What a rollercoaster 24 hours in crypto! After dipping to a fresh 2026 low near $55,130 (levels not seen since September 2024), Bitcoin staged an impressive +9% intraday recovery to reclaim the key $60,200–$60,300 zone.
What triggered the shakeout?
• Heavy institutional rotation, with spot Bitcoin ETFs seeing over $3.4B in November outflows (including a record $541M single-day exit from IBIT).
• Macro headwinds and spillover from a sharp tech/AI stock correction.
Why the setup is starting to look interesting:
• Massive Leverage Flush: Over $2.5B in liquidations wiped out nearly 360,000 over-leveraged positions in 24 hours, clearing major sell-side liquidity clusters below $60K.
• Peak Capitulation: The Fear & Greed Index hit an all-time low reading of 5 earlier today. Historically, maximum pessimism and deep oversold readings mark major local bottoms.
• Altcoins Showing Strength: Leading alts like $SOL , $ETH , and $XRP are bouncing even harder than BTC today, signaling that buyers are stepping back in.
My Game Plan:
Clearing out excess leverage is healthy for the long-term trend. Holding above $60K is a great first step, though I want to see a confirmed daily close above $62K (estimated mining cost) and slowing ETF outflows before calling a full trend reversal.
Keep your emotions in check, scale in smartly, and stick to your risk management! 📈
Are you buying this dip or waiting for $62K? Drop your thoughts below! 👇
#BTC #Bitcoin #CryptoMarket #BinanceSquare #TradingStrategy
1
195

·
--
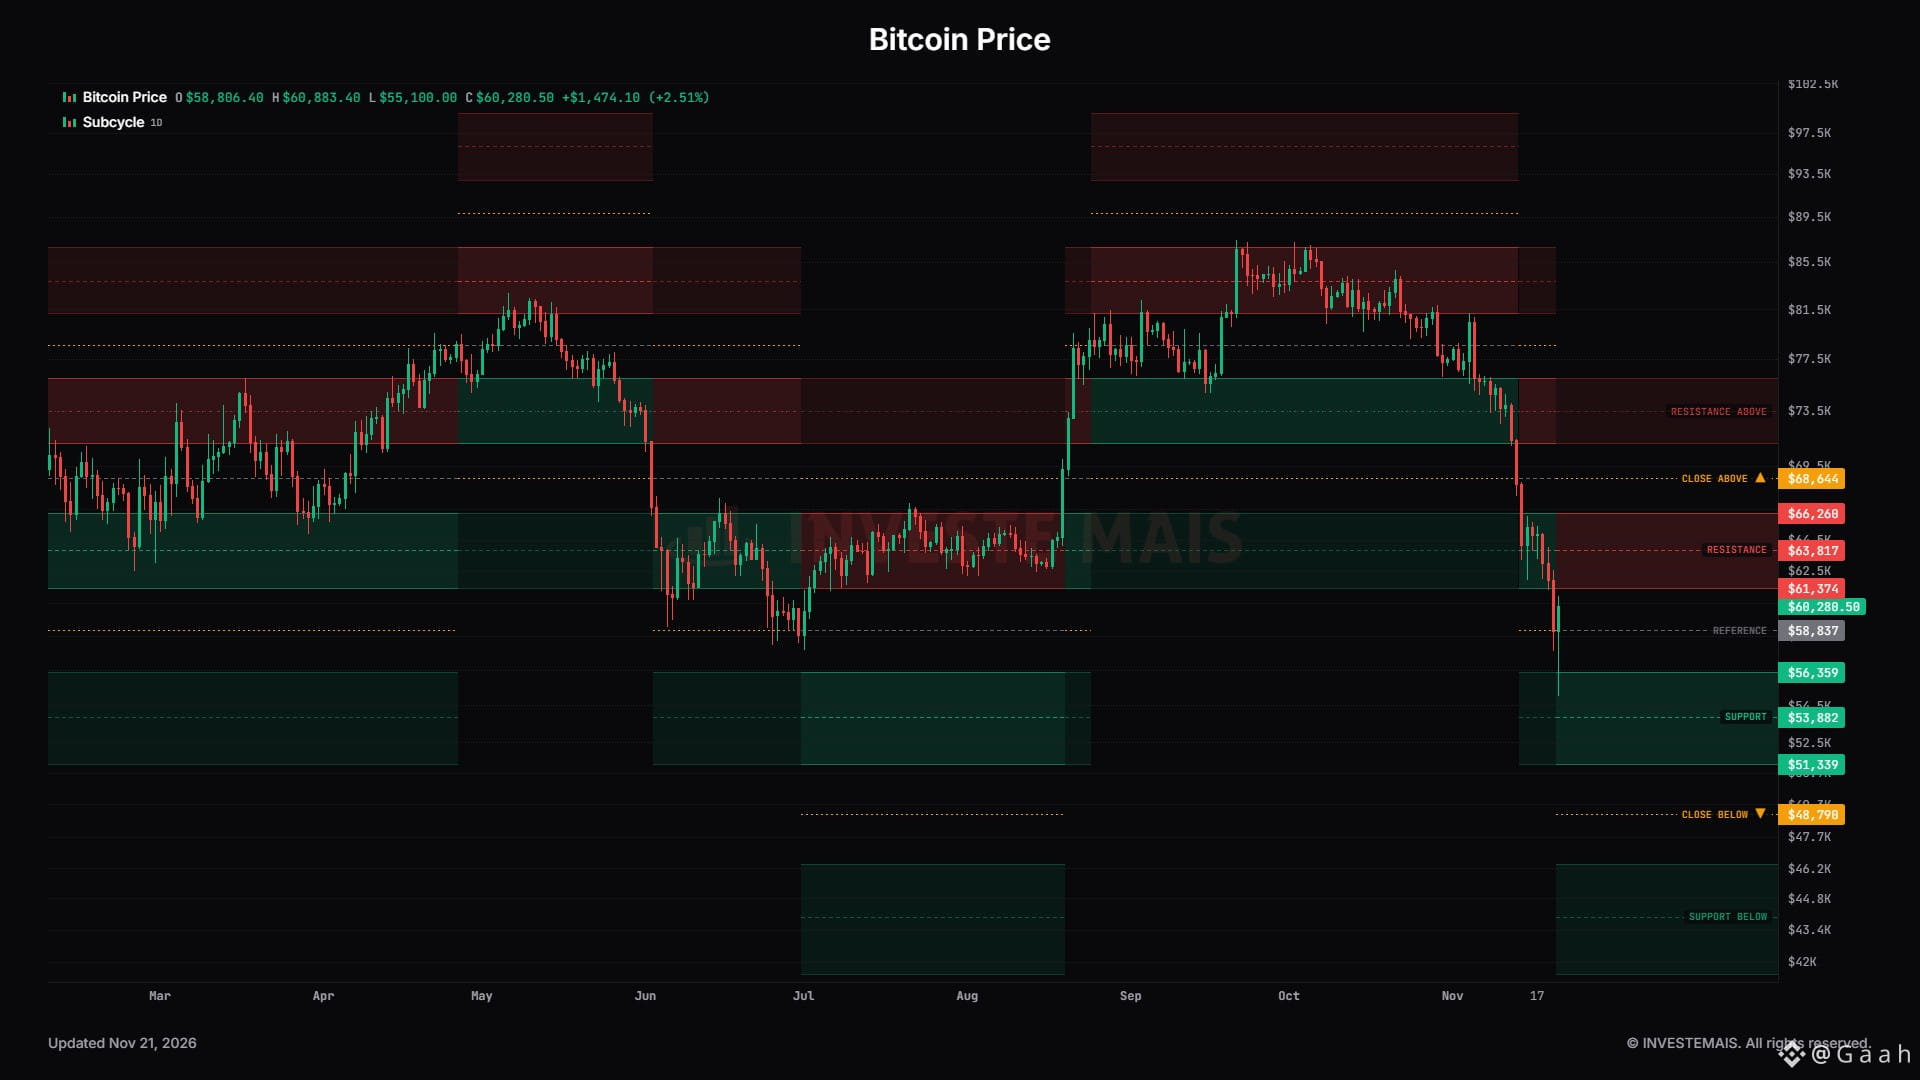
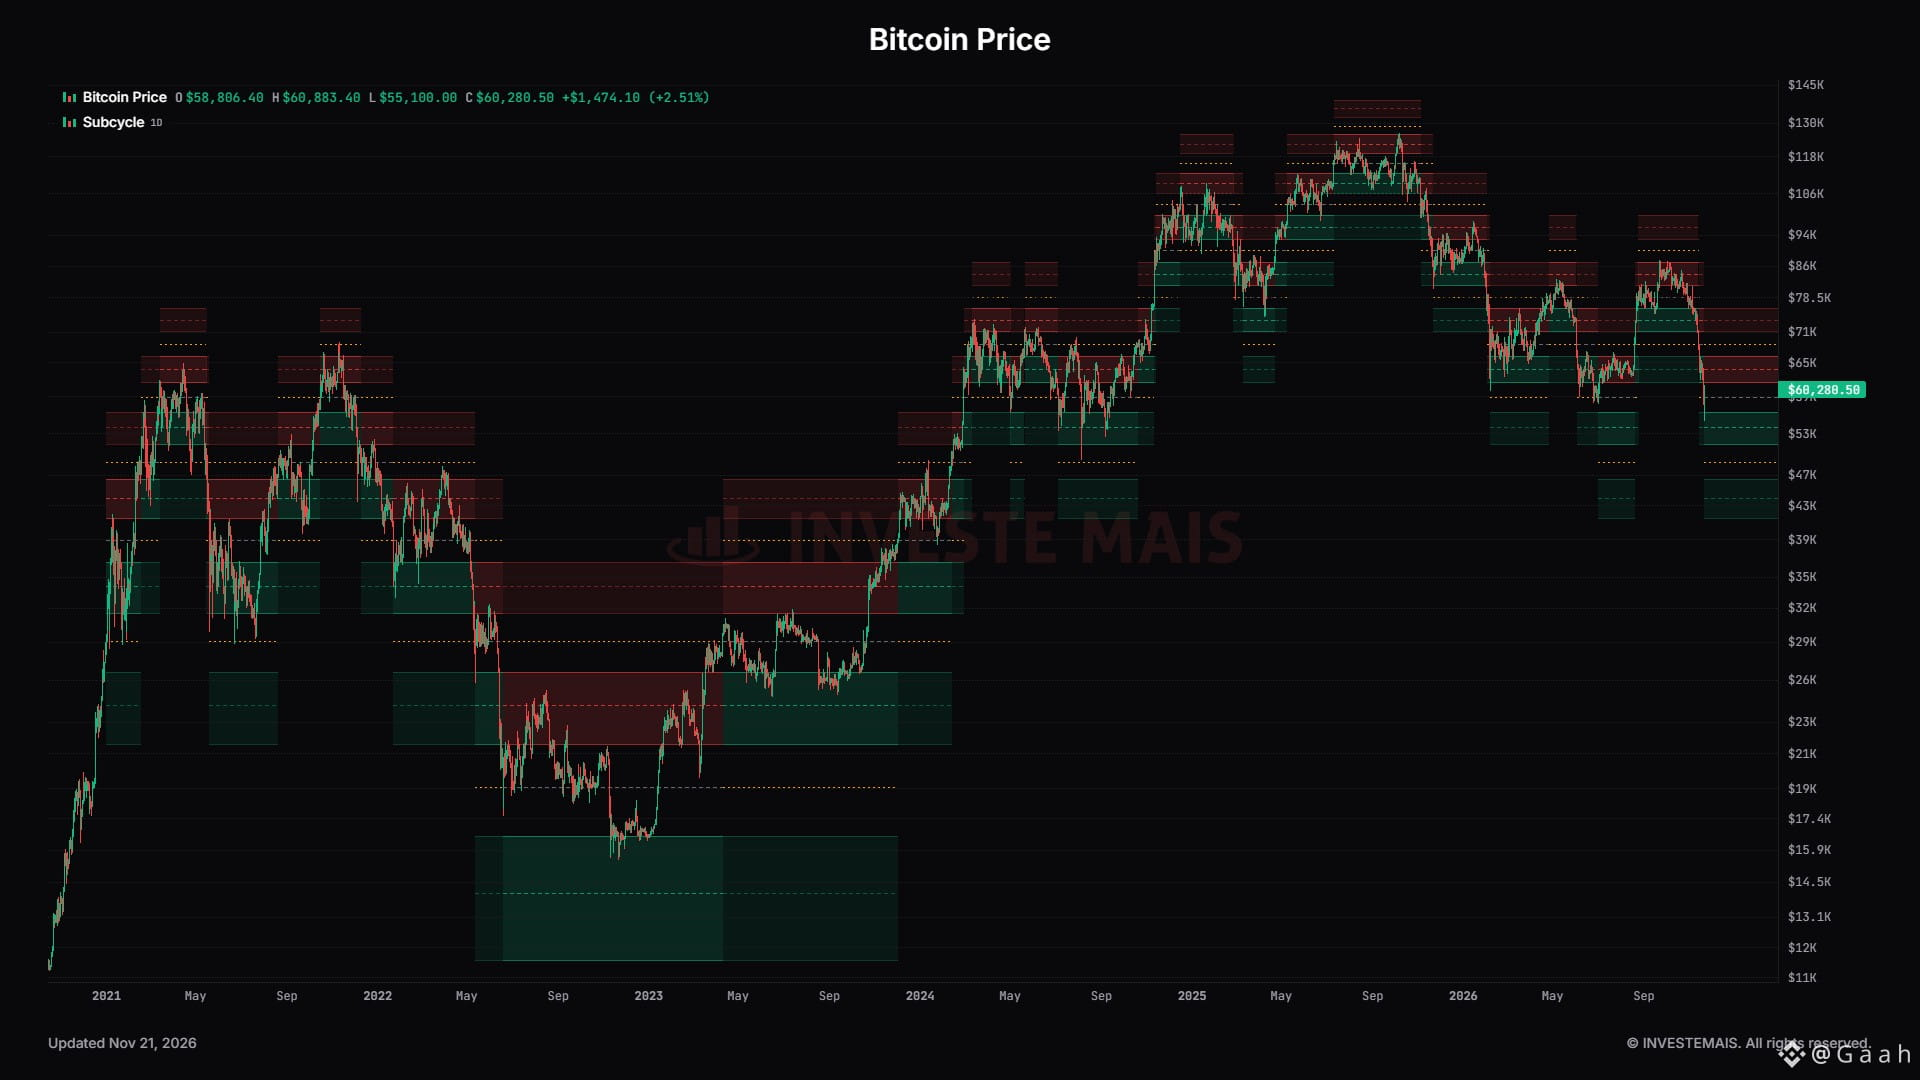
#bitcoin broke below $58k, which signals an expansion of subcycle in line with the trend — now the former support channel has become resistance.
Control point at $58k (reference) and buy orders (for long positions) within the support channel, with a target for full liquidation of position at $63,8k within the resistance channel — this exit target may change if #BTC price advances and expands into another subcycle.
We use a 3T for long positions and a 5T for short positions — this strategy will be available on INVESTEMAIS in 2027 as an automated system.
This is one of our main trading strategies — we’ve been using it for at least 6 years and rely solely on price data in its execution.
Currently available in the system only for BTC — with plans to expand to other assets in future.
We’re now using this chart to track Bitcoin subcycles.
New design, new layout for easier reading.
What do you think?
#FutureTarding #futures #Futures_Signals $BTC
{spot}(BTCUSDT)
#bitcoin broke below $58k, which signals an expansion of subcycle in line with the trend — now the former support channel has become resistance.
Control point at $58k (reference) and buy orders (for long positions) within the support channel, with a target for full liquidation of position at $63,8k within the resistance channel — this exit target may change if #BTC price advances and expands into another subcycle.
We use a 3T for long positions and a 5T for short positions — this strategy will be available on INVESTEMAIS in 2027 as an automated system.
This is one of our main trading strategies — we’ve been using it for at least 6 years and rely solely on price data in its execution.
Currently available in the system only for BTC — with plans to expand to other assets in future.
We’re now using this chart to track Bitcoin subcycles.
New design, new layout for easier reading.
What do you think?
#FutureTarding #futures #Futures_Signals $BTC
Control point at $58k (reference) and buy orders (for long positions) within the support channel, with a target for full liquidation of position at $63,8k within the resistance channel — this exit target may change if #BTC price advances and expands into another subcycle.
We use a 3T for long positions and a 5T for short positions — this strategy will be available on INVESTEMAIS in 2027 as an automated system.
This is one of our main trading strategies — we’ve been using it for at least 6 years and rely solely on price data in its execution.
Currently available in the system only for BTC — with plans to expand to other assets in future.
We’re now using this chart to track Bitcoin subcycles.
New design, new layout for easier reading.
What do you think?
#FutureTarding #futures #Futures_Signals $BTC
1
152

·
--
Bitcoin (BTC): Is the Market Preparing for Another Major Correction? 📉The cryptocurrency market never moves in a straight line. Every rally comes with uncertainty, and every correction creates new questions.
Bitcoin remains one of the most closely watched assets in the crypto market. But the big question is:
Could BTC face another major correction, or are we approaching a potential recovery?
1. Understanding the Bearish Sentiment
When traders become increasingly cautious, selling pressure can increase.
Market sentiment is important, but it should never be treated as a guaranteed prediction of future prices.
2. Why Is $51,000 Getting Attention?
A prediction-market scenario mentioned in recent community discussion points toward $51,000 as a possible downside target.
However, this is a speculative scenario, not a confirmed Bitcoin price target.
3. What Should Traders Watch?
Before forming an opinion about Bitcoin's next move, consider:
- Support Levels: Where could buying interest emerge?
- Resistance Levels: Where could selling pressure increase?
- Trading Volume: Is market participation increasing or decreasing?
- Market Structure: Is BTC making higher highs or lower lows?
- Sentiment: Are traders becoming more fearful or optimistic?
4. The Biggest Mistake Beginners Make
Reacting emotionally to every red candle can lead to poor decisions.
A market correction does not automatically mean the market is finished, just as a green candle does not guarantee a rally.
Learning to understand price action and manage risk is essential.
Final Thoughts
Bitcoin's next major move remains uncertain.
Instead of blindly following predictions, focus on understanding the market and making informed decisions.
Remember: The goal isn't to predict every move. It's to understand the risks before making a decision.
Let's Discuss 👇
Do you think Bitcoin is preparing for another correction, or could buyers surprise the market with a recovery?
Share your thoughts!
{spot}(SOLUSDT)
$BTC $SOL $ETH
#Bitcoin #BTC #CryptoMarket #BinanceSquare #tradingeducation
Bitcoin (BTC): Is the Market Preparing for Another Major Correction? 📉
The cryptocurrency market never moves in a straight line. Every rally comes with uncertainty, and every correction creates new questions.
Bitcoin remains one of the most closely watched assets in the crypto market. But the big question is:
Could BTC face another major correction, or are we approaching a potential recovery?
1. Understanding the Bearish Sentiment
When traders become increasingly cautious, selling pressure can increase.
Market sentiment is important, but it should never be treated as a guaranteed prediction of future prices.
2. Why Is $51,000 Getting Attention?
A prediction-market scenario mentioned in recent community discussion points toward $51,000 as a possible downside target.
However, this is a speculative scenario, not a confirmed Bitcoin price target.
3. What Should Traders Watch?
Before forming an opinion about Bitcoin's next move, consider:
- Support Levels: Where could buying interest emerge?
- Resistance Levels: Where could selling pressure increase?
- Trading Volume: Is market participation increasing or decreasing?
- Market Structure: Is BTC making higher highs or lower lows?
- Sentiment: Are traders becoming more fearful or optimistic?
4. The Biggest Mistake Beginners Make
Reacting emotionally to every red candle can lead to poor decisions.
A market correction does not automatically mean the market is finished, just as a green candle does not guarantee a rally.
Learning to understand price action and manage risk is essential.
Final Thoughts
Bitcoin's next major move remains uncertain.
Instead of blindly following predictions, focus on understanding the market and making informed decisions.
Remember: The goal isn't to predict every move. It's to understand the risks before making a decision.
Let's Discuss 👇
Do you think Bitcoin is preparing for another correction, or could buyers surprise the market with a recovery?
Share your thoughts!
$BTC $SOL $ETH
#Bitcoin #BTC #CryptoMarket #BinanceSquare #tradingeducation
Bitcoin remains one of the most closely watched assets in the crypto market. But the big question is:
Could BTC face another major correction, or are we approaching a potential recovery?
1. Understanding the Bearish Sentiment
When traders become increasingly cautious, selling pressure can increase.
Market sentiment is important, but it should never be treated as a guaranteed prediction of future prices.
2. Why Is $51,000 Getting Attention?
A prediction-market scenario mentioned in recent community discussion points toward $51,000 as a possible downside target.
However, this is a speculative scenario, not a confirmed Bitcoin price target.
3. What Should Traders Watch?
Before forming an opinion about Bitcoin's next move, consider:
- Support Levels: Where could buying interest emerge?
- Resistance Levels: Where could selling pressure increase?
- Trading Volume: Is market participation increasing or decreasing?
- Market Structure: Is BTC making higher highs or lower lows?
- Sentiment: Are traders becoming more fearful or optimistic?
4. The Biggest Mistake Beginners Make
Reacting emotionally to every red candle can lead to poor decisions.
A market correction does not automatically mean the market is finished, just as a green candle does not guarantee a rally.
Learning to understand price action and manage risk is essential.
Final Thoughts
Bitcoin's next major move remains uncertain.
Instead of blindly following predictions, focus on understanding the market and making informed decisions.
Remember: The goal isn't to predict every move. It's to understand the risks before making a decision.
Let's Discuss 👇
Do you think Bitcoin is preparing for another correction, or could buyers surprise the market with a recovery?
Share your thoughts!
$BTC $SOL $ETH
#Bitcoin #BTC #CryptoMarket #BinanceSquare #tradingeducation
1
110

🚨 BITCOIN IS BACK ABOVE $60K! IS THE BULLISH REVERSAL STARTING? 🚀
The crypto market is showing signs of recovery!
📊 Market Watch:
$BTC : Around $60,300 (+3.1%)
$ETH : Around $1,686 (+4.6%)
$SOL : Around $70.50 (+3.2%)
$XRP: Around $0.94 (+4.4%)
🔥 My Market Outlook:
Bitcoin's strong rebound is attracting attention, but one recovery doesn't confirm a new bull run.
👀 What I'm Watching:
BTC holding above $60K.
ETH maintaining bullish momentum.
SOL continuing its recovery.
🎯 My Strategy: Watch volume and confirmation before entering. Avoid FOMO and manage risk carefully.
What do you think? Is BTC preparing for another rally or just a temporary bounce?
👇 Drop your prediction!
#bitcoin #BTC #Ethereum #ETH #Solana #cryptotrading #Binance #CryptoAnalysis
{spot}(BTCUSDT)
{spot}(ETHUSDT)
{spot}(SOLUSDT)
🚨 BITCOIN IS BACK ABOVE $60K! IS THE BULLISH REVERSAL STARTING? 🚀
The crypto market is showing signs of recovery!
📊 Market Watch:
$BTC : Around $60,300 (+3.1%)
$ETH : Around $1,686 (+4.6%)
$SOL : Around $70.50 (+3.2%)
$XRP: Around $0.94 (+4.4%)
🔥 My Market Outlook:
Bitcoin's strong rebound is attracting attention, but one recovery doesn't confirm a new bull run.
👀 What I'm Watching:
BTC holding above $60K.
ETH maintaining bullish momentum.
SOL continuing its recovery.
🎯 My Strategy: Watch volume and confirmation before entering. Avoid FOMO and manage risk carefully.
What do you think? Is BTC preparing for another rally or just a temporary bounce?
👇 Drop your prediction!
#bitcoin #BTC #Ethereum #ETH #Solana #cryptotrading #Binance #CryptoAnalysis
The crypto market is showing signs of recovery!
📊 Market Watch:
$BTC : Around $60,300 (+3.1%)
$ETH : Around $1,686 (+4.6%)
$SOL : Around $70.50 (+3.2%)
$XRP: Around $0.94 (+4.4%)
🔥 My Market Outlook:
Bitcoin's strong rebound is attracting attention, but one recovery doesn't confirm a new bull run.
👀 What I'm Watching:
BTC holding above $60K.
ETH maintaining bullish momentum.
SOL continuing its recovery.
🎯 My Strategy: Watch volume and confirmation before entering. Avoid FOMO and manage risk carefully.
What do you think? Is BTC preparing for another rally or just a temporary bounce?
👇 Drop your prediction!
#bitcoin #BTC #Ethereum #ETH #Solana #cryptotrading #Binance #CryptoAnalysis

49

$BTC has followed almost the SAME pattern for over a decade. But there's a catch. 👀
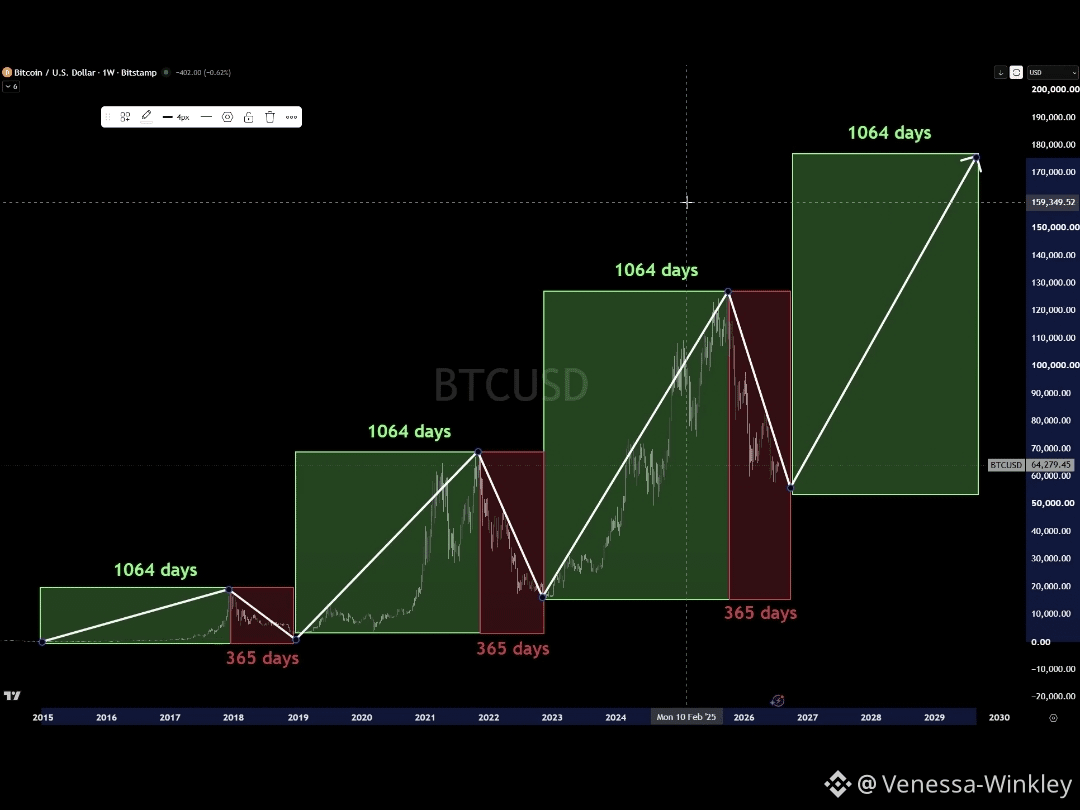
You've probably seen that chart claiming BTC always goes up for 1,064 days and then crashes for exactly 365 days.
Sounds a little too perfect, right? So I looked into the actual numbers.
Here's what I found:
📈 2015–2017: 1,067 days of growth.
📈 2018–2021: 1,059 days of growth.
📈 2022–2025: 1,050 days of growth.
That's actually pretty crazy when you think about it. Three separate bull runs, all lasting roughly the same amount of time.
And the bear markets?
📉 2017–2018: Around 364 days.
📉 2021–2022: Around 378 days.
So yes, there's definitely a historical pattern here. But saying Bitcoin follows an EXACT 1,064-day clock is stretching the truth.
Here's where things get even more interesting.
BTC peaked around $126K in October 2025, and we've already seen a major correction since then. The lowest point so far came in June 2026, just 267 days after the peak.
If that turns out to be the actual bottom, this cycle would be noticeably shorter on the bearish side.
Personally, I think the four-year cycle is still worth watching. But markets don't run on a stopwatch, and three similar cycles aren't enough to guarantee a fourth.
The real question is, are we seeing the same cycle play out again, or is Bitcoin finally starting to behave differently?
What do you guys think? 🤔
$BTC
{future}(BTCUSDT)
#bitcoin #crypto #BTC
$BTC has followed almost the SAME pattern for over a decade. But there's a catch. 👀
You've probably seen that chart claiming BTC always goes up for 1,064 days and then crashes for exactly 365 days.
Sounds a little too perfect, right? So I looked into the actual numbers.
Here's what I found:
📈 2015–2017: 1,067 days of growth.
📈 2018–2021: 1,059 days of growth.
📈 2022–2025: 1,050 days of growth.
That's actually pretty crazy when you think about it. Three separate bull runs, all lasting roughly the same amount of time.
And the bear markets?
📉 2017–2018: Around 364 days.
📉 2021–2022: Around 378 days.
So yes, there's definitely a historical pattern here. But saying Bitcoin follows an EXACT 1,064-day clock is stretching the truth.
Here's where things get even more interesting.
BTC peaked around $126K in October 2025, and we've already seen a major correction since then. The lowest point so far came in June 2026, just 267 days after the peak.
If that turns out to be the actual bottom, this cycle would be noticeably shorter on the bearish side.
Personally, I think the four-year cycle is still worth watching. But markets don't run on a stopwatch, and three similar cycles aren't enough to guarantee a fourth.
The real question is, are we seeing the same cycle play out again, or is Bitcoin finally starting to behave differently?
What do you guys think? 🤔
$BTC
#bitcoin #crypto #BTC
You've probably seen that chart claiming BTC always goes up for 1,064 days and then crashes for exactly 365 days.
Sounds a little too perfect, right? So I looked into the actual numbers.
Here's what I found:
📈 2015–2017: 1,067 days of growth.
📈 2018–2021: 1,059 days of growth.
📈 2022–2025: 1,050 days of growth.
That's actually pretty crazy when you think about it. Three separate bull runs, all lasting roughly the same amount of time.
And the bear markets?
📉 2017–2018: Around 364 days.
📉 2021–2022: Around 378 days.
So yes, there's definitely a historical pattern here. But saying Bitcoin follows an EXACT 1,064-day clock is stretching the truth.
Here's where things get even more interesting.
BTC peaked around $126K in October 2025, and we've already seen a major correction since then. The lowest point so far came in June 2026, just 267 days after the peak.
If that turns out to be the actual bottom, this cycle would be noticeably shorter on the bearish side.
Personally, I think the four-year cycle is still worth watching. But markets don't run on a stopwatch, and three similar cycles aren't enough to guarantee a fourth.
The real question is, are we seeing the same cycle play out again, or is Bitcoin finally starting to behave differently?
What do you guys think? 🤔
$BTC
#bitcoin #crypto #BTC
58

·
--
Bullish
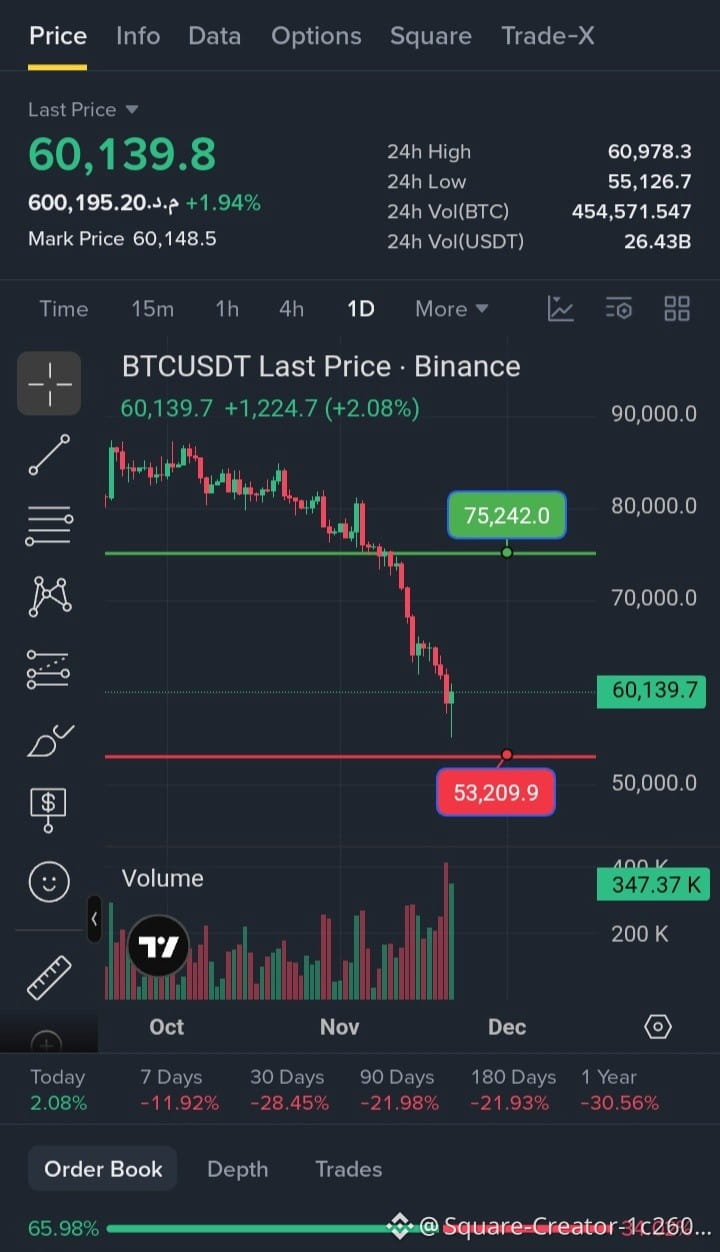
$BTC holding strong around $60K⚡️
After sweeping into the mid $55K zone and reclaiming the $60K mark, the heaviest selling pressure looks absorbed.
✨ In my view, BTC will not drop below $53,209 and is currently on its way toward the $75,242 level.
Volatility cuts both ways, so keep a close eye on key support and resistance as momentum builds. (DYOR)
$BTC
{future}(BTCUSDT)
#BTC #bitcoin
$BTC holding strong around $60K⚡️
After sweeping into the mid $55K zone and reclaiming the $60K mark, the heaviest selling pressure looks absorbed.
✨ In my view, BTC will not drop below $53,209 and is currently on its way toward the $75,242 level.
Volatility cuts both ways, so keep a close eye on key support and resistance as momentum builds. (DYOR)
$BTC
#BTC #bitcoin
After sweeping into the mid $55K zone and reclaiming the $60K mark, the heaviest selling pressure looks absorbed.
✨ In my view, BTC will not drop below $53,209 and is currently on its way toward the $75,242 level.
Volatility cuts both ways, so keep a close eye on key support and resistance as momentum builds. (DYOR)
$BTC
#BTC #bitcoin
1
167

🚨 DORMANT $BTC LARGE WALLET MOVES 4,500 COINS AS LIQUIDITY SHIFTS
Target: 79,700 📉
Institutional tracking reveals a dormant capital block of 4,500 $BTC awakening after four years of absolute stillness, shifting to a fresh ledger address. While the transfer bypassed order books on any major exchange, such structural realignments often precede broader volatility contraction. 📊 The original accumulation traces back to 2022 at significantly lower valuations, leaving this entity sitting on substantial unrealized gains with dry powder intact. As smart money rebalances positioning, price action is likely to test crucial liquidity pools before any impulsive continuation unfolds. ⚡ 🤔 Are you positioning for a deeper structural sweep down to 79,700, or anticipating immediate buyer absorption?
⚠️ Not financial advice. Always manage your risk. 🛡️
#BTC #SmartMoney #LiquidityPool #Crypto
🔥
🚨 DORMANT $BTC LARGE WALLET MOVES 4,500 COINS AS LIQUIDITY SHIFTS
Target: 79,700 📉
Institutional tracking reveals a dormant capital block of 4,500 $BTC awakening after four years of absolute stillness, shifting to a fresh ledger address. While the transfer bypassed order books on any major exchange, such structural realignments often precede broader volatility contraction. 📊 The original accumulation traces back to 2022 at significantly lower valuations, leaving this entity sitting on substantial unrealized gains with dry powder intact. As smart money rebalances positioning, price action is likely to test crucial liquidity pools before any impulsive continuation unfolds. ⚡ 🤔 Are you positioning for a deeper structural sweep down to 79,700, or anticipating immediate buyer absorption?
⚠️ Not financial advice. Always manage your risk. 🛡️
#BTC #SmartMoney #LiquidityPool #Crypto
🔥
Target: 79,700 📉
Institutional tracking reveals a dormant capital block of 4,500 $BTC awakening after four years of absolute stillness, shifting to a fresh ledger address. While the transfer bypassed order books on any major exchange, such structural realignments often precede broader volatility contraction. 📊 The original accumulation traces back to 2022 at significantly lower valuations, leaving this entity sitting on substantial unrealized gains with dry powder intact. As smart money rebalances positioning, price action is likely to test crucial liquidity pools before any impulsive continuation unfolds. ⚡ 🤔 Are you positioning for a deeper structural sweep down to 79,700, or anticipating immediate buyer absorption?
⚠️ Not financial advice. Always manage your risk. 🛡️
#BTC #SmartMoney #LiquidityPool #Crypto
🔥

3

·
--
🐋 WHALES ARE BUYING THE DIP
Abraxas Capital reportedly scooped up 10,356 $BTC — $607M — at an average of $58,651 during Friday's flush, per Lookonchain and TradingBeats monitoring.
That is not a retail-sized bet. A nine-figure dip buy from a major fund, right after BTC tagged the $55K zone and spot ETF outflows hit record levels, tells you where the smart money sees value.
BTC has already bounced back above $60K. But let's be honest: one whale buy does not flip a downtrend. The attribution is onchain monitoring, not a confirmed filing, and ETF outflows plus macro fear are still the dominant flow.
Still, when funds start deploying hundreds of millions into a panic flush, it is a signal worth watching, not ignoring.
🐂 Dip buyers stepping in, or 🐻 dead-cat bounce?
📌 Sharing personal opinions only, not financial advice or a recommendation to buy/sell. Crypto is highly risky; DYOR and you are solely responsible. No coin promotion.
#Bitcoin #BTC #Whale #Crypto #Binance
🐋 WHALES ARE BUYING THE DIP
Abraxas Capital reportedly scooped up 10,356 $BTC — $607M — at an average of $58,651 during Friday's flush, per Lookonchain and TradingBeats monitoring.
That is not a retail-sized bet. A nine-figure dip buy from a major fund, right after BTC tagged the $55K zone and spot ETF outflows hit record levels, tells you where the smart money sees value.
BTC has already bounced back above $60K. But let's be honest: one whale buy does not flip a downtrend. The attribution is onchain monitoring, not a confirmed filing, and ETF outflows plus macro fear are still the dominant flow.
Still, when funds start deploying hundreds of millions into a panic flush, it is a signal worth watching, not ignoring.
🐂 Dip buyers stepping in, or 🐻 dead-cat bounce?
📌 Sharing personal opinions only, not financial advice or a recommendation to buy/sell. Crypto is highly risky; DYOR and you are solely responsible. No coin promotion.
#Bitcoin #BTC #Whale #Crypto #Binance
Abraxas Capital reportedly scooped up 10,356 $BTC — $607M — at an average of $58,651 during Friday's flush, per Lookonchain and TradingBeats monitoring.
That is not a retail-sized bet. A nine-figure dip buy from a major fund, right after BTC tagged the $55K zone and spot ETF outflows hit record levels, tells you where the smart money sees value.
BTC has already bounced back above $60K. But let's be honest: one whale buy does not flip a downtrend. The attribution is onchain monitoring, not a confirmed filing, and ETF outflows plus macro fear are still the dominant flow.
Still, when funds start deploying hundreds of millions into a panic flush, it is a signal worth watching, not ignoring.
🐂 Dip buyers stepping in, or 🐻 dead-cat bounce?
📌 Sharing personal opinions only, not financial advice or a recommendation to buy/sell. Crypto is highly risky; DYOR and you are solely responsible. No coin promotion.
#Bitcoin #BTC #Whale #Crypto #Binance
3
980

·
--
Bullish
Thoughts on #BTC
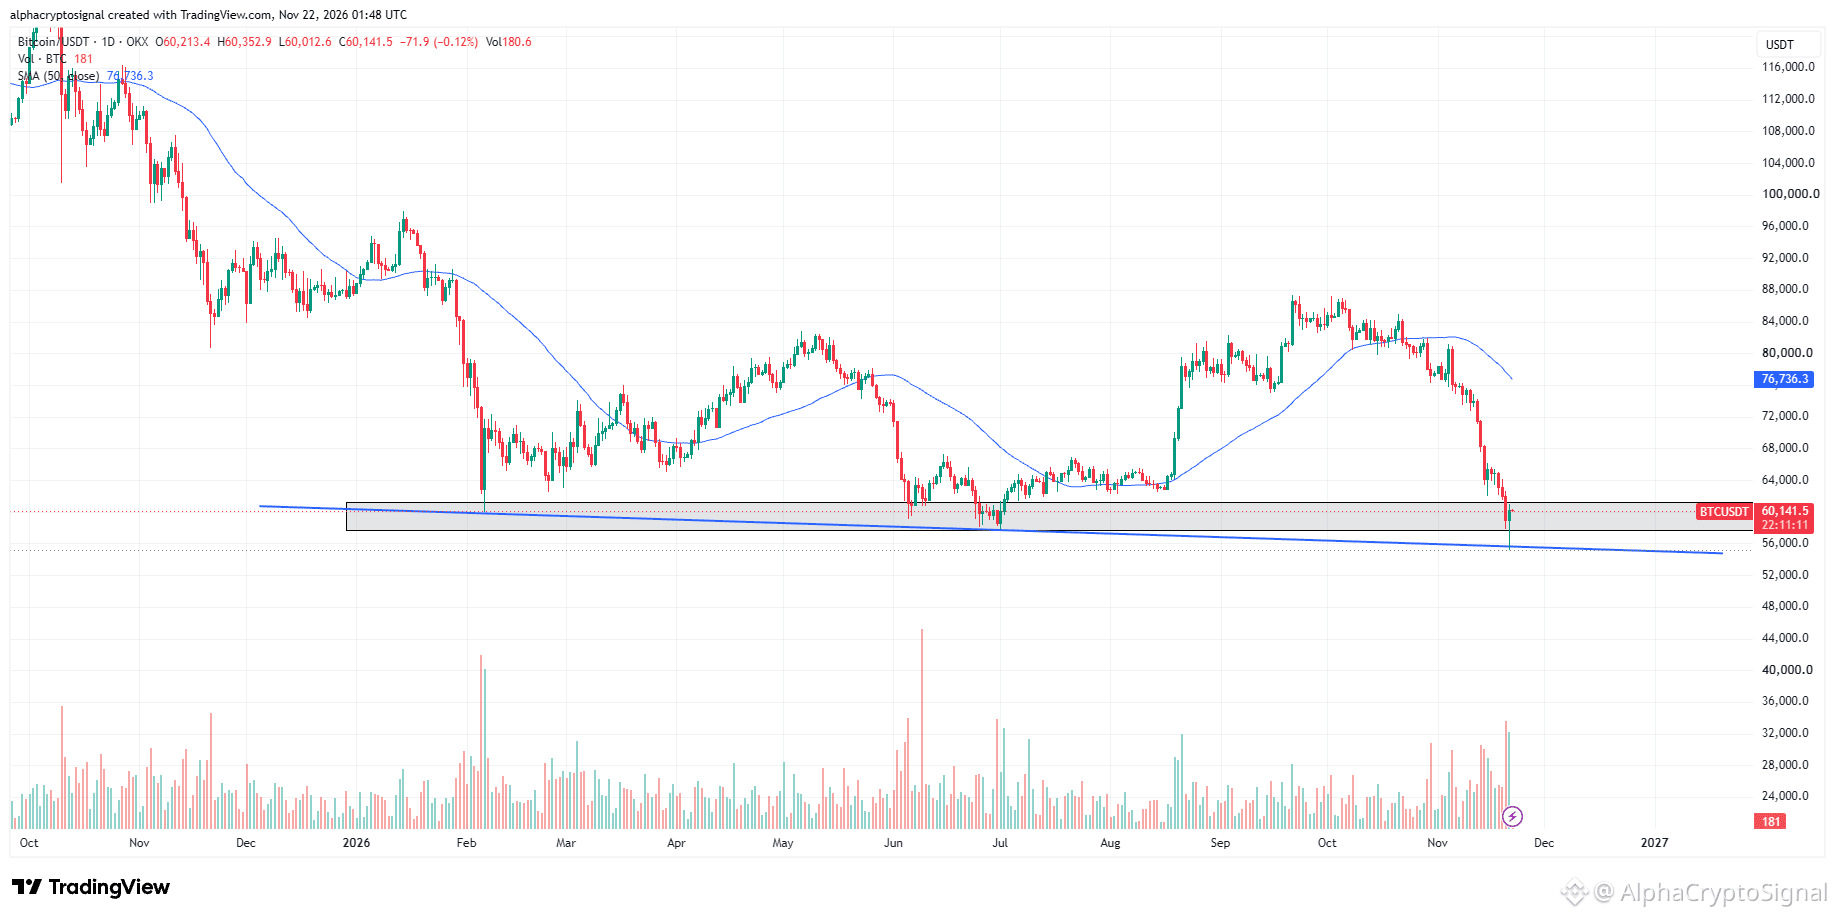
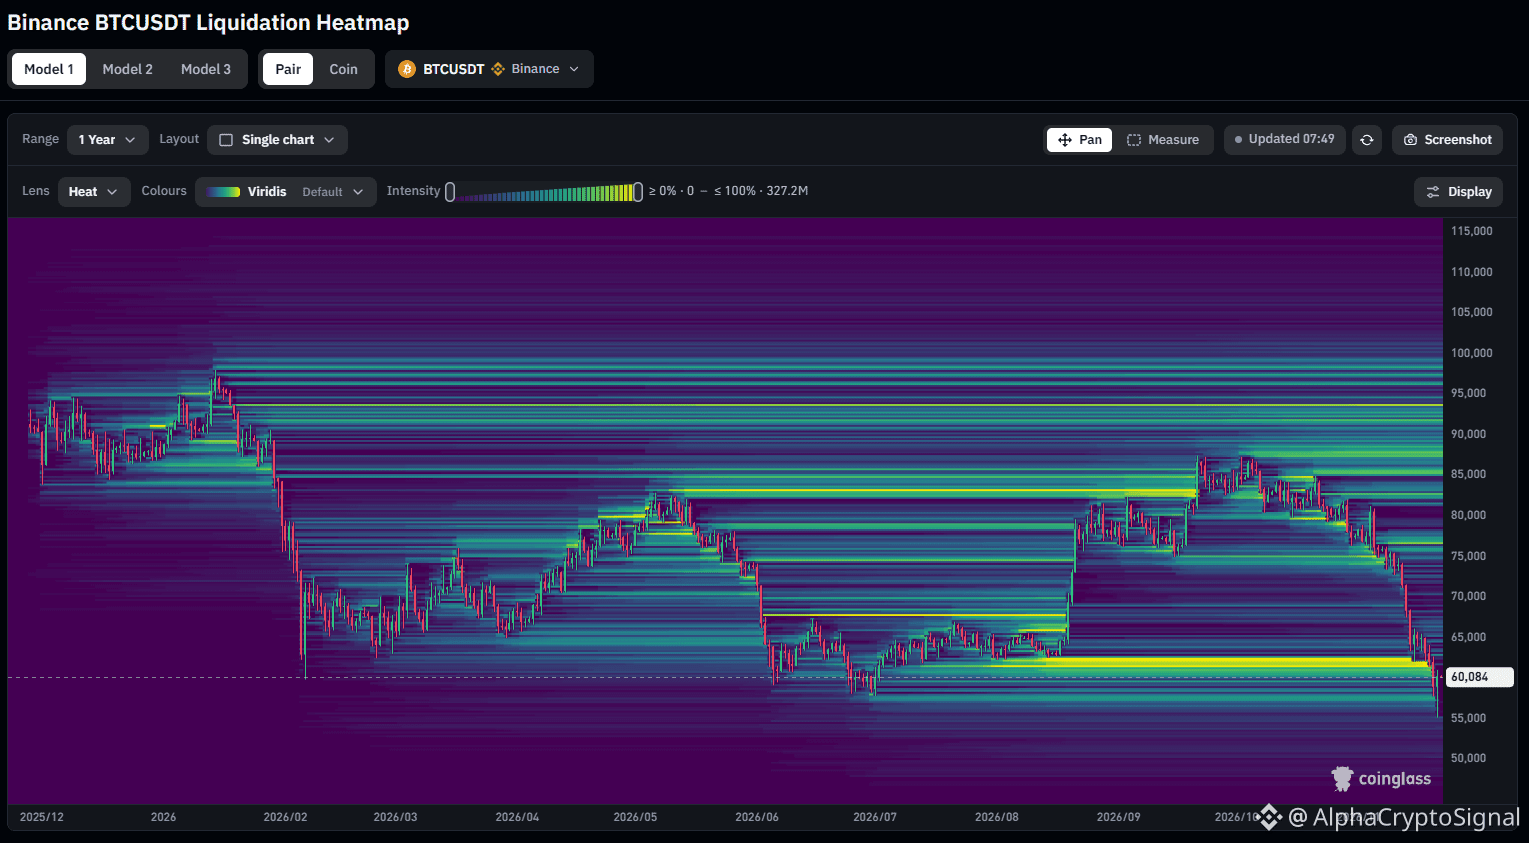
$BTC invalidated our inverse head and shoulders setup and decided to push lower. However, a few interesting developments have emerged since then. $BTC swept a massive pool of liquidity on the yearly timeframe, and there's now very little significant liquidity sitting below. If the weekend's scam wick was intended to grab that liquidity, the sweep played out nicely, potentially limiting further downside from here.
From a TA perspective, $BTC is still respecting its descending trendline support and bounced almost instantly after touching it. We're also back at a key horizontal support zone. Not rushing into any longs yet, though. I'd love to see a proper rebound around this zone before considering an entry. Let's wait for Monday's price action before deciding the next move. That said, it looks increasingly close to its cycle bottom, and this could be a reasonable area to start building a spot portfolio while keeping some capital aside for DCA in case we get another downside wick.
{future}(BTCUSDT)
Thoughts on #BTC
$BTC invalidated our inverse head and shoulders setup and decided to push lower. However, a few interesting developments have emerged since then. $BTC swept a massive pool of liquidity on the yearly timeframe, and there's now very little significant liquidity sitting below. If the weekend's scam wick was intended to grab that liquidity, the sweep played out nicely, potentially limiting further downside from here.
From a TA perspective, $BTC is still respecting its descending trendline support and bounced almost instantly after touching it. We're also back at a key horizontal support zone. Not rushing into any longs yet, though. I'd love to see a proper rebound around this zone before considering an entry. Let's wait for Monday's price action before deciding the next move. That said, it looks increasingly close to its cycle bottom, and this could be a reasonable area to start building a spot portfolio while keeping some capital aside for DCA in case we get another downside wick.
$BTC invalidated our inverse head and shoulders setup and decided to push lower. However, a few interesting developments have emerged since then. $BTC swept a massive pool of liquidity on the yearly timeframe, and there's now very little significant liquidity sitting below. If the weekend's scam wick was intended to grab that liquidity, the sweep played out nicely, potentially limiting further downside from here.
From a TA perspective, $BTC is still respecting its descending trendline support and bounced almost instantly after touching it. We're also back at a key horizontal support zone. Not rushing into any longs yet, though. I'd love to see a proper rebound around this zone before considering an entry. Let's wait for Monday's price action before deciding the next move. That said, it looks increasingly close to its cycle bottom, and this could be a reasonable area to start building a spot portfolio while keeping some capital aside for DCA in case we get another downside wick.
1
37

🚨 INSTITUTIONAL $BTC OUTFLOWS HIT A FOUR-MONTH PEAK AS SMART MONEY REBALANCES LIQUIDITY!
📊 Institutional flows just registered their sharpest contraction in four months, with US spot vehicles bleeding 635.5 million dollars in a single session. This heavy distribution sweep flushes out leveraged late arrivals while smart money tests deeper structural liquidity pools.
Market depth is absorbing the shock efficiently, proving that macro readjustments often create the cleanest structural reaccumulations for patient participants. 💬 Are you viewing this institutional outflow as a macro warning or a textbook liquidity sweep before the next structural leg? 👇
⚠️ Not financial advice. Always manage your risk. 🛡️
🏷️ #BTC #SmartMoney #Crypto #MarketStructure
🔥
🚨 INSTITUTIONAL $BTC OUTFLOWS HIT A FOUR-MONTH PEAK AS SMART MONEY REBALANCES LIQUIDITY!
📊 Institutional flows just registered their sharpest contraction in four months, with US spot vehicles bleeding 635.5 million dollars in a single session. This heavy distribution sweep flushes out leveraged late arrivals while smart money tests deeper structural liquidity pools.
Market depth is absorbing the shock efficiently, proving that macro readjustments often create the cleanest structural reaccumulations for patient participants. 💬 Are you viewing this institutional outflow as a macro warning or a textbook liquidity sweep before the next structural leg? 👇
⚠️ Not financial advice. Always manage your risk. 🛡️
🏷️ #BTC #SmartMoney #Crypto #MarketStructure
🔥
📊 Institutional flows just registered their sharpest contraction in four months, with US spot vehicles bleeding 635.5 million dollars in a single session. This heavy distribution sweep flushes out leveraged late arrivals while smart money tests deeper structural liquidity pools.
Market depth is absorbing the shock efficiently, proving that macro readjustments often create the cleanest structural reaccumulations for patient participants. 💬 Are you viewing this institutional outflow as a macro warning or a textbook liquidity sweep before the next structural leg? 👇
⚠️ Not financial advice. Always manage your risk. 🛡️
🏷️ #BTC #SmartMoney #Crypto #MarketStructure
🔥


10

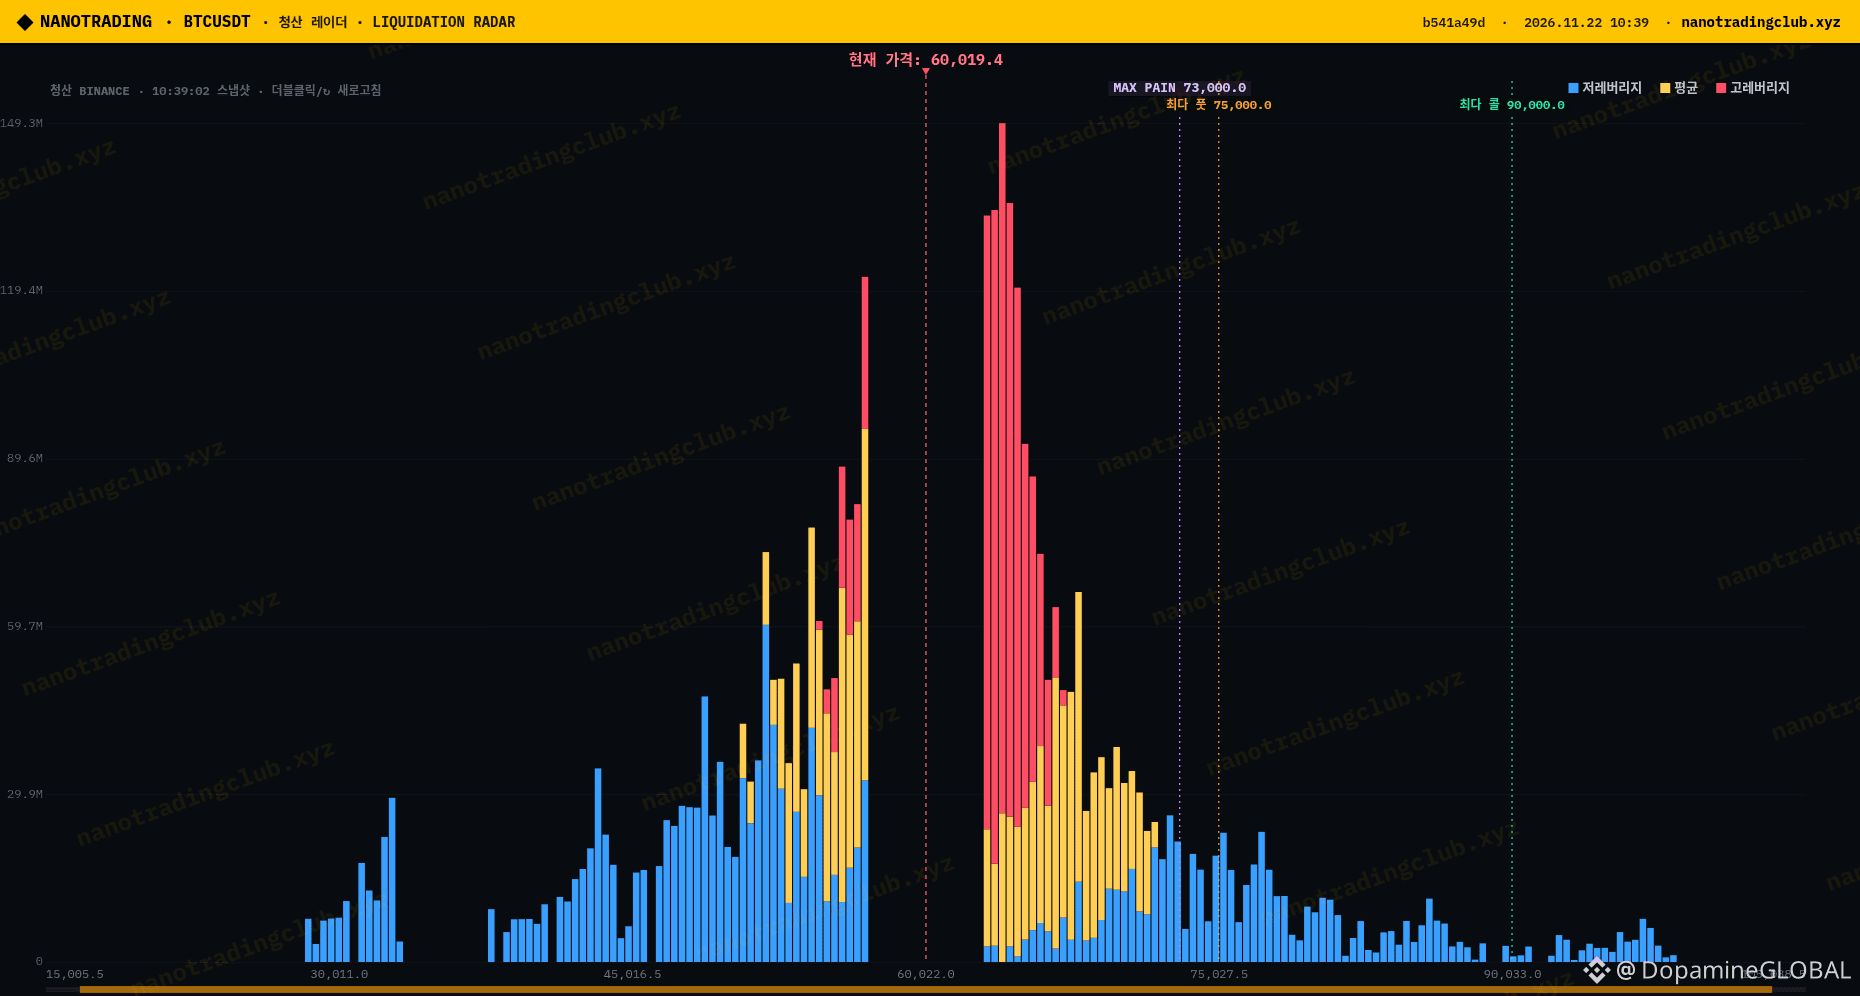
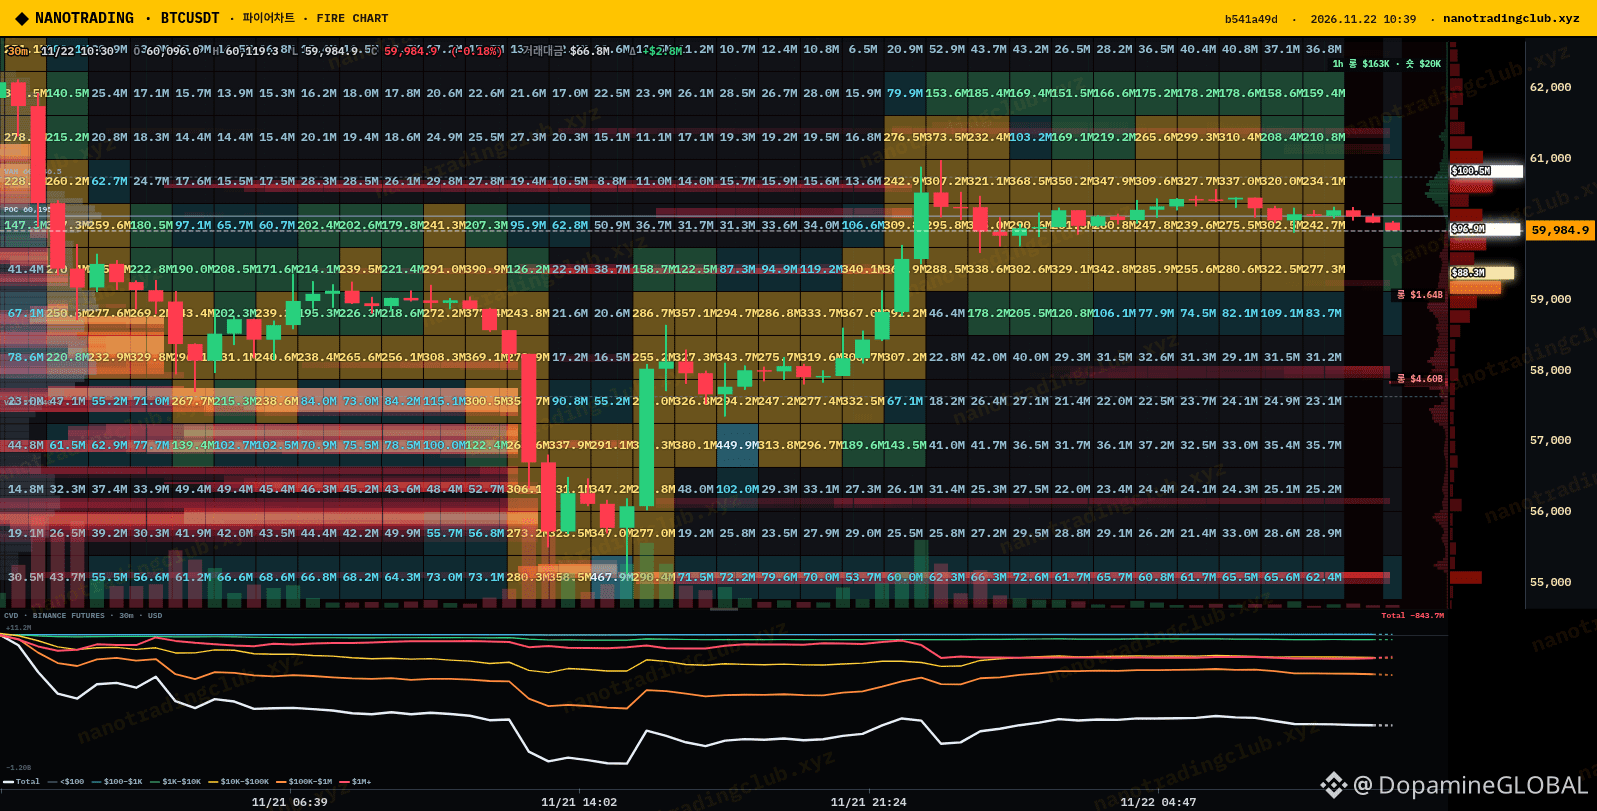
$BTC bounced back to ~60K this morning, and NanoTrading's liquidation radar shows it sitting right between two magnets.
Above: the tallest stack on the whole map, mostly high-leverage shorts, roughly 63-64K. Below: a fat cluster around 56-57K, and the Fire chart has a ~$4.6B long liquidation line near 58K.
So which gets tagged first, 64K or 57K? Drop your pick 👇 I lean a squeeze toward 64K first, but in this tape I wouldn't bet the house on it.
Not financial advice.
Charts: NanoTrading liquidation radar + Fire chart 30m (nanotradingclub.xyz)
#BTC #Bitcoin #NanoTrading #Liquidations
$BTC bounced back to ~60K this morning, and NanoTrading's liquidation radar shows it sitting right between two magnets.
Above: the tallest stack on the whole map, mostly high-leverage shorts, roughly 63-64K. Below: a fat cluster around 56-57K, and the Fire chart has a ~$4.6B long liquidation line near 58K.
So which gets tagged first, 64K or 57K? Drop your pick 👇 I lean a squeeze toward 64K first, but in this tape I wouldn't bet the house on it.
Not financial advice.
Charts: NanoTrading liquidation radar + Fire chart 30m (nanotradingclub.xyz)
#BTC #Bitcoin #NanoTrading #Liquidations
Above: the tallest stack on the whole map, mostly high-leverage shorts, roughly 63-64K. Below: a fat cluster around 56-57K, and the Fire chart has a ~$4.6B long liquidation line near 58K.
So which gets tagged first, 64K or 57K? Drop your pick 👇 I lean a squeeze toward 64K first, but in this tape I wouldn't bet the house on it.
Not financial advice.
Charts: NanoTrading liquidation radar + Fire chart 30m (nanotradingclub.xyz)
#BTC #Bitcoin #NanoTrading #Liquidations
54

·
--
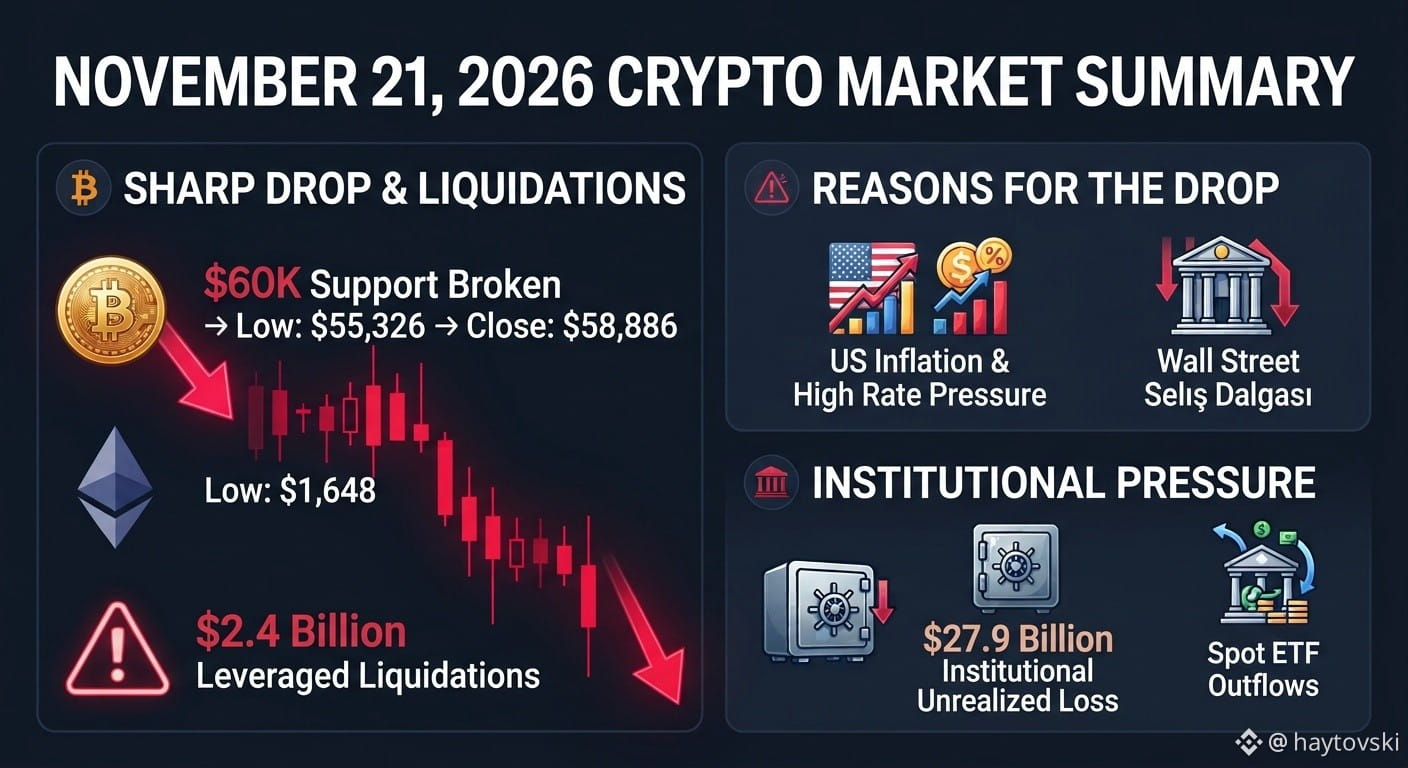
#btc #eth #xrp #sol On November 21, 2026, the crypto market was shaken by a sharp sell-off; Bitcoin broke below the $60,000 level, retracing as far as the $55,300 range before closing the day at approximately $58,886.
Key Highlights
Sharp Decline and Liquidations: Bitcoin dipped to $55,326 during the day, while Ethereum tested the $1,648 level. A total of $2.4 billion in leveraged positions were liquidated.
Reasons for the Downturn: Inflation concerns in the U.S., high interest rates, and a sell-off in Wall Street technology stocks dampened risk appetite.
Institutional Losses: As outflows from spot ETFs continued, the total unrealized losses on the holdings of major institutional entities (such as Strategy, BitMine, etc.) reached $27.9 billion.
#btc #eth #xrp #sol On November 21, 2026, the crypto market was shaken by a sharp sell-off; Bitcoin broke below the $60,000 level, retracing as far as the $55,300 range before closing the day at approximately $58,886.
Key Highlights
Sharp Decline and Liquidations: Bitcoin dipped to $55,326 during the day, while Ethereum tested the $1,648 level. A total of $2.4 billion in leveraged positions were liquidated.
Reasons for the Downturn: Inflation concerns in the U.S., high interest rates, and a sell-off in Wall Street technology stocks dampened risk appetite.
Institutional Losses: As outflows from spot ETFs continued, the total unrealized losses on the holdings of major institutional entities (such as Strategy, BitMine, etc.) reached $27.9 billion.
Key Highlights
Sharp Decline and Liquidations: Bitcoin dipped to $55,326 during the day, while Ethereum tested the $1,648 level. A total of $2.4 billion in leveraged positions were liquidated.
Reasons for the Downturn: Inflation concerns in the U.S., high interest rates, and a sell-off in Wall Street technology stocks dampened risk appetite.
Institutional Losses: As outflows from spot ETFs continued, the total unrealized losses on the holdings of major institutional entities (such as Strategy, BitMine, etc.) reached $27.9 billion.

1
79

·
--
📡 BTC Snaps Back Above 60K After a Two Year Low
Yesterday BTC broke below 60K. Overnight it went further, down to about 55,100, its lowest in nearly two years, before snapping back above 60,200 in hours.
The flush wiped out about 2.4B in leveraged positions in 24 hours, mostly longs, and that washout may be exactly what the bounce needed. ETH and SOL followed higher. Fear and Greed read 11 yesterday, deep in extreme fear, so the crowd has not turned yet.
One bounce does not end a seven week slide, and ETF flows are still bleeding, so this looks like relief, not a reversal. What matters next is whether 60K holds into the new week or gives way again.
What level are you watching for the weekly close?
📌 Personal opinion, not financial advice. DYOR.
#BTC #Crypto #CryptoMarket #Bitcoin
📡 BTC Snaps Back Above 60K After a Two Year Low
Yesterday BTC broke below 60K. Overnight it went further, down to about 55,100, its lowest in nearly two years, before snapping back above 60,200 in hours.
The flush wiped out about 2.4B in leveraged positions in 24 hours, mostly longs, and that washout may be exactly what the bounce needed. ETH and SOL followed higher. Fear and Greed read 11 yesterday, deep in extreme fear, so the crowd has not turned yet.
One bounce does not end a seven week slide, and ETF flows are still bleeding, so this looks like relief, not a reversal. What matters next is whether 60K holds into the new week or gives way again.
What level are you watching for the weekly close?
📌 Personal opinion, not financial advice. DYOR.
#BTC #Crypto #CryptoMarket #Bitcoin
Yesterday BTC broke below 60K. Overnight it went further, down to about 55,100, its lowest in nearly two years, before snapping back above 60,200 in hours.
The flush wiped out about 2.4B in leveraged positions in 24 hours, mostly longs, and that washout may be exactly what the bounce needed. ETH and SOL followed higher. Fear and Greed read 11 yesterday, deep in extreme fear, so the crowd has not turned yet.
One bounce does not end a seven week slide, and ETF flows are still bleeding, so this looks like relief, not a reversal. What matters next is whether 60K holds into the new week or gives way again.
What level are you watching for the weekly close?
📌 Personal opinion, not financial advice. DYOR.
#BTC #Crypto #CryptoMarket #Bitcoin
69

·
--
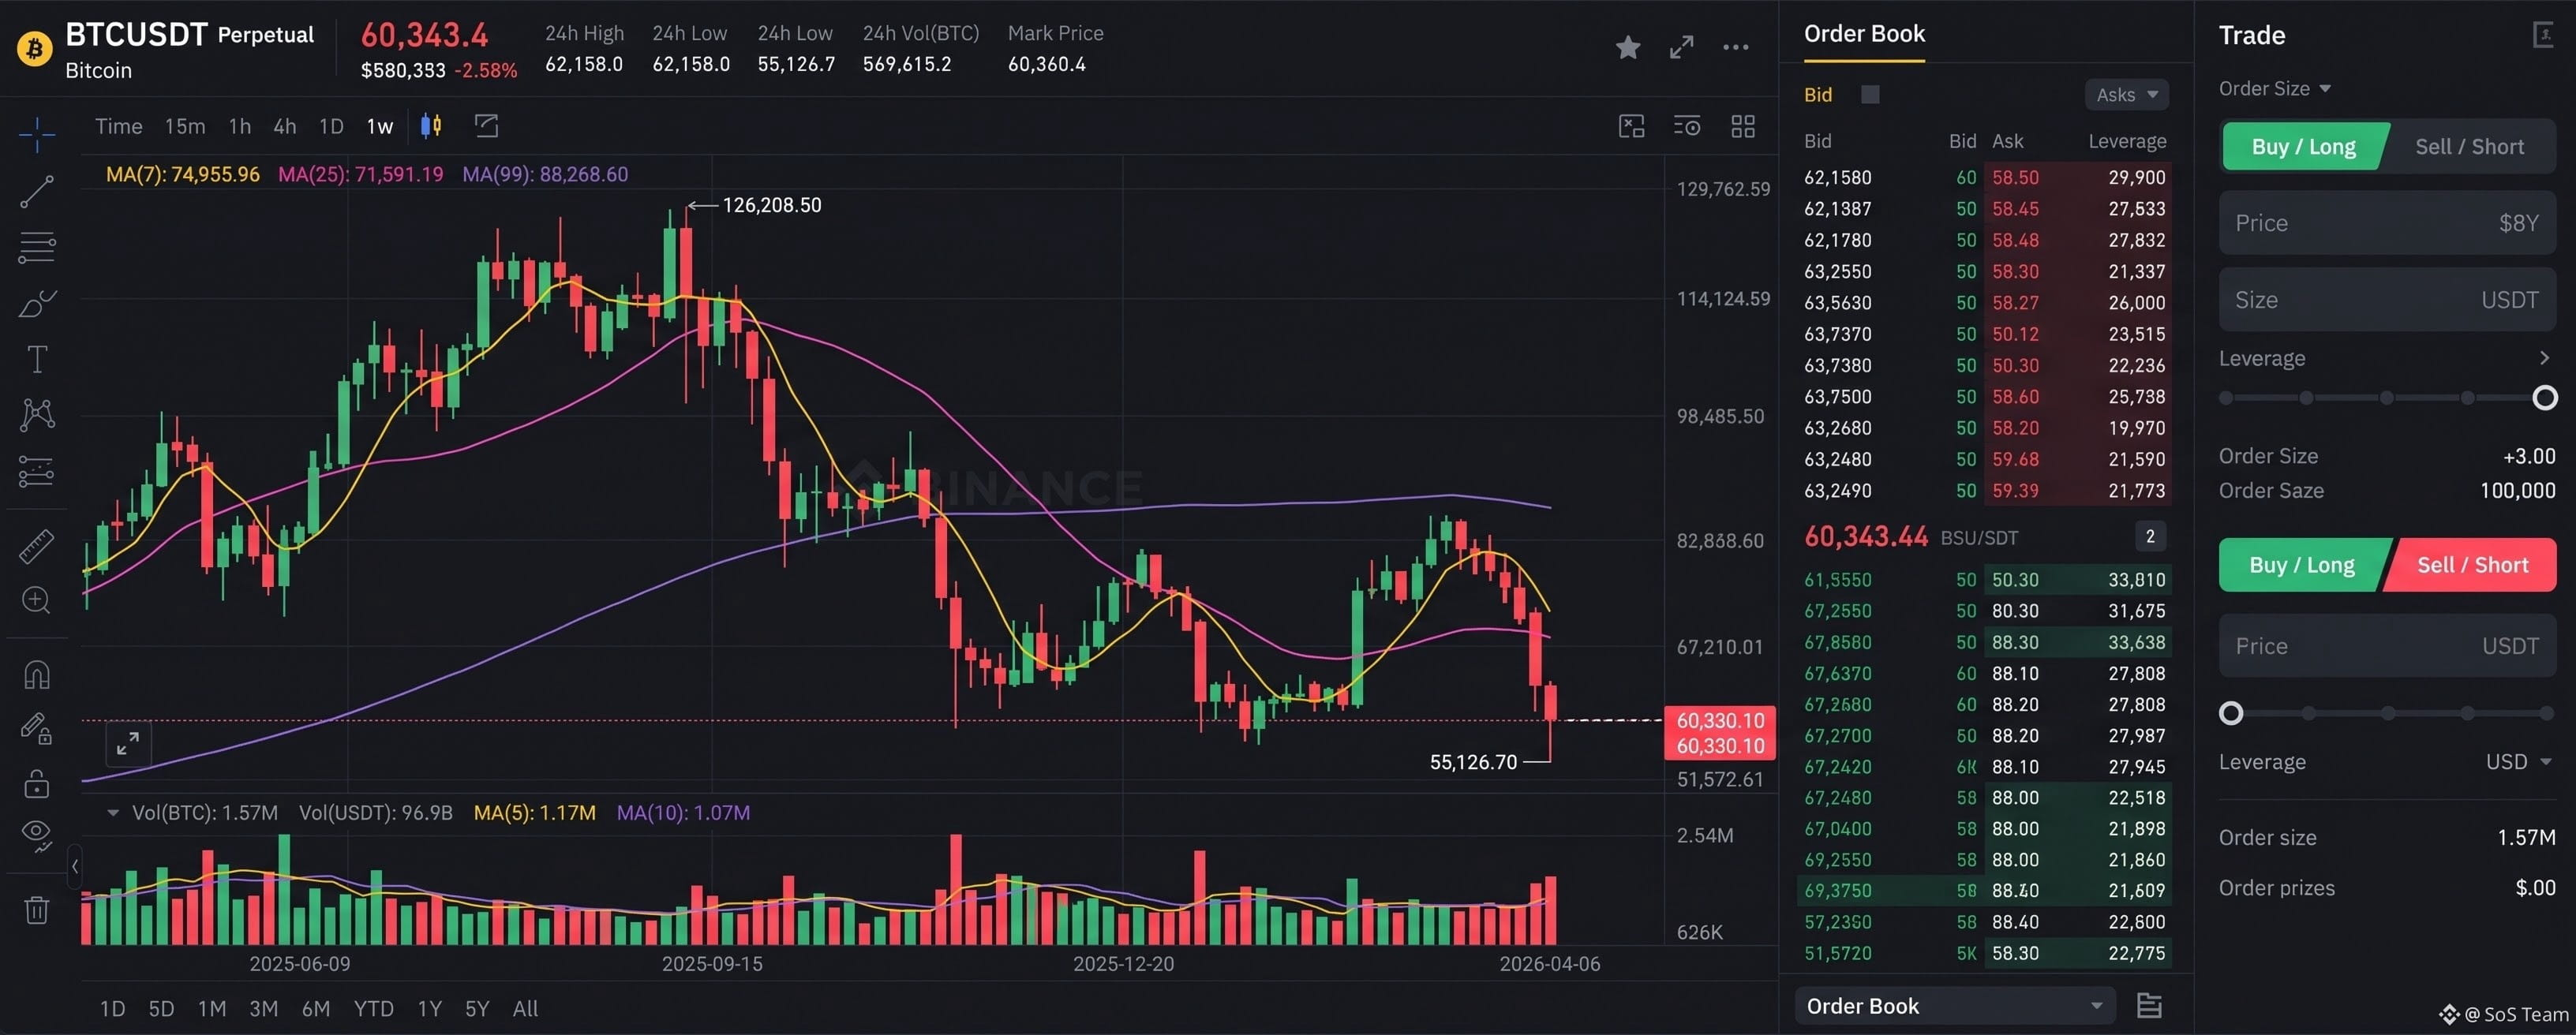
$BTC just bounced from a dramatic low of $55,130 and is trading around $60,109.99 (+1.54%) in your Binance chart snapshot.
But here's what makes this setup interesting! 👀
Buyers are showing signs of returning, with rising volume and a strong lower candle wick. However, $BTC remains below all three major moving averages:
MA7: $62,756
MA25: $71,858
MA99: $77,834
Potential Trading Setup:
Entry watch: $60,000–$60,500, only after confirmation.
TP1: $62,750
TP2: $63,850
TP3: $68,446
Invalidation: Breakdown below $55,130.
These are conditional reference levels, not a confirmed LONG signal.
The big question is:
Is $55K Bitcoin's bottom, or are we about to see another brutal sell-off? 🐻🐂
Are you buying this recovery or waiting for confirmation? 👇
#bitcoin #BTC #cryptouniverseofficial #BitcoinAnalysis #BinanceSquare
{spot}(BTCUSDT)
$BTC just bounced from a dramatic low of $55,130 and is trading around $60,109.99 (+1.54%) in your Binance chart snapshot.
But here's what makes this setup interesting! 👀
Buyers are showing signs of returning, with rising volume and a strong lower candle wick. However, $BTC remains below all three major moving averages:
MA7: $62,756
MA25: $71,858
MA99: $77,834
Potential Trading Setup:
Entry watch: $60,000–$60,500, only after confirmation.
TP1: $62,750
TP2: $63,850
TP3: $68,446
Invalidation: Breakdown below $55,130.
These are conditional reference levels, not a confirmed LONG signal.
The big question is:
Is $55K Bitcoin's bottom, or are we about to see another brutal sell-off? 🐻🐂
Are you buying this recovery or waiting for confirmation? 👇
#bitcoin #BTC #cryptouniverseofficial #BitcoinAnalysis #BinanceSquare
But here's what makes this setup interesting! 👀
Buyers are showing signs of returning, with rising volume and a strong lower candle wick. However, $BTC remains below all three major moving averages:
MA7: $62,756
MA25: $71,858
MA99: $77,834
Potential Trading Setup:
Entry watch: $60,000–$60,500, only after confirmation.
TP1: $62,750
TP2: $63,850
TP3: $68,446
Invalidation: Breakdown below $55,130.
These are conditional reference levels, not a confirmed LONG signal.
The big question is:
Is $55K Bitcoin's bottom, or are we about to see another brutal sell-off? 🐻🐂
Are you buying this recovery or waiting for confirmation? 👇
#bitcoin #BTC #cryptouniverseofficial #BitcoinAnalysis #BinanceSquare

76

·
--
Everyone thinks $BTC sliding below sixty thousand dollars is an automatic discount, but actually, blind dip-buying during an institutional exit is the easiest way to wreck your portfolio.
Most traders bleed capital not because they missed the peak, but because they rush into crumbling support levels and catch falling knives. Watching your account shrink while convincing yourself that you bought the bottom is an exhausting trap that wipes out months of hard work.
First, never treat crypto like an isolated island. When $BTC tumbled to roughly $58,700, dropping over 5% in a single day and sliding 53% below its October peak of $126,296, it was moving in lockstep with a heavy selloff in US tech and AI stocks. Trying to catch a crypto dip without watching traditional macro conditions is like paddling a kayak straight into a gathering storm.
Second, respect the institutional exit door. Retail buyers tried defending sixty thousand as a psychological shield, but BlackRock's IBIT ETF recorded a record $541 million in net outflows on Thursday, marking its largest single-day withdrawal to date. When major funds are actively heading for the exits, major assets like $ETH feel the collateral drag, and artificial floor prices can vanish in an instant.
Third, stop confusing impatience with long-term conviction. Sustainable market bottoms are built on quiet, boring accumulation where price action stabilizes over weeks, not on chaotic breakdown days. Giving yourself permission to wait on the sidelines until the dust settles will preserve far more capital than guessing the exact bottom.
Where do you think we find true support from here?
#Bitcoin #CryptoMarket #BTC
Everyone thinks $BTC sliding below sixty thousand dollars is an automatic discount, but actually, blind dip-buying during an institutional exit is the easiest way to wreck your portfolio.
Most traders bleed capital not because they missed the peak, but because they rush into crumbling support levels and catch falling knives. Watching your account shrink while convincing yourself that you bought the bottom is an exhausting trap that wipes out months of hard work.
First, never treat crypto like an isolated island. When $BTC tumbled to roughly $58,700, dropping over 5% in a single day and sliding 53% below its October peak of $126,296, it was moving in lockstep with a heavy selloff in US tech and AI stocks. Trying to catch a crypto dip without watching traditional macro conditions is like paddling a kayak straight into a gathering storm.
Second, respect the institutional exit door. Retail buyers tried defending sixty thousand as a psychological shield, but BlackRock's IBIT ETF recorded a record $541 million in net outflows on Thursday, marking its largest single-day withdrawal to date. When major funds are actively heading for the exits, major assets like $ETH feel the collateral drag, and artificial floor prices can vanish in an instant.
Third, stop confusing impatience with long-term conviction. Sustainable market bottoms are built on quiet, boring accumulation where price action stabilizes over weeks, not on chaotic breakdown days. Giving yourself permission to wait on the sidelines until the dust settles will preserve far more capital than guessing the exact bottom.
Where do you think we find true support from here?
#Bitcoin #CryptoMarket #BTC
Most traders bleed capital not because they missed the peak, but because they rush into crumbling support levels and catch falling knives. Watching your account shrink while convincing yourself that you bought the bottom is an exhausting trap that wipes out months of hard work.
First, never treat crypto like an isolated island. When $BTC tumbled to roughly $58,700, dropping over 5% in a single day and sliding 53% below its October peak of $126,296, it was moving in lockstep with a heavy selloff in US tech and AI stocks. Trying to catch a crypto dip without watching traditional macro conditions is like paddling a kayak straight into a gathering storm.
Second, respect the institutional exit door. Retail buyers tried defending sixty thousand as a psychological shield, but BlackRock's IBIT ETF recorded a record $541 million in net outflows on Thursday, marking its largest single-day withdrawal to date. When major funds are actively heading for the exits, major assets like $ETH feel the collateral drag, and artificial floor prices can vanish in an instant.
Third, stop confusing impatience with long-term conviction. Sustainable market bottoms are built on quiet, boring accumulation where price action stabilizes over weeks, not on chaotic breakdown days. Giving yourself permission to wait on the sidelines until the dust settles will preserve far more capital than guessing the exact bottom.
Where do you think we find true support from here?
#Bitcoin #CryptoMarket #BTC
139

·
--
Bullish
🚀 BITCOIN (BTC) – Bullish Momentum Is Back! 🟢
📊 Price Movement:
Previous Price: $5,513,000
Current Price: $6,037,664
Price Increase: +$524,664
Growth: +9.52% 🔥
Watch the trend. Respect the risk. Trade with a strategy. 📈
What's your next BTC target? 👇
#Bitcoin #BTC #CryptoMarket #BullishMomentum #Binance
🚀 BITCOIN (BTC) – Bullish Momentum Is Back! 🟢
📊 Price Movement:
Previous Price: $5,513,000
Current Price: $6,037,664
Price Increase: +$524,664
Growth: +9.52% 🔥
Watch the trend. Respect the risk. Trade with a strategy. 📈
What's your next BTC target? 👇
#Bitcoin #BTC #CryptoMarket #BullishMomentum #Binance
📊 Price Movement:
Previous Price: $5,513,000
Current Price: $6,037,664
Price Increase: +$524,664
Growth: +9.52% 🔥
Watch the trend. Respect the risk. Trade with a strategy. 📈
What's your next BTC target? 👇
#Bitcoin #BTC #CryptoMarket #BullishMomentum #Binance

1
165

·
--
🚨 BTC JUST BOUNCED +9.8%
$55,130 → $60,192
Yesterday everyone panicked $BTC hit its lowest since Sep 2024
$1.8B liquidated $11.3B losses in 7 days Fear at 8/100
Then shorts got trapped And BTC exploded back above $60K
Is this the bottom or just a trap?
What did you do at $55K?
🔴 Sold
🟢 Bought
🟡 Held
Comment 👇
{web3_wallet_create}(10x42778037d69350508cdd34d9fa17053970591101)
{spot}(BTCUSDT)
{spot}(ETHUSDT)
#BTC
#Crypto #CanBTCReboundAfterFallingBelow60K? #TwentyOneCapitalAdds172.25BTC
🚨 BTC JUST BOUNCED +9.8%
$55,130 → $60,192
Yesterday everyone panicked $BTC hit its lowest since Sep 2024
$1.8B liquidated $11.3B losses in 7 days Fear at 8/100
Then shorts got trapped And BTC exploded back above $60K
Is this the bottom or just a trap?
What did you do at $55K?
🔴 Sold
🟢 Bought
🟡 Held
Comment 👇
#BTC
#Crypto #CanBTCReboundAfterFallingBelow60K? #TwentyOneCapitalAdds172.25BTC
$55,130 → $60,192
Yesterday everyone panicked $BTC hit its lowest since Sep 2024
$1.8B liquidated $11.3B losses in 7 days Fear at 8/100
Then shorts got trapped And BTC exploded back above $60K
Is this the bottom or just a trap?
What did you do at $55K?
🔴 Sold
🟢 Bought
🟡 Held
Comment 👇
#BTC
#Crypto #CanBTCReboundAfterFallingBelow60K? #TwentyOneCapitalAdds172.25BTC

Mr KhaalOo:
☘️☘️☘️
3
2
11
1.4k

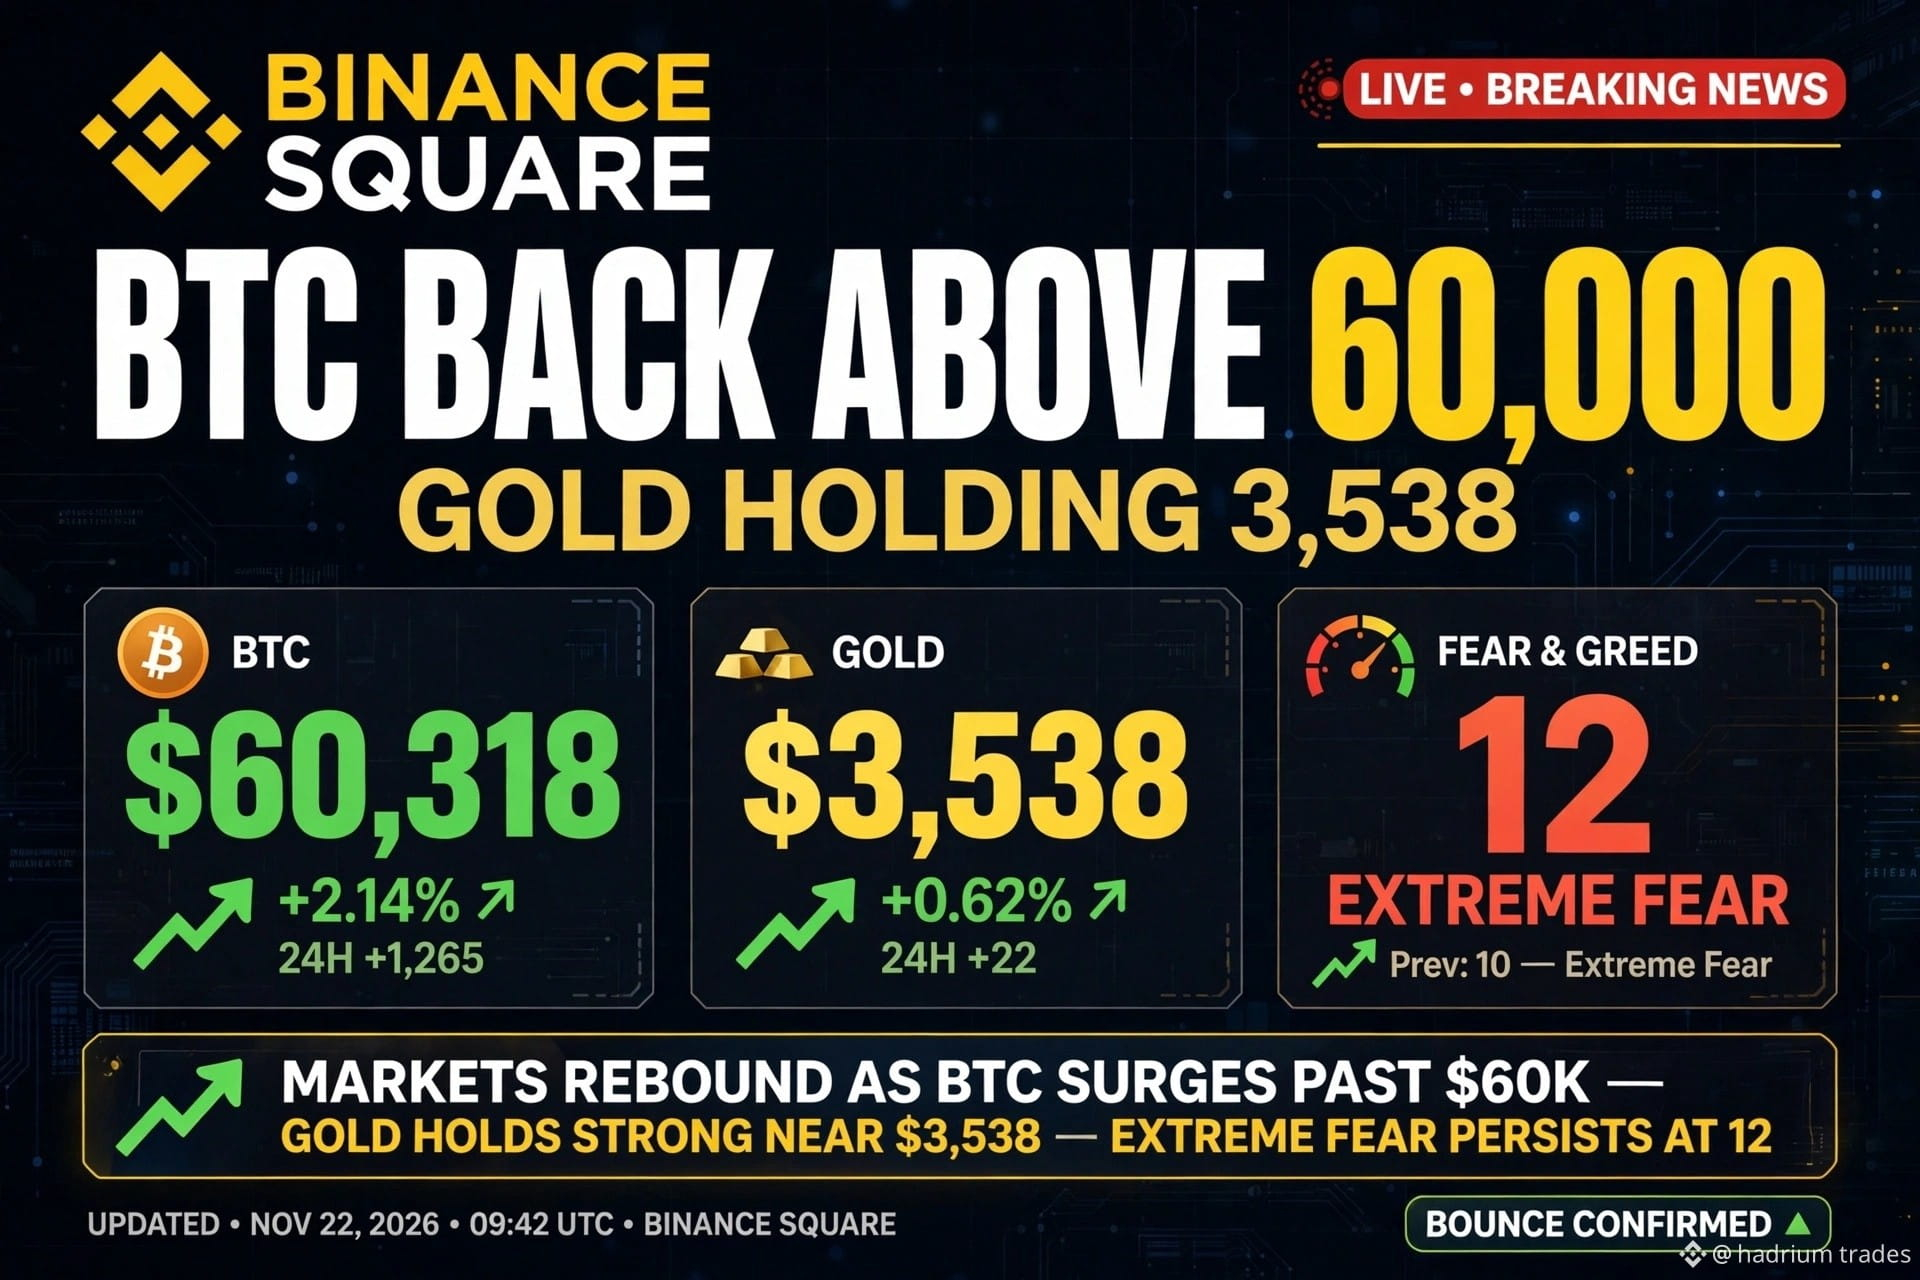
BTC IS BACK ABOVE $60,000! GOLD HOLDING $3,538! Did The BOTTOM Just Happen?
LIVE Today - 22 Nov:
BTC: $60,318 - BACK ABOVE $60K! +2.87% Today! Bounced From $55,130 Low!
GOLD: $3,538 - Holding Above $3,502 Low! Worst Week Since March is OVER?
FEAR: 12 - EXTREME FEAR! Bearish talk is everywhere!
My Last Post Got 650 Views! Thank You! This Is PART 13!
Yesterday Everyone Was Panicking:
BTC fell to $55,130 - Lowest since 2024!
GOLD fell to $3,502 - 14-month low!
Fear hit 6-12 - Lowest since February!
Everyone said "Sell! Sell! Sell!"
Today Market Said NO!
BTC bounced $55,130 -> $60,318 = +$5,188 BOUNCE! +9.4%!
GOLD held $3,502 -> $3,538 = Holding!
BTC is now up +2.14% to $60,192! Back above $60K for first time since Friday!
Why Did It Bounce?
1. Capitulation Done - Everyone who had to sell, sold!
2. Buyers Came At $55K - Smart money bought the fear!
3. Short Covering - Shorts had to buy back!
Is This REAL Bounce Or FAKE Bounce?
If BTC holds $60,000: Next $62,000 -> $65,000!
If BTC falls below $60,000 again: Next $57,000 -> $55,000!
GOLD: If holds $3,500: Next $3,600 -> $3,700! If breaks $3,500: Next $3,400!
My Plan As GOLD Trader:
I am NOT chasing. I am waiting for BOS.
No BOS, No Trade. 1% Risk Only.
My P&L is zero. I share learning, not fake profit.
If you want Part 14 - Dec 9 Fed War - follow me now. Otherwise you will miss the real move!
Do you think BOTTOM is IN or This Is A TRAP?
Comment BOTTOM or TRAP + Your Country 👇
I don't ask for follow. I earn it with truth.
NFA. Educational Only.
#BTC #Bitcoin #GOLD #XAUUSD #Fear #Crypto #GoldCrash #Bottom #bounce
BTC IS BACK ABOVE $60,000! GOLD HOLDING $3,538! Did The BOTTOM Just Happen?
LIVE Today - 22 Nov:
BTC: $60,318 - BACK ABOVE $60K! +2.87% Today! Bounced From $55,130 Low!
GOLD: $3,538 - Holding Above $3,502 Low! Worst Week Since March is OVER?
FEAR: 12 - EXTREME FEAR! Bearish talk is everywhere!
My Last Post Got 650 Views! Thank You! This Is PART 13!
Yesterday Everyone Was Panicking:
BTC fell to $55,130 - Lowest since 2024!
GOLD fell to $3,502 - 14-month low!
Fear hit 6-12 - Lowest since February!
Everyone said "Sell! Sell! Sell!"
Today Market Said NO!
BTC bounced $55,130 -> $60,318 = +$5,188 BOUNCE! +9.4%!
GOLD held $3,502 -> $3,538 = Holding!
BTC is now up +2.14% to $60,192! Back above $60K for first time since Friday!
Why Did It Bounce?
1. Capitulation Done - Everyone who had to sell, sold!
2. Buyers Came At $55K - Smart money bought the fear!
3. Short Covering - Shorts had to buy back!
Is This REAL Bounce Or FAKE Bounce?
If BTC holds $60,000: Next $62,000 -> $65,000!
If BTC falls below $60,000 again: Next $57,000 -> $55,000!
GOLD: If holds $3,500: Next $3,600 -> $3,700! If breaks $3,500: Next $3,400!
My Plan As GOLD Trader:
I am NOT chasing. I am waiting for BOS.
No BOS, No Trade. 1% Risk Only.
My P&L is zero. I share learning, not fake profit.
If you want Part 14 - Dec 9 Fed War - follow me now. Otherwise you will miss the real move!
Do you think BOTTOM is IN or This Is A TRAP?
Comment BOTTOM or TRAP + Your Country 👇
I don't ask for follow. I earn it with truth.
NFA. Educational Only.
#BTC #Bitcoin #GOLD #XAUUSD #Fear #Crypto #GoldCrash #Bottom #bounce
LIVE Today - 22 Nov:
BTC: $60,318 - BACK ABOVE $60K! +2.87% Today! Bounced From $55,130 Low!
GOLD: $3,538 - Holding Above $3,502 Low! Worst Week Since March is OVER?
FEAR: 12 - EXTREME FEAR! Bearish talk is everywhere!
My Last Post Got 650 Views! Thank You! This Is PART 13!
Yesterday Everyone Was Panicking:
BTC fell to $55,130 - Lowest since 2024!
GOLD fell to $3,502 - 14-month low!
Fear hit 6-12 - Lowest since February!
Everyone said "Sell! Sell! Sell!"
Today Market Said NO!
BTC bounced $55,130 -> $60,318 = +$5,188 BOUNCE! +9.4%!
GOLD held $3,502 -> $3,538 = Holding!
BTC is now up +2.14% to $60,192! Back above $60K for first time since Friday!
Why Did It Bounce?
1. Capitulation Done - Everyone who had to sell, sold!
2. Buyers Came At $55K - Smart money bought the fear!
3. Short Covering - Shorts had to buy back!
Is This REAL Bounce Or FAKE Bounce?
If BTC holds $60,000: Next $62,000 -> $65,000!
If BTC falls below $60,000 again: Next $57,000 -> $55,000!
GOLD: If holds $3,500: Next $3,600 -> $3,700! If breaks $3,500: Next $3,400!
My Plan As GOLD Trader:
I am NOT chasing. I am waiting for BOS.
No BOS, No Trade. 1% Risk Only.
My P&L is zero. I share learning, not fake profit.
If you want Part 14 - Dec 9 Fed War - follow me now. Otherwise you will miss the real move!
Do you think BOTTOM is IN or This Is A TRAP?
Comment BOTTOM or TRAP + Your Country 👇
I don't ask for follow. I earn it with truth.
NFA. Educational Only.
#BTC #Bitcoin #GOLD #XAUUSD #Fear #Crypto #GoldCrash #Bottom #bounce
209

·
--
🚨 BITCOIN JUST WIPED OUT $2.4 BILLION IN TRADER POSITIONS!
The market is sending a brutal warning, and leveraged bulls are paying the price.
Here's what just happened:
🔴 $BTC crashed below $57,000, hitting its lowest level since September 2024.
💥 $2.40 BILLION in crypto futures positions liquidated within 24 hours.
📉 Bitcoin futures liquidations exceeded $1 BILLION.
⚠️ ETH traders also suffered approximately $545 MILLION in liquidations.
📊 BTC has recovered toward $59,300, but the bigger picture remains bearish.
What's driving this crash?
• Rising US Treasury yields.
• Growing expectations of Fed rate hikes.
• Weakness across global risk assets.
• Excessive leverage and aggressive bullish positioning.
THE BIG QUESTION NOW:
Is this a temporary liquidity flush before a major recovery, or are we witnessing another leg down in Bitcoin's bear market?
One thing is certain: Trading with excessive leverage in this market can be extremely dangerous.
{spot}(BTCUSDT)
#BTC #CryptoMarketMoves
🚨 BITCOIN JUST WIPED OUT $2.4 BILLION IN TRADER POSITIONS!
The market is sending a brutal warning, and leveraged bulls are paying the price.
Here's what just happened:
🔴 $BTC crashed below $57,000, hitting its lowest level since September 2024.
💥 $2.40 BILLION in crypto futures positions liquidated within 24 hours.
📉 Bitcoin futures liquidations exceeded $1 BILLION.
⚠️ ETH traders also suffered approximately $545 MILLION in liquidations.
📊 BTC has recovered toward $59,300, but the bigger picture remains bearish.
What's driving this crash?
• Rising US Treasury yields.
• Growing expectations of Fed rate hikes.
• Weakness across global risk assets.
• Excessive leverage and aggressive bullish positioning.
THE BIG QUESTION NOW:
Is this a temporary liquidity flush before a major recovery, or are we witnessing another leg down in Bitcoin's bear market?
One thing is certain: Trading with excessive leverage in this market can be extremely dangerous.
#BTC #CryptoMarketMoves
The market is sending a brutal warning, and leveraged bulls are paying the price.
Here's what just happened:
🔴 $BTC crashed below $57,000, hitting its lowest level since September 2024.
💥 $2.40 BILLION in crypto futures positions liquidated within 24 hours.
📉 Bitcoin futures liquidations exceeded $1 BILLION.
⚠️ ETH traders also suffered approximately $545 MILLION in liquidations.
📊 BTC has recovered toward $59,300, but the bigger picture remains bearish.
What's driving this crash?
• Rising US Treasury yields.
• Growing expectations of Fed rate hikes.
• Weakness across global risk assets.
• Excessive leverage and aggressive bullish positioning.
THE BIG QUESTION NOW:
Is this a temporary liquidity flush before a major recovery, or are we witnessing another leg down in Bitcoin's bear market?
One thing is certain: Trading with excessive leverage in this market can be extremely dangerous.
#BTC #CryptoMarketMoves

1
80
Log in to explore more content
Join global crypto users on Binance Square
⚡️ Get latest and useful information about crypto.
💬 Trusted by the world’s largest crypto exchange.
👍 Discover real insights from verified creators.
Email / Phone number
Trending Topics
1
#NvidiaLoses$2.7TrillionInMonthAndAHalf
26,783 views
154 Discussing
2
#CanBTCReboundAfterFallingBelow60K?
831,663 views
3,136 Discussing
3
#GlobalStocksFaceLongestLosingStreakSince2023
309,960 views
2,099 Discussing
4
#BlackRockIBITPostsRecord$541MSingleDayOutflow
38,827 views
113 Discussing
5
#AnthropicPlungesTowardIPOPriceonDay2
159,855 views
1,275 Discussing
6
#TwentyOneCapitalAdds172.25BTC
74,045 views
716 Discussing
7
#HKBillWouldExcludeTokenizedDepositsFromVirtualAssets
10,348 views
52 Discussing
8
#BNBDropsBelow540USDTWith8.46%DailyDecline
85,200 views
689 Discussing
9
#HKBillProposesHK$100KFineForUnauthorizedCryptoTitles
2,899 views
26 Discussing
10
#BitMineFaces$10.1BUnrealizedETHLoss
6,004 views
30 Discussing