
#bitcoinrainbow
bitcoinrainbow
3,923 views
7 Discussing
Hot
Latest

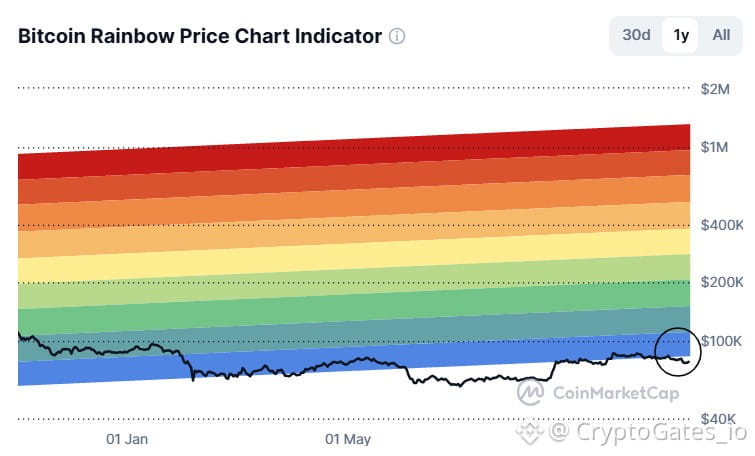
$BTC : Rainbow Chart shows price in the lower bands 📊
price is trading near the bottom of the log regression bands on the 1Y view.
Interpretation: relative to long term trend, BTC is in a cheaper zone of this model. The model has no timing component.
Lesson: lower bands have often come with long sideways phases. Staged entries and sized risk matter more than guessing the exact low.
If you run a DCA plan, test your interval and step size on historical data first.
#BTC #DCA #BitcoinRainbow
$BTC : Rainbow Chart shows price in the lower bands 📊
price is trading near the bottom of the log regression bands on the 1Y view.
Interpretation: relative to long term trend, BTC is in a cheaper zone of this model. The model has no timing component.
Lesson: lower bands have often come with long sideways phases. Staged entries and sized risk matter more than guessing the exact low.
If you run a DCA plan, test your interval and step size on historical data first.
#BTC #DCA #BitcoinRainbow
price is trading near the bottom of the log regression bands on the 1Y view.
Interpretation: relative to long term trend, BTC is in a cheaper zone of this model. The model has no timing component.
Lesson: lower bands have often come with long sideways phases. Staged entries and sized risk matter more than guessing the exact low.
If you run a DCA plan, test your interval and step size on historical data first.
#BTC #DCA #BitcoinRainbow
61

·
--
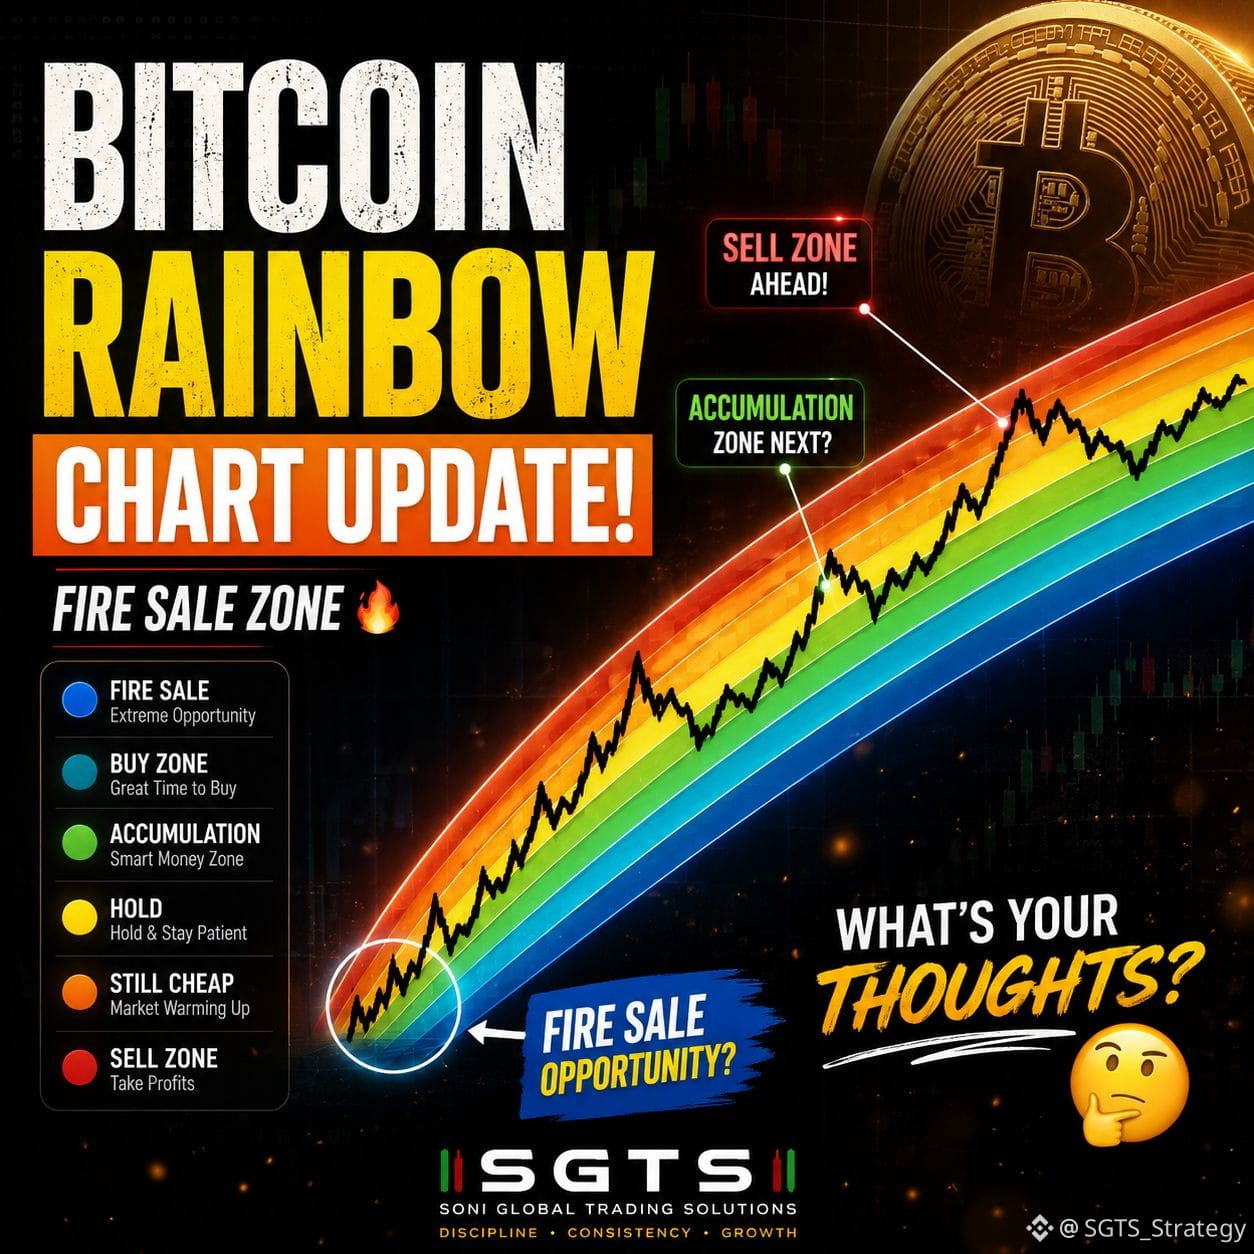
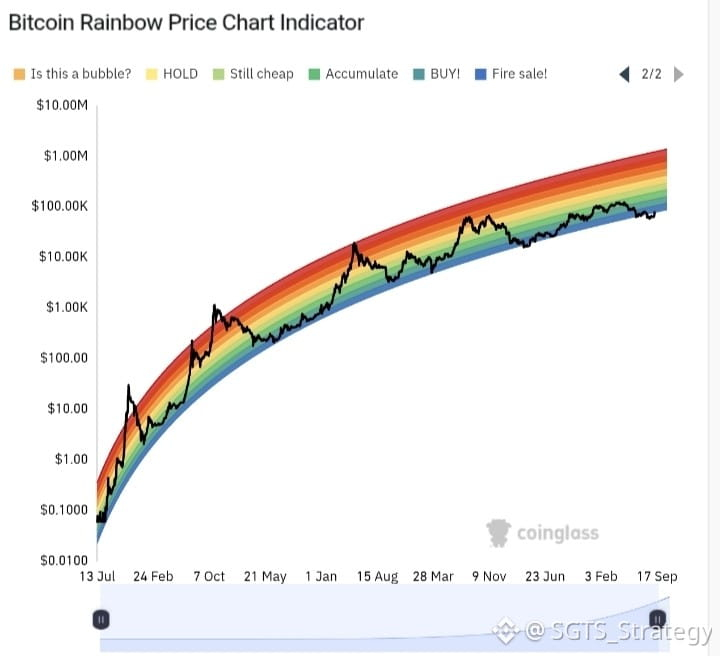
$BTC | The Bitcoin Rainbow Chart compresses cycle-position into nine logarithmic regression bands across a single colour ramp. Red (Maximum Bubble Territory) historically caught Dec 2013, Dec 2017, Apr 2021, and the late 2025 cluster. Dark blue (Buy / Accumulate) caught Jan 2015, Dec 2018, and Nov 2022.
The honest framing: it is the same log-log regression underneath as Bitcoin Power Law, just visualised differently. Useful as a quick-glance cycle-position read for a confluence stack, not load-bearing on its own.
Inside the SatoshiMacro Model it sits as a secondary visual in the Tier 1 Valuation card.
Full historical chart: https://satoshimacro.com/tools/crypto/cycle-indicators/bitcoin-rainbow-chart/
#SatoshiMacro #BitcoinRainbow #OnChain #Bitcoin
$BTC | The Bitcoin Rainbow Chart compresses cycle-position into nine logarithmic regression bands across a single colour ramp. Red (Maximum Bubble Territory) historically caught Dec 2013, Dec 2017, Apr 2021, and the late 2025 cluster. Dark blue (Buy / Accumulate) caught Jan 2015, Dec 2018, and Nov 2022.
The honest framing: it is the same log-log regression underneath as Bitcoin Power Law, just visualised differently. Useful as a quick-glance cycle-position read for a confluence stack, not load-bearing on its own.
Inside the SatoshiMacro Model it sits as a secondary visual in the Tier 1 Valuation card.
Full historical chart: https://satoshimacro.com/tools/crypto/cycle-indicators/bitcoin-rainbow-chart/
#SatoshiMacro #BitcoinRainbow #OnChain #Bitcoin
The honest framing: it is the same log-log regression underneath as Bitcoin Power Law, just visualised differently. Useful as a quick-glance cycle-position read for a confluence stack, not load-bearing on its own.
Inside the SatoshiMacro Model it sits as a secondary visual in the Tier 1 Valuation card.
Full historical chart: https://satoshimacro.com/tools/crypto/cycle-indicators/bitcoin-rainbow-chart/
#SatoshiMacro #BitcoinRainbow #OnChain #Bitcoin
1
123

Do you think BTC will move into the Accumulation Zone? 🌈₿
#BitcoinRainbow
{future}(BTCUSDT)
Do you think BTC will move into the Accumulation Zone? 🌈₿
#BitcoinRainbow
#BitcoinRainbow
92
Log in to explore more content
Join global crypto users on Binance Square
⚡️ Get latest and useful information about crypto.
💬 Trusted by the world’s largest crypto exchange.
👍 Discover real insights from verified creators.
Email / Phone number
Trending Topics
1
#BTCRebounds80K
2,158 views
229 Discussing
2
#Binance98PercentReplenished
5,904 views
310 Discussing
3
#USMidterms-WhatAreMarketsExpecting?
229,201 views
1,755 Discussing
4
#USOctoberNFP-AreRateCutsStillPossible
331,525 views
2,627 Discussing
5
#AMDBeatsExpectations-AINarrativeContinues
63,089 views
672 Discussing
6
#CircleQ3Revenue865M
13,072 views
358 Discussing
7
#BinanceIncidentReport
411,238 views
1,951 Discussing
8
#USStocksOpenHigherAsDowGains1.9%
1,060 views
45 Discussing
9
#ADPUSPrivateEmployersAdd86000JobsInOctober
594 views
27 Discussing
10
#FrenchAssemblyPassesSelfCustodiedCryptoReportingAmendment
353 views
12 Discussing