
#sol
sol
121.1M views
294,284 Discussing
Hot
Latest


·
--
Bearish
$123M Worth of $SOL Moves to Coinbase Prime… Should Holders Be Worried?
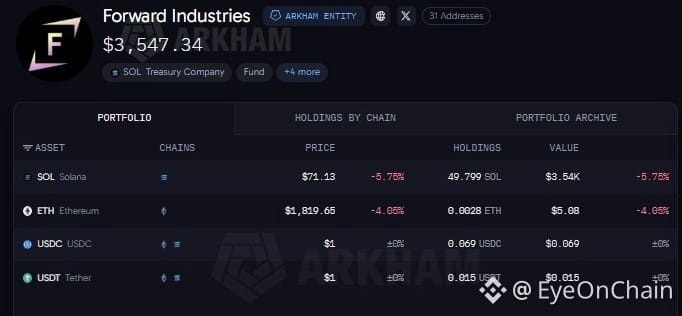
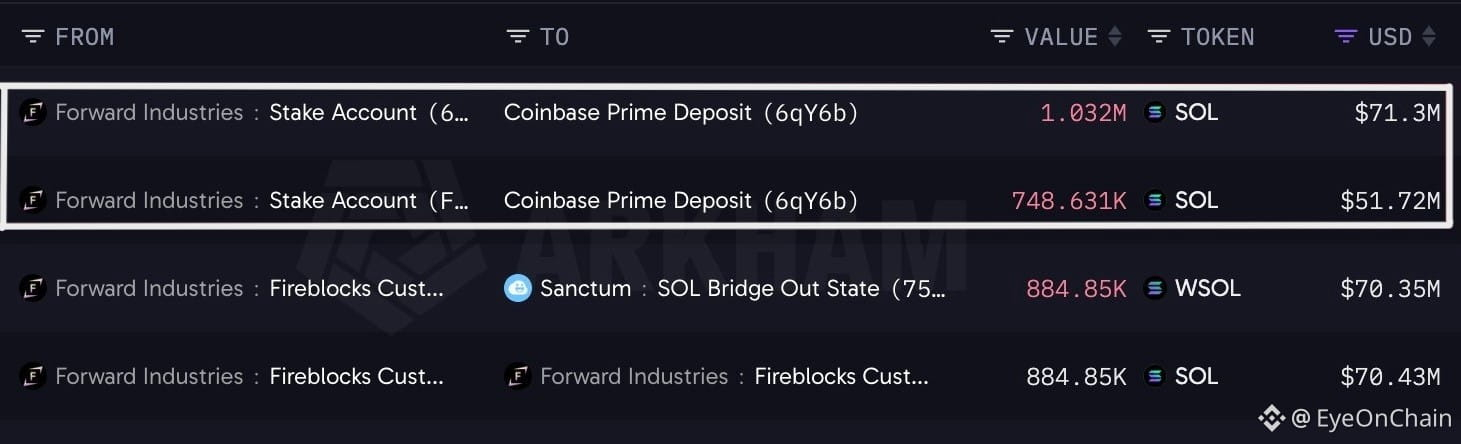
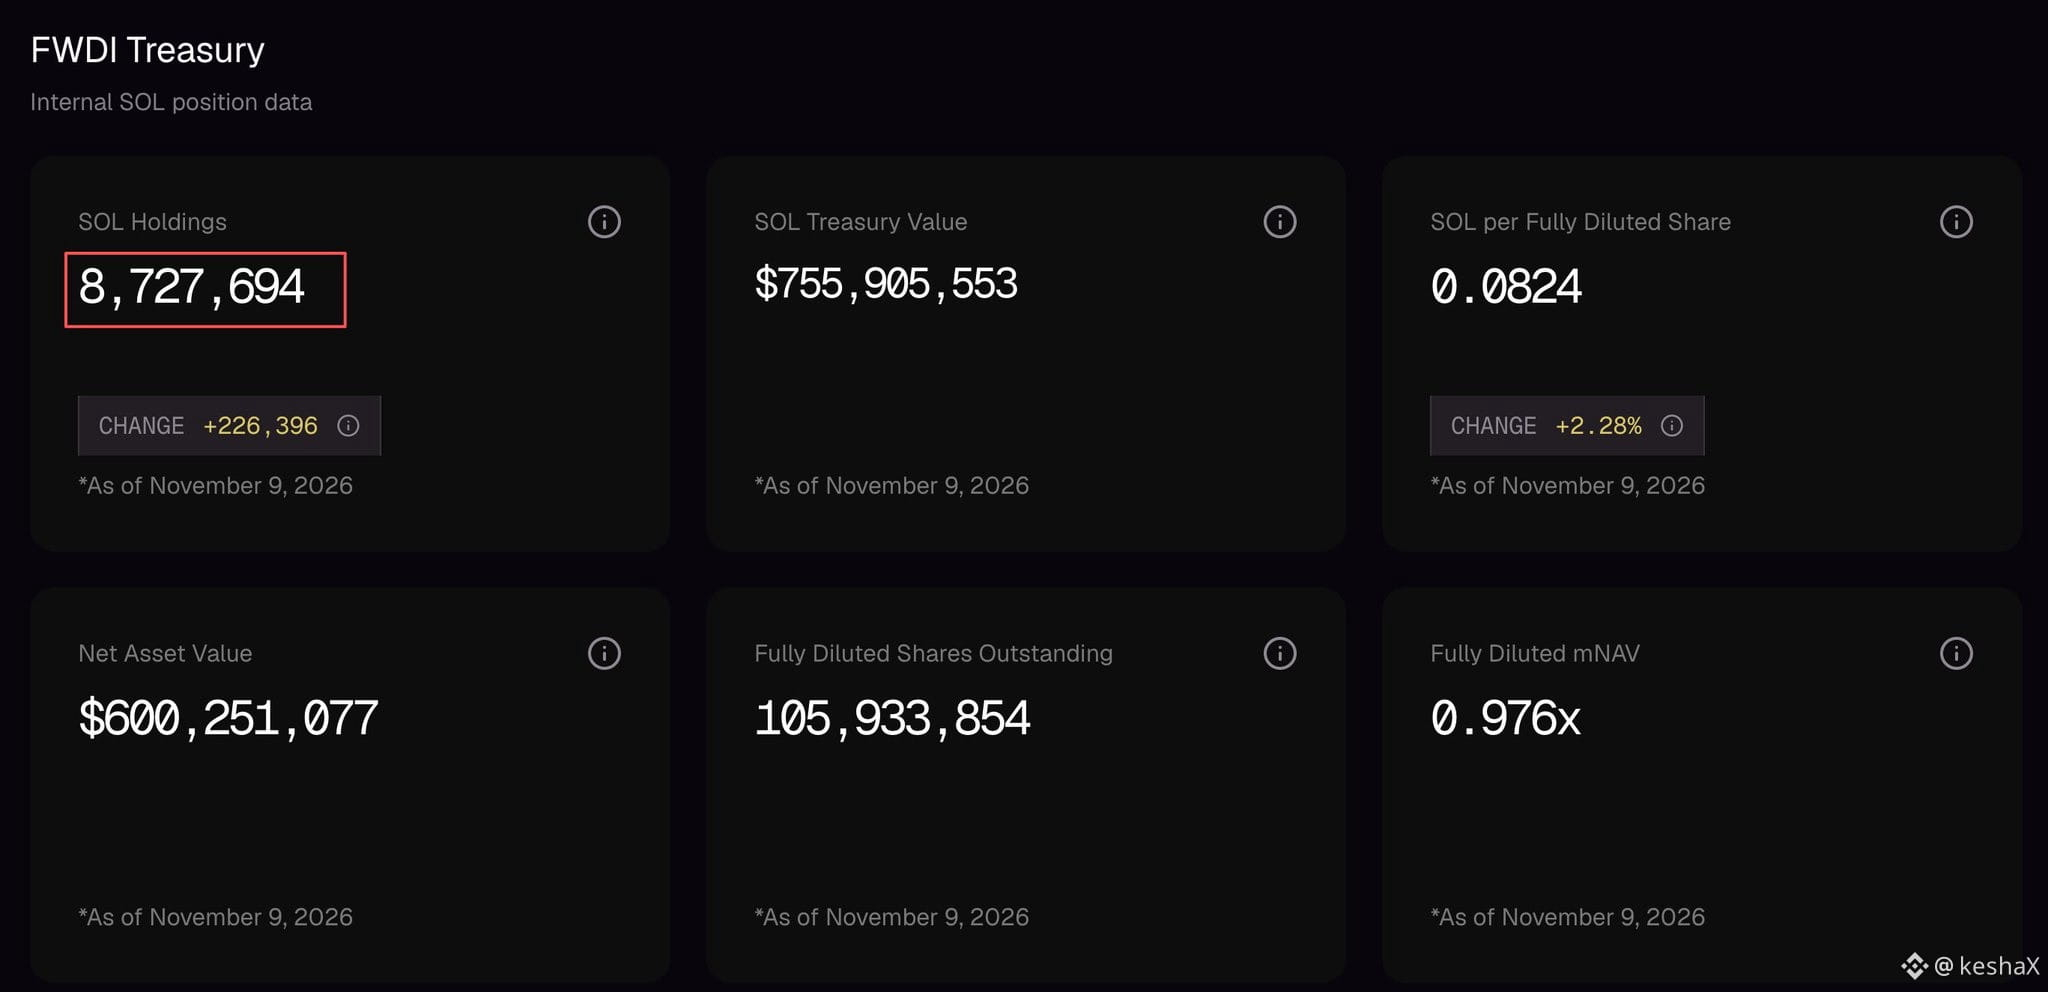
Forward Industries, the Solana treasury giant. The company, which reportedly holds around 8.73M #sol worth approximately $600M, has just transferred another 1.78M SOL, valued at roughly $123M, into Coinbase Prime.
That's a pretty sizeable chunk of its #SOL treasury moving to an exchange-related platform. Now the big question is… what's the plan here? Is Forward Industries preparing to sell some of its holdings, repositioning its treasury, or simply moving funds for other purposes? FURTHER PLEASE NOTE: A Coinbase Prime deposit doesn't automatically mean a sell-off is coming, but with $123M involved, this is definitely a wallet movement worth watching.
Wallet tracker: https://arkm.com/explorer/entity/forward-industries
{future}(SOLUSDT)
{spot}(SOLUSDT)
$123M Worth of $SOL Moves to Coinbase Prime… Should Holders Be Worried?
Forward Industries, the Solana treasury giant. The company, which reportedly holds around 8.73M #sol worth approximately $600M, has just transferred another 1.78M SOL, valued at roughly $123M, into Coinbase Prime.
That's a pretty sizeable chunk of its #SOL treasury moving to an exchange-related platform. Now the big question is… what's the plan here? Is Forward Industries preparing to sell some of its holdings, repositioning its treasury, or simply moving funds for other purposes? FURTHER PLEASE NOTE: A Coinbase Prime deposit doesn't automatically mean a sell-off is coming, but with $123M involved, this is definitely a wallet movement worth watching.
Wallet tracker: https://arkm.com/explorer/entity/forward-industries
Forward Industries, the Solana treasury giant. The company, which reportedly holds around 8.73M #sol worth approximately $600M, has just transferred another 1.78M SOL, valued at roughly $123M, into Coinbase Prime.
That's a pretty sizeable chunk of its #SOL treasury moving to an exchange-related platform. Now the big question is… what's the plan here? Is Forward Industries preparing to sell some of its holdings, repositioning its treasury, or simply moving funds for other purposes? FURTHER PLEASE NOTE: A Coinbase Prime deposit doesn't automatically mean a sell-off is coming, but with $123M involved, this is definitely a wallet movement worth watching.
Wallet tracker: https://arkm.com/explorer/entity/forward-industries
Muzamil_Trader1:
True, $72 is a crucial level right now. If it loses this support, we might retest the $68 area before any strong bounce."
2
2
2k

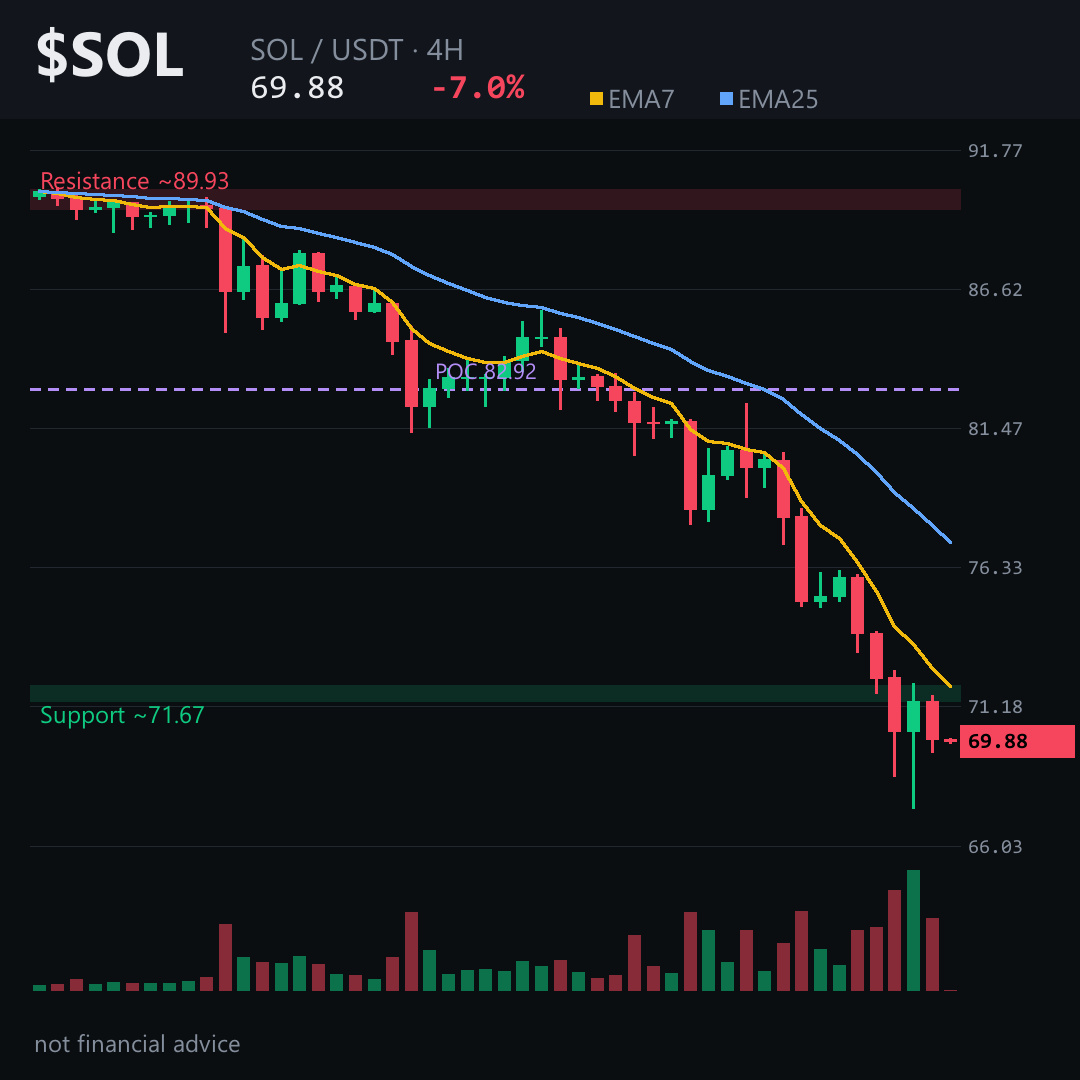
A 13% daily range and RSI buried at 21.86 — Solana isn't just dipping, it's looking for a floor and hasn't found one yet.
The 4H chart is the cleanest read here. Price is pinned below the 73–74 zone with zero hesitation. That's the line in the sand — a bearish gap sits right there, unfilled, acting like a ceiling every bounce tries to kiss and fails. If $SOL keeps rejecting that area on closes, the path of least resistance stays lower, toward the mid-64s. Lose that and the swing picture opens up toward 60.
What makes this dangerous isn't the red candles alone. Funding is still positive while the crowd sits heavily net long. That's not a squeeze setup — it's a pressure cooker. Longs are paying to hold while price keeps sliding. Open interest is thin, so don't expect a violent flush. Expect a slow bleed until that 73–74 wall breaks or the bid finally shows up.
The invalidation is simple: a 4H close back above the 74 area flips this read. Until then, every pop toward it looks like a lower high, not a reversal.
My read: the trend is down, the bounce attempts are weak, and the real risk is chasing green candles before the structure changes.
Tap $SOL to pull up the chart and see where these zones sit. What level are you watching for the first real sign of strength? 👇
Follow for the next read on this chart.
⚠️ Not financial advice. DYOR.
#SOL #Solana #Crypto #BinanceSquare
A 13% daily range and RSI buried at 21.86 — Solana isn't just dipping, it's looking for a floor and hasn't found one yet.
The 4H chart is the cleanest read here. Price is pinned below the 73–74 zone with zero hesitation. That's the line in the sand — a bearish gap sits right there, unfilled, acting like a ceiling every bounce tries to kiss and fails. If $SOL keeps rejecting that area on closes, the path of least resistance stays lower, toward the mid-64s. Lose that and the swing picture opens up toward 60.
What makes this dangerous isn't the red candles alone. Funding is still positive while the crowd sits heavily net long. That's not a squeeze setup — it's a pressure cooker. Longs are paying to hold while price keeps sliding. Open interest is thin, so don't expect a violent flush. Expect a slow bleed until that 73–74 wall breaks or the bid finally shows up.
The invalidation is simple: a 4H close back above the 74 area flips this read. Until then, every pop toward it looks like a lower high, not a reversal.
My read: the trend is down, the bounce attempts are weak, and the real risk is chasing green candles before the structure changes.
Tap $SOL to pull up the chart and see where these zones sit. What level are you watching for the first real sign of strength? 👇
Follow for the next read on this chart.
⚠️ Not financial advice. DYOR.
#SOL #Solana #Crypto #BinanceSquare
The 4H chart is the cleanest read here. Price is pinned below the 73–74 zone with zero hesitation. That's the line in the sand — a bearish gap sits right there, unfilled, acting like a ceiling every bounce tries to kiss and fails. If $SOL keeps rejecting that area on closes, the path of least resistance stays lower, toward the mid-64s. Lose that and the swing picture opens up toward 60.
What makes this dangerous isn't the red candles alone. Funding is still positive while the crowd sits heavily net long. That's not a squeeze setup — it's a pressure cooker. Longs are paying to hold while price keeps sliding. Open interest is thin, so don't expect a violent flush. Expect a slow bleed until that 73–74 wall breaks or the bid finally shows up.
The invalidation is simple: a 4H close back above the 74 area flips this read. Until then, every pop toward it looks like a lower high, not a reversal.
My read: the trend is down, the bounce attempts are weak, and the real risk is chasing green candles before the structure changes.
Tap $SOL to pull up the chart and see where these zones sit. What level are you watching for the first real sign of strength? 👇
Follow for the next read on this chart.
⚠️ Not financial advice. DYOR.
#SOL #Solana #Crypto #BinanceSquare
DopamineGLOBAL:
funding still positive while it bleeds, 73-74 needs to break
1
456

🟣 $SOL BREAKS $80 — AND KEEPS SLIDING
Solana: ~$70.90, down ~6.2% in 24h — one of the steepest falls in the top 10.
It lost $80, then $78, then $76. No bounce yet.
SOL is now -42% over the last year.
The fastest chain in crypto is also falling the fastest today.
Where do SOL buyers step back in? 👀
Not financial advice. #Solana #SOL
🟣 $SOL BREAKS $80 — AND KEEPS SLIDING
Solana: ~$70.90, down ~6.2% in 24h — one of the steepest falls in the top 10.
It lost $80, then $78, then $76. No bounce yet.
SOL is now -42% over the last year.
The fastest chain in crypto is also falling the fastest today.
Where do SOL buyers step back in? 👀
Not financial advice. #Solana #SOL
Solana: ~$70.90, down ~6.2% in 24h — one of the steepest falls in the top 10.
It lost $80, then $78, then $76. No bounce yet.
SOL is now -42% over the last year.
The fastest chain in crypto is also falling the fastest today.
Where do SOL buyers step back in? 👀
Not financial advice. #Solana #SOL
Milly Yerkovich Y0tJ:
🚀 LET'S CONNECT, LEARN & GROW TOGETHER! 🤝
Are you new to cryptocurrency or looking to improve your trading knowledge? You're in the right place!
Let's connect, support one another, share valuable insights, and explore exciting opportunities in the crypto space.
Follow my page, and I'll gladly follow back. Together, we can learn, grow, and succeed as a stronger crypto community.
Your growth is my growth. Let's make it happen! 📈🌍
#CryptoCommunity #BinanceSquare #CryptoTrading #FollowForFollow
2
1
392

·
--
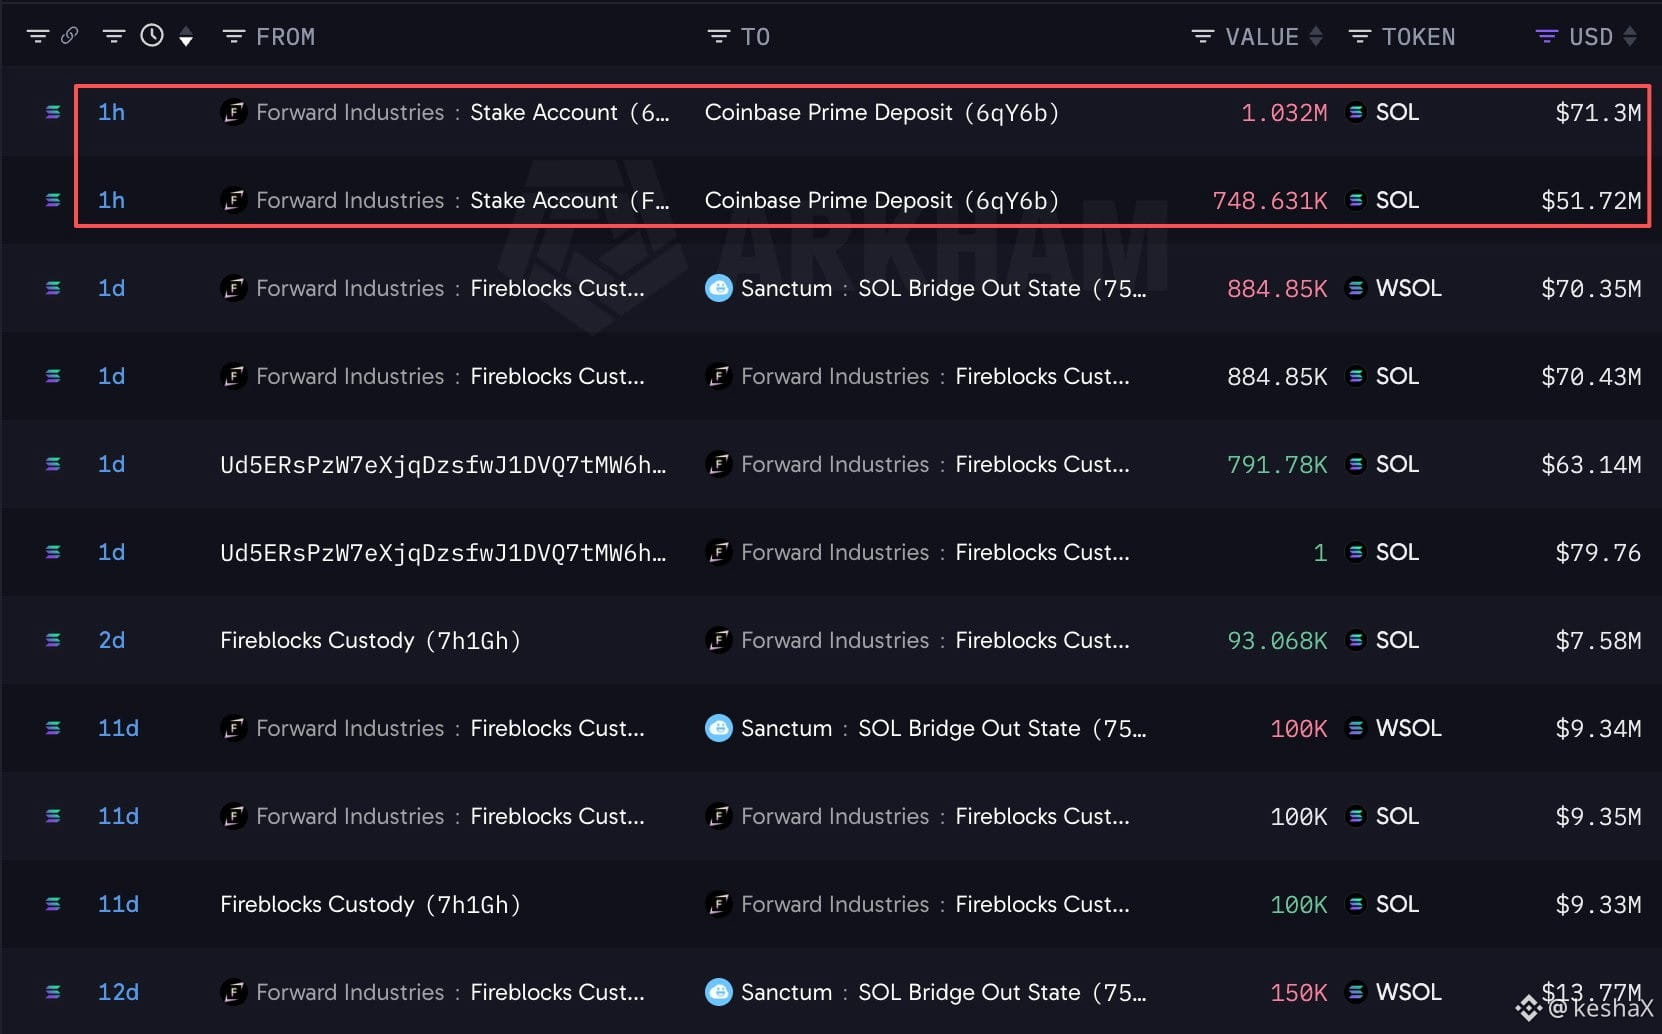
🧐 1.78M $SOL HIT COINBASE PRIME. FORWARD SAYS IT WASN'T THEM
Lookonchain flagged Forward Industries, the largest Solana treasury company, depositing 1.78M SOL (~$123M) into Coinbase Prime overnight. That's roughly 20% of its 8.73M SOL stack.
Arkham labels show the coins leaving Forward stake accounts. The company now denies the transfer, and The Defiant reports ownership is disputed. The movement itself is confirmed on-chain.
Same morning, a separate whale unstaked and sent 162.56K SOL to Binance, bringing its total to ~435K SOL (~$32.96M) in 5 days.
SOL slipped under $70, with a low of $67.41 on Binance.
Who do you trust on this one: the chain labels or the company?
#Solana #SOL #ForwardIndustries #OnchainData
🧐 1.78M $SOL HIT COINBASE PRIME. FORWARD SAYS IT WASN'T THEM
Lookonchain flagged Forward Industries, the largest Solana treasury company, depositing 1.78M SOL (~$123M) into Coinbase Prime overnight. That's roughly 20% of its 8.73M SOL stack.
Arkham labels show the coins leaving Forward stake accounts. The company now denies the transfer, and The Defiant reports ownership is disputed. The movement itself is confirmed on-chain.
Same morning, a separate whale unstaked and sent 162.56K SOL to Binance, bringing its total to ~435K SOL (~$32.96M) in 5 days.
SOL slipped under $70, with a low of $67.41 on Binance.
Who do you trust on this one: the chain labels or the company?
#Solana #SOL #ForwardIndustries #OnchainData
Lookonchain flagged Forward Industries, the largest Solana treasury company, depositing 1.78M SOL (~$123M) into Coinbase Prime overnight. That's roughly 20% of its 8.73M SOL stack.
Arkham labels show the coins leaving Forward stake accounts. The company now denies the transfer, and The Defiant reports ownership is disputed. The movement itself is confirmed on-chain.
Same morning, a separate whale unstaked and sent 162.56K SOL to Binance, bringing its total to ~435K SOL (~$32.96M) in 5 days.
SOL slipped under $70, with a low of $67.41 on Binance.
Who do you trust on this one: the chain labels or the company?
#Solana #SOL #ForwardIndustries #OnchainData
1
816

{spot}(SOLUSDT)
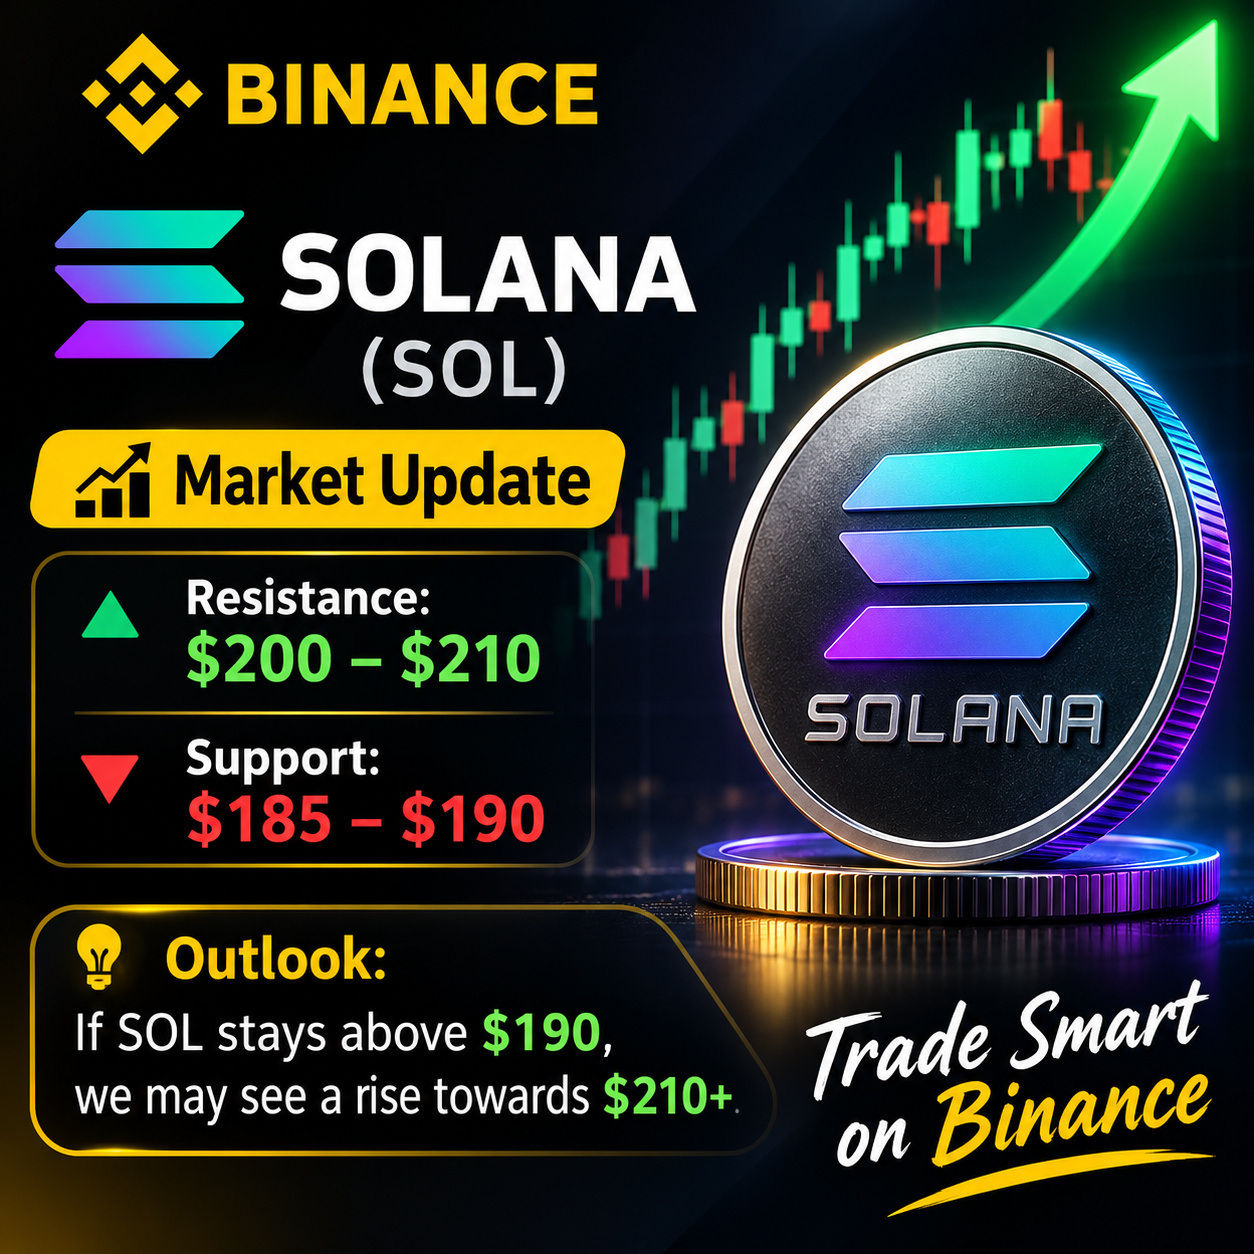
🚀 SOLANA ($SOL ) Market Update
⚡ Solana is gaining attention in the crypto market!
🟢 Resistance: $200–$210
🔴 Support: $185–$190
📈 If SOL holds above $190, a move towards $210+ could be possible.
💡 Stay patient and trade smart!
Are you bullish on SOL? 🐂
#SOL #Solana #Crypto #Altcoins! #BinanceExplorers
🚀 SOLANA ($SOL ) Market Update
⚡ Solana is gaining attention in the crypto market!
🟢 Resistance: $200–$210
🔴 Support: $185–$190
📈 If SOL holds above $190, a move towards $210+ could be possible.
💡 Stay patient and trade smart!
Are you bullish on SOL? 🐂
#SOL #Solana #Crypto #Altcoins! #BinanceExplorers
⚡ Solana is gaining attention in the crypto market!
🟢 Resistance: $200–$210
🔴 Support: $185–$190
📈 If SOL holds above $190, a move towards $210+ could be possible.
💡 Stay patient and trade smart!
Are you bullish on SOL? 🐂
#SOL #Solana #Crypto #Altcoins! #BinanceExplorers
1
238

·
--
$SOL at the Crossroads: Will $74.80 Hold? 📉
Solana ($SOL ) is currently hovering around $75.53 under a persistent 1-hour bearish trend, placing the asset at a crucial technical juncture where all eyes are locked on the vital $74.80 support zone. If bulls successfully defend this key support floor, we could see a swift relief recovery pushing toward the $80 to $82.50 resistance band, whereas losing this barrier opens the door to a deeper slide down toward $72.70. While short-term bounces offer quick trading opportunities, a definitive reclaim of the $80 level remains key before shifting to a broader bullish bias—so watch the charts closely and manage your risk!
{spot}(SOLUSDT)
#BinanceSquare #SOL #Solana #CryptoTrading #MarketAnalysis
$SOL at the Crossroads: Will $74.80 Hold? 📉
Solana ($SOL ) is currently hovering around $75.53 under a persistent 1-hour bearish trend, placing the asset at a crucial technical juncture where all eyes are locked on the vital $74.80 support zone. If bulls successfully defend this key support floor, we could see a swift relief recovery pushing toward the $80 to $82.50 resistance band, whereas losing this barrier opens the door to a deeper slide down toward $72.70. While short-term bounces offer quick trading opportunities, a definitive reclaim of the $80 level remains key before shifting to a broader bullish bias—so watch the charts closely and manage your risk!
#BinanceSquare #SOL #Solana #CryptoTrading #MarketAnalysis
Solana ($SOL ) is currently hovering around $75.53 under a persistent 1-hour bearish trend, placing the asset at a crucial technical juncture where all eyes are locked on the vital $74.80 support zone. If bulls successfully defend this key support floor, we could see a swift relief recovery pushing toward the $80 to $82.50 resistance band, whereas losing this barrier opens the door to a deeper slide down toward $72.70. While short-term bounces offer quick trading opportunities, a definitive reclaim of the $80 level remains key before shifting to a broader bullish bias—so watch the charts closely and manage your risk!
#BinanceSquare #SOL #Solana #CryptoTrading #MarketAnalysis
Crypto Scientist Expert44:
i followed you sweet brother please follows me back.......plzzz follows me all guyzz
1
2
428

·
--
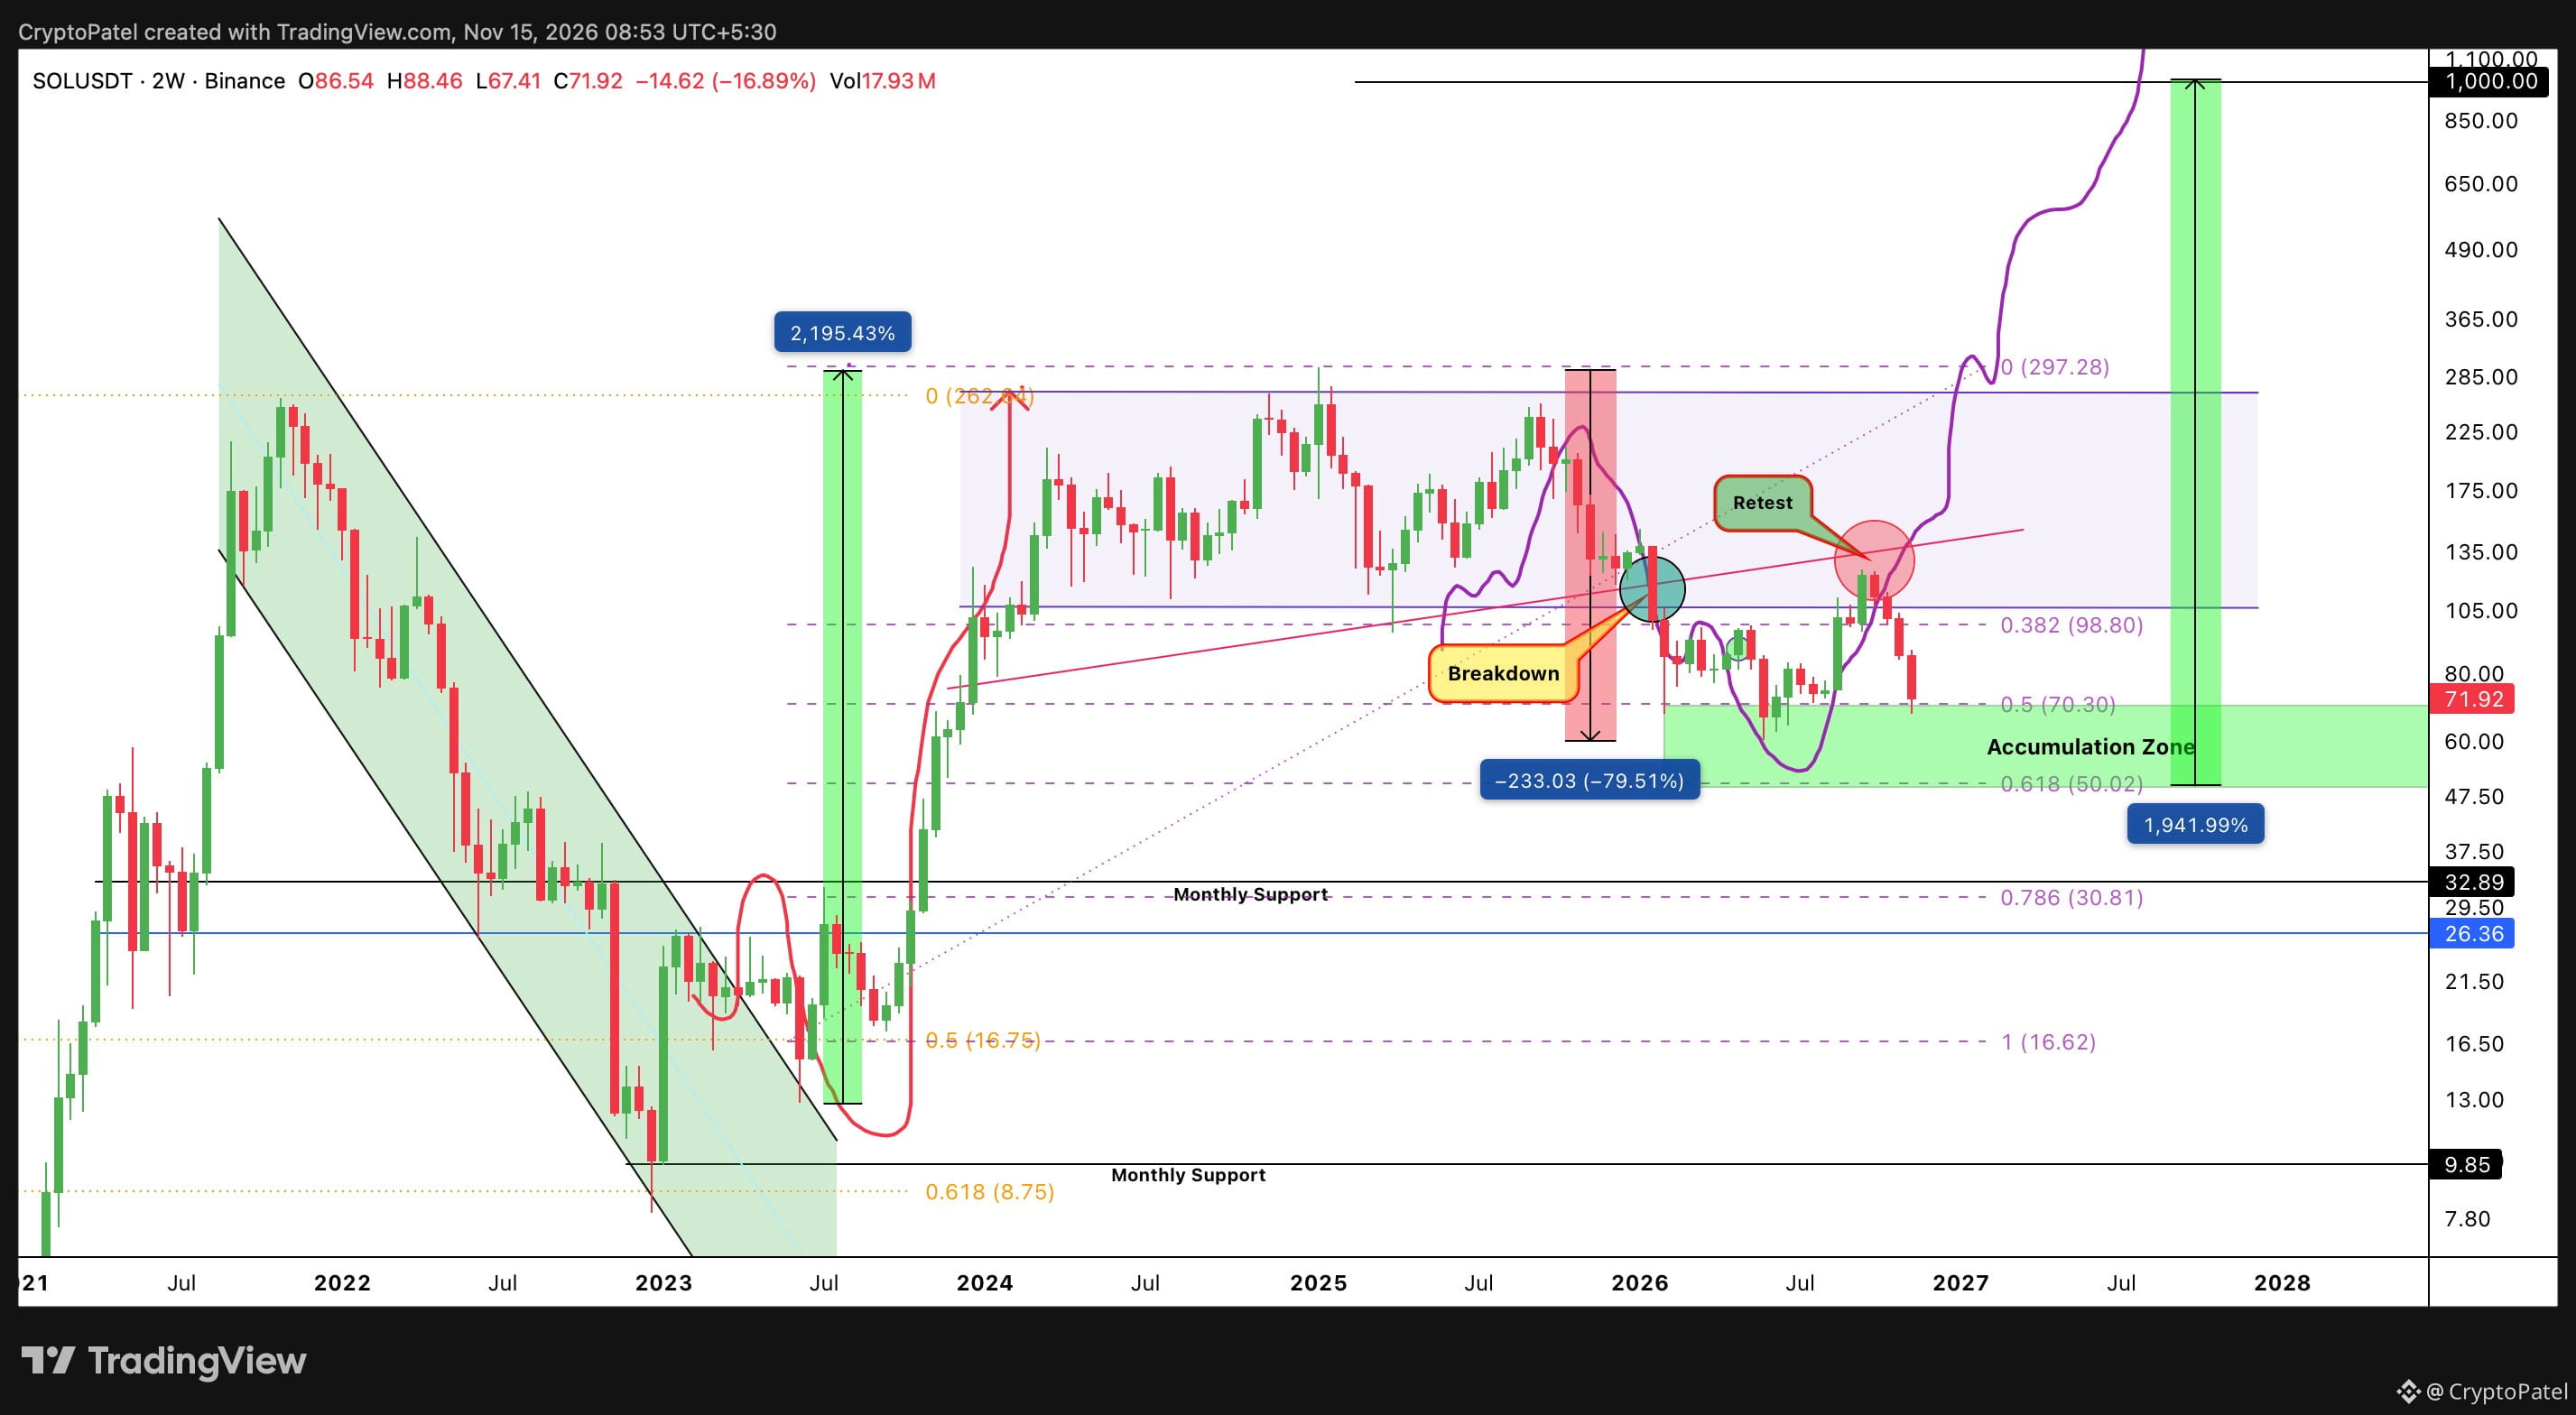
$SOL has finally entered my TERRITORY ENTRY ZONE 😍
I have two major accumulation zones for my long-term $500–$1,000 targets:
🟢 Entry Zone 1: $70–$50
🟢 Entry Zone 2: Around $30
My strategy is simple: I'll keep accumulating during every major crash instead of panic selling.
If you're holding #SOL for the long term, panic selling inside these accumulation zones makes little sense to me.
The only time I'll happily panic is when $SOL trades above $200 😂
Big crashes are opportunities for patient spot investors, not reasons to lose conviction.
My long-term targets remain unchanged: $500 / $700 / $1,000.
$SOL has finally entered my TERRITORY ENTRY ZONE 😍
I have two major accumulation zones for my long-term $500–$1,000 targets:
🟢 Entry Zone 1: $70–$50
🟢 Entry Zone 2: Around $30
My strategy is simple: I'll keep accumulating during every major crash instead of panic selling.
If you're holding #SOL for the long term, panic selling inside these accumulation zones makes little sense to me.
The only time I'll happily panic is when $SOL trades above $200 😂
Big crashes are opportunities for patient spot investors, not reasons to lose conviction.
My long-term targets remain unchanged: $500 / $700 / $1,000.
I have two major accumulation zones for my long-term $500–$1,000 targets:
🟢 Entry Zone 1: $70–$50
🟢 Entry Zone 2: Around $30
My strategy is simple: I'll keep accumulating during every major crash instead of panic selling.
If you're holding #SOL for the long term, panic selling inside these accumulation zones makes little sense to me.
The only time I'll happily panic is when $SOL trades above $200 😂
Big crashes are opportunities for patient spot investors, not reasons to lose conviction.
My long-term targets remain unchanged: $500 / $700 / $1,000.
Feed-Creator-7cde8b2ed:
博主,ray你觉得还能跌倒1左右吗
1
1
419

·
--
🚨 $SOL Daily Market Update 📉
$SOL break the major support level at $75
Currently the market is under high pressure ⛔️
As the volume decrese . The fear factor is increasing ‼️
⚠️ NEXT LEVEL TO WATCH
⛔️ Price Action:
SOL has officially broken below its key support level at $75.10.📉
🚨The market is under heavy selling pressure. With support lost, the next major downside target to watch is $70.50. 🔻
#SOL #MarketUpdate #CryptoNews
🚨 $SOL Daily Market Update 📉
$SOL break the major support level at $75
Currently the market is under high pressure ⛔️
As the volume decrese . The fear factor is increasing ‼️
⚠️ NEXT LEVEL TO WATCH
⛔️ Price Action:
SOL has officially broken below its key support level at $75.10.📉
🚨The market is under heavy selling pressure. With support lost, the next major downside target to watch is $70.50. 🔻
#SOL #MarketUpdate #CryptoNews
$SOL break the major support level at $75
Currently the market is under high pressure ⛔️
As the volume decrese . The fear factor is increasing ‼️
⚠️ NEXT LEVEL TO WATCH
⛔️ Price Action:
SOL has officially broken below its key support level at $75.10.📉
🚨The market is under heavy selling pressure. With support lost, the next major downside target to watch is $70.50. 🔻
#SOL #MarketUpdate #CryptoNews

2
611


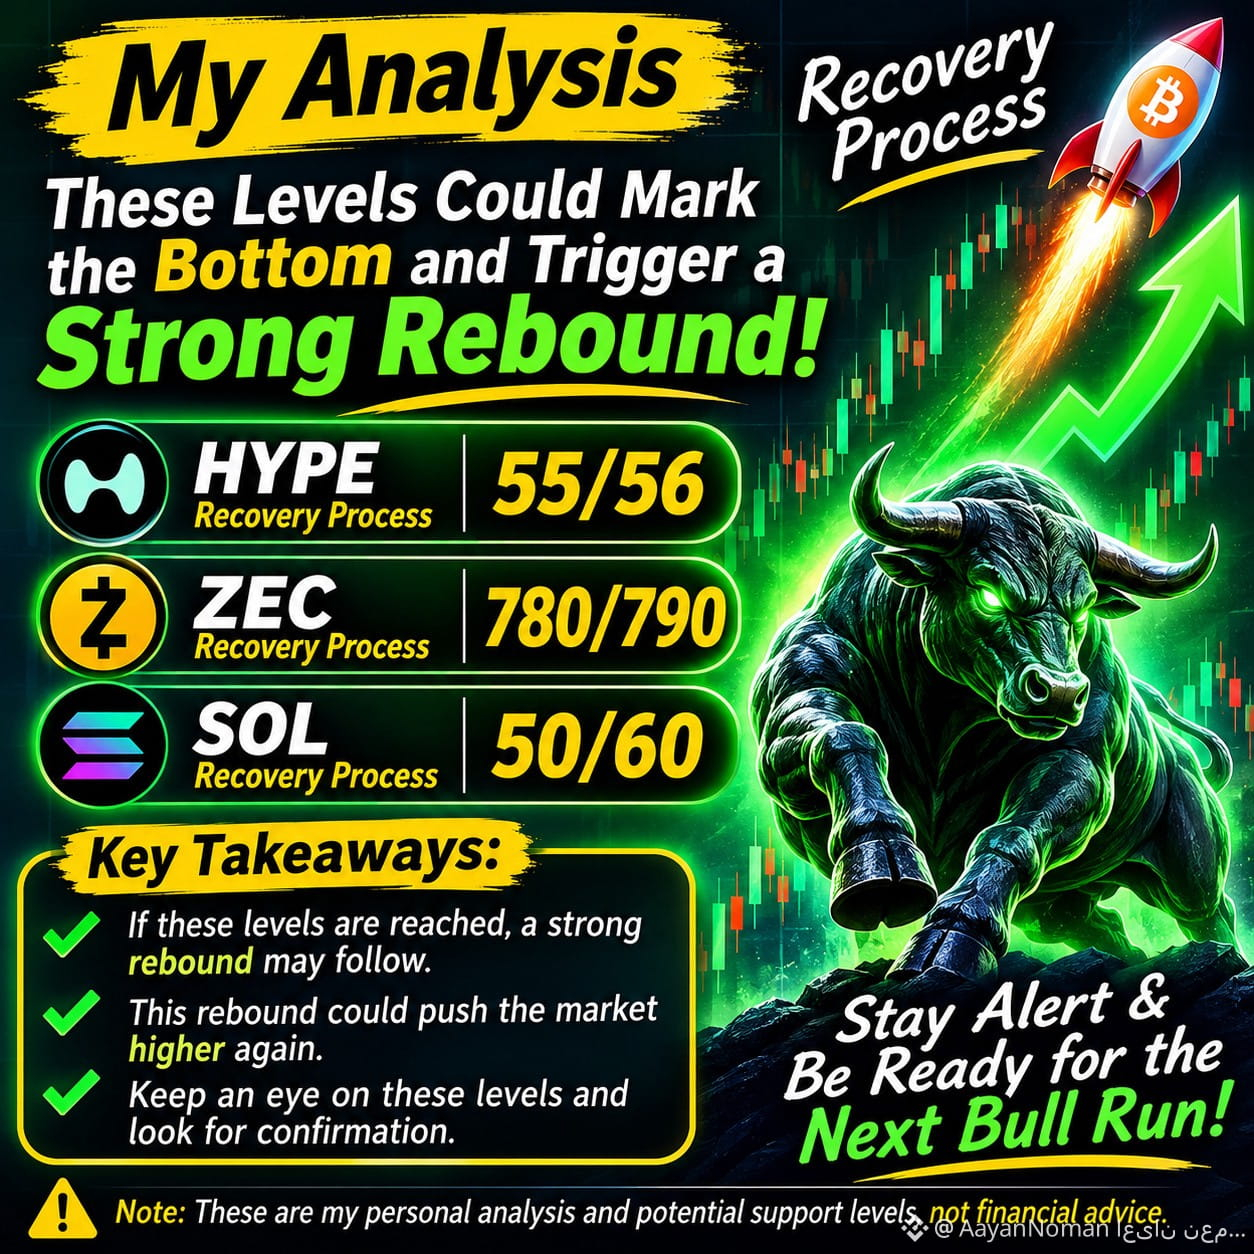
🚨 MY OWN ANALYSIS | RECOVERY WATCHLIST 📊🔥
The market is going through a correction, but I am closely watching three major assets that could be approaching important recovery zones
🎯 KEY LEVELS TO WATCH👁️👀👁️🗨️
🔹 $HYPE 55-56
{future}(HYPEUSDT)
🔹 $ZEC 780 – 790
{future}(ZECUSDT)
🔹 $SOL 50 – 60
{future}(SOLUSDT)
📈 MY EXPECTATION💰🫵💰💰🫵🫵
If these assets reach their respective levels and show strong buying pressure, we could see a powerful rebound.
This recovery could bring fresh bullish momentum and potentially help push the wider crypto market upward again.
🐂 What I am watching 🦬🐂
Strong buying pressure at support💪💪💪💪
Bullish reversal Signals
Trading volume confirmation
A possible recovery across the altcoin market.
🔥 Remember: Market corrections can create opportunities, but patience and confirmation are essential.
Don't panic. Watch the levels. Stay prepared.
The next recovery move could be interesting! 🚀
@MirzaNoman90 AayanNoman
#hype #zec #sol
🚨 MY OWN ANALYSIS | RECOVERY WATCHLIST 📊🔥
The market is going through a correction, but I am closely watching three major assets that could be approaching important recovery zones
🎯 KEY LEVELS TO WATCH👁️👀👁️🗨️
🔹 $HYPE 55-56
🔹 $ZEC 780 – 790
🔹 $SOL 50 – 60
📈 MY EXPECTATION💰🫵💰💰🫵🫵
If these assets reach their respective levels and show strong buying pressure, we could see a powerful rebound.
This recovery could bring fresh bullish momentum and potentially help push the wider crypto market upward again.
🐂 What I am watching 🦬🐂
Strong buying pressure at support💪💪💪💪
Bullish reversal Signals
Trading volume confirmation
A possible recovery across the altcoin market.
🔥 Remember: Market corrections can create opportunities, but patience and confirmation are essential.
Don't panic. Watch the levels. Stay prepared.
The next recovery move could be interesting! 🚀
@AayanNoman اعیان نعمان AayanNoman
#hype #zec #sol
The market is going through a correction, but I am closely watching three major assets that could be approaching important recovery zones
🎯 KEY LEVELS TO WATCH👁️👀👁️🗨️
🔹 $HYPE 55-56
🔹 $ZEC 780 – 790
🔹 $SOL 50 – 60
📈 MY EXPECTATION💰🫵💰💰🫵🫵
If these assets reach their respective levels and show strong buying pressure, we could see a powerful rebound.
This recovery could bring fresh bullish momentum and potentially help push the wider crypto market upward again.
🐂 What I am watching 🦬🐂
Strong buying pressure at support💪💪💪💪
Bullish reversal Signals
Trading volume confirmation
A possible recovery across the altcoin market.
🔥 Remember: Market corrections can create opportunities, but patience and confirmation are essential.
Don't panic. Watch the levels. Stay prepared.
The next recovery move could be interesting! 🚀
@AayanNoman اعیان نعمان AayanNoman
#hype #zec #sol
-_JáVéD_-:
.ab Hoti rahy recovery ..half to wash hogy .😅.
1
1
3
6.6k

·
--
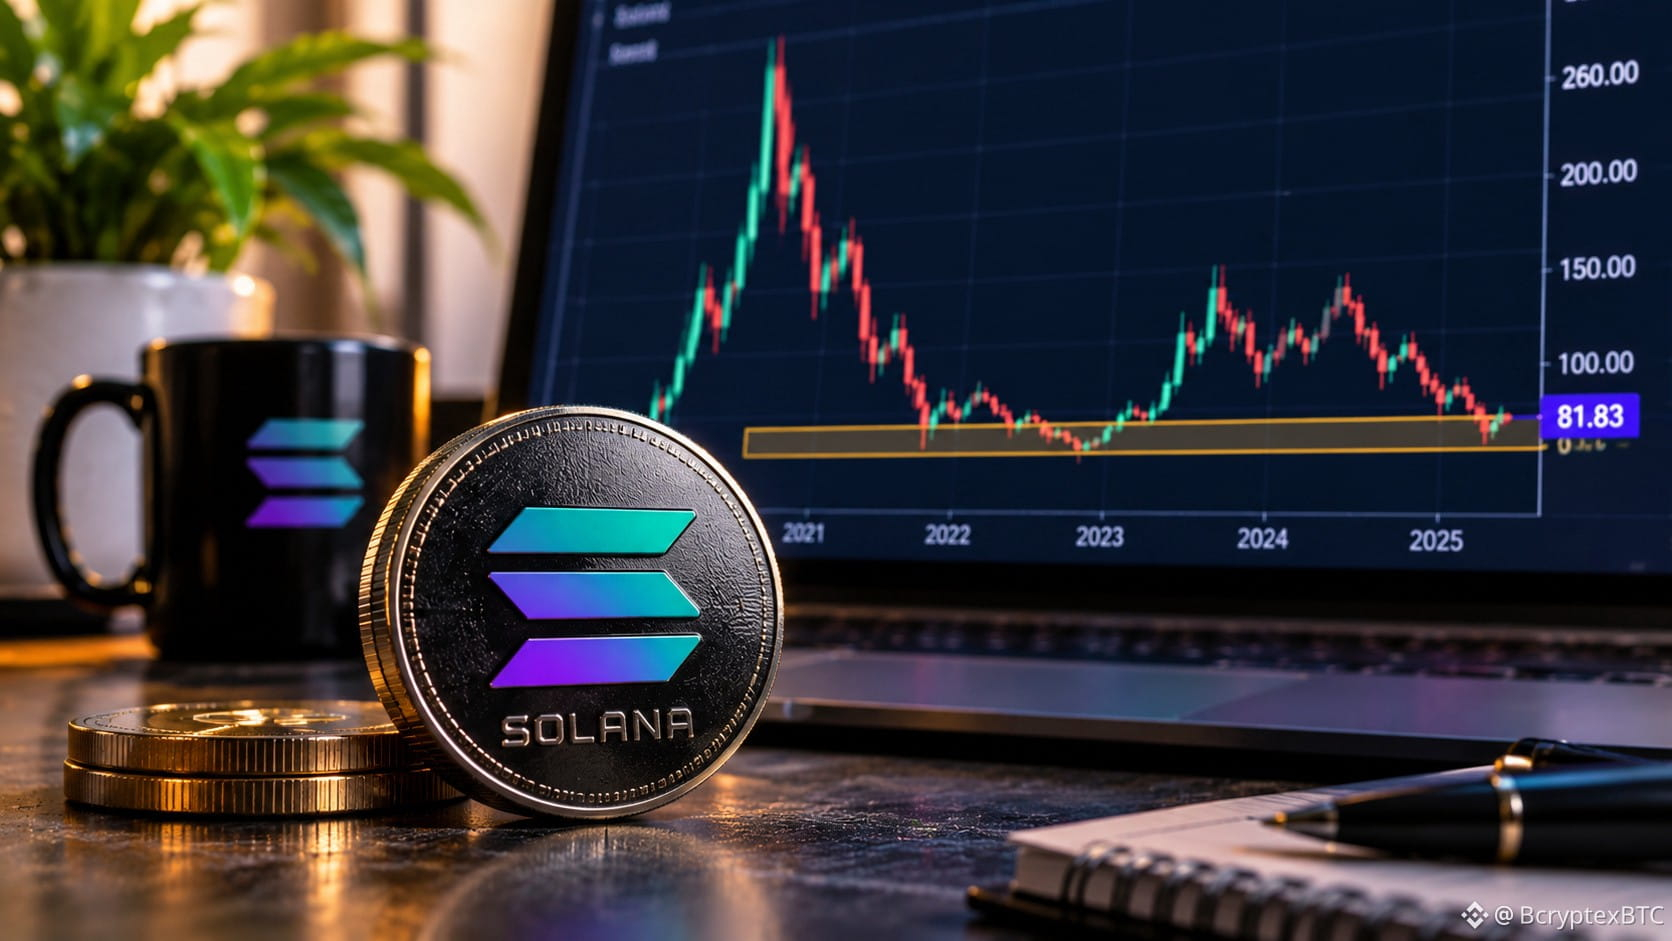
$SOL Back to 2021 Levels. What Does It Mean for Holders?
Solana is trading near $82, revisiting a price zone last seen in August 2021.
But there's a bigger question: after years of market cycles, have long-term holders actually benefited?
Key levels to watch:
- $82: Critical area for price stability.
- $114: A sustained reclaim could strengthen recovery momentum.
Solana's ecosystem has evolved, but network growth doesn't automatically translate into token value.
My take: The real test is whether adoption can create sustainable demand for $SOL , not just another temporary price rally.
Has SOL rewarded long-term conviction, or has time become its biggest cost?
#Solana #SOL #CryptoAnalysis
$SOL Back to 2021 Levels. What Does It Mean for Holders?
Solana is trading near $82, revisiting a price zone last seen in August 2021.
But there's a bigger question: after years of market cycles, have long-term holders actually benefited?
Key levels to watch:
- $82: Critical area for price stability.
- $114: A sustained reclaim could strengthen recovery momentum.
Solana's ecosystem has evolved, but network growth doesn't automatically translate into token value.
My take: The real test is whether adoption can create sustainable demand for $SOL , not just another temporary price rally.
Has SOL rewarded long-term conviction, or has time become its biggest cost?
#Solana #SOL #CryptoAnalysis
Solana is trading near $82, revisiting a price zone last seen in August 2021.
But there's a bigger question: after years of market cycles, have long-term holders actually benefited?
Key levels to watch:
- $82: Critical area for price stability.
- $114: A sustained reclaim could strengthen recovery momentum.
Solana's ecosystem has evolved, but network growth doesn't automatically translate into token value.
My take: The real test is whether adoption can create sustainable demand for $SOL , not just another temporary price rally.
Has SOL rewarded long-term conviction, or has time become its biggest cost?
#Solana #SOL #CryptoAnalysis
1
479

·
--
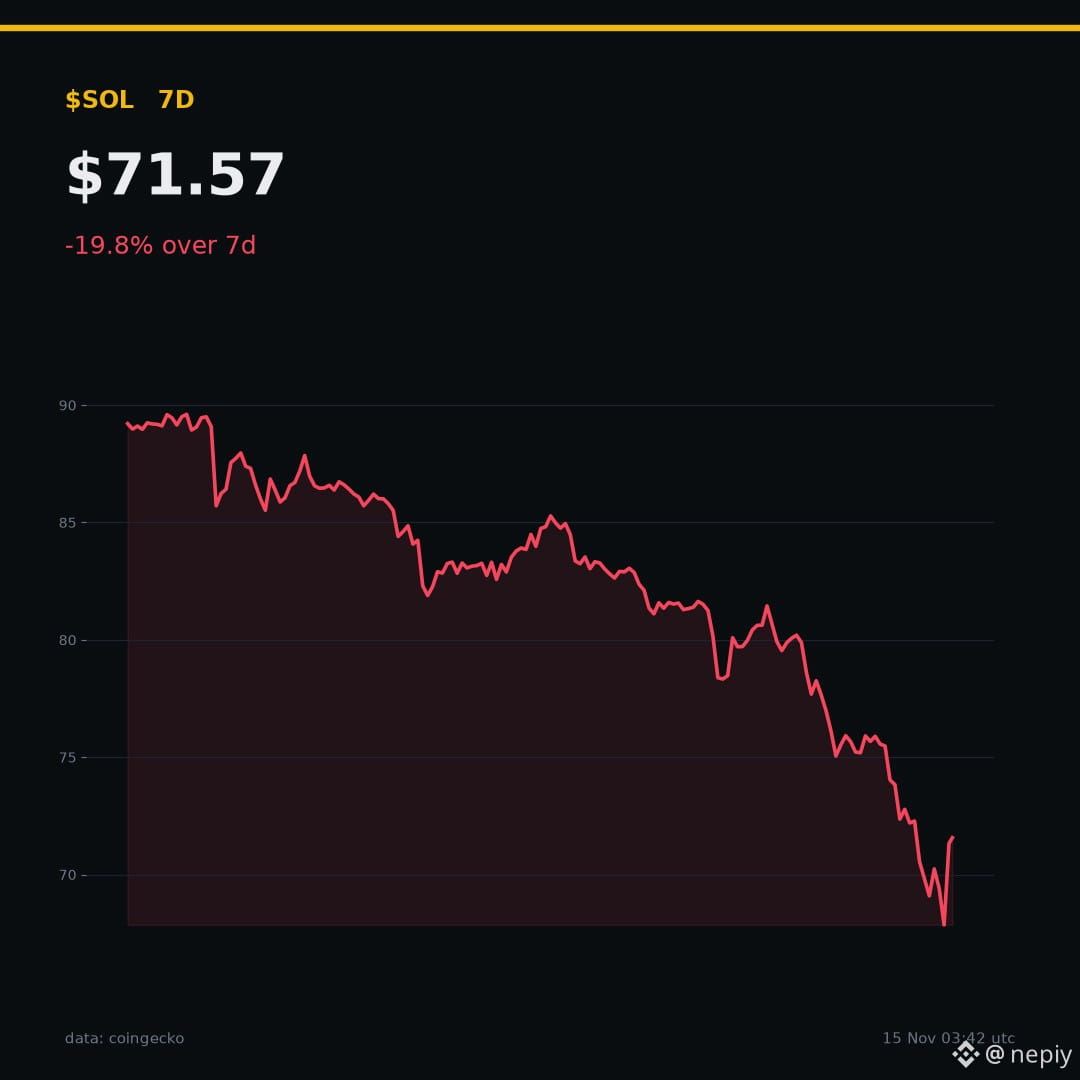
solana at 71.57 and down 19.8% over the last 7 days
that is not a dip, that is a repricing
24h is only -4.62%, so today looks calm next to the week
the l1 trade was always fees and users showing up
fees did not show up, the unlocks did
my read: sol holds this zone or the next stop is a lot lower
what would fix it: real fee growth and a bid that is not rotation
not adding here
#solana #sol
solana at 71.57 and down 19.8% over the last 7 days
that is not a dip, that is a repricing
24h is only -4.62%, so today looks calm next to the week
the l1 trade was always fees and users showing up
fees did not show up, the unlocks did
my read: sol holds this zone or the next stop is a lot lower
what would fix it: real fee growth and a bid that is not rotation
not adding here
#solana #sol
that is not a dip, that is a repricing
24h is only -4.62%, so today looks calm next to the week
the l1 trade was always fees and users showing up
fees did not show up, the unlocks did
my read: sol holds this zone or the next stop is a lot lower
what would fix it: real fee growth and a bid that is not rotation
not adding here
#solana #sol
1
235

·
--
🚨 $SOL
{spot}(SOLUSDT)
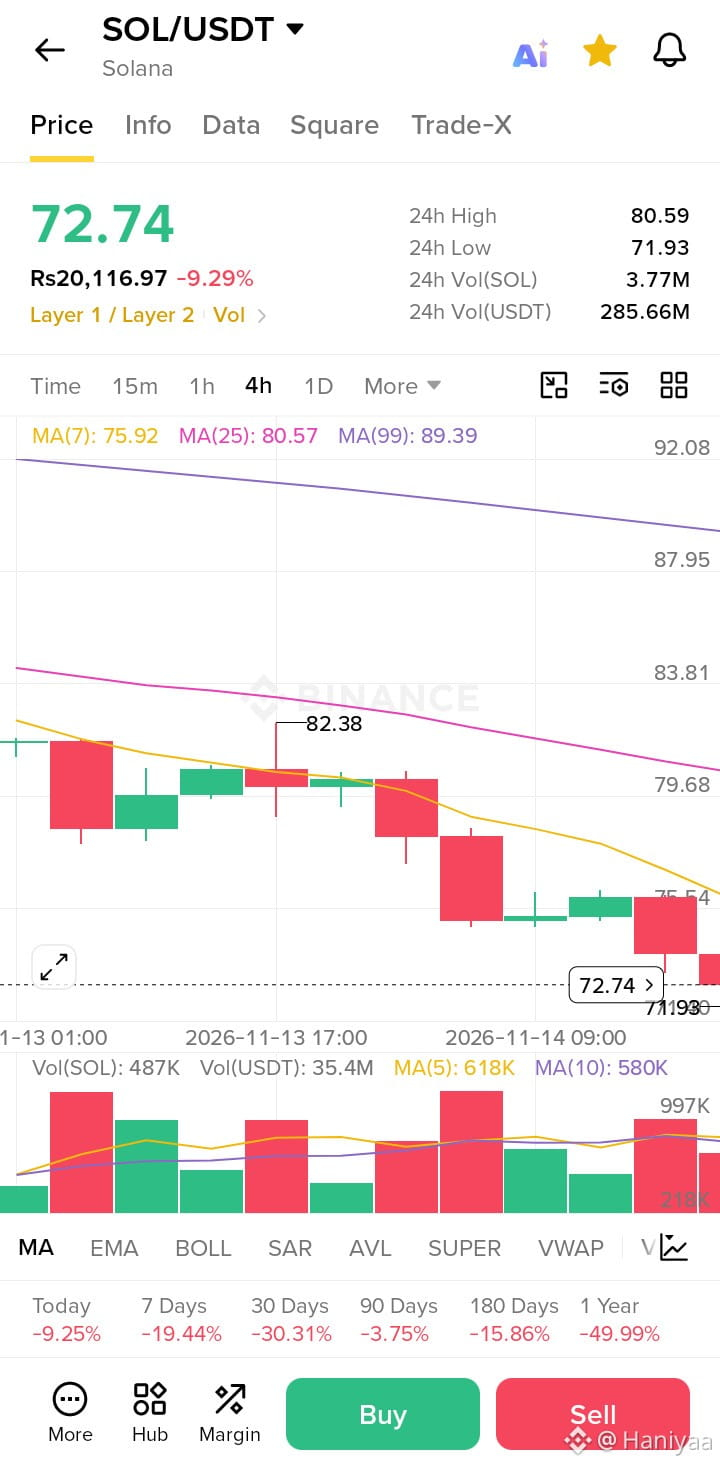
$72.87 -9.13%! $80 -> $72 24H High $80 rejected! Below MA(7) $78...
SOL is crashing hard today! Is this a DIP or more DUMP coming?
What is your target? $65 or $85 bounce?
#sol #solana #CryptoNewss #BinanceSquareFamily
🚨 $SOL
$72.87 -9.13%! $80 -> $72 24H High $80 rejected! Below MA(7) $78...
SOL is crashing hard today! Is this a DIP or more DUMP coming?
What is your target? $65 or $85 bounce?
#sol #solana #CryptoNewss #BinanceSquareFamily
$72.87 -9.13%! $80 -> $72 24H High $80 rejected! Below MA(7) $78...
SOL is crashing hard today! Is this a DIP or more DUMP coming?
What is your target? $65 or $85 bounce?
#sol #solana #CryptoNewss #BinanceSquareFamily
Faheem khokhar :
SOL is under pressure right now. I'll wait for some stability before making any move. Let's see if buyers step in here
3
1
2
592

·
--
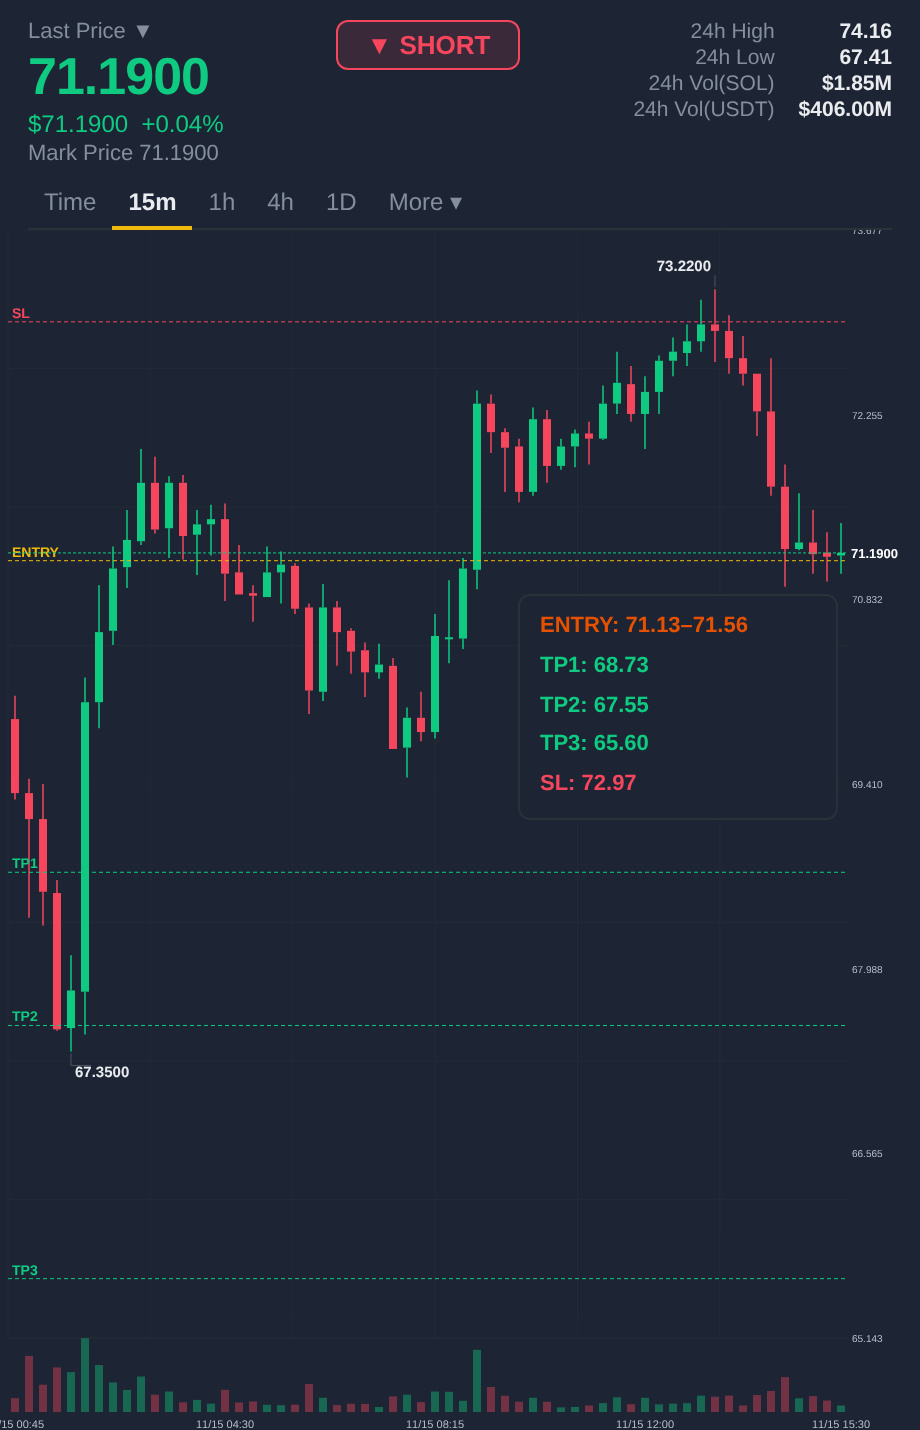
$SOL SHORT SETUP 📉
Entry: $71.13 – $71.56
TP1: $68.73
TP2: $67.55
TP3: $65.60
SL: $72.97
RSI 45 overbought + 1H resistance level
Funding Rate: +0.001% | 1H chart
#SOL #DACITYCOIN #GATO
💥 $SOL — go short now
$SOL SHORT SETUP 📉
Entry: $71.13 – $71.56
TP1: $68.73
TP2: $67.55
TP3: $65.60
SL: $72.97
RSI 45 overbought + 1H resistance level
Funding Rate: +0.001% | 1H chart
#SOL #DACITYCOIN #GATO
💥 $SOL — go short now
Entry: $71.13 – $71.56
TP1: $68.73
TP2: $67.55
TP3: $65.60
SL: $72.97
RSI 45 overbought + 1H resistance level
Funding Rate: +0.001% | 1H chart
#SOL #DACITYCOIN #GATO
💥 $SOL — go short now
692

·
--
Bearish
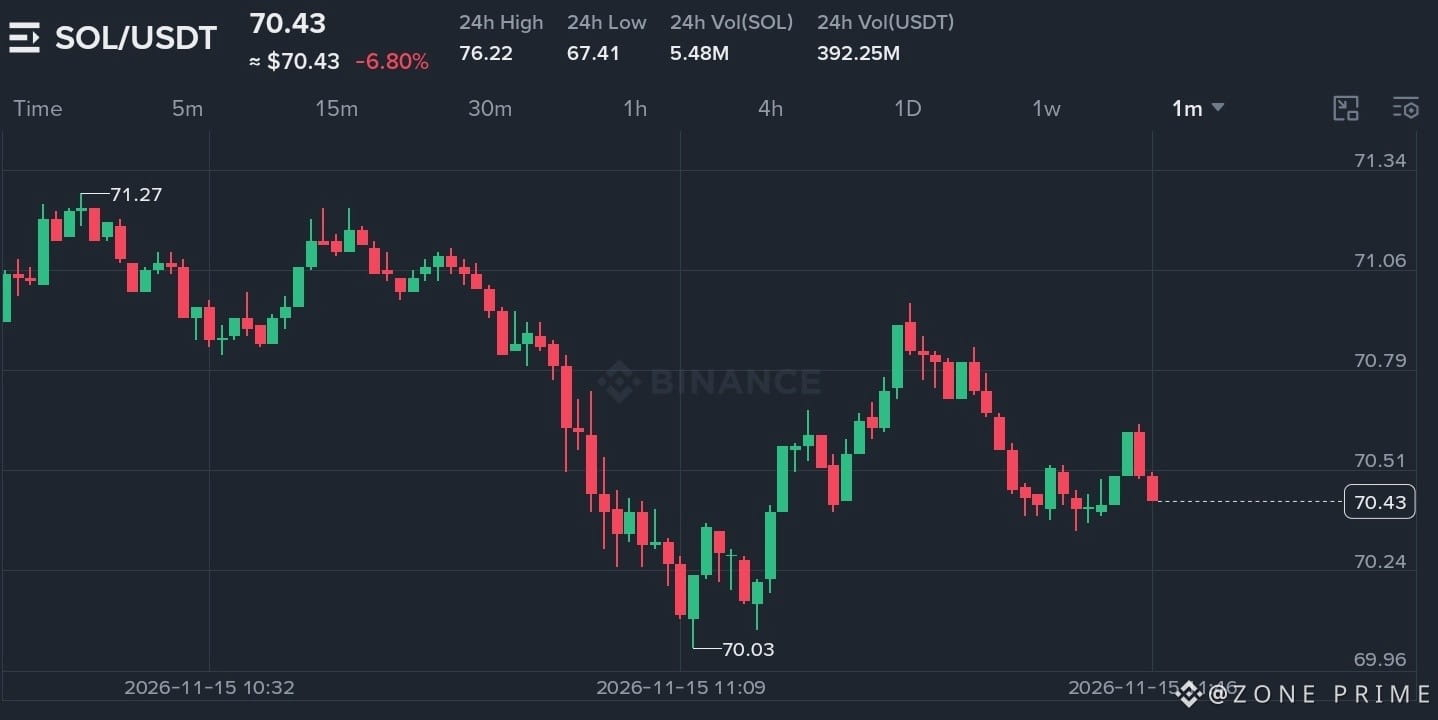
$SOL /USDT — SHORT SETUP 📉 💯 😱
Entry: 70.75 - 71.05
TP1: 70.40
TP2: 70.03
TP3: 69.75
Stop: 71.32
Repeated lower-high formations descending from the 71.27 peak underscore lingering seller pressure across intraday sessions. Fading volume on approach to the 70.85 supply cluster gives bears a favorable risk-reward angle to target floor liquidity.
#sol #solusdt #solana #crypto $SOL
{future}(SOLUSDT)
$SOL /USDT — SHORT SETUP 📉 💯 😱
Entry: 70.75 - 71.05
TP1: 70.40
TP2: 70.03
TP3: 69.75
Stop: 71.32
Repeated lower-high formations descending from the 71.27 peak underscore lingering seller pressure across intraday sessions. Fading volume on approach to the 70.85 supply cluster gives bears a favorable risk-reward angle to target floor liquidity.
#sol #solusdt #solana #crypto $SOL
Entry: 70.75 - 71.05
TP1: 70.40
TP2: 70.03
TP3: 69.75
Stop: 71.32
Repeated lower-high formations descending from the 71.27 peak underscore lingering seller pressure across intraday sessions. Fading volume on approach to the 70.85 supply cluster gives bears a favorable risk-reward angle to target floor liquidity.
#sol #solusdt #solana #crypto $SOL
Muzamil_Trader1:
Patience is key in this volatility. Better to wait for a confirmed breakout above $75 than rush in."
1
224

·
--
📉 SOL Short Setup 🐻
Entry: $72.47 (market)
SL: $73.80
TP1: $68.19
TP2: $66.54
Reason: SOL broke below $80 support, death cross confirmed Nov 13, strong bearish trend on all timeframes — but daily RSI 18.8 is deeply oversold, so this is a weak setup; bounce risk is real. Trade with care.
Stop-loss is essential. This is not financial advice — DYOR.
#SOL $SOL
📉 SOL Short Setup 🐻
Entry: $72.47 (market)
SL: $73.80
TP1: $68.19
TP2: $66.54
Reason: SOL broke below $80 support, death cross confirmed Nov 13, strong bearish trend on all timeframes — but daily RSI 18.8 is deeply oversold, so this is a weak setup; bounce risk is real. Trade with care.
Stop-loss is essential. This is not financial advice — DYOR.
#SOL $SOL
Entry: $72.47 (market)
SL: $73.80
TP1: $68.19
TP2: $66.54
Reason: SOL broke below $80 support, death cross confirmed Nov 13, strong bearish trend on all timeframes — but daily RSI 18.8 is deeply oversold, so this is a weak setup; bounce risk is real. Trade with care.
Stop-loss is essential. This is not financial advice — DYOR.
#SOL $SOL
87

·
--
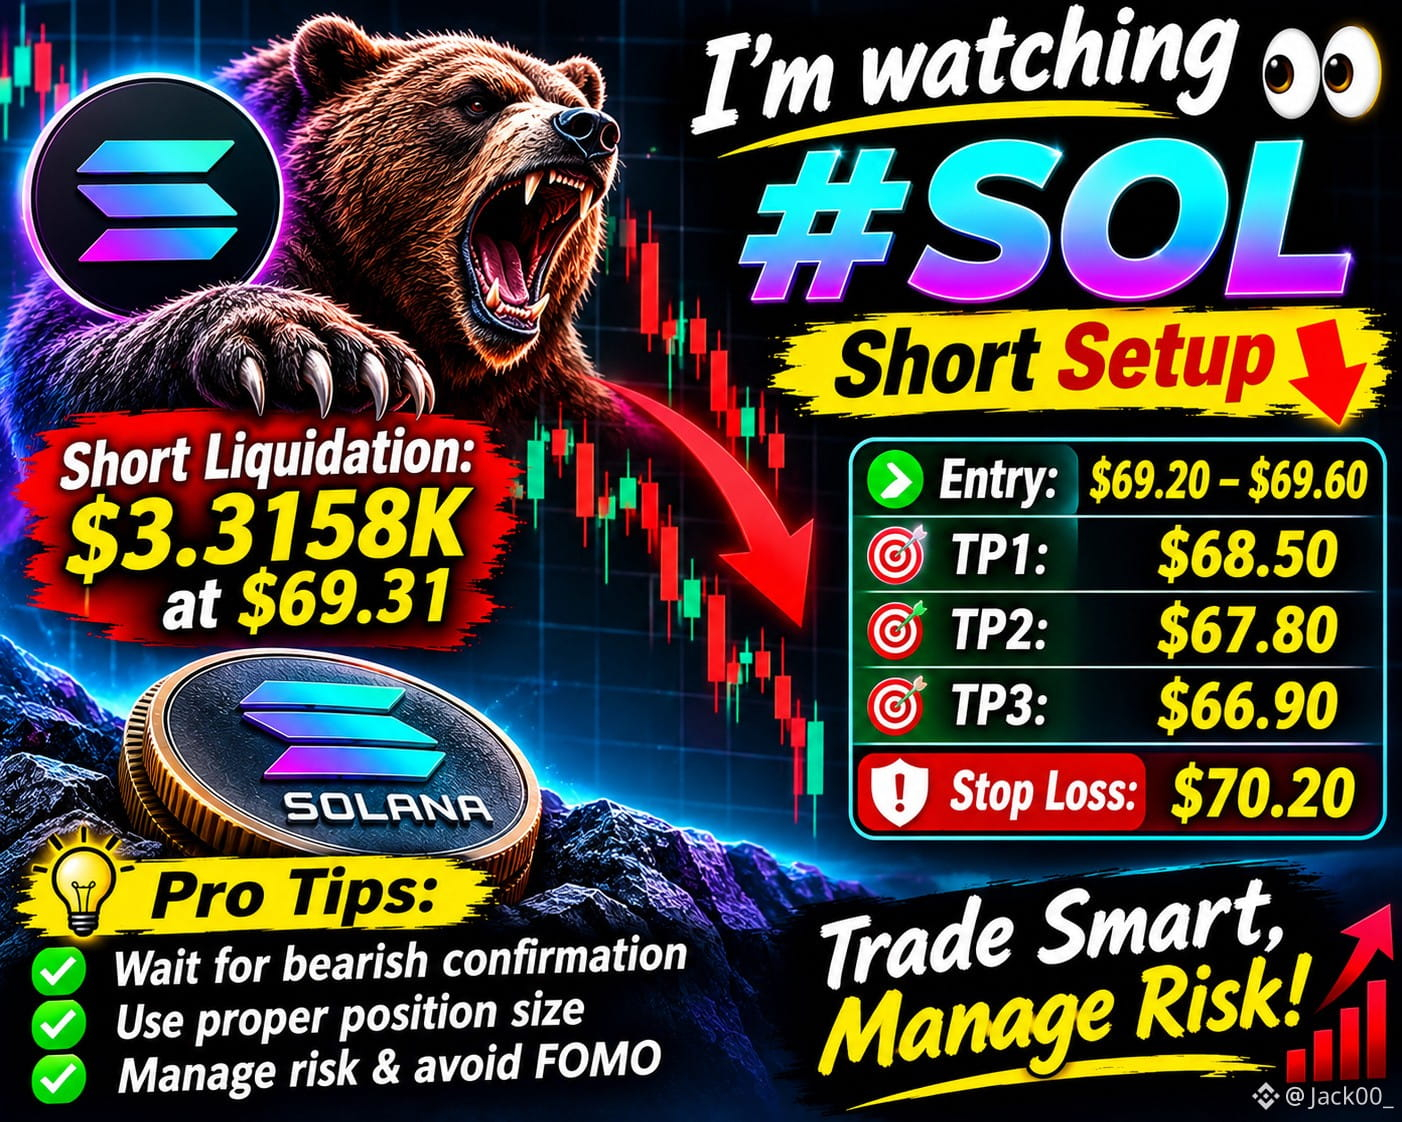
I'm watching $SOL closely! 👀 Bears are showing interest near $69.31. A rejection here could open the door to another downside move.
🔴 SOL SHORT SETUP
📍 Entry: $69.20–$69.60
🎯 TP1: $68.50
🎯 TP2: $67.80
🎯 TP3: $66.90
🛑 Stop Loss: $70.20
💡 Pro Tip: Wait for bearish confirmation before entry. Manage risk and avoid chasing the move.
#SOL #Solana #CryptoTrading. #ShortSetup
I'm watching $SOL closely! 👀 Bears are showing interest near $69.31. A rejection here could open the door to another downside move.
🔴 SOL SHORT SETUP
📍 Entry: $69.20–$69.60
🎯 TP1: $68.50
🎯 TP2: $67.80
🎯 TP3: $66.90
🛑 Stop Loss: $70.20
💡 Pro Tip: Wait for bearish confirmation before entry. Manage risk and avoid chasing the move.
#SOL #Solana #CryptoTrading. #ShortSetup
🔴 SOL SHORT SETUP
📍 Entry: $69.20–$69.60
🎯 TP1: $68.50
🎯 TP2: $67.80
🎯 TP3: $66.90
🛑 Stop Loss: $70.20
💡 Pro Tip: Wait for bearish confirmation before entry. Manage risk and avoid chasing the move.
#SOL #Solana #CryptoTrading. #ShortSetup
1
360

·
--
Bullish
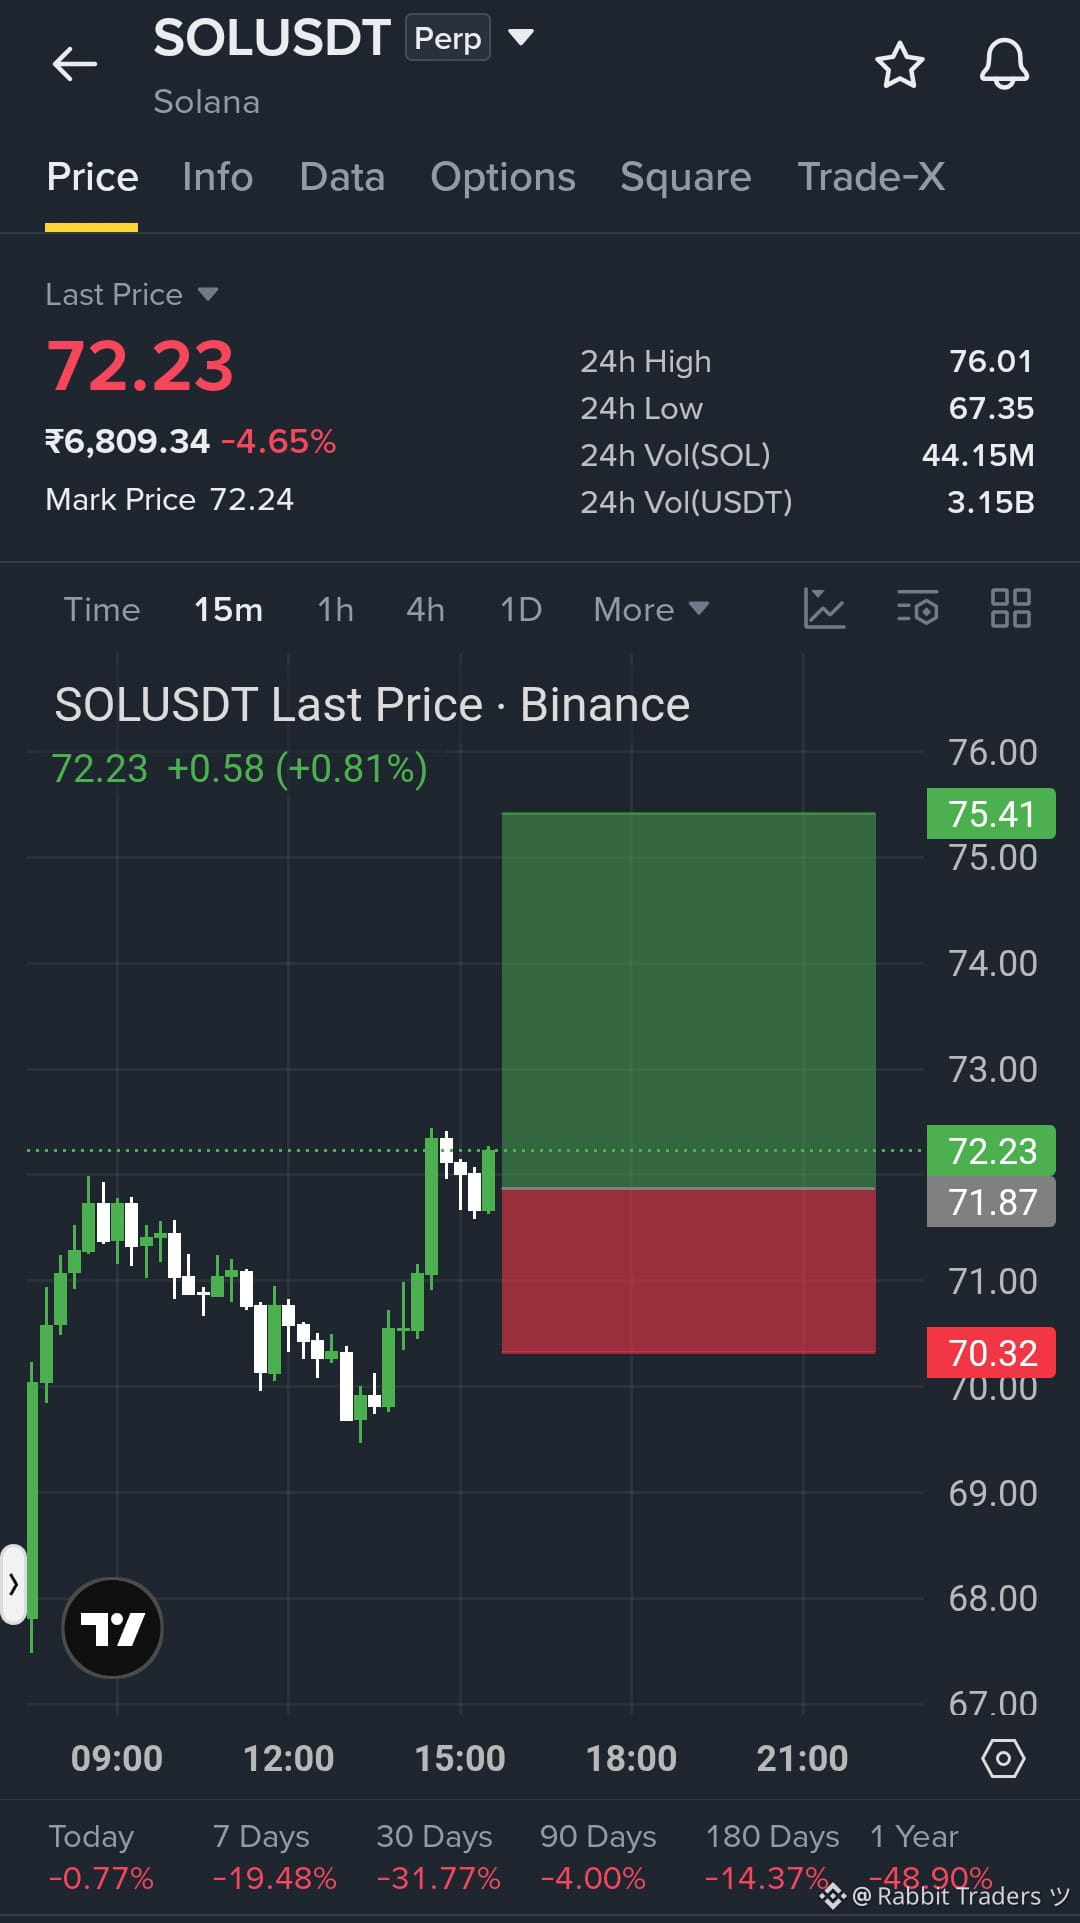
#SOL LONG ALERT 🤯 I am doing Long here‼️‼️‼️👇
Entry: 71.87
Stop-loss: 70.32
TP1: 73.05
TP2: 74.23
TP3: 75.41
Click here to trade 👇⬆️⬆️ Long.. With meeee...👇⬆️ $SOL
{future}(SOLUSDT)
#SOL LONG ALERT 🤯 I am doing Long here‼️‼️‼️👇
Entry: 71.87
Stop-loss: 70.32
TP1: 73.05
TP2: 74.23
TP3: 75.41
Click here to trade 👇⬆️⬆️ Long.. With meeee...👇⬆️ $SOL
Entry: 71.87
Stop-loss: 70.32
TP1: 73.05
TP2: 74.23
TP3: 75.41
Click here to trade 👇⬆️⬆️ Long.. With meeee...👇⬆️ $SOL
281

·
--
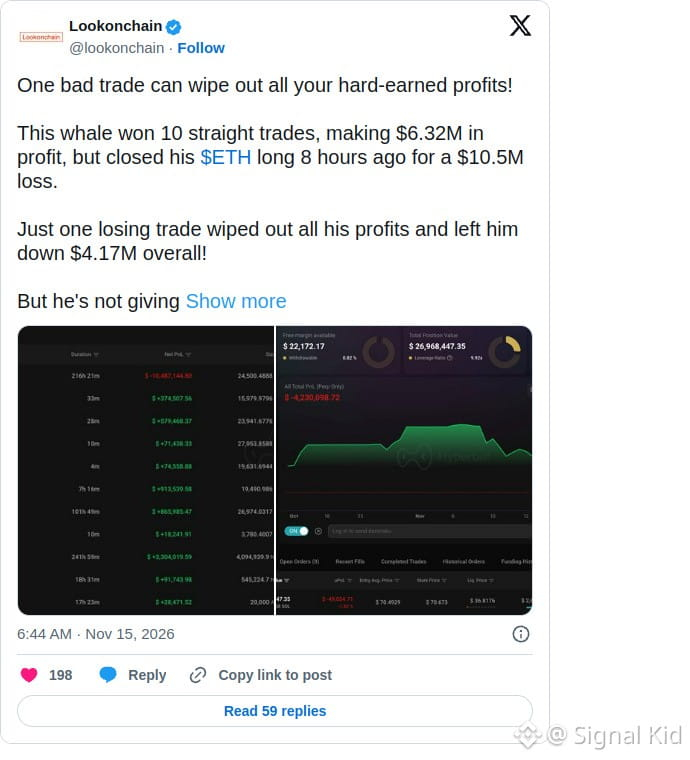
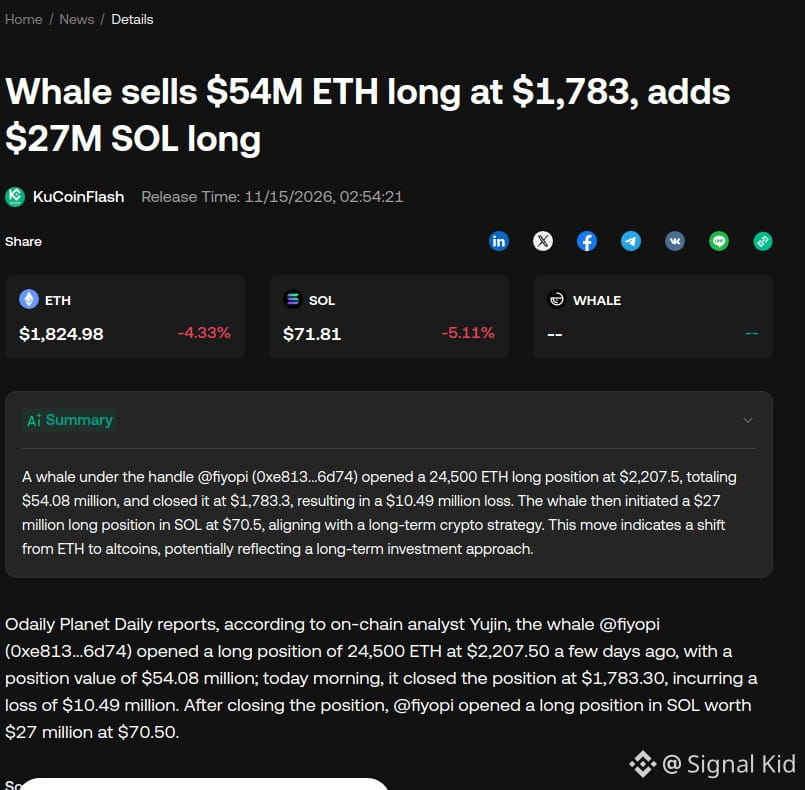
$10.5 million. Gone in one trade.
He won 10 trades in a row and banked $6.32 million.
One ETH long wiped it all out. He is down $4.17 million.
I think win rate means nothing when one loss beats ten wins.
He opened a $27 million SOL long at 10x. How many wins will it cost?
@Binance_News $ETH $SOL #ETH #SOL
$10.5 million. Gone in one trade.
He won 10 trades in a row and banked $6.32 million.
One ETH long wiped it all out. He is down $4.17 million.
I think win rate means nothing when one loss beats ten wins.
He opened a $27 million SOL long at 10x. How many wins will it cost?
@Binance_News $ETH $SOL #ETH #SOL
He won 10 trades in a row and banked $6.32 million.
One ETH long wiped it all out. He is down $4.17 million.
I think win rate means nothing when one loss beats ten wins.
He opened a $27 million SOL long at 10x. How many wins will it cost?
@Binance_News $ETH $SOL #ETH #SOL
97

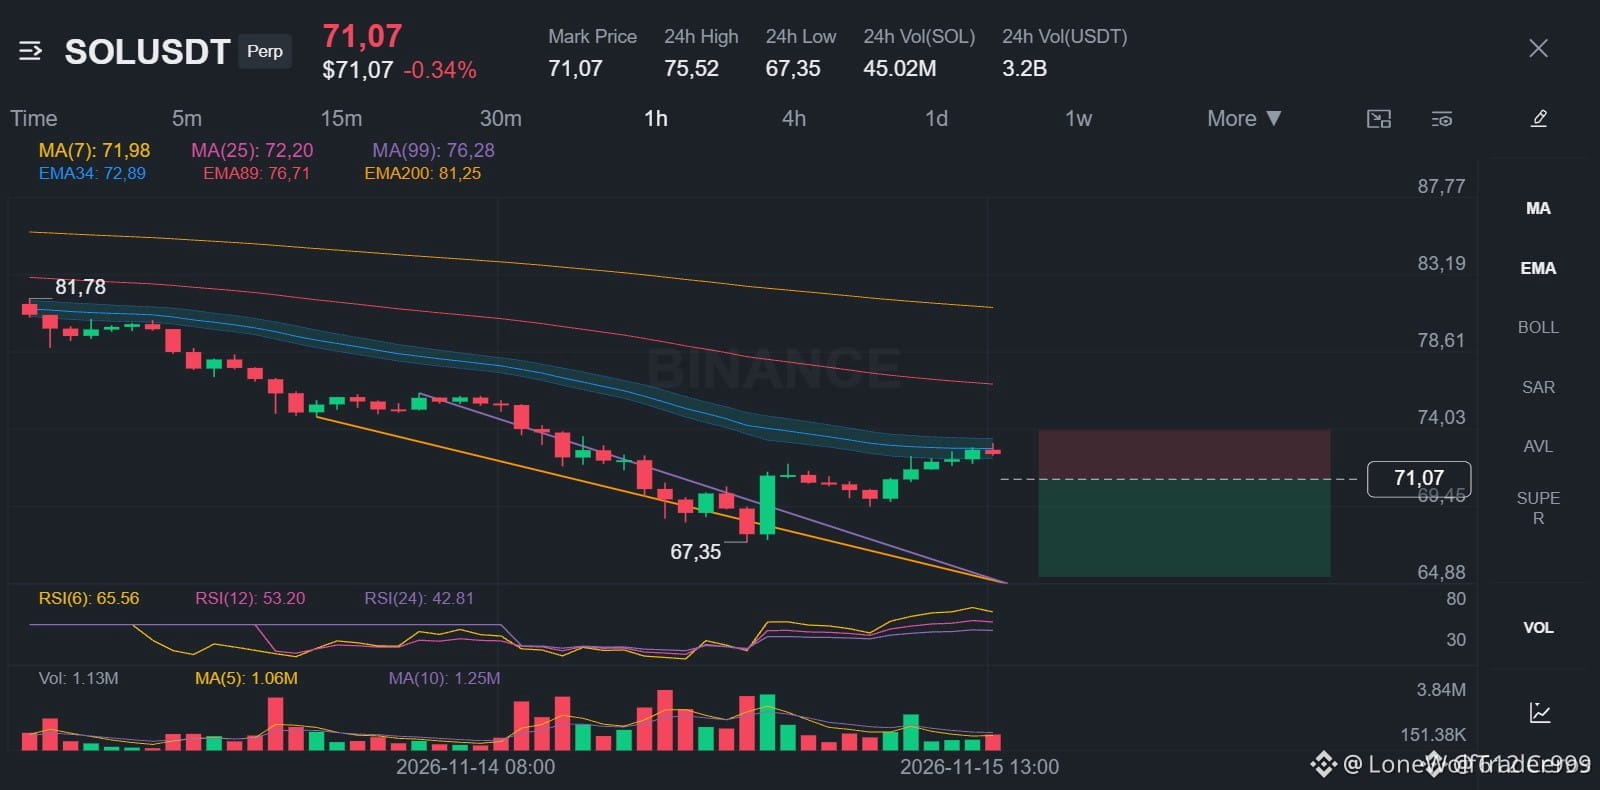
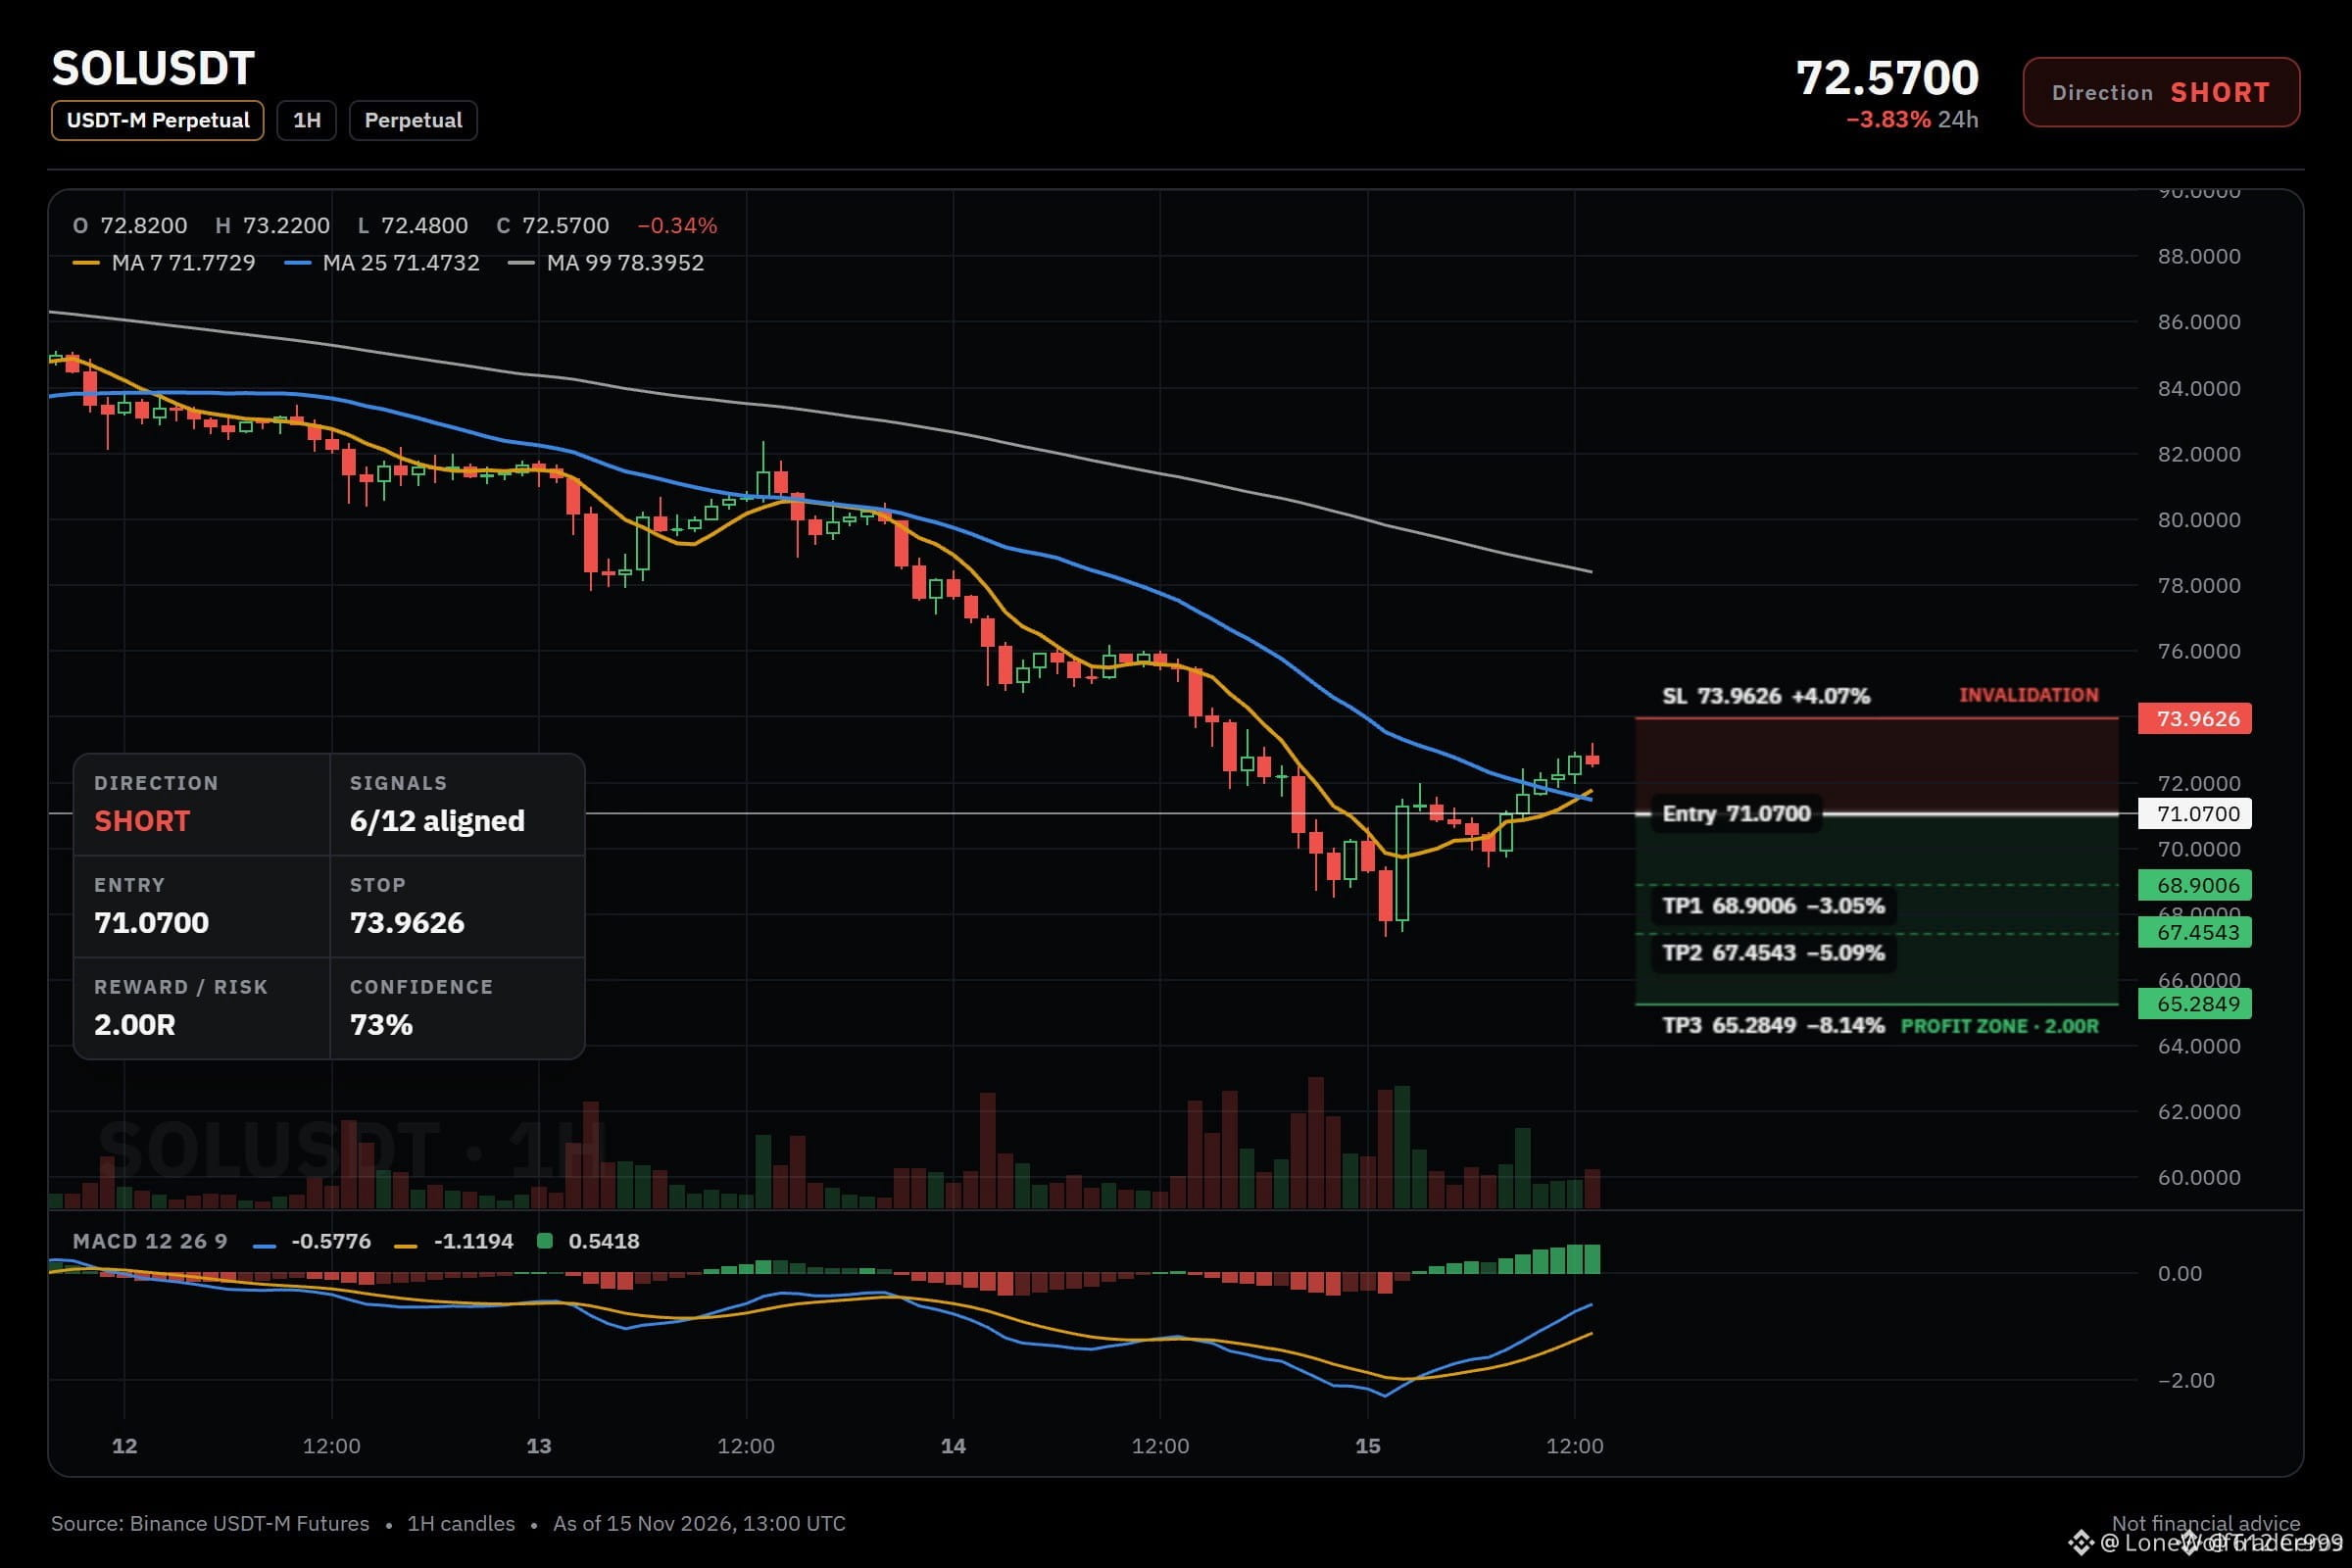
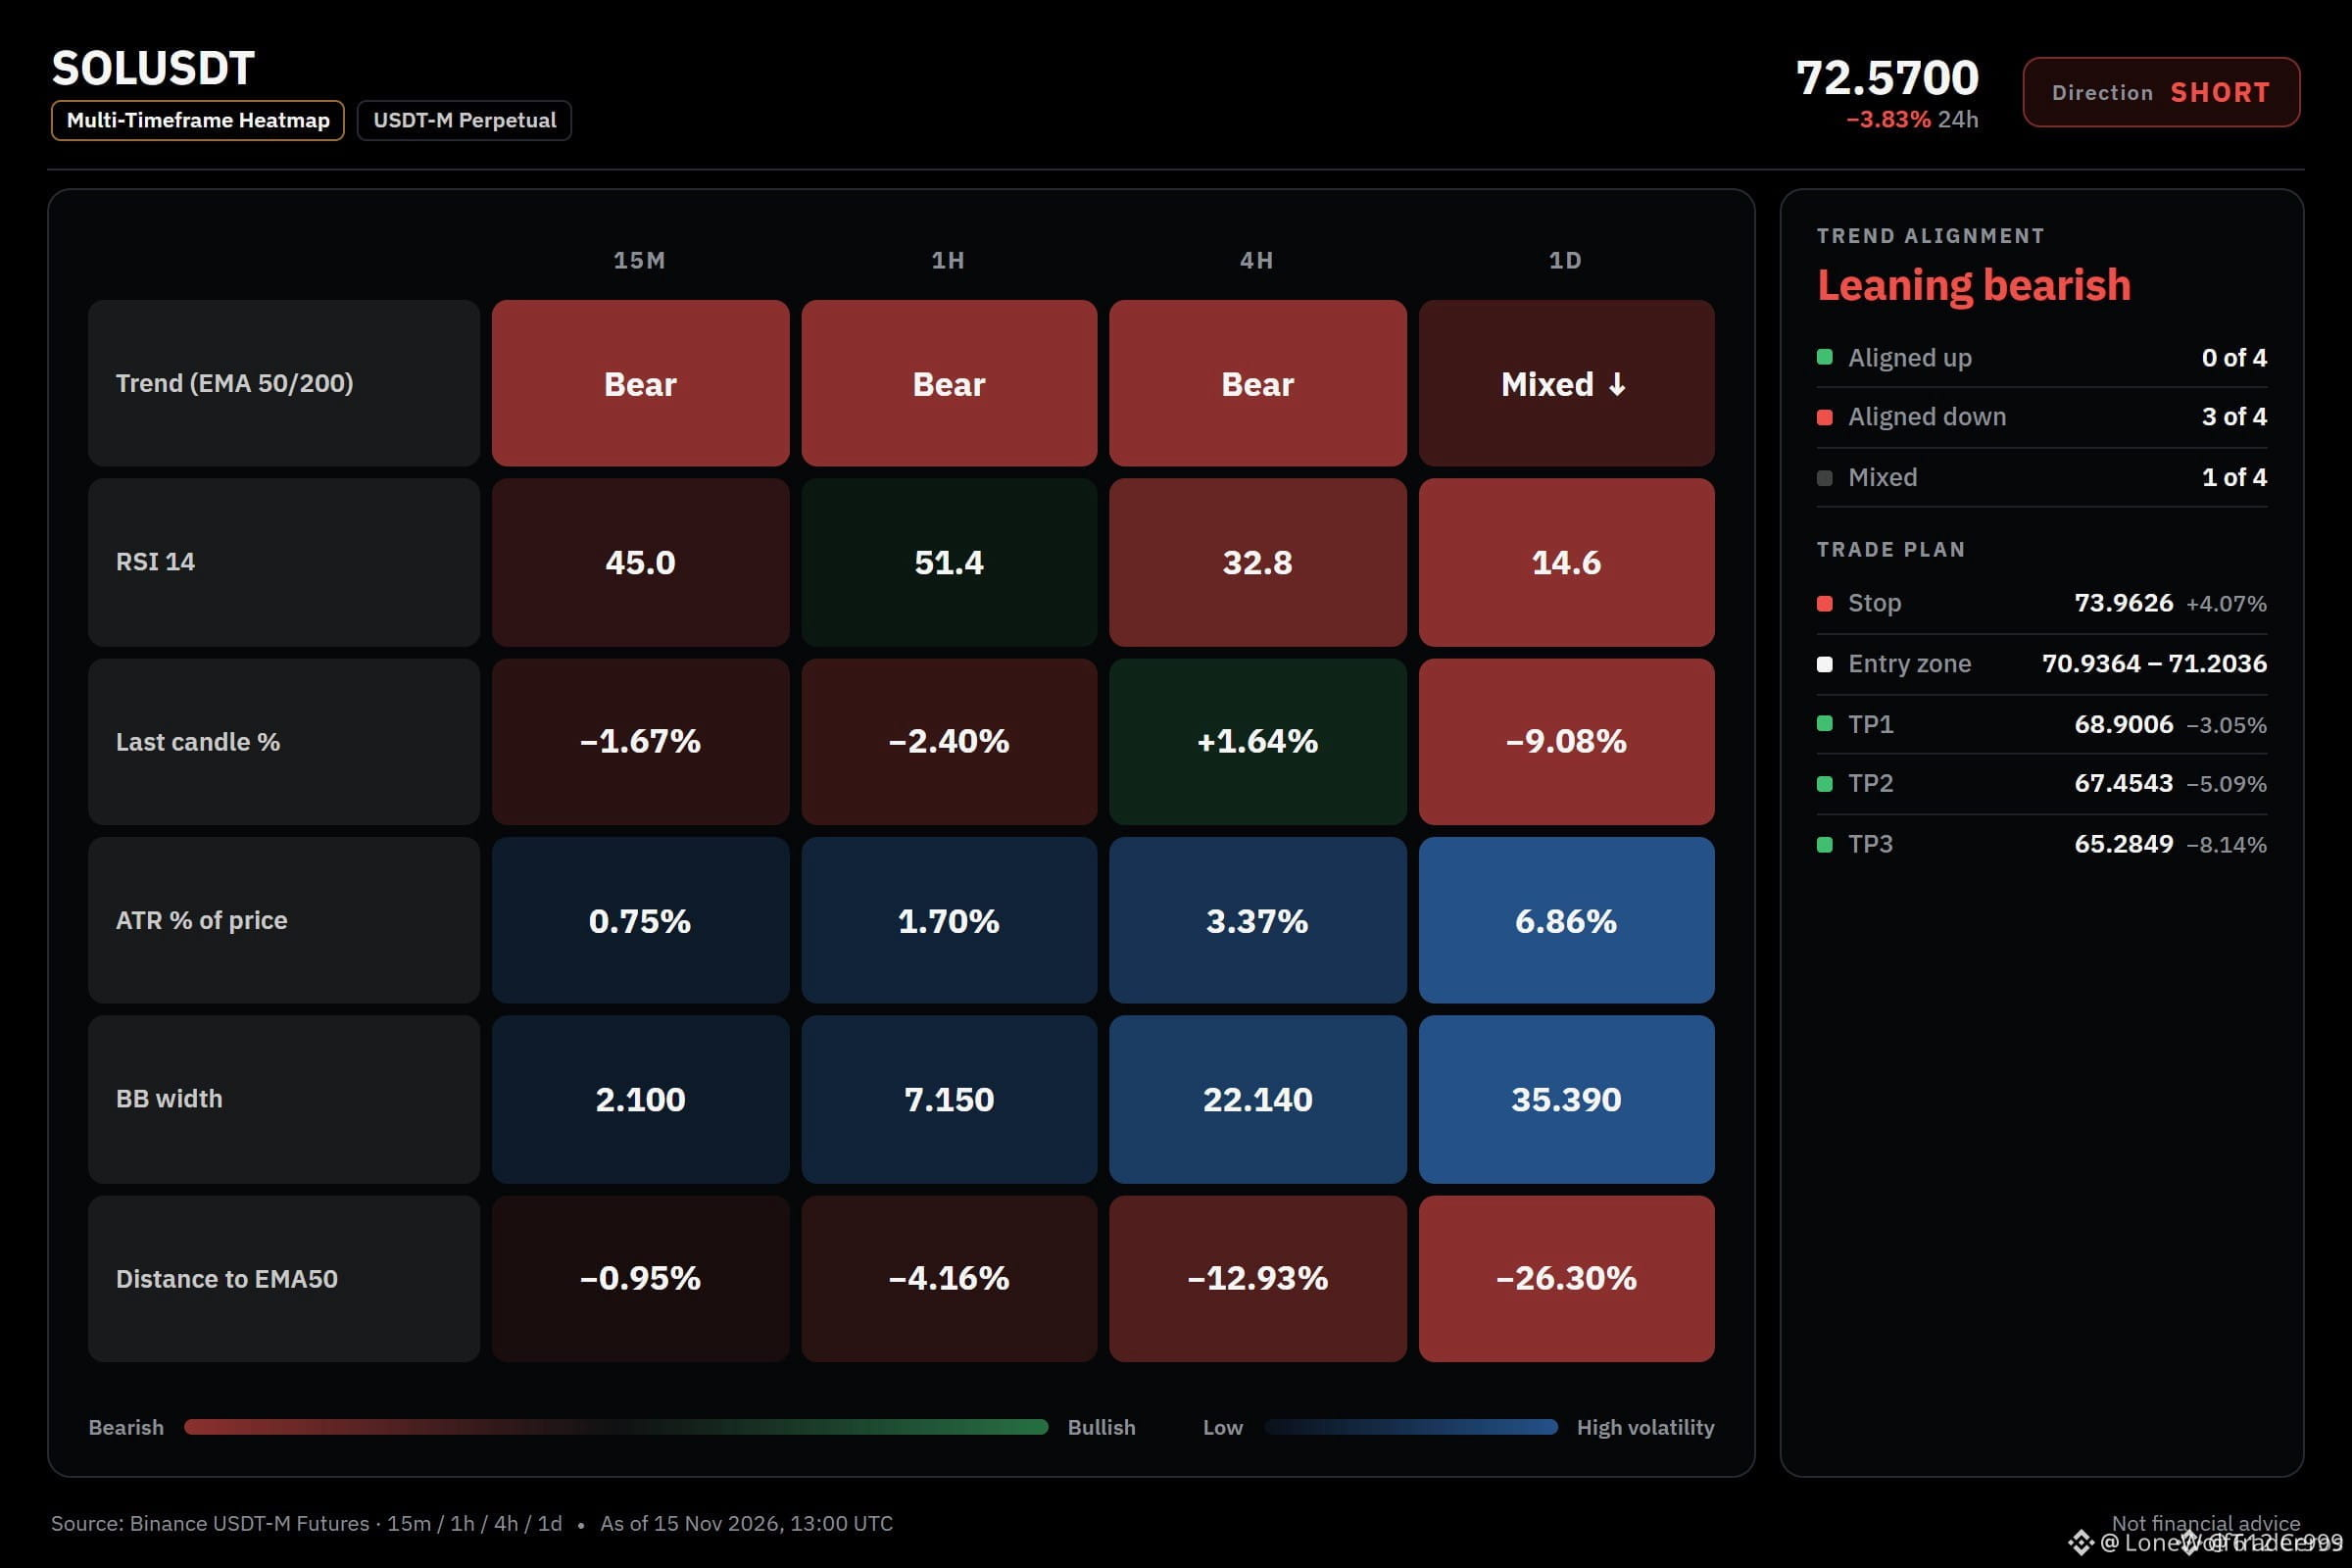
🔴 $SOL SLIPPING BELOW KEY MOVING AVERAGES AS SELLERS SEIZE FULL CONTROL! 📉
Entry: 70.9364 - 71.2036 ⚡
Target: 68.9006 🎯
Stop Loss: 73.9626 ⚠️
Sellers are firmly defending the trendline after a clean rejection, locking $SOL below both the fifty and two-hundred period exponential moving averages on the four-hour chart. 📊 This bearish stack confirms that institutional supply is overriding any minor bids attempting to catch falling knives.
Momentum is favoring downside continuation as liquidity thins out above current levels, opening the door for a swift descent toward our targets. ⚡ Scaling out partial profits along the way locks in gains while letting the rest ride down. 💬 Where do you think $SOL finds its next major demand pocket? 👇
⚠️ Not financial advice. Always manage your risk. 🛡️
🏷️ #SOL #ShortSetup #CryptoTrading #Bearish #PriceAction
🩸 🐻
🔴 $SOL SLIPPING BELOW KEY MOVING AVERAGES AS SELLERS SEIZE FULL CONTROL! 📉
Entry: 70.9364 - 71.2036 ⚡
Target: 68.9006 🎯
Stop Loss: 73.9626 ⚠️
Sellers are firmly defending the trendline after a clean rejection, locking $SOL below both the fifty and two-hundred period exponential moving averages on the four-hour chart. 📊 This bearish stack confirms that institutional supply is overriding any minor bids attempting to catch falling knives.
Momentum is favoring downside continuation as liquidity thins out above current levels, opening the door for a swift descent toward our targets. ⚡ Scaling out partial profits along the way locks in gains while letting the rest ride down. 💬 Where do you think $SOL finds its next major demand pocket? 👇
⚠️ Not financial advice. Always manage your risk. 🛡️
🏷️ #SOL #ShortSetup #CryptoTrading #Bearish #PriceAction
🩸 🐻
Entry: 70.9364 - 71.2036 ⚡
Target: 68.9006 🎯
Stop Loss: 73.9626 ⚠️
Sellers are firmly defending the trendline after a clean rejection, locking $SOL below both the fifty and two-hundred period exponential moving averages on the four-hour chart. 📊 This bearish stack confirms that institutional supply is overriding any minor bids attempting to catch falling knives.
Momentum is favoring downside continuation as liquidity thins out above current levels, opening the door for a swift descent toward our targets. ⚡ Scaling out partial profits along the way locks in gains while letting the rest ride down. 💬 Where do you think $SOL finds its next major demand pocket? 👇
⚠️ Not financial advice. Always manage your risk. 🛡️
🏷️ #SOL #ShortSetup #CryptoTrading #Bearish #PriceAction
🩸 🐻
4
Log in to explore more content
Join global crypto users on Binance Square
⚡️ Get latest and useful information about crypto.
💬 Trusted by the world’s largest crypto exchange.
👍 Discover real insights from verified creators.
Email / Phone number
Trending Topics
1
#CryptoSelloffTriggersMultipleWhaleLiquidations
114,223 views
1,308 Discussing
2
#USSpotXRPETFsSeeLargestWeeklyOutflowIn8Months
115,172 views
1,316 Discussing
3
#WillFOMCMinutesReinforceRateHikeExpectations?
27,431 views
564 Discussing
4
#BitcoinActiveSupplyInProfitDropsBelow45%
193,190 views
1,598 Discussing
5
#TONStrategyReports$23.97MQ3NetLoss
16,789 views
129 Discussing
6
#KavaSaysAbnormalActivityLimitedToKavaLend
124,630 views
912 Discussing
7
#WORPTLetsTouristsConvertCryptoToThaiBaht
39,110 views
348 Discussing
8
#WhoWillSucceedJensenHuangatNvidia?
310,316 views
2,089 Discussing
9
#WhatWillDriveCryptoandStocks’NextRebound?
821,124 views
3,880 Discussing
10
#TradFiForBeginners
821,064 views
4,897 Discussing