

#liquidationmap
liquidationmap
398,177 views
858 Discussing
Hot
Latest

·
--
Bullish
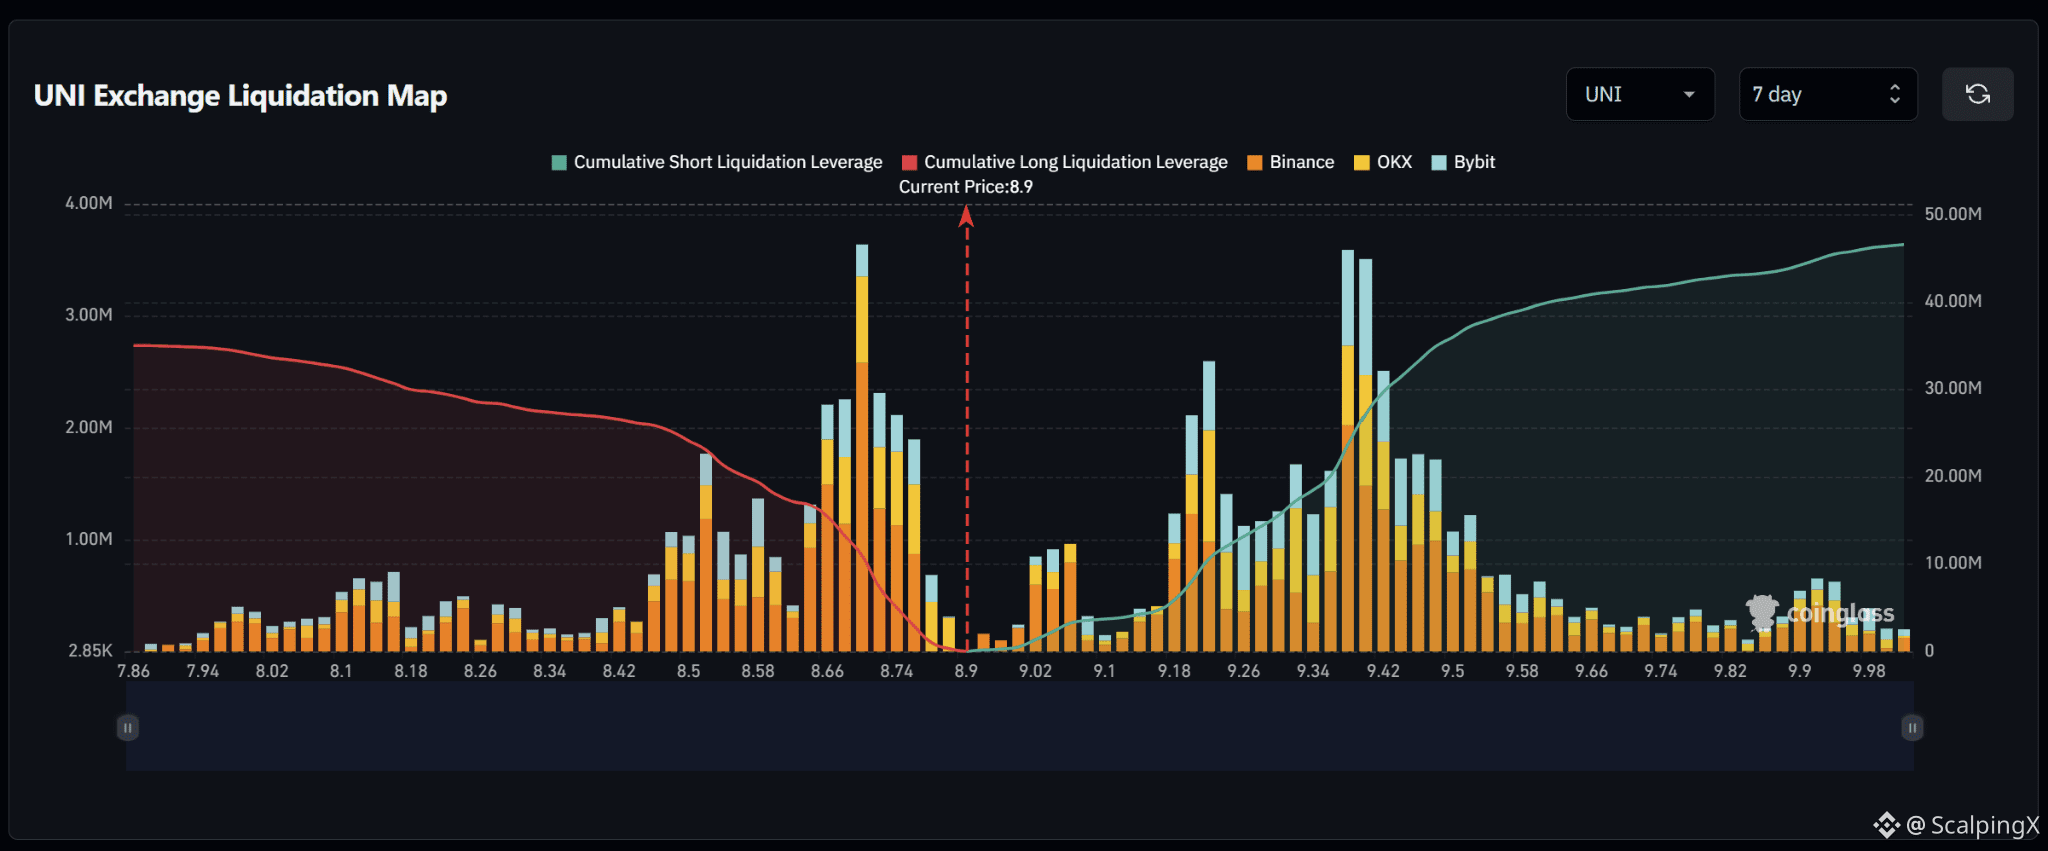
$UNI – Liquidation Map (7 Days) – Current Price 8.90
🔎 The 7-day liquidation map shows roughly 45–46 million USD in short liquidations above the current price, exceeding approximately 34–35 million USD in long liquidations below. The liquidity structure therefore carries a fairly clear upside tilt, with around 1.3 times more cumulative liquidity above the market.
📉 Below the market, long-liquidation liquidity is concentrated heavily across 8.50–8.78. The strongest cluster sits around 8.64–8.75 with several bars near 1.5–3.6 million USD, with the densest concentration around 8.69–8.71. Losing 8.82–8.74 would shift attention toward 8.66–8.58 and then 8.50.
📈 Above the market, short-liquidation liquidity is concentrated across 9.18–9.26 and especially 9.34–9.50. The strongest cluster sits around 9.37–9.42 with bars near 3.5–3.6 million USD, while 9.18–9.23 also contains a bar around 2–2.6 million USD. Further out, 9.44–9.52 continues to hold several notable liquidity layers.
🧭 The broader setup favors the upside because short-liquidation exposure above is larger. Breaking above 9.10–9.18 would expose 9.22–9.26, followed by the major 9.34–9.42 and 9.44–9.52 liquidity zones. Losing 8.82–8.74 would instead increase the probability of a sweep toward 8.66–8.58 and then 8.50.
#LiquidationMap
$UNI – Liquidation Map (7 Days) – Current Price 8.90
🔎 The 7-day liquidation map shows roughly 45–46 million USD in short liquidations above the current price, exceeding approximately 34–35 million USD in long liquidations below. The liquidity structure therefore carries a fairly clear upside tilt, with around 1.3 times more cumulative liquidity above the market.
📉 Below the market, long-liquidation liquidity is concentrated heavily across 8.50–8.78. The strongest cluster sits around 8.64–8.75 with several bars near 1.5–3.6 million USD, with the densest concentration around 8.69–8.71. Losing 8.82–8.74 would shift attention toward 8.66–8.58 and then 8.50.
📈 Above the market, short-liquidation liquidity is concentrated across 9.18–9.26 and especially 9.34–9.50. The strongest cluster sits around 9.37–9.42 with bars near 3.5–3.6 million USD, while 9.18–9.23 also contains a bar around 2–2.6 million USD. Further out, 9.44–9.52 continues to hold several notable liquidity layers.
🧭 The broader setup favors the upside because short-liquidation exposure above is larger. Breaking above 9.10–9.18 would expose 9.22–9.26, followed by the major 9.34–9.42 and 9.44–9.52 liquidity zones. Losing 8.82–8.74 would instead increase the probability of a sweep toward 8.66–8.58 and then 8.50.
#LiquidationMap
🔎 The 7-day liquidation map shows roughly 45–46 million USD in short liquidations above the current price, exceeding approximately 34–35 million USD in long liquidations below. The liquidity structure therefore carries a fairly clear upside tilt, with around 1.3 times more cumulative liquidity above the market.
📉 Below the market, long-liquidation liquidity is concentrated heavily across 8.50–8.78. The strongest cluster sits around 8.64–8.75 with several bars near 1.5–3.6 million USD, with the densest concentration around 8.69–8.71. Losing 8.82–8.74 would shift attention toward 8.66–8.58 and then 8.50.
📈 Above the market, short-liquidation liquidity is concentrated across 9.18–9.26 and especially 9.34–9.50. The strongest cluster sits around 9.37–9.42 with bars near 3.5–3.6 million USD, while 9.18–9.23 also contains a bar around 2–2.6 million USD. Further out, 9.44–9.52 continues to hold several notable liquidity layers.
🧭 The broader setup favors the upside because short-liquidation exposure above is larger. Breaking above 9.10–9.18 would expose 9.22–9.26, followed by the major 9.34–9.42 and 9.44–9.52 liquidity zones. Losing 8.82–8.74 would instead increase the probability of a sweep toward 8.66–8.58 and then 8.50.
#LiquidationMap
3
·
--
Bullish
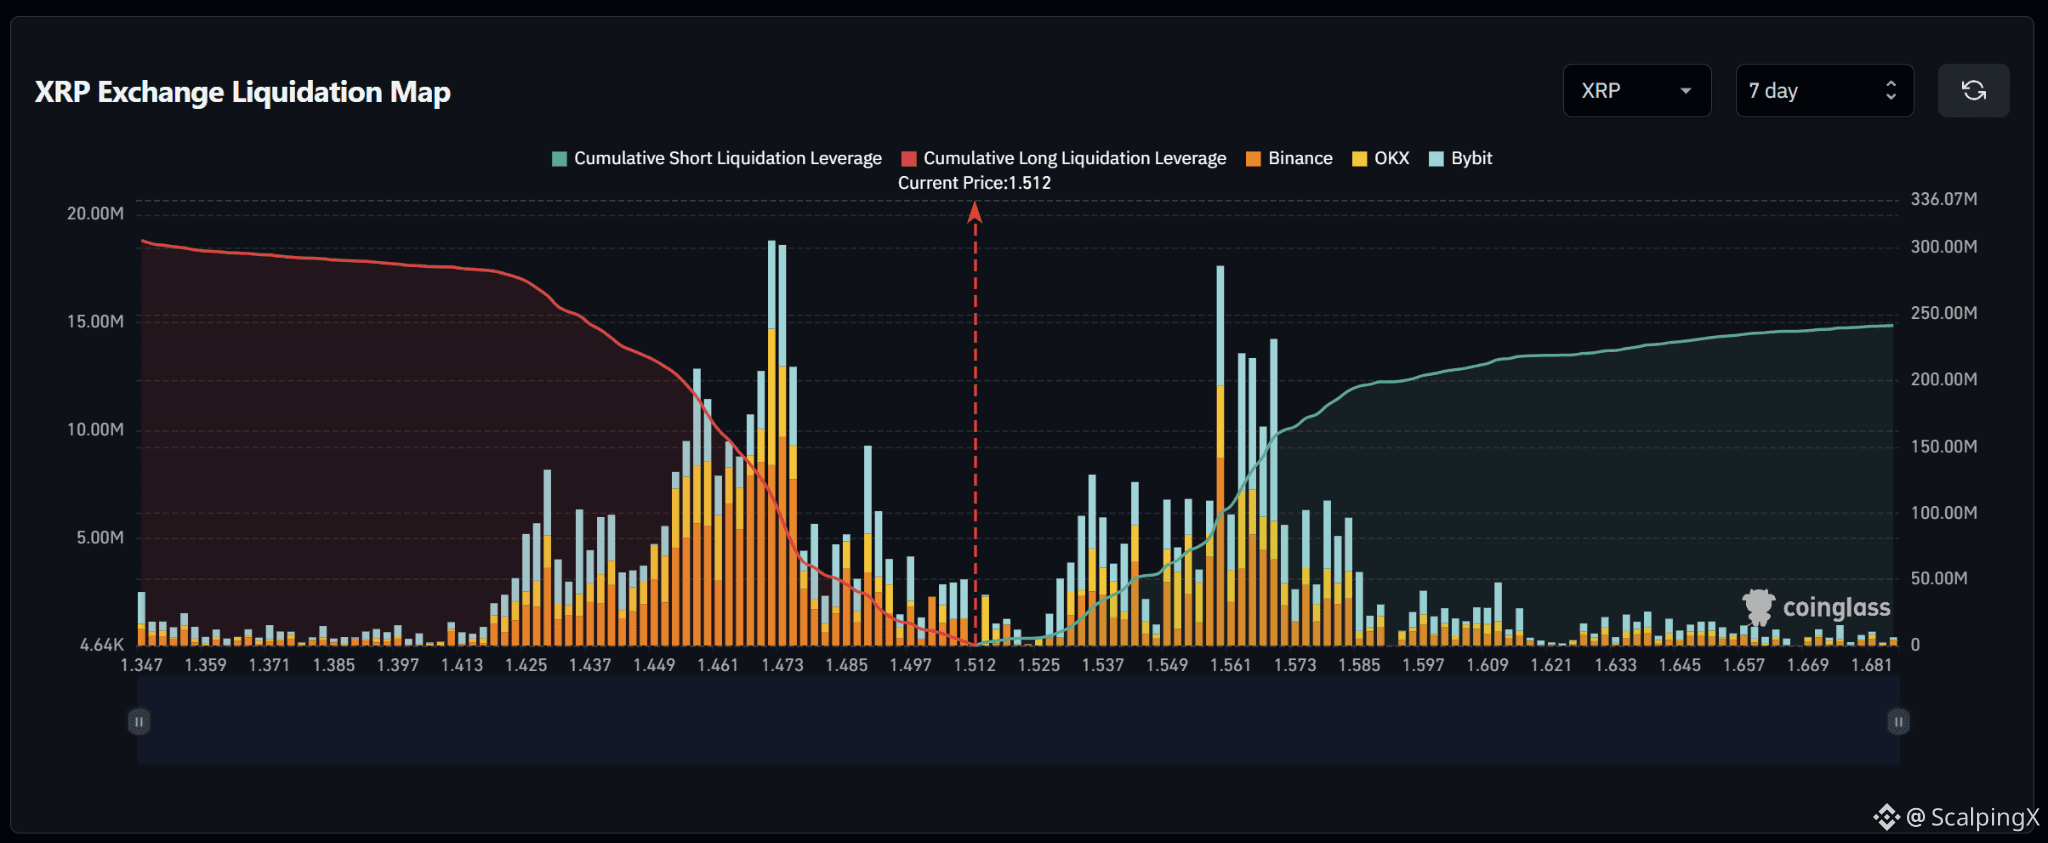
$XRP – Liquidation Map (7 Days) – Current Price 1.512
🔎 The 7-day liquidation map shows roughly 300–305 million USD in long liquidations below the current price, exceeding approximately 240–245 million USD in short liquidations above. The liquidity structure therefore carries a fairly clear downside tilt, with around 1.25 times more cumulative liquidity below the market.
📉 Below the market, long-liquidation liquidity is concentrated heavily across 1.449–1.476. The strongest cluster sits around 1.468–1.474 with several bars near 13–19 million USD, while 1.450–1.463 also contains multiple pockets around 8–13 million USD. Losing 1.497–1.485 would shift attention toward 1.476–1.468 and then 1.461–1.449.
📈 Above the market, short-liquidation liquidity is concentrated across 1.535–1.585. The strongest cluster sits around 1.556–1.573 with several bars near 10–18 million USD, with the 1.559–1.562 area standing out most. Further out, 1.575–1.585 continues to hold multiple bars around 5–7 million USD.
🧭 The broader setup favors the downside because long-liquidation exposure below is larger. Losing 1.497–1.485 would increase the probability of a sweep toward 1.476–1.468, followed by 1.461–1.449. Breaking above 1.535–1.549 would instead expose 1.556–1.573 and then 1.580–1.585.
#LiquidationMap
$XRP – Liquidation Map (7 Days) – Current Price 1.512
🔎 The 7-day liquidation map shows roughly 300–305 million USD in long liquidations below the current price, exceeding approximately 240–245 million USD in short liquidations above. The liquidity structure therefore carries a fairly clear downside tilt, with around 1.25 times more cumulative liquidity below the market.
📉 Below the market, long-liquidation liquidity is concentrated heavily across 1.449–1.476. The strongest cluster sits around 1.468–1.474 with several bars near 13–19 million USD, while 1.450–1.463 also contains multiple pockets around 8–13 million USD. Losing 1.497–1.485 would shift attention toward 1.476–1.468 and then 1.461–1.449.
📈 Above the market, short-liquidation liquidity is concentrated across 1.535–1.585. The strongest cluster sits around 1.556–1.573 with several bars near 10–18 million USD, with the 1.559–1.562 area standing out most. Further out, 1.575–1.585 continues to hold multiple bars around 5–7 million USD.
🧭 The broader setup favors the downside because long-liquidation exposure below is larger. Losing 1.497–1.485 would increase the probability of a sweep toward 1.476–1.468, followed by 1.461–1.449. Breaking above 1.535–1.549 would instead expose 1.556–1.573 and then 1.580–1.585.
#LiquidationMap
🔎 The 7-day liquidation map shows roughly 300–305 million USD in long liquidations below the current price, exceeding approximately 240–245 million USD in short liquidations above. The liquidity structure therefore carries a fairly clear downside tilt, with around 1.25 times more cumulative liquidity below the market.
📉 Below the market, long-liquidation liquidity is concentrated heavily across 1.449–1.476. The strongest cluster sits around 1.468–1.474 with several bars near 13–19 million USD, while 1.450–1.463 also contains multiple pockets around 8–13 million USD. Losing 1.497–1.485 would shift attention toward 1.476–1.468 and then 1.461–1.449.
📈 Above the market, short-liquidation liquidity is concentrated across 1.535–1.585. The strongest cluster sits around 1.556–1.573 with several bars near 10–18 million USD, with the 1.559–1.562 area standing out most. Further out, 1.575–1.585 continues to hold multiple bars around 5–7 million USD.
🧭 The broader setup favors the downside because long-liquidation exposure below is larger. Losing 1.497–1.485 would increase the probability of a sweep toward 1.476–1.468, followed by 1.461–1.449. Breaking above 1.535–1.549 would instead expose 1.556–1.573 and then 1.580–1.585.
#LiquidationMap
23
·
--
Bullish
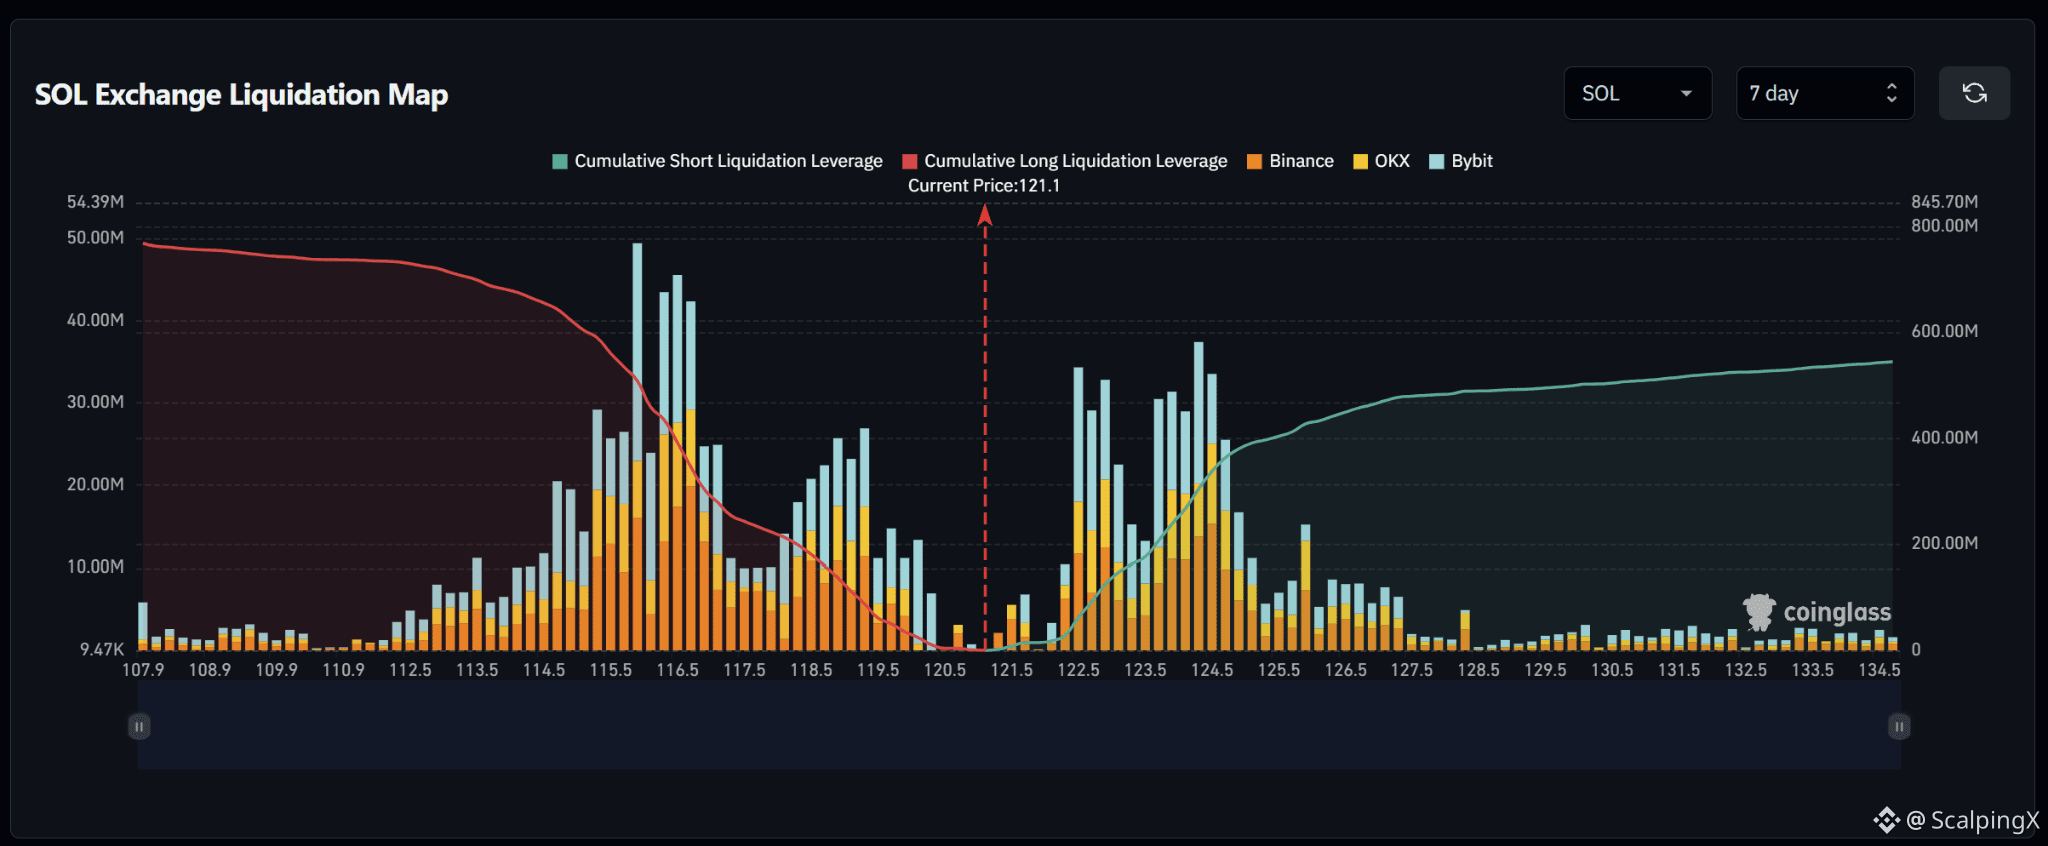
$SOL – Liquidation Map (7 Days) – Current Price 121.1
🔎 The 7-day liquidation map shows roughly 760–780 million USD in long liquidations below the current price, exceeding approximately 540–560 million USD in short liquidations above. The liquidity structure therefore carries a fairly clear downside tilt.
📉 Below the market, long-liquidation liquidity is concentrated most heavily across 115.3–116.8. The strongest cluster sits around 115.8–116.6 with several bars near 25–49 million USD, while 118.2–119.2 also holds another notable cluster with multiple bars around 18–27 million USD. Losing 120.5–119.5 would shift attention toward 118.8–118.0 and then 116.8–115.5.
📈 Above the market, short-liquidation liquidity is concentrated across 122.3–124.8. The strongest cluster sits around 123.5–124.5 with several bars near 25–38 million USD, while 122.3–123.0 also contains bars around 25–35 million USD. Further out, 125.5–127.0 continues to hold smaller liquidity layers.
🧭 The broader setup favors the downside because long-liquidation exposure below is larger. Losing 120.5–119.5 would increase the probability of a sweep toward 118.8–118.0, followed by 116.8–115.5. Breaking above 122.3–123.0 would instead expose 123.5–124.5 and then 125.5–127.0.
#LiquidationMap
$SOL – Liquidation Map (7 Days) – Current Price 121.1
🔎 The 7-day liquidation map shows roughly 760–780 million USD in long liquidations below the current price, exceeding approximately 540–560 million USD in short liquidations above. The liquidity structure therefore carries a fairly clear downside tilt.
📉 Below the market, long-liquidation liquidity is concentrated most heavily across 115.3–116.8. The strongest cluster sits around 115.8–116.6 with several bars near 25–49 million USD, while 118.2–119.2 also holds another notable cluster with multiple bars around 18–27 million USD. Losing 120.5–119.5 would shift attention toward 118.8–118.0 and then 116.8–115.5.
📈 Above the market, short-liquidation liquidity is concentrated across 122.3–124.8. The strongest cluster sits around 123.5–124.5 with several bars near 25–38 million USD, while 122.3–123.0 also contains bars around 25–35 million USD. Further out, 125.5–127.0 continues to hold smaller liquidity layers.
🧭 The broader setup favors the downside because long-liquidation exposure below is larger. Losing 120.5–119.5 would increase the probability of a sweep toward 118.8–118.0, followed by 116.8–115.5. Breaking above 122.3–123.0 would instead expose 123.5–124.5 and then 125.5–127.0.
#LiquidationMap
🔎 The 7-day liquidation map shows roughly 760–780 million USD in long liquidations below the current price, exceeding approximately 540–560 million USD in short liquidations above. The liquidity structure therefore carries a fairly clear downside tilt.
📉 Below the market, long-liquidation liquidity is concentrated most heavily across 115.3–116.8. The strongest cluster sits around 115.8–116.6 with several bars near 25–49 million USD, while 118.2–119.2 also holds another notable cluster with multiple bars around 18–27 million USD. Losing 120.5–119.5 would shift attention toward 118.8–118.0 and then 116.8–115.5.
📈 Above the market, short-liquidation liquidity is concentrated across 122.3–124.8. The strongest cluster sits around 123.5–124.5 with several bars near 25–38 million USD, while 122.3–123.0 also contains bars around 25–35 million USD. Further out, 125.5–127.0 continues to hold smaller liquidity layers.
🧭 The broader setup favors the downside because long-liquidation exposure below is larger. Losing 120.5–119.5 would increase the probability of a sweep toward 118.8–118.0, followed by 116.8–115.5. Breaking above 122.3–123.0 would instead expose 123.5–124.5 and then 125.5–127.0.
#LiquidationMap
43
·
--
Bullish
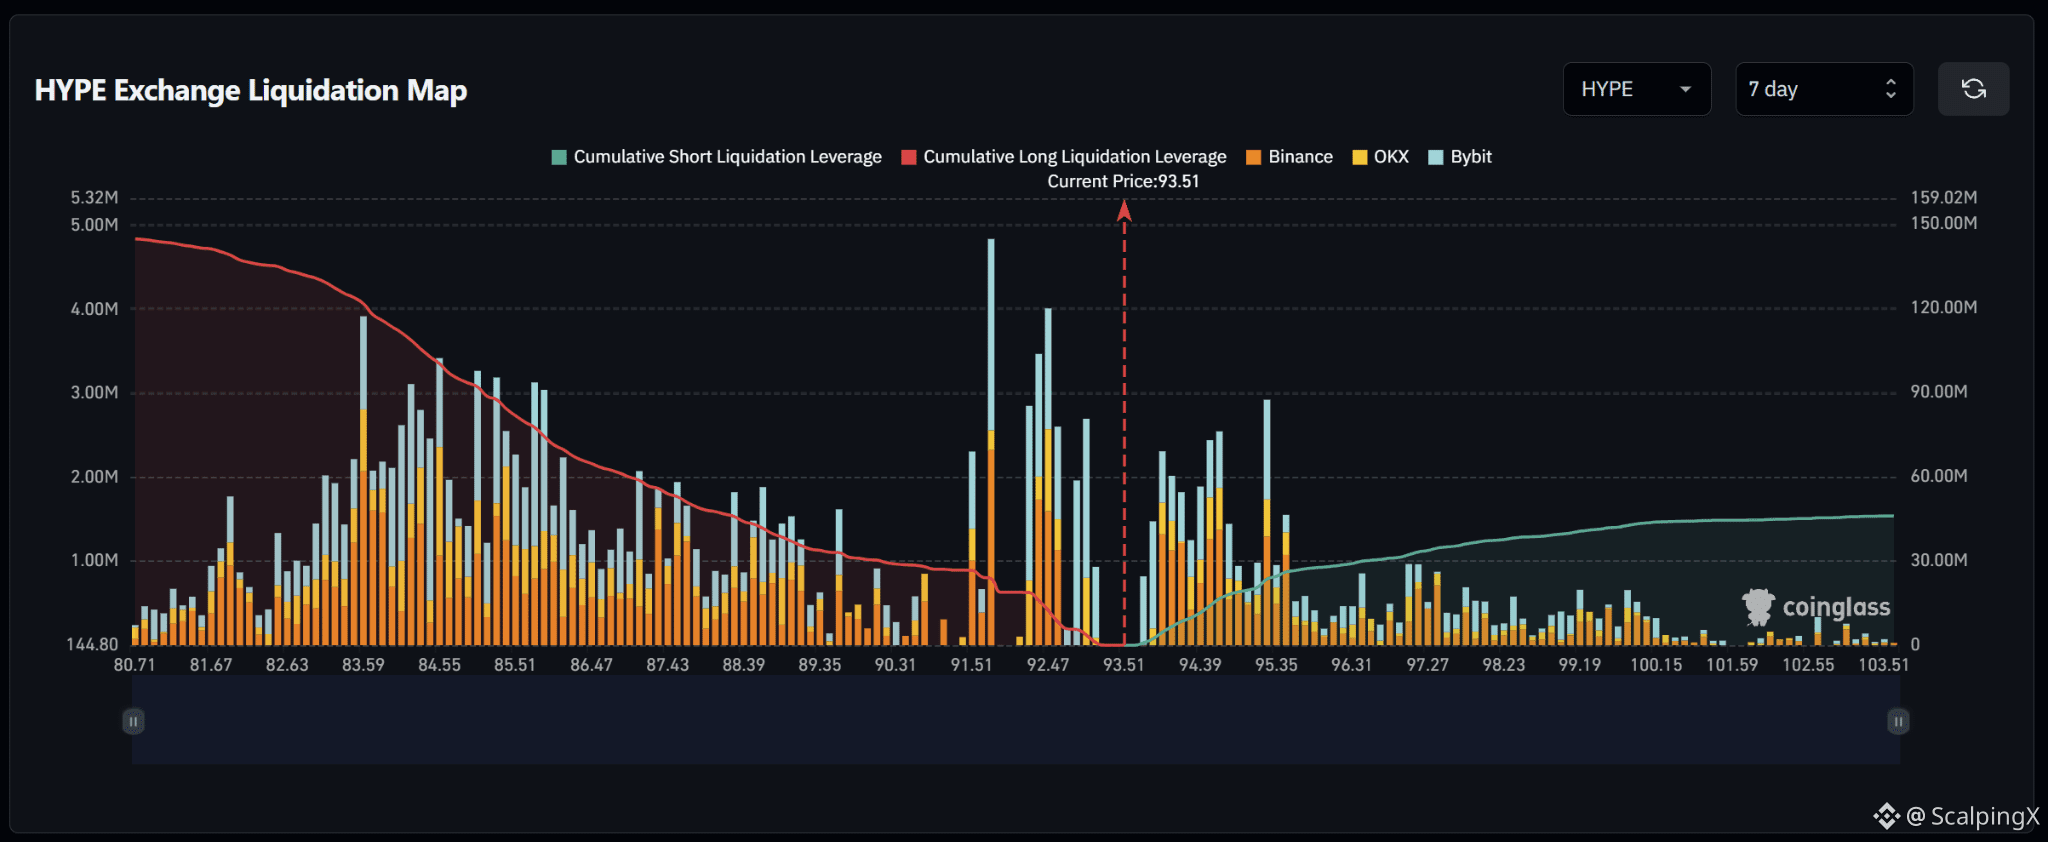
$HYPE – Liquidation Map (7 Days) – Current Price 93.51
🔎 The 7-day liquidation map shows roughly 145 million USD in long liquidations below the current price, nearly four times the approximately 35–38 million USD in short liquidations above. The liquidity structure therefore carries a very strong downside tilt.
📉 Below the market, long-liquidation liquidity is concentrated notably across 91.5–92.8. The strongest cluster sits around 91.7–92.0 with a bar near 4.8 million USD, while 92.3–92.6 contains additional bars around 3–4 million USD. Further below, 83.5–85.8 still holds another major liquidity band.
📈 Above the market, the nearest short-liquidation liquidity is concentrated across 94.0–95.6. Notable clusters appear around 94.0–94.6 with bars near 2–2.5 million USD and 95.2–95.5 with a bar close to 2.9 million USD. Liquidity becomes noticeably thinner above 96.0.
🧭 The broader setup strongly favors the downside because long-liquidation exposure below dominates. Losing 92.5–91.5 would increase the probability of a deeper sweep toward 90.3–89.3, followed by 87.5–85.5. Breaking above 94.0–94.6 would instead expose 95.2–95.6 before liquidity becomes thinner.
#LiquidationMap
$HYPE – Liquidation Map (7 Days) – Current Price 93.51
🔎 The 7-day liquidation map shows roughly 145 million USD in long liquidations below the current price, nearly four times the approximately 35–38 million USD in short liquidations above. The liquidity structure therefore carries a very strong downside tilt.
📉 Below the market, long-liquidation liquidity is concentrated notably across 91.5–92.8. The strongest cluster sits around 91.7–92.0 with a bar near 4.8 million USD, while 92.3–92.6 contains additional bars around 3–4 million USD. Further below, 83.5–85.8 still holds another major liquidity band.
📈 Above the market, the nearest short-liquidation liquidity is concentrated across 94.0–95.6. Notable clusters appear around 94.0–94.6 with bars near 2–2.5 million USD and 95.2–95.5 with a bar close to 2.9 million USD. Liquidity becomes noticeably thinner above 96.0.
🧭 The broader setup strongly favors the downside because long-liquidation exposure below dominates. Losing 92.5–91.5 would increase the probability of a deeper sweep toward 90.3–89.3, followed by 87.5–85.5. Breaking above 94.0–94.6 would instead expose 95.2–95.6 before liquidity becomes thinner.
#LiquidationMap
🔎 The 7-day liquidation map shows roughly 145 million USD in long liquidations below the current price, nearly four times the approximately 35–38 million USD in short liquidations above. The liquidity structure therefore carries a very strong downside tilt.
📉 Below the market, long-liquidation liquidity is concentrated notably across 91.5–92.8. The strongest cluster sits around 91.7–92.0 with a bar near 4.8 million USD, while 92.3–92.6 contains additional bars around 3–4 million USD. Further below, 83.5–85.8 still holds another major liquidity band.
📈 Above the market, the nearest short-liquidation liquidity is concentrated across 94.0–95.6. Notable clusters appear around 94.0–94.6 with bars near 2–2.5 million USD and 95.2–95.5 with a bar close to 2.9 million USD. Liquidity becomes noticeably thinner above 96.0.
🧭 The broader setup strongly favors the downside because long-liquidation exposure below dominates. Losing 92.5–91.5 would increase the probability of a deeper sweep toward 90.3–89.3, followed by 87.5–85.5. Breaking above 94.0–94.6 would instead expose 95.2–95.6 before liquidity becomes thinner.
#LiquidationMap
26
·
--
Bullish
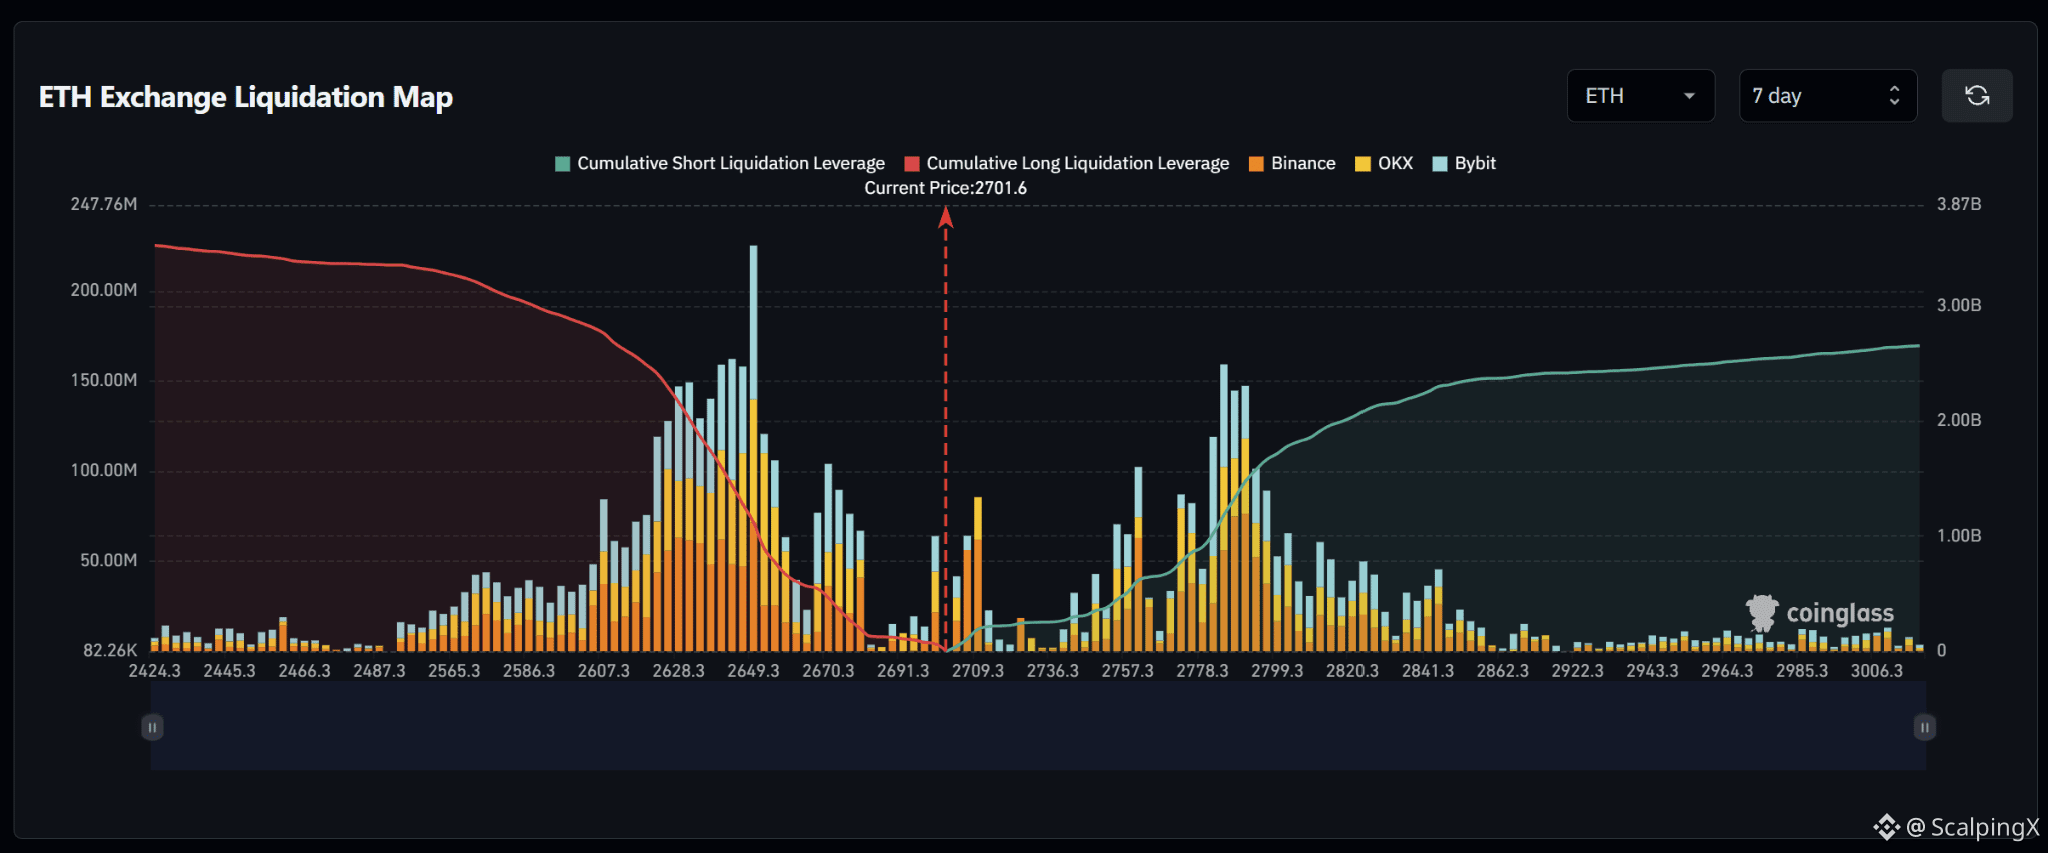
$ETH – Liquidation Map (7 Days) – Current Price 2,701.6
🔎 The 7-day liquidation map shows roughly 3.4–3.5 billion USD in long liquidations below the current price, exceeding approximately 2.6–2.7 billion USD in short liquidations above. The liquidity structure therefore carries a fairly clear downside tilt.
📉 Below the market, long-liquidation liquidity is concentrated heavily across 2,610–2,675. The strongest cluster sits around 2,635–2,655 with several bars near 140–225 million USD, with the densest concentration around 2,649. The 2,660–2,675 area also contains multiple bars around 70–105 million USD. Losing 2,690–2,680 would shift attention toward 2,670–2,645 and then 2,630–2,610.
📈 Above the market, short-liquidation liquidity is concentrated across 2,750–2,805. The strongest cluster sits around 2,780–2,795 with several bars near 120–160 million USD, while 2,755–2,770 also contains pockets around 70–100 million USD. Further out, 2,810–2,850 continues to hold another notable liquidity band.
🧭 The broader setup favors the downside because long-liquidation exposure below is larger. Losing 2,690–2,680 would increase the probability of a sweep toward 2,670–2,645, followed by 2,630–2,610. Breaking above 2,735–2,755 would instead expose 2,780–2,795 and then 2,810–2,850.
#LiquidationMap
$ETH – Liquidation Map (7 Days) – Current Price 2,701.6
🔎 The 7-day liquidation map shows roughly 3.4–3.5 billion USD in long liquidations below the current price, exceeding approximately 2.6–2.7 billion USD in short liquidations above. The liquidity structure therefore carries a fairly clear downside tilt.
📉 Below the market, long-liquidation liquidity is concentrated heavily across 2,610–2,675. The strongest cluster sits around 2,635–2,655 with several bars near 140–225 million USD, with the densest concentration around 2,649. The 2,660–2,675 area also contains multiple bars around 70–105 million USD. Losing 2,690–2,680 would shift attention toward 2,670–2,645 and then 2,630–2,610.
📈 Above the market, short-liquidation liquidity is concentrated across 2,750–2,805. The strongest cluster sits around 2,780–2,795 with several bars near 120–160 million USD, while 2,755–2,770 also contains pockets around 70–100 million USD. Further out, 2,810–2,850 continues to hold another notable liquidity band.
🧭 The broader setup favors the downside because long-liquidation exposure below is larger. Losing 2,690–2,680 would increase the probability of a sweep toward 2,670–2,645, followed by 2,630–2,610. Breaking above 2,735–2,755 would instead expose 2,780–2,795 and then 2,810–2,850.
#LiquidationMap
🔎 The 7-day liquidation map shows roughly 3.4–3.5 billion USD in long liquidations below the current price, exceeding approximately 2.6–2.7 billion USD in short liquidations above. The liquidity structure therefore carries a fairly clear downside tilt.
📉 Below the market, long-liquidation liquidity is concentrated heavily across 2,610–2,675. The strongest cluster sits around 2,635–2,655 with several bars near 140–225 million USD, with the densest concentration around 2,649. The 2,660–2,675 area also contains multiple bars around 70–105 million USD. Losing 2,690–2,680 would shift attention toward 2,670–2,645 and then 2,630–2,610.
📈 Above the market, short-liquidation liquidity is concentrated across 2,750–2,805. The strongest cluster sits around 2,780–2,795 with several bars near 120–160 million USD, while 2,755–2,770 also contains pockets around 70–100 million USD. Further out, 2,810–2,850 continues to hold another notable liquidity band.
🧭 The broader setup favors the downside because long-liquidation exposure below is larger. Losing 2,690–2,680 would increase the probability of a sweep toward 2,670–2,645, followed by 2,630–2,610. Breaking above 2,735–2,755 would instead expose 2,780–2,795 and then 2,810–2,850.
#LiquidationMap
100
·
--
Bullish
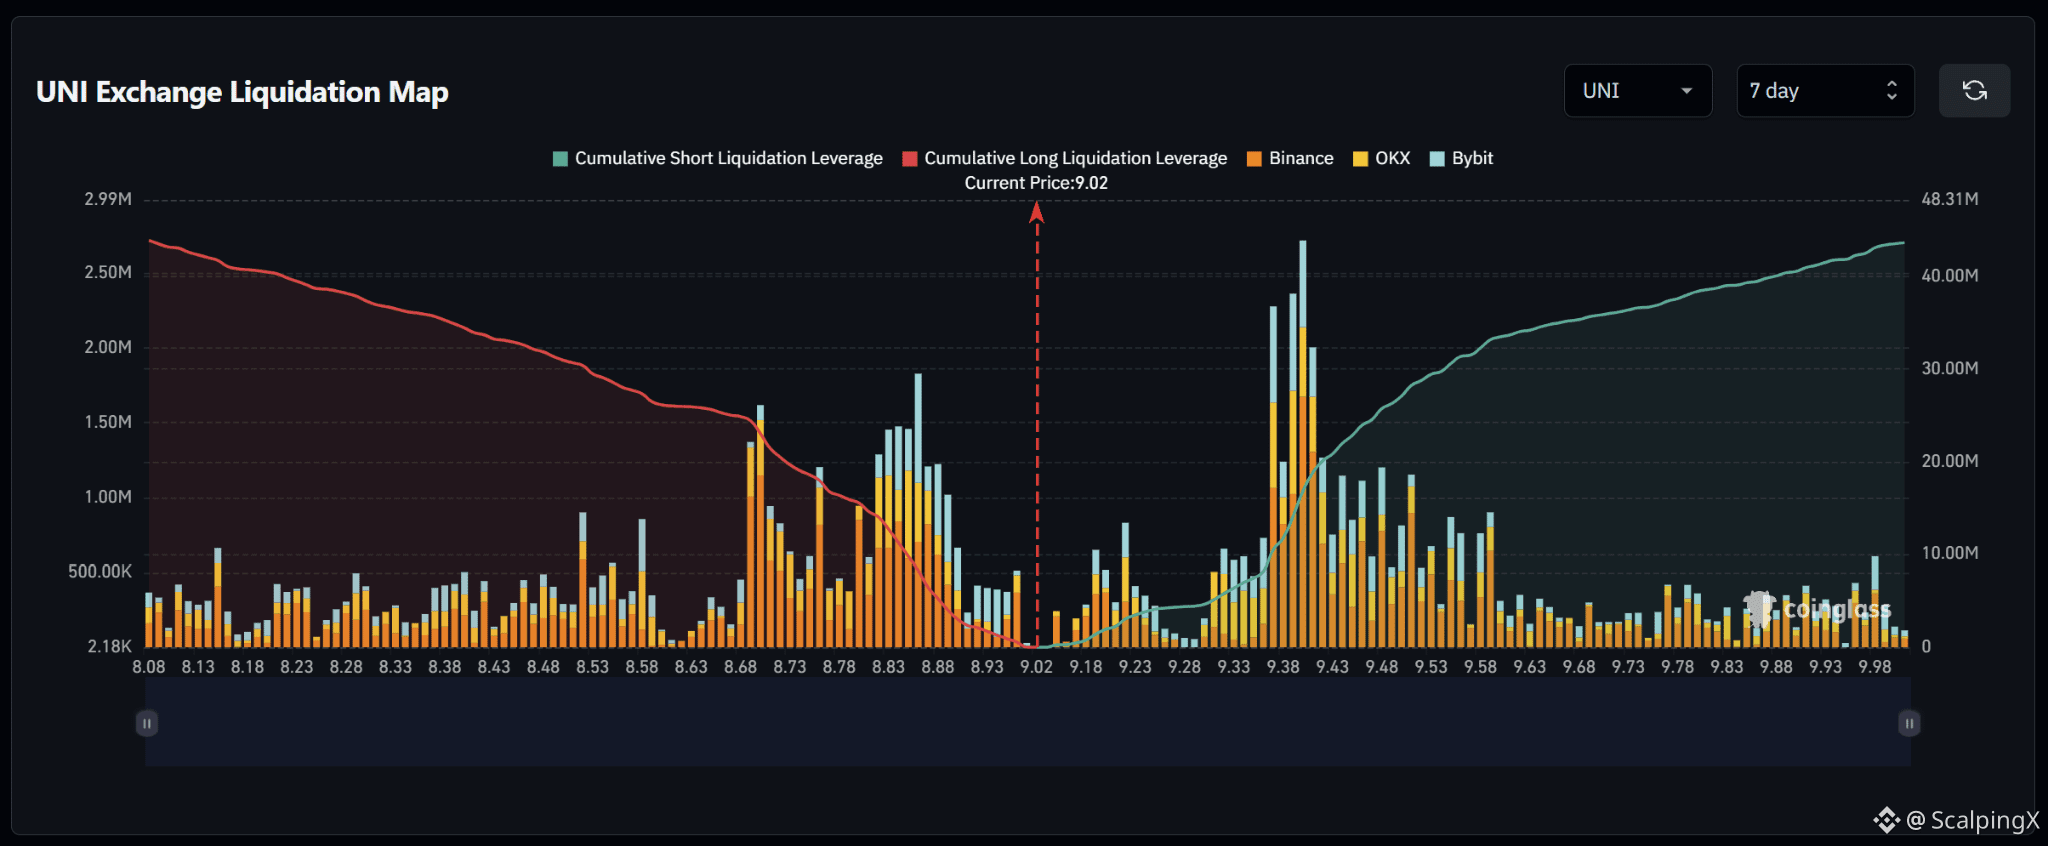
$UNI – Liquidation Map (7 Days) – Current Price 9.02
🔎 The 7-day liquidation map is relatively balanced, with both long liquidations below and short liquidations above totaling roughly 42–44 million USD. The overall imbalance is limited, although the upside contains several larger individual liquidation clusters.
📉 Below the market, long-liquidation liquidity is concentrated heavily across 8.68–8.89. The strongest cluster sits around 8.83–8.88 with several bars near 1.2–1.8 million USD, while 8.68–8.78 also contains multiple pockets around 1.0–1.6 million USD. Losing 8.93–8.88 would shift attention toward 8.83–8.78 and then 8.73–8.68.
📈 Above the market, short-liquidation liquidity is concentrated most heavily across 9.33–9.58. The strongest cluster sits around 9.37–9.43 with several bars near 2.0–2.7 million USD, while 9.45–9.58 continues to hold multiple pockets around 0.8–1.2 million USD.
🧭 The broader setup is close to balanced. Breaking above 9.23–9.33 would expose the major 9.37–9.43 cluster, followed by 9.48–9.58. Losing 8.93–8.88 would instead increase the probability of a sweep toward 8.83–8.78 and then 8.73–8.68.
#LiquidationMap
$UNI – Liquidation Map (7 Days) – Current Price 9.02
🔎 The 7-day liquidation map is relatively balanced, with both long liquidations below and short liquidations above totaling roughly 42–44 million USD. The overall imbalance is limited, although the upside contains several larger individual liquidation clusters.
📉 Below the market, long-liquidation liquidity is concentrated heavily across 8.68–8.89. The strongest cluster sits around 8.83–8.88 with several bars near 1.2–1.8 million USD, while 8.68–8.78 also contains multiple pockets around 1.0–1.6 million USD. Losing 8.93–8.88 would shift attention toward 8.83–8.78 and then 8.73–8.68.
📈 Above the market, short-liquidation liquidity is concentrated most heavily across 9.33–9.58. The strongest cluster sits around 9.37–9.43 with several bars near 2.0–2.7 million USD, while 9.45–9.58 continues to hold multiple pockets around 0.8–1.2 million USD.
🧭 The broader setup is close to balanced. Breaking above 9.23–9.33 would expose the major 9.37–9.43 cluster, followed by 9.48–9.58. Losing 8.93–8.88 would instead increase the probability of a sweep toward 8.83–8.78 and then 8.73–8.68.
#LiquidationMap
🔎 The 7-day liquidation map is relatively balanced, with both long liquidations below and short liquidations above totaling roughly 42–44 million USD. The overall imbalance is limited, although the upside contains several larger individual liquidation clusters.
📉 Below the market, long-liquidation liquidity is concentrated heavily across 8.68–8.89. The strongest cluster sits around 8.83–8.88 with several bars near 1.2–1.8 million USD, while 8.68–8.78 also contains multiple pockets around 1.0–1.6 million USD. Losing 8.93–8.88 would shift attention toward 8.83–8.78 and then 8.73–8.68.
📈 Above the market, short-liquidation liquidity is concentrated most heavily across 9.33–9.58. The strongest cluster sits around 9.37–9.43 with several bars near 2.0–2.7 million USD, while 9.45–9.58 continues to hold multiple pockets around 0.8–1.2 million USD.
🧭 The broader setup is close to balanced. Breaking above 9.23–9.33 would expose the major 9.37–9.43 cluster, followed by 9.48–9.58. Losing 8.93–8.88 would instead increase the probability of a sweep toward 8.83–8.78 and then 8.73–8.68.
#LiquidationMap
12

·
--
Liquidation maps 101 📊
Bars ABOVE price = shorts. Push price up and they get squeezed — forced buybacks accelerate the move.
Bars BELOW price = longs. Drop price down and they get cascaded — forced selling accelerates the drop.
Price is a magnet for the brightest zones. Whales hunt where liquidations cluster.
Right now on the BTC heatmap (PerpDEX Wars data):
- Mapped liquidity: 905.6M — 66% sits BELOW as longs (598.7M), only 34% above as shorts
- Biggest cluster: 331.6M of longs at ~82,598 (-4.5%)
- Nearest shorts: 86,922 (+0.5%), then a 241.1M wall at 87,355–88,220
The last 24h already proved it: 22.16M in shorts got liquidated, up 1304% — that squeeze is what pushed BTC through 86K.
Read: the long side is crowded and exposed below, shorts are thin above 87K. The map doesn't say WHEN price moves — only WHERE the fuel sits. Size your leverage accordingly.
$BTC $ETH
#LiquidationMap #Bitcoin
---
Liquidation maps 101 📊
Bars ABOVE price = shorts. Push price up and they get squeezed — forced buybacks accelerate the move.
Bars BELOW price = longs. Drop price down and they get cascaded — forced selling accelerates the drop.
Price is a magnet for the brightest zones. Whales hunt where liquidations cluster.
Current conditions on the BTC heatmap (PerpDEX Wars data):
- Mapped liquidity: 905.6M — 66% sits BELOW as longs (598.7M), only 34% above as shorts
- Biggest cluster: 331.6M of longs at ~82,598 (-4.5%)
- Nearest shorts: 86,922 (+0.5%), followed by a 241.1M wall at 87,355–88,220
The last 24 hours have already proved it: 22.16M in shorts were liquidated, up 1304% — this squeeze is what pushed BTC through 86K.
In other words: the long side is crowded and exposed below, while shorts are thin above 87K. The map doesn't say WHEN price will move — only WHERE the fuel is. Adjust your leverage accordingly.
#PetaLikuidasi #Bitcoin
Liquidation maps 101 📊
Bars ABOVE price = shorts. Push price up and they get squeezed — forced buybacks accelerate the move.
Bars BELOW price = longs. Drop price down and they get cascaded — forced selling accelerates the drop.
Price is a magnet for the brightest zones. Whales hunt where liquidations cluster.
Right now on the BTC heatmap (PerpDEX Wars data):
- Mapped liquidity: 905.6M — 66% sits BELOW as longs (598.7M), only 34% above as shorts
- Biggest cluster: 331.6M of longs at ~82,598 (-4.5%)
- Nearest shorts: 86,922 (+0.5%), then a 241.1M wall at 87,355–88,220
The last 24h already proved it: 22.16M in shorts got liquidated, up 1304% — that squeeze is what pushed BTC through 86K.
Read: the long side is crowded and exposed below, shorts are thin above 87K. The map doesn't say WHEN price moves — only WHERE the fuel sits. Size your leverage accordingly.
$BTC $ETH
#LiquidationMap #Bitcoin
---
Liquidation maps 101 📊
Bars ABOVE price = shorts. Push price up and they get squeezed — forced buybacks accelerate the move.
Bars BELOW price = longs. Drop price down and they get cascaded — forced selling accelerates the drop.
Price is a magnet for the brightest zones. Whales hunt where liquidations cluster.
Current conditions on the BTC heatmap (PerpDEX Wars data):
- Mapped liquidity: 905.6M — 66% sits BELOW as longs (598.7M), only 34% above as shorts
- Biggest cluster: 331.6M of longs at ~82,598 (-4.5%)
- Nearest shorts: 86,922 (+0.5%), followed by a 241.1M wall at 87,355–88,220
The last 24 hours have already proved it: 22.16M in shorts were liquidated, up 1304% — this squeeze is what pushed BTC through 86K.
In other words: the long side is crowded and exposed below, while shorts are thin above 87K. The map doesn't say WHEN price will move — only WHERE the fuel is. Adjust your leverage accordingly.
#PetaLikuidasi #Bitcoin
Bars ABOVE price = shorts. Push price up and they get squeezed — forced buybacks accelerate the move.
Bars BELOW price = longs. Drop price down and they get cascaded — forced selling accelerates the drop.
Price is a magnet for the brightest zones. Whales hunt where liquidations cluster.
Right now on the BTC heatmap (PerpDEX Wars data):
- Mapped liquidity: 905.6M — 66% sits BELOW as longs (598.7M), only 34% above as shorts
- Biggest cluster: 331.6M of longs at ~82,598 (-4.5%)
- Nearest shorts: 86,922 (+0.5%), then a 241.1M wall at 87,355–88,220
The last 24h already proved it: 22.16M in shorts got liquidated, up 1304% — that squeeze is what pushed BTC through 86K.
Read: the long side is crowded and exposed below, shorts are thin above 87K. The map doesn't say WHEN price moves — only WHERE the fuel sits. Size your leverage accordingly.
$BTC $ETH
#LiquidationMap #Bitcoin
---
Liquidation maps 101 📊
Bars ABOVE price = shorts. Push price up and they get squeezed — forced buybacks accelerate the move.
Bars BELOW price = longs. Drop price down and they get cascaded — forced selling accelerates the drop.
Price is a magnet for the brightest zones. Whales hunt where liquidations cluster.
Current conditions on the BTC heatmap (PerpDEX Wars data):
- Mapped liquidity: 905.6M — 66% sits BELOW as longs (598.7M), only 34% above as shorts
- Biggest cluster: 331.6M of longs at ~82,598 (-4.5%)
- Nearest shorts: 86,922 (+0.5%), followed by a 241.1M wall at 87,355–88,220
The last 24 hours have already proved it: 22.16M in shorts were liquidated, up 1304% — this squeeze is what pushed BTC through 86K.
In other words: the long side is crowded and exposed below, while shorts are thin above 87K. The map doesn't say WHEN price will move — only WHERE the fuel is. Adjust your leverage accordingly.
#PetaLikuidasi #Bitcoin
65
·
--
Bullish
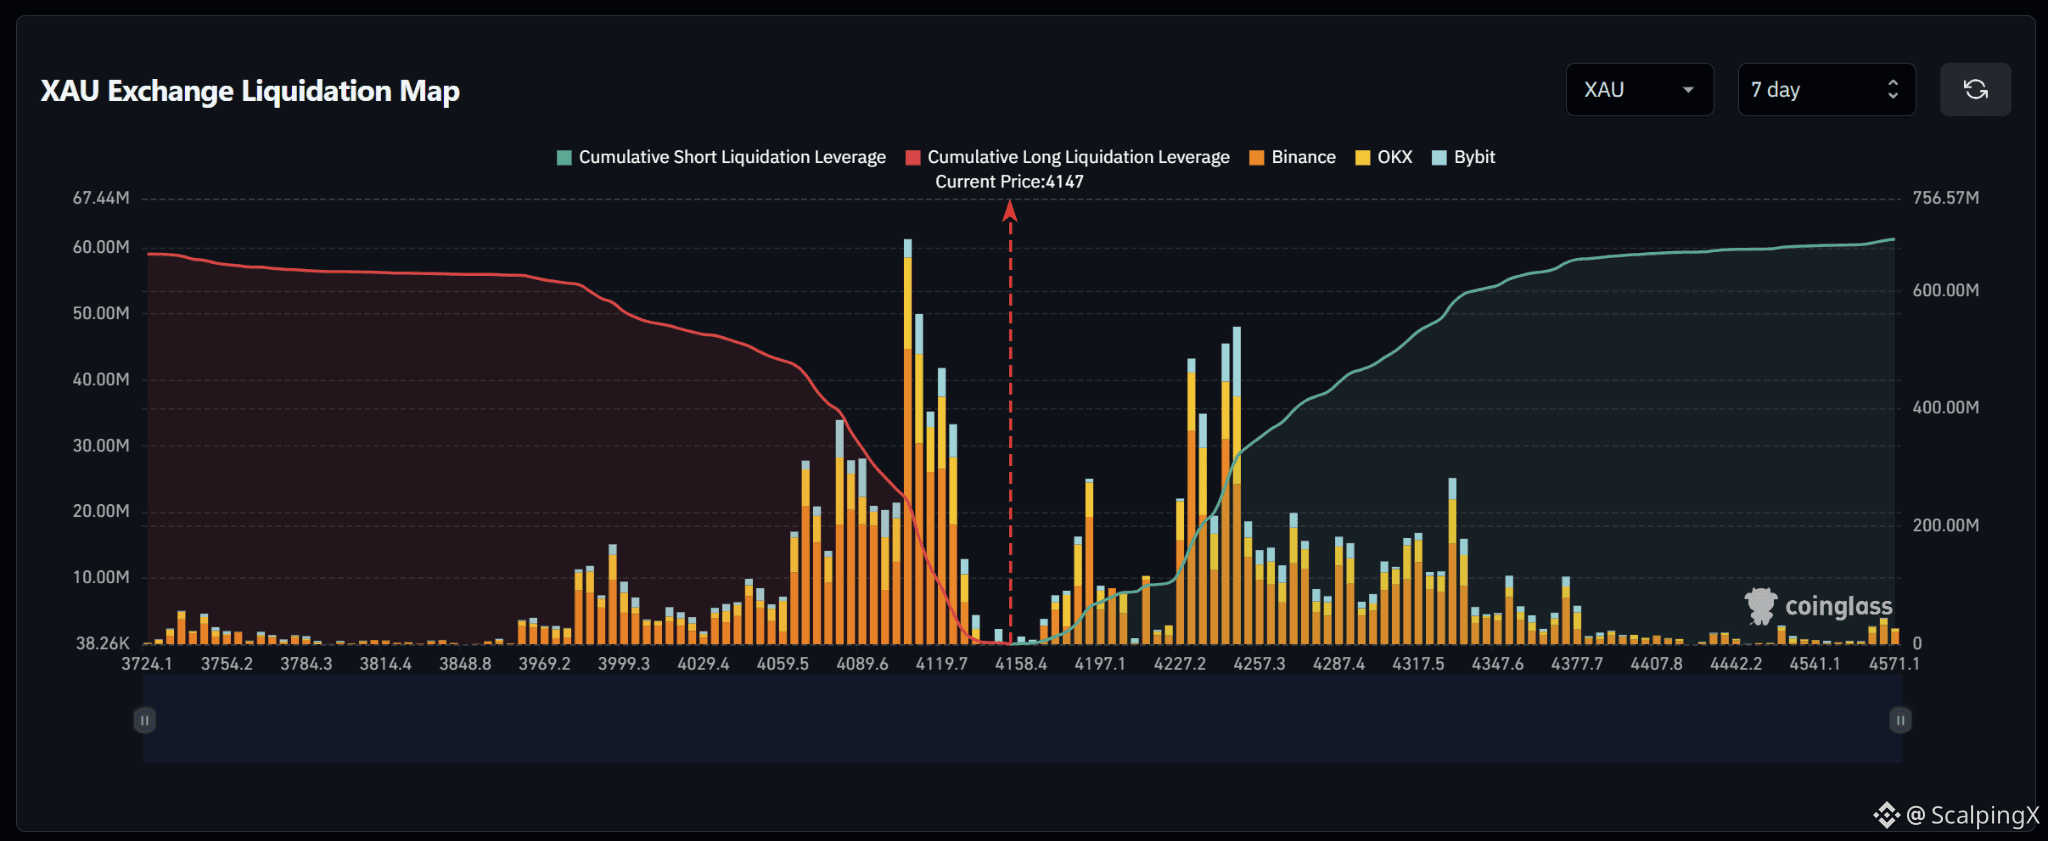
$XAU – Liquidation Map (7 Days) – Current Price 4,147
🔎 The 7-day liquidation map is relatively balanced, with roughly 690–700 million USD in short liquidations above the current price, slightly exceeding approximately 660–670 million USD in long liquidations below. The overall structure therefore carries a mild upside tilt rather than a strong imbalance.
📉 Below the market, long-liquidation liquidity is concentrated heavily across 4,060–4,120. The strongest cluster sits around 4,095–4,115, with the largest bar above 60 million USD, while 4,070–4,090 also contains several bars around 20–35 million USD. Losing 4,120–4,110 would shift attention toward 4,090–4,070 and then 4,060.
📈 Above the market, short-liquidation liquidity is concentrated across 4,220–4,260. The strongest cluster sits around 4,230–4,250 with several bars around 35–48 million USD; closer to price, 4,190–4,200 contains a bar near 25 million USD. Further out, 4,280–4,340 continues to hold several notable liquidity layers.
🧭 The broader setup is close to balanced but carries a mild upside tilt. Breaking above 4,190–4,200 would expose 4,220–4,260, followed by 4,280–4,340. Losing 4,120–4,110 would instead increase the probability of a sweep toward 4,090–4,070.
#LiquidationMap
$XAU – Liquidation Map (7 Days) – Current Price 4,147
🔎 The 7-day liquidation map is relatively balanced, with roughly 690–700 million USD in short liquidations above the current price, slightly exceeding approximately 660–670 million USD in long liquidations below. The overall structure therefore carries a mild upside tilt rather than a strong imbalance.
📉 Below the market, long-liquidation liquidity is concentrated heavily across 4,060–4,120. The strongest cluster sits around 4,095–4,115, with the largest bar above 60 million USD, while 4,070–4,090 also contains several bars around 20–35 million USD. Losing 4,120–4,110 would shift attention toward 4,090–4,070 and then 4,060.
📈 Above the market, short-liquidation liquidity is concentrated across 4,220–4,260. The strongest cluster sits around 4,230–4,250 with several bars around 35–48 million USD; closer to price, 4,190–4,200 contains a bar near 25 million USD. Further out, 4,280–4,340 continues to hold several notable liquidity layers.
🧭 The broader setup is close to balanced but carries a mild upside tilt. Breaking above 4,190–4,200 would expose 4,220–4,260, followed by 4,280–4,340. Losing 4,120–4,110 would instead increase the probability of a sweep toward 4,090–4,070.
#LiquidationMap
🔎 The 7-day liquidation map is relatively balanced, with roughly 690–700 million USD in short liquidations above the current price, slightly exceeding approximately 660–670 million USD in long liquidations below. The overall structure therefore carries a mild upside tilt rather than a strong imbalance.
📉 Below the market, long-liquidation liquidity is concentrated heavily across 4,060–4,120. The strongest cluster sits around 4,095–4,115, with the largest bar above 60 million USD, while 4,070–4,090 also contains several bars around 20–35 million USD. Losing 4,120–4,110 would shift attention toward 4,090–4,070 and then 4,060.
📈 Above the market, short-liquidation liquidity is concentrated across 4,220–4,260. The strongest cluster sits around 4,230–4,250 with several bars around 35–48 million USD; closer to price, 4,190–4,200 contains a bar near 25 million USD. Further out, 4,280–4,340 continues to hold several notable liquidity layers.
🧭 The broader setup is close to balanced but carries a mild upside tilt. Breaking above 4,190–4,200 would expose 4,220–4,260, followed by 4,280–4,340. Losing 4,120–4,110 would instead increase the probability of a sweep toward 4,090–4,070.
#LiquidationMap
76
·
--
Bullish
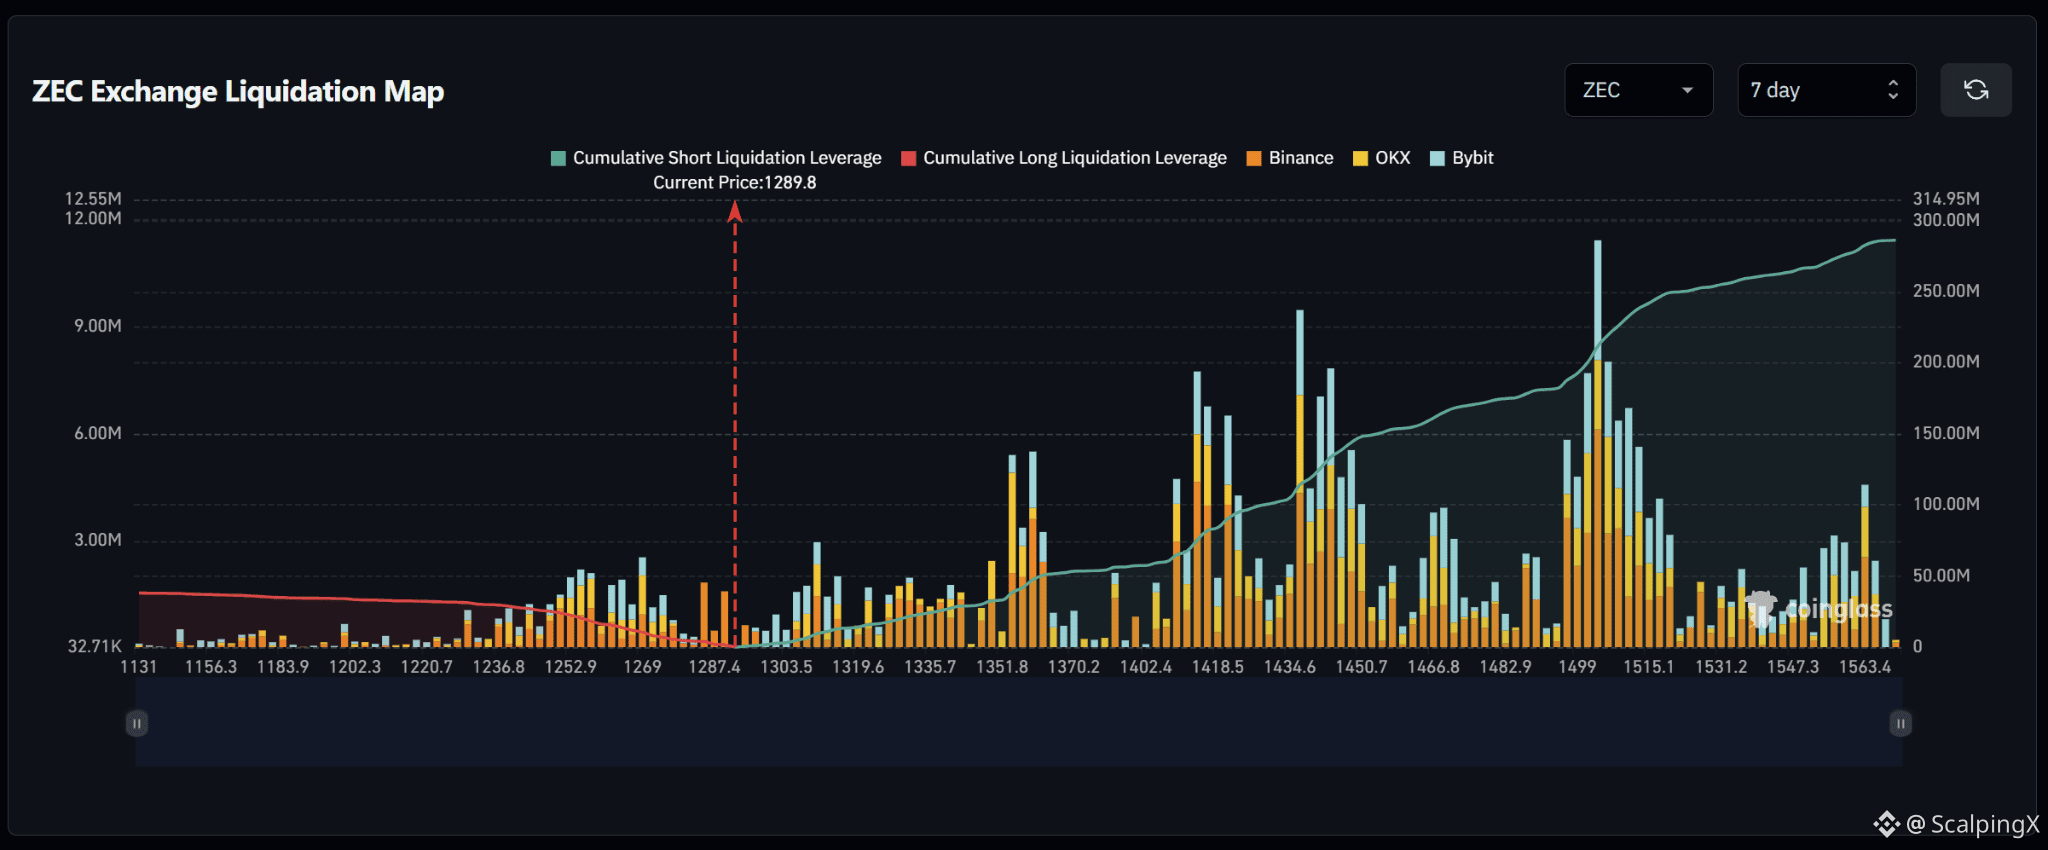
$ZEC – Liquidation Map (7 Days) – Current Price 1,289.8
🔎 The 7-day liquidation map shows roughly 280–290 million USD in short liquidations above the current price, overwhelmingly exceeding only around 40 million USD in long liquidations below. The liquidity structure therefore strongly favors the upside, with roughly seven times more cumulative liquidity above the market.
📉 Below the market, long-liquidation liquidity is relatively thin and concentrated mainly across 1,240–1,275. Notable clusters sit around 1,250–1,270 with several bars near 1.5–2.5 million USD. Losing 1,287–1,280 would shift attention toward 1,270–1,250 and then 1,235–1,220.
📈 Above the market, short-liquidation liquidity is distributed heavily from 1,350 upward. Major clusters appear around 1,410–1,425 with several bars near 6–8 million USD, 1,435–1,450 with a bar near 9.5 million USD, and especially 1,495–1,515 where the largest bar exceeds 11 million USD.
🧭 The broader setup strongly favors the upside because short-liquidation exposure above dominates. Breaking above 1,320–1,350 would expose 1,410–1,450, followed by the major 1,495–1,515 liquidity zone. Losing 1,280 would instead increase the probability of a sweep toward 1,270–1,250.
#LiquidationMap
$ZEC – Liquidation Map (7 Days) – Current Price 1,289.8
🔎 The 7-day liquidation map shows roughly 280–290 million USD in short liquidations above the current price, overwhelmingly exceeding only around 40 million USD in long liquidations below. The liquidity structure therefore strongly favors the upside, with roughly seven times more cumulative liquidity above the market.
📉 Below the market, long-liquidation liquidity is relatively thin and concentrated mainly across 1,240–1,275. Notable clusters sit around 1,250–1,270 with several bars near 1.5–2.5 million USD. Losing 1,287–1,280 would shift attention toward 1,270–1,250 and then 1,235–1,220.
📈 Above the market, short-liquidation liquidity is distributed heavily from 1,350 upward. Major clusters appear around 1,410–1,425 with several bars near 6–8 million USD, 1,435–1,450 with a bar near 9.5 million USD, and especially 1,495–1,515 where the largest bar exceeds 11 million USD.
🧭 The broader setup strongly favors the upside because short-liquidation exposure above dominates. Breaking above 1,320–1,350 would expose 1,410–1,450, followed by the major 1,495–1,515 liquidity zone. Losing 1,280 would instead increase the probability of a sweep toward 1,270–1,250.
#LiquidationMap
🔎 The 7-day liquidation map shows roughly 280–290 million USD in short liquidations above the current price, overwhelmingly exceeding only around 40 million USD in long liquidations below. The liquidity structure therefore strongly favors the upside, with roughly seven times more cumulative liquidity above the market.
📉 Below the market, long-liquidation liquidity is relatively thin and concentrated mainly across 1,240–1,275. Notable clusters sit around 1,250–1,270 with several bars near 1.5–2.5 million USD. Losing 1,287–1,280 would shift attention toward 1,270–1,250 and then 1,235–1,220.
📈 Above the market, short-liquidation liquidity is distributed heavily from 1,350 upward. Major clusters appear around 1,410–1,425 with several bars near 6–8 million USD, 1,435–1,450 with a bar near 9.5 million USD, and especially 1,495–1,515 where the largest bar exceeds 11 million USD.
🧭 The broader setup strongly favors the upside because short-liquidation exposure above dominates. Breaking above 1,320–1,350 would expose 1,410–1,450, followed by the major 1,495–1,515 liquidity zone. Losing 1,280 would instead increase the probability of a sweep toward 1,270–1,250.
#LiquidationMap
125
·
--
Bullish
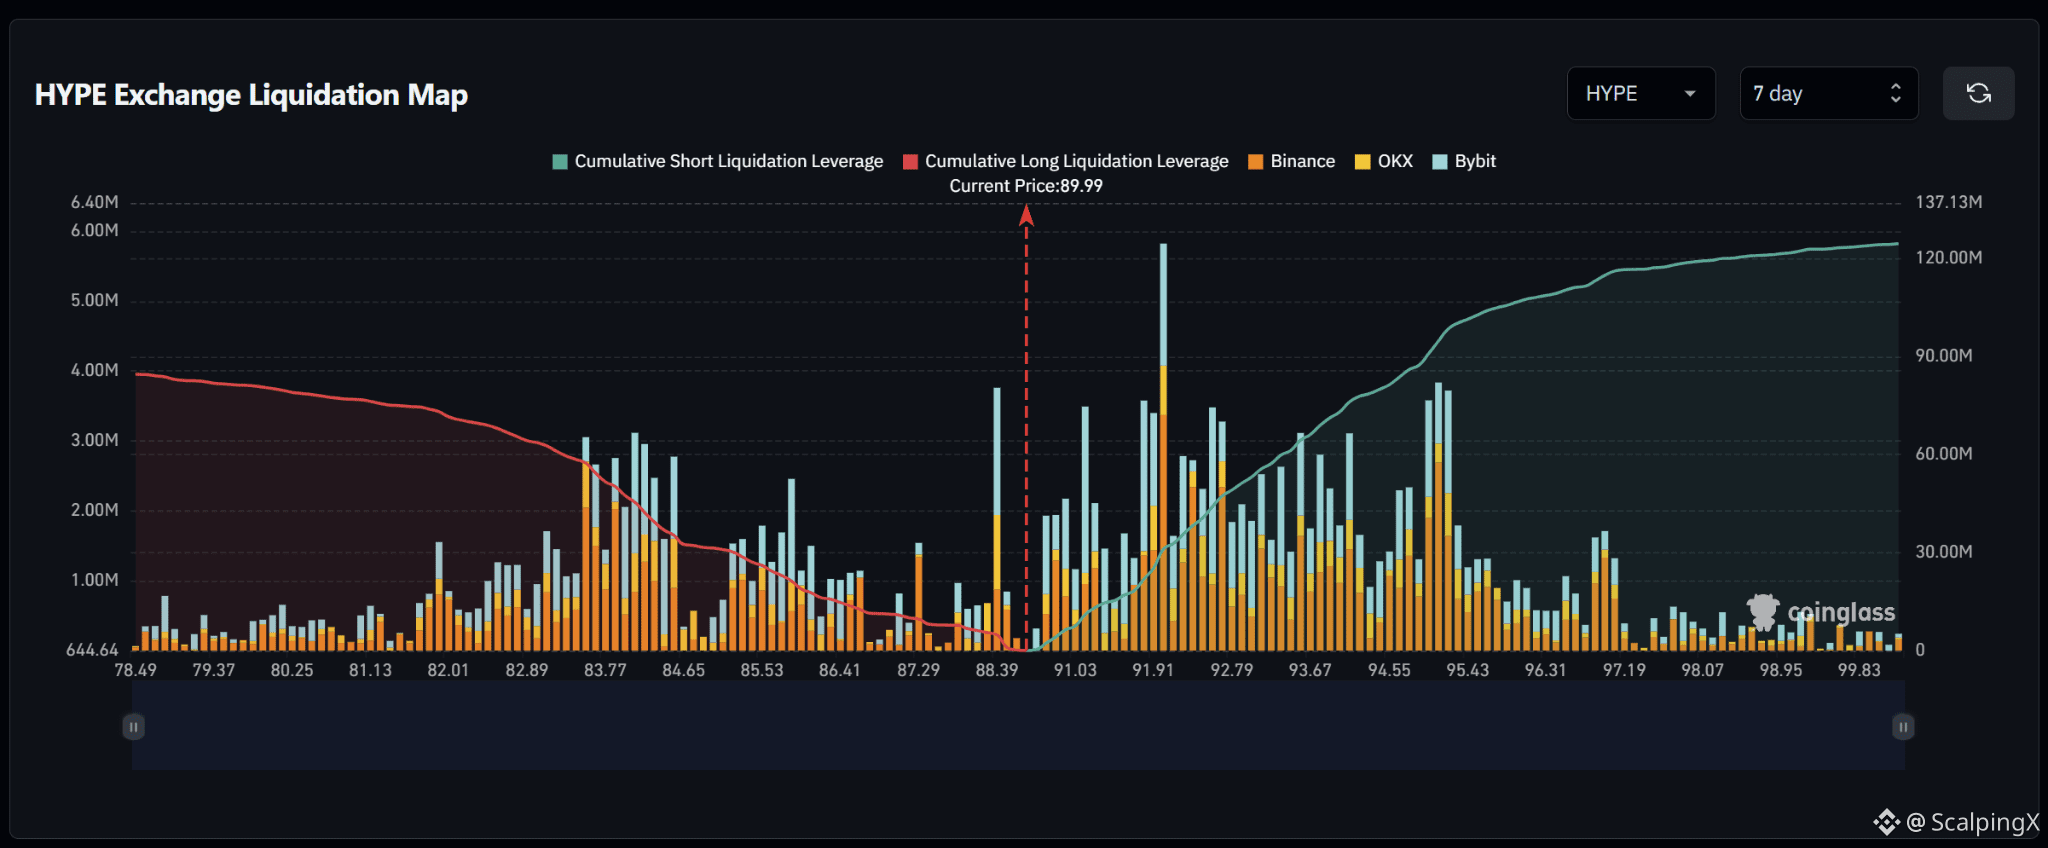
$HYPE – Liquidation Map (7 Days) – Current Price 89.99
🔎 The 7-day liquidation map shows roughly 120–125 million USD in short liquidations above the current price, significantly exceeding approximately 85–90 million USD in long liquidations below. The liquidity structure therefore clearly favors the upside, with around 1.4 times more cumulative liquidity above the market.
📉 Below the market, long-liquidation liquidity is concentrated heavily across 83.3–86.5. Major clusters sit around 83.5–84.5 with several bars near 2.5–3.1 million USD, while 85.5–86.5 also contains multiple pockets around 1.5–2.5 million USD. Closer to the current price, 88.3–88.5 holds a larger bar near 3.7 million USD.
📈 Above the market, short-liquidation liquidity builds sharply from around 91.0 and is concentrated across 91.5–95.5. The strongest cluster sits around 91.8–92.0 with a bar near 5.8 million USD; 92.5–94.0 contains several bars around 2–3.5 million USD, while 94.8–95.3 forms another strong cluster around 3.5–3.8 million USD.
🧭 The broader setup favors the upside because short-liquidation exposure above clearly dominates. Breaking above 91.0–92.0 would expose 92.8–94.0, followed by 94.8–95.5. Losing 88.3–88.0 would instead increase the probability of a sweep toward 86.5–85.5 and then 84.5–83.5.
#LiquidationMap
$HYPE – Liquidation Map (7 Days) – Current Price 89.99
🔎 The 7-day liquidation map shows roughly 120–125 million USD in short liquidations above the current price, significantly exceeding approximately 85–90 million USD in long liquidations below. The liquidity structure therefore clearly favors the upside, with around 1.4 times more cumulative liquidity above the market.
📉 Below the market, long-liquidation liquidity is concentrated heavily across 83.3–86.5. Major clusters sit around 83.5–84.5 with several bars near 2.5–3.1 million USD, while 85.5–86.5 also contains multiple pockets around 1.5–2.5 million USD. Closer to the current price, 88.3–88.5 holds a larger bar near 3.7 million USD.
📈 Above the market, short-liquidation liquidity builds sharply from around 91.0 and is concentrated across 91.5–95.5. The strongest cluster sits around 91.8–92.0 with a bar near 5.8 million USD; 92.5–94.0 contains several bars around 2–3.5 million USD, while 94.8–95.3 forms another strong cluster around 3.5–3.8 million USD.
🧭 The broader setup favors the upside because short-liquidation exposure above clearly dominates. Breaking above 91.0–92.0 would expose 92.8–94.0, followed by 94.8–95.5. Losing 88.3–88.0 would instead increase the probability of a sweep toward 86.5–85.5 and then 84.5–83.5.
#LiquidationMap
🔎 The 7-day liquidation map shows roughly 120–125 million USD in short liquidations above the current price, significantly exceeding approximately 85–90 million USD in long liquidations below. The liquidity structure therefore clearly favors the upside, with around 1.4 times more cumulative liquidity above the market.
📉 Below the market, long-liquidation liquidity is concentrated heavily across 83.3–86.5. Major clusters sit around 83.5–84.5 with several bars near 2.5–3.1 million USD, while 85.5–86.5 also contains multiple pockets around 1.5–2.5 million USD. Closer to the current price, 88.3–88.5 holds a larger bar near 3.7 million USD.
📈 Above the market, short-liquidation liquidity builds sharply from around 91.0 and is concentrated across 91.5–95.5. The strongest cluster sits around 91.8–92.0 with a bar near 5.8 million USD; 92.5–94.0 contains several bars around 2–3.5 million USD, while 94.8–95.3 forms another strong cluster around 3.5–3.8 million USD.
🧭 The broader setup favors the upside because short-liquidation exposure above clearly dominates. Breaking above 91.0–92.0 would expose 92.8–94.0, followed by 94.8–95.5. Losing 88.3–88.0 would instead increase the probability of a sweep toward 86.5–85.5 and then 84.5–83.5.
#LiquidationMap
45
·
--
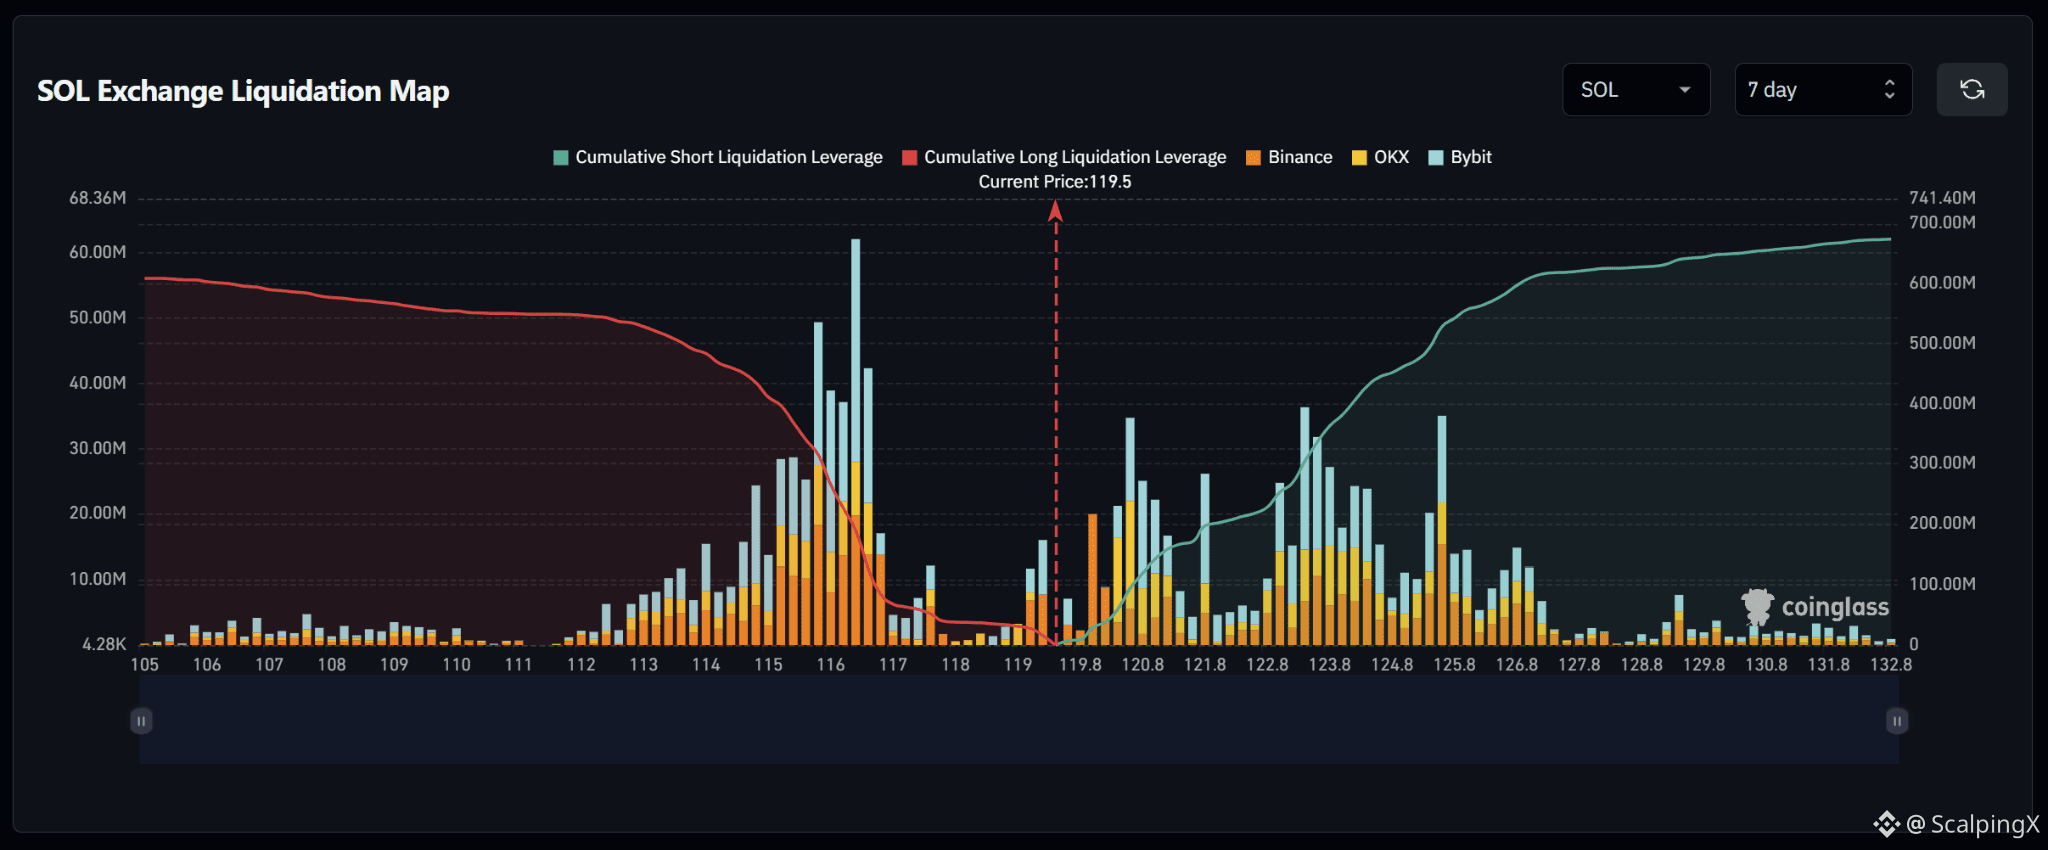
$SOL – Liquidation Map (7 Days) – Current Price 119.5
🔎 The 7-day liquidation map is nearly balanced, with both long liquidations below and short liquidations above totaling roughly 600–620 million USD. The overall imbalance is limited, making nearby liquidity clusters more important for directional attraction.
📉 Below the market, long-liquidation liquidity is concentrated heavily across 115–117. The strongest cluster sits around 116.0–116.5 with a bar above 60 million USD, while 115.0–115.8 also contains several bars around 25–50 million USD. Losing 119.0 would shift attention toward 117.5–116.8 and then 116.0–115.0.
📈 Above the market, short-liquidation liquidity builds noticeably from 120, with concentrations around 120.4–121.8, 122.8–124.3 and 125.0–126.0. The largest bars around 120.5, 123.4 and 125.5 reach roughly 35 million USD, creating several consecutive liquidity layers overhead.
🧭 The broader setup is currently close to balanced. Breaking above 120.0–120.8 would expose 121.8, followed by 123.0–124.0 and 125.0–126.0. Losing 119.0 would instead increase the probability of a sweep toward 117.5–116.8 and then 116.0–115.0.
#LiquidationMap
$SOL – Liquidation Map (7 Days) – Current Price 119.5
🔎 The 7-day liquidation map is nearly balanced, with both long liquidations below and short liquidations above totaling roughly 600–620 million USD. The overall imbalance is limited, making nearby liquidity clusters more important for directional attraction.
📉 Below the market, long-liquidation liquidity is concentrated heavily across 115–117. The strongest cluster sits around 116.0–116.5 with a bar above 60 million USD, while 115.0–115.8 also contains several bars around 25–50 million USD. Losing 119.0 would shift attention toward 117.5–116.8 and then 116.0–115.0.
📈 Above the market, short-liquidation liquidity builds noticeably from 120, with concentrations around 120.4–121.8, 122.8–124.3 and 125.0–126.0. The largest bars around 120.5, 123.4 and 125.5 reach roughly 35 million USD, creating several consecutive liquidity layers overhead.
🧭 The broader setup is currently close to balanced. Breaking above 120.0–120.8 would expose 121.8, followed by 123.0–124.0 and 125.0–126.0. Losing 119.0 would instead increase the probability of a sweep toward 117.5–116.8 and then 116.0–115.0.
#LiquidationMap
🔎 The 7-day liquidation map is nearly balanced, with both long liquidations below and short liquidations above totaling roughly 600–620 million USD. The overall imbalance is limited, making nearby liquidity clusters more important for directional attraction.
📉 Below the market, long-liquidation liquidity is concentrated heavily across 115–117. The strongest cluster sits around 116.0–116.5 with a bar above 60 million USD, while 115.0–115.8 also contains several bars around 25–50 million USD. Losing 119.0 would shift attention toward 117.5–116.8 and then 116.0–115.0.
📈 Above the market, short-liquidation liquidity builds noticeably from 120, with concentrations around 120.4–121.8, 122.8–124.3 and 125.0–126.0. The largest bars around 120.5, 123.4 and 125.5 reach roughly 35 million USD, creating several consecutive liquidity layers overhead.
🧭 The broader setup is currently close to balanced. Breaking above 120.0–120.8 would expose 121.8, followed by 123.0–124.0 and 125.0–126.0. Losing 119.0 would instead increase the probability of a sweep toward 117.5–116.8 and then 116.0–115.0.
#LiquidationMap
87
·
--
Bullish
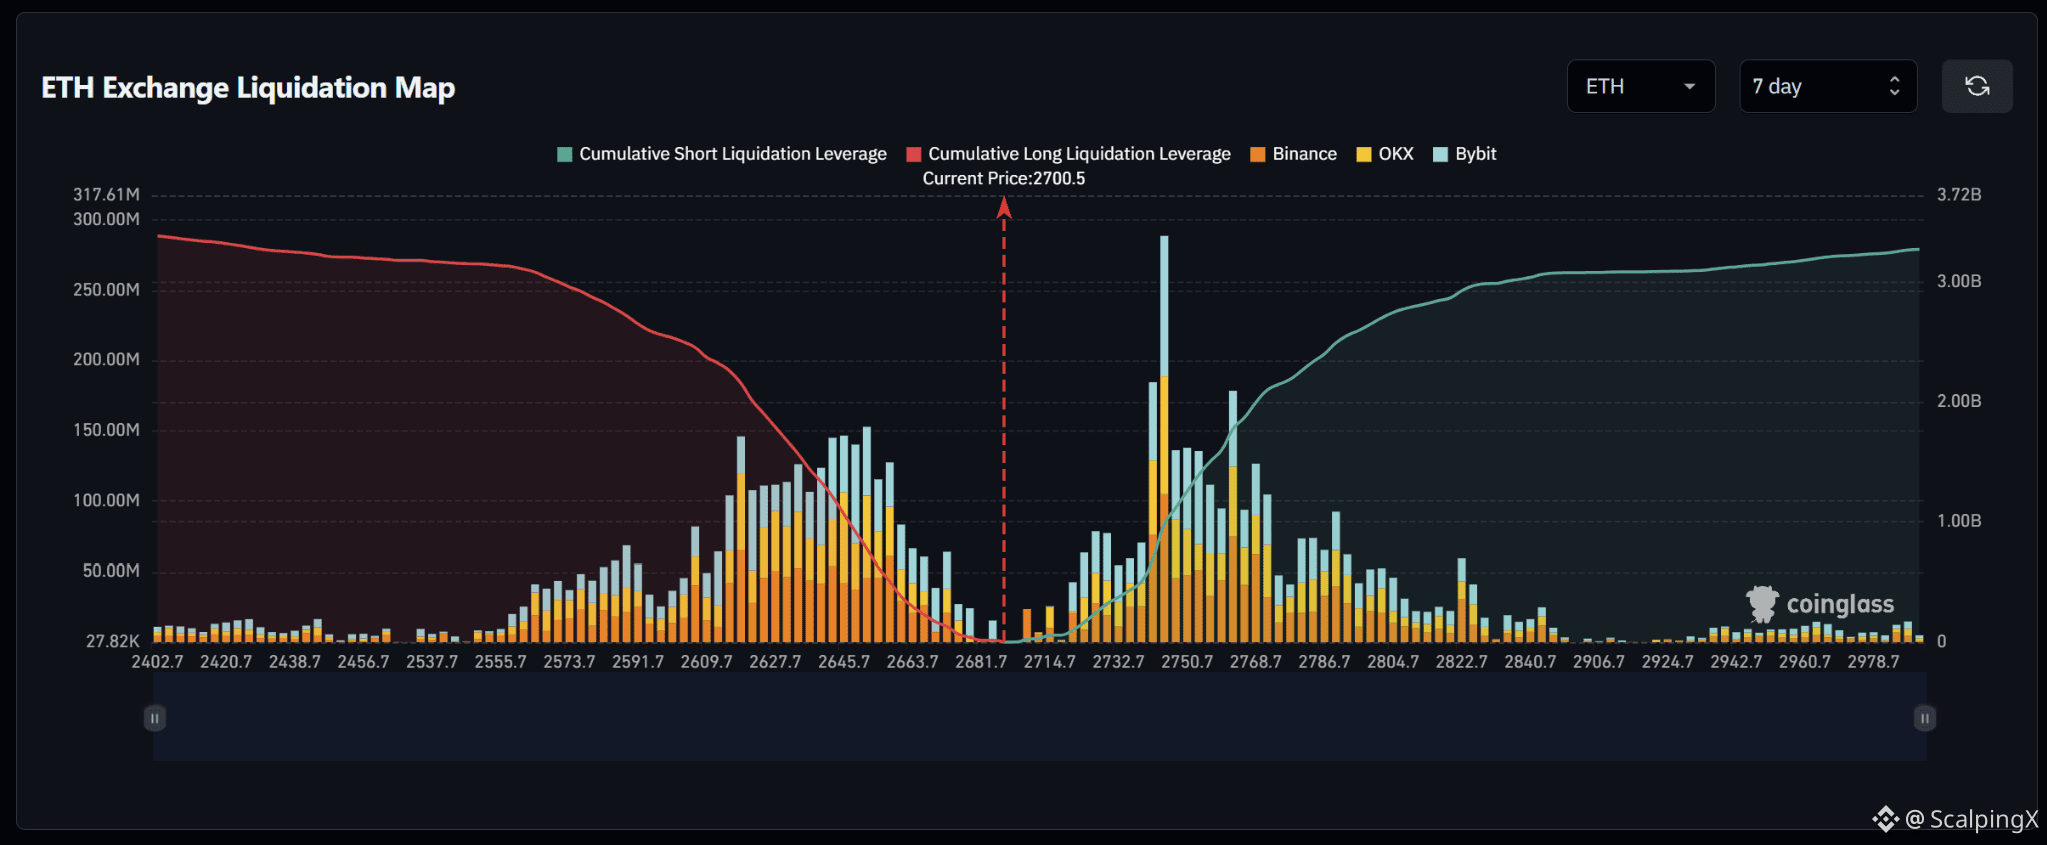
$ETH – Liquidation Map (7 Days) – Current Price 2,700.5
🔎 The 7-day liquidation map is relatively balanced, with roughly 3.3 billion USD in long liquidations below the current price and around 3.2–3.3 billion USD in short liquidations above. Long-liquidation exposure is slightly larger, giving the structure a mild downside tilt rather than a strong imbalance.
📉 Below the market, long-liquidation liquidity is concentrated heavily across 2,610–2,660. The strongest cluster sits around 2,625–2,650 with several bars near 110–150 million USD, while 2,610–2,630 also carries dense liquidity. Losing 2,681 would shift attention toward 2,663–2,645 and then 2,628–2,610.
📈 Above the market, short-liquidation liquidity is heavily concentrated across 2,730–2,770. The strongest cluster sits around 2,745–2,750 with a bar near 290 million USD, while 2,755–2,770 also contains several bars around 100–180 million USD. Further out, 2,780–2,825 continues to hold another notable liquidity band.
🧭 The broader setup is close to balanced but carries a mild downside tilt. Losing 2,681 would increase the probability of a sweep toward 2,663–2,645, followed by 2,628–2,610. Breaking above 2,714–2,733 would instead expose 2,745–2,770 and then 2,786–2,823.
#LiquidationMap
$ETH – Liquidation Map (7 Days) – Current Price 2,700.5
🔎 The 7-day liquidation map is relatively balanced, with roughly 3.3 billion USD in long liquidations below the current price and around 3.2–3.3 billion USD in short liquidations above. Long-liquidation exposure is slightly larger, giving the structure a mild downside tilt rather than a strong imbalance.
📉 Below the market, long-liquidation liquidity is concentrated heavily across 2,610–2,660. The strongest cluster sits around 2,625–2,650 with several bars near 110–150 million USD, while 2,610–2,630 also carries dense liquidity. Losing 2,681 would shift attention toward 2,663–2,645 and then 2,628–2,610.
📈 Above the market, short-liquidation liquidity is heavily concentrated across 2,730–2,770. The strongest cluster sits around 2,745–2,750 with a bar near 290 million USD, while 2,755–2,770 also contains several bars around 100–180 million USD. Further out, 2,780–2,825 continues to hold another notable liquidity band.
🧭 The broader setup is close to balanced but carries a mild downside tilt. Losing 2,681 would increase the probability of a sweep toward 2,663–2,645, followed by 2,628–2,610. Breaking above 2,714–2,733 would instead expose 2,745–2,770 and then 2,786–2,823.
#LiquidationMap
🔎 The 7-day liquidation map is relatively balanced, with roughly 3.3 billion USD in long liquidations below the current price and around 3.2–3.3 billion USD in short liquidations above. Long-liquidation exposure is slightly larger, giving the structure a mild downside tilt rather than a strong imbalance.
📉 Below the market, long-liquidation liquidity is concentrated heavily across 2,610–2,660. The strongest cluster sits around 2,625–2,650 with several bars near 110–150 million USD, while 2,610–2,630 also carries dense liquidity. Losing 2,681 would shift attention toward 2,663–2,645 and then 2,628–2,610.
📈 Above the market, short-liquidation liquidity is heavily concentrated across 2,730–2,770. The strongest cluster sits around 2,745–2,750 with a bar near 290 million USD, while 2,755–2,770 also contains several bars around 100–180 million USD. Further out, 2,780–2,825 continues to hold another notable liquidity band.
🧭 The broader setup is close to balanced but carries a mild downside tilt. Losing 2,681 would increase the probability of a sweep toward 2,663–2,645, followed by 2,628–2,610. Breaking above 2,714–2,733 would instead expose 2,745–2,770 and then 2,786–2,823.
#LiquidationMap
75
·
--
Bullish
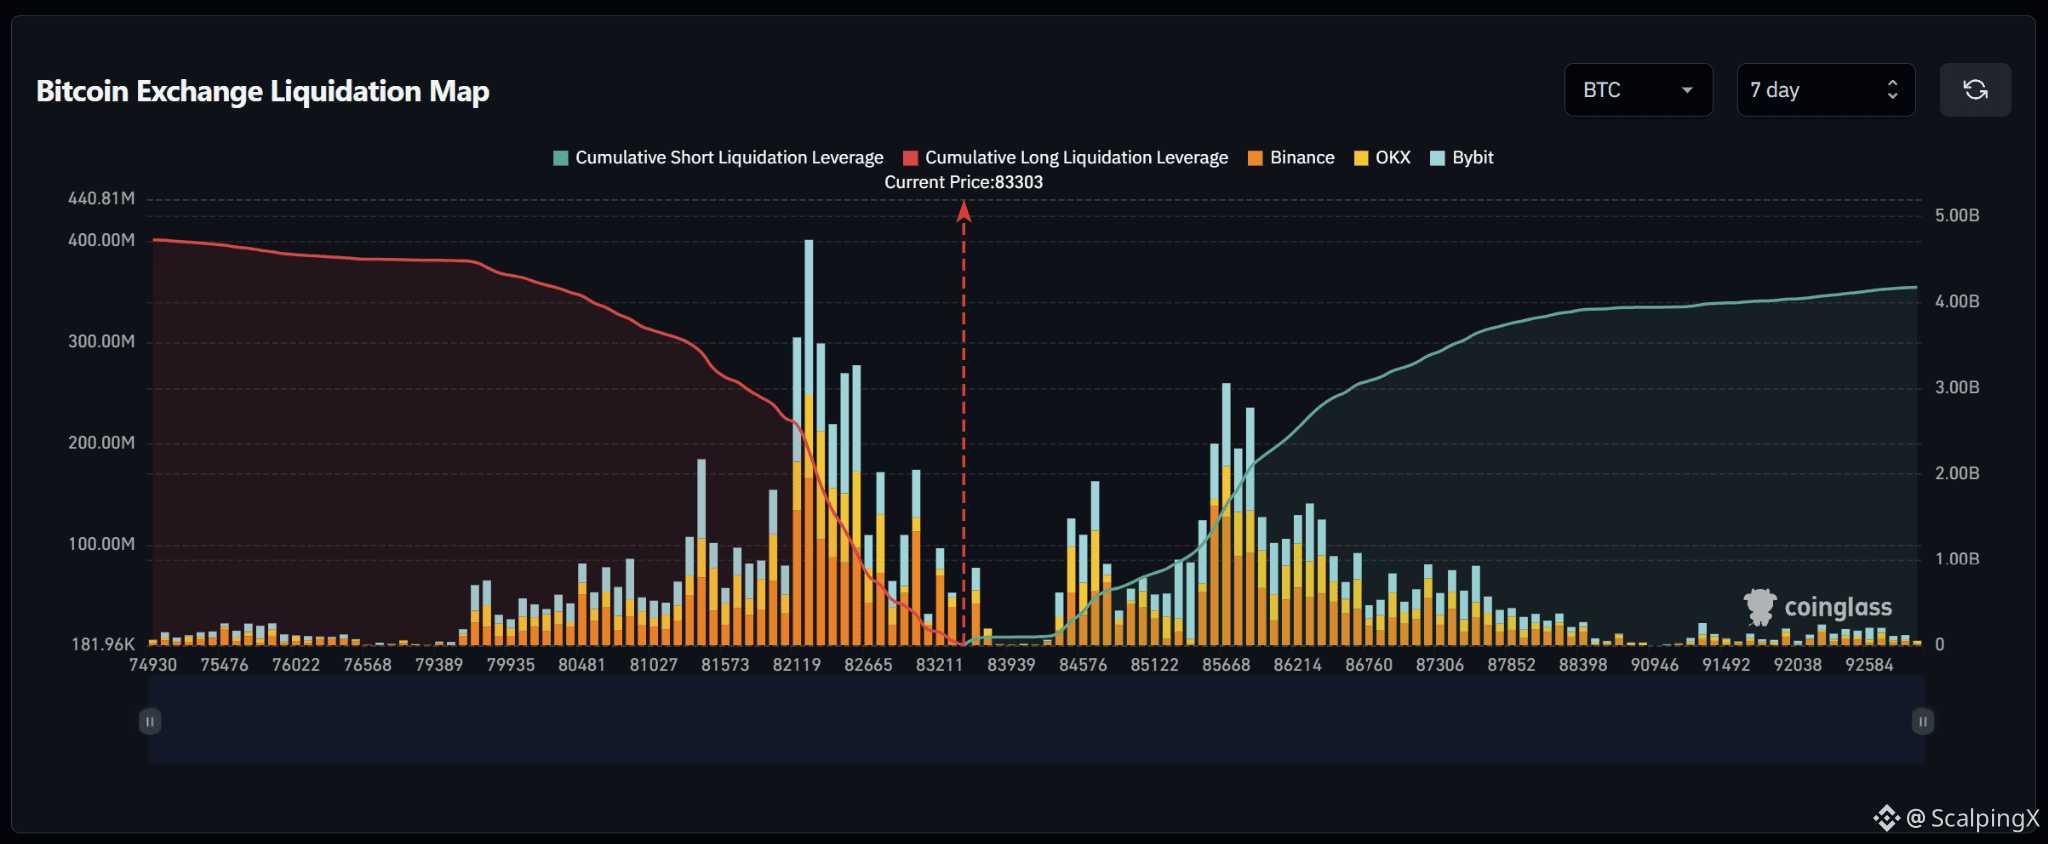
$BTC – Liquidation Map (7 Days) – Current Price 83,303
🔎 The 7-day liquidation map shows roughly 4.6–4.7 billion USD in long liquidations below the current price, slightly exceeding approximately 4.1 billion USD in short liquidations above. The liquidity structure is therefore relatively balanced with a mild downside tilt.
📉 Below the market, long-liquidation liquidity is concentrated most heavily across 81,500–82,700. The strongest cluster sits around 82,100–82,600 with several bars near 200–400 million USD, with the densest concentration around 82,200–82,400. Losing 83,200 would shift attention toward 82,700–82,100 and then 81,600–81,000.
📈 Above the market, short-liquidation liquidity begins building from around 84,500 and becomes concentrated across 85,500–86,300. The strongest cluster sits around 85,600–85,900 with bars near 200–260 million USD, while 86,000–86,700 continues to hold several pockets around 100–150 million USD.
🧭 The broader setup is close to balanced but carries a mild downside tilt because long-liquidation exposure below is slightly larger. Losing 83,200 would increase the probability of a sweep toward 82,700–82,100, followed by 81,600–81,000. Breaking above 84,500–85,100 would instead expose 85,600–86,300 and then 86,700–87,300.
#LiquidationMap
$BTC – Liquidation Map (7 Days) – Current Price 83,303
🔎 The 7-day liquidation map shows roughly 4.6–4.7 billion USD in long liquidations below the current price, slightly exceeding approximately 4.1 billion USD in short liquidations above. The liquidity structure is therefore relatively balanced with a mild downside tilt.
📉 Below the market, long-liquidation liquidity is concentrated most heavily across 81,500–82,700. The strongest cluster sits around 82,100–82,600 with several bars near 200–400 million USD, with the densest concentration around 82,200–82,400. Losing 83,200 would shift attention toward 82,700–82,100 and then 81,600–81,000.
📈 Above the market, short-liquidation liquidity begins building from around 84,500 and becomes concentrated across 85,500–86,300. The strongest cluster sits around 85,600–85,900 with bars near 200–260 million USD, while 86,000–86,700 continues to hold several pockets around 100–150 million USD.
🧭 The broader setup is close to balanced but carries a mild downside tilt because long-liquidation exposure below is slightly larger. Losing 83,200 would increase the probability of a sweep toward 82,700–82,100, followed by 81,600–81,000. Breaking above 84,500–85,100 would instead expose 85,600–86,300 and then 86,700–87,300.
#LiquidationMap
🔎 The 7-day liquidation map shows roughly 4.6–4.7 billion USD in long liquidations below the current price, slightly exceeding approximately 4.1 billion USD in short liquidations above. The liquidity structure is therefore relatively balanced with a mild downside tilt.
📉 Below the market, long-liquidation liquidity is concentrated most heavily across 81,500–82,700. The strongest cluster sits around 82,100–82,600 with several bars near 200–400 million USD, with the densest concentration around 82,200–82,400. Losing 83,200 would shift attention toward 82,700–82,100 and then 81,600–81,000.
📈 Above the market, short-liquidation liquidity begins building from around 84,500 and becomes concentrated across 85,500–86,300. The strongest cluster sits around 85,600–85,900 with bars near 200–260 million USD, while 86,000–86,700 continues to hold several pockets around 100–150 million USD.
🧭 The broader setup is close to balanced but carries a mild downside tilt because long-liquidation exposure below is slightly larger. Losing 83,200 would increase the probability of a sweep toward 82,700–82,100, followed by 81,600–81,000. Breaking above 84,500–85,100 would instead expose 85,600–86,300 and then 86,700–87,300.
#LiquidationMap
1
102
·
--
Bullish
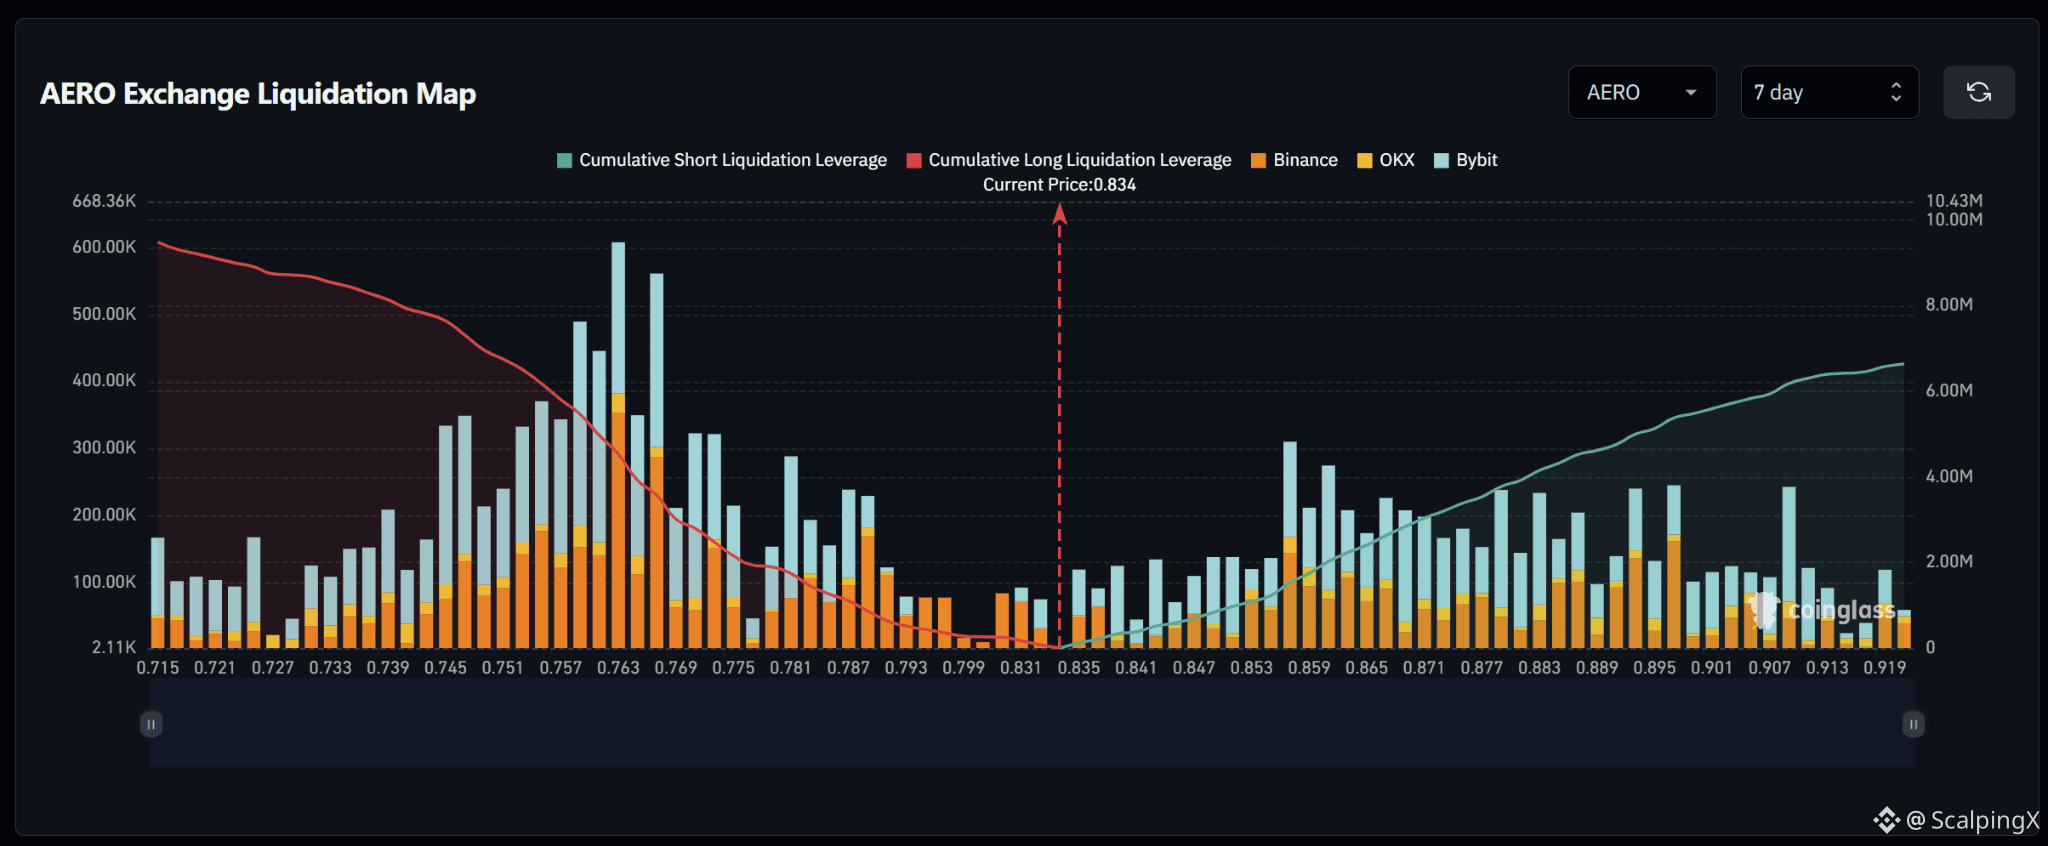
$AERO – Liquidation Map (7 Days) – Current Price 0.834
🔎 The 7-day liquidation map shows roughly 9.5–10 million USD in long liquidations below the current price, exceeding approximately 6–6.5 million USD in short liquidations above. The liquidity structure therefore favors the downside, with around 1.5 times more cumulative liquidity below the market.
📉 Below the market, long-liquidation liquidity is concentrated heavily across 0.745–0.775. The strongest cluster sits around 0.757–0.769 with several bars near 0.35–0.60 million USD, with the densest concentration around 0.762–0.768. Losing 0.831 would shift attention toward 0.799–0.787 and then 0.775–0.757.
📈 Above the market, short-liquidation liquidity is distributed heavily across 0.853–0.899. Notable clusters appear around 0.857–0.871 with several bars near 0.20–0.31 million USD, while 0.883–0.899 also contains multiple pockets around 0.20–0.25 million USD.
🧭 The broader setup favors the downside because long-liquidation exposure below is larger. Losing 0.831 would increase the probability of a sweep toward 0.799–0.787, followed by 0.775–0.757. Breaking above 0.853–0.859 would instead expose 0.865–0.871 and then 0.883–0.899.
#LiquidationMap
$AERO – Liquidation Map (7 Days) – Current Price 0.834
🔎 The 7-day liquidation map shows roughly 9.5–10 million USD in long liquidations below the current price, exceeding approximately 6–6.5 million USD in short liquidations above. The liquidity structure therefore favors the downside, with around 1.5 times more cumulative liquidity below the market.
📉 Below the market, long-liquidation liquidity is concentrated heavily across 0.745–0.775. The strongest cluster sits around 0.757–0.769 with several bars near 0.35–0.60 million USD, with the densest concentration around 0.762–0.768. Losing 0.831 would shift attention toward 0.799–0.787 and then 0.775–0.757.
📈 Above the market, short-liquidation liquidity is distributed heavily across 0.853–0.899. Notable clusters appear around 0.857–0.871 with several bars near 0.20–0.31 million USD, while 0.883–0.899 also contains multiple pockets around 0.20–0.25 million USD.
🧭 The broader setup favors the downside because long-liquidation exposure below is larger. Losing 0.831 would increase the probability of a sweep toward 0.799–0.787, followed by 0.775–0.757. Breaking above 0.853–0.859 would instead expose 0.865–0.871 and then 0.883–0.899.
#LiquidationMap
🔎 The 7-day liquidation map shows roughly 9.5–10 million USD in long liquidations below the current price, exceeding approximately 6–6.5 million USD in short liquidations above. The liquidity structure therefore favors the downside, with around 1.5 times more cumulative liquidity below the market.
📉 Below the market, long-liquidation liquidity is concentrated heavily across 0.745–0.775. The strongest cluster sits around 0.757–0.769 with several bars near 0.35–0.60 million USD, with the densest concentration around 0.762–0.768. Losing 0.831 would shift attention toward 0.799–0.787 and then 0.775–0.757.
📈 Above the market, short-liquidation liquidity is distributed heavily across 0.853–0.899. Notable clusters appear around 0.857–0.871 with several bars near 0.20–0.31 million USD, while 0.883–0.899 also contains multiple pockets around 0.20–0.25 million USD.
🧭 The broader setup favors the downside because long-liquidation exposure below is larger. Losing 0.831 would increase the probability of a sweep toward 0.799–0.787, followed by 0.775–0.757. Breaking above 0.853–0.859 would instead expose 0.865–0.871 and then 0.883–0.899.
#LiquidationMap
147
·
--
Bullish
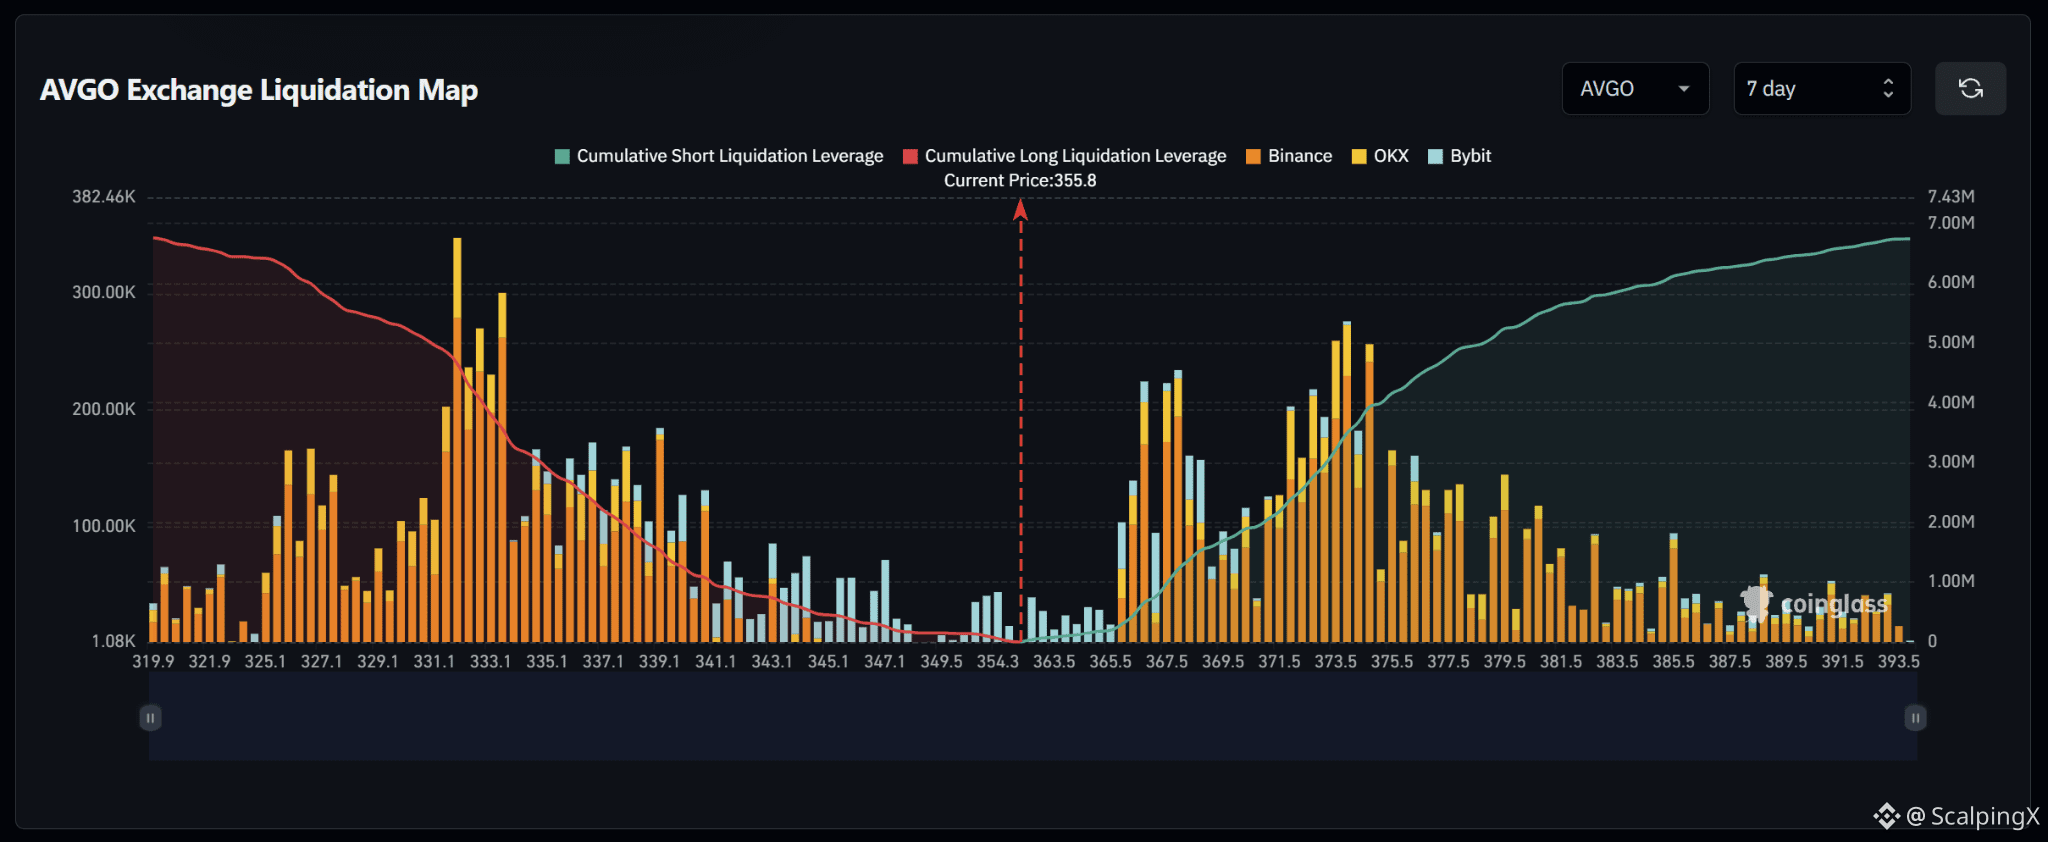
AVGO – Liquidation Map (7 Days) – Current Price 355.8
🔎 The 7-day liquidation map is relatively balanced, with roughly 6.6–6.8 million USD in long liquidations below the current price and around 6.7–6.9 million USD in short liquidations above. Short-liquidation exposure is slightly larger, giving the structure a mild upside tilt rather than a strong imbalance.
📉 Below the market, long-liquidation liquidity is concentrated heavily across 331–339. The strongest cluster sits around 332–334 with several bars near 0.23–0.35 million USD, while 326–328 and 335–339 also contain multiple pockets around 0.14–0.18 million USD. Losing 354 would shift attention toward 349–345 and then 339–333.
📈 Above the market, short-liquidation liquidity becomes concentrated from 366–375. The nearest notable cluster sits around 366–368 with bars near 0.21–0.23 million USD, while the stronger 372–375 area contains several bars around 0.20–0.27 million USD. Further out, 379–386 continues to hold liquidity, though it becomes more dispersed.
🧭 The broader setup is close to balanced but carries a mild upside tilt. Breaking above 366–368 would expose 372–375, followed by 379–386. Losing 354 would instead increase the probability of a sweep toward 349–345 and then 339–333.
#LiquidationMap
AVGO – Liquidation Map (7 Days) – Current Price 355.8
🔎 The 7-day liquidation map is relatively balanced, with roughly 6.6–6.8 million USD in long liquidations below the current price and around 6.7–6.9 million USD in short liquidations above. Short-liquidation exposure is slightly larger, giving the structure a mild upside tilt rather than a strong imbalance.
📉 Below the market, long-liquidation liquidity is concentrated heavily across 331–339. The strongest cluster sits around 332–334 with several bars near 0.23–0.35 million USD, while 326–328 and 335–339 also contain multiple pockets around 0.14–0.18 million USD. Losing 354 would shift attention toward 349–345 and then 339–333.
📈 Above the market, short-liquidation liquidity becomes concentrated from 366–375. The nearest notable cluster sits around 366–368 with bars near 0.21–0.23 million USD, while the stronger 372–375 area contains several bars around 0.20–0.27 million USD. Further out, 379–386 continues to hold liquidity, though it becomes more dispersed.
🧭 The broader setup is close to balanced but carries a mild upside tilt. Breaking above 366–368 would expose 372–375, followed by 379–386. Losing 354 would instead increase the probability of a sweep toward 349–345 and then 339–333.
#LiquidationMap
🔎 The 7-day liquidation map is relatively balanced, with roughly 6.6–6.8 million USD in long liquidations below the current price and around 6.7–6.9 million USD in short liquidations above. Short-liquidation exposure is slightly larger, giving the structure a mild upside tilt rather than a strong imbalance.
📉 Below the market, long-liquidation liquidity is concentrated heavily across 331–339. The strongest cluster sits around 332–334 with several bars near 0.23–0.35 million USD, while 326–328 and 335–339 also contain multiple pockets around 0.14–0.18 million USD. Losing 354 would shift attention toward 349–345 and then 339–333.
📈 Above the market, short-liquidation liquidity becomes concentrated from 366–375. The nearest notable cluster sits around 366–368 with bars near 0.21–0.23 million USD, while the stronger 372–375 area contains several bars around 0.20–0.27 million USD. Further out, 379–386 continues to hold liquidity, though it becomes more dispersed.
🧭 The broader setup is close to balanced but carries a mild upside tilt. Breaking above 366–368 would expose 372–375, followed by 379–386. Losing 354 would instead increase the probability of a sweep toward 349–345 and then 339–333.
#LiquidationMap
1
95
·
--
Bullish
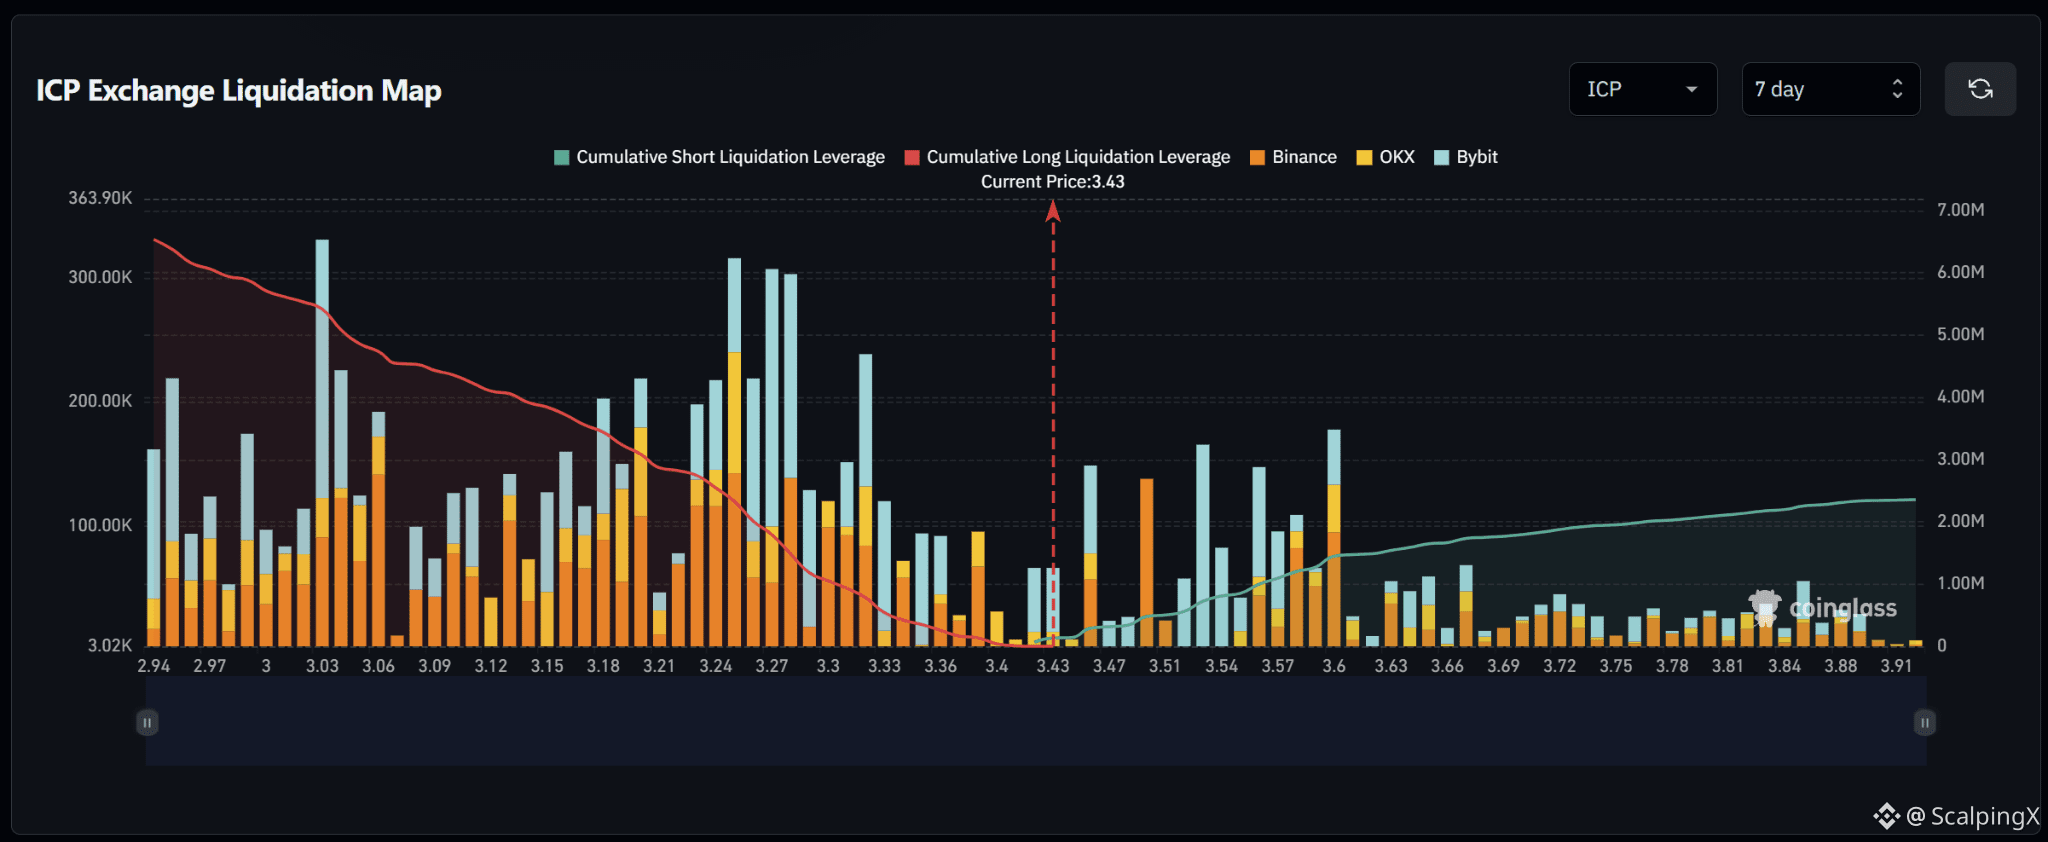
$ICP – Liquidation Map (7 Days) – Current Price 3.43
🔎 The 7-day liquidation map shows roughly 6.5 million USD in long liquidations below the current price, clearly exceeding approximately 2.2 million USD in short liquidations above. The liquidity structure therefore strongly favors the downside, with nearly three times more cumulative liquidity below the market.
📉 Below the market, long-liquidation liquidity is concentrated heavily across 3.18–3.33. The strongest cluster sits around 3.24–3.28 with several bars near 0.30–0.32 million USD; 3.03 also contains a bar above 0.3 million USD, while 3.31–3.33 holds another cluster around 0.15–0.24 million USD. Losing 3.40 would shift attention toward 3.36–3.30 and then 3.28–3.24.
📈 Above the market, short-liquidation liquidity is significantly thinner. Notable clusters appear around 3.46–3.47, 3.53–3.54 and 3.58–3.60, with bars around 0.14–0.18 million USD. Beyond 3.63, liquidity becomes progressively thinner and more dispersed.
🧭 The broader setup favors the downside because long-liquidation exposure below dominates. Losing 3.40 would increase the probability of a sweep toward 3.36–3.30, followed by 3.28–3.24. Breaking above 3.47–3.54 would instead expose 3.58–3.60 before price enters a thinner liquidity zone.
#LiquidationMap
$ICP – Liquidation Map (7 Days) – Current Price 3.43
🔎 The 7-day liquidation map shows roughly 6.5 million USD in long liquidations below the current price, clearly exceeding approximately 2.2 million USD in short liquidations above. The liquidity structure therefore strongly favors the downside, with nearly three times more cumulative liquidity below the market.
📉 Below the market, long-liquidation liquidity is concentrated heavily across 3.18–3.33. The strongest cluster sits around 3.24–3.28 with several bars near 0.30–0.32 million USD; 3.03 also contains a bar above 0.3 million USD, while 3.31–3.33 holds another cluster around 0.15–0.24 million USD. Losing 3.40 would shift attention toward 3.36–3.30 and then 3.28–3.24.
📈 Above the market, short-liquidation liquidity is significantly thinner. Notable clusters appear around 3.46–3.47, 3.53–3.54 and 3.58–3.60, with bars around 0.14–0.18 million USD. Beyond 3.63, liquidity becomes progressively thinner and more dispersed.
🧭 The broader setup favors the downside because long-liquidation exposure below dominates. Losing 3.40 would increase the probability of a sweep toward 3.36–3.30, followed by 3.28–3.24. Breaking above 3.47–3.54 would instead expose 3.58–3.60 before price enters a thinner liquidity zone.
#LiquidationMap
🔎 The 7-day liquidation map shows roughly 6.5 million USD in long liquidations below the current price, clearly exceeding approximately 2.2 million USD in short liquidations above. The liquidity structure therefore strongly favors the downside, with nearly three times more cumulative liquidity below the market.
📉 Below the market, long-liquidation liquidity is concentrated heavily across 3.18–3.33. The strongest cluster sits around 3.24–3.28 with several bars near 0.30–0.32 million USD; 3.03 also contains a bar above 0.3 million USD, while 3.31–3.33 holds another cluster around 0.15–0.24 million USD. Losing 3.40 would shift attention toward 3.36–3.30 and then 3.28–3.24.
📈 Above the market, short-liquidation liquidity is significantly thinner. Notable clusters appear around 3.46–3.47, 3.53–3.54 and 3.58–3.60, with bars around 0.14–0.18 million USD. Beyond 3.63, liquidity becomes progressively thinner and more dispersed.
🧭 The broader setup favors the downside because long-liquidation exposure below dominates. Losing 3.40 would increase the probability of a sweep toward 3.36–3.30, followed by 3.28–3.24. Breaking above 3.47–3.54 would instead expose 3.58–3.60 before price enters a thinner liquidity zone.
#LiquidationMap
1
14
·
--
Bullish
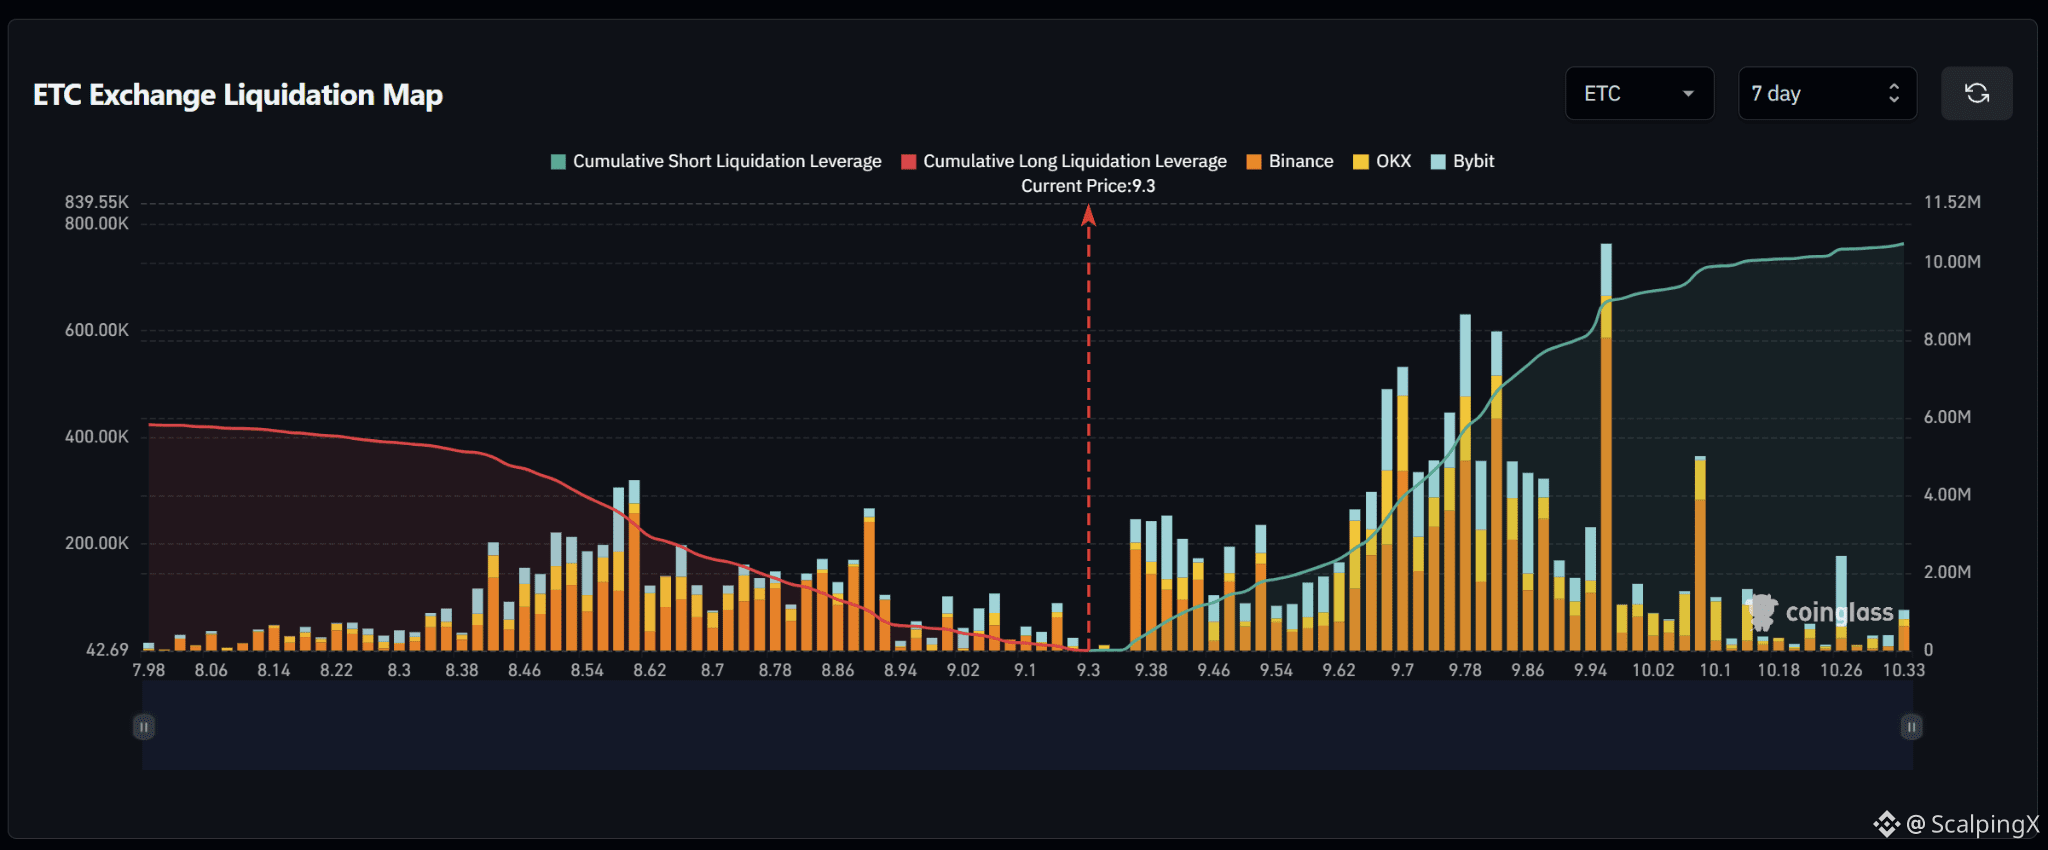
$ETC – Liquidation Map (7 Days) – Current Price 9.30
🔎 The 7-day liquidation map shows roughly 10–11 million USD in short liquidations above the current price, significantly exceeding approximately 5.8–6 million USD in long liquidations below. The liquidity structure therefore clearly favors the upside, with around 1.8 times more cumulative liquidity above the market.
📉 Below the market, long-liquidation liquidity is concentrated mainly across 8.42–8.66. Notable clusters sit around 8.46–8.62 with several bars near 0.15–0.32 million USD, while 8.78–8.88 also contains multiple pockets around 0.15–0.25 million USD. Losing 9.10 would shift attention toward 9.02–8.94 and then 8.86–8.62.
📈 Above the market, short-liquidation liquidity is heavily concentrated across 9.62–10.00. Major clusters appear around 9.68–9.72 with a bar above 0.5 million USD, 9.78–9.84 with several bars around 0.35–0.63 million USD, and especially 9.94–9.96 with a bar near 0.76 million USD.
🧭 The broader setup favors the upside because short-liquidation exposure above dominates. Breaking above 9.54–9.62 would expose 9.68–9.84, followed by the major 9.94–9.96 cluster. Losing 9.10 would instead increase the probability of a sweep toward 9.02–8.94 and then 8.86–8.62.
#LiquidationMap
$ETC – Liquidation Map (7 Days) – Current Price 9.30
🔎 The 7-day liquidation map shows roughly 10–11 million USD in short liquidations above the current price, significantly exceeding approximately 5.8–6 million USD in long liquidations below. The liquidity structure therefore clearly favors the upside, with around 1.8 times more cumulative liquidity above the market.
📉 Below the market, long-liquidation liquidity is concentrated mainly across 8.42–8.66. Notable clusters sit around 8.46–8.62 with several bars near 0.15–0.32 million USD, while 8.78–8.88 also contains multiple pockets around 0.15–0.25 million USD. Losing 9.10 would shift attention toward 9.02–8.94 and then 8.86–8.62.
📈 Above the market, short-liquidation liquidity is heavily concentrated across 9.62–10.00. Major clusters appear around 9.68–9.72 with a bar above 0.5 million USD, 9.78–9.84 with several bars around 0.35–0.63 million USD, and especially 9.94–9.96 with a bar near 0.76 million USD.
🧭 The broader setup favors the upside because short-liquidation exposure above dominates. Breaking above 9.54–9.62 would expose 9.68–9.84, followed by the major 9.94–9.96 cluster. Losing 9.10 would instead increase the probability of a sweep toward 9.02–8.94 and then 8.86–8.62.
#LiquidationMap
🔎 The 7-day liquidation map shows roughly 10–11 million USD in short liquidations above the current price, significantly exceeding approximately 5.8–6 million USD in long liquidations below. The liquidity structure therefore clearly favors the upside, with around 1.8 times more cumulative liquidity above the market.
📉 Below the market, long-liquidation liquidity is concentrated mainly across 8.42–8.66. Notable clusters sit around 8.46–8.62 with several bars near 0.15–0.32 million USD, while 8.78–8.88 also contains multiple pockets around 0.15–0.25 million USD. Losing 9.10 would shift attention toward 9.02–8.94 and then 8.86–8.62.
📈 Above the market, short-liquidation liquidity is heavily concentrated across 9.62–10.00. Major clusters appear around 9.68–9.72 with a bar above 0.5 million USD, 9.78–9.84 with several bars around 0.35–0.63 million USD, and especially 9.94–9.96 with a bar near 0.76 million USD.
🧭 The broader setup favors the upside because short-liquidation exposure above dominates. Breaking above 9.54–9.62 would expose 9.68–9.84, followed by the major 9.94–9.96 cluster. Losing 9.10 would instead increase the probability of a sweep toward 9.02–8.94 and then 8.86–8.62.
#LiquidationMap
17

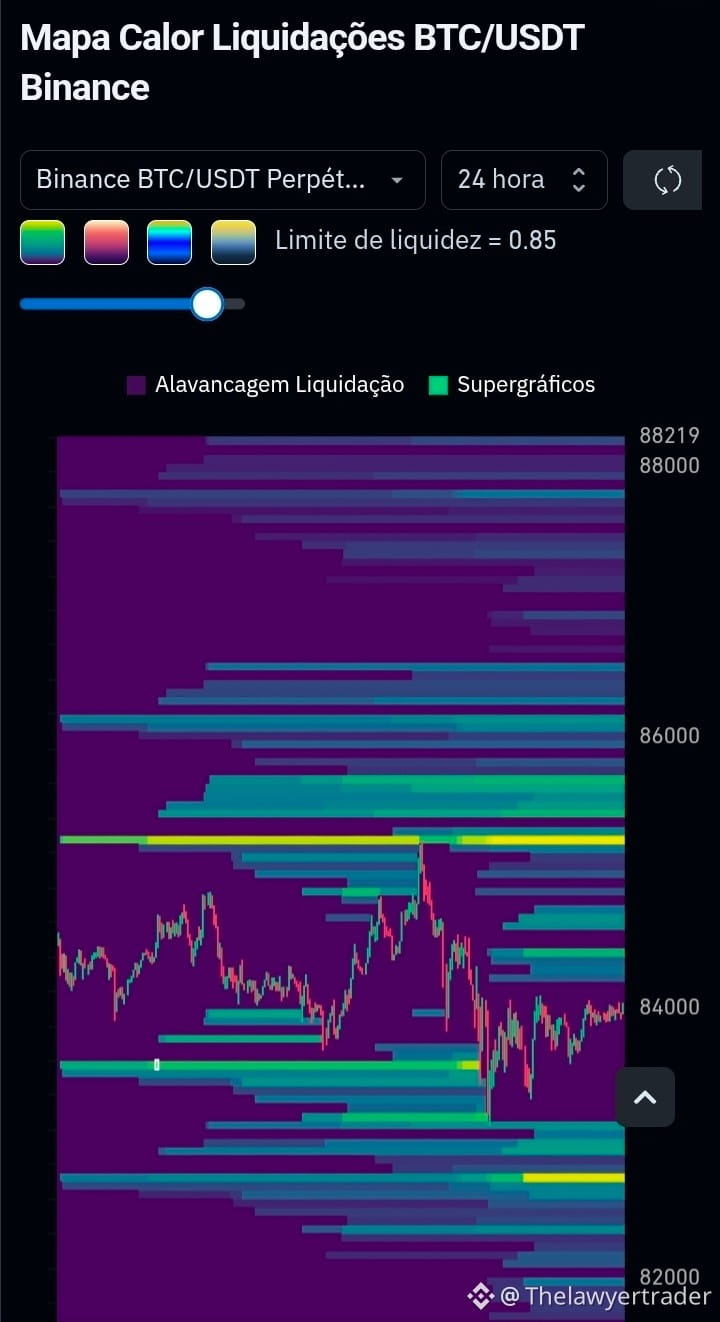
BTC/USDT — Liquidity Analysis (24h)
Price remains consolidated in the 84,000 range, trapped between two relevant liquidity zones.
Areas of interest:
Resistance: ~85,000 – 85,500 (dense liquidity above the price)
Support: ~83,000 (order accumulation below)
Chart read:
No classic chart pattern (triangle, head-and-shoulders) is clearly formed. What’s visible is consolidation between liquidity zones—a common behavior before defining direction.
Probability (estimate):
Test of the 85,000 zone before a clear direction: high (~65%)
Sustained breakout above 85,500: moderate (~40%)
Loss of the 83,000 support: low-moderate (~30%)
Conclusion:
The market tends to "seek" accumulated liquidity. The most likely scenario is a test of the 85,000 resistance, with a directional decision after this move. Wait for volume confirmation before positioning.
⚠️ Informational analysis only; not investment advice. Cryptoassets are volatile.
#liquidationmap #liquidez
BTC/USDT — Liquidity Analysis (24h)
Price remains consolidated in the 84,000 range, trapped between two relevant liquidity zones.
Areas of interest:
Resistance: ~85,000 – 85,500 (dense liquidity above the price)
Support: ~83,000 (order accumulation below)
Chart read:
No classic chart pattern (triangle, head-and-shoulders) is clearly formed. What’s visible is consolidation between liquidity zones—a common behavior before defining direction.
Probability (estimate):
Test of the 85,000 zone before a clear direction: high (~65%)
Sustained breakout above 85,500: moderate (~40%)
Loss of the 83,000 support: low-moderate (~30%)
Conclusion:
The market tends to "seek" accumulated liquidity. The most likely scenario is a test of the 85,000 resistance, with a directional decision after this move. Wait for volume confirmation before positioning.
⚠️ Informational analysis only; not investment advice. Cryptoassets are volatile.
#liquidationmap #liquidez
Price remains consolidated in the 84,000 range, trapped between two relevant liquidity zones.
Areas of interest:
Resistance: ~85,000 – 85,500 (dense liquidity above the price)
Support: ~83,000 (order accumulation below)
Chart read:
No classic chart pattern (triangle, head-and-shoulders) is clearly formed. What’s visible is consolidation between liquidity zones—a common behavior before defining direction.
Probability (estimate):
Test of the 85,000 zone before a clear direction: high (~65%)
Sustained breakout above 85,500: moderate (~40%)
Loss of the 83,000 support: low-moderate (~30%)
Conclusion:
The market tends to "seek" accumulated liquidity. The most likely scenario is a test of the 85,000 resistance, with a directional decision after this move. Wait for volume confirmation before positioning.
⚠️ Informational analysis only; not investment advice. Cryptoassets are volatile.
#liquidationmap #liquidez
2
250

·
--
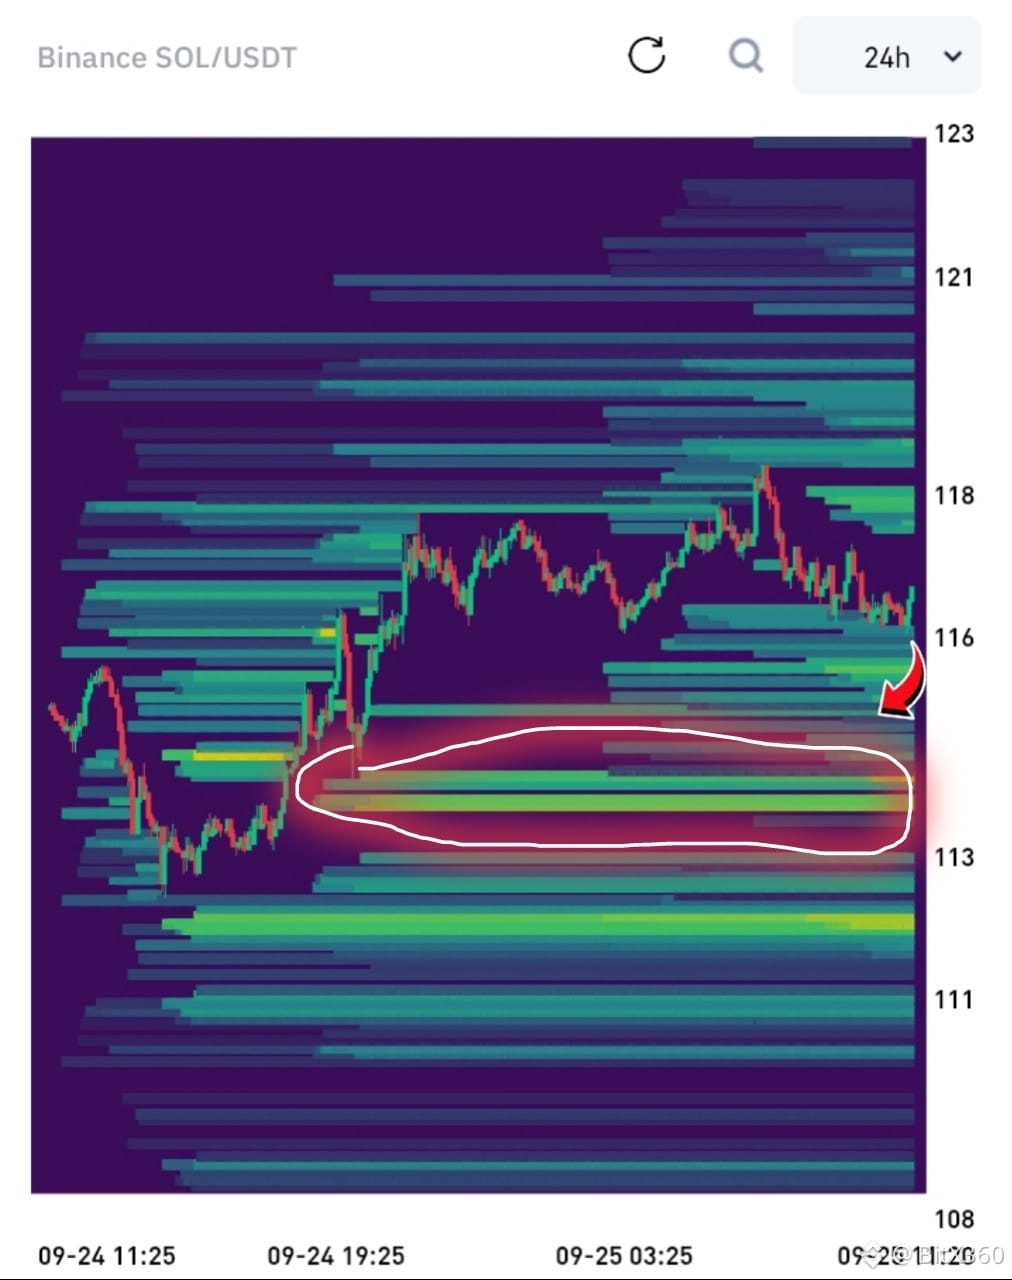
$SOL liquidation map just exposed everything The heaviest liquidity is sitting at 113-115 This is the biggest long liquidation zone If price drops into this area, a large number of long positions will get wiped out There’s also short liquidity stacked between 118-121
But the real density and intensity is clearly below
Two paths left:
Either hunt the longs below
Or push up and liquidate the shorts
The market is about to decide
{future}(SOLUSDT)
#SOL #LiquidationMap #Crypto
$SOL liquidation map just exposed everything The heaviest liquidity is sitting at 113-115 This is the biggest long liquidation zone If price drops into this area, a large number of long positions will get wiped out There’s also short liquidity stacked between 118-121
But the real density and intensity is clearly below
Two paths left:
Either hunt the longs below
Or push up and liquidate the shorts
The market is about to decide
#SOL #LiquidationMap #Crypto
But the real density and intensity is clearly below
Two paths left:
Either hunt the longs below
Or push up and liquidate the shorts
The market is about to decide
#SOL #LiquidationMap #Crypto
3
221

💣$BTC
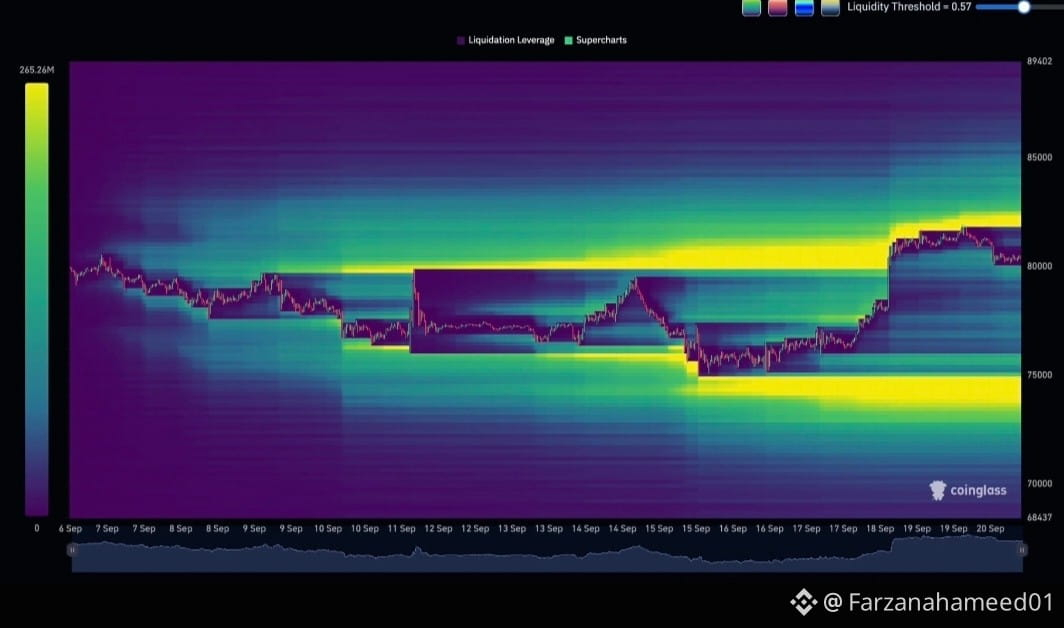
BTC LIQUIDATION TRAP ACTIVATED! $75K or $83K First? 👀
The BTC Liquidation Heatmap is showing massive liquidity on both sides!
Heavy yellow zones at $83K (short liquidations) and $75K (long liquidations).
Bitcoin always hunts liquidity. The question is, which side gets hunted first?
My bias: $83K taps first to grab liquidity, then a sharp reversal towards $75K. Pump first, then dump.
What do you think will hit first?
A) $83K
B) $75K
Drop your prediction below 👇
Not Financial Advice.
#BTC #Bitcoin #Crypto #LiquidationMap #cryptotrading
💣$BTC
BTC LIQUIDATION TRAP ACTIVATED! $75K or $83K First? 👀
The BTC Liquidation Heatmap is showing massive liquidity on both sides!
Heavy yellow zones at $83K (short liquidations) and $75K (long liquidations).
Bitcoin always hunts liquidity. The question is, which side gets hunted first?
My bias: $83K taps first to grab liquidity, then a sharp reversal towards $75K. Pump first, then dump.
What do you think will hit first?
A) $83K
B) $75K
Drop your prediction below 👇
Not Financial Advice.
#BTC #Bitcoin #Crypto #LiquidationMap #cryptotrading
BTC LIQUIDATION TRAP ACTIVATED! $75K or $83K First? 👀
The BTC Liquidation Heatmap is showing massive liquidity on both sides!
Heavy yellow zones at $83K (short liquidations) and $75K (long liquidations).
Bitcoin always hunts liquidity. The question is, which side gets hunted first?
My bias: $83K taps first to grab liquidity, then a sharp reversal towards $75K. Pump first, then dump.
What do you think will hit first?
A) $83K
B) $75K
Drop your prediction below 👇
Not Financial Advice.
#BTC #Bitcoin #Crypto #LiquidationMap #cryptotrading
1
1
111
Log in to explore more content
Join global crypto users on Binance Square
⚡️ Get latest and useful information about crypto.
💬 Trusted by the world’s largest crypto exchange.
👍 Discover real insights from verified creators.
Email / Phone number
Trending Topics
1
#BinanceLaunchesBinanceIntelligence
133,116 views
1,312 Discussing
2
#StriveBuys2000BTCFor$169M
5,263 views
59 Discussing
3
#EvernorthXRPTreasuryCompletesSPACMerger
83,226 views
847 Discussing
4
#ADAGains10%Above$0.27
42,768 views
238 Discussing
5
#ETHUp70%InQ3ButLiquidityFalls
284,268 views
1,913 Discussing
6
#EthStakingExitQueueHits2026High
106,944 views
1,276 Discussing
7
#FedOctoberHoldOdds82.3%
114,446 views
1,240 Discussing
8
#Nikkei225Jumps2.5%ToThreeMonthHigh
109,839 views
1,421 Discussing
9
#CircleMints$2.75BUSDCOnSolanaIn7Days
2,937 views
60 Discussing
10
#DriftHackVictimsBeginClaims
225,439 views
2,099 Discussing