

#97
97
4,799 views
37 Discussing
Hot
Latest

Article
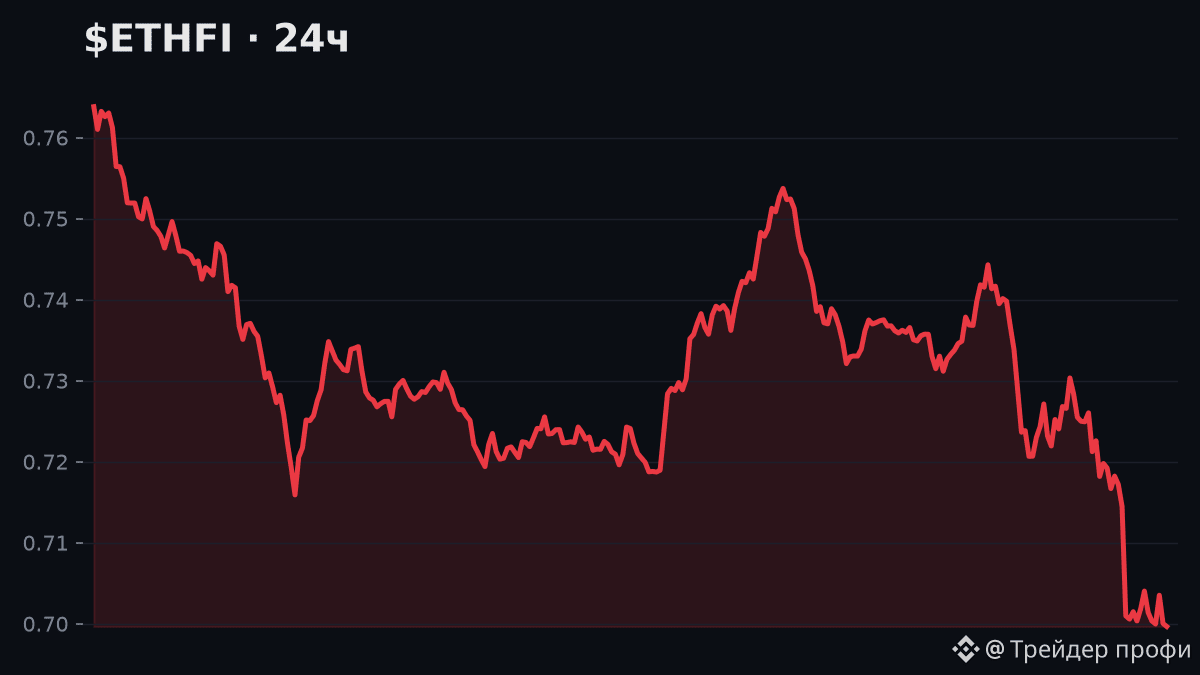
$ETHFI -8.6% over 24h — delivered the worst performance of the day in the top-100!📉 $ETHFI -8.6% over 24h — delivered the worst performance of the day in the top-100!
Here’s what’s happening right now.
🧭 Summary: the movement is GOING AGAINST the broader trend (7d/30d in the opposite direction) — it looks like a short-term bounce/correction rather than a trend change.
🌍 Market context: out of 62 large coins with notable movement in the last 24h — 🔼 24 rose, 🔽 38 fell
$ETHFI -8.6% over 24h — delivered the worst performance of the day in the top-100!
📉 $ETHFI -8.6% over 24h — delivered the worst performance of the day in the top-100!
Here’s what’s happening right now.
🧭 Summary: the movement is GOING AGAINST the broader trend (7d/30d in the opposite direction) — it looks like a short-term bounce/correction rather than a trend change.
🌍 Market context: out of 62 large coins with notable movement in the last 24h — 🔼 24 rose, 🔽 38 fell
Here’s what’s happening right now.
🧭 Summary: the movement is GOING AGAINST the broader trend (7d/30d in the opposite direction) — it looks like a short-term bounce/correction rather than a trend change.
🌍 Market context: out of 62 large coins with notable movement in the last 24h — 🔼 24 rose, 🔽 38 fell
295

·
--
** How Can You Earn Profit on Binance Square with Up-to-Date Data? 📈💰Official Trump (TRUMPUSDT) is trending right now!
Rank: #97
** ### 1️⃣ Open Binance Square and Check the “Live Market” Panel **Why is it important?** Real-time price and volume data helps you make decisions with data—not just by “glancing.” - **Step:** In Binance Square, open the “Market” tab → enter the “Live Market” panel. - **Visual hint:** If the **% change** color next to the price box is green, it’s a rise; if it’s red, it’s a drop. - **Application:** Right now, the price is **79 647.33 USDT** (+%1.65, 24h), and it is **2 511.90 USDT** (+%1.58). Mark this rise as a “trend confirmation.” --- ### 2️⃣ Review the “Top Movers” List and Identify Potential “Breakouts” **Why is it important?** The most active pairs provide volatility and liquidity opportunities. | Symbol | Price | % Change | Volume (USDT) | Example Strategy | |--------|-------|-----------|--------------|----------------| | **NEARUSDT** | 2.626 | **+14.52%** | 89 909 416 | **Breakout** – 2–3% stop-loss, target 2.80 USDT | | **ATOMUSDT** | 1.932 | **+9.96%** | 9 925 245 | **Pull-back** – support 1.90 USDT, target 2.10 USDT | | **DOTUSDT** | 1.176 | **+7.99%** | 36 861 329 | **Trend-continuation** – stop 1.15 USDT, target 1.30 USDT | | **UNIUSDT** | 6.709 | **‑3.06%** | 50 844 287 | **Short-bias** – stop-loss 6.60 USDT, target 6.30 USDT | - **Visual hint:** The percentage sign color in the “Top Movers” rows is green/red. Green = a buying opportunity; red = a selling opportunity. - **Application:** Let’s take **NEAR** as an example. From 2.626 USDT, a 5%
** How Can You Earn Profit on Binance Square with Up-to-Date Data? 📈💰
Official Trump (TRUMPUSDT) is trending right now!
Rank: #97
** ### 1️⃣ Open Binance Square and Check the “Live Market” Panel **Why is it important?** Real-time price and volume data helps you make decisions with data—not just by “glancing.” - **Step:** In Binance Square, open the “Market” tab → enter the “Live Market” panel. - **Visual hint:** If the **% change** color next to the price box is green, it’s a rise; if it’s red, it’s a drop. - **Application:** Right now, the price is **79 647.33 USDT** (+%1.65, 24h), and it is **2 511.90 USDT** (+%1.58). Mark this rise as a “trend confirmation.” --- ### 2️⃣ Review the “Top Movers” List and Identify Potential “Breakouts” **Why is it important?** The most active pairs provide volatility and liquidity opportunities. | Symbol | Price | % Change | Volume (USDT) | Example Strategy | |--------|-------|-----------|--------------|----------------| | **NEARUSDT** | 2.626 | **+14.52%** | 89 909 416 | **Breakout** – 2–3% stop-loss, target 2.80 USDT | | **ATOMUSDT** | 1.932 | **+9.96%** | 9 925 245 | **Pull-back** – support 1.90 USDT, target 2.10 USDT | | **DOTUSDT** | 1.176 | **+7.99%** | 36 861 329 | **Trend-continuation** – stop 1.15 USDT, target 1.30 USDT | | **UNIUSDT** | 6.709 | **‑3.06%** | 50 844 287 | **Short-bias** – stop-loss 6.60 USDT, target 6.30 USDT | - **Visual hint:** The percentage sign color in the “Top Movers” rows is green/red. Green = a buying opportunity; red = a selling opportunity. - **Application:** Let’s take **NEAR** as an example. From 2.626 USDT, a 5%
Rank: #97
** ### 1️⃣ Open Binance Square and Check the “Live Market” Panel **Why is it important?** Real-time price and volume data helps you make decisions with data—not just by “glancing.” - **Step:** In Binance Square, open the “Market” tab → enter the “Live Market” panel. - **Visual hint:** If the **% change** color next to the price box is green, it’s a rise; if it’s red, it’s a drop. - **Application:** Right now, the price is **79 647.33 USDT** (+%1.65, 24h), and it is **2 511.90 USDT** (+%1.58). Mark this rise as a “trend confirmation.” --- ### 2️⃣ Review the “Top Movers” List and Identify Potential “Breakouts” **Why is it important?** The most active pairs provide volatility and liquidity opportunities. | Symbol | Price | % Change | Volume (USDT) | Example Strategy | |--------|-------|-----------|--------------|----------------| | **NEARUSDT** | 2.626 | **+14.52%** | 89 909 416 | **Breakout** – 2–3% stop-loss, target 2.80 USDT | | **ATOMUSDT** | 1.932 | **+9.96%** | 9 925 245 | **Pull-back** – support 1.90 USDT, target 2.10 USDT | | **DOTUSDT** | 1.176 | **+7.99%** | 36 861 329 | **Trend-continuation** – stop 1.15 USDT, target 1.30 USDT | | **UNIUSDT** | 6.709 | **‑3.06%** | 50 844 287 | **Short-bias** – stop-loss 6.60 USDT, target 6.30 USDT | - **Visual hint:** The percentage sign color in the “Top Movers” rows is green/red. Green = a buying opportunity; red = a selling opportunity. - **Application:** Let’s take **NEAR** as an example. From 2.626 USDT, a 5%
124
·
--
79,054 $ — Why This Drop Could Be a Buying Opportunity NowAerodrome Finance (AEROUSDT) is trending right now!
Rank: #97
79,054 $ — right within the last 24 hours, it’s down 1.6%. Most are saying “drop, panic sell,” but I’m seeing a “pump-ready” signal at this dip. 📈 At first glance, it looks like its volume is 834M USDT and the price has stayed stable around the 79k$ level. But when I dive deeper into the volume-price correlation, whale buying pressure is still active. As volume increased by 0.8% while price only fell by 1.6%—that’s a classic “low-volume dump” signal for a “buy-the-dip” strategy. Now let’s look at (data is missing, but the trend is still bullish). It generally moves in parallel with BTC, so slight pullback in BTC increases the odds of a 2–3% “rebound” for ETH. **Top Movers Analysis** - **DOTUSDT (+7.5%)**: Polkadot rose to the $1.061 level and gathered 28.5M USDT in volume over 24 hours. This could be a “short-term rally” driven by new parachain auction announcements in the “Layer-2” ecosystem. - **ATOMUSDT (+2.4%)**: Cosmos broke out to $1.635 with 2.45M USDT volume. “Inter-chain” protocols are heating up, strengthening the DeFi liquidity chain. - **AVAXUSDT (+2.0%)**: Avalanche climbed to $8.077 with 38.5M USDT in volume. “Sub-net” launches and new staking options are creating short-term “ape-in” opportunities. **Losers and Risk Management** - **UNIUSDT (-5.4%)** and **NEARUSDT (-5.0%)** are still trending downward, and they’re exposed to “rekt” risk due to liquidity pullback and “yield-farm” frenzy. - **SOLUSDT (-2.6%)** and **BNBUSDT (-2.1%)** meanwhile are facing a “margin squeeze”
79,054 $ — Why This Drop Could Be a Buying Opportunity Now
Aerodrome Finance (AEROUSDT) is trending right now!
Rank: #97
79,054 $ — right within the last 24 hours, it’s down 1.6%. Most are saying “drop, panic sell,” but I’m seeing a “pump-ready” signal at this dip. 📈 At first glance, it looks like its volume is 834M USDT and the price has stayed stable around the 79k$ level. But when I dive deeper into the volume-price correlation, whale buying pressure is still active. As volume increased by 0.8% while price only fell by 1.6%—that’s a classic “low-volume dump” signal for a “buy-the-dip” strategy. Now let’s look at (data is missing, but the trend is still bullish). It generally moves in parallel with BTC, so slight pullback in BTC increases the odds of a 2–3% “rebound” for ETH. **Top Movers Analysis** - **DOTUSDT (+7.5%)**: Polkadot rose to the $1.061 level and gathered 28.5M USDT in volume over 24 hours. This could be a “short-term rally” driven by new parachain auction announcements in the “Layer-2” ecosystem. - **ATOMUSDT (+2.4%)**: Cosmos broke out to $1.635 with 2.45M USDT volume. “Inter-chain” protocols are heating up, strengthening the DeFi liquidity chain. - **AVAXUSDT (+2.0%)**: Avalanche climbed to $8.077 with 38.5M USDT in volume. “Sub-net” launches and new staking options are creating short-term “ape-in” opportunities. **Losers and Risk Management** - **UNIUSDT (-5.4%)** and **NEARUSDT (-5.0%)** are still trending downward, and they’re exposed to “rekt” risk due to liquidity pullback and “yield-farm” frenzy. - **SOLUSDT (-2.6%)** and **BNBUSDT (-2.1%)** meanwhile are facing a “margin squeeze”
Rank: #97
79,054 $ — right within the last 24 hours, it’s down 1.6%. Most are saying “drop, panic sell,” but I’m seeing a “pump-ready” signal at this dip. 📈 At first glance, it looks like its volume is 834M USDT and the price has stayed stable around the 79k$ level. But when I dive deeper into the volume-price correlation, whale buying pressure is still active. As volume increased by 0.8% while price only fell by 1.6%—that’s a classic “low-volume dump” signal for a “buy-the-dip” strategy. Now let’s look at (data is missing, but the trend is still bullish). It generally moves in parallel with BTC, so slight pullback in BTC increases the odds of a 2–3% “rebound” for ETH. **Top Movers Analysis** - **DOTUSDT (+7.5%)**: Polkadot rose to the $1.061 level and gathered 28.5M USDT in volume over 24 hours. This could be a “short-term rally” driven by new parachain auction announcements in the “Layer-2” ecosystem. - **ATOMUSDT (+2.4%)**: Cosmos broke out to $1.635 with 2.45M USDT volume. “Inter-chain” protocols are heating up, strengthening the DeFi liquidity chain. - **AVAXUSDT (+2.0%)**: Avalanche climbed to $8.077 with 38.5M USDT in volume. “Sub-net” launches and new staking options are creating short-term “ape-in” opportunities. **Losers and Risk Management** - **UNIUSDT (-5.4%)** and **NEARUSDT (-5.0%)** are still trending downward, and they’re exposed to “rekt” risk due to liquidity pullback and “yield-farm” frenzy. - **SOLUSDT (-2.6%)** and **BNBUSDT (-2.1%)** meanwhile are facing a “margin squeeze”
56

·
--
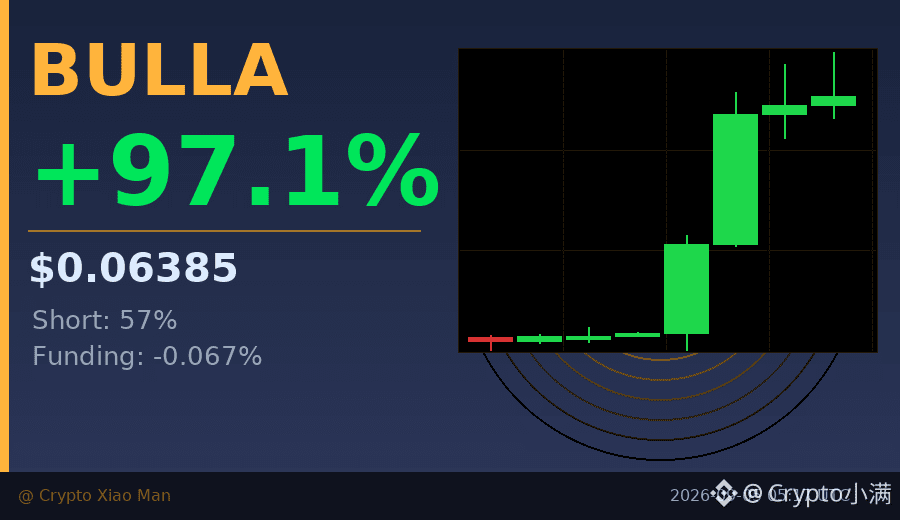
97% increase, but the funding rate is negative — and that’s happening on BULLA at the same time.
Price surged from 0.025 all the way to 0.0699, with trading volume jumping to 156 million USDT, yet there are actually more people betting against it: 57% shorts vs 43% longs.
The hourly candles have closed green in a row, so buying pressure is clearly strong, but the negative funding rate suggests many people don’t believe this rally can hold.
This kind of divergence usually means two things: either shorts get squeezed and the upside accelerates, or longs run out of steam and the price pulls back quickly.
I’m watching the 0.06 level — the last few candles have been fighting around this area repeatedly. If it holds, there’s still room to go; if it breaks below, be careful of profit-taking flooding in.
$BULLA #资金费率背离 #97%
Click the small card below to quickly check the market 👇
97% increase, but the funding rate is negative — and that’s happening on BULLA at the same time.
Price surged from 0.025 all the way to 0.0699, with trading volume jumping to 156 million USDT, yet there are actually more people betting against it: 57% shorts vs 43% longs.
The hourly candles have closed green in a row, so buying pressure is clearly strong, but the negative funding rate suggests many people don’t believe this rally can hold.
This kind of divergence usually means two things: either shorts get squeezed and the upside accelerates, or longs run out of steam and the price pulls back quickly.
I’m watching the 0.06 level — the last few candles have been fighting around this area repeatedly. If it holds, there’s still room to go; if it breaks below, be careful of profit-taking flooding in.
$BULLA #资金费率背离 #97%
Click the small card below to quickly check the market 👇
Price surged from 0.025 all the way to 0.0699, with trading volume jumping to 156 million USDT, yet there are actually more people betting against it: 57% shorts vs 43% longs.
The hourly candles have closed green in a row, so buying pressure is clearly strong, but the negative funding rate suggests many people don’t believe this rally can hold.
This kind of divergence usually means two things: either shorts get squeezed and the upside accelerates, or longs run out of steam and the price pulls back quickly.
I’m watching the 0.06 level — the last few candles have been fighting around this area repeatedly. If it holds, there’s still room to go; if it breaks below, be careful of profit-taking flooding in.
$BULLA #资金费率背离 #97%
Click the small card below to quickly check the market 👇
67


·
--
We're excited to share the latest trending tokens with our community 🚀. According to CoinGecko, the list includes The Black Bull (ANSEM), Solstice (SLX), and Bitcoin (BTC). We're seeing a diverse range of tokens, from established players like Ethereum (ETH) to newer ones like Sui (SUI) and Hyperliquid (HYPE).
We're tracking the market capitalization ranks of these tokens, with Bitcoin at #1 and Ethereum at #2. Other notable tokens include Venice Token (VVV) at #97. Our community is eager to learn more about these trending tokens and their potential impact on the market.
As we continue to monitor the market, we're seeing significant changes in token values 💰. We're committed to providing our community with the latest updates and insights, helping us all stay informed and up-to-date 📊.
$TLM, $VANRY, $TLM
We're excited to share the latest trending tokens with our community 🚀. According to CoinGecko, the list includes The Black Bull (ANSEM), Solstice (SLX), and Bitcoin (BTC). We're seeing a diverse range of tokens, from established players like Ethereum (ETH) to newer ones like Sui (SUI) and Hyperliquid (HYPE).
We're tracking the market capitalization ranks of these tokens, with Bitcoin at #1 and Ethereum at #2. Other notable tokens include Venice Token (VVV) at #97. Our community is eager to learn more about these trending tokens and their potential impact on the market.
As we continue to monitor the market, we're seeing significant changes in token values 💰. We're committed to providing our community with the latest updates and insights, helping us all stay informed and up-to-date 📊.
$TLM , $VANRY, $TLM
We're tracking the market capitalization ranks of these tokens, with Bitcoin at #1 and Ethereum at #2. Other notable tokens include Venice Token (VVV) at #97. Our community is eager to learn more about these trending tokens and their potential impact on the market.
As we continue to monitor the market, we're seeing significant changes in token values 💰. We're committed to providing our community with the latest updates and insights, helping us all stay informed and up-to-date 📊.
$TLM , $VANRY, $TLM
1
461

·
--
$APT quick research note, not a hype thread.
Aptos is being priced like a narrative reset, not just a candle trade.
Price: $0.6590
Market cap: $547.3M
Rank: #97
FDV: $0.0000
7d / 30d: -3.2% / -32.2%
The part I care about:
Circulating ratio is about 69.1%, so supply pressure belongs in the valuation debate.
Daily trend: Neutral/Consolidating ↔️
RSI: 34.9
Support: $0.6100
Resistance: $0.8200
My read: if $APT reclaims resistance, the market starts paying for the story again. Lose support, and I would rather wait than be early. NFA.
Is $APT undervalued here, or just another bounce trap?
$APT quick research note, not a hype thread.
Aptos is being priced like a narrative reset, not just a candle trade.
Price: $0.6590
Market cap: $547.3M
Rank: #97
FDV: $0.0000
7d / 30d: -3.2% / -32.2%
The part I care about:
Circulating ratio is about 69.1%, so supply pressure belongs in the valuation debate.
Daily trend: Neutral/Consolidating ↔️
RSI: 34.9
Support: $0.6100
Resistance: $0.8200
My read: if $APT reclaims resistance, the market starts paying for the story again. Lose support, and I would rather wait than be early. NFA.
Is $APT undervalued here, or just another bounce trap?
Aptos is being priced like a narrative reset, not just a candle trade.
Price: $0.6590
Market cap: $547.3M
Rank: #97
FDV: $0.0000
7d / 30d: -3.2% / -32.2%
The part I care about:
Circulating ratio is about 69.1%, so supply pressure belongs in the valuation debate.
Daily trend: Neutral/Consolidating ↔️
RSI: 34.9
Support: $0.6100
Resistance: $0.8200
My read: if $APT reclaims resistance, the market starts paying for the story again. Lose support, and I would rather wait than be early. NFA.
Is $APT undervalued here, or just another bounce trap?
161

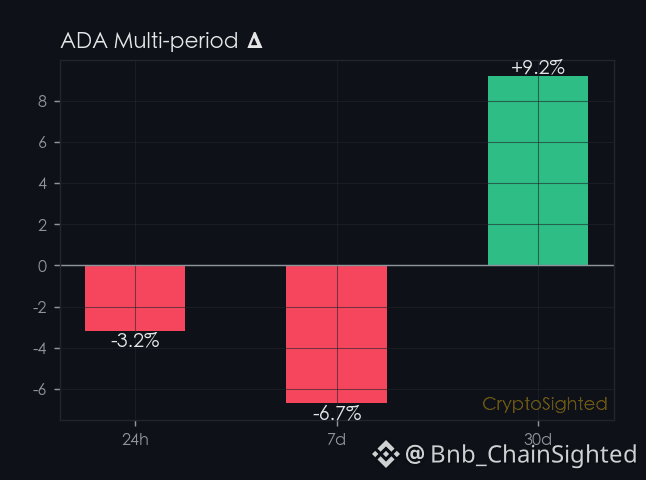
↓3.4% - $ADA’s 24-hour price drop hints at a possible stall in its recent rally.
ADA’s 30-day price increase of ↑10.6% hides a recent slowdown - its 7-day drop of ↓9.4% suggests the rally may be losing steam.
That’s not just a number - it’s a sign the market is testing whether this move has legs.
The price is near $0.16, but the derivatives market tells a different story.
ADA’s funding rate is ↓0.0201%, meaning shorts are in control and paying a premium to hold their positions.
That’s a bearish signal - the crowd isn’t buying into the price move.
When shorts are dominant, it’s often a sign of caution or even a potential short squeeze brewing in the background.
—
📊 13 directional calls in the last 30d, every one auto-settled against price. Direction only — no buy/sell calls.
Not financial advice. DYOR.
📌 Funding Pulse · #97 · #FundingRate #CryptoSighted $ADA
↓3.4% - $ADA ’s 24-hour price drop hints at a possible stall in its recent rally.
ADA’s 30-day price increase of ↑10.6% hides a recent slowdown - its 7-day drop of ↓9.4% suggests the rally may be losing steam.
That’s not just a number - it’s a sign the market is testing whether this move has legs.
The price is near $0.16, but the derivatives market tells a different story.
ADA’s funding rate is ↓0.0201%, meaning shorts are in control and paying a premium to hold their positions.
That’s a bearish signal - the crowd isn’t buying into the price move.
When shorts are dominant, it’s often a sign of caution or even a potential short squeeze brewing in the background.
—
📊 13 directional calls in the last 30d, every one auto-settled against price. Direction only — no buy/sell calls.
Not financial advice. DYOR.
📌 Funding Pulse · #97 · #FundingRate #CryptoSighted $ADA
ADA’s 30-day price increase of ↑10.6% hides a recent slowdown - its 7-day drop of ↓9.4% suggests the rally may be losing steam.
That’s not just a number - it’s a sign the market is testing whether this move has legs.
The price is near $0.16, but the derivatives market tells a different story.
ADA’s funding rate is ↓0.0201%, meaning shorts are in control and paying a premium to hold their positions.
That’s a bearish signal - the crowd isn’t buying into the price move.
When shorts are dominant, it’s often a sign of caution or even a potential short squeeze brewing in the background.
—
📊 13 directional calls in the last 30d, every one auto-settled against price. Direction only — no buy/sell calls.
Not financial advice. DYOR.
📌 Funding Pulse · #97 · #FundingRate #CryptoSighted $ADA
384
$SOL’s recent move has been anything but quiet - and it’s not just because of the Marmot researchers’ pivot to OnlyFans and meme coins.
The Solana ecosystem is seeing a shift in how projects are funded and how communities are engaged. Unlike traditional venture capital models, which are centralized and opaque, Solana-based initiatives are increasingly relying on decentralized, community-driven mechanisms - and SOL is at the center of that shift.
So, what’s next? That’s the real question.
—
For educational purposes only. Not financial advice.
📌 Crypto 101 · #97 · #CryptoEducation #CryptoSighted $SOL
$SOL ’s recent move has been anything but quiet - and it’s not just because of the Marmot researchers’ pivot to OnlyFans and meme coins.
The Solana ecosystem is seeing a shift in how projects are funded and how communities are engaged. Unlike traditional venture capital models, which are centralized and opaque, Solana-based initiatives are increasingly relying on decentralized, community-driven mechanisms - and SOL is at the center of that shift.
So, what’s next? That’s the real question.
—
For educational purposes only. Not financial advice.
📌 Crypto 101 · #97 · #CryptoEducation #CryptoSighted $SOL
The Solana ecosystem is seeing a shift in how projects are funded and how communities are engaged. Unlike traditional venture capital models, which are centralized and opaque, Solana-based initiatives are increasingly relying on decentralized, community-driven mechanisms - and SOL is at the center of that shift.
So, what’s next? That’s the real question.
—
For educational purposes only. Not financial advice.
📌 Crypto 101 · #97 · #CryptoEducation #CryptoSighted $SOL
138

·
--
Falls to the level 96% below the previous high—no matter how dead-quiet the chart looks, even it will ripple.
$ARB plunged 74% over the past year, and it’s formed a despair-inducing deep pit just $2.39 away from its ATH. But in the last 24 hours, it suddenly rebounded 13.7%, with trading volume spiking to $108 million—directly two or three times the average daily level over the past month.
This kind of move is worth paying attention to. In long periods of slow bleed and bottom consolidation, a sudden surge in volume often signals that smart money has entered to test the sell pressure.
Currently, $ARB ’s market cap ranking has slipped back to the edge of #97 . Over the past 30 days, it has been repeatedly grinding in a tight range between $0.07 and $0.08. With this wave of liquidity now flowing in, it’s at least managed to poke out of the suffocating base range.
But it’s still too early to call a reversal. A -96% drawdown means everything above is a pile of trapped positions from the prior cycle. Every attempt upward will face heavy pressure from those trying to get out. If the following days’ volume can’t hold up, or if the price drops back and falls below the dense share-accumulation zone around $0.075, then this is very likely only a brief oversold bounce or short-covering.
The real right-side opportunity always belongs to those assets that are “high volume and can hold.” What do you think about $ARB this time—dead cat bounce, or is capital truly returning?
Falls to the level 96% below the previous high—no matter how dead-quiet the chart looks, even it will ripple.
$ARB plunged 74% over the past year, and it’s formed a despair-inducing deep pit just $2.39 away from its ATH. But in the last 24 hours, it suddenly rebounded 13.7%, with trading volume spiking to $108 million—directly two or three times the average daily level over the past month.
This kind of move is worth paying attention to. In long periods of slow bleed and bottom consolidation, a sudden surge in volume often signals that smart money has entered to test the sell pressure.
Currently, $ARB ’s market cap ranking has slipped back to the edge of #97 . Over the past 30 days, it has been repeatedly grinding in a tight range between $0.07 and $0.08. With this wave of liquidity now flowing in, it’s at least managed to poke out of the suffocating base range.
But it’s still too early to call a reversal. A -96% drawdown means everything above is a pile of trapped positions from the prior cycle. Every attempt upward will face heavy pressure from those trying to get out. If the following days’ volume can’t hold up, or if the price drops back and falls below the dense share-accumulation zone around $0.075, then this is very likely only a brief oversold bounce or short-covering.
The real right-side opportunity always belongs to those assets that are “high volume and can hold.” What do you think about $ARB this time—dead cat bounce, or is capital truly returning?
$ARB plunged 74% over the past year, and it’s formed a despair-inducing deep pit just $2.39 away from its ATH. But in the last 24 hours, it suddenly rebounded 13.7%, with trading volume spiking to $108 million—directly two or three times the average daily level over the past month.
This kind of move is worth paying attention to. In long periods of slow bleed and bottom consolidation, a sudden surge in volume often signals that smart money has entered to test the sell pressure.
Currently, $ARB ’s market cap ranking has slipped back to the edge of #97 . Over the past 30 days, it has been repeatedly grinding in a tight range between $0.07 and $0.08. With this wave of liquidity now flowing in, it’s at least managed to poke out of the suffocating base range.
But it’s still too early to call a reversal. A -96% drawdown means everything above is a pile of trapped positions from the prior cycle. Every attempt upward will face heavy pressure from those trying to get out. If the following days’ volume can’t hold up, or if the price drops back and falls below the dense share-accumulation zone around $0.075, then this is very likely only a brief oversold bounce or short-covering.
The real right-side opportunity always belongs to those assets that are “high volume and can hold.” What do you think about $ARB this time—dead cat bounce, or is capital truly returning?
70

·
--
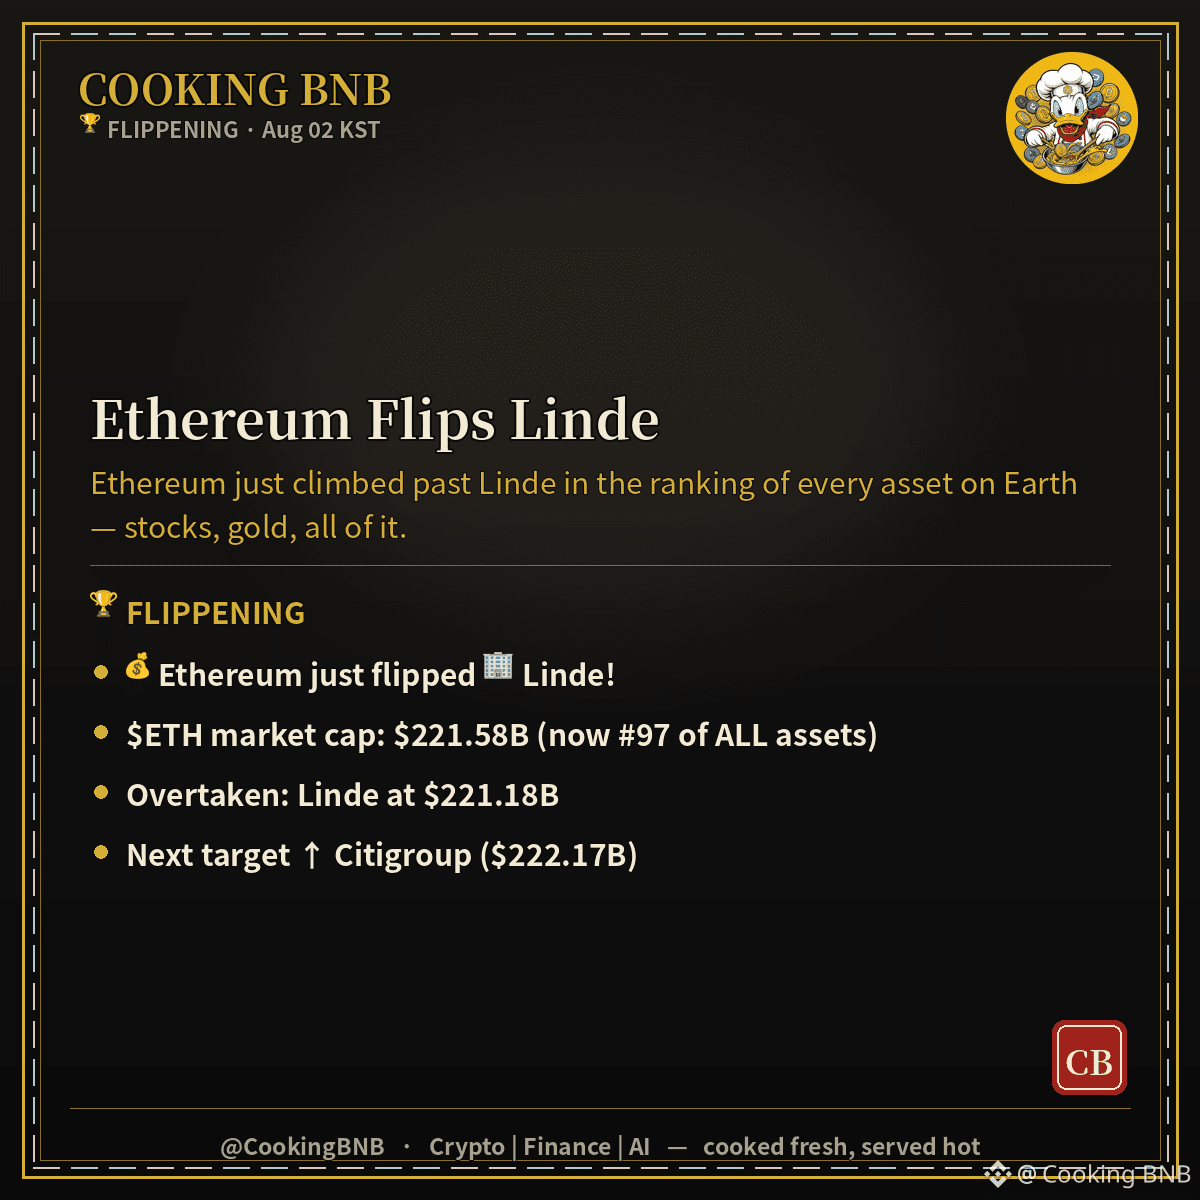
🏆 FLIPPENING
💰 Ethereum just flipped Linde!
$ETH $221.58B · now #97 of all assets
Passed Linde ($221.18B)
🍳 Crypto vs the whole world. Not financial advice.
#CookingBNB #Crypto #Bitcoin #BTC
🏆 FLIPPENING
💰 Ethereum just flipped Linde!
$ETH $221.58B · now #97 of all assets
Passed Linde ($221.18B)
🍳 Crypto vs the whole world. Not financial advice.
#CookingBNB #Crypto #Bitcoin #BTC
💰 Ethereum just flipped Linde!
$ETH $221.58B · now #97 of all assets
Passed Linde ($221.18B)
🍳 Crypto vs the whole world. Not financial advice.
#CookingBNB #Crypto #Bitcoin #BTC
1
32
If you noticed Binance quietly rolling out TradFi perpetuals and tokenized securities in late July without a market hiccup, you might be missing a deeper shift in how funding flows are being rerouted - and why it matters now.
Between July 27 and August 3, 2026, Binance launched multiple USDⓈ-Margined TradFi perpetual contracts, including GIGADEVUSDT and POPMARTUSDT, while also adding 10 bStocks trading pairs and tokenized securities as collateral assets.
Yet, there was no significant price reaction or surge in market sentiment to suggest this was a major catalyst.
Could this be the start of a new funding layer on Binance, one that's not yet visible in price action?
Likely more chop near-term.
—
Not financial advice. DYOR.
📌 Announcements · #97 · #CryptoNews #CryptoSighted
If you noticed Binance quietly rolling out TradFi perpetuals and tokenized securities in late July without a market hiccup, you might be missing a deeper shift in how funding flows are being rerouted - and why it matters now.
Between July 27 and August 3, 2026, Binance launched multiple USDⓈ-Margined TradFi perpetual contracts, including GIGADEVUSDT and POPMARTUSDT, while also adding 10 bStocks trading pairs and tokenized securities as collateral assets.
Yet, there was no significant price reaction or surge in market sentiment to suggest this was a major catalyst.
Could this be the start of a new funding layer on Binance, one that's not yet visible in price action?
Likely more chop near-term.
—
Not financial advice. DYOR.
📌 Announcements · #97 · #CryptoNews #CryptoSighted
Between July 27 and August 3, 2026, Binance launched multiple USDⓈ-Margined TradFi perpetual contracts, including GIGADEVUSDT and POPMARTUSDT, while also adding 10 bStocks trading pairs and tokenized securities as collateral assets.
Yet, there was no significant price reaction or surge in market sentiment to suggest this was a major catalyst.
Could this be the start of a new funding layer on Binance, one that's not yet visible in price action?
Likely more chop near-term.
—
Not financial advice. DYOR.
📌 Announcements · #97 · #CryptoNews #CryptoSighted
505

This is the kind of zone where $XAUT can reject hard if buyers fail to reclaim control.
$XAUT remains trapped in a soft range, with upside attempts still lacking conviction.
Setup SHORT $XAUT (max 10x)
🎯 Entry: 4483 - 4537
🛑 SL: 4546
✅ TP1: 4438
✅ TP2: 4375
✅ TP3: 4312
• Purdue Football: 20 Year Countdown – #97 Gerald Gooden
Do you expect $XAUT to lose support, or recover first?
Trade $XAUT here 👇
#XAUT #MarketStructure #TradingSetup
This is the kind of zone where $XAUT can reject hard if buyers fail to reclaim control.
$XAUT remains trapped in a soft range, with upside attempts still lacking conviction.
Setup SHORT $XAUT (max 10x)
🎯 Entry: 4483 - 4537
🛑 SL: 4546
✅ TP1: 4438
✅ TP2: 4375
✅ TP3: 4312
• Purdue Football: 20 Year Countdown – #97 Gerald Gooden
Do you expect $XAUT to lose support, or recover first?
Trade $XAUT here 👇
#XAUT #MarketStructure #TradingSetup
$XAUT remains trapped in a soft range, with upside attempts still lacking conviction.
Setup SHORT $XAUT (max 10x)
🎯 Entry: 4483 - 4537
🛑 SL: 4546
✅ TP1: 4438
✅ TP2: 4375
✅ TP3: 4312
• Purdue Football: 20 Year Countdown – #97 Gerald Gooden
Do you expect $XAUT to lose support, or recover first?
Trade $XAUT here 👇
#XAUT #MarketStructure #TradingSetup
45

·
--
Contract Quant Brief #97|The funding hasn’t turned bad yet—I'll wait for a pullback confirmation
The market is still trending, but it’s not a mindless tailwind. Right now it’s more like “continuation within divergence.” Funding rates overall haven’t reached runaway levels, so I won’t chase the hottest move. I’ll first see whether the pullback can hold.
For Top candidates, I’ll look at these two first:
1) Lobster USDT
The 6-hour continuation is still intact; the 1-hour shows a minor pullback, and positions are still increasing—suggesting it isn’t a pure breakout followed by an immediate fade-out.
Observation level: around 0.0128
Trigger: after the pullback holds, reclaims and stands back above 0.0130
Invalidation: if 0.0123 breaks down; even a rebound won’t be able to get back up
2) ACTUSDT
This one looks more like a “repair-and-confirmation.” Price is sticking close to the 20-day line; funding rate is slightly negative, and short-term heat hasn’t been squeezed too excessively.
Observation level: 0.0125—0.0126
Trigger: after reclaiming 0.0128, if the pullback doesn’t break, then enter
Invalidation: a weak rebound that continues below 0.0123
Secondary watch: AIGENSYNUSDT moves very fast, but it’s already farther away from the moving average. I won’t chase it yet—I'll wait for a pullback.
Risk warning: In a continuing market, the biggest fear is a fake pullback and a fake repair. Before chasing, you must first check whether the key levels can be held. Today is more suitable for confirmation plays, not for betting on sentiment.
One sentence: I’ll prioritize watching for strong assets where the pullback can be held, and I won’t chase the hottest one.
Contract Quant Brief #97|The funding hasn’t turned bad yet—I'll wait for a pullback confirmation
The market is still trending, but it’s not a mindless tailwind. Right now it’s more like “continuation within divergence.” Funding rates overall haven’t reached runaway levels, so I won’t chase the hottest move. I’ll first see whether the pullback can hold.
For Top candidates, I’ll look at these two first:
1) Lobster USDT
The 6-hour continuation is still intact; the 1-hour shows a minor pullback, and positions are still increasing—suggesting it isn’t a pure breakout followed by an immediate fade-out.
Observation level: around 0.0128
Trigger: after the pullback holds, reclaims and stands back above 0.0130
Invalidation: if 0.0123 breaks down; even a rebound won’t be able to get back up
2) ACTUSDT
This one looks more like a “repair-and-confirmation.” Price is sticking close to the 20-day line; funding rate is slightly negative, and short-term heat hasn’t been squeezed too excessively.
Observation level: 0.0125—0.0126
Trigger: after reclaiming 0.0128, if the pullback doesn’t break, then enter
Invalidation: a weak rebound that continues below 0.0123
Secondary watch: AIGENSYNUSDT moves very fast, but it’s already farther away from the moving average. I won’t chase it yet—I'll wait for a pullback.
Risk warning: In a continuing market, the biggest fear is a fake pullback and a fake repair. Before chasing, you must first check whether the key levels can be held. Today is more suitable for confirmation plays, not for betting on sentiment.
One sentence: I’ll prioritize watching for strong assets where the pullback can be held, and I won’t chase the hottest one.
The market is still trending, but it’s not a mindless tailwind. Right now it’s more like “continuation within divergence.” Funding rates overall haven’t reached runaway levels, so I won’t chase the hottest move. I’ll first see whether the pullback can hold.
For Top candidates, I’ll look at these two first:
1) Lobster USDT
The 6-hour continuation is still intact; the 1-hour shows a minor pullback, and positions are still increasing—suggesting it isn’t a pure breakout followed by an immediate fade-out.
Observation level: around 0.0128
Trigger: after the pullback holds, reclaims and stands back above 0.0130
Invalidation: if 0.0123 breaks down; even a rebound won’t be able to get back up
2) ACTUSDT
This one looks more like a “repair-and-confirmation.” Price is sticking close to the 20-day line; funding rate is slightly negative, and short-term heat hasn’t been squeezed too excessively.
Observation level: 0.0125—0.0126
Trigger: after reclaiming 0.0128, if the pullback doesn’t break, then enter
Invalidation: a weak rebound that continues below 0.0123
Secondary watch: AIGENSYNUSDT moves very fast, but it’s already farther away from the moving average. I won’t chase it yet—I'll wait for a pullback.
Risk warning: In a continuing market, the biggest fear is a fake pullback and a fake repair. Before chasing, you must first check whether the key levels can be held. Today is more suitable for confirmation plays, not for betting on sentiment.
One sentence: I’ll prioritize watching for strong assets where the pullback can be held, and I won’t chase the hottest one.
769
That was sudden. Binance just added 10 bStocks as collateral.
The move comes as tokenized securities are increasingly being integrated into crypto infrastructure, and Binance’s latest update signals a shift in how margin trading is approached.
By accepting bStocks as collateral, the exchange is effectively opening the door for traders to use real-world assets in their leveraged positions - a step that could reshape the dynamics of margin trading on crypto platforms.
The broader market has been watching how tokenized assets are treated - and Binance’s move may set a precedent.
If this works, we could see more traditional financial instruments being used in crypto trading, blurring the lines between DeFi and traditional finance even further.
defense or offense - one word.
—
Not financial advice. DYOR.
📌 News Take · #97 · #CryptoNews #CryptoSighted
That was sudden. Binance just added 10 bStocks as collateral.
The move comes as tokenized securities are increasingly being integrated into crypto infrastructure, and Binance’s latest update signals a shift in how margin trading is approached.
By accepting bStocks as collateral, the exchange is effectively opening the door for traders to use real-world assets in their leveraged positions - a step that could reshape the dynamics of margin trading on crypto platforms.
The broader market has been watching how tokenized assets are treated - and Binance’s move may set a precedent.
If this works, we could see more traditional financial instruments being used in crypto trading, blurring the lines between DeFi and traditional finance even further.
defense or offense - one word.
—
Not financial advice. DYOR.
📌 News Take · #97 · #CryptoNews #CryptoSighted
The move comes as tokenized securities are increasingly being integrated into crypto infrastructure, and Binance’s latest update signals a shift in how margin trading is approached.
By accepting bStocks as collateral, the exchange is effectively opening the door for traders to use real-world assets in their leveraged positions - a step that could reshape the dynamics of margin trading on crypto platforms.
The broader market has been watching how tokenized assets are treated - and Binance’s move may set a precedent.
If this works, we could see more traditional financial instruments being used in crypto trading, blurring the lines between DeFi and traditional finance even further.
defense or offense - one word.
—
Not financial advice. DYOR.
📌 News Take · #97 · #CryptoNews #CryptoSighted
153
·
--
$LIT is still 72.55% away from the ATH. The number itself feels like a psychological firewall—some people think, “It’s already down more than 70%, so where else can it fall?” while others think, “It’s doubled from the lows—chasing now is just catching the bag.” Both thoughts aren’t wrong, but what ultimately determines your cost basis is the timing.
In the past 30 days it’s up 41%, but it fell 10% over 7 days, and then dropped another 6% in the last 24 hours. On July 11, $2.68 became the recent peak. Now it’s pulling back on shrinking volume to $2.16; trading volume has dropped from the peak of $150M to $24M. This isn’t panic selling. It’s more like after the momentum cools off, buy orders are waiting for the next narrative.
Market cap #97 at $539M—neither high nor low. Once tokens in this range lose momentum, liquidity can easily dry up.
What I care about most: the upside over the last 30 days has clear volume support, while during the pullback, volume is declining. That suggests smart money hasn’t broadly exited—but it’s also not rushing to add. If you’re waiting for “confirmation,” you may need to see the daily chart reclaim and hold above $2.3, with volume returning to $50M+. But if you enter early, around the current $2.15 area, you’re already near the relative lows of the past two weeks. The risk is that if it breaks below $2.0, support below becomes blurry.
The real disagreement is right here: do you wait and chase after a rebound with volume, or do you bet on a second push in this low-volume, drifting-down zone? The former is safer but you may miss the move; the latter offers better value but requires tolerating further pullbacks. There’s no standard answer—so ask yourself: if you place a buy order in the $2.0–$2.1 range, if it breaks below, would you stop-loss? Or would you add more?
$LIT is still 72.55% away from the ATH. The number itself feels like a psychological firewall—some people think, “It’s already down more than 70%, so where else can it fall?” while others think, “It’s doubled from the lows—chasing now is just catching the bag.” Both thoughts aren’t wrong, but what ultimately determines your cost basis is the timing.
In the past 30 days it’s up 41%, but it fell 10% over 7 days, and then dropped another 6% in the last 24 hours. On July 11, $2.68 became the recent peak. Now it’s pulling back on shrinking volume to $2.16; trading volume has dropped from the peak of $150M to $24M. This isn’t panic selling. It’s more like after the momentum cools off, buy orders are waiting for the next narrative.
Market cap #97 at $539M—neither high nor low. Once tokens in this range lose momentum, liquidity can easily dry up.
What I care about most: the upside over the last 30 days has clear volume support, while during the pullback, volume is declining. That suggests smart money hasn’t broadly exited—but it’s also not rushing to add. If you’re waiting for “confirmation,” you may need to see the daily chart reclaim and hold above $2.3, with volume returning to $50M+. But if you enter early, around the current $2.15 area, you’re already near the relative lows of the past two weeks. The risk is that if it breaks below $2.0, support below becomes blurry.
The real disagreement is right here: do you wait and chase after a rebound with volume, or do you bet on a second push in this low-volume, drifting-down zone? The former is safer but you may miss the move; the latter offers better value but requires tolerating further pullbacks. There’s no standard answer—so ask yourself: if you place a buy order in the $2.0–$2.1 range, if it breaks below, would you stop-loss? Or would you add more?
In the past 30 days it’s up 41%, but it fell 10% over 7 days, and then dropped another 6% in the last 24 hours. On July 11, $2.68 became the recent peak. Now it’s pulling back on shrinking volume to $2.16; trading volume has dropped from the peak of $150M to $24M. This isn’t panic selling. It’s more like after the momentum cools off, buy orders are waiting for the next narrative.
Market cap #97 at $539M—neither high nor low. Once tokens in this range lose momentum, liquidity can easily dry up.
What I care about most: the upside over the last 30 days has clear volume support, while during the pullback, volume is declining. That suggests smart money hasn’t broadly exited—but it’s also not rushing to add. If you’re waiting for “confirmation,” you may need to see the daily chart reclaim and hold above $2.3, with volume returning to $50M+. But if you enter early, around the current $2.15 area, you’re already near the relative lows of the past two weeks. The risk is that if it breaks below $2.0, support below becomes blurry.
The real disagreement is right here: do you wait and chase after a rebound with volume, or do you bet on a second push in this low-volume, drifting-down zone? The former is safer but you may miss the move; the latter offers better value but requires tolerating further pullbacks. There’s no standard answer—so ask yourself: if you place a buy order in the $2.0–$2.1 range, if it breaks below, would you stop-loss? Or would you add more?
83
·
--
$APT The current order book isn’t panic or opportunity—it’s liquidity slowly being drained. From $0.62 in mid-July to $0.566 now, it’s down about 5% over a month, which doesn’t look too bad. But trading volume has fallen steadily from $47M to $28M—this tells a bigger story than the price itself: neither bulls nor bears are willing to act at this level.
Down 97% from ATH, from $19.92 to $0.566—the distance has already crushed most people’s expectations. It used to be a star-chain, but now its market cap is $486M and it ranks #97; the market isn’t really willing to give it a clear role. This isn’t that $APT ’s fundamentals have collapsed—rather, its narrative hasn’t been updated in too long. Capital can’t find a reason to reprice it.
In the short term, $0.55 is the range repeatedly confirmed over the past month. If it breaks down on increased volume, the next support won’t have much historical reference. Conversely, if trading volume returns above $40M and there are sustained bids in the $0.58–$0.60 range, that would indicate capital is willing to step back in. Either path is possible—don’t pick a side too early.
What’s really trapping $APT isn’t whether $0.55 can hold—it’s that the old narrative has stopped working, and the new one hasn’t been written yet. The public-chain sector doesn’t lack performance anymore; what it lacks is a reason strong enough to make capital believe again.
$APT The current order book isn’t panic or opportunity—it’s liquidity slowly being drained. From $0.62 in mid-July to $0.566 now, it’s down about 5% over a month, which doesn’t look too bad. But trading volume has fallen steadily from $47M to $28M—this tells a bigger story than the price itself: neither bulls nor bears are willing to act at this level.
Down 97% from ATH, from $19.92 to $0.566—the distance has already crushed most people’s expectations. It used to be a star-chain, but now its market cap is $486M and it ranks #97; the market isn’t really willing to give it a clear role. This isn’t that $APT ’s fundamentals have collapsed—rather, its narrative hasn’t been updated in too long. Capital can’t find a reason to reprice it.
In the short term, $0.55 is the range repeatedly confirmed over the past month. If it breaks down on increased volume, the next support won’t have much historical reference. Conversely, if trading volume returns above $40M and there are sustained bids in the $0.58–$0.60 range, that would indicate capital is willing to step back in. Either path is possible—don’t pick a side too early.
What’s really trapping $APT isn’t whether $0.55 can hold—it’s that the old narrative has stopped working, and the new one hasn’t been written yet. The public-chain sector doesn’t lack performance anymore; what it lacks is a reason strong enough to make capital believe again.
Down 97% from ATH, from $19.92 to $0.566—the distance has already crushed most people’s expectations. It used to be a star-chain, but now its market cap is $486M and it ranks #97; the market isn’t really willing to give it a clear role. This isn’t that $APT ’s fundamentals have collapsed—rather, its narrative hasn’t been updated in too long. Capital can’t find a reason to reprice it.
In the short term, $0.55 is the range repeatedly confirmed over the past month. If it breaks down on increased volume, the next support won’t have much historical reference. Conversely, if trading volume returns above $40M and there are sustained bids in the $0.58–$0.60 range, that would indicate capital is willing to step back in. Either path is possible—don’t pick a side too early.
What’s really trapping $APT isn’t whether $0.55 can hold—it’s that the old narrative has stopped working, and the new one hasn’t been written yet. The public-chain sector doesn’t lack performance anymore; what it lacks is a reason strong enough to make capital believe again.
89
·
--
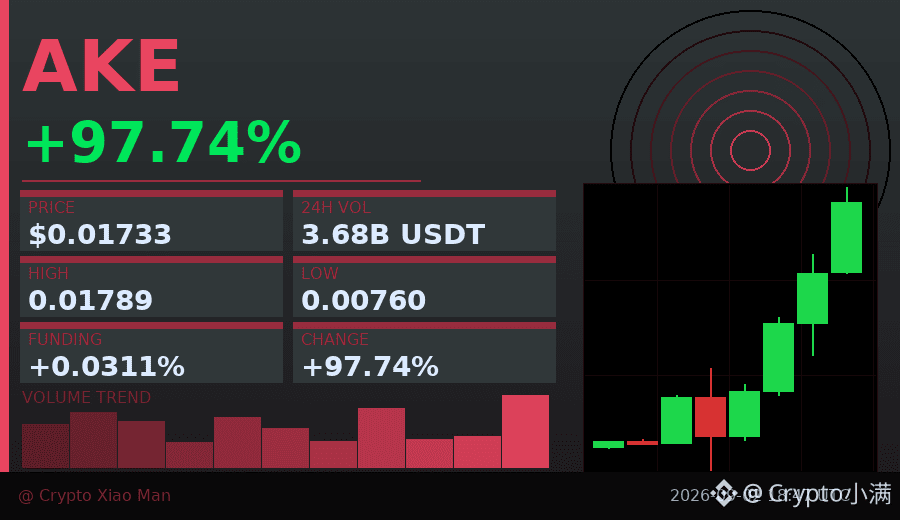
97% single-day rise, but the funding rate has already spiked to 0.031%—what does that mean?
Today, AKE moved from 0.0076 to 0.0173, with volume of 368 million USDT.
The hourly chart has been closing green in a row, looking very strong. But take a closer look at the long/short ratio:
69% are short, only 31% are long.
This kind of extreme disagreement usually happens in two situations: either shorts are being squeezed,
or the main players are luring longs. A high funding rate indicates that long leverage is already overcrowded.
I’d rather wait for a pullback and observe—chasing higher carries more risk than opportunity.
$AKE #资金费率预警 #97%涨幅
Click the small card below to quickly check the market 👇
97% single-day rise, but the funding rate has already spiked to 0.031%—what does that mean?
Today, AKE moved from 0.0076 to 0.0173, with volume of 368 million USDT.
The hourly chart has been closing green in a row, looking very strong. But take a closer look at the long/short ratio:
69% are short, only 31% are long.
This kind of extreme disagreement usually happens in two situations: either shorts are being squeezed,
or the main players are luring longs. A high funding rate indicates that long leverage is already overcrowded.
I’d rather wait for a pullback and observe—chasing higher carries more risk than opportunity.
$AKE #资金费率预警 #97%涨幅
Click the small card below to quickly check the market 👇
Today, AKE moved from 0.0076 to 0.0173, with volume of 368 million USDT.
The hourly chart has been closing green in a row, looking very strong. But take a closer look at the long/short ratio:
69% are short, only 31% are long.
This kind of extreme disagreement usually happens in two situations: either shorts are being squeezed,
or the main players are luring longs. A high funding rate indicates that long leverage is already overcrowded.
I’d rather wait for a pullback and observe—chasing higher carries more risk than opportunity.
$AKE #资金费率预警 #97%涨幅
Click the small card below to quickly check the market 👇
278
Log in to explore more content
Join global crypto users on Binance Square
⚡️ Get latest and useful information about crypto.
💬 Trusted by the world’s largest crypto exchange.
👍 Discover real insights from verified creators.
Email / Phone number
Trending Topics
1
#BinanceLaunchesBinanceIntelligence
298,237 views
2,553 Discussing
2
#BitcoinTargets2026OpenAt$87570
727 views
42 Discussing
3
#BitcoinRejectedAt$87KThirdTime
900 views
43 Discussing
4
#StrategyMarketCapSurpassesRumble
2,899 views
210 Discussing
5
#StriveBuys2000BTCFor$169M
12,141 views
114 Discussing
6
#EvernorthXRPTreasuryCompletesSPACMerger
145,931 views
1,440 Discussing
7
#ADAGains10%Above$0.27
59,125 views
256 Discussing
8
#ETHUp70%InQ3ButLiquidityFalls
340,583 views
2,422 Discussing
9
#EthStakingExitQueueHits2026High
138,260 views
1,611 Discussing
10
#FedOctoberHoldOdds82.3%
147,419 views
1,519 Discussing