

#65
65
7,921 views
50 Discussing
Hot
Latest

·
--
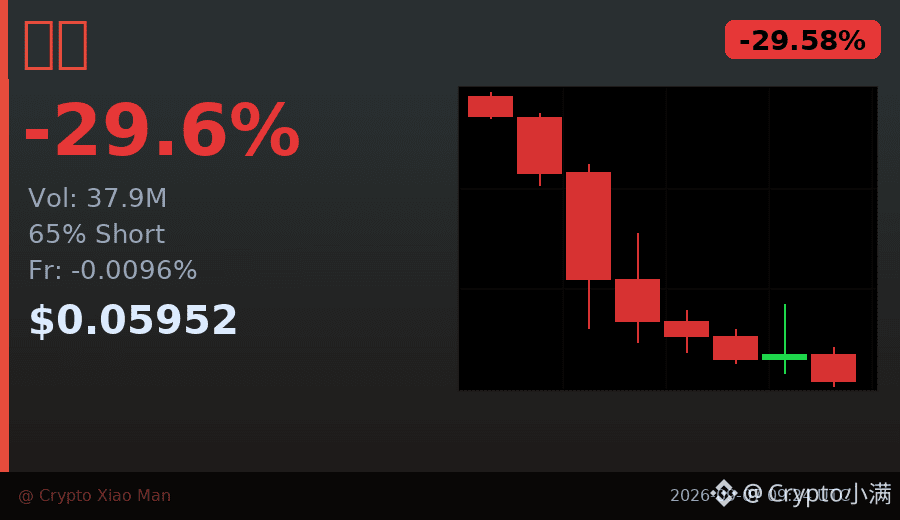
65% of people are shorting, but the drop is already approaching 30%—the LOBSTER token is staging a typical case of “crowded trading.”
Over the past 8 hours, the price has been smashed from 0.085 down to 0.0595, while trading volume has surged to 37.9 million USDT.
The funding rate has flipped negative to -0.0096%, indicating that shorts are starting to pay longs.
With such extreme sentiment, it’s either continued sell-off liquidations or a sudden rebound that liquidates both sides.
I prefer to wait for a clear stabilization signal rather than guessing the bottom right now.
$Lobster #拥挤交易 #65% Short
Click the small card below to quickly check the market 👇
65% of people are shorting, but the drop is already approaching 30%—the LOBSTER token is staging a typical case of “crowded trading.”
Over the past 8 hours, the price has been smashed from 0.085 down to 0.0595, while trading volume has surged to 37.9 million USDT.
The funding rate has flipped negative to -0.0096%, indicating that shorts are starting to pay longs.
With such extreme sentiment, it’s either continued sell-off liquidations or a sudden rebound that liquidates both sides.
I prefer to wait for a clear stabilization signal rather than guessing the bottom right now.
$Lobster #拥挤交易 #65% Short
Click the small card below to quickly check the market 👇
Over the past 8 hours, the price has been smashed from 0.085 down to 0.0595, while trading volume has surged to 37.9 million USDT.
The funding rate has flipped negative to -0.0096%, indicating that shorts are starting to pay longs.
With such extreme sentiment, it’s either continued sell-off liquidations or a sudden rebound that liquidates both sides.
I prefer to wait for a clear stabilization signal rather than guessing the bottom right now.
$Lobster #拥挤交易 #65% Short
Click the small card below to quickly check the market 👇
61

·
--
$EGLD This location is a bit interesting.
In 15m, it surged 1.45%, and the volume directly hit 2.99x. The Z value is 2.45, and the closing price broke above the upper boundary of the past ~20 5m candles. Active order imbalance is -41.8%, and the buy/sell ratio is 2.44—not eaten out by passive orders, but actively bought up.
More importantly, it’s the OI. In 15m, +0.38%; in 1h, +1.16%. Nominal change is 4.72%, abnormal percentile 97.4%, and the pool’s abnormal count is #4. Across multiple consecutive cycles, OI is stacking while price is also rising—this is a classic structure of new leveraged long entries, not short-covering pushing.
The funding rate is already at a recent high percentile. This signal has two sides: on one hand, it indicates strong long sentiment and good follow-through; on the other, it means that if price stalls, the funding premium is the first bubble to get squeezed.
The 24h turnover is 13.68M—not a large pool. OI nominal change ranks #65, but the abnormal percentile jumps to #4—showing the absolute size isn’t huge, yet relative to its own history it’s extremely stretched, nearing the edge of its historical range.
Overall a bullish structure, but we’ve entered the stage where you need to closely watch the funding rate and the closing/position-reduction rhythm. When it rallies too smoothly, it’s often when leverage is the most crowded.
$EGLD This location is a bit interesting.
In 15m, it surged 1.45%, and the volume directly hit 2.99x. The Z value is 2.45, and the closing price broke above the upper boundary of the past ~20 5m candles. Active order imbalance is -41.8%, and the buy/sell ratio is 2.44—not eaten out by passive orders, but actively bought up.
More importantly, it’s the OI. In 15m, +0.38%; in 1h, +1.16%. Nominal change is 4.72%, abnormal percentile 97.4%, and the pool’s abnormal count is #4. Across multiple consecutive cycles, OI is stacking while price is also rising—this is a classic structure of new leveraged long entries, not short-covering pushing.
The funding rate is already at a recent high percentile. This signal has two sides: on one hand, it indicates strong long sentiment and good follow-through; on the other, it means that if price stalls, the funding premium is the first bubble to get squeezed.
The 24h turnover is 13.68M—not a large pool. OI nominal change ranks #65, but the abnormal percentile jumps to #4—showing the absolute size isn’t huge, yet relative to its own history it’s extremely stretched, nearing the edge of its historical range.
Overall a bullish structure, but we’ve entered the stage where you need to closely watch the funding rate and the closing/position-reduction rhythm. When it rallies too smoothly, it’s often when leverage is the most crowded.
In 15m, it surged 1.45%, and the volume directly hit 2.99x. The Z value is 2.45, and the closing price broke above the upper boundary of the past ~20 5m candles. Active order imbalance is -41.8%, and the buy/sell ratio is 2.44—not eaten out by passive orders, but actively bought up.
More importantly, it’s the OI. In 15m, +0.38%; in 1h, +1.16%. Nominal change is 4.72%, abnormal percentile 97.4%, and the pool’s abnormal count is #4. Across multiple consecutive cycles, OI is stacking while price is also rising—this is a classic structure of new leveraged long entries, not short-covering pushing.
The funding rate is already at a recent high percentile. This signal has two sides: on one hand, it indicates strong long sentiment and good follow-through; on the other, it means that if price stalls, the funding premium is the first bubble to get squeezed.
The 24h turnover is 13.68M—not a large pool. OI nominal change ranks #65, but the abnormal percentile jumps to #4—showing the absolute size isn’t huge, yet relative to its own history it’s extremely stretched, nearing the edge of its historical range.
Overall a bullish structure, but we’ve entered the stage where you need to closely watch the funding rate and the closing/position-reduction rhythm. When it rallies too smoothly, it’s often when leverage is the most crowded.

·
--
** How Can You Make Profit with Binance Square’s Daily Top-Movers? 📈Arbitrum (ARBUSDT) is trending right now!
Rank: #65
** ### Step 1 – Find the “Stars of the Day” **Why is it important?** Coins with the highest %24 change and volume offer volatility and liquidity → ideal for short- and medium-term strategies. **How do you do it?** - Go to the **“Top Movers”** tab on the Binance Square homepage. - Check the 24-hour % change and trading volume. **Example (09-18-2026):** | Symbol | Price | %24 Change | 24h Volume (USDT) | |--------|------------|------------|------------------| | | **8.729** | **+26.09 %** | **216 M** | | | **3.514** | **+21.63 %** | **349 M** | | | **1.127** | **+9.10 %** | **17 M** | 💡 **Visual hint:** In these coins, you often see **“Bull Flag”** (rising flag) and **“Ascending Triangle”** (ascending triangle) formations on the price chart. --- ### Step 2 – Verify Volume & Price Analysis **Why is it important?** High volume indicates that the price move reflects a real change in supply/demand; it reduces the risk of a fake “pump-and-dump.” **How do you do it?** - Enter the coin’s **“Trade”** page and review the **Volume** bar (volume). - Check the difference between **Weighted Avg Price** and **Open–High–Low**. **Example:** - Open: **6.923 USDT**, High: **9.440 USDT**, Low: **6.817 USDT** - Average price (**Weighted Avg**) = **8.162 USDT** → price is close to the average, meaning trading is balanced. **Visual hint:** If the volume bar shows a **“Volume Spike”** (volume surge) alongside the price increase, this
** How Can You Make Profit with Binance Square’s Daily Top-Movers? 📈
Arbitrum (ARBUSDT) is trending right now!
Rank: #65
** ### Step 1 – Find the “Stars of the Day” **Why is it important?** Coins with the highest %24 change and volume offer volatility and liquidity → ideal for short- and medium-term strategies. **How do you do it?** - Go to the **“Top Movers”** tab on the Binance Square homepage. - Check the 24-hour % change and trading volume. **Example (09-18-2026):** | Symbol | Price | %24 Change | 24h Volume (USDT) | |--------|------------|------------|------------------| | | **8.729** | **+26.09 %** | **216 M** | | | **3.514** | **+21.63 %** | **349 M** | | | **1.127** | **+9.10 %** | **17 M** | 💡 **Visual hint:** In these coins, you often see **“Bull Flag”** (rising flag) and **“Ascending Triangle”** (ascending triangle) formations on the price chart. --- ### Step 2 – Verify Volume & Price Analysis **Why is it important?** High volume indicates that the price move reflects a real change in supply/demand; it reduces the risk of a fake “pump-and-dump.” **How do you do it?** - Enter the coin’s **“Trade”** page and review the **Volume** bar (volume). - Check the difference between **Weighted Avg Price** and **Open–High–Low**. **Example:** - Open: **6.923 USDT**, High: **9.440 USDT**, Low: **6.817 USDT** - Average price (**Weighted Avg**) = **8.162 USDT** → price is close to the average, meaning trading is balanced. **Visual hint:** If the volume bar shows a **“Volume Spike”** (volume surge) alongside the price increase, this
Rank: #65
** ### Step 1 – Find the “Stars of the Day” **Why is it important?** Coins with the highest %24 change and volume offer volatility and liquidity → ideal for short- and medium-term strategies. **How do you do it?** - Go to the **“Top Movers”** tab on the Binance Square homepage. - Check the 24-hour % change and trading volume. **Example (09-18-2026):** | Symbol | Price | %24 Change | 24h Volume (USDT) | |--------|------------|------------|------------------| | | **8.729** | **+26.09 %** | **216 M** | | | **3.514** | **+21.63 %** | **349 M** | | | **1.127** | **+9.10 %** | **17 M** | 💡 **Visual hint:** In these coins, you often see **“Bull Flag”** (rising flag) and **“Ascending Triangle”** (ascending triangle) formations on the price chart. --- ### Step 2 – Verify Volume & Price Analysis **Why is it important?** High volume indicates that the price move reflects a real change in supply/demand; it reduces the risk of a fake “pump-and-dump.” **How do you do it?** - Enter the coin’s **“Trade”** page and review the **Volume** bar (volume). - Check the difference between **Weighted Avg Price** and **Open–High–Low**. **Example:** - Open: **6.923 USDT**, High: **9.440 USDT**, Low: **6.817 USDT** - Average price (**Weighted Avg**) = **8.162 USDT** → price is close to the average, meaning trading is balanced. **Visual hint:** If the volume bar shows a **“Volume Spike”** (volume surge) alongside the price increase, this
52
·
--
Crypto Market UpdateVenice Token (VVVUSDT) is trending right now!
Rank: #65
BIG PUMP ALERT! 🚀 NEARUSDT is MOONING with a **14.5% surge** to .615! I'm loving the momentum in , but is it sustainable? 🤔 also pumping hard with an **11.1% gain** to .946. Meanwhile, is up **8.8%** to .182. What's driving this altcoin rally? Is it a sign of a broader market trend? 💡
#bitcoin #ethereum #crypto
Crypto Market Update
Venice Token (VVVUSDT) is trending right now!
Rank: #65
BIG PUMP ALERT! 🚀 NEARUSDT is MOONING with a **14.5% surge** to .615! I'm loving the momentum in , but is it sustainable? 🤔 also pumping hard with an **11.1% gain** to .946. Meanwhile, is up **8.8%** to .182. What's driving this altcoin rally? Is it a sign of a broader market trend? 💡
#bitcoin #ethereum #crypto
Rank: #65
BIG PUMP ALERT! 🚀 NEARUSDT is MOONING with a **14.5% surge** to .615! I'm loving the momentum in , but is it sustainable? 🤔 also pumping hard with an **11.1% gain** to .946. Meanwhile, is up **8.8%** to .182. What's driving this altcoin rally? Is it a sign of a broader market trend? 💡
#bitcoin #ethereum #crypto
92
·
--
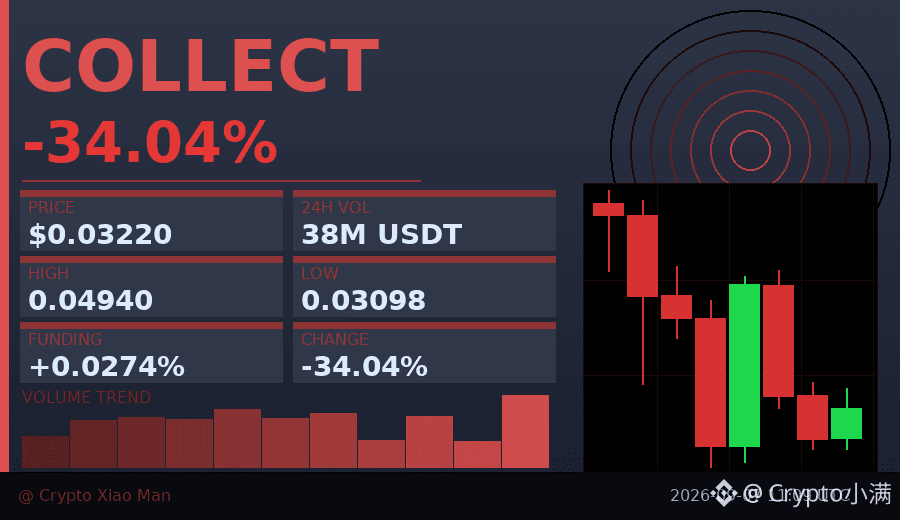
34% drop in range, but the funding rate is still positive—kind of interesting.
COLLECT Today they smashed it from 0.0494 all the way down to 0.031, and the trading volume of 38M USDT isn’t small.
The key point is that longs account for 65%, meaning many people are still betting on a rebound.
But over the last 8-hour candles, price has been weakening—each rebound gets pushed back down.
In this kind of situation, I usually wait: either a breakout above 0.035 with increased volume, or a breakdown below 0.031 to watch for acceleration.
Right now it’s stuck in the middle—when longs get more crowded, the more likely it is for longs to slaughter each other.
$COLLECT #资金费率 #65% Longs
Click the small card below to quickly check the market 👇
34% drop in range, but the funding rate is still positive—kind of interesting.
COLLECT Today they smashed it from 0.0494 all the way down to 0.031, and the trading volume of 38M USDT isn’t small.
The key point is that longs account for 65%, meaning many people are still betting on a rebound.
But over the last 8-hour candles, price has been weakening—each rebound gets pushed back down.
In this kind of situation, I usually wait: either a breakout above 0.035 with increased volume, or a breakdown below 0.031 to watch for acceleration.
Right now it’s stuck in the middle—when longs get more crowded, the more likely it is for longs to slaughter each other.
$COLLECT #资金费率 #65% Longs
Click the small card below to quickly check the market 👇
COLLECT Today they smashed it from 0.0494 all the way down to 0.031, and the trading volume of 38M USDT isn’t small.
The key point is that longs account for 65%, meaning many people are still betting on a rebound.
But over the last 8-hour candles, price has been weakening—each rebound gets pushed back down.
In this kind of situation, I usually wait: either a breakout above 0.035 with increased volume, or a breakdown below 0.031 to watch for acceleration.
Right now it’s stuck in the middle—when longs get more crowded, the more likely it is for longs to slaughter each other.
$COLLECT #资金费率 #65% Longs
Click the small card below to quickly check the market 👇
165
·
--
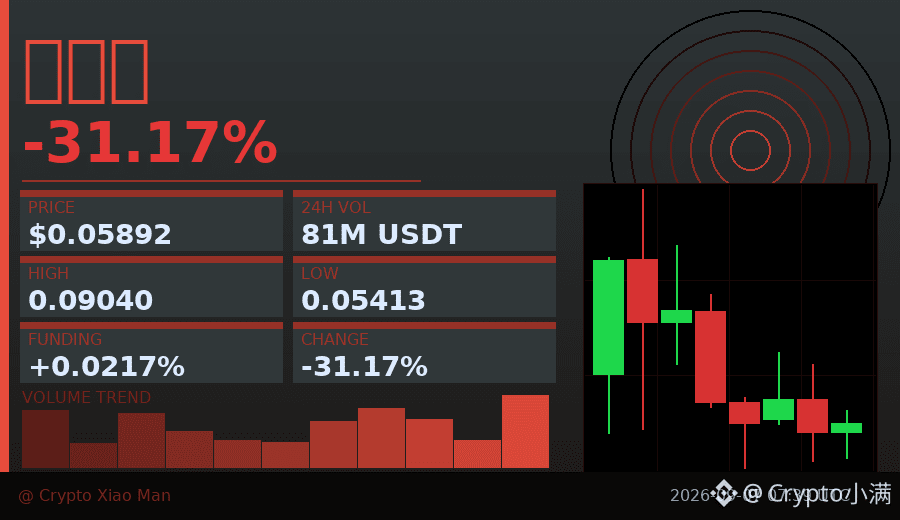
65% of people are going long, but the price has fallen 31% — Hakimi just staged a classic "crowded trade" today.
Trading volume of 80.9 million USDT is not small, but the funding rate is only 0.021%, indicating that bullish enthusiasm has clearly cooled off.
From the candlestick chart, the overall trend weakened within 8 hours, with highs sliding all the way from 0.09 to around 0.058.
This kind of pattern with long wicks + continued pullback is usually short-term profit-taking exiting the market.
If trading volume cannot expand again later, the rebound may be relatively weak.
$Hakimi #拥挤交易 #65% longs
Click the card below to quickly view the market👇
65% of people are going long, but the price has fallen 31% — Hakimi just staged a classic "crowded trade" today.
Trading volume of 80.9 million USDT is not small, but the funding rate is only 0.021%, indicating that bullish enthusiasm has clearly cooled off.
From the candlestick chart, the overall trend weakened within 8 hours, with highs sliding all the way from 0.09 to around 0.058.
This kind of pattern with long wicks + continued pullback is usually short-term profit-taking exiting the market.
If trading volume cannot expand again later, the rebound may be relatively weak.
$Hakimi #拥挤交易 #65% longs
Click the card below to quickly view the market👇
Trading volume of 80.9 million USDT is not small, but the funding rate is only 0.021%, indicating that bullish enthusiasm has clearly cooled off.
From the candlestick chart, the overall trend weakened within 8 hours, with highs sliding all the way from 0.09 to around 0.058.
This kind of pattern with long wicks + continued pullback is usually short-term profit-taking exiting the market.
If trading volume cannot expand again later, the rebound may be relatively weak.
$Hakimi #拥挤交易 #65% longs
Click the card below to quickly view the market👇
266
·
--
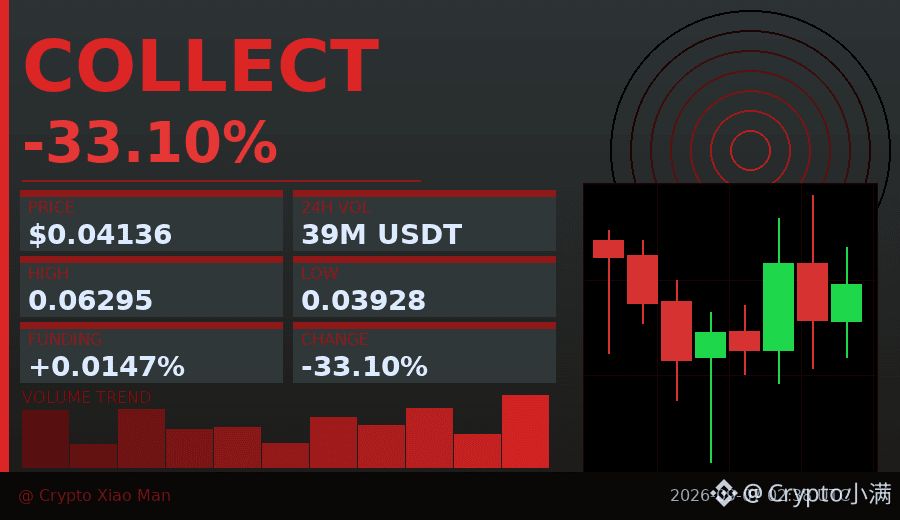
33% drop, but funding rate is still in positive territory?
COLLECT fell from 0.063 to 0.041 today, with trading volume approaching 40M USDT. Such a sharp drop usually forces longs to cut losses and exit, but the current funding rate is still +0.0147%, which means some traders are still willing to pay interest to hold long positions.
The long/short ratio is 65% to 35%, with longs clearly in the lead. The candlestick chart shows short-term consolidation between 0.039 and 0.042. If this range fails to hold, there could be another accelerated leg down.
My view: sharp drop + positive funding rate + crowded longs = a high-risk combination. Chasing a rebound here requires extra caution; wait until the funding rate turns negative or the price stabilizes before acting.
$COLLECT #资金费率 #65% longs
Click the small card below to quickly view the market👇
33% drop, but funding rate is still in positive territory?
COLLECT fell from 0.063 to 0.041 today, with trading volume approaching 40M USDT. Such a sharp drop usually forces longs to cut losses and exit, but the current funding rate is still +0.0147%, which means some traders are still willing to pay interest to hold long positions.
The long/short ratio is 65% to 35%, with longs clearly in the lead. The candlestick chart shows short-term consolidation between 0.039 and 0.042. If this range fails to hold, there could be another accelerated leg down.
My view: sharp drop + positive funding rate + crowded longs = a high-risk combination. Chasing a rebound here requires extra caution; wait until the funding rate turns negative or the price stabilizes before acting.
$COLLECT #资金费率 #65% longs
Click the small card below to quickly view the market👇
COLLECT fell from 0.063 to 0.041 today, with trading volume approaching 40M USDT. Such a sharp drop usually forces longs to cut losses and exit, but the current funding rate is still +0.0147%, which means some traders are still willing to pay interest to hold long positions.
The long/short ratio is 65% to 35%, with longs clearly in the lead. The candlestick chart shows short-term consolidation between 0.039 and 0.042. If this range fails to hold, there could be another accelerated leg down.
My view: sharp drop + positive funding rate + crowded longs = a high-risk combination. Chasing a rebound here requires extra caution; wait until the funding rate turns negative or the price stabilizes before acting.
$COLLECT #资金费率 #65% longs
Click the small card below to quickly view the market👇
140
·
--
** NEAR rockets 11.5% while ETH sneaks past .5K!Arbitrum (ARBUSDT) is trending right now!
Rank: #65
** 🚀 **NEAR just exploded +11.5%** to .433 in the last 24h – the biggest mover on Binance! is humming too, **up +1.47%** to ,517.18, while surged **+10.27%** to 3.285 and pumped **+7.95%** to /bin/sh.991. I’m seeing a fresh DeFi inflow, especially into Layer‑1s and oracle tech – could be the start of a broader alt
#bitcoin #ethereum #crypto
** NEAR rockets 11.5% while ETH sneaks past .5K!
Arbitrum (ARBUSDT) is trending right now!
Rank: #65
** 🚀 **NEAR just exploded +11.5%** to .433 in the last 24h – the biggest mover on Binance! is humming too, **up +1.47%** to ,517.18, while surged **+10.27%** to 3.285 and pumped **+7.95%** to /bin/sh.991. I’m seeing a fresh DeFi inflow, especially into Layer‑1s and oracle tech – could be the start of a broader alt
#bitcoin #ethereum #crypto
Rank: #65
** 🚀 **NEAR just exploded +11.5%** to .433 in the last 24h – the biggest mover on Binance! is humming too, **up +1.47%** to ,517.18, while surged **+10.27%** to 3.285 and pumped **+7.95%** to /bin/sh.991. I’m seeing a fresh DeFi inflow, especially into Layer‑1s and oracle tech – could be the start of a broader alt
#bitcoin #ethereum #crypto
181

·
--
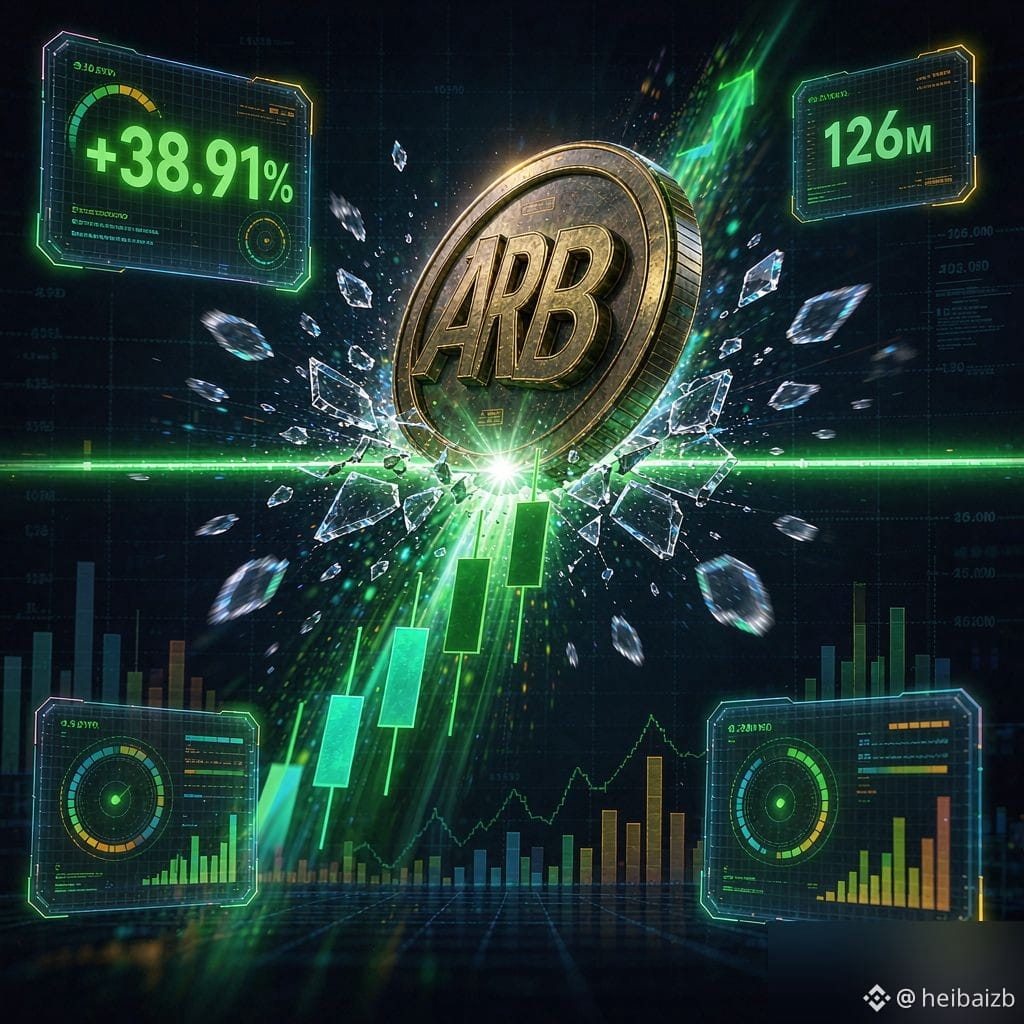
$ARB +38.91% / 24h volume 126M / current price $0.1885, CoinGecko trending board #65 moved onto the list.
24h range $0.1343 → $0.2066, **amplitude 53.8%**, now pulled back to the 0.188 midpoint — a typical **post-pump main-force rotation structure**, not a one-way squeeze.
Key structure: overhead trapped supply above 0.20 is heavy (high-volume at the 24h high of 0.2066), while 0.145-0.16 below is dense trading support. **Only holding above 0.20 counts as trend confirmation**; if 0.16 breaks, this wave is invalid.
$ARB is the L2 narrative laggard leader, strengthening independently of $BTC , just like $ZEC . Watch for the move that breaks above 0.20 on volume.
#数据视角 #行情播报 #fund flows
$ARB +38.91% / 24h volume 126M / current price $0.1885, CoinGecko trending board #65 moved onto the list.
24h range $0.1343 → $0.2066, **amplitude 53.8%**, now pulled back to the 0.188 midpoint — a typical **post-pump main-force rotation structure**, not a one-way squeeze.
Key structure: overhead trapped supply above 0.20 is heavy (high-volume at the 24h high of 0.2066), while 0.145-0.16 below is dense trading support. **Only holding above 0.20 counts as trend confirmation**; if 0.16 breaks, this wave is invalid.
$ARB is the L2 narrative laggard leader, strengthening independently of $BTC , just like $ZEC . Watch for the move that breaks above 0.20 on volume.
#数据视角 #行情播报 #fund flows
24h range $0.1343 → $0.2066, **amplitude 53.8%**, now pulled back to the 0.188 midpoint — a typical **post-pump main-force rotation structure**, not a one-way squeeze.
Key structure: overhead trapped supply above 0.20 is heavy (high-volume at the 24h high of 0.2066), while 0.145-0.16 below is dense trading support. **Only holding above 0.20 counts as trend confirmation**; if 0.16 breaks, this wave is invalid.
$ARB is the L2 narrative laggard leader, strengthening independently of $BTC , just like $ZEC . Watch for the move that breaks above 0.20 on volume.
#数据视角 #行情播报 #fund flows
1
239
·
--
UNI Rockets 12.5% – DeFi’s Next Moonshot?Arbitrum (ARBUSDT) is trending right now!
Rank: #65
🚨 UNI just exploded **12.458%** to **.032** in 24h – the hottest mover on Binance! Meanwhile pumped **1.723%** to **,501.41**, and nudged up **3.83%** to **07.07**. is flat, but the alt‑season vibe is unmistakable.
#bitcoin #ethereum #crypto
UNI Rockets 12.5% – DeFi’s Next Moonshot?
1
9
·
--
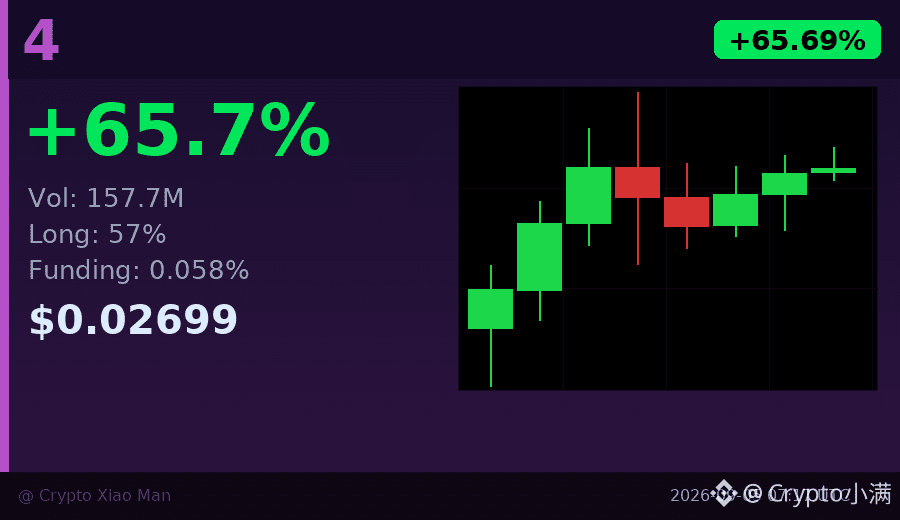
Behind the 65% surge, the funding rate has quietly risen to 0.058%—longs are paying up to compete for entries.
With $158 million in trading volume and three consecutive hourly bullish candles, the momentum looks strong. But the 57% long-side share shows the crowd is already leaning one way, so chasing the move here calls for caution.
In this kind of setup, I usually wait for two signals: either the funding rate pulls back while price keeps breaking higher; or there’s a clear sign of rising volume with stalled price action. Right now, it looks more like an acceleration phase driven by sentiment.
$4 #资金费率预警 #65%
Tap the small card below to quickly check the market 👇
Behind the 65% surge, the funding rate has quietly risen to 0.058%—longs are paying up to compete for entries.
With $158 million in trading volume and three consecutive hourly bullish candles, the momentum looks strong. But the 57% long-side share shows the crowd is already leaning one way, so chasing the move here calls for caution.
In this kind of setup, I usually wait for two signals: either the funding rate pulls back while price keeps breaking higher; or there’s a clear sign of rising volume with stalled price action. Right now, it looks more like an acceleration phase driven by sentiment.
$4 #资金费率预警 #65%
Tap the small card below to quickly check the market 👇
With $158 million in trading volume and three consecutive hourly bullish candles, the momentum looks strong. But the 57% long-side share shows the crowd is already leaning one way, so chasing the move here calls for caution.
In this kind of setup, I usually wait for two signals: either the funding rate pulls back while price keeps breaking higher; or there’s a clear sign of rising volume with stalled price action. Right now, it looks more like an acceleration phase driven by sentiment.
$4 #资金费率预警 #65%
Tap the small card below to quickly check the market 👇
13
·
--
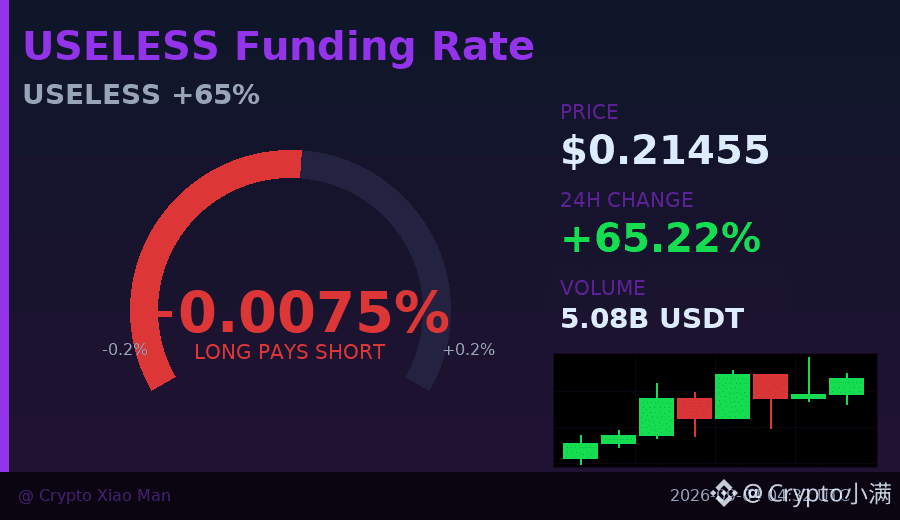
65% gain, but the funding rate is only 0.0075% — what does that mean?
USELESS surged from 0.13 to 0.21 today, with trading volume hitting $508 million.
The hourly candlesticks have closed green in a row, looking really strong, right?
But look at the long/short ratio: 42% long vs 58% short.
Most people are still short, thinking this is a false breakout.
This kind of disagreement is often when the market gets most interesting.
If the price keeps moving up, short sellers may be forced to cover, accelerating the rise.
I'm watching 0.22, the previous high, and will reassess if it breaks out.
$USELESS # meme surge #65%
Click the small card below to quickly check the market 👇
65% gain, but the funding rate is only 0.0075% — what does that mean?
USELESS surged from 0.13 to 0.21 today, with trading volume hitting $508 million.
The hourly candlesticks have closed green in a row, looking really strong, right?
But look at the long/short ratio: 42% long vs 58% short.
Most people are still short, thinking this is a false breakout.
This kind of disagreement is often when the market gets most interesting.
If the price keeps moving up, short sellers may be forced to cover, accelerating the rise.
I'm watching 0.22, the previous high, and will reassess if it breaks out.
$USELESS # meme surge #65%
Click the small card below to quickly check the market 👇
USELESS surged from 0.13 to 0.21 today, with trading volume hitting $508 million.
The hourly candlesticks have closed green in a row, looking really strong, right?
But look at the long/short ratio: 42% long vs 58% short.
Most people are still short, thinking this is a false breakout.
This kind of disagreement is often when the market gets most interesting.
If the price keeps moving up, short sellers may be forced to cover, accelerating the rise.
I'm watching 0.22, the previous high, and will reassess if it breaks out.
$USELESS # meme surge #65%
Click the small card below to quickly check the market 👇
10
·
--
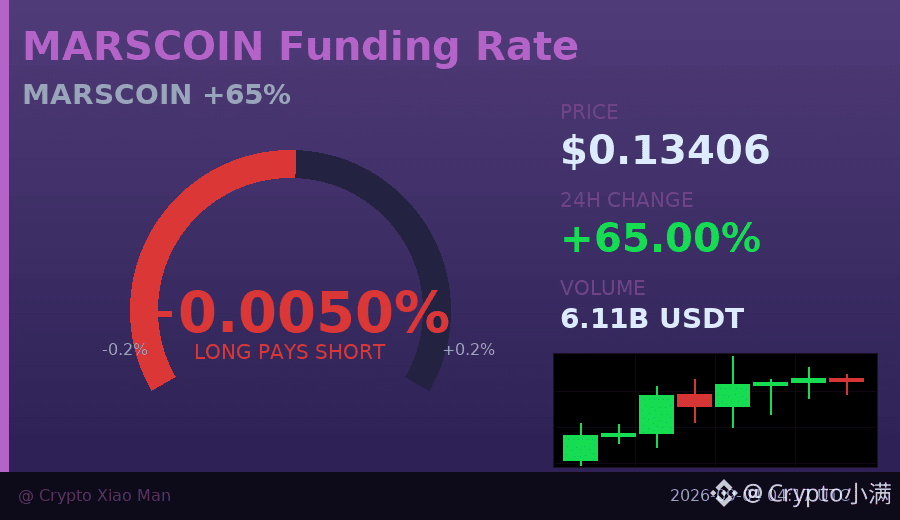
Behind the 65% surge in MARSCOIN, are the shorts even more than the longs?
MARSCOIN is up 65% today, with the price surging to $0.134 and trading volume of 610 million U. But interestingly, the open-position data shows 56% are short positions, while only 44% are long positions.
With the price rallying hard, shorts keep piling up more—doesn’t this look like a typical short-squeeze setup? The hourly chart has seen three consecutive bullish candles, and buying pressure is still ongoing.
If the shorts keep adding while the price doesn’t drop, they’ll eventually have to cover and admit defeat, which would further push the price higher. Of course, if longs take profits, a pullback could also happen quickly.
I’m watching this long–short divergence, waiting for the direction to become clearer.
$MARSCOIN #逼空行情 #65%
Click the small card below to quickly check the market 👇
Behind the 65% surge in MARSCOIN, are the shorts even more than the longs?
MARSCOIN is up 65% today, with the price surging to $0.134 and trading volume of 610 million U. But interestingly, the open-position data shows 56% are short positions, while only 44% are long positions.
With the price rallying hard, shorts keep piling up more—doesn’t this look like a typical short-squeeze setup? The hourly chart has seen three consecutive bullish candles, and buying pressure is still ongoing.
If the shorts keep adding while the price doesn’t drop, they’ll eventually have to cover and admit defeat, which would further push the price higher. Of course, if longs take profits, a pullback could also happen quickly.
I’m watching this long–short divergence, waiting for the direction to become clearer.
$MARSCOIN #逼空行情 #65%
Click the small card below to quickly check the market 👇
MARSCOIN is up 65% today, with the price surging to $0.134 and trading volume of 610 million U. But interestingly, the open-position data shows 56% are short positions, while only 44% are long positions.
With the price rallying hard, shorts keep piling up more—doesn’t this look like a typical short-squeeze setup? The hourly chart has seen three consecutive bullish candles, and buying pressure is still ongoing.
If the shorts keep adding while the price doesn’t drop, they’ll eventually have to cover and admit defeat, which would further push the price higher. Of course, if longs take profits, a pullback could also happen quickly.
I’m watching this long–short divergence, waiting for the direction to become clearer.
$MARSCOIN #逼空行情 #65%
Click the small card below to quickly check the market 👇
3
·
--
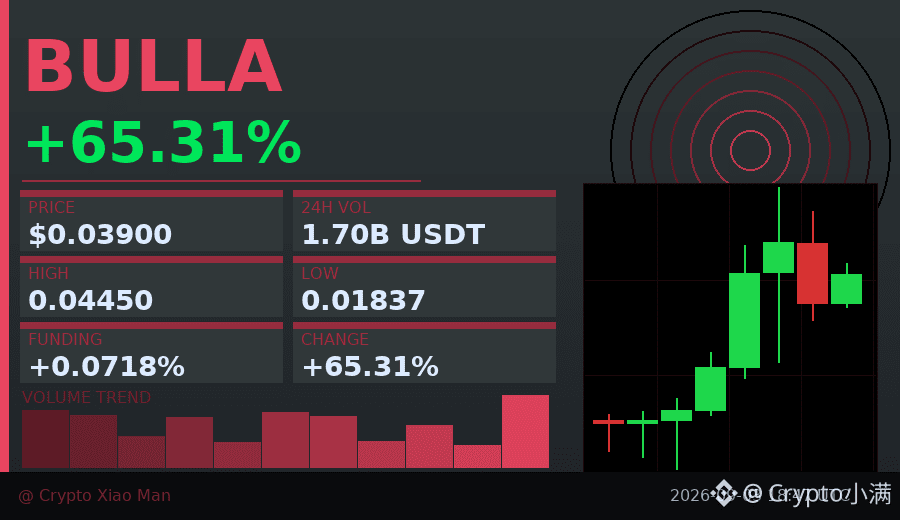
Behind the 65% surge, the funding rate has quietly risen to 0.07%—meaning longs are paying a considerable cost for their positions.
BULLA has indeed been strong over these 8 hours, rallying from 0.029 up to 0.0445, with trading volume reaching 170 million USDT. But now the long-to-short ratio is 51% vs. 49%, nearly a tie.
In other words, the price has risen a lot, but everyone is not unanimously bullish. A high funding rate + balanced positioning like this often signals that short-term volatility will increase.
If you’ve already entered, watch for support around 0.036; if you want to enter, waiting for the funding rate to pull back may be safer.
$BULLA #资金费率预警 #65%
Click the small card below to quickly view the market trend👇
Behind the 65% surge, the funding rate has quietly risen to 0.07%—meaning longs are paying a considerable cost for their positions.
BULLA has indeed been strong over these 8 hours, rallying from 0.029 up to 0.0445, with trading volume reaching 170 million USDT. But now the long-to-short ratio is 51% vs. 49%, nearly a tie.
In other words, the price has risen a lot, but everyone is not unanimously bullish. A high funding rate + balanced positioning like this often signals that short-term volatility will increase.
If you’ve already entered, watch for support around 0.036; if you want to enter, waiting for the funding rate to pull back may be safer.
$BULLA #资金费率预警 #65%
Click the small card below to quickly view the market trend👇
BULLA has indeed been strong over these 8 hours, rallying from 0.029 up to 0.0445, with trading volume reaching 170 million USDT. But now the long-to-short ratio is 51% vs. 49%, nearly a tie.
In other words, the price has risen a lot, but everyone is not unanimously bullish. A high funding rate + balanced positioning like this often signals that short-term volatility will increase.
If you’ve already entered, watch for support around 0.036; if you want to enter, waiting for the funding rate to pull back may be safer.
$BULLA #资金费率预警 #65%
Click the small card below to quickly view the market trend👇
45
·
--
Behind the 36% surge, longs have already taken up 65%.
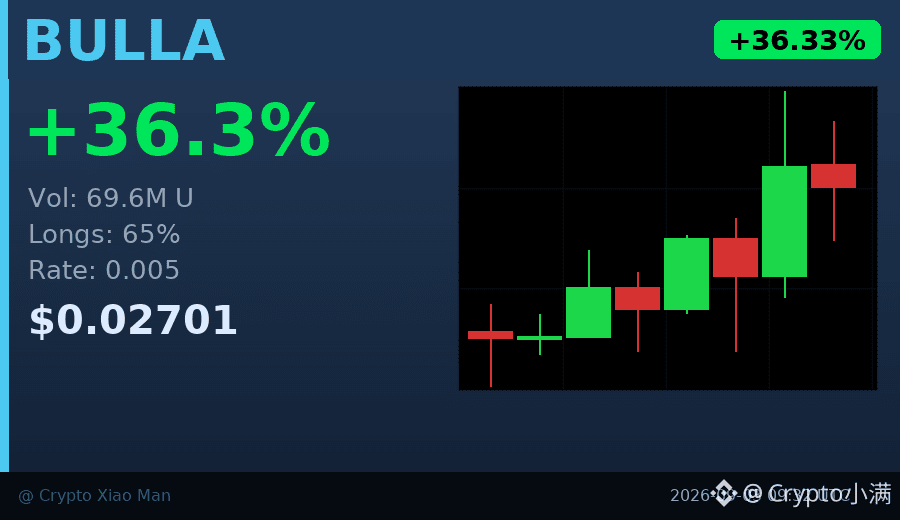
BULLA has moved pretty decisively over these 8 hours—rising all the way from around 0.018 to 0.027, with volume reaching 69.6 million U. The funding rate is still only 0.005, suggesting this rally hasn’t triggered overly crowded leverage.
But the long/short ratio of 65:35 is a signal—most people have already sided with the bulls. If the price can hold above 0.025, sentiment may continue to push higher. If it breaks below, short-term profit-takers could run pretty fast.
I’ll watch the order-book strength at 0.025 and 0.029. I won’t chase; I’ll wait for a pullback and confirmation.
$BULLA #强势突破 #65% Longs’ share
Click the small card below to quickly check the market trend👇
Behind the 36% surge, longs have already taken up 65%.
BULLA has moved pretty decisively over these 8 hours—rising all the way from around 0.018 to 0.027, with volume reaching 69.6 million U. The funding rate is still only 0.005, suggesting this rally hasn’t triggered overly crowded leverage.
But the long/short ratio of 65:35 is a signal—most people have already sided with the bulls. If the price can hold above 0.025, sentiment may continue to push higher. If it breaks below, short-term profit-takers could run pretty fast.
I’ll watch the order-book strength at 0.025 and 0.029. I won’t chase; I’ll wait for a pullback and confirmation.
$BULLA #强势突破 #65% Longs’ share
Click the small card below to quickly check the market trend👇
BULLA has moved pretty decisively over these 8 hours—rising all the way from around 0.018 to 0.027, with volume reaching 69.6 million U. The funding rate is still only 0.005, suggesting this rally hasn’t triggered overly crowded leverage.
But the long/short ratio of 65:35 is a signal—most people have already sided with the bulls. If the price can hold above 0.025, sentiment may continue to push higher. If it breaks below, short-term profit-takers could run pretty fast.
I’ll watch the order-book strength at 0.025 and 0.029. I won’t chase; I’ll wait for a pullback and confirmation.
$BULLA #强势突破 #65% Longs’ share
Click the small card below to quickly check the market trend👇
94
·
--
After a 50% plunge, are 65% of people still going long?
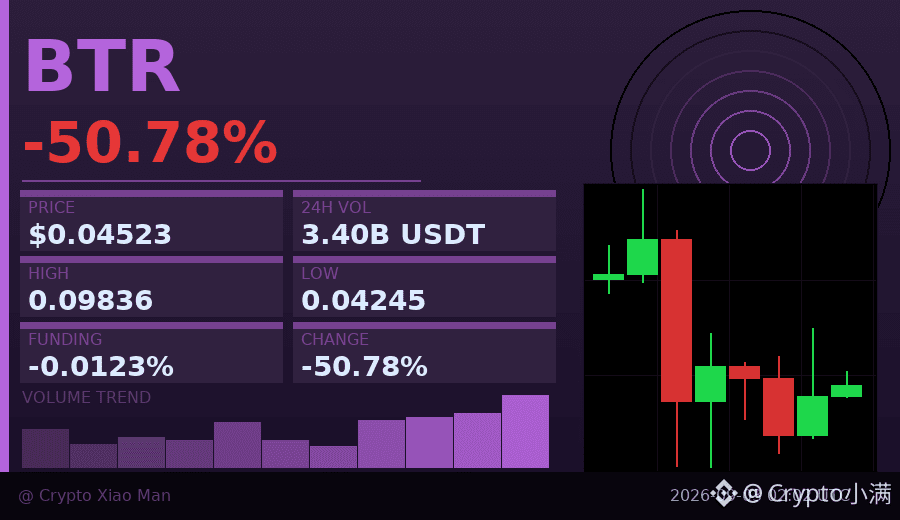
Today, BTR dropped from 0.098 to 0.045, almost halving. But interestingly, the long/short ratio shows that 65% of positions are still long. The funding rate has already flipped to negative at -0.012%, indicating that shorts are paying longs.
More importantly, the hourly chart has closed green for 3 consecutive candles, and the low at 0.04245 seems to be where some buyers are stepping in. In such extreme sentiment, any rebound is either a short-term opportunity for short covering, or a continuation during a downtrend.
I’ll wait for the next candlestick to confirm the direction—no rush to buy the dip.
$BTR #资金费率 #65% Long
Click the small card below to quickly view the market 👇
After a 50% plunge, are 65% of people still going long?
Today, BTR dropped from 0.098 to 0.045, almost halving. But interestingly, the long/short ratio shows that 65% of positions are still long. The funding rate has already flipped to negative at -0.012%, indicating that shorts are paying longs.
More importantly, the hourly chart has closed green for 3 consecutive candles, and the low at 0.04245 seems to be where some buyers are stepping in. In such extreme sentiment, any rebound is either a short-term opportunity for short covering, or a continuation during a downtrend.
I’ll wait for the next candlestick to confirm the direction—no rush to buy the dip.
$BTR #资金费率 #65% Long
Click the small card below to quickly view the market 👇
Today, BTR dropped from 0.098 to 0.045, almost halving. But interestingly, the long/short ratio shows that 65% of positions are still long. The funding rate has already flipped to negative at -0.012%, indicating that shorts are paying longs.
More importantly, the hourly chart has closed green for 3 consecutive candles, and the low at 0.04245 seems to be where some buyers are stepping in. In such extreme sentiment, any rebound is either a short-term opportunity for short covering, or a continuation during a downtrend.
I’ll wait for the next candlestick to confirm the direction—no rush to buy the dip.
$BTR #资金费率 #65% Long
Click the small card below to quickly view the market 👇
60

·
--
I've been keeping an eye on the trending tokens on CoinGecko, and I'm excited to share my findings with you. The list includes a mix of established and new tokens, with Ethereum (ETH) and Bitcoin (BTC) being the most notable ones.
I've noticed that some of the lesser-known tokens have been gaining traction, such as Pudgy Penguins (PENGU) with a market cap rank of #117, and Pump.fun (PUMP) with a market cap rank of #77, which has seen a significant increase in interest. Other tokens like Cash Cat (CASHCAT) and Lorenzo Protocol (BANK) are also trending, although they have lower market cap ranks. Pi Network (PI) is another token that's been gaining attention, with a market cap rank of #65.
I'm intrigued by the diversity of tokens on this list, and I think it's worth keeping an eye on them to see how they perform in the future 📈. Overall, I'm excited to see the growth and development of these tokens, and I'm looking forward to seeing how they will impact the crypto market 💰. As always, I recommend doing your own research before investing in any token 🚀.
$BANK, $ACE, $BANK
I've been keeping an eye on the trending tokens on CoinGecko, and I'm excited to share my findings with you. The list includes a mix of established and new tokens, with Ethereum (ETH) and Bitcoin (BTC) being the most notable ones.
I've noticed that some of the lesser-known tokens have been gaining traction, such as Pudgy Penguins (PENGU) with a market cap rank of #117, and Pump.fun (PUMP) with a market cap rank of #77, which has seen a significant increase in interest. Other tokens like Cash Cat (CASHCAT) and Lorenzo Protocol (BANK) are also trending, although they have lower market cap ranks. Pi Network (PI) is another token that's been gaining attention, with a market cap rank of #65.
I'm intrigued by the diversity of tokens on this list, and I think it's worth keeping an eye on them to see how they perform in the future 📈. Overall, I'm excited to see the growth and development of these tokens, and I'm looking forward to seeing how they will impact the crypto market 💰. As always, I recommend doing your own research before investing in any token 🚀.
$BANK , $ACE , $BANK
I've noticed that some of the lesser-known tokens have been gaining traction, such as Pudgy Penguins (PENGU) with a market cap rank of #117, and Pump.fun (PUMP) with a market cap rank of #77, which has seen a significant increase in interest. Other tokens like Cash Cat (CASHCAT) and Lorenzo Protocol (BANK) are also trending, although they have lower market cap ranks. Pi Network (PI) is another token that's been gaining attention, with a market cap rank of #65.
I'm intrigued by the diversity of tokens on this list, and I think it's worth keeping an eye on them to see how they perform in the future 📈. Overall, I'm excited to see the growth and development of these tokens, and I'm looking forward to seeing how they will impact the crypto market 💰. As always, I recommend doing your own research before investing in any token 🚀.
$BANK , $ACE , $BANK
102

·
--
$2.99 This ATH for $PI isn’t a pressure level—it’s a shadow. There are still 97.03% to go. For holders trying to get back to breakeven, they need to make 33x. New entrants glance at this number and the first reaction is always, “How can this still keep dropping?” The anchor is too big—so big that even a 7% move in a single day feels irrelevant.
But the market action over the past 30 days isn’t without structure. In mid-July, $0.077 was dumped on heavy volume to form a low. On July 20, it was pulled back to $0.0926 with $33.9M in volume. After that, it slowly bled lower with shrinking volume, and by August 5, volume was down to just $3.53M—selling pressure was nearing exhaustion. On August 6, volume jumped back to $12M, and price moved back above $0.09, though it didn’t hold.
What I care more about is the $7.49M figure today. Volume expands the next day but then pulls back—this suggests the probing capital hasn’t left, but it also hasn’t chased. A market-cap rank of #65 with a size of $978M doesn’t have the shape of something going to zero. The problem is that what it wants is sustained volume, not a one-day pulse.
The disagreement is actually quite specific: wait for it to build and hold with volume at $0.095 before moving, or take responsibility for a pullback from the current $0.088 level? If volume can shrink back below $5M and the price loses $0.083, then this probing move is just another pinprick. What’s hard for $PI isn’t understanding—it’s whether you dare to pay that small bit of uncertainty before the confirmation comes.
$2.99 This ATH for $PI isn’t a pressure level—it’s a shadow. There are still 97.03% to go. For holders trying to get back to breakeven, they need to make 33x. New entrants glance at this number and the first reaction is always, “How can this still keep dropping?” The anchor is too big—so big that even a 7% move in a single day feels irrelevant.
But the market action over the past 30 days isn’t without structure. In mid-July, $0.077 was dumped on heavy volume to form a low. On July 20, it was pulled back to $0.0926 with $33.9M in volume. After that, it slowly bled lower with shrinking volume, and by August 5, volume was down to just $3.53M—selling pressure was nearing exhaustion. On August 6, volume jumped back to $12M, and price moved back above $0.09, though it didn’t hold.
What I care more about is the $7.49M figure today. Volume expands the next day but then pulls back—this suggests the probing capital hasn’t left, but it also hasn’t chased. A market-cap rank of #65 with a size of $978M doesn’t have the shape of something going to zero. The problem is that what it wants is sustained volume, not a one-day pulse.
The disagreement is actually quite specific: wait for it to build and hold with volume at $0.095 before moving, or take responsibility for a pullback from the current $0.088 level? If volume can shrink back below $5M and the price loses $0.083, then this probing move is just another pinprick. What’s hard for $PI isn’t understanding—it’s whether you dare to pay that small bit of uncertainty before the confirmation comes.
But the market action over the past 30 days isn’t without structure. In mid-July, $0.077 was dumped on heavy volume to form a low. On July 20, it was pulled back to $0.0926 with $33.9M in volume. After that, it slowly bled lower with shrinking volume, and by August 5, volume was down to just $3.53M—selling pressure was nearing exhaustion. On August 6, volume jumped back to $12M, and price moved back above $0.09, though it didn’t hold.
What I care more about is the $7.49M figure today. Volume expands the next day but then pulls back—this suggests the probing capital hasn’t left, but it also hasn’t chased. A market-cap rank of #65 with a size of $978M doesn’t have the shape of something going to zero. The problem is that what it wants is sustained volume, not a one-day pulse.
The disagreement is actually quite specific: wait for it to build and hold with volume at $0.095 before moving, or take responsibility for a pullback from the current $0.088 level? If volume can shrink back below $5M and the price loses $0.083, then this probing move is just another pinprick. What’s hard for $PI isn’t understanding—it’s whether you dare to pay that small bit of uncertainty before the confirmation comes.
8

·
--
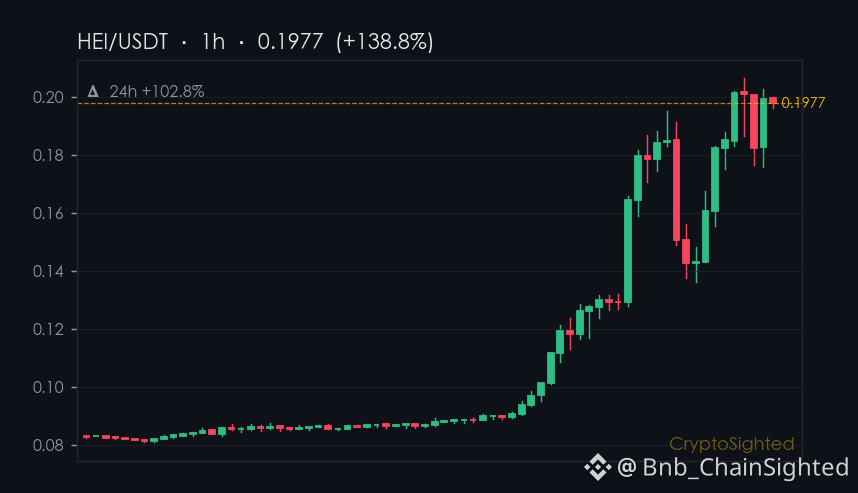
A 102.8% jump in 24 hours - that’s the kind of move that grabs attention. $HEI is up by that exact number, but it’s not even on the top trading volume list. That’s the kind of contradiction that makes you pause.
HEI’s surge isn’t just price action. Its technicals are telling a story too. On the daily chart, HEI’s RSI is in overbought territory, and its volume is 5.53 times the average. That kind of volume spike is usually a sign of a big move either continuing or reversing - but it’s not showing up on the volume leaderboards. That’s the puzzle.
Meanwhile, the broader market is showing signs of divergence. Bitcoin is up slightly, and its funding rate is flat at ↑0.0010%, suggesting a balanced leverage position. The same goes for Ethereum, which is also seeing a flat funding rate at ↑0.0006%. Both $BTC and $ETH are showing a measured, steady move, while HEI is flying under the radar.
What’s interesting is that the top gainers - HEI, HFT, SYN, BICO, and FIDA - are all seeing sharp moves, but none of them are showing up on the volume list. That’s a sign of something happening in the mid-cap or small-cap space. It’s not the usual suspects driving the market - it’s something else.
—
Not financial advice. Crypto assets are high-risk; do your own research.
📌 Market Narrative · #65 · #CryptoMarket #CryptoSighted $HEI
A 102.8% jump in 24 hours - that’s the kind of move that grabs attention. $HEI is up by that exact number, but it’s not even on the top trading volume list. That’s the kind of contradiction that makes you pause.
HEI’s surge isn’t just price action. Its technicals are telling a story too. On the daily chart, HEI’s RSI is in overbought territory, and its volume is 5.53 times the average. That kind of volume spike is usually a sign of a big move either continuing or reversing - but it’s not showing up on the volume leaderboards. That’s the puzzle.
Meanwhile, the broader market is showing signs of divergence. Bitcoin is up slightly, and its funding rate is flat at ↑0.0010%, suggesting a balanced leverage position. The same goes for Ethereum, which is also seeing a flat funding rate at ↑0.0006%. Both $BTC and $ETH are showing a measured, steady move, while HEI is flying under the radar.
What’s interesting is that the top gainers - HEI, HFT, SYN, BICO, and FIDA - are all seeing sharp moves, but none of them are showing up on the volume list. That’s a sign of something happening in the mid-cap or small-cap space. It’s not the usual suspects driving the market - it’s something else.
—
Not financial advice. Crypto assets are high-risk; do your own research.
📌 Market Narrative · #65 · #CryptoMarket #CryptoSighted $HEI
HEI’s surge isn’t just price action. Its technicals are telling a story too. On the daily chart, HEI’s RSI is in overbought territory, and its volume is 5.53 times the average. That kind of volume spike is usually a sign of a big move either continuing or reversing - but it’s not showing up on the volume leaderboards. That’s the puzzle.
Meanwhile, the broader market is showing signs of divergence. Bitcoin is up slightly, and its funding rate is flat at ↑0.0010%, suggesting a balanced leverage position. The same goes for Ethereum, which is also seeing a flat funding rate at ↑0.0006%. Both $BTC and $ETH are showing a measured, steady move, while HEI is flying under the radar.
What’s interesting is that the top gainers - HEI, HFT, SYN, BICO, and FIDA - are all seeing sharp moves, but none of them are showing up on the volume list. That’s a sign of something happening in the mid-cap or small-cap space. It’s not the usual suspects driving the market - it’s something else.
—
Not financial advice. Crypto assets are high-risk; do your own research.
📌 Market Narrative · #65 · #CryptoMarket #CryptoSighted $HEI
257
·
--
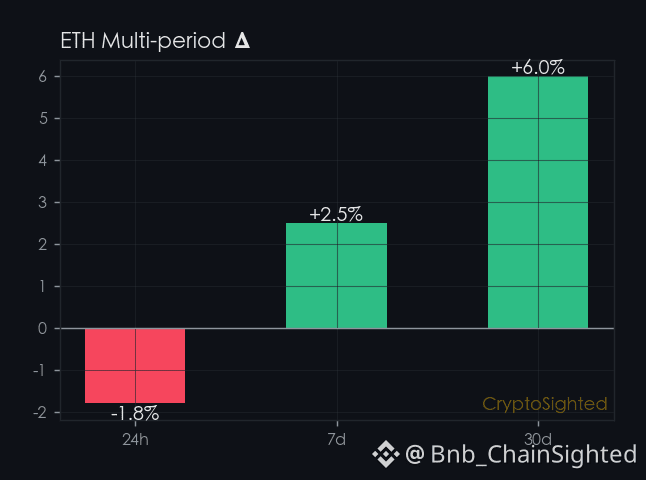
$ETH is sitting near $1,840, just below its 24-hour high of $1,873 — and the price is down about 1.7% over the past 24 hours.
That’s the tension: short-term pain, long-term gain. Which one matters more?
Over the last 30 days, ETH has moved up 6% — a clear sign of sustained movement.
It’s not a flash move, it’s a measured climb.
That kind of steady accumulation doesn’t happen by accident.
But here’s the catch: ETH is down about 2% in the last 24 hours.
That’s not a crash, not even close. It’s not the kind of drop that wipes out longs or triggers mass liquidations.
📊 14 directional calls in the last 30d, every one auto-settled against price. Direction only — no buy/sell calls.
—
Not financial advice. DYOR.
📌 Funding Pulse · #65 · #FundingRate #CryptoSighted $ETH
$ETH is sitting near $1,840, just below its 24-hour high of $1,873 — and the price is down about 1.7% over the past 24 hours.
That’s the tension: short-term pain, long-term gain. Which one matters more?
Over the last 30 days, ETH has moved up 6% — a clear sign of sustained movement.
It’s not a flash move, it’s a measured climb.
That kind of steady accumulation doesn’t happen by accident.
But here’s the catch: ETH is down about 2% in the last 24 hours.
That’s not a crash, not even close. It’s not the kind of drop that wipes out longs or triggers mass liquidations.
📊 14 directional calls in the last 30d, every one auto-settled against price. Direction only — no buy/sell calls.
—
Not financial advice. DYOR.
📌 Funding Pulse · #65 · #FundingRate #CryptoSighted $ETH
That’s the tension: short-term pain, long-term gain. Which one matters more?
Over the last 30 days, ETH has moved up 6% — a clear sign of sustained movement.
It’s not a flash move, it’s a measured climb.
That kind of steady accumulation doesn’t happen by accident.
But here’s the catch: ETH is down about 2% in the last 24 hours.
That’s not a crash, not even close. It’s not the kind of drop that wipes out longs or triggers mass liquidations.
📊 14 directional calls in the last 30d, every one auto-settled against price. Direction only — no buy/sell calls.
—
Not financial advice. DYOR.
📌 Funding Pulse · #65 · #FundingRate #CryptoSighted $ETH
1
300
Log in to explore more content
Join global crypto users on Binance Square
⚡️ Get latest and useful information about crypto.
💬 Trusted by the world’s largest crypto exchange.
👍 Discover real insights from verified creators.
Email / Phone number
Trending Topics
1
#UKFCAWinsCourtOrderToRecover851400Pounds
220 views
84 Discussing
2
#ChainlinkLaunchesCCIP2WithEnterpriseVerification
7,131 views
405 Discussing
3
#GoldFallsTo$4144
4,169 views
101 Discussing
4
#QNTFallsOver40%FromMorningHigh
32,526 views
807 Discussing
5
#USDTAdds845900HoldersInPast7Days
865 views
96 Discussing
6
#KospiFalls2.7%SamsungSKHynixDropOver5%
6,656 views
365 Discussing
7
#BitgetCEOConfirms$388MStolenInHack
2,703 views
37 Discussing
8
#BTCFallsBelow$83000
16,658 views
138 Discussing
9
#BitgetDetailsSecurityIncidentTimeline
18,547 views
524 Discussing
10
#BitcoinSpotETFs$2.39BWeeklyNetInflow
7,060 views
34 Discussing