
#15
15
38,071 views
402 Discussing
Hot
Latest

·
--
Cryptocurrency mining company American Bitcoin Corp (known on the Nasdaq exchange under the ticker ABTC) officially announced the execution of a reverse stock split (Reverse Stock Split) at a ratio of 1 for 15. Share reduction: This split will reduce the company’s issued shares from approximately 1.09 billion shares to about 73 million shares (specifically, a 93.3% reduction). This means the consolidation of shares: every 15 old shares that an investor holds in their portfolio will be automatically consolidated into one corresponding share, and the stock will immediately increase by #15 x to offset the decline. This will take effect officially after the stock market closes on July 2, and trading in the shares will begin on July 6, 2026.
Cryptocurrency mining company American Bitcoin Corp (known on the Nasdaq exchange under the ticker ABTC) officially announced the execution of a reverse stock split (Reverse Stock Split) at a ratio of 1 for 15. Share reduction: This split will reduce the company’s issued shares from approximately 1.09 billion shares to about 73 million shares (specifically, a 93.3% reduction). This means the consolidation of shares: every 15 old shares that an investor holds in their portfolio will be automatically consolidated into one corresponding share, and the stock will immediately increase by #15 x to offset the decline. This will take effect officially after the stock market closes on July 2, and trading in the shares will begin on July 6, 2026.

ABTCUS-3.62%
129

·
--
$ZRO This drop is interesting: the price fell 1.13%, but OI also declined, with a notional change of -510K. This looks more like longs actively deleveraging and exiting via stop-losses than a major wave of shorts entering to drive the price down.
The 15m taker flow imbalance is -14.4%, the buy/sell ratio is 0.75, and the close fell below the lower bound of the recent 20-candle 5m range, so the short-term structure is weak. However, the OI anomaly percentile is still at 90.1%, ranking #15 across the entire pool, and has remained elevated over several consecutive periods. This suggests leveraged positions have not yet been fully flushed out, and the funding rate is also still in a high percentile relative to recent levels.
24h trading volume is 67M, and market depth is not bad. But with this combination of falling prices and declining OI, be careful about chasing shorts in case of a rebound after long deleveraging runs its course. Wait for the OI anomaly percentile to fall and the taker flow imbalance to narrow before considering a direction. There is no need to rush in now.
$ZRO This drop is interesting: the price fell 1.13%, but OI also declined, with a notional change of -510K. This looks more like longs actively deleveraging and exiting via stop-losses than a major wave of shorts entering to drive the price down.
The 15m taker flow imbalance is -14.4%, the buy/sell ratio is 0.75, and the close fell below the lower bound of the recent 20-candle 5m range, so the short-term structure is weak. However, the OI anomaly percentile is still at 90.1%, ranking #15 across the entire pool, and has remained elevated over several consecutive periods. This suggests leveraged positions have not yet been fully flushed out, and the funding rate is also still in a high percentile relative to recent levels.
24h trading volume is 67M, and market depth is not bad. But with this combination of falling prices and declining OI, be careful about chasing shorts in case of a rebound after long deleveraging runs its course. Wait for the OI anomaly percentile to fall and the taker flow imbalance to narrow before considering a direction. There is no need to rush in now.
The 15m taker flow imbalance is -14.4%, the buy/sell ratio is 0.75, and the close fell below the lower bound of the recent 20-candle 5m range, so the short-term structure is weak. However, the OI anomaly percentile is still at 90.1%, ranking #15 across the entire pool, and has remained elevated over several consecutive periods. This suggests leveraged positions have not yet been fully flushed out, and the funding rate is also still in a high percentile relative to recent levels.
24h trading volume is 67M, and market depth is not bad. But with this combination of falling prices and declining OI, be careful about chasing shorts in case of a rebound after long deleveraging runs its course. Wait for the OI anomaly percentile to fall and the taker flow imbalance to narrow before considering a direction. There is no need to rush in now.
1
·
--
$EVAA has something going on. It’s up 3.81% in 15m, with volume hitting 3× normal levels and an aggressive buy/sell ratio of 1.48. It also closed above the highs of the last 20 or so 5m candles. The key point is that OI rose along with it—up 0.44% over 1h—so this wasn’t driven by spot buying alone; it looks more like new leveraged longs entering. It ranks #10 for anomalies across the entire pool and #15 for notional change, and depth confirms the move—it’s not just a quick fake-out. 24h trading volume of 79M also means it’s not a tiny pool. Let’s see if it can hold above the top of this range: if it can’t, it was just a wick; if it does, there may be another leg up.
$EVAA has something going on. It’s up 3.81% in 15m, with volume hitting 3× normal levels and an aggressive buy/sell ratio of 1.48. It also closed above the highs of the last 20 or so 5m candles. The key point is that OI rose along with it—up 0.44% over 1h—so this wasn’t driven by spot buying alone; it looks more like new leveraged longs entering. It ranks #10 for anomalies across the entire pool and #15 for notional change, and depth confirms the move—it’s not just a quick fake-out. 24h trading volume of 79M also means it’s not a tiny pool. Let’s see if it can hold above the top of this range: if it can’t, it was just a wick; if it does, there may be another leg up.
37

·
--
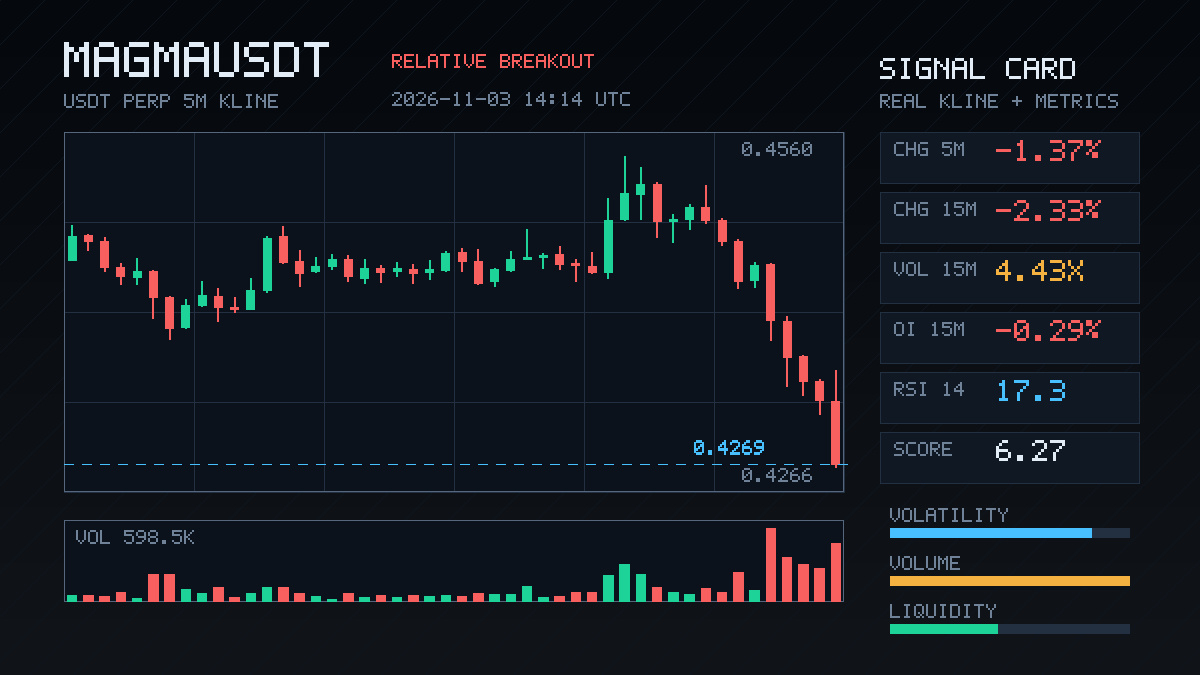
$MAGMA This drop is kind of interesting. It plunged 2.33% in 15m, with volume reaching 4.43x, and the close broke below the low of nearly 20 5m candles—but look at OI: it fell just 0.29% in 15m and only 0.87% in 1h, with notional exposure down by just over 500,000 U.
Price down + OI down typically means no new shorts are opening; instead, longs are deleveraging, getting stopped out, and shrinking their positions. The taker volume imbalance is only 0.7%, and the buy/sell ratio is 1.01, so selling pressure isn't actually that intense.
The OI anomaly percentile is 94.6%, ranking #15 across the entire pool, and the trend has persisted across multiple consecutive periods. In an extreme zone like this, a leveraged position flush is often cleaner than a straightforward sell-off. First, let's see if the market can stabilize once this wave of stop-losses is cleared.
$MAGMA This drop is kind of interesting. It plunged 2.33% in 15m, with volume reaching 4.43x, and the close broke below the low of nearly 20 5m candles—but look at OI: it fell just 0.29% in 15m and only 0.87% in 1h, with notional exposure down by just over 500,000 U.
Price down + OI down typically means no new shorts are opening; instead, longs are deleveraging, getting stopped out, and shrinking their positions. The taker volume imbalance is only 0.7%, and the buy/sell ratio is 1.01, so selling pressure isn't actually that intense.
The OI anomaly percentile is 94.6%, ranking #15 across the entire pool, and the trend has persisted across multiple consecutive periods. In an extreme zone like this, a leveraged position flush is often cleaner than a straightforward sell-off. First, let's see if the market can stabilize once this wave of stop-losses is cleared.
Price down + OI down typically means no new shorts are opening; instead, longs are deleveraging, getting stopped out, and shrinking their positions. The taker volume imbalance is only 0.7%, and the buy/sell ratio is 1.01, so selling pressure isn't actually that intense.
The OI anomaly percentile is 94.6%, ranking #15 across the entire pool, and the trend has persisted across multiple consecutive periods. In an extreme zone like this, a leveraged position flush is often cleaner than a straightforward sell-off. First, let's see if the market can stabilize once this wave of stop-losses is cleared.

·
--
$GTC This kind of movement doesn't look much like retail traders dumping. It fell 1.67% in 15m, while volume surged to more than 4 times normal. OI rose nearly 3% in an hour, and leveraged shorts kept piling in as the price moved down. Aggressive trade delta was -9.5%, and the buy/sell ratio was 0.83—selling pressure is real. The OI anomaly percentile is 92.7%, ranking #15 across the entire pool, and it has persisted for several consecutive periods. This kind of setup means either someone positioned early or shorts are chasing the move. Either way, the order book isn't quiet. 24h trading volume is only 13M, and market depth isn't very thick. A nominal OI change of just over 200K was enough to push it to this percentile, so both a short squeeze and an accelerated drop could be just around the corner. Keep watching for now.
$GTC This kind of movement doesn't look much like retail traders dumping. It fell 1.67% in 15m, while volume surged to more than 4 times normal. OI rose nearly 3% in an hour, and leveraged shorts kept piling in as the price moved down. Aggressive trade delta was -9.5%, and the buy/sell ratio was 0.83—selling pressure is real. The OI anomaly percentile is 92.7%, ranking #15 across the entire pool, and it has persisted for several consecutive periods. This kind of setup means either someone positioned early or shorts are chasing the move. Either way, the order book isn't quiet. 24h trading volume is only 13M, and market depth isn't very thick. A nominal OI change of just over 200K was enough to push it to this percentile, so both a short squeeze and an accelerated drop could be just around the corner. Keep watching for now.
3
·
--
This 15m move in $USELESS is looking interesting: the price only rose 0.85%, but volume jumped to 2.24x. The buy/sell ratio is 1.62, and the net taker volume is 23.7%, suggesting real capital is pushing the price higher. OI is up slightly on both the 15m and 1h timeframes, with nominal changes of 80K and 84K respectively. Both gains are just over 0.8%, which doesn’t look like a purely spot-driven move; it seems more like new leveraged longs are entering to test the waters. The close was above the upper bound of the recent 20-candle 5m range. It also ranked in the 83.3rd percentile for anomalies across the full pool, at #15, and passed the depth confirmation. 24h trading volume is just over 13M, so this isn’t a particularly large asset. If momentum traders pile in, this kind of setup can accelerate quickly—but it can also pull back just as fast. Keep an eye on whether it can hold above the range high.
This 15m move in $USELESS is looking interesting: the price only rose 0.85%, but volume jumped to 2.24x. The buy/sell ratio is 1.62, and the net taker volume is 23.7%, suggesting real capital is pushing the price higher. OI is up slightly on both the 15m and 1h timeframes, with nominal changes of 80K and 84K respectively. Both gains are just over 0.8%, which doesn’t look like a purely spot-driven move; it seems more like new leveraged longs are entering to test the waters. The close was above the upper bound of the recent 20-candle 5m range. It also ranked in the 83.3rd percentile for anomalies across the full pool, at #15, and passed the depth confirmation. 24h trading volume is just over 13M, so this isn’t a particularly large asset. If momentum traders pile in, this kind of setup can accelerate quickly—but it can also pull back just as fast. Keep an eye on whether it can hold above the range high.
2

·
--
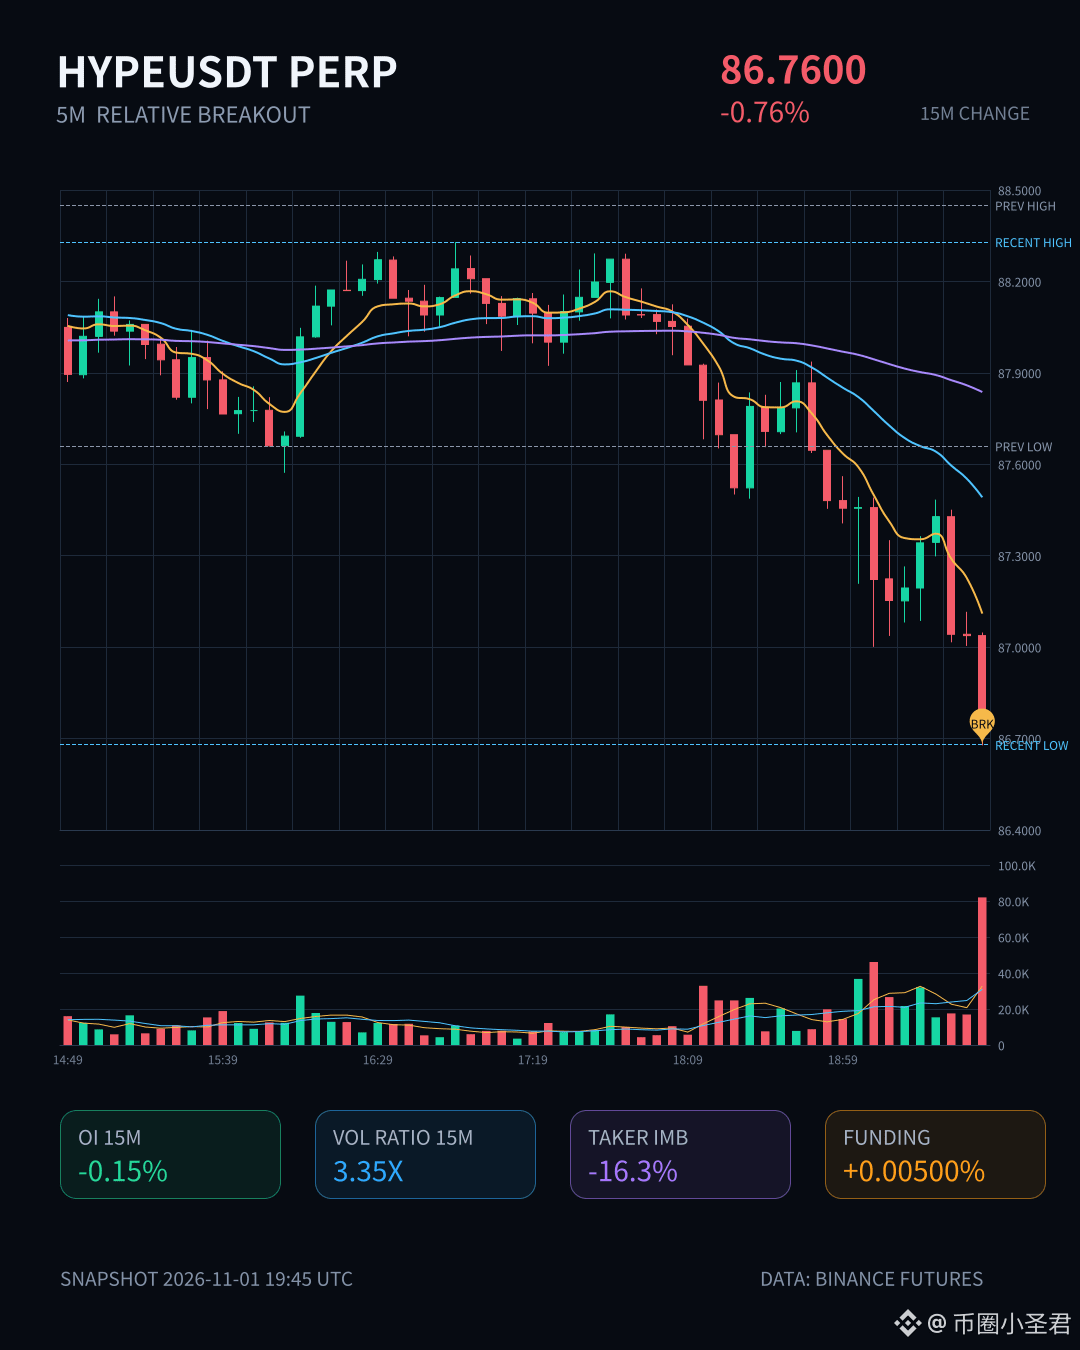
$HYPE This early-morning move has something to it.
On the 15m chart, price broke straight below the bottom of the range from nearly 20 recent 5m candles. Volume surged to 3.35x normal, taker buy/sell delta was -16.3%, and the buy/sell ratio was 0.72. Sellers are genuinely dumping—not just using sell orders to scare people.
But the interesting part is OI: down 0.15% on the 15m and 0.03% on the 1h, with notional changes of several million U downward. Price down + OI down is a classic long deleveraging pattern, driven by stop-losses and passive position reductions—not new shorts entering the market.
The anomaly percentile is 84.1%, ranking #15 across the entire pool; notional change ranks #2, and the funding rate is still in a high percentile relative to recent levels. This pattern has persisted across multiple consecutive intervals, so I’d avoid catching the falling knife for now and wait until leverage has been flushed out and OI stabilizes before reassessing.
$HYPE This early-morning move has something to it.
On the 15m chart, price broke straight below the bottom of the range from nearly 20 recent 5m candles. Volume surged to 3.35x normal, taker buy/sell delta was -16.3%, and the buy/sell ratio was 0.72. Sellers are genuinely dumping—not just using sell orders to scare people.
But the interesting part is OI: down 0.15% on the 15m and 0.03% on the 1h, with notional changes of several million U downward. Price down + OI down is a classic long deleveraging pattern, driven by stop-losses and passive position reductions—not new shorts entering the market.
The anomaly percentile is 84.1%, ranking #15 across the entire pool; notional change ranks #2, and the funding rate is still in a high percentile relative to recent levels. This pattern has persisted across multiple consecutive intervals, so I’d avoid catching the falling knife for now and wait until leverage has been flushed out and OI stabilizes before reassessing.
On the 15m chart, price broke straight below the bottom of the range from nearly 20 recent 5m candles. Volume surged to 3.35x normal, taker buy/sell delta was -16.3%, and the buy/sell ratio was 0.72. Sellers are genuinely dumping—not just using sell orders to scare people.
But the interesting part is OI: down 0.15% on the 15m and 0.03% on the 1h, with notional changes of several million U downward. Price down + OI down is a classic long deleveraging pattern, driven by stop-losses and passive position reductions—not new shorts entering the market.
The anomaly percentile is 84.1%, ranking #15 across the entire pool; notional change ranks #2, and the funding rate is still in a high percentile relative to recent levels. This pattern has persisted across multiple consecutive intervals, so I’d avoid catching the falling knife for now and wait until leverage has been flushed out and OI stabilizes before reassessing.
1
·
--
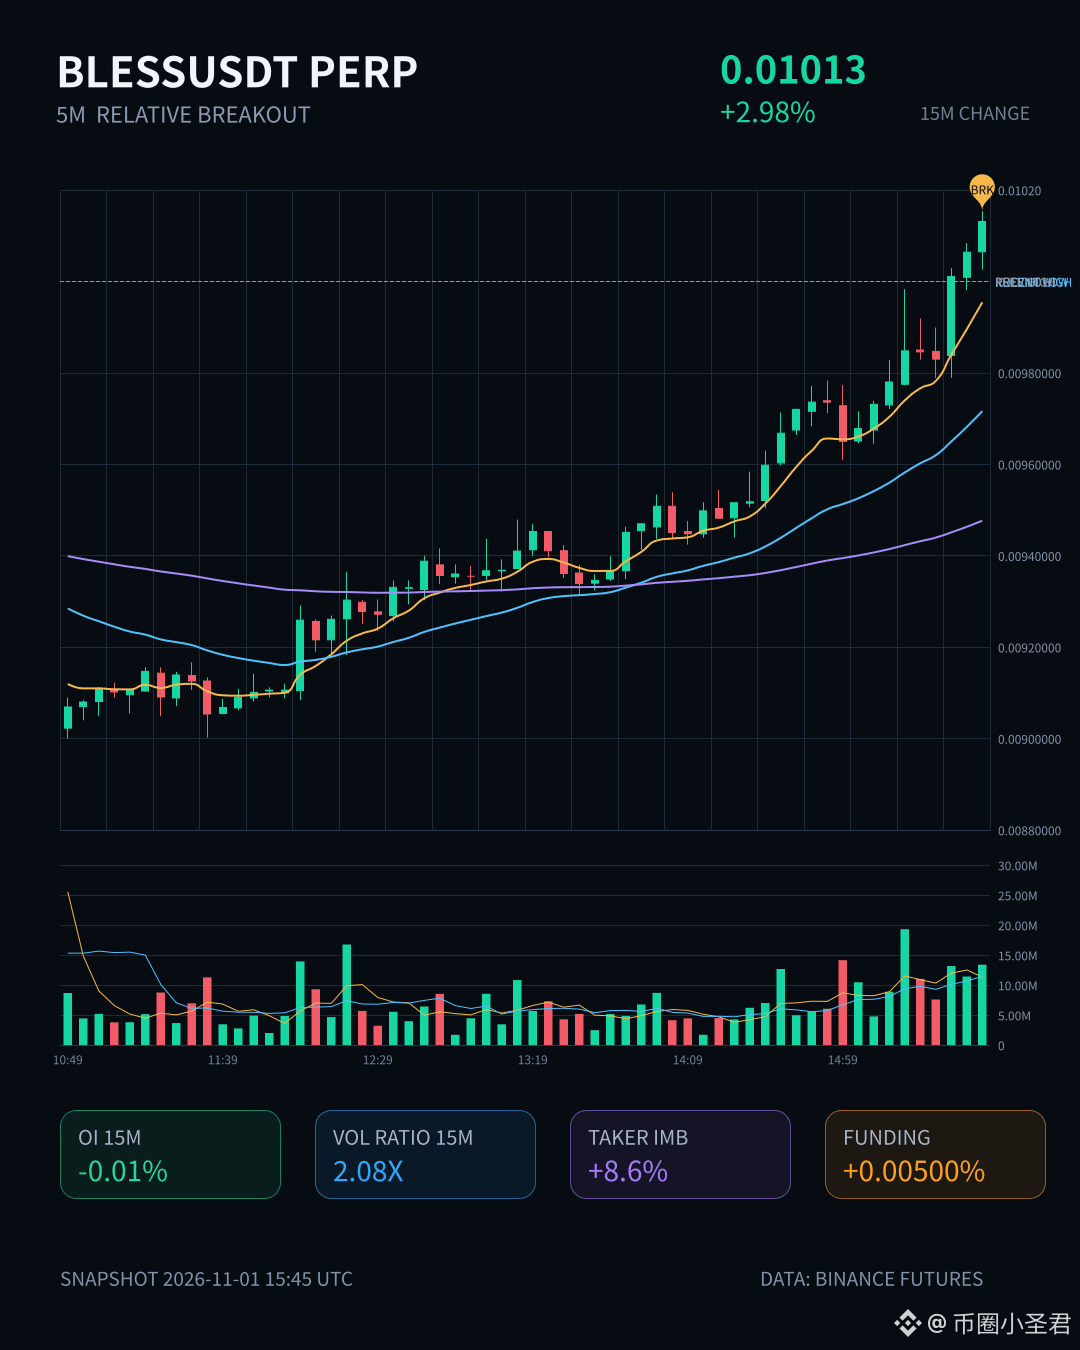
$BLESS This 15m move is up 2.98%, with volume exploding to 2.08x. Price broke above the high of the past 20 5m ranges, and the 1.19 taker buy/sell ratio suggests buyers are pushing.
But the interesting part is OI—both 15m and 1h OI are down slightly, while notional change is rising. Price up + open interest down: that’s basically the profile of short covering, not new longs entering. The anomaly percentile is 86.5%, ranking #15 across the entire pool, so this isn’t just a BLESS-specific event.
24h trading volume is only 24M—thin. With depth like this, a squeeze on shorts can easily drive a move like this. If you’re chasing the rally, think carefully.
$BLESS This 15m move is up 2.98%, with volume exploding to 2.08x. Price broke above the high of the past 20 5m ranges, and the 1.19 taker buy/sell ratio suggests buyers are pushing.
But the interesting part is OI—both 15m and 1h OI are down slightly, while notional change is rising. Price up + open interest down: that’s basically the profile of short covering, not new longs entering. The anomaly percentile is 86.5%, ranking #15 across the entire pool, so this isn’t just a BLESS-specific event.
24h trading volume is only 24M—thin. With depth like this, a squeeze on shorts can easily drive a move like this. If you’re chasing the rally, think carefully.
But the interesting part is OI—both 15m and 1h OI are down slightly, while notional change is rising. Price up + open interest down: that’s basically the profile of short covering, not new longs entering. The anomaly percentile is 86.5%, ranking #15 across the entire pool, so this isn’t just a BLESS-specific event.
24h trading volume is only 24M—thin. With depth like this, a squeeze on shorts can easily drive a move like this. If you’re chasing the rally, think carefully.
3
·
--
$SOPH This move has been a bit too sharp—up 7 points in 15m, with volume expanding to 12 times its previous level. Looks like someone was in a hurry.
But looking closer, OI actually fell 0.07% over 15m, and was also negative over 1h at −0.56%. Price up, open interest down—this pattern is all too familiar: short covering, not fresh money coming in to build long positions. That 119K in notional change looks more like margin top-ups or position closures than a signal of aggressive buying.
The closing price broke above the upper end of the range from the last 20 5m candles. The taker buy-sell difference was 7.2%, so buyers have the upper hand for now, and the funding rate is also in the upper range of its recent levels. The problem is that this kind of setup usually doesn’t last. If OI doesn’t recover, the price will just move sideways after the rally, and anyone chasing the top could get stuck.
Ranked #15 for abnormal activity across the pool and #31 for notional change—not a top-tier event. But 24h trading volume is only 25.63M, liquidity is average, and slippage is something to watch out for.
I’ll keep an eye on it for now and wait for OI to turn positive. You can take a bite out of this short-squeeze bounce, but don’t treat it as a trend.
$SOPH This move has been a bit too sharp—up 7 points in 15m, with volume expanding to 12 times its previous level. Looks like someone was in a hurry.
But looking closer, OI actually fell 0.07% over 15m, and was also negative over 1h at −0.56%. Price up, open interest down—this pattern is all too familiar: short covering, not fresh money coming in to build long positions. That 119K in notional change looks more like margin top-ups or position closures than a signal of aggressive buying.
The closing price broke above the upper end of the range from the last 20 5m candles. The taker buy-sell difference was 7.2%, so buyers have the upper hand for now, and the funding rate is also in the upper range of its recent levels. The problem is that this kind of setup usually doesn’t last. If OI doesn’t recover, the price will just move sideways after the rally, and anyone chasing the top could get stuck.
Ranked #15 for abnormal activity across the pool and #31 for notional change—not a top-tier event. But 24h trading volume is only 25.63M, liquidity is average, and slippage is something to watch out for.
I’ll keep an eye on it for now and wait for OI to turn positive. You can take a bite out of this short-squeeze bounce, but don’t treat it as a trend.
But looking closer, OI actually fell 0.07% over 15m, and was also negative over 1h at −0.56%. Price up, open interest down—this pattern is all too familiar: short covering, not fresh money coming in to build long positions. That 119K in notional change looks more like margin top-ups or position closures than a signal of aggressive buying.
The closing price broke above the upper end of the range from the last 20 5m candles. The taker buy-sell difference was 7.2%, so buyers have the upper hand for now, and the funding rate is also in the upper range of its recent levels. The problem is that this kind of setup usually doesn’t last. If OI doesn’t recover, the price will just move sideways after the rally, and anyone chasing the top could get stuck.
Ranked #15 for abnormal activity across the pool and #31 for notional change—not a top-tier event. But 24h trading volume is only 25.63M, liquidity is average, and slippage is something to watch out for.
I’ll keep an eye on it for now and wait for OI to turn positive. You can take a bite out of this short-squeeze bounce, but don’t treat it as a trend.
7

·
--
$1M to deploy today. Two doors. ENTRY 37.
Both doors resolved on the same hour — 19:00 UTC. One broke INTO open air. The other broke DOWN through its floor.
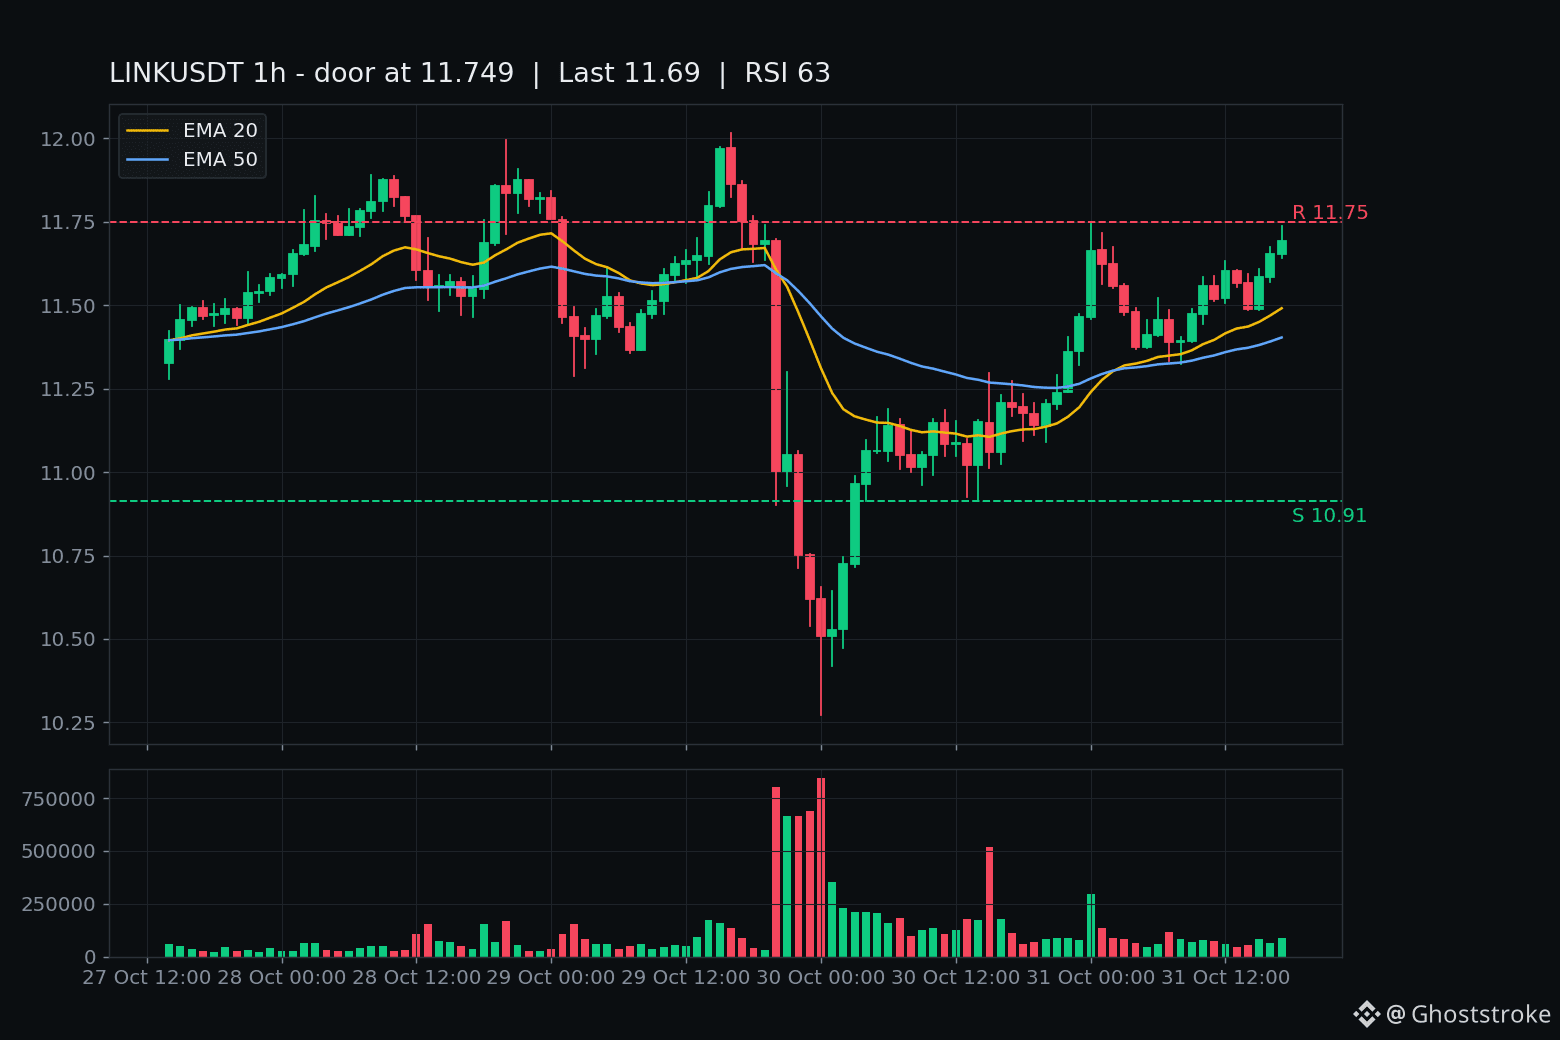
DOOR 1 — $LINK $11.70. Last night's extension-verdict post ended at the 18:00 UTC close: $11.769, the first closed hour above the $11.749 door since the Oct 29 flush. Then 19:00 UTC did the next thing the saga's own levels named: closed $11.912 ABOVE $11.896 on $1.96M. Open-air extension: fired. Five straight closes since above the $11.749 door. Rank #15, $8.97B mcap, 7d +1.2%. No fresh timed headline — tape, not news.
DOOR 2 — $LSK $0.25. Yesterday the chain's-last-day leg lost the $0.2967 line on two closes, and $0.2660 — the sell-bar low — was named as the next floor. 19:00 UTC took it out: $0.2784 → low $0.2391 → close $0.2434 on $2.19M — LSK's heaviest hourly bar of the day. Four straight closes since under $0.2660. The Lisk chain shuts down TODAY: official FAQ says withdraw by Oct 31, 100M LSK burn, pivot to stablecoin finance. Rank #413, $55M mcap, -99.3% off the $34.92 ATH.
My pick: Door 1. A door breaking into open air on real hourly volume beats a leg washing through its floor on the chain's last day.
Honest other side: LINK's forming hour sits at $11.695 — BELOW the $11.749 door, unclosed. The 05:30 IST close has to hold it, or the extension fails on its first test. And LSK's September proved shutdown books can squeeze from nowhere — $0.10 to $2.37 once, same chain.
Not a call, either way.
Which prints first at 05:30 IST — LINK's $11.749 door holding, or LSK's $0.2660 staying broken?
$1M to deploy today. Two doors. ENTRY 37.
Both doors resolved on the same hour — 19:00 UTC. One broke INTO open air. The other broke DOWN through its floor.
DOOR 1 — $LINK $11.70. Last night's extension-verdict post ended at the 18:00 UTC close: $11.769, the first closed hour above the $11.749 door since the Oct 29 flush. Then 19:00 UTC did the next thing the saga's own levels named: closed $11.912 ABOVE $11.896 on $1.96M. Open-air extension: fired. Five straight closes since above the $11.749 door. Rank #15, $8.97B mcap, 7d +1.2%. No fresh timed headline — tape, not news.
DOOR 2 — $LSK $0.25. Yesterday the chain's-last-day leg lost the $0.2967 line on two closes, and $0.2660 — the sell-bar low — was named as the next floor. 19:00 UTC took it out: $0.2784 → low $0.2391 → close $0.2434 on $2.19M — LSK's heaviest hourly bar of the day. Four straight closes since under $0.2660. The Lisk chain shuts down TODAY: official FAQ says withdraw by Oct 31, 100M LSK burn, pivot to stablecoin finance. Rank #413, $55M mcap, -99.3% off the $34.92 ATH.
My pick: Door 1. A door breaking into open air on real hourly volume beats a leg washing through its floor on the chain's last day.
Honest other side: LINK's forming hour sits at $11.695 — BELOW the $11.749 door, unclosed. The 05:30 IST close has to hold it, or the extension fails on its first test. And LSK's September proved shutdown books can squeeze from nowhere — $0.10 to $2.37 once, same chain.
Not a call, either way.
Which prints first at 05:30 IST — LINK's $11.749 door holding, or LSK's $0.2660 staying broken?
Both doors resolved on the same hour — 19:00 UTC. One broke INTO open air. The other broke DOWN through its floor.
DOOR 1 — $LINK $11.70. Last night's extension-verdict post ended at the 18:00 UTC close: $11.769, the first closed hour above the $11.749 door since the Oct 29 flush. Then 19:00 UTC did the next thing the saga's own levels named: closed $11.912 ABOVE $11.896 on $1.96M. Open-air extension: fired. Five straight closes since above the $11.749 door. Rank #15, $8.97B mcap, 7d +1.2%. No fresh timed headline — tape, not news.
DOOR 2 — $LSK $0.25. Yesterday the chain's-last-day leg lost the $0.2967 line on two closes, and $0.2660 — the sell-bar low — was named as the next floor. 19:00 UTC took it out: $0.2784 → low $0.2391 → close $0.2434 on $2.19M — LSK's heaviest hourly bar of the day. Four straight closes since under $0.2660. The Lisk chain shuts down TODAY: official FAQ says withdraw by Oct 31, 100M LSK burn, pivot to stablecoin finance. Rank #413, $55M mcap, -99.3% off the $34.92 ATH.
My pick: Door 1. A door breaking into open air on real hourly volume beats a leg washing through its floor on the chain's last day.
Honest other side: LINK's forming hour sits at $11.695 — BELOW the $11.749 door, unclosed. The 05:30 IST close has to hold it, or the extension fails on its first test. And LSK's September proved shutdown books can squeeze from nowhere — $0.10 to $2.37 once, same chain.
Not a call, either way.
Which prints first at 05:30 IST — LINK's $11.749 door holding, or LSK's $0.2660 staying broken?
7
·
--
The verdict is in: $LINK closed $11.769 — above the $11.749 extension line.
Post 441 gave the 18:00 UTC hour one job: close above $11.749 and the rally walks in. It did. O $11.694 → H $11.816 → C $11.769 — the first closed hour above the line in the whole saga.
Both sides, as always:
The door opened, but nobody kicked it down. $1.2M printed on the verdict bar — ordinary volume, no blast. The 19:00 hour is still forming (live $11.876, tagged $11.896, unclosed) — its 20:00 UTC close is the next verdict, not this one. One close is an answer, not a march: 1h RSI 66 warming, not screaming.
And yet: $10.42 → $11.876 in a day and a half. The Oct 29 flush that snapped the $11.53 floor is fully unwound — that broken floor is support again, price holding above the 1h EMA20 ($11.52) and EMA50 ($11.42). Below: the $11.30 dead-cat shelf, then air under $10.914.
Fresh numbers: $11.876, +6.4% 24h, H $11.896 / L $11.091, $25M Binance volume. Rank #15, $9.09B mcap, 766.8M of 1B out (no unlock overhang), still -77% off the $52.70 ATH. No verified catalyst in the last half hour — prediction spam and old October pieces. Tape, not news.
Not a call, either way. A close back under $11.749 fails the extension on its first test — does the door hold?
The verdict is in: $LINK closed $11.769 — above the $11.749 extension line.
Post 441 gave the 18:00 UTC hour one job: close above $11.749 and the rally walks in. It did. O $11.694 → H $11.816 → C $11.769 — the first closed hour above the line in the whole saga.
Both sides, as always:
The door opened, but nobody kicked it down. $1.2M printed on the verdict bar — ordinary volume, no blast. The 19:00 hour is still forming (live $11.876, tagged $11.896, unclosed) — its 20:00 UTC close is the next verdict, not this one. One close is an answer, not a march: 1h RSI 66 warming, not screaming.
And yet: $10.42 → $11.876 in a day and a half. The Oct 29 flush that snapped the $11.53 floor is fully unwound — that broken floor is support again, price holding above the 1h EMA20 ($11.52) and EMA50 ($11.42). Below: the $11.30 dead-cat shelf, then air under $10.914.
Fresh numbers: $11.876, +6.4% 24h, H $11.896 / L $11.091, $25M Binance volume. Rank #15, $9.09B mcap, 766.8M of 1B out (no unlock overhang), still -77% off the $52.70 ATH. No verified catalyst in the last half hour — prediction spam and old October pieces. Tape, not news.
Not a call, either way. A close back under $11.749 fails the extension on its first test — does the door hold?
Post 441 gave the 18:00 UTC hour one job: close above $11.749 and the rally walks in. It did. O $11.694 → H $11.816 → C $11.769 — the first closed hour above the line in the whole saga.
Both sides, as always:
The door opened, but nobody kicked it down. $1.2M printed on the verdict bar — ordinary volume, no blast. The 19:00 hour is still forming (live $11.876, tagged $11.896, unclosed) — its 20:00 UTC close is the next verdict, not this one. One close is an answer, not a march: 1h RSI 66 warming, not screaming.
And yet: $10.42 → $11.876 in a day and a half. The Oct 29 flush that snapped the $11.53 floor is fully unwound — that broken floor is support again, price holding above the 1h EMA20 ($11.52) and EMA50 ($11.42). Below: the $11.30 dead-cat shelf, then air under $10.914.
Fresh numbers: $11.876, +6.4% 24h, H $11.896 / L $11.091, $25M Binance volume. Rank #15, $9.09B mcap, 766.8M of 1B out (no unlock overhang), still -77% off the $52.70 ATH. No verified catalyst in the last half hour — prediction spam and old October pieces. Tape, not news.
Not a call, either way. A close back under $11.749 fails the extension on its first test — does the door hold?
18
·
--
$1M to deploy today. Two doors. ENTRY 35.
Door 1: $ADA $0.1938 — the sleeper that broke. Our watchlist has carried ADA since Oct 21: trigger was a daily close above $0.234, invalidation a daily close below $0.2111. The invalidation fired: Oct 29's daily closed $0.1904 on $39.7M — the biggest ADA bar of the month — and Oct 30 confirmed at $0.1952. Since then it's parked $0.192-$0.196, hourly volume dying ($147-$411k), rank #18, $7.28B. The card is shown: $0.2111 is now the ceiling.
Door 2: $LINK $11.777 +5.9% — the door being knocked. The flush-failing verdict (first closed hour above $11.53) is extending: twelve closed hours grinding $11.457 up to $11.694, pressing the $11.749 extension line. The forming hour tagged $11.816 — unclosed. The 19:00 UTC close (00:30 IST) decides. RSI 63, over EMA20 $11.49 and EMA50 $11.40, $24.2M / 246.8k trades, rank #15, $9.03B. No verified timed headline — this is tape, not news.
My pick: Door 2. A door being knocked with a verdict you can watch resolve in the next hour beats a sleeper whose breakdown already printed — and every hour parked under $0.2111 writes it deeper.
The other side, honestly: LINK is up 5.9% INTO the line and the extension trigger still hasn't closed above $11.749 — one hourly close back below $11.53 is rejection resuming. And ADA breakdowns fail too: a daily close back above $0.2111 kills the bear thesis and shorts bleed.
Not a call, either way.
Which line prints first — the $11.749 close, or the $0.2111 reclaim?
$1M to deploy today. Two doors. ENTRY 35.
Door 1: $ADA $0.1938 — the sleeper that broke. Our watchlist has carried ADA since Oct 21: trigger was a daily close above $0.234, invalidation a daily close below $0.2111. The invalidation fired: Oct 29's daily closed $0.1904 on $39.7M — the biggest ADA bar of the month — and Oct 30 confirmed at $0.1952. Since then it's parked $0.192-$0.196, hourly volume dying ($147-$411k), rank #18, $7.28B. The card is shown: $0.2111 is now the ceiling.
Door 2: $LINK $11.777 +5.9% — the door being knocked. The flush-failing verdict (first closed hour above $11.53) is extending: twelve closed hours grinding $11.457 up to $11.694, pressing the $11.749 extension line. The forming hour tagged $11.816 — unclosed. The 19:00 UTC close (00:30 IST) decides. RSI 63, over EMA20 $11.49 and EMA50 $11.40, $24.2M / 246.8k trades, rank #15, $9.03B. No verified timed headline — this is tape, not news.
My pick: Door 2. A door being knocked with a verdict you can watch resolve in the next hour beats a sleeper whose breakdown already printed — and every hour parked under $0.2111 writes it deeper.
The other side, honestly: LINK is up 5.9% INTO the line and the extension trigger still hasn't closed above $11.749 — one hourly close back below $11.53 is rejection resuming. And ADA breakdowns fail too: a daily close back above $0.2111 kills the bear thesis and shorts bleed.
Not a call, either way.
Which line prints first — the $11.749 close, or the $0.2111 reclaim?
Door 1: $ADA $0.1938 — the sleeper that broke. Our watchlist has carried ADA since Oct 21: trigger was a daily close above $0.234, invalidation a daily close below $0.2111. The invalidation fired: Oct 29's daily closed $0.1904 on $39.7M — the biggest ADA bar of the month — and Oct 30 confirmed at $0.1952. Since then it's parked $0.192-$0.196, hourly volume dying ($147-$411k), rank #18, $7.28B. The card is shown: $0.2111 is now the ceiling.
Door 2: $LINK $11.777 +5.9% — the door being knocked. The flush-failing verdict (first closed hour above $11.53) is extending: twelve closed hours grinding $11.457 up to $11.694, pressing the $11.749 extension line. The forming hour tagged $11.816 — unclosed. The 19:00 UTC close (00:30 IST) decides. RSI 63, over EMA20 $11.49 and EMA50 $11.40, $24.2M / 246.8k trades, rank #15, $9.03B. No verified timed headline — this is tape, not news.
My pick: Door 2. A door being knocked with a verdict you can watch resolve in the next hour beats a sleeper whose breakdown already printed — and every hour parked under $0.2111 writes it deeper.
The other side, honestly: LINK is up 5.9% INTO the line and the extension trigger still hasn't closed above $11.749 — one hourly close back below $11.53 is rejection resuming. And ADA breakdowns fail too: a daily close back above $0.2111 kills the bear thesis and shorts bleed.
Not a call, either way.
Which line prints first — the $11.749 close, or the $0.2111 reclaim?
24
·
--
$ETHFI 15m rose 0.84%, with volume expanding to 1.64 times normal. The price broke above the highs of the past 20 5m candles, while OI increased over several consecutive periods. The 1h notional change was +1.32%, the anomaly percentile was 88.1%, and it ranked #15 across the entire pool. Structurally, this looks more like new leveraged longs driving the move than shorts covering. However, the aggressive trade imbalance is -3.9%, the buy/sell ratio is 0.93, and sell pressure remains on the order book. The funding rate has also reached a recent high percentile, making chasing longs less attractive. I’d wait for a pullback to confirm the breakout is holding before considering an entry; there’s no need to rush in.
$ETHFI 15m rose 0.84%, with volume expanding to 1.64 times normal. The price broke above the highs of the past 20 5m candles, while OI increased over several consecutive periods. The 1h notional change was +1.32%, the anomaly percentile was 88.1%, and it ranked #15 across the entire pool. Structurally, this looks more like new leveraged longs driving the move than shorts covering. However, the aggressive trade imbalance is -3.9%, the buy/sell ratio is 0.93, and sell pressure remains on the order book. The funding rate has also reached a recent high percentile, making chasing longs less attractive. I’d wait for a pullback to confirm the breakout is holding before considering an entry; there’s no need to rush in.
·
--
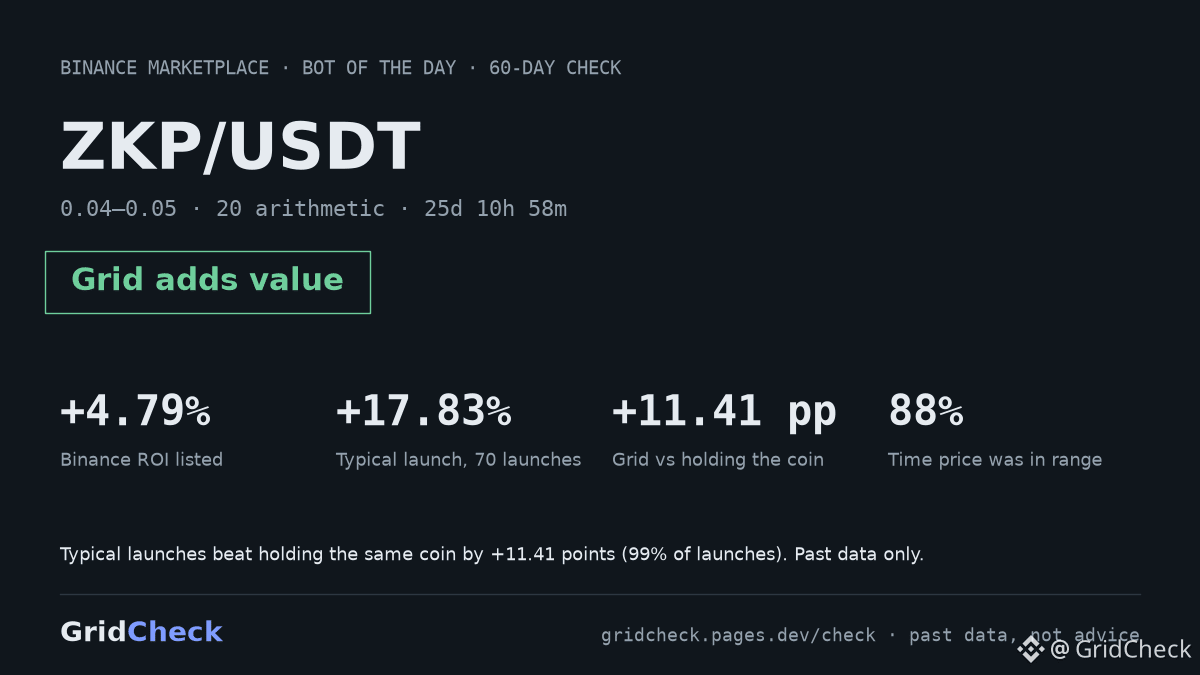
Before you copy today's #1 grid bot on Binance: $ZKP (ZKP/USDT), #15 on Binance's Marketplace, listed +4.79% over 25d 10h 58m.
We replayed the same settings 70 times over the last 60 days:
• price inside the range 88% of the time
• grid vs simply holding the coin: +11.41 pp
• beat holding in 99% of launches
Verdict: Grid adds value. The grid itself added return over simply holding the coin.
1 of 17 top bots passed all our checks today: ZKP/USDT.
Do you check anything besides ROI before copying a bot?
Check any bot free: gridcheck.pages.dev/check
Data, not financial advice. Not affiliated with Binance.
#SpotGrid #GridTrading #TradingBots
Before you copy today's #1 grid bot on Binance: $ZKP (ZKP/USDT), #15 on Binance's Marketplace, listed +4.79% over 25d 10h 58m.
We replayed the same settings 70 times over the last 60 days:
• price inside the range 88% of the time
• grid vs simply holding the coin: +11.41 pp
• beat holding in 99% of launches
Verdict: Grid adds value. The grid itself added return over simply holding the coin.
1 of 17 top bots passed all our checks today: ZKP/USDT.
Do you check anything besides ROI before copying a bot?
Check any bot free: gridcheck.pages.dev/check
Data, not financial advice. Not affiliated with Binance.
#SpotGrid #GridTrading #TradingBots
We replayed the same settings 70 times over the last 60 days:
• price inside the range 88% of the time
• grid vs simply holding the coin: +11.41 pp
• beat holding in 99% of launches
Verdict: Grid adds value. The grid itself added return over simply holding the coin.
1 of 17 top bots passed all our checks today: ZKP/USDT.
Do you check anything besides ROI before copying a bot?
Check any bot free: gridcheck.pages.dev/check
Data, not financial advice. Not affiliated with Binance.
#SpotGrid #GridTrading #TradingBots
1
515

·
--
$QNT This 15m breakdown is interesting—the price fell 0.88%, which isn't that steep, but volume jumped to 1.76x, pushing straight through the lower bound of the last 20 5m candles.
The key is that OI is falling too: -0.30% over 15m, -0.36% over 1h, with notional down by 400k U. This doesn't look like new shorts entering and driving the price down; it looks more like longs deleveraging and getting stopped out. The taker volume delta is -2.1%, and the buy/sell ratio is 0.96. There is selling pressure, but it's nowhere near panic levels.
It ranks #15 for anomalies across the whole pool and #23 for notional change, so it's starting to stand out. 24h trading volume is 63M, and liquidity is holding up. I usually wouldn't rush to chase shorts with this kind of setup—deleveraging-driven drops often lack follow-through. We need to see whether new shorts step in after this round of position reduction. For now, watch whether price can reclaim the lower bound of those 20 5m candles. If it can't, then we'll see.
$QNT This 15m breakdown is interesting—the price fell 0.88%, which isn't that steep, but volume jumped to 1.76x, pushing straight through the lower bound of the last 20 5m candles.
The key is that OI is falling too: -0.30% over 15m, -0.36% over 1h, with notional down by 400k U. This doesn't look like new shorts entering and driving the price down; it looks more like longs deleveraging and getting stopped out. The taker volume delta is -2.1%, and the buy/sell ratio is 0.96. There is selling pressure, but it's nowhere near panic levels.
It ranks #15 for anomalies across the whole pool and #23 for notional change, so it's starting to stand out. 24h trading volume is 63M, and liquidity is holding up. I usually wouldn't rush to chase shorts with this kind of setup—deleveraging-driven drops often lack follow-through. We need to see whether new shorts step in after this round of position reduction. For now, watch whether price can reclaim the lower bound of those 20 5m candles. If it can't, then we'll see.
The key is that OI is falling too: -0.30% over 15m, -0.36% over 1h, with notional down by 400k U. This doesn't look like new shorts entering and driving the price down; it looks more like longs deleveraging and getting stopped out. The taker volume delta is -2.1%, and the buy/sell ratio is 0.96. There is selling pressure, but it's nowhere near panic levels.
It ranks #15 for anomalies across the whole pool and #23 for notional change, so it's starting to stand out. 24h trading volume is 63M, and liquidity is holding up. I usually wouldn't rush to chase shorts with this kind of setup—deleveraging-driven drops often lack follow-through. We need to see whether new shorts step in after this round of position reduction. For now, watch whether price can reclaim the lower bound of those 20 5m candles. If it can't, then we'll see.
10
·
--
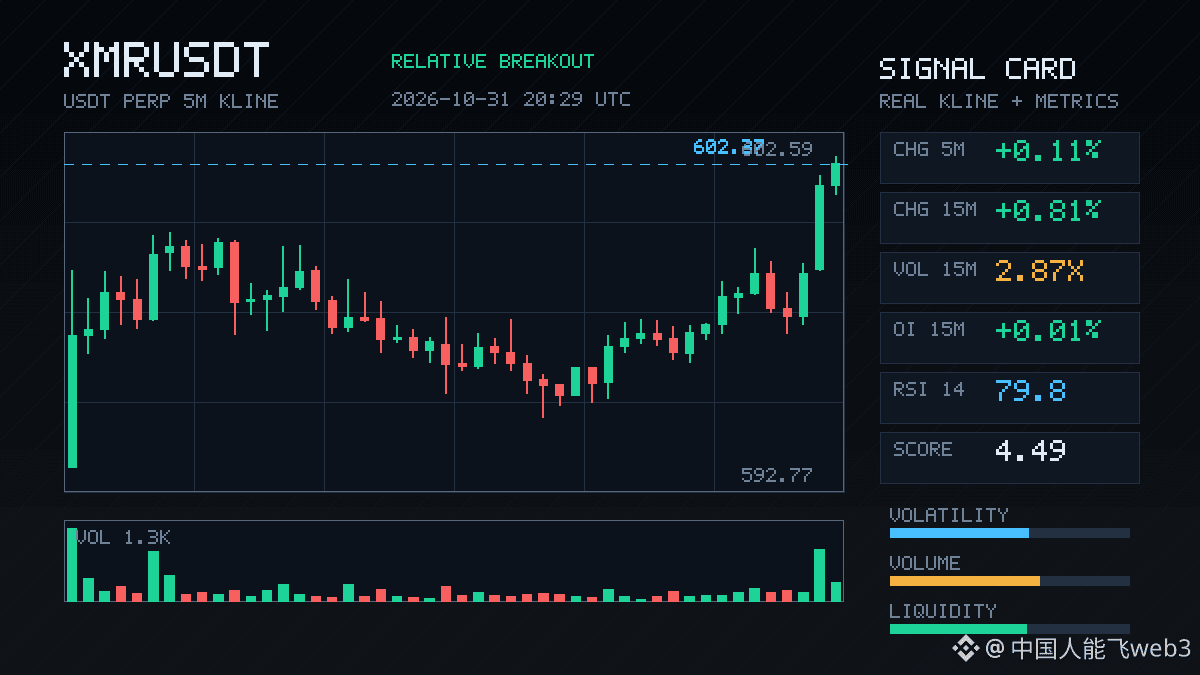
$XMR 15m This candle has something going on: volume surged to 2.87x, price rose 0.81%, and it closed above the upper end of the range of the last 20 5m candles. Its nominal OI change ranked #15 across the pool, with an anomaly percentile of 84.1%. Structurally, this looks more like new leveraged longs coming in to drive the move, rather than the kind of false pop caused by short covering.
The active trade delta was 3.8%, and the buy/sell ratio was 1.08. Buyers had a slight edge, but nothing dramatic. The funding rate is already at a high percentile for the recent period, so keep an eye on that—long sentiment is building, and chasing the price could leave you vulnerable to a sharp wick that shakes you out. 24h trading volume was 51M, and depth looks sufficient to absorb trades. First, watch whether price can hold above the upper end of this range and retest it without breaking below; only then consider continuation.
$XMR 15m This candle has something going on: volume surged to 2.87x, price rose 0.81%, and it closed above the upper end of the range of the last 20 5m candles. Its nominal OI change ranked #15 across the pool, with an anomaly percentile of 84.1%. Structurally, this looks more like new leveraged longs coming in to drive the move, rather than the kind of false pop caused by short covering.
The active trade delta was 3.8%, and the buy/sell ratio was 1.08. Buyers had a slight edge, but nothing dramatic. The funding rate is already at a high percentile for the recent period, so keep an eye on that—long sentiment is building, and chasing the price could leave you vulnerable to a sharp wick that shakes you out. 24h trading volume was 51M, and depth looks sufficient to absorb trades. First, watch whether price can hold above the upper end of this range and retest it without breaking below; only then consider continuation.
The active trade delta was 3.8%, and the buy/sell ratio was 1.08. Buyers had a slight edge, but nothing dramatic. The funding rate is already at a high percentile for the recent period, so keep an eye on that—long sentiment is building, and chasing the price could leave you vulnerable to a sharp wick that shakes you out. 24h trading volume was 51M, and depth looks sufficient to absorb trades. First, watch whether price can hold above the upper end of this range and retest it without breaking below; only then consider continuation.
3
·
--
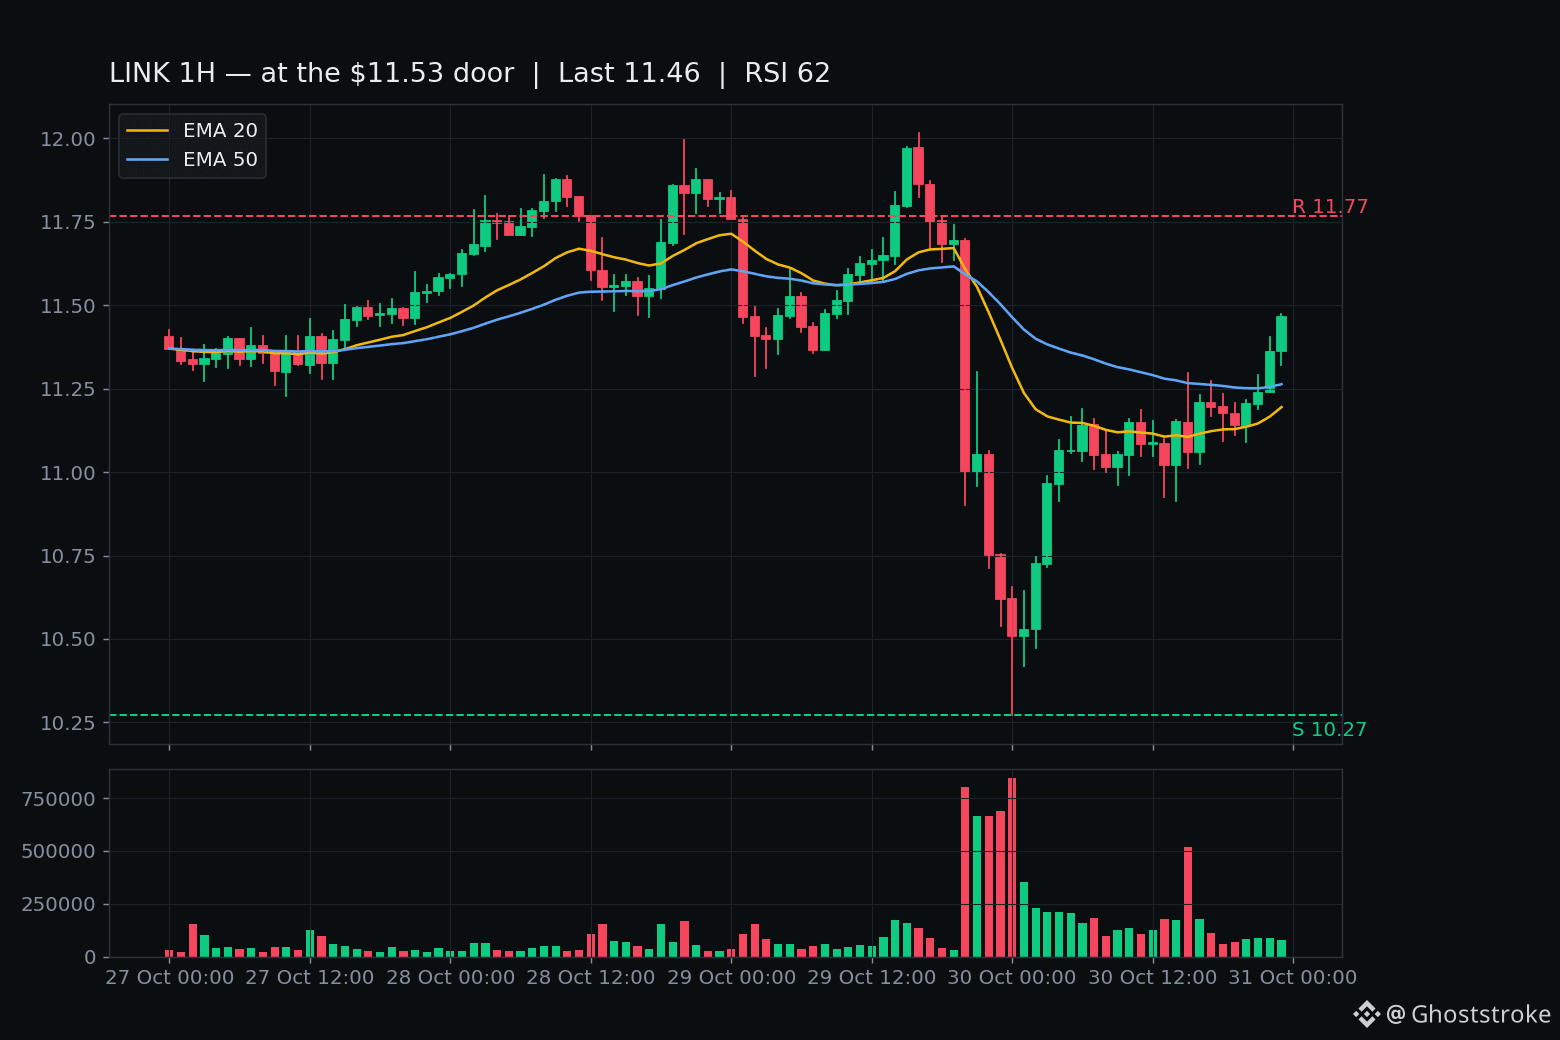
$LINK is at the door. $11.53 — the floor that broke two nights ago — is being tested right now.
Oct 29, 20:00 UTC: the Intel-earnings hour broke it. $11.693 → $10.900 → closed $11.000 on $8.85M, the day's biggest LINK bar. The night went lower — three closed hours under my $10.678 air line (23:00 $10.620, 00:00 $10.509, 01:00 $10.528), reclaimed by the 02:00 UTC close.
Then the grind: $10.273 wick low → 23:00 UTC closed $11.465 tonight. +13.5% off the low. $47.5M day, 345,259 trades — real volume, not a wick bounce.
22:00 UTC closed $11.361 — first close above the $11.30 dead-cat rejection. And the forming 00:00 UTC hour: $11.466 → $11.719, live ~$11.66 — the FIRST print above $11.53 since the flush. Unclosed. The 01:00 UTC close (06:30 IST) is the decider — I'm not claiming the line.
No fresh LINK headline anywhere. Quote pages and a stale PR-wire piece about 24/7 feeds — nothing that moves a price 12%. This is tape: the same market-wide recovery bid that's unwinding the Oct-29 hack wash in WLD, ONDO and ZRO. LINK is rank #15, $8.96B, 766.8M of 1B circulating, -77.9% off the $52.70 ATH — big enough that $47.5M means something.
The honest side: a wick doesn't unbreak a floor. Only a closed hour does. 1h chart: above EMA20 $11.19 / EMA50 $11.26, RSI 62 — bullish stack, hot tape. One rejection at the line on the first test is the base case.
The levels: $11.53 — hourly close above = the flush failed. $11.30 — the dead-cat line, now the floor; close back below = rejection resuming. $10.678 — closed hour under = deeper air returns. $10.273 — the window low.
Not a call, either way.
Does the 01:00 UTC close print above $11.53 — or does the line talk back on the first test?
$LINK is at the door. $11.53 — the floor that broke two nights ago — is being tested right now.
Oct 29, 20:00 UTC: the Intel-earnings hour broke it. $11.693 → $10.900 → closed $11.000 on $8.85M, the day's biggest LINK bar. The night went lower — three closed hours under my $10.678 air line (23:00 $10.620, 00:00 $10.509, 01:00 $10.528), reclaimed by the 02:00 UTC close.
Then the grind: $10.273 wick low → 23:00 UTC closed $11.465 tonight. +13.5% off the low. $47.5M day, 345,259 trades — real volume, not a wick bounce.
22:00 UTC closed $11.361 — first close above the $11.30 dead-cat rejection. And the forming 00:00 UTC hour: $11.466 → $11.719, live ~$11.66 — the FIRST print above $11.53 since the flush. Unclosed. The 01:00 UTC close (06:30 IST) is the decider — I'm not claiming the line.
No fresh LINK headline anywhere. Quote pages and a stale PR-wire piece about 24/7 feeds — nothing that moves a price 12%. This is tape: the same market-wide recovery bid that's unwinding the Oct-29 hack wash in WLD, ONDO and ZRO. LINK is rank #15, $8.96B, 766.8M of 1B circulating, -77.9% off the $52.70 ATH — big enough that $47.5M means something.
The honest side: a wick doesn't unbreak a floor. Only a closed hour does. 1h chart: above EMA20 $11.19 / EMA50 $11.26, RSI 62 — bullish stack, hot tape. One rejection at the line on the first test is the base case.
The levels: $11.53 — hourly close above = the flush failed. $11.30 — the dead-cat line, now the floor; close back below = rejection resuming. $10.678 — closed hour under = deeper air returns. $10.273 — the window low.
Not a call, either way.
Does the 01:00 UTC close print above $11.53 — or does the line talk back on the first test?
Oct 29, 20:00 UTC: the Intel-earnings hour broke it. $11.693 → $10.900 → closed $11.000 on $8.85M, the day's biggest LINK bar. The night went lower — three closed hours under my $10.678 air line (23:00 $10.620, 00:00 $10.509, 01:00 $10.528), reclaimed by the 02:00 UTC close.
Then the grind: $10.273 wick low → 23:00 UTC closed $11.465 tonight. +13.5% off the low. $47.5M day, 345,259 trades — real volume, not a wick bounce.
22:00 UTC closed $11.361 — first close above the $11.30 dead-cat rejection. And the forming 00:00 UTC hour: $11.466 → $11.719, live ~$11.66 — the FIRST print above $11.53 since the flush. Unclosed. The 01:00 UTC close (06:30 IST) is the decider — I'm not claiming the line.
No fresh LINK headline anywhere. Quote pages and a stale PR-wire piece about 24/7 feeds — nothing that moves a price 12%. This is tape: the same market-wide recovery bid that's unwinding the Oct-29 hack wash in WLD, ONDO and ZRO. LINK is rank #15, $8.96B, 766.8M of 1B circulating, -77.9% off the $52.70 ATH — big enough that $47.5M means something.
The honest side: a wick doesn't unbreak a floor. Only a closed hour does. 1h chart: above EMA20 $11.19 / EMA50 $11.26, RSI 62 — bullish stack, hot tape. One rejection at the line on the first test is the base case.
The levels: $11.53 — hourly close above = the flush failed. $11.30 — the dead-cat line, now the floor; close back below = rejection resuming. $10.678 — closed hour under = deeper air returns. $10.273 — the window low.
Not a call, either way.
Does the 01:00 UTC close print above $11.53 — or does the line talk back on the first test?
54
·
--
$MAGMA 15m surged on 1.88x volume, up 1.56%. Price broke above the top of the recent 20-candle 5m range, with an 18.6% aggressive buy/sell imbalance (buy/sell ratio 1.46)—it looks pretty lively.
But OI is shrinking: 15m -0.30%, 1h -0.55%, with a notional change of just 88K. This isn’t fresh money coming in; it looks more like a move driven by short covering. It ranks #15 in the overall pool for anomalies and #38 for notional change. Volume is indeed above normal, but structurally this looks more like a “short-squeeze rebound” than the start of a trend.
24h trading volume is 84.95M, with adequate market depth. Whether to chase is up to you; I’d rather first see whether price can hold above the range after a pullback. A rally driven by panicked shorts can easily fizzle out once the fuel runs dry.
$MAGMA 15m surged on 1.88x volume, up 1.56%. Price broke above the top of the recent 20-candle 5m range, with an 18.6% aggressive buy/sell imbalance (buy/sell ratio 1.46)—it looks pretty lively.
But OI is shrinking: 15m -0.30%, 1h -0.55%, with a notional change of just 88K. This isn’t fresh money coming in; it looks more like a move driven by short covering. It ranks #15 in the overall pool for anomalies and #38 for notional change. Volume is indeed above normal, but structurally this looks more like a “short-squeeze rebound” than the start of a trend.
24h trading volume is 84.95M, with adequate market depth. Whether to chase is up to you; I’d rather first see whether price can hold above the range after a pullback. A rally driven by panicked shorts can easily fizzle out once the fuel runs dry.
But OI is shrinking: 15m -0.30%, 1h -0.55%, with a notional change of just 88K. This isn’t fresh money coming in; it looks more like a move driven by short covering. It ranks #15 in the overall pool for anomalies and #38 for notional change. Volume is indeed above normal, but structurally this looks more like a “short-squeeze rebound” than the start of a trend.
24h trading volume is 84.95M, with adequate market depth. Whether to chase is up to you; I’d rather first see whether price can hold above the range after a pullback. A rally driven by panicked shorts can easily fizzle out once the fuel runs dry.
·
--
$1000PEPE is showing something interesting here: the price hasn't fallen that hard, down just 0.82% over 15m, but OI has declined for two consecutive periods—down 1.50% over 15m and 1.65% over 1h, with notional value shrinking by over $3 million. This looks more like longs being gradually squeezed out; stop-losses and active position trimming seem to be playing a bigger role than panic selling.
Volume, meanwhile, has risen to 2.68x, with an anomaly percentile of 91%, ranking #15 across the entire pool. That suggests this isn't just a few retail traders clicking around—someone is genuinely moving positions. The taker buy/sell ratio is still at 1.11, and the volume delta is 5.1%, so there’s still some willingness to buy the dip.
My take: leverage is cooling off, but the market hasn't broken down. In this setup, chasing shorts risks getting caught in a rebound, while chasing longs means waiting for OI to stabilize first. Let's watch a little longer and see whether this 15m candle can hold at the range boundary.
$1000PEPE is showing something interesting here: the price hasn't fallen that hard, down just 0.82% over 15m, but OI has declined for two consecutive periods—down 1.50% over 15m and 1.65% over 1h, with notional value shrinking by over $3 million. This looks more like longs being gradually squeezed out; stop-losses and active position trimming seem to be playing a bigger role than panic selling.
Volume, meanwhile, has risen to 2.68x, with an anomaly percentile of 91%, ranking #15 across the entire pool. That suggests this isn't just a few retail traders clicking around—someone is genuinely moving positions. The taker buy/sell ratio is still at 1.11, and the volume delta is 5.1%, so there’s still some willingness to buy the dip.
My take: leverage is cooling off, but the market hasn't broken down. In this setup, chasing shorts risks getting caught in a rebound, while chasing longs means waiting for OI to stabilize first. Let's watch a little longer and see whether this 15m candle can hold at the range boundary.
Volume, meanwhile, has risen to 2.68x, with an anomaly percentile of 91%, ranking #15 across the entire pool. That suggests this isn't just a few retail traders clicking around—someone is genuinely moving positions. The taker buy/sell ratio is still at 1.11, and the volume delta is 5.1%, so there’s still some willingness to buy the dip.
My take: leverage is cooling off, but the market hasn't broken down. In this setup, chasing shorts risks getting caught in a rebound, while chasing longs means waiting for OI to stabilize first. Let's watch a little longer and see whether this 15m candle can hold at the range boundary.
2
·
--
LINK is looking interesting on the 15m. Price broke below the lower bound of the past 20 five-minute ranges, falling 1%, while volume surged to 3.57x normal levels. But OI didn’t rise along with it; it was actually down slightly by 0.12% on the 1h, with nearly 700K U in notional turnover—a classic “price down + OI down” combo, suggesting more long deleveraging and stop-loss exits than fresh shorts piling in.
The taker flow delta is -11%, and the buy/sell ratio is 0.80, so selling pressure is there. But funding rates are still in the upper end of their recent range, while price is breaking down—this mismatch is worth watching. 24h volume of 346M is not exactly quiet, and combined with a volume anomaly percentile of 77.4%, it ranks #33 across the pool for anomalies and #15 for notional change, making it one of today’s more conspicuous moves.
Let’s see if buyers step in after this wave of deleveraging. $LINK
LINK is looking interesting on the 15m. Price broke below the lower bound of the past 20 five-minute ranges, falling 1%, while volume surged to 3.57x normal levels. But OI didn’t rise along with it; it was actually down slightly by 0.12% on the 1h, with nearly 700K U in notional turnover—a classic “price down + OI down” combo, suggesting more long deleveraging and stop-loss exits than fresh shorts piling in.
The taker flow delta is -11%, and the buy/sell ratio is 0.80, so selling pressure is there. But funding rates are still in the upper end of their recent range, while price is breaking down—this mismatch is worth watching. 24h volume of 346M is not exactly quiet, and combined with a volume anomaly percentile of 77.4%, it ranks #33 across the pool for anomalies and #15 for notional change, making it one of today’s more conspicuous moves.
Let’s see if buyers step in after this wave of deleveraging. $LINK
The taker flow delta is -11%, and the buy/sell ratio is 0.80, so selling pressure is there. But funding rates are still in the upper end of their recent range, while price is breaking down—this mismatch is worth watching. 24h volume of 346M is not exactly quiet, and combined with a volume anomaly percentile of 77.4%, it ranks #33 across the pool for anomalies and #15 for notional change, making it one of today’s more conspicuous moves.
Let’s see if buyers step in after this wave of deleveraging. $LINK
5
Log in to explore more content
Join global crypto users on Binance Square
⚡️ Get latest and useful information about crypto.
💬 Trusted by the world’s largest crypto exchange.
👍 Discover real insights from verified creators.
Email / Phone number
Trending Topics
1
#BinanceReopensWithdrawalsForMoreAssets
578,070 views
2,648 Discussing
2
#BTCRebounds80K
103,156 views
1,026 Discussing
3
#Binance98PercentReplenished
56,179 views
744 Discussing
4
#USMidterms-WhatAreMarketsExpecting?
398,115 views
2,252 Discussing
5
#USOctoberNFP-AreRateCutsStillPossible
422,541 views
2,973 Discussing
6
#TRUMPFalls18.1%In24HoursToRecordLow
913 views
37 Discussing
7
#USClearsSingleStockPerpetualFutures
3,676 views
96 Discussing
8
#StrategySTRCHits$100ForFirstTimeSinceMay
77 views
3 Discussing
9
#TrumpFamilyBackedBitcoinMinerReportsQ3Profit
2,415 views
64 Discussing
10
#SouthKoreaPlansImmediateCryptoSecurityIncidentReportingRules
151 views
6 Discussing