
TheCryptoSultan
510 Posts

TheCryptoSultan
Report
Block User
Binance Square Content Creator 📊📈📉✅
Occasional Trader
5.1 Years
73 Following
10 Followers
32 Liked
Posts
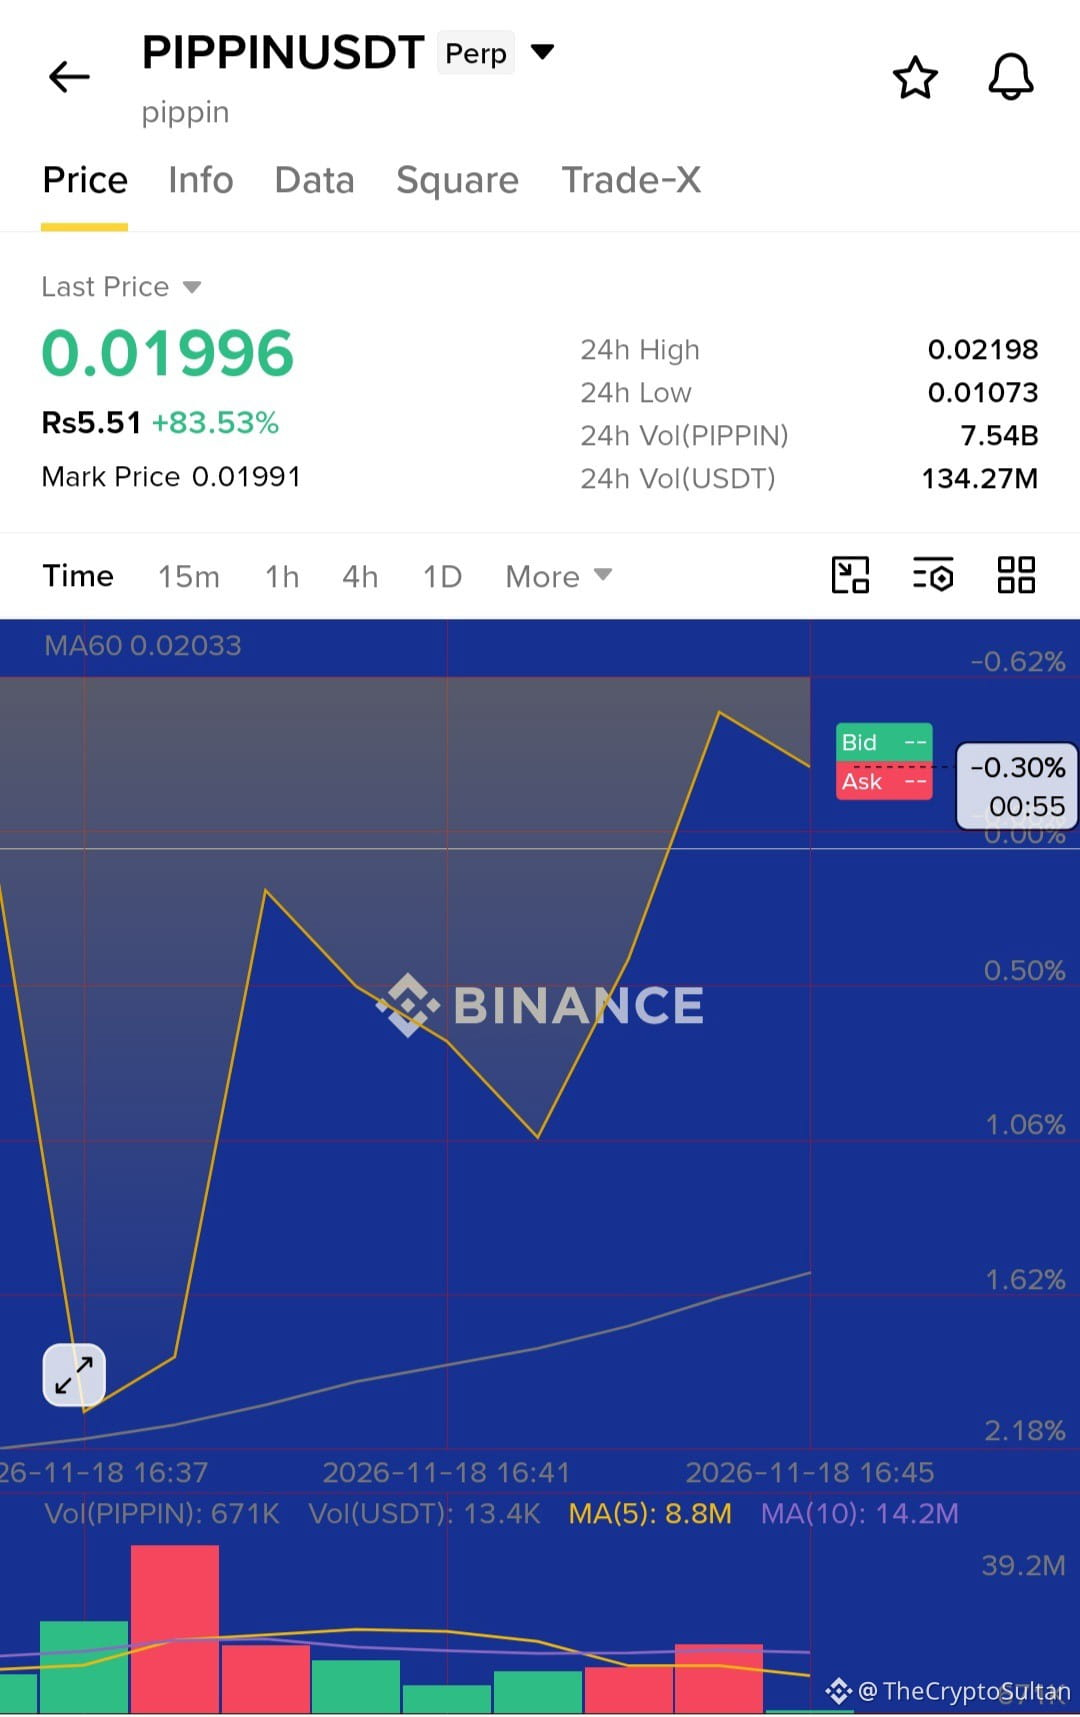
🚀 $PIPPIN – EXPLOSIVE BULLISH MOVE! BUYERS ARE TARGETING HIGHER LEVELS! 🔥
$PIPPIN is showing strong bullish potential, and traders are watching closely for the next upward move. If buyers maintain momentum and defend the key support zone, a breakout toward higher targets could be on the cards.
📊 LONG TRADE SETUP
🟢 Entry Zone: $0.0195 – $0.0200
🎯 TP1: $0.0210
🎯 TP2: $0.0220
🚀 TP3: $0.0240
🛑 Stop Loss: $0.0188
Market Outlook: Bulls are looking for continuation toward $0.0240. Watch price action around the entry zone and wait for confirmation before entering.
⚠️ Manage your risk, follow your trading plan, and always do your own research (DYOR).
Can $PIPPIN hit $0.0240? Let's watch! 🚀
#Pippin #cryptotrading #Binance #altcoins #BullishMomentum
🚀 $PIPPIN – EXPLOSIVE BULLISH MOVE! BUYERS ARE TARGETING HIGHER LEVELS! 🔥
$PIPPIN is showing strong bullish potential, and traders are watching closely for the next upward move. If buyers maintain momentum and defend the key support zone, a breakout toward higher targets could be on the cards.
📊 LONG TRADE SETUP
🟢 Entry Zone: $0.0195 – $0.0200
🎯 TP1: $0.0210
🎯 TP2: $0.0220
🚀 TP3: $0.0240
🛑 Stop Loss: $0.0188
Market Outlook: Bulls are looking for continuation toward $0.0240. Watch price action around the entry zone and wait for confirmation before entering.
⚠️ Manage your risk, follow your trading plan, and always do your own research (DYOR).
Can $PIPPIN hit $0.0240? Let's watch! 🚀
#Pippin #cryptotrading #Binance #altcoins #BullishMomentum
$PIPPIN is showing strong bullish potential, and traders are watching closely for the next upward move. If buyers maintain momentum and defend the key support zone, a breakout toward higher targets could be on the cards.
📊 LONG TRADE SETUP
🟢 Entry Zone: $0.0195 – $0.0200
🎯 TP1: $0.0210
🎯 TP2: $0.0220
🚀 TP3: $0.0240
🛑 Stop Loss: $0.0188
Market Outlook: Bulls are looking for continuation toward $0.0240. Watch price action around the entry zone and wait for confirmation before entering.
⚠️ Manage your risk, follow your trading plan, and always do your own research (DYOR).
Can $PIPPIN hit $0.0240? Let's watch! 🚀
#Pippin #cryptotrading #Binance #altcoins #BullishMomentum
3
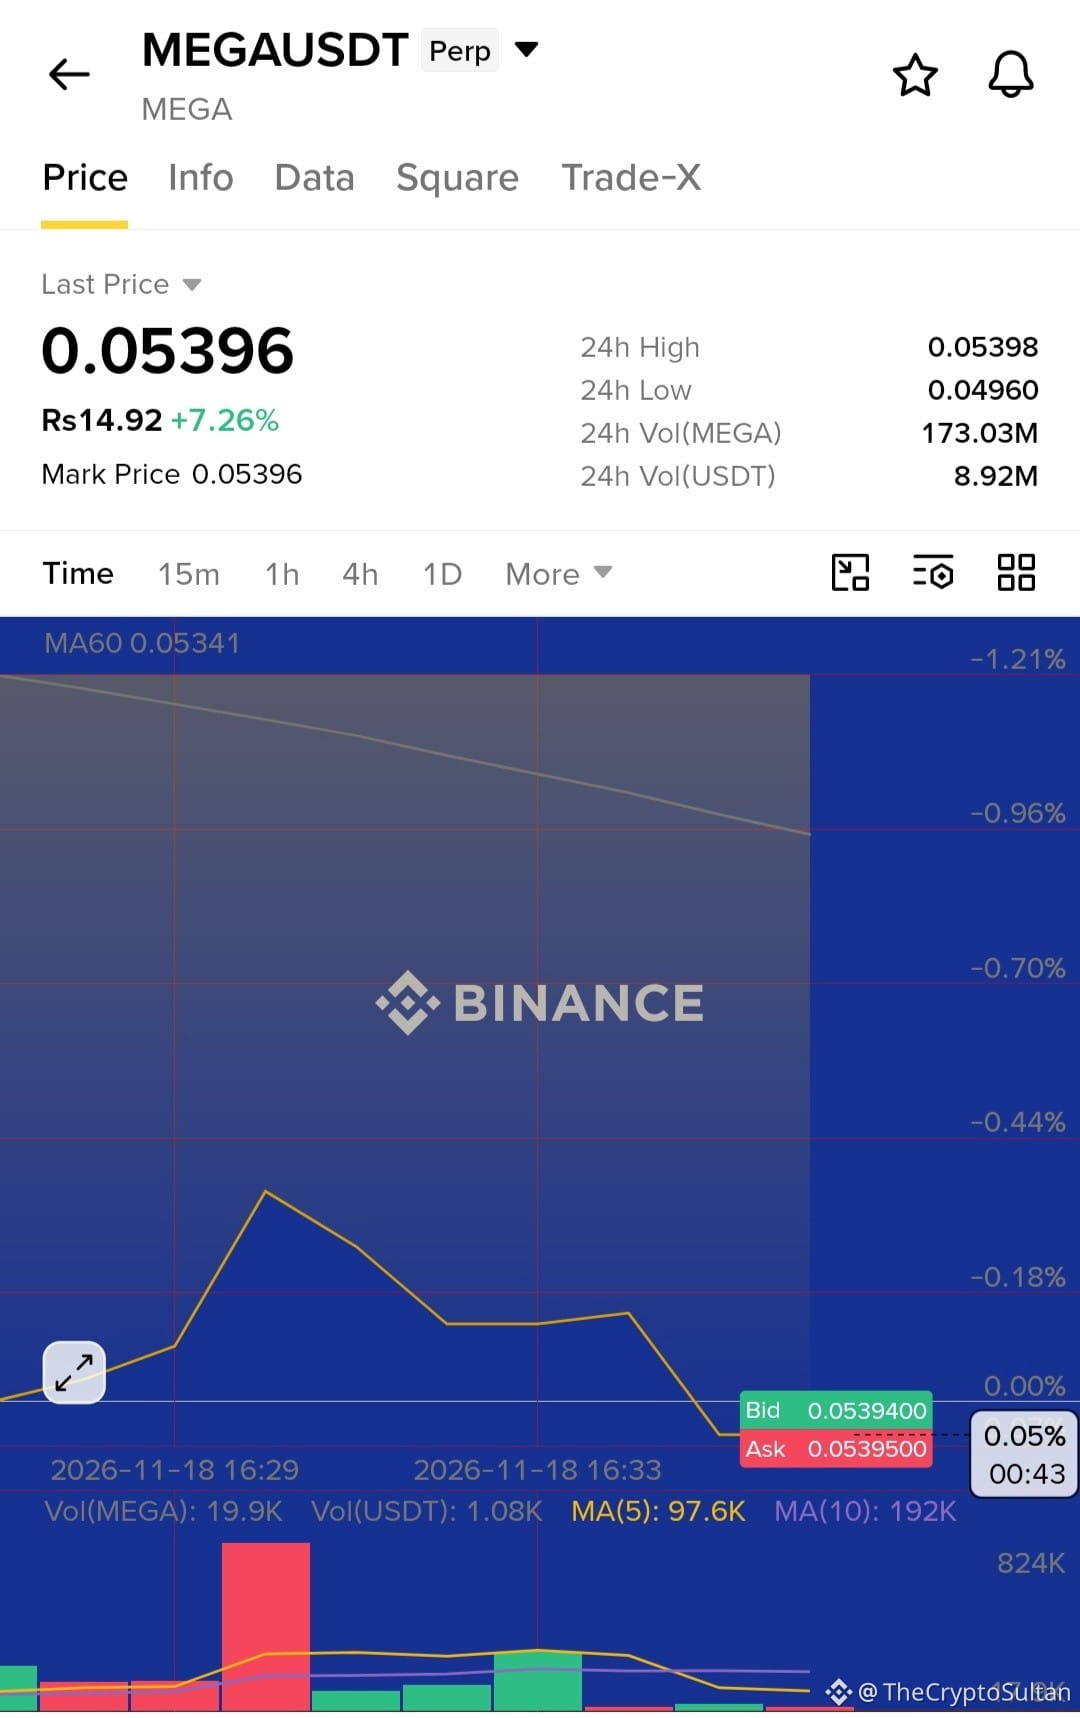
🚀 $MEGA BULLISH BREAKOUT – TARGETING 0.056124!
$MEGA has successfully broken above the 0.053550 resistance, with strong bullish follow-through on the 15M chart. Buyers are gaining momentum!
📈 LONG TRADE SETUP
Entry: 0.053860
🎯 TP1: 0.054615
🎯 TP2: 0.055369
🚀 Final TP: 0.056124
🛑 Stop Loss: 0.053105
As long as buyers maintain control, further upside looks possible. Watch the key resistance levels and manage risk carefully.
Can bulls push $MEGA toward 0.056124? 🔥
#MEGA #cryptotrading #BullishBreakout #BİNANCE #altcoins
🚀 $MEGA BULLISH BREAKOUT – TARGETING 0.056124!
$MEGA has successfully broken above the 0.053550 resistance, with strong bullish follow-through on the 15M chart. Buyers are gaining momentum!
📈 LONG TRADE SETUP
Entry: 0.053860
🎯 TP1: 0.054615
🎯 TP2: 0.055369
🚀 Final TP: 0.056124
🛑 Stop Loss: 0.053105
As long as buyers maintain control, further upside looks possible. Watch the key resistance levels and manage risk carefully.
Can bulls push $MEGA toward 0.056124? 🔥
#MEGA #cryptotrading #BullishBreakout #BİNANCE #altcoins
$MEGA has successfully broken above the 0.053550 resistance, with strong bullish follow-through on the 15M chart. Buyers are gaining momentum!
📈 LONG TRADE SETUP
Entry: 0.053860
🎯 TP1: 0.054615
🎯 TP2: 0.055369
🚀 Final TP: 0.056124
🛑 Stop Loss: 0.053105
As long as buyers maintain control, further upside looks possible. Watch the key resistance levels and manage risk carefully.
Can bulls push $MEGA toward 0.056124? 🔥
#MEGA #cryptotrading #BullishBreakout #BİNANCE #altcoins
3
·
--
Bullish
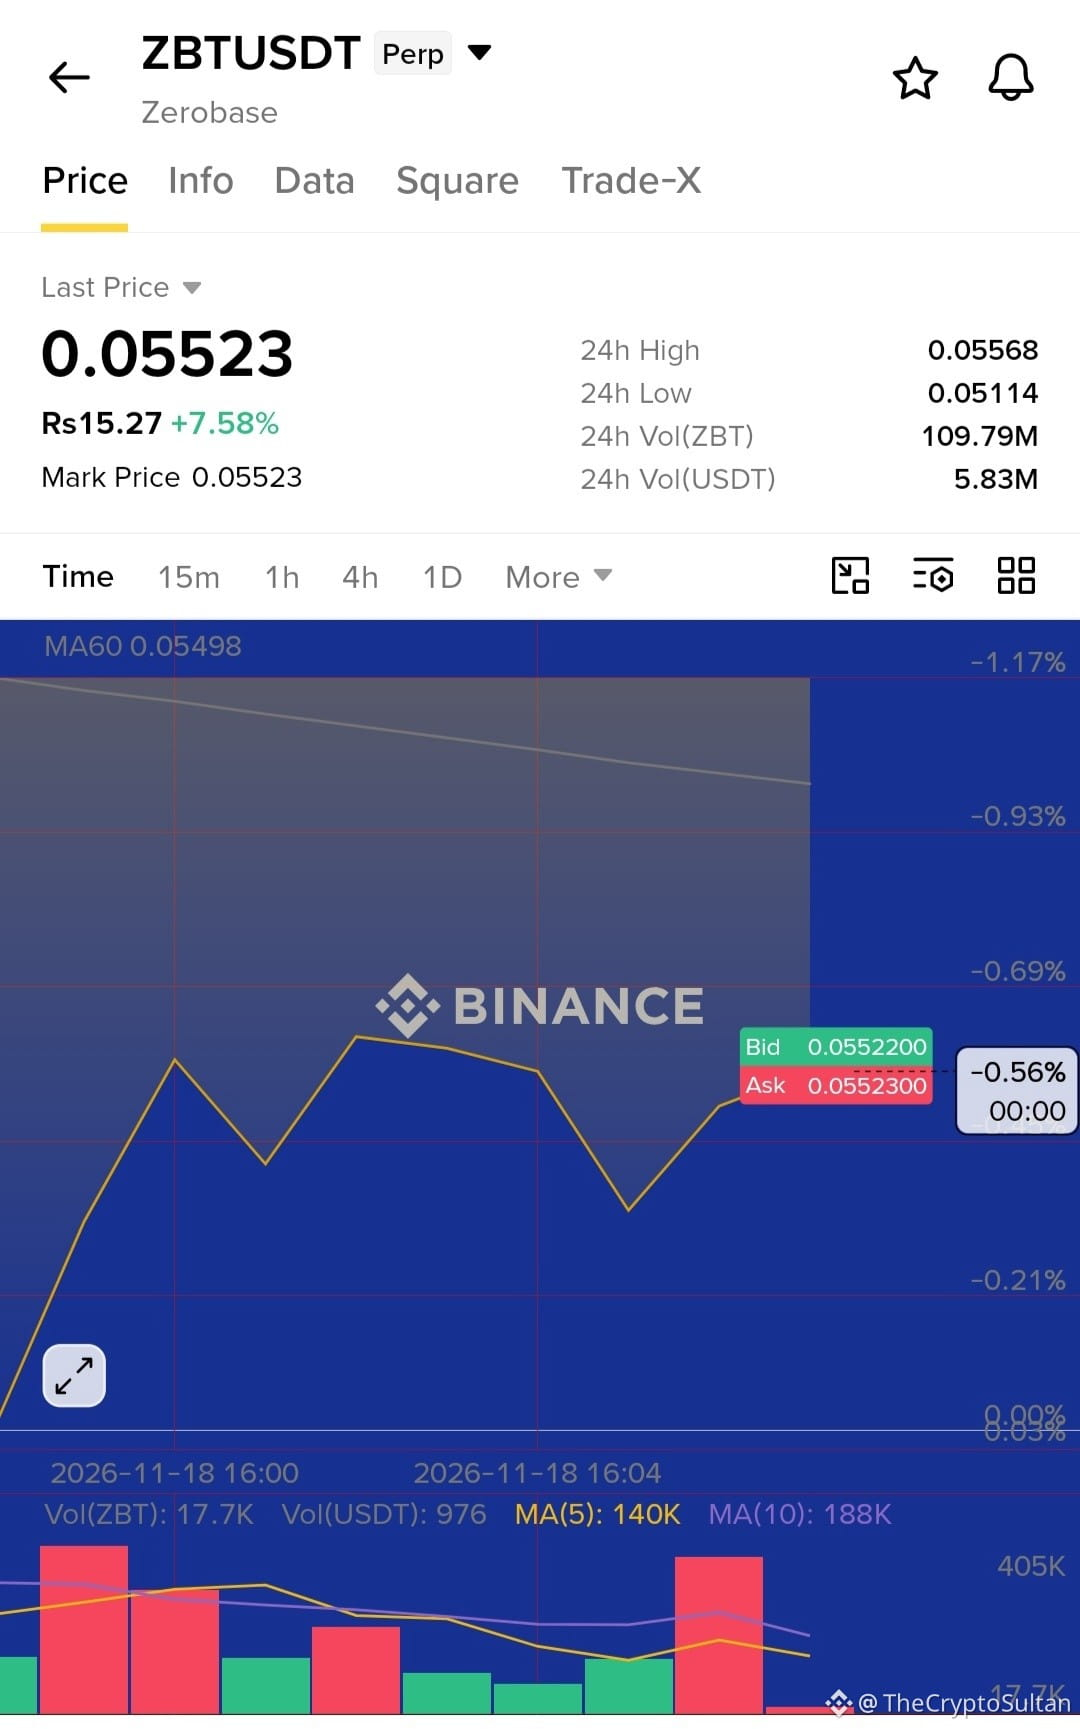
🚀 $ZBT BULLISH MOMENTUM IS BUILDING! – BUYERS TARGET HIGHER LEVELS! 🔥
$ZBT is showing renewed bullish strength after recovering strongly from the $0.049140 support zone. Buyers are stepping in, and the short-term market structure remains positive.
As long as ZBT holds above $0.054090, the bullish outlook stays intact, with further upside potential.
📈 LONG TRADE SETUP
🟢 Entry: $0.055113 – $0.055360
🎯 Take Profit: $0.056596
🛑 Stop Loss: $0.054124
Market Outlook: Bulls are gaining momentum! Watch the key support level and look for continued buying pressure.
Trade smart, manage your risk, and always do your own research (DYOR).
#ZBT #CryptoTrading #BullishMomentum #AltcoinSeason #BinanceSquare
🚀 $ZBT BULLISH MOMENTUM IS BUILDING! – BUYERS TARGET HIGHER LEVELS! 🔥
$ZBT is showing renewed bullish strength after recovering strongly from the $0.049140 support zone. Buyers are stepping in, and the short-term market structure remains positive.
As long as ZBT holds above $0.054090, the bullish outlook stays intact, with further upside potential.
📈 LONG TRADE SETUP
🟢 Entry: $0.055113 – $0.055360
🎯 Take Profit: $0.056596
🛑 Stop Loss: $0.054124
Market Outlook: Bulls are gaining momentum! Watch the key support level and look for continued buying pressure.
Trade smart, manage your risk, and always do your own research (DYOR).
#ZBT #CryptoTrading #BullishMomentum #AltcoinSeason #BinanceSquare
$ZBT is showing renewed bullish strength after recovering strongly from the $0.049140 support zone. Buyers are stepping in, and the short-term market structure remains positive.
As long as ZBT holds above $0.054090, the bullish outlook stays intact, with further upside potential.
📈 LONG TRADE SETUP
🟢 Entry: $0.055113 – $0.055360
🎯 Take Profit: $0.056596
🛑 Stop Loss: $0.054124
Market Outlook: Bulls are gaining momentum! Watch the key support level and look for continued buying pressure.
Trade smart, manage your risk, and always do your own research (DYOR).
#ZBT #CryptoTrading #BullishMomentum #AltcoinSeason #BinanceSquare
3
·
--
Bullish
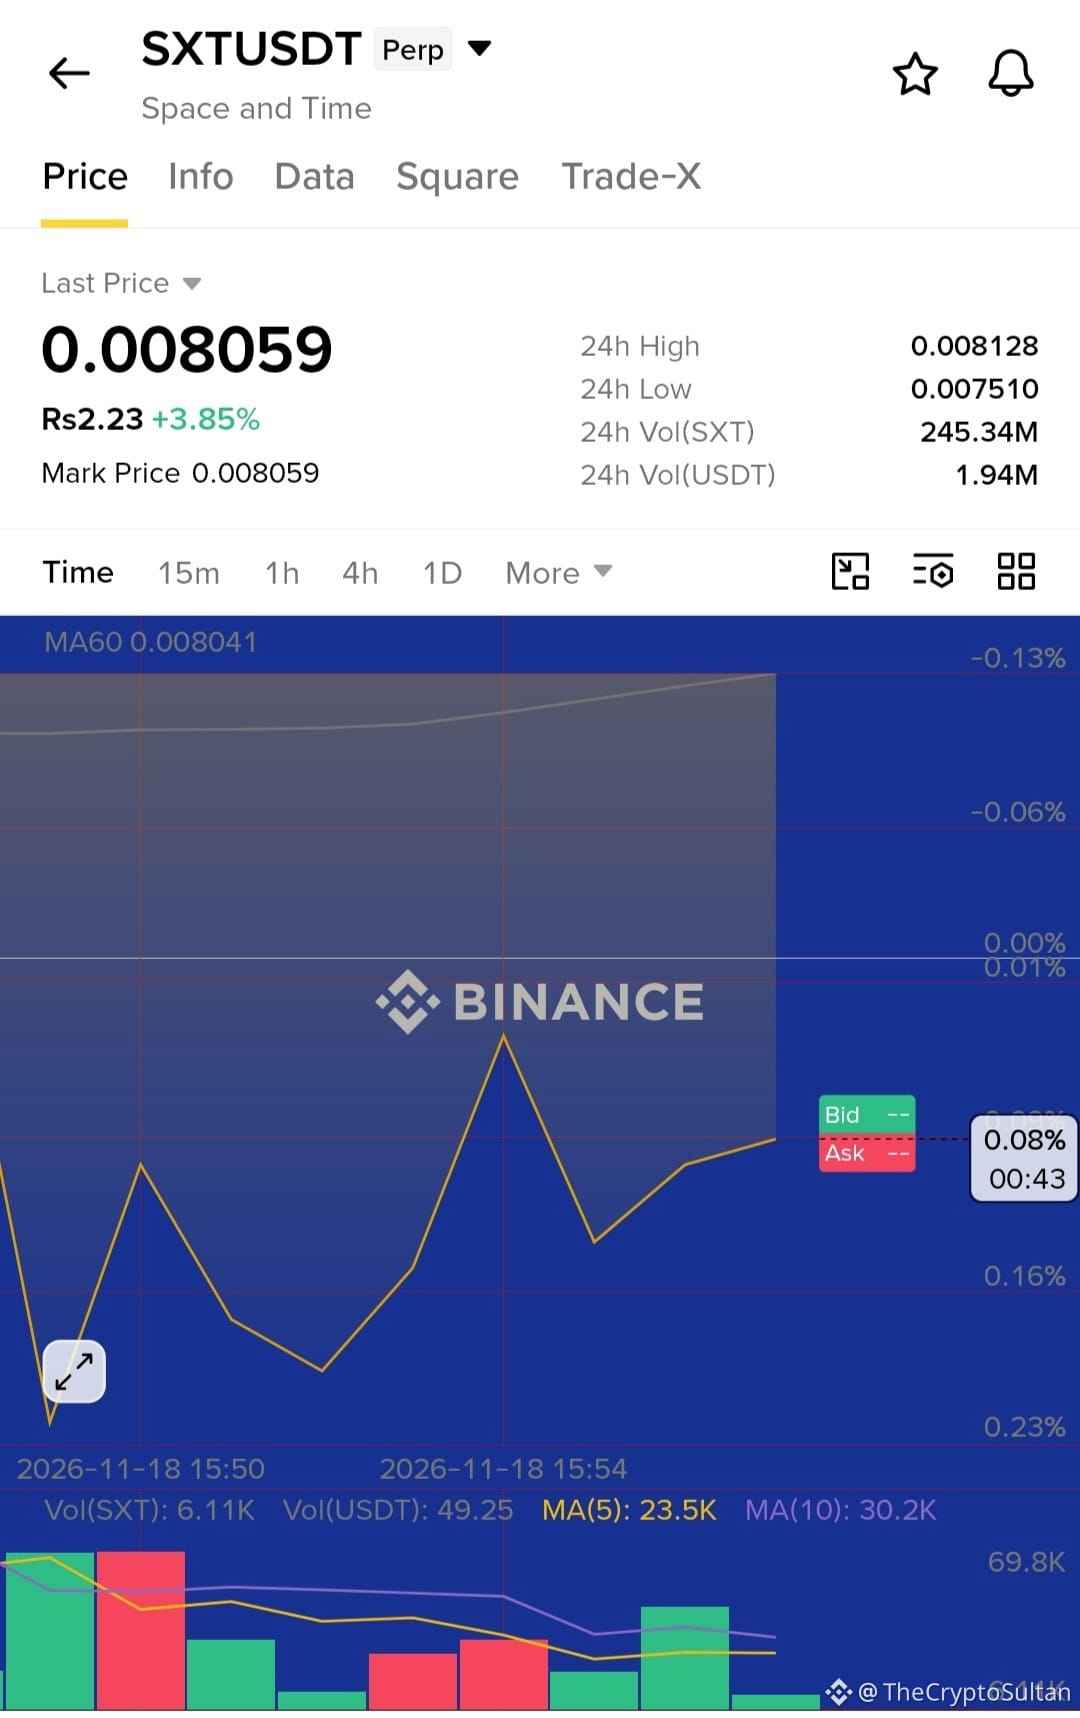
🚀 $SXT BREAKOUT ALERT! BULLS ARE TARGETING HIGHER LEVELS! 🔥
$SXT is showing promising bullish potential as buyers attempt to push the price higher. The latest setup highlights a potential breakout opportunity, with $0.00830–$0.00840 in focus.
📈 LONG TRADE SETUP
🟢 Entry Zone: $0.00800 – $0.00808
🛑 Stop Loss: $0.00790
🎯 Take Profit Targets:
TP1: $0.00815
TP2: $0.00825
TP3: $0.00840
💡 Trading Strategy: Watch for strong buying pressure and confirmation above the entry zone. Proper risk management is essential, and the stop-loss should always be respected.
🔥 Can $SXT bulls deliver the next breakout? Let's watch!
#SXT #cryptotrading #Binance #altcoins #BullishMomentum
🚀 $SXT BREAKOUT ALERT! BULLS ARE TARGETING HIGHER LEVELS! 🔥
$SXT is showing promising bullish potential as buyers attempt to push the price higher. The latest setup highlights a potential breakout opportunity, with $0.00830–$0.00840 in focus.
📈 LONG TRADE SETUP
🟢 Entry Zone: $0.00800 – $0.00808
🛑 Stop Loss: $0.00790
🎯 Take Profit Targets:
TP1: $0.00815
TP2: $0.00825
TP3: $0.00840
💡 Trading Strategy: Watch for strong buying pressure and confirmation above the entry zone. Proper risk management is essential, and the stop-loss should always be respected.
🔥 Can $SXT bulls deliver the next breakout? Let's watch!
#SXT #cryptotrading #Binance #altcoins #BullishMomentum
$SXT is showing promising bullish potential as buyers attempt to push the price higher. The latest setup highlights a potential breakout opportunity, with $0.00830–$0.00840 in focus.
📈 LONG TRADE SETUP
🟢 Entry Zone: $0.00800 – $0.00808
🛑 Stop Loss: $0.00790
🎯 Take Profit Targets:
TP1: $0.00815
TP2: $0.00825
TP3: $0.00840
💡 Trading Strategy: Watch for strong buying pressure and confirmation above the entry zone. Proper risk management is essential, and the stop-loss should always be respected.
🔥 Can $SXT bulls deliver the next breakout? Let's watch!
#SXT #cryptotrading #Binance #altcoins #BullishMomentum
30
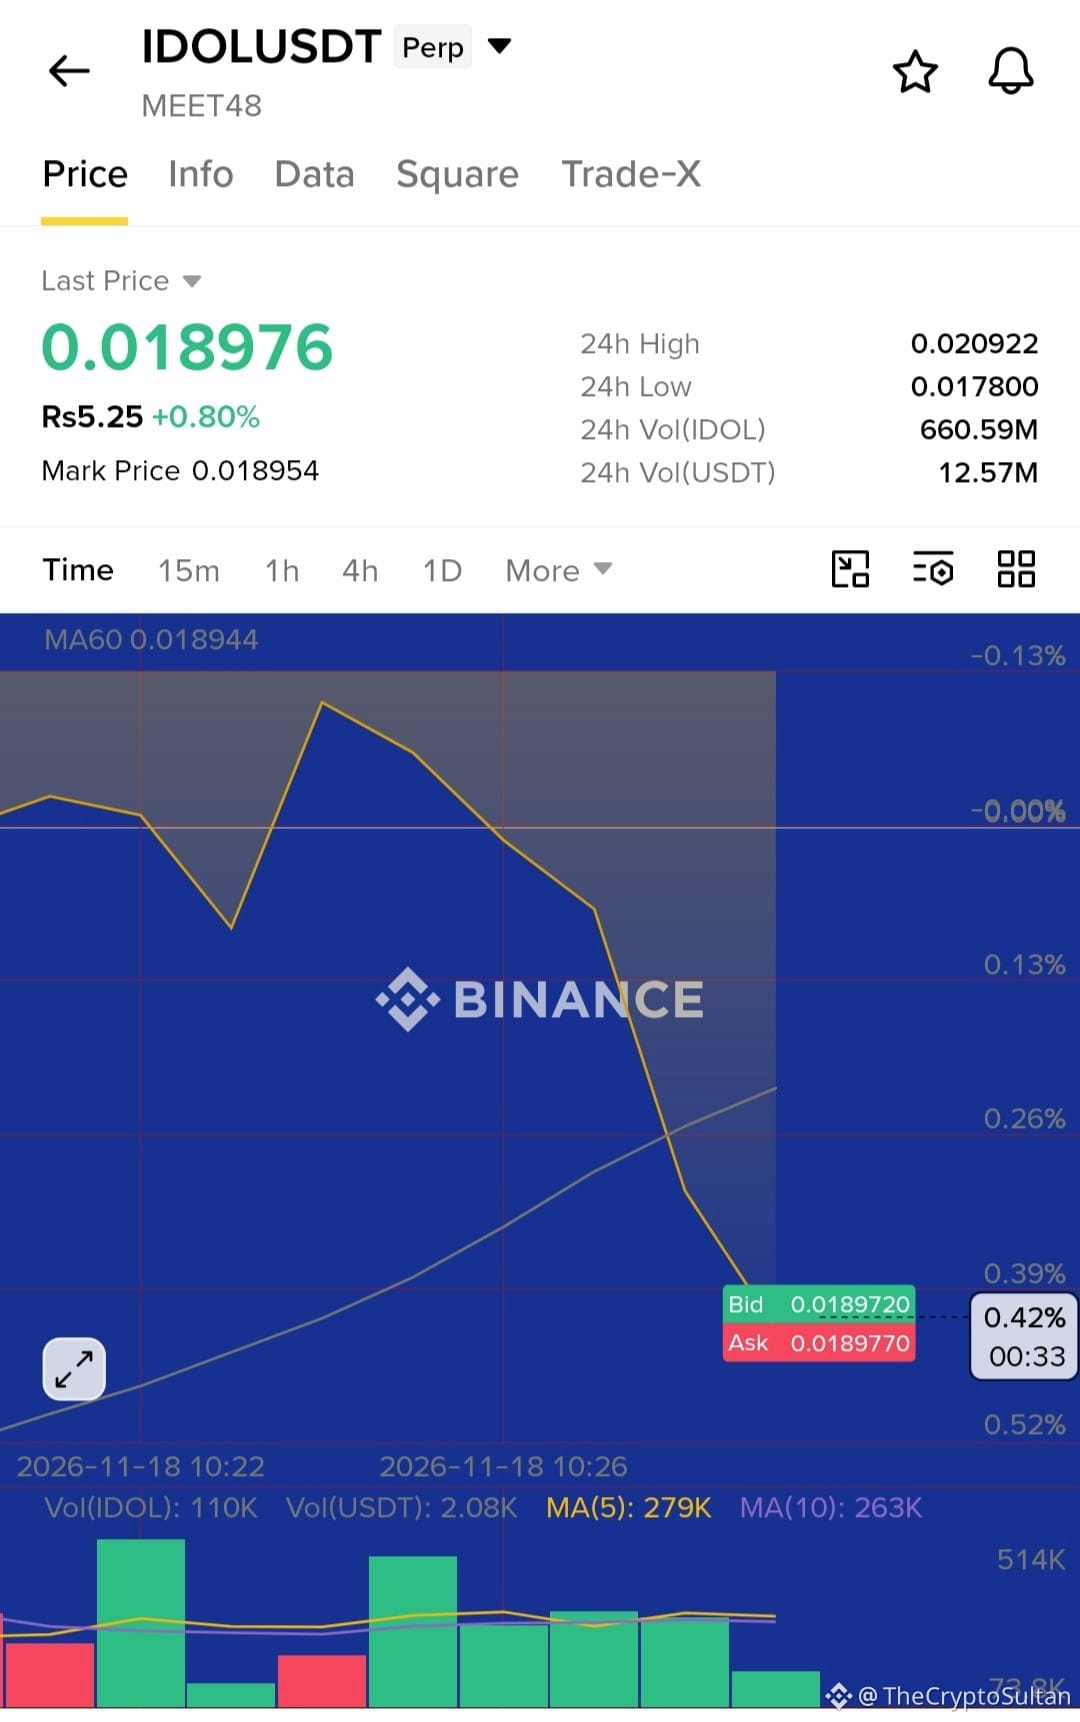
🔻 $IDOL BEARS ARE TAKING CONTROL – MORE DOWNSIDE AHEAD?
$IDOL is showing strong bearish signals after facing rejection near $0.020195, following its drop from $0.020922. Consecutive red candles indicate increasing selling pressure.
📉 SHORT-TERM BEARISH TARGETS: 🎯 TP1: $0.017906 🎯 TP2: $0.016859 🎯 TP3: $0.015813
⚠️ Key Resistance: $0.020195
As long as IDOL remains below $0.020195, bearish momentum could continue toward lower support levels. A reclaim of this resistance may weaken the bearish setup.
🐻 Sellers are in control for now. Can bears push $IDOL even lower?
#IDOLTrade #CryptoTrading. #ShortSetup #BearishTrend #Binance
🔻 $IDOL BEARS ARE TAKING CONTROL – MORE DOWNSIDE AHEAD?
$IDOL is showing strong bearish signals after facing rejection near $0.020195, following its drop from $0.020922. Consecutive red candles indicate increasing selling pressure.
📉 SHORT-TERM BEARISH TARGETS: 🎯 TP1: $0.017906 🎯 TP2: $0.016859 🎯 TP3: $0.015813
⚠️ Key Resistance: $0.020195
As long as IDOL remains below $0.020195, bearish momentum could continue toward lower support levels. A reclaim of this resistance may weaken the bearish setup.
🐻 Sellers are in control for now. Can bears push $IDOL even lower?
#IDOLTrade #CryptoTrading. #ShortSetup #BearishTrend #Binance
$IDOL is showing strong bearish signals after facing rejection near $0.020195, following its drop from $0.020922. Consecutive red candles indicate increasing selling pressure.
📉 SHORT-TERM BEARISH TARGETS: 🎯 TP1: $0.017906 🎯 TP2: $0.016859 🎯 TP3: $0.015813
⚠️ Key Resistance: $0.020195
As long as IDOL remains below $0.020195, bearish momentum could continue toward lower support levels. A reclaim of this resistance may weaken the bearish setup.
🐻 Sellers are in control for now. Can bears push $IDOL even lower?
#IDOLTrade #CryptoTrading. #ShortSetup #BearishTrend #Binance
35
·
--
Bullish
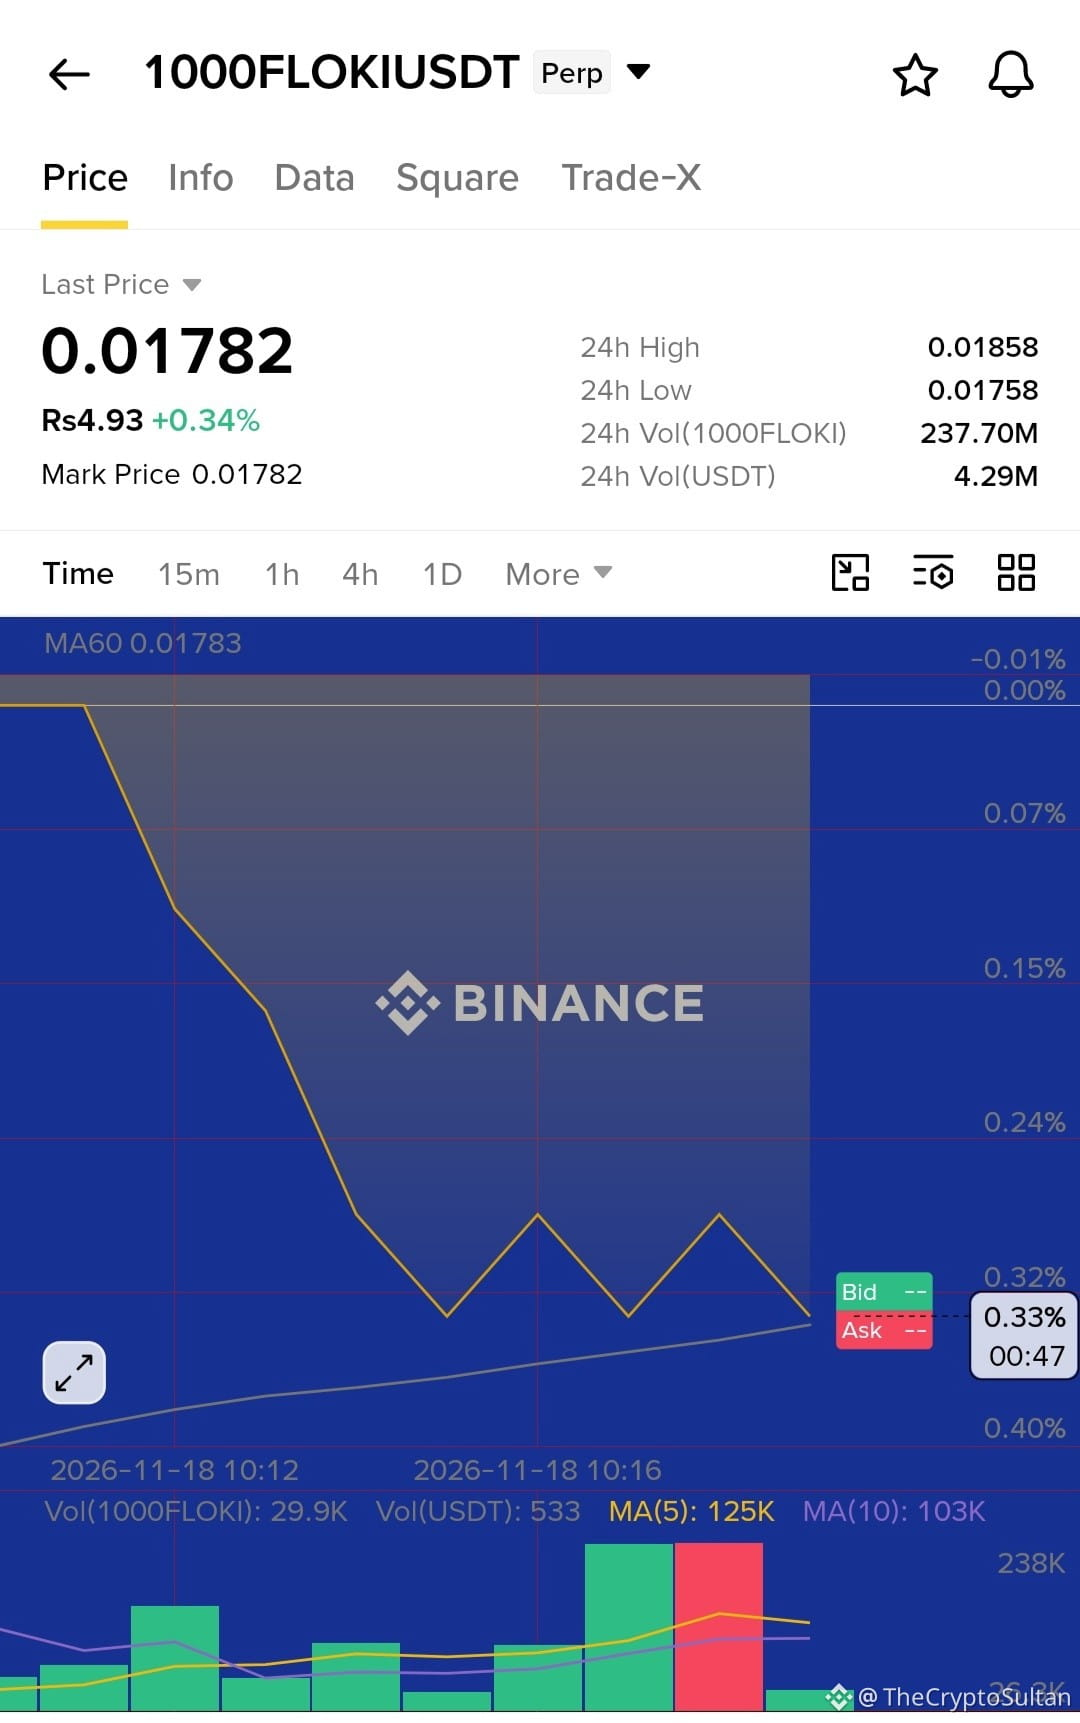
🚀 $1000FLOKI – BULLISH LONG SETUP! POTENTIAL UPSIDE AHEAD! 🐂
$1000FLOKI is presenting an interesting long-trade opportunity. Buyers are in focus, and traders can watch the following levels for a potential upward move.
📊 LONG TRADE PLAN
🟢 Entry: 0.00001794
🛑 Stop Loss: 0.00001783 (-0.6%)
🎯 TP1: 0.00001816 (+1.2%)
🎯 TP2: 0.00001827 (+1.8%)
⚖️ TRADE MANAGEMENT
Take 50% profit at TP1.
Move Stop Loss to Entry (Break-Even).
Let the remaining position run toward TP2.
Margin Allocation: 2%
💡 Risk Management Is Key! Stick to your trading plan, protect your capital, and avoid emotional decisions.
Can $1000FLOKI deliver the expected bullish move? 🚀
Trade smart and always do your own research (DYOR).
#1000FLOKI #cryptotradingpro #BinanceFutureSignal #altcoinseason #TradingSignals
🚀 $1000FLOKI – BULLISH LONG SETUP! POTENTIAL UPSIDE AHEAD! 🐂
$1000FLOKI is presenting an interesting long-trade opportunity. Buyers are in focus, and traders can watch the following levels for a potential upward move.
📊 LONG TRADE PLAN
🟢 Entry: 0.00001794
🛑 Stop Loss: 0.00001783 (-0.6%)
🎯 TP1: 0.00001816 (+1.2%)
🎯 TP2: 0.00001827 (+1.8%)
⚖️ TRADE MANAGEMENT
Take 50% profit at TP1.
Move Stop Loss to Entry (Break-Even).
Let the remaining position run toward TP2.
Margin Allocation: 2%
💡 Risk Management Is Key! Stick to your trading plan, protect your capital, and avoid emotional decisions.
Can $1000FLOKI deliver the expected bullish move? 🚀
Trade smart and always do your own research (DYOR).
#1000FLOKI #cryptotradingpro #BinanceFutureSignal #altcoinseason #TradingSignals
$1000FLOKI is presenting an interesting long-trade opportunity. Buyers are in focus, and traders can watch the following levels for a potential upward move.
📊 LONG TRADE PLAN
🟢 Entry: 0.00001794
🛑 Stop Loss: 0.00001783 (-0.6%)
🎯 TP1: 0.00001816 (+1.2%)
🎯 TP2: 0.00001827 (+1.8%)
⚖️ TRADE MANAGEMENT
Take 50% profit at TP1.
Move Stop Loss to Entry (Break-Even).
Let the remaining position run toward TP2.
Margin Allocation: 2%
💡 Risk Management Is Key! Stick to your trading plan, protect your capital, and avoid emotional decisions.
Can $1000FLOKI deliver the expected bullish move? 🚀
Trade smart and always do your own research (DYOR).
#1000FLOKI #cryptotradingpro #BinanceFutureSignal #altcoinseason #TradingSignals
47

Article
🚀 BITCOIN SHOWS SIGNS OF RECOVERY! BTC HOLDS ABOVE $64,000 — IS A BULLISH REVERSAL COMING?Bitcoin ($BTC ) is showing positive momentum, with the price currently trading around $64,464.90, recording a 24-hour gain of approximately 1.13%.
The latest market data indicates that buyers are attempting to regain control after recent market weakness. BTC has maintained its position above the important $64,000 psychological level, which could support further recovery if buying pressure continues.
📊 Key Market Highlights
- Current Price: $64,464.90
- 24H Change: +1.13%
- 24H High: $65,425.50
- 24H Low: $63,300.90
- 24H Trading Volume: $14.04 Billion USDT
- MA60: $64,361.20
🔥 Important Levels to Watch
Resistance Zone:
- $65,000
- $65,425
- A breakout above $65,425 could strengthen bullish momentum.
Support Zone:
- $64,000
- $63,300
- Losing these levels could bring renewed selling pressure.
📈 What Comes Next for Bitcoin?
BTC is currently trading slightly above its MA60 level, suggesting a potentially positive short-term signal. However, bulls need to maintain buying pressure and secure a convincing breakout above $65,425 to confirm further upside potential.
If resistance holds, Bitcoin could experience another rejection and revisit lower support zones.
🎯 My Market Outlook
Bitcoin is approaching an important decision zone. Traders should closely monitor volume, price action, and resistance confirmation before entering new positions.
The next major move could determine BTC's short-term direction. Stay patient, manage risk carefully, and avoid emotional trading.
Do you think Bitcoin will break above $65,000 and continue its recovery, or will bears take control again?
#Bitcoin❗ #BTCUSDT #CryptoMarket #BitcoinAnalysis #Binance
🚀 BITCOIN SHOWS SIGNS OF RECOVERY! BTC HOLDS ABOVE $64,000 — IS A BULLISH REVERSAL COMING?
Bitcoin ($BTC ) is showing positive momentum, with the price currently trading around $64,464.90, recording a 24-hour gain of approximately 1.13%.
The latest market data indicates that buyers are attempting to regain control after recent market weakness. BTC has maintained its position above the important $64,000 psychological level, which could support further recovery if buying pressure continues.
📊 Key Market Highlights
- Current Price: $64,464.90
- 24H Change: +1.13%
- 24H High: $65,425.50
- 24H Low: $63,300.90
- 24H Trading Volume: $14.04 Billion USDT
- MA60: $64,361.20
🔥 Important Levels to Watch
Resistance Zone:
- $65,000
- $65,425
- A breakout above $65,425 could strengthen bullish momentum.
Support Zone:
- $64,000
- $63,300
- Losing these levels could bring renewed selling pressure.
📈 What Comes Next for Bitcoin?
BTC is currently trading slightly above its MA60 level, suggesting a potentially positive short-term signal. However, bulls need to maintain buying pressure and secure a convincing breakout above $65,425 to confirm further upside potential.
If resistance holds, Bitcoin could experience another rejection and revisit lower support zones.
🎯 My Market Outlook
Bitcoin is approaching an important decision zone. Traders should closely monitor volume, price action, and resistance confirmation before entering new positions.
The next major move could determine BTC's short-term direction. Stay patient, manage risk carefully, and avoid emotional trading.
Do you think Bitcoin will break above $65,000 and continue its recovery, or will bears take control again?
#Bitcoin❗ #BTCUSDT #CryptoMarket #BitcoinAnalysis #Binance
The latest market data indicates that buyers are attempting to regain control after recent market weakness. BTC has maintained its position above the important $64,000 psychological level, which could support further recovery if buying pressure continues.
📊 Key Market Highlights
- Current Price: $64,464.90
- 24H Change: +1.13%
- 24H High: $65,425.50
- 24H Low: $63,300.90
- 24H Trading Volume: $14.04 Billion USDT
- MA60: $64,361.20
🔥 Important Levels to Watch
Resistance Zone:
- $65,000
- $65,425
- A breakout above $65,425 could strengthen bullish momentum.
Support Zone:
- $64,000
- $63,300
- Losing these levels could bring renewed selling pressure.
📈 What Comes Next for Bitcoin?
BTC is currently trading slightly above its MA60 level, suggesting a potentially positive short-term signal. However, bulls need to maintain buying pressure and secure a convincing breakout above $65,425 to confirm further upside potential.
If resistance holds, Bitcoin could experience another rejection and revisit lower support zones.
🎯 My Market Outlook
Bitcoin is approaching an important decision zone. Traders should closely monitor volume, price action, and resistance confirmation before entering new positions.
The next major move could determine BTC's short-term direction. Stay patient, manage risk carefully, and avoid emotional trading.
Do you think Bitcoin will break above $65,000 and continue its recovery, or will bears take control again?
#Bitcoin❗ #BTCUSDT #CryptoMarket #BitcoinAnalysis #Binance
66
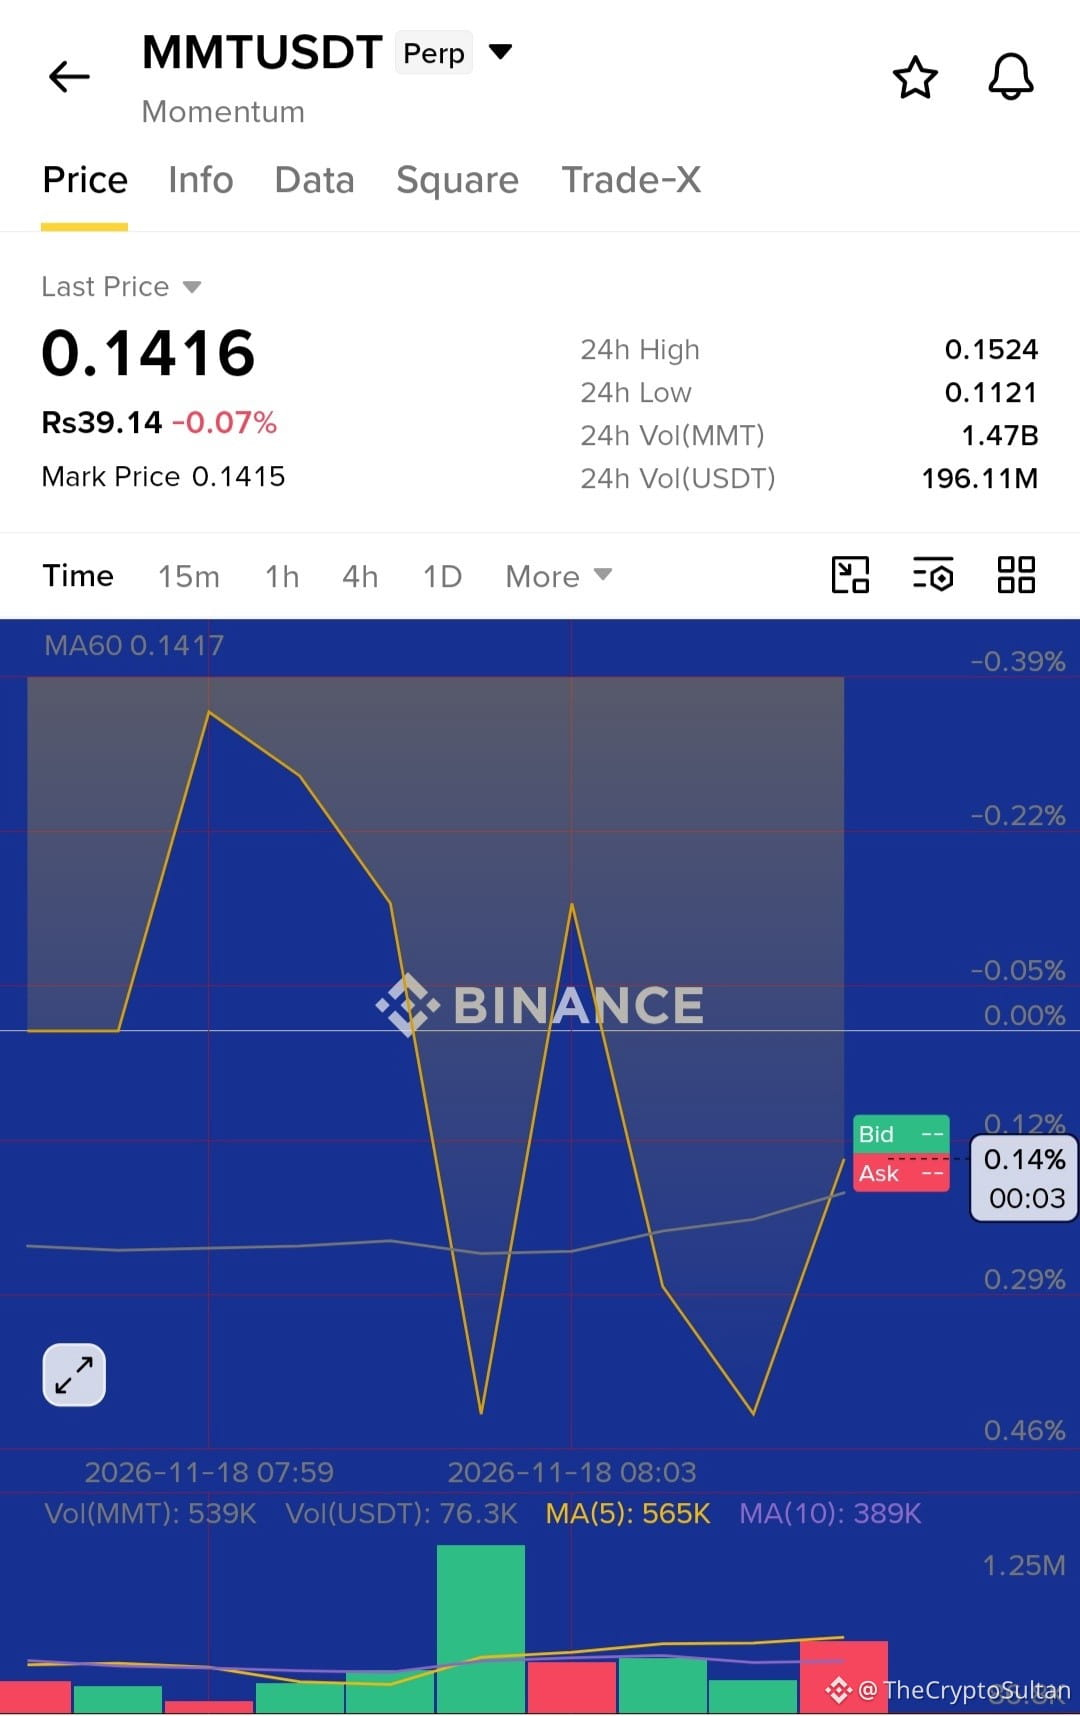
🚀 $MMT BULLISH MOMENTUM IS BUILDING! CAN BUYERS PUSH TOWARD $0.15240? 🔥
$MMT is showing impressive bullish strength, gaining 24.7% in the last 24 hours, backed by massive futures trading volume of 195.68M USDT.
📊 Technical Overview:
Current Price: $0.14100
24H High: $0.15240
24H Gain: +24.7%
1H Trend: Above 21 EMA
RSI: Around 65 (Bullish Momentum)
Key Support: $0.11210
Major Resistance: $0.15240
🚀 What's Next?
A confirmed breakout above $0.15240 could trigger another bullish move and potentially establish a fresh high. Buyers currently have momentum, but a strong candle close above resistance is important for confirmation.
👀 Keep $0.15240 on your radar. Bulls are in control for now!
Trade wisely and always manage your risk. DYOR.
#MMT #cryptotrading #BullishMomentum #Binance #TechnicalAnalysis
{future}(MMTUSDT)
🚀 $MMT BULLISH MOMENTUM IS BUILDING! CAN BUYERS PUSH TOWARD $0.15240? 🔥
$MMT is showing impressive bullish strength, gaining 24.7% in the last 24 hours, backed by massive futures trading volume of 195.68M USDT.
📊 Technical Overview:
Current Price: $0.14100
24H High: $0.15240
24H Gain: +24.7%
1H Trend: Above 21 EMA
RSI: Around 65 (Bullish Momentum)
Key Support: $0.11210
Major Resistance: $0.15240
🚀 What's Next?
A confirmed breakout above $0.15240 could trigger another bullish move and potentially establish a fresh high. Buyers currently have momentum, but a strong candle close above resistance is important for confirmation.
👀 Keep $0.15240 on your radar. Bulls are in control for now!
Trade wisely and always manage your risk. DYOR.
#MMT #cryptotrading #BullishMomentum #Binance #TechnicalAnalysis
$MMT is showing impressive bullish strength, gaining 24.7% in the last 24 hours, backed by massive futures trading volume of 195.68M USDT.
📊 Technical Overview:
Current Price: $0.14100
24H High: $0.15240
24H Gain: +24.7%
1H Trend: Above 21 EMA
RSI: Around 65 (Bullish Momentum)
Key Support: $0.11210
Major Resistance: $0.15240
🚀 What's Next?
A confirmed breakout above $0.15240 could trigger another bullish move and potentially establish a fresh high. Buyers currently have momentum, but a strong candle close above resistance is important for confirmation.
👀 Keep $0.15240 on your radar. Bulls are in control for now!
Trade wisely and always manage your risk. DYOR.
#MMT #cryptotrading #BullishMomentum #Binance #TechnicalAnalysis
70
·
--
Bullish
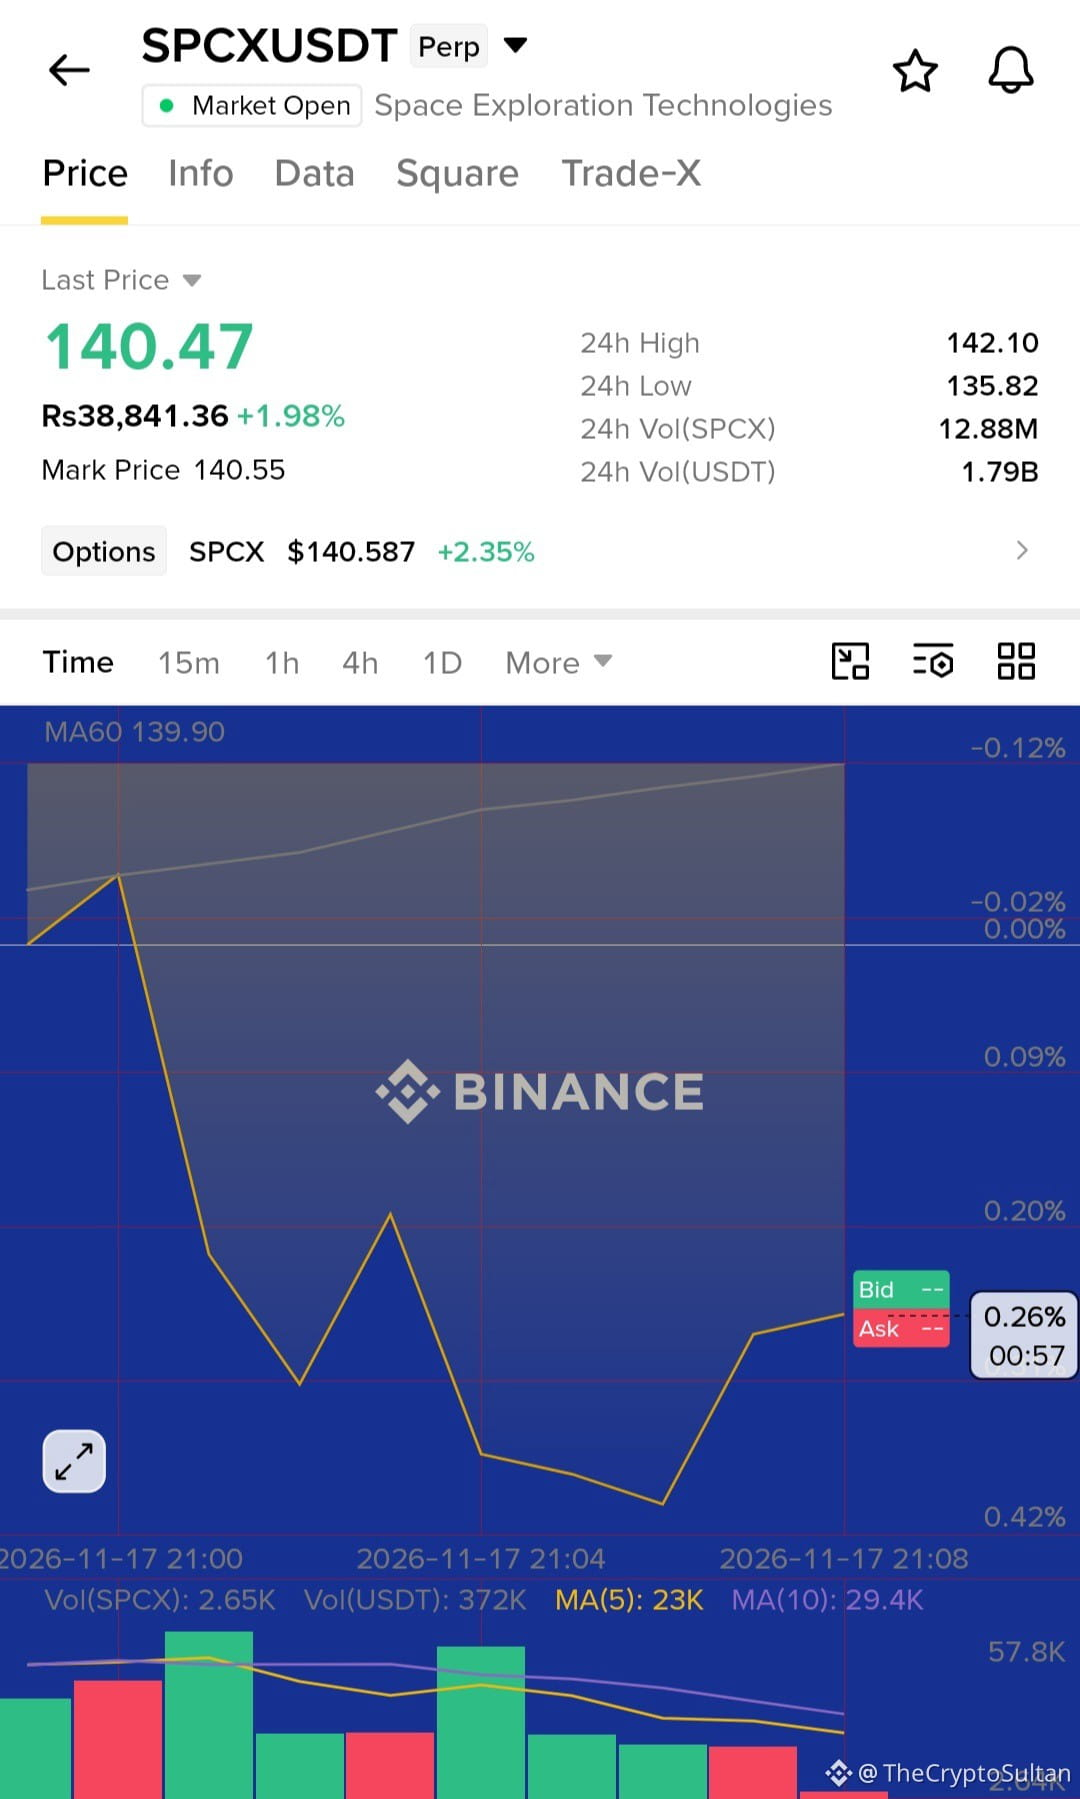
🚀 $SPCX BOUNCES BACK STRONGLY – BULLISH MOMENTUM BUILDING! 📈
$SPCX is showing strong recovery, with buyers stepping in and pushing the price upward. Bulls are gaining momentum, and a continuation toward $143–$144 could be on the cards if buying pressure remains strong.
🔥 LONG TRADE SETUP
🟢 Entry: $140.00 – $140.60
🛑 Stop Loss: $138.80
🎯 Take Profit Targets:
TP1: $141.50
TP2: $142.50
TP3: $144.00
The bullish structure remains promising. Watch the entry zone closely and manage risk carefully. Let's see if bulls can push $SPCX toward the next resistance! 🚀
#SPCX #cryptotrading #Binance
{future}(SPCXUSDT)
🚀 $SPCX BOUNCES BACK STRONGLY – BULLISH MOMENTUM BUILDING! 📈
$SPCX is showing strong recovery, with buyers stepping in and pushing the price upward. Bulls are gaining momentum, and a continuation toward $143–$144 could be on the cards if buying pressure remains strong.
🔥 LONG TRADE SETUP
🟢 Entry: $140.00 – $140.60
🛑 Stop Loss: $138.80
🎯 Take Profit Targets:
TP1: $141.50
TP2: $142.50
TP3: $144.00
The bullish structure remains promising. Watch the entry zone closely and manage risk carefully. Let's see if bulls can push $SPCX toward the next resistance! 🚀
#SPCX #cryptotrading #Binance
$SPCX is showing strong recovery, with buyers stepping in and pushing the price upward. Bulls are gaining momentum, and a continuation toward $143–$144 could be on the cards if buying pressure remains strong.
🔥 LONG TRADE SETUP
🟢 Entry: $140.00 – $140.60
🛑 Stop Loss: $138.80
🎯 Take Profit Targets:
TP1: $141.50
TP2: $142.50
TP3: $144.00
The bullish structure remains promising. Watch the entry zone closely and manage risk carefully. Let's see if bulls can push $SPCX toward the next resistance! 🚀
#SPCX #cryptotrading #Binance
7
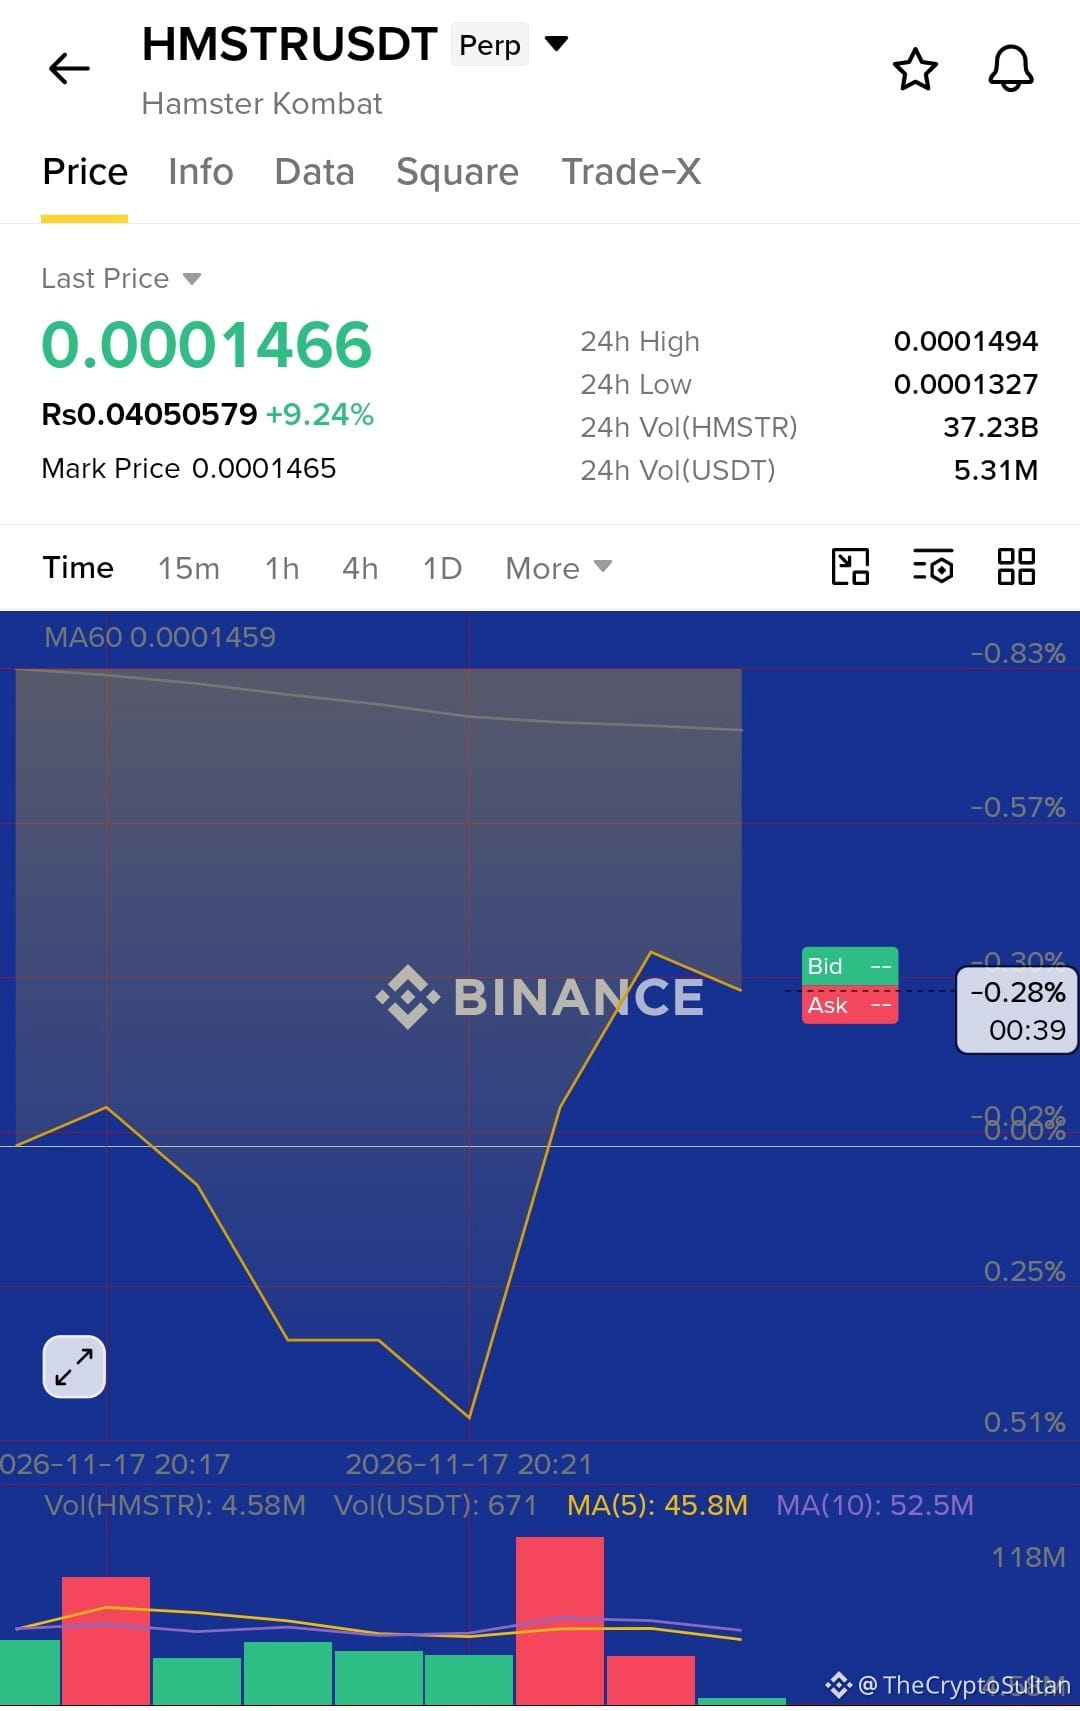
🔴 $HMSTR BEARISH ALERT! Can Bears Push Price Toward $0.0001389?
HMSTR is facing strong selling pressure after getting rejected near the $0.0001494 resistance. The formation of consecutive red candles signals increasing bearish momentum.
A confirmed breakdown below $0.0001446 could trigger further downside toward the following targets.
📉 $HMSTR SHORT SETUP
🔹 Entry Watch: Below $0.0001446
🎯 TP1: $0.0001416
🎯 TP2: $0.0001389
⚠️ Risk Management: The broader trend remains challenging for this bearish setup. Keep position sizes small and wait for breakdown confirmation before entering.
🐻 Sellers are gaining momentum. Will HMSTR reach $0.0001389 next?
Trade smart, manage risk, and always DYOR!
#HMSTR #cryptotrading #Binance
🔴 $HMSTR BEARISH ALERT! Can Bears Push Price Toward $0.0001389?
HMSTR is facing strong selling pressure after getting rejected near the $0.0001494 resistance. The formation of consecutive red candles signals increasing bearish momentum.
A confirmed breakdown below $0.0001446 could trigger further downside toward the following targets.
📉 $HMSTR SHORT SETUP
🔹 Entry Watch: Below $0.0001446
🎯 TP1: $0.0001416
🎯 TP2: $0.0001389
⚠️ Risk Management: The broader trend remains challenging for this bearish setup. Keep position sizes small and wait for breakdown confirmation before entering.
🐻 Sellers are gaining momentum. Will HMSTR reach $0.0001389 next?
Trade smart, manage risk, and always DYOR!
#HMSTR #cryptotrading #Binance
HMSTR is facing strong selling pressure after getting rejected near the $0.0001494 resistance. The formation of consecutive red candles signals increasing bearish momentum.
A confirmed breakdown below $0.0001446 could trigger further downside toward the following targets.
📉 $HMSTR SHORT SETUP
🔹 Entry Watch: Below $0.0001446
🎯 TP1: $0.0001416
🎯 TP2: $0.0001389
⚠️ Risk Management: The broader trend remains challenging for this bearish setup. Keep position sizes small and wait for breakdown confirmation before entering.
🐻 Sellers are gaining momentum. Will HMSTR reach $0.0001389 next?
Trade smart, manage risk, and always DYOR!
#HMSTR #cryptotrading #Binance
8
·
--
Bullish
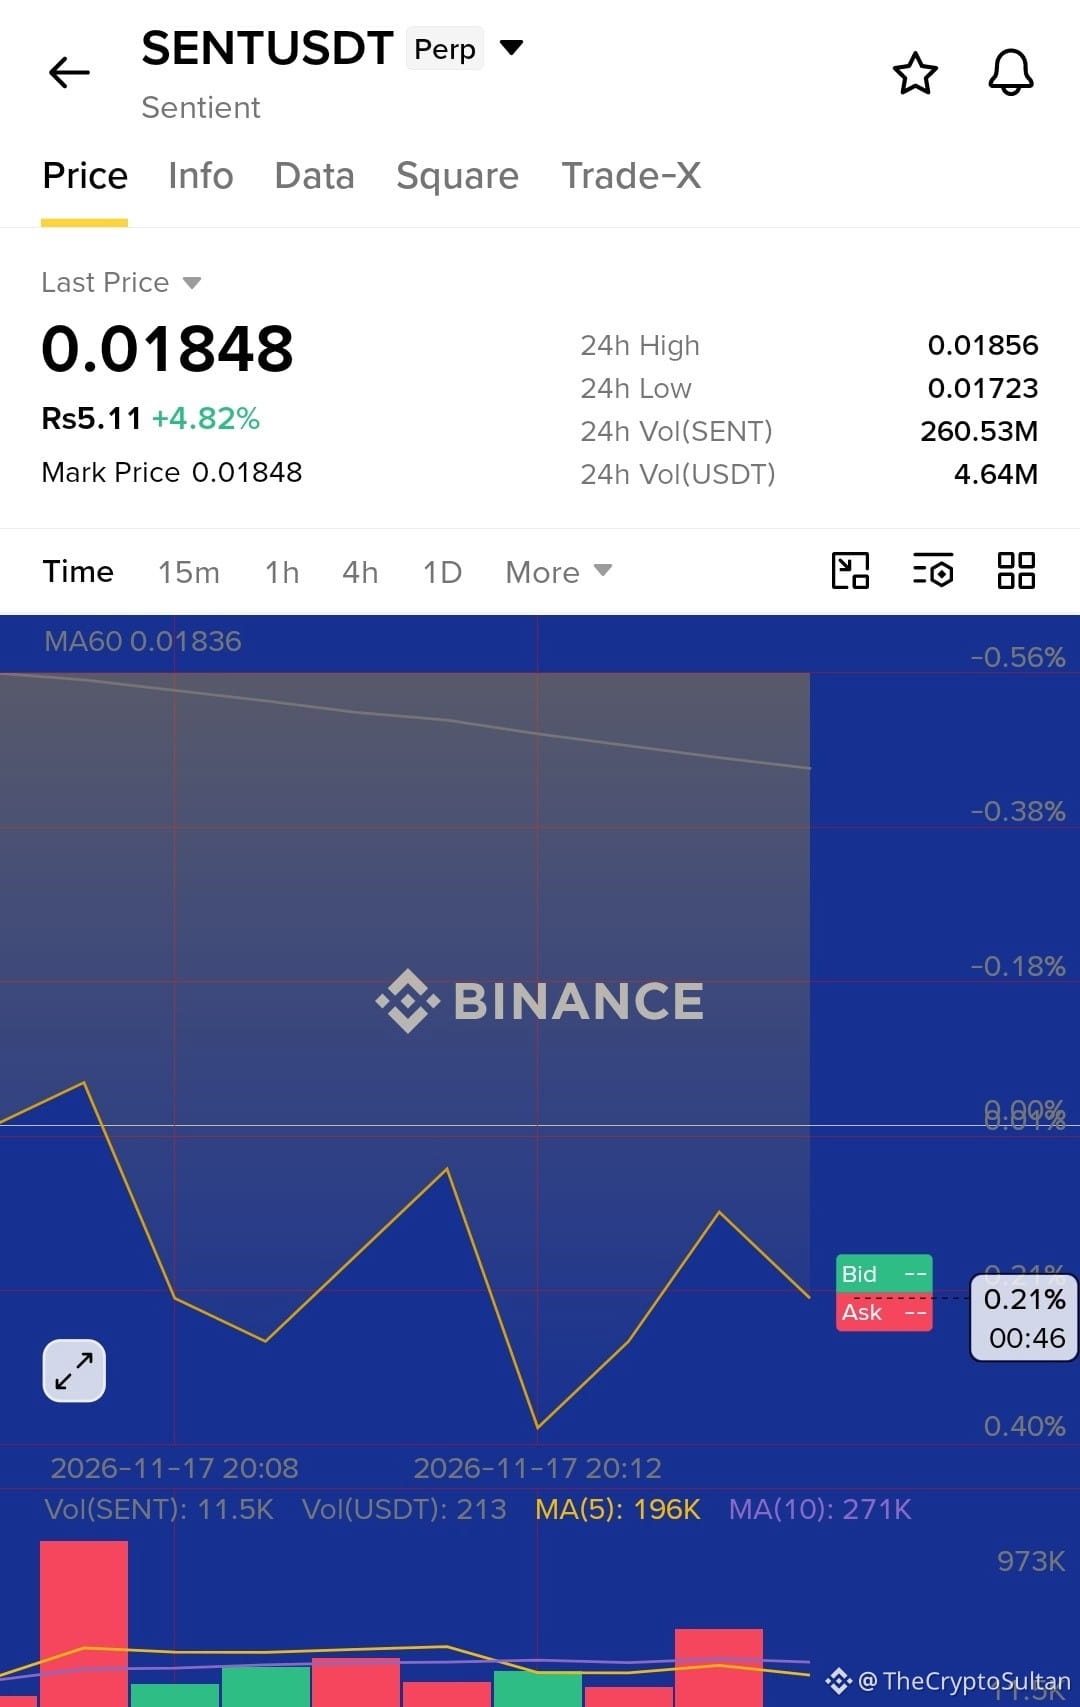
🚀 $SENT BULLISH BREAKOUT! BUYERS ARE TAKING CONTROL! 🔥
$SENT is showing impressive bullish momentum on the 4H chart, breaking above its previous consolidation range with consecutive green candles. Buying pressure is increasing, and bulls are aiming for the next resistance levels.
📈 $SENT LONG TRADE SETUP
🟢 Entry: $0.01840 – $0.01855
🛑 Stop Loss: $0.01780
🎯 Take Profit Targets:
TP1: $0.01890
TP2: $0.01930
TP3: $0.01970
A sustained breakout could open the door for another upward move toward $0.01970. Watch the price action and manage risk carefully.
🔥 Bulls are gaining momentum! Stay focused and trade smart.
#SENT #cryptotrading #Binance
{future}(SENTUSDT)
🚀 $SENT BULLISH BREAKOUT! BUYERS ARE TAKING CONTROL! 🔥
$SENT is showing impressive bullish momentum on the 4H chart, breaking above its previous consolidation range with consecutive green candles. Buying pressure is increasing, and bulls are aiming for the next resistance levels.
📈 $SENT LONG TRADE SETUP
🟢 Entry: $0.01840 – $0.01855
🛑 Stop Loss: $0.01780
🎯 Take Profit Targets:
TP1: $0.01890
TP2: $0.01930
TP3: $0.01970
A sustained breakout could open the door for another upward move toward $0.01970. Watch the price action and manage risk carefully.
🔥 Bulls are gaining momentum! Stay focused and trade smart.
#SENT #cryptotrading #Binance
$SENT is showing impressive bullish momentum on the 4H chart, breaking above its previous consolidation range with consecutive green candles. Buying pressure is increasing, and bulls are aiming for the next resistance levels.
📈 $SENT LONG TRADE SETUP
🟢 Entry: $0.01840 – $0.01855
🛑 Stop Loss: $0.01780
🎯 Take Profit Targets:
TP1: $0.01890
TP2: $0.01930
TP3: $0.01970
A sustained breakout could open the door for another upward move toward $0.01970. Watch the price action and manage risk carefully.
🔥 Bulls are gaining momentum! Stay focused and trade smart.
#SENT #cryptotrading #Binance
1
·
--
Bullish
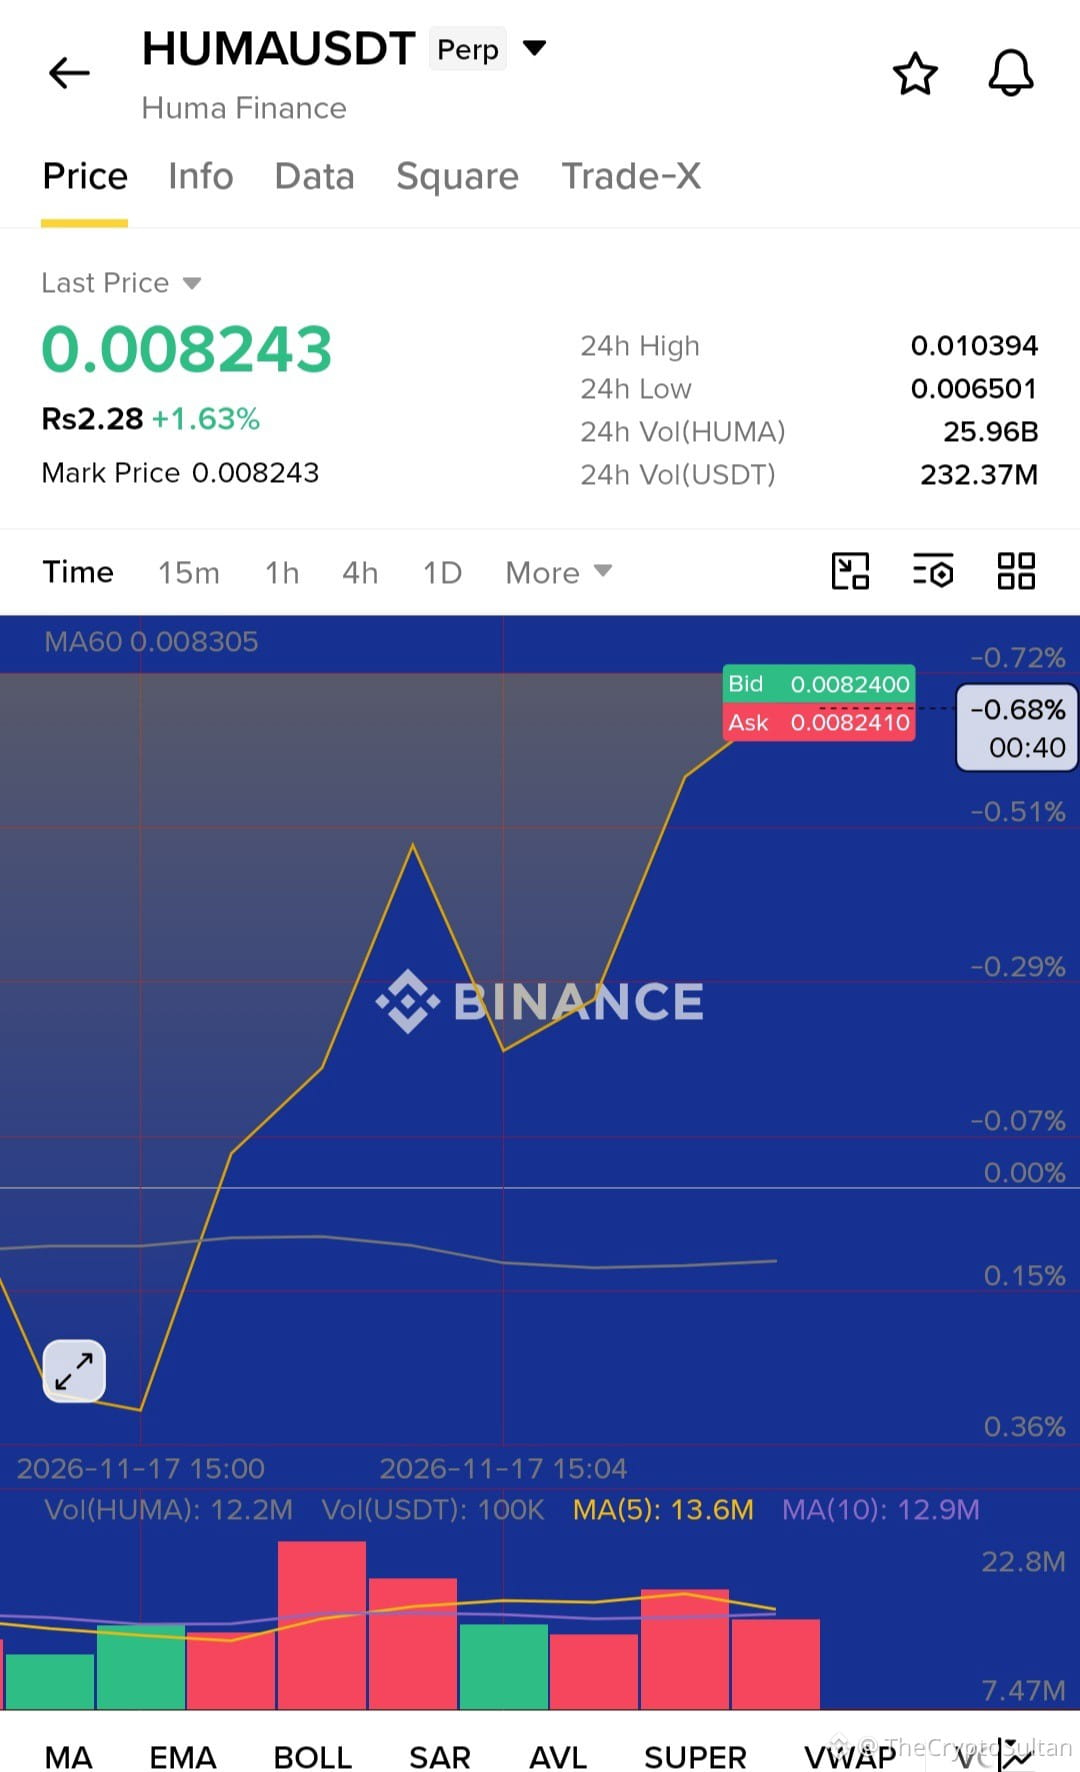
🚀 $HUMA BULLISH MOMENTUM IS BUILDING! IS $0.010394 THE NEXT TARGET? 🔥
HUMA is showing impressive market strength, surging 29.9% in the last 24 hours, backed by a massive 229.84M USDT in futures trading volume.
Currently trading around $0.008397, HUMA is consolidating below its 24-hour high of $0.010394. Bulls are looking for a decisive breakout above this resistance to trigger another potential upward move.
📊 Key Technical Levels:
Current Price: $0.008397
Major Resistance: $0.010394
Key Support: $0.006431
1H EMA 21: Price currently trading below it
RSI: Around 50
🔥 What to Watch Next: A strong breakout above $0.010394 could open the door for further upside. However, bulls need to reclaim the 21 EMA and maintain buying pressure to strengthen the bullish structure.
⚠️ Trade Smart: Watch volume and confirmation before entering. Manage risk carefully and avoid chasing sudden pumps.
Can $HUMA bulls push for another breakout? Let's watch! 🚀
#HUMA #cryptotrading #Binance
{future}(HUMAUSDT)
🚀 $HUMA BULLISH MOMENTUM IS BUILDING! IS $0.010394 THE NEXT TARGET? 🔥
HUMA is showing impressive market strength, surging 29.9% in the last 24 hours, backed by a massive 229.84M USDT in futures trading volume.
Currently trading around $0.008397, HUMA is consolidating below its 24-hour high of $0.010394. Bulls are looking for a decisive breakout above this resistance to trigger another potential upward move.
📊 Key Technical Levels:
Current Price: $0.008397
Major Resistance: $0.010394
Key Support: $0.006431
1H EMA 21: Price currently trading below it
RSI: Around 50
🔥 What to Watch Next: A strong breakout above $0.010394 could open the door for further upside. However, bulls need to reclaim the 21 EMA and maintain buying pressure to strengthen the bullish structure.
⚠️ Trade Smart: Watch volume and confirmation before entering. Manage risk carefully and avoid chasing sudden pumps.
Can $HUMA bulls push for another breakout? Let's watch! 🚀
#HUMA #cryptotrading #Binance
HUMA is showing impressive market strength, surging 29.9% in the last 24 hours, backed by a massive 229.84M USDT in futures trading volume.
Currently trading around $0.008397, HUMA is consolidating below its 24-hour high of $0.010394. Bulls are looking for a decisive breakout above this resistance to trigger another potential upward move.
📊 Key Technical Levels:
Current Price: $0.008397
Major Resistance: $0.010394
Key Support: $0.006431
1H EMA 21: Price currently trading below it
RSI: Around 50
🔥 What to Watch Next: A strong breakout above $0.010394 could open the door for further upside. However, bulls need to reclaim the 21 EMA and maintain buying pressure to strengthen the bullish structure.
⚠️ Trade Smart: Watch volume and confirmation before entering. Manage risk carefully and avoid chasing sudden pumps.
Can $HUMA bulls push for another breakout? Let's watch! 🚀
#HUMA #cryptotrading #Binance
2
·
--
Bullish
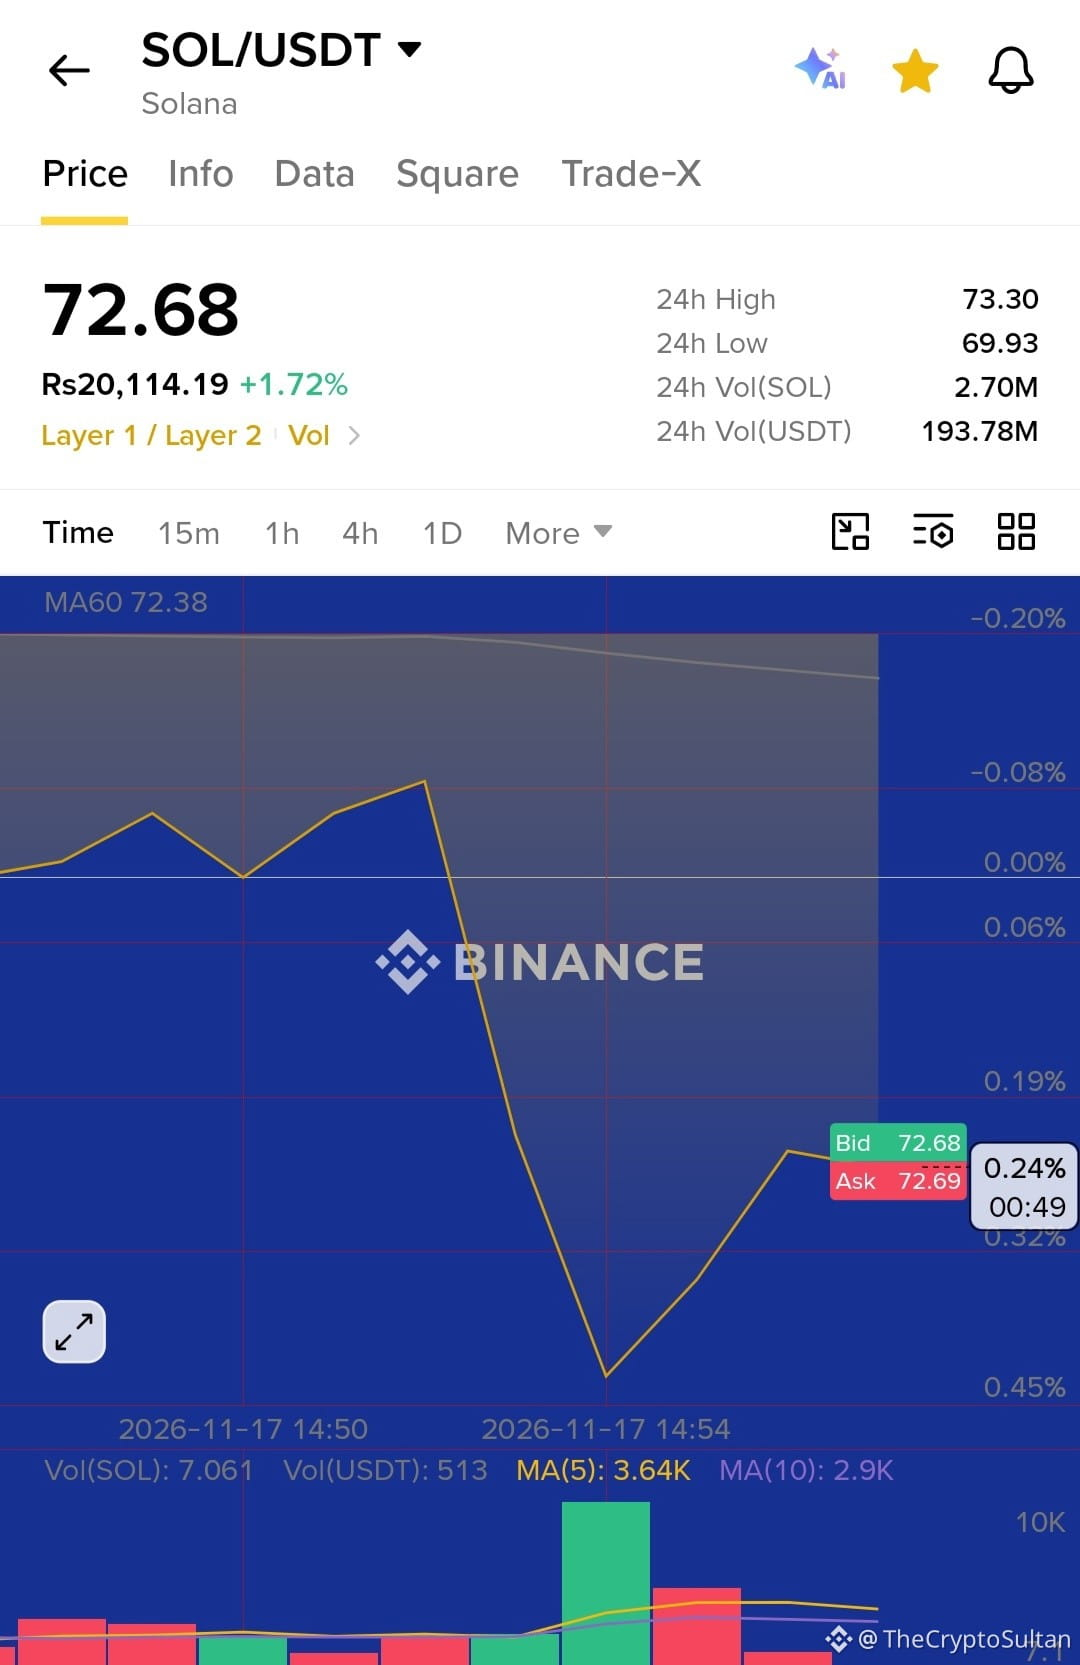
🚀 $SOL BOUNCES FROM $72 SUPPORT! CAN BULLS PUSH TOWARD $73.50?
Solana ($SOL) is showing bullish momentum after bouncing from the key $72 support zone. Buyers are stepping in, and a sustained move higher could open the door toward $73.50.
📈 SOL LONG TRADE SETUP
🟢 Entry Zone: $72.20 – $72.45
🛑 Stop Loss: $71.80
🎯 Take Profit Targets:
TP1: $72.80
TP2: $73.00
TP3: $73.50
Market Outlook: Holding above the $72 support zone could strengthen the bullish structure. Watch for buying volume and confirmation before entering.
Trade smart, manage your risk, and always DYOR! 🔥
#sol #solana #cryptotrading
{spot}(SOLUSDT)
🚀 $SOL BOUNCES FROM $72 SUPPORT! CAN BULLS PUSH TOWARD $73.50?
Solana ($SOL ) is showing bullish momentum after bouncing from the key $72 support zone. Buyers are stepping in, and a sustained move higher could open the door toward $73.50.
📈 SOL LONG TRADE SETUP
🟢 Entry Zone: $72.20 – $72.45
🛑 Stop Loss: $71.80
🎯 Take Profit Targets:
TP1: $72.80
TP2: $73.00
TP3: $73.50
Market Outlook: Holding above the $72 support zone could strengthen the bullish structure. Watch for buying volume and confirmation before entering.
Trade smart, manage your risk, and always DYOR! 🔥
#sol #solana #cryptotrading
Solana ($SOL ) is showing bullish momentum after bouncing from the key $72 support zone. Buyers are stepping in, and a sustained move higher could open the door toward $73.50.
📈 SOL LONG TRADE SETUP
🟢 Entry Zone: $72.20 – $72.45
🛑 Stop Loss: $71.80
🎯 Take Profit Targets:
TP1: $72.80
TP2: $73.00
TP3: $73.50
Market Outlook: Holding above the $72 support zone could strengthen the bullish structure. Watch for buying volume and confirmation before entering.
Trade smart, manage your risk, and always DYOR! 🔥
#sol #solana #cryptotrading
7
·
--
Bullish
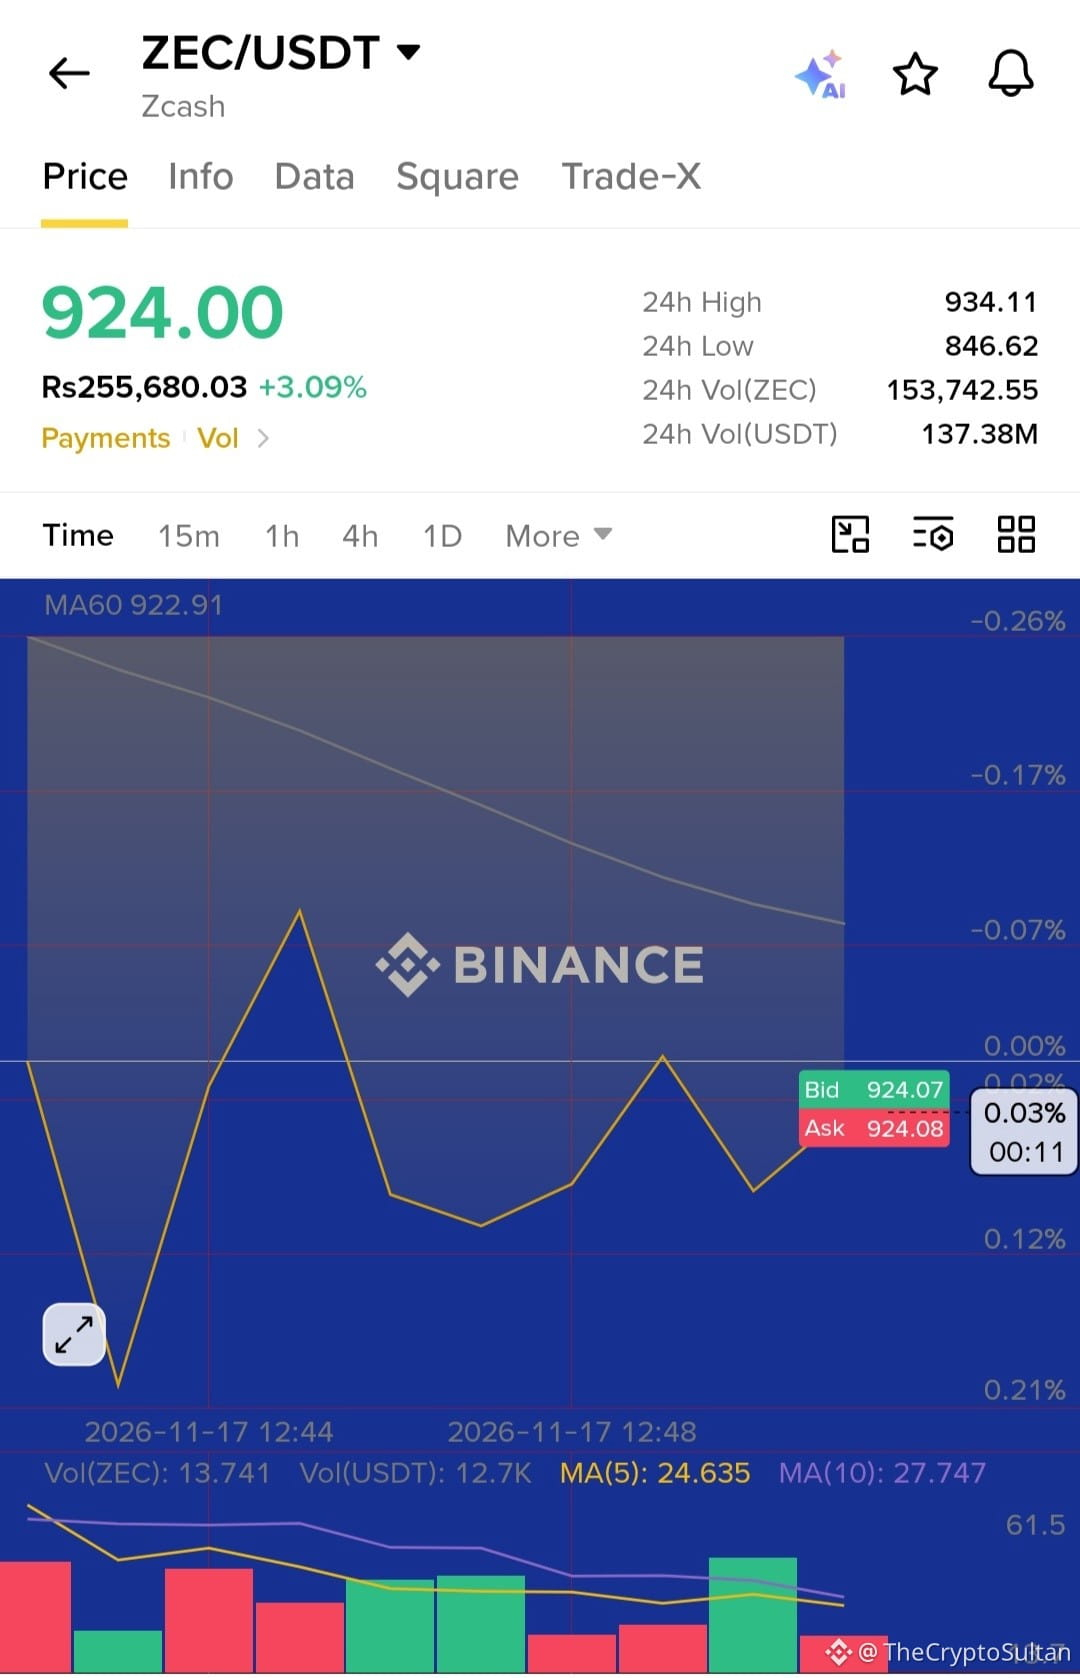
🚨 $ZEC — STRONG RALLY, BUT WATCH FOR A POSSIBLE REVERSAL! 📉
Zcash ($ZEC) is trading near $922.88, up 3.59%, showing strong bullish momentum. However, after a significant rally, profit-taking and resistance rejection could trigger a potential downside move.
🔻 SHORT TRADE WATCHLIST
Entry: After confirmed resistance rejection
TP1: First downside support
Final Target: Next major support zone
Stop Loss: Above the rejection high
⚠️ Trading Strategy: Don't chase the rally! Wait for clear confirmation before entering a short position. A strong rejection could create a potential selling opportunity.
🎯 Patience, confirmation, and proper risk management are key. Trade smart and protect your capital!
#ZEC/USDT #zcash #cryptotrading
{spot}(ZECUSDT)
🚨 $ZEC — STRONG RALLY, BUT WATCH FOR A POSSIBLE REVERSAL! 📉
Zcash ($ZEC ) is trading near $922.88, up 3.59%, showing strong bullish momentum. However, after a significant rally, profit-taking and resistance rejection could trigger a potential downside move.
🔻 SHORT TRADE WATCHLIST
Entry: After confirmed resistance rejection
TP1: First downside support
Final Target: Next major support zone
Stop Loss: Above the rejection high
⚠️ Trading Strategy: Don't chase the rally! Wait for clear confirmation before entering a short position. A strong rejection could create a potential selling opportunity.
🎯 Patience, confirmation, and proper risk management are key. Trade smart and protect your capital!
#ZEC/USDT #zcash #cryptotrading
Zcash ($ZEC ) is trading near $922.88, up 3.59%, showing strong bullish momentum. However, after a significant rally, profit-taking and resistance rejection could trigger a potential downside move.
🔻 SHORT TRADE WATCHLIST
Entry: After confirmed resistance rejection
TP1: First downside support
Final Target: Next major support zone
Stop Loss: Above the rejection high
⚠️ Trading Strategy: Don't chase the rally! Wait for clear confirmation before entering a short position. A strong rejection could create a potential selling opportunity.
🎯 Patience, confirmation, and proper risk management are key. Trade smart and protect your capital!
#ZEC/USDT #zcash #cryptotrading
6
·
--
Bullish
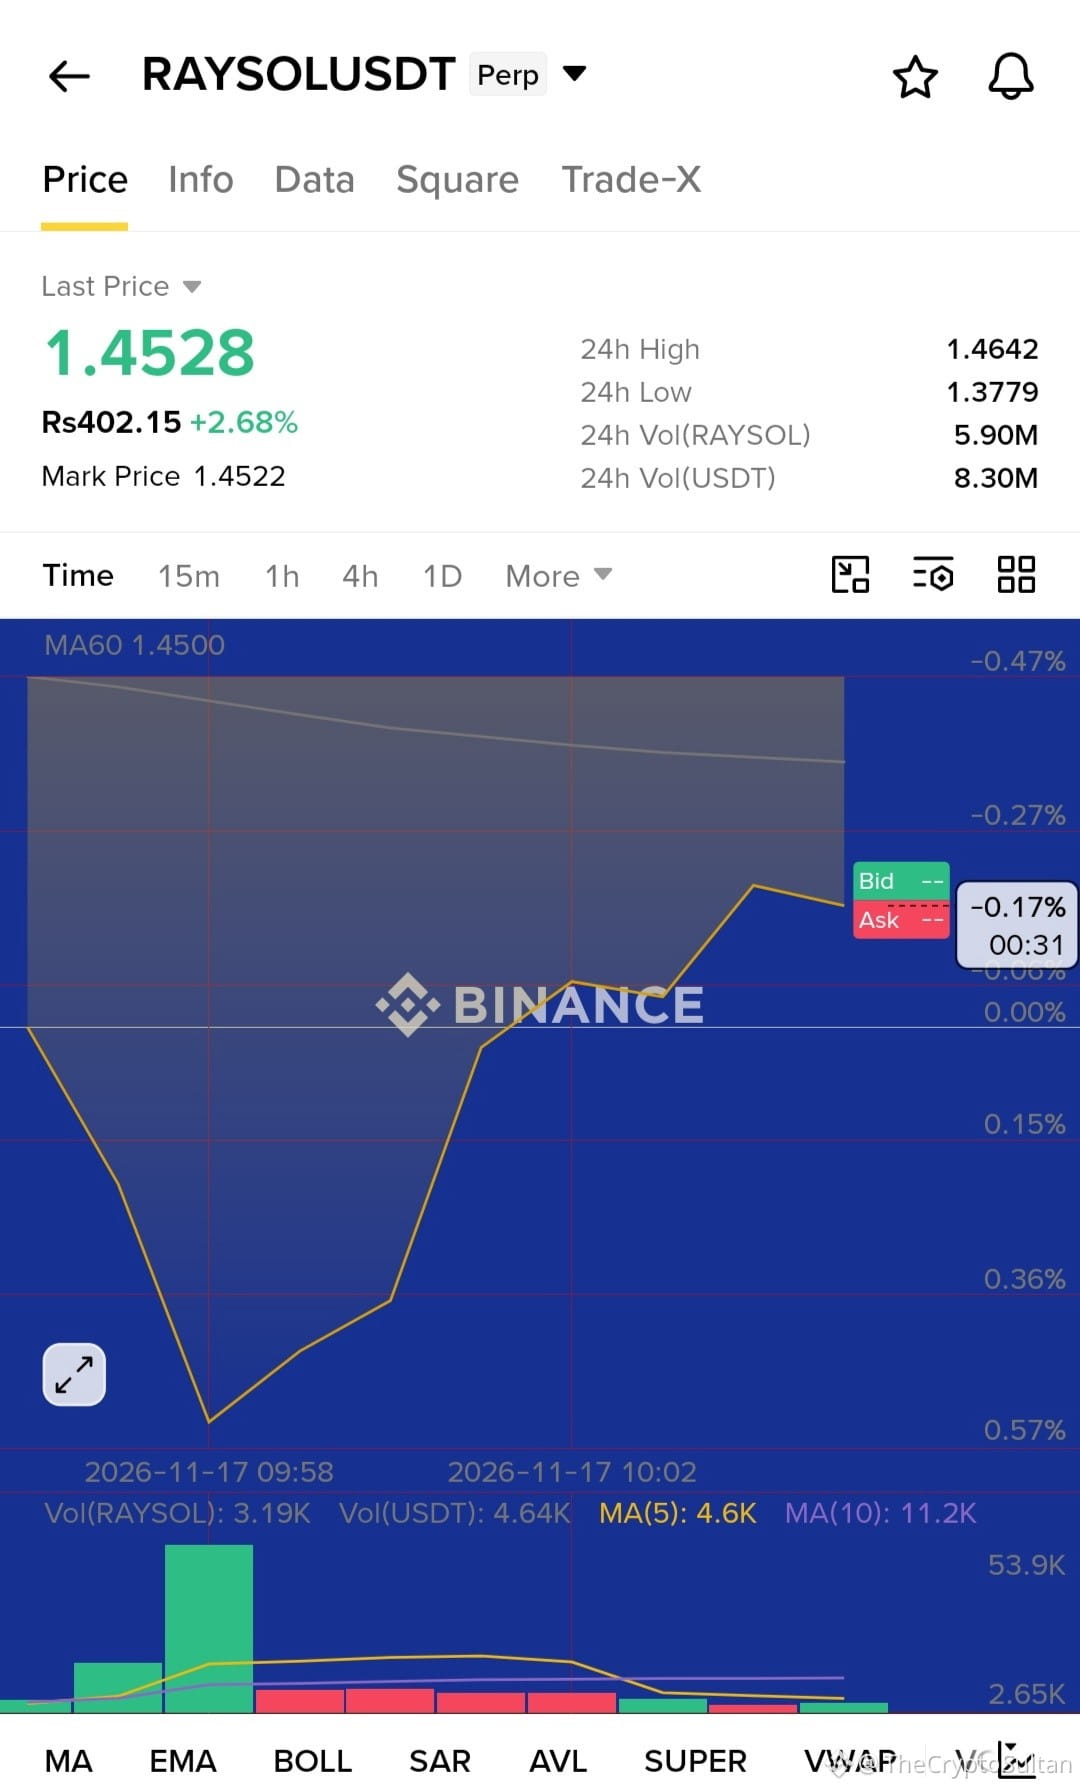
🚀 $RAYSOL BULLISH BREAKOUT ALERT! BUYERS ARE TAKING CONTROL! 🔥
$RAYSOL is showing strong bullish momentum after breaking out on the 15-minute chart with a powerful bullish candle and 2.08x volume, signaling increased buying interest.
📈 LONG TRADE SETUP
🟢 Entry Zone: $1.4585 – $1.4616
🎯 Take Profit: $1.4769
🛑 Stop Loss: $1.4463
Key Level to Watch: $1.4536
As long as RAYSOL holds above $1.4536, the bullish structure remains intact, with potential for another upward move toward the target.
🔥 Stay focused, manage your risk, and trade with discipline!
Buy & Trade $RAYSOL! 🚀
#RAYSOL #cryptotrading #Binance
{future}(RAYSOLUSDT)
$BTC
{future}(BTCUSDT)
🚀 $RAYSOL BULLISH BREAKOUT ALERT! BUYERS ARE TAKING CONTROL! 🔥
$RAYSOL is showing strong bullish momentum after breaking out on the 15-minute chart with a powerful bullish candle and 2.08x volume, signaling increased buying interest.
📈 LONG TRADE SETUP
🟢 Entry Zone: $1.4585 – $1.4616
🎯 Take Profit: $1.4769
🛑 Stop Loss: $1.4463
Key Level to Watch: $1.4536
As long as RAYSOL holds above $1.4536, the bullish structure remains intact, with potential for another upward move toward the target.
🔥 Stay focused, manage your risk, and trade with discipline!
Buy & Trade $RAYSOL ! 🚀
#RAYSOL #cryptotrading #Binance
$BTC
$RAYSOL is showing strong bullish momentum after breaking out on the 15-minute chart with a powerful bullish candle and 2.08x volume, signaling increased buying interest.
📈 LONG TRADE SETUP
🟢 Entry Zone: $1.4585 – $1.4616
🎯 Take Profit: $1.4769
🛑 Stop Loss: $1.4463
Key Level to Watch: $1.4536
As long as RAYSOL holds above $1.4536, the bullish structure remains intact, with potential for another upward move toward the target.
🔥 Stay focused, manage your risk, and trade with discipline!
Buy & Trade $RAYSOL ! 🚀
#RAYSOL #cryptotrading #Binance
$BTC
·
--
Bullish
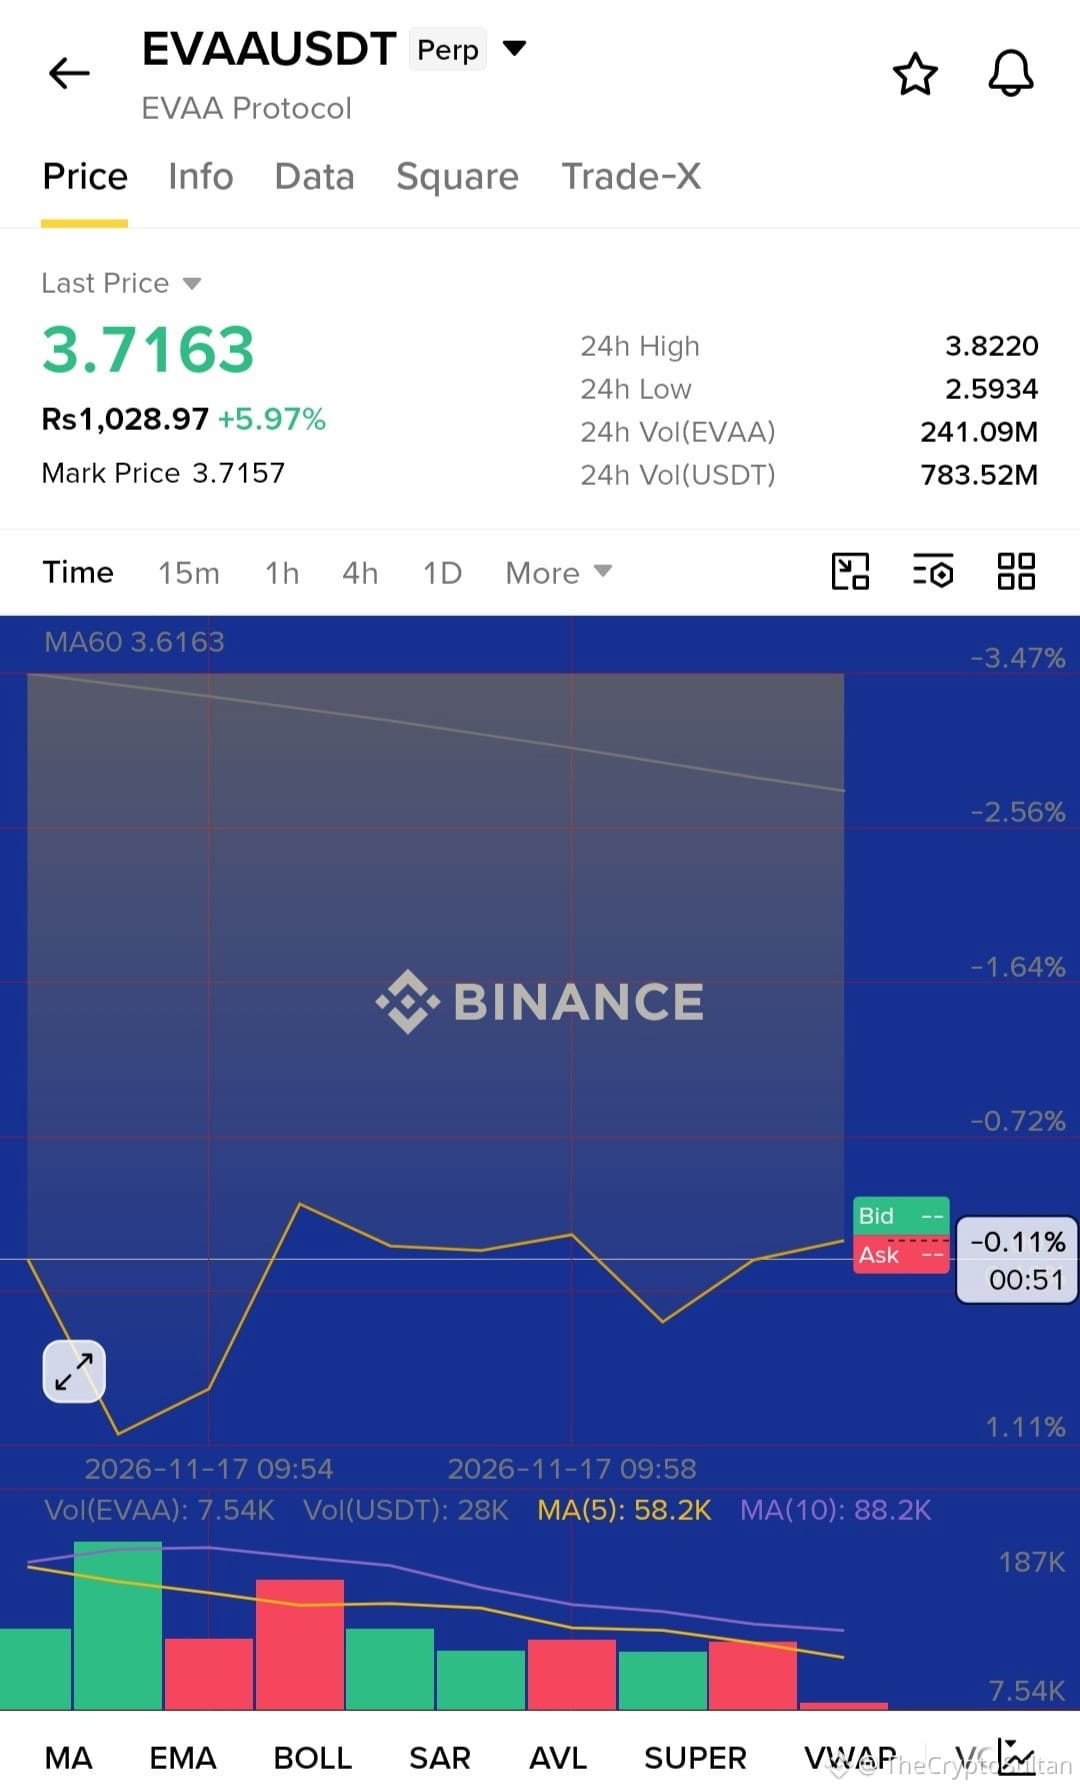
🚀 $EVAA – BIG LONG OPPORTUNITY! 🔥
$EVAA is presenting a promising bullish setup, with buyers potentially preparing for the next upward move. The $3.60–$3.74 zone is our key entry area to watch. If bullish momentum continues, the price could target higher resistance levels.
📈 LONG TRADE SETUP
🟢 Entry Zone: $3.60 – $3.74
🛑 Stop Loss: $3.42
🎯 Take Profit Targets:
TP1: $3.88
TP2: $4.07
TP3: $4.30
Stay disciplined, manage your risk, and follow the plan. Always wait for confirmation before entering the trade.
Trade Smart. Stay Focused. Trade Like a Pro! 🚀
$JCT
{future}(JCTUSDT)
#EVAA #cryptotrading #Binance
{future}(EVAAUSDT)
🚀 $EVAA – BIG LONG OPPORTUNITY! 🔥
$EVAA is presenting a promising bullish setup, with buyers potentially preparing for the next upward move. The $3.60–$3.74 zone is our key entry area to watch. If bullish momentum continues, the price could target higher resistance levels.
📈 LONG TRADE SETUP
🟢 Entry Zone: $3.60 – $3.74
🛑 Stop Loss: $3.42
🎯 Take Profit Targets:
TP1: $3.88
TP2: $4.07
TP3: $4.30
Stay disciplined, manage your risk, and follow the plan. Always wait for confirmation before entering the trade.
Trade Smart. Stay Focused. Trade Like a Pro! 🚀
$JCT
#EVAA #cryptotrading #Binance
$EVAA is presenting a promising bullish setup, with buyers potentially preparing for the next upward move. The $3.60–$3.74 zone is our key entry area to watch. If bullish momentum continues, the price could target higher resistance levels.
📈 LONG TRADE SETUP
🟢 Entry Zone: $3.60 – $3.74
🛑 Stop Loss: $3.42
🎯 Take Profit Targets:
TP1: $3.88
TP2: $4.07
TP3: $4.30
Stay disciplined, manage your risk, and follow the plan. Always wait for confirmation before entering the trade.
Trade Smart. Stay Focused. Trade Like a Pro! 🚀
$JCT
#EVAA #cryptotrading #Binance
14
·
--
Bullish
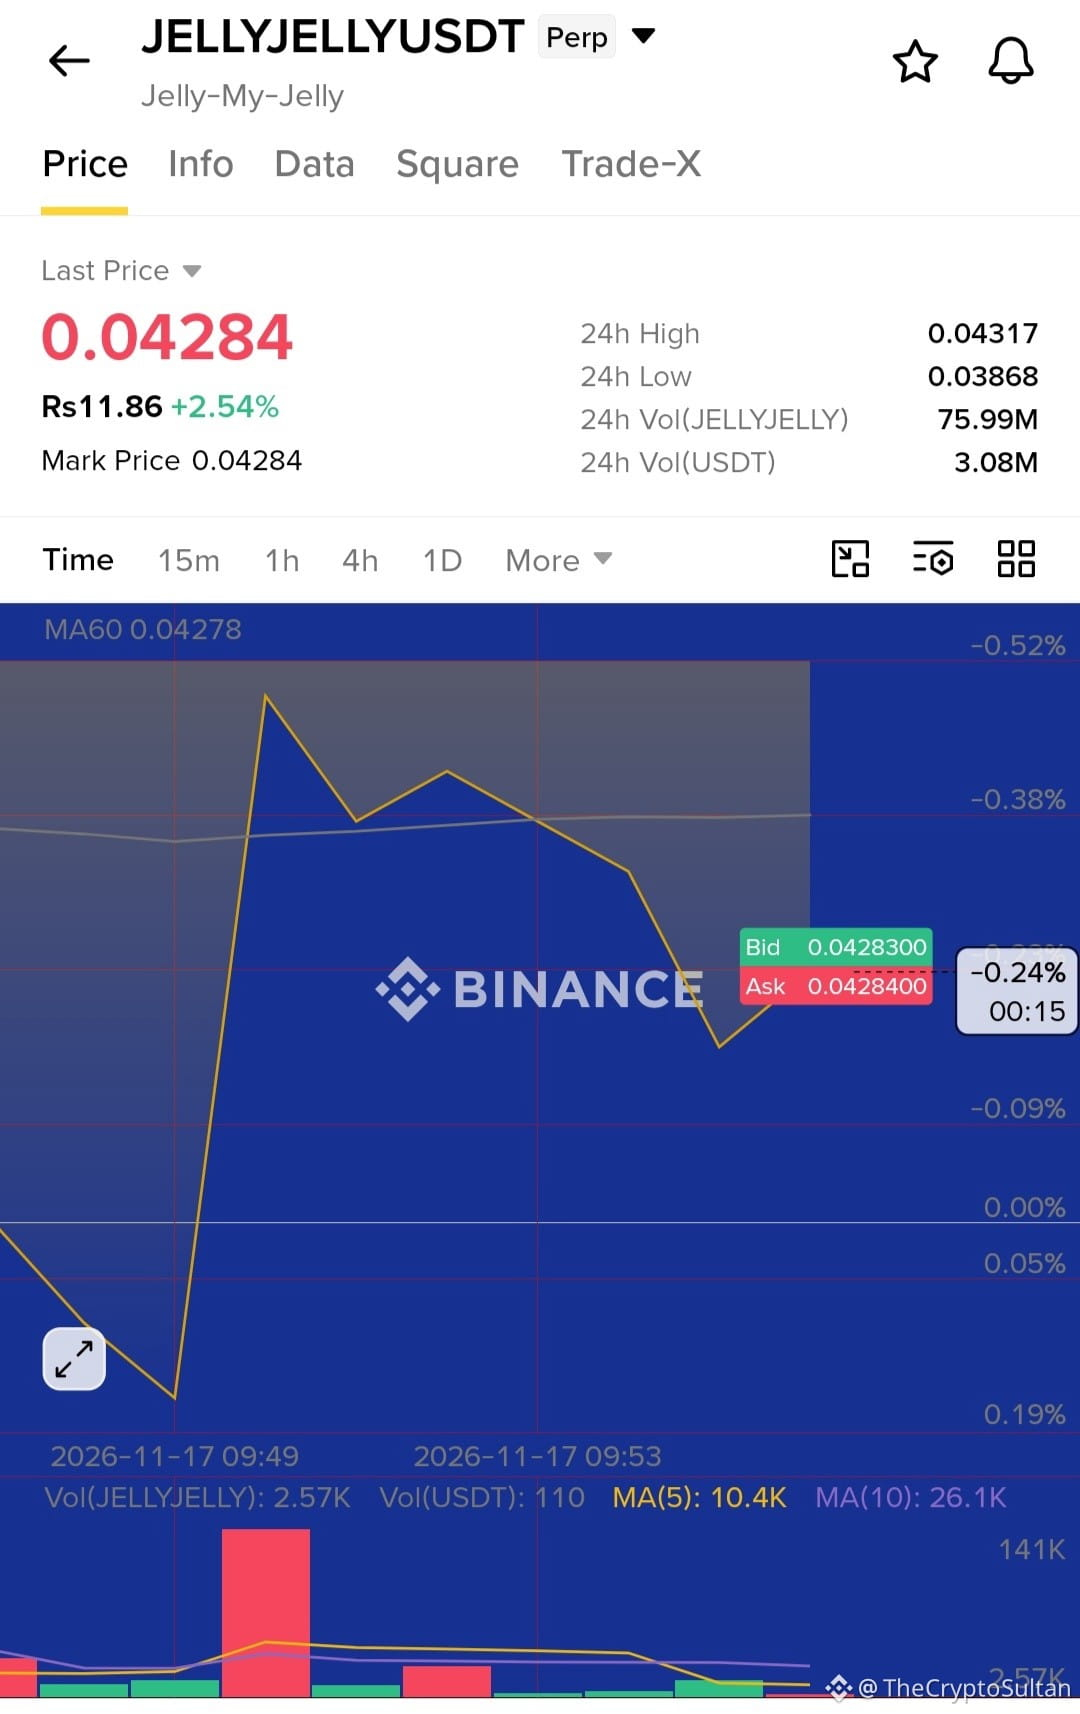
🚀 $JELLYJELLY BREAKOUT ALERT! BULLISH MOMENTUM IS BUILDING! 🔥
$JELLYJELLY is showing strong bullish momentum after breaking out on the 15-minute chart with a powerful bullish candle and 1.54x volume.
Buyers are stepping in, and holding above $0.043010 could support another upward move. The bullish structure remains intact as long as this key level holds.
📊 TRADE SETUP – LONG
🟢 Entry: $0.043090
🎯 Take Profit: $0.043535
🔴 Stop Loss: $0.042645
Watch the breakout level closely and manage your risk wisely. Always wait for confirmation before entering.
🔥 Buy and Trade $JELLYJELLY!
#jellyjelly #CryptoTrading #Binance $BNB
{future}(JELLYJELLYUSDT)
🚀 $JELLYJELLY BREAKOUT ALERT! BULLISH MOMENTUM IS BUILDING! 🔥
$JELLYJELLY is showing strong bullish momentum after breaking out on the 15-minute chart with a powerful bullish candle and 1.54x volume.
Buyers are stepping in, and holding above $0.043010 could support another upward move. The bullish structure remains intact as long as this key level holds.
📊 TRADE SETUP – LONG
🟢 Entry: $0.043090
🎯 Take Profit: $0.043535
🔴 Stop Loss: $0.042645
Watch the breakout level closely and manage your risk wisely. Always wait for confirmation before entering.
🔥 Buy and Trade $JELLYJELLY !
#jellyjelly #CryptoTrading #Binance $BNB
$JELLYJELLY is showing strong bullish momentum after breaking out on the 15-minute chart with a powerful bullish candle and 1.54x volume.
Buyers are stepping in, and holding above $0.043010 could support another upward move. The bullish structure remains intact as long as this key level holds.
📊 TRADE SETUP – LONG
🟢 Entry: $0.043090
🎯 Take Profit: $0.043535
🔴 Stop Loss: $0.042645
Watch the breakout level closely and manage your risk wisely. Always wait for confirmation before entering.
🔥 Buy and Trade $JELLYJELLY !
#jellyjelly #CryptoTrading #Binance $BNB
5
·
--
Bullish
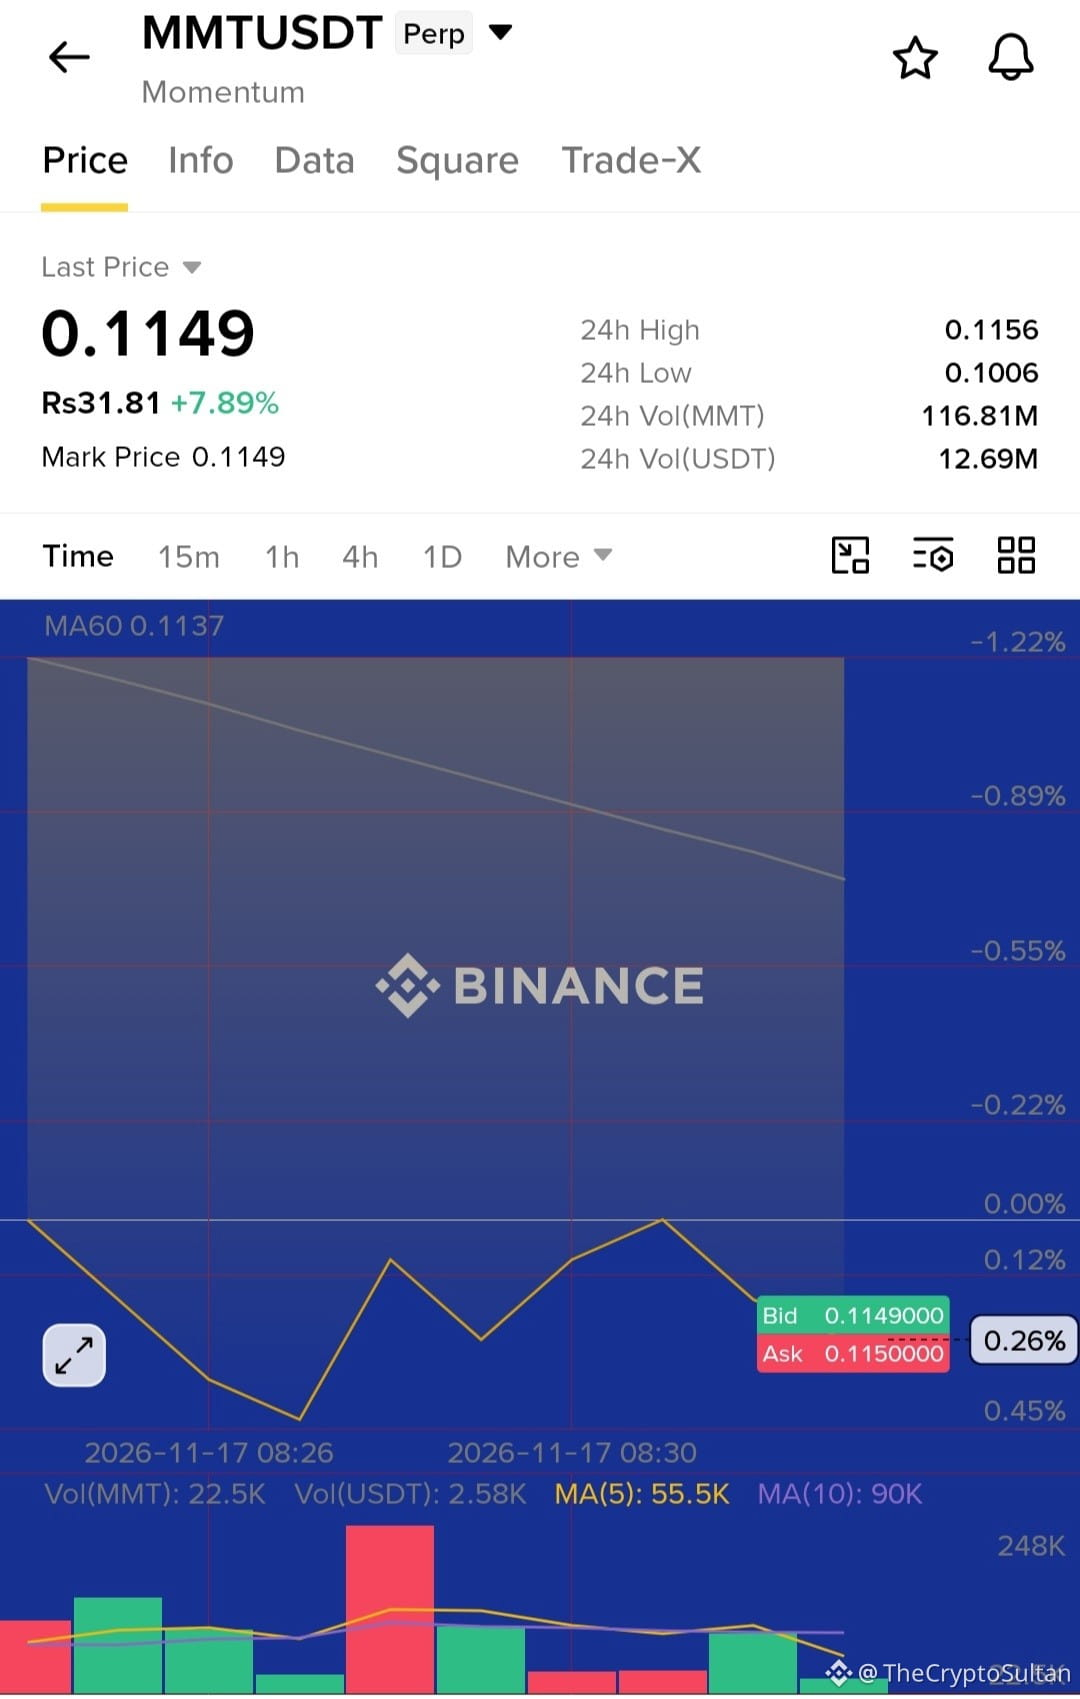
🚀 $MMT BREAKOUT ALERT! BULLISH MOMENTUM BUILDING – $0.1200 IN SIGHT! 📈🔥
$MMT is showing promising bullish momentum, with buyers looking to push the price toward higher resistance levels. If the bullish structure remains intact, a move toward $0.1200 and beyond could be on the cards.
🎯 LONG TRADE SETUP
🟢 Entry Zone: $0.1120 – $0.1140
🎯 TP1: $0.1170
🎯 TP2: $0.1200
🎯 TP3: $0.1240
🛑 Stop Loss: $0.1090
📊 Trading Strategy: Watch for strong buying volume and confirmation around the entry zone. Manage risk carefully and consider securing partial profits at each target.
🔥 Stay disciplined, follow the plan, and trade smart!
#MMT #CryptoTrading #Binance
{future}(MMTUSDT)
🚀 $MMT BREAKOUT ALERT! BULLISH MOMENTUM BUILDING – $0.1200 IN SIGHT! 📈🔥
$MMT is showing promising bullish momentum, with buyers looking to push the price toward higher resistance levels. If the bullish structure remains intact, a move toward $0.1200 and beyond could be on the cards.
🎯 LONG TRADE SETUP
🟢 Entry Zone: $0.1120 – $0.1140
🎯 TP1: $0.1170
🎯 TP2: $0.1200
🎯 TP3: $0.1240
🛑 Stop Loss: $0.1090
📊 Trading Strategy: Watch for strong buying volume and confirmation around the entry zone. Manage risk carefully and consider securing partial profits at each target.
🔥 Stay disciplined, follow the plan, and trade smart!
#MMT #CryptoTrading #Binance
$MMT is showing promising bullish momentum, with buyers looking to push the price toward higher resistance levels. If the bullish structure remains intact, a move toward $0.1200 and beyond could be on the cards.
🎯 LONG TRADE SETUP
🟢 Entry Zone: $0.1120 – $0.1140
🎯 TP1: $0.1170
🎯 TP2: $0.1200
🎯 TP3: $0.1240
🛑 Stop Loss: $0.1090
📊 Trading Strategy: Watch for strong buying volume and confirmation around the entry zone. Manage risk carefully and consider securing partial profits at each target.
🔥 Stay disciplined, follow the plan, and trade smart!
#MMT #CryptoTrading #Binance
6
·
--
Bullish
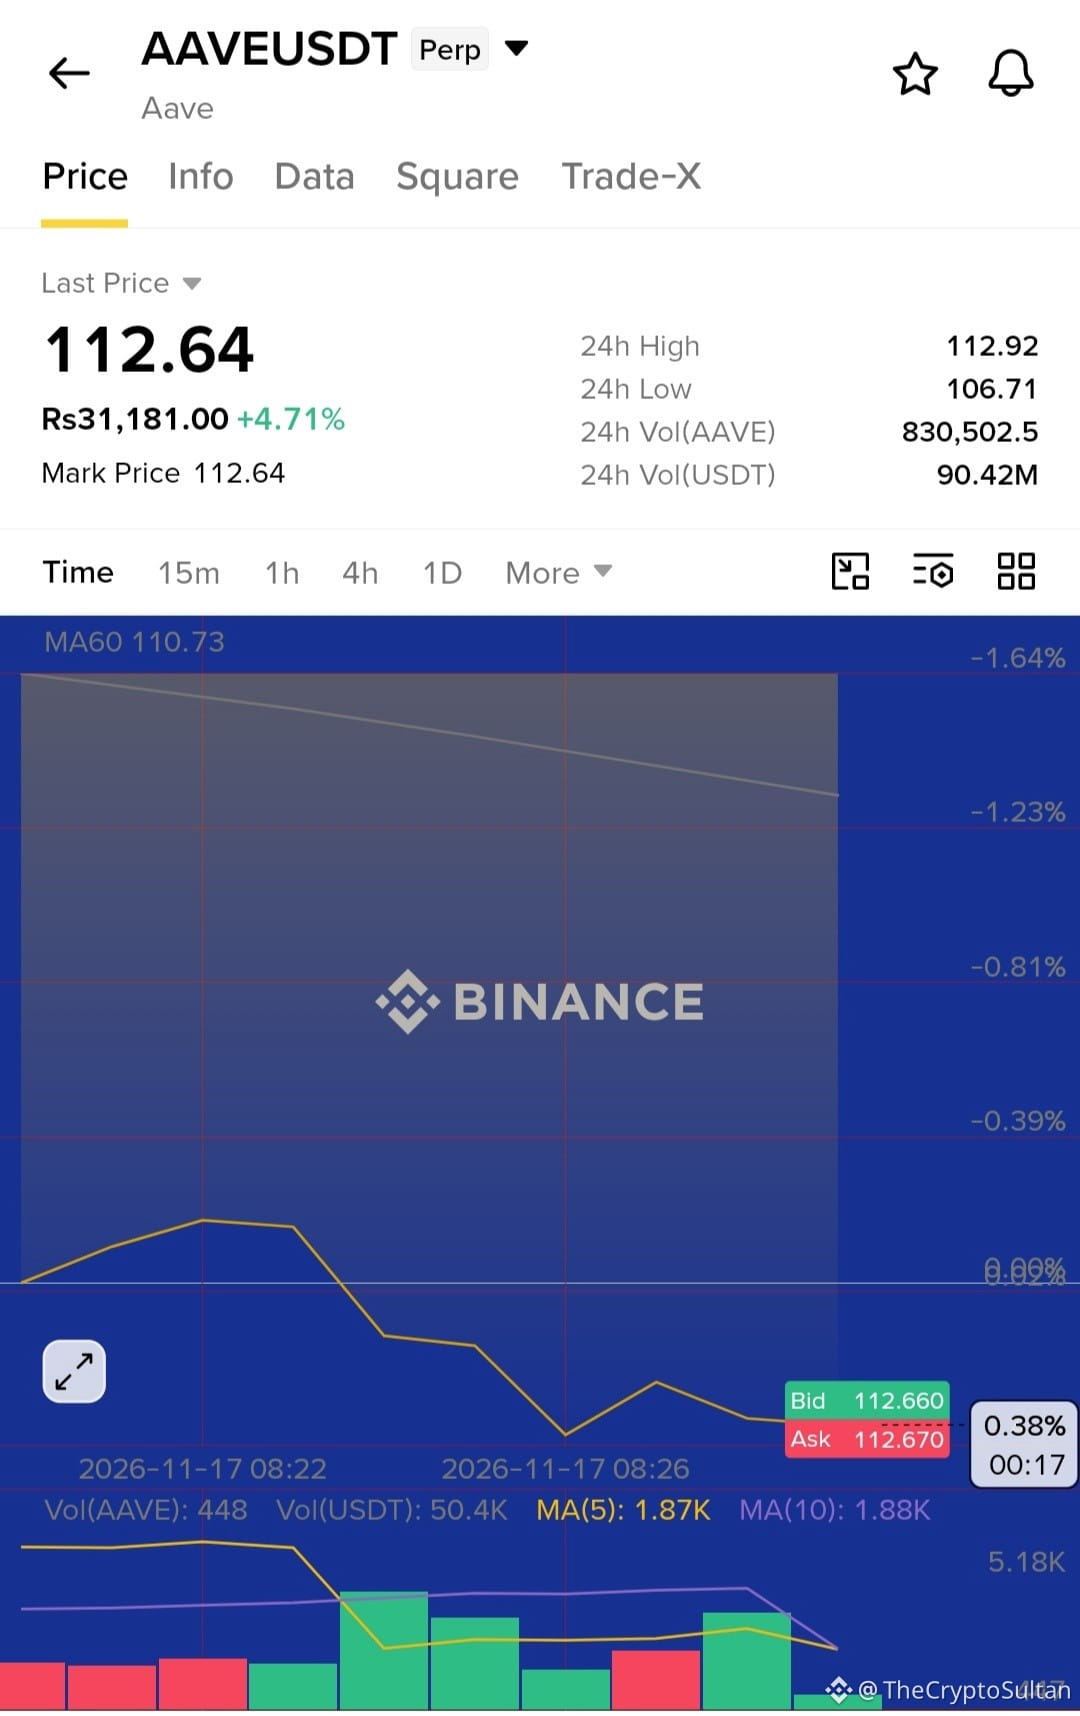
🚀 $AAVE E BULLISH BREAKOUT — BUYERS TAKE CONTROL! 📈
AAVE is showing strong bullish momentum after breaking out on the 15-minute chart with a powerful green candle and 2.66x trading volume. This signals increasing buying interest and a potential continuation toward higher levels.
🔥 AAVE LONG TRADE SETUP
📍 Entry Zone: $110.857 – $111.050
🎯 Take Profit: $112.017
🛑 Stop Loss: $110.083
Bulls are stepping in! Watch for continued volume and price strength to confirm the breakout. Stay disciplined, manage your risk, and trade smart.
DYOR – Always follow your risk management strategy.
#AAVE #cryptotrading #Binance
{future}(AAVEUSDT)
🚀 $AAVE E BULLISH BREAKOUT — BUYERS TAKE CONTROL! 📈
AAVE is showing strong bullish momentum after breaking out on the 15-minute chart with a powerful green candle and 2.66x trading volume. This signals increasing buying interest and a potential continuation toward higher levels.
🔥 AAVE LONG TRADE SETUP
📍 Entry Zone: $110.857 – $111.050
🎯 Take Profit: $112.017
🛑 Stop Loss: $110.083
Bulls are stepping in! Watch for continued volume and price strength to confirm the breakout. Stay disciplined, manage your risk, and trade smart.
DYOR – Always follow your risk management strategy.
#AAVE #cryptotrading #Binance
AAVE is showing strong bullish momentum after breaking out on the 15-minute chart with a powerful green candle and 2.66x trading volume. This signals increasing buying interest and a potential continuation toward higher levels.
🔥 AAVE LONG TRADE SETUP
📍 Entry Zone: $110.857 – $111.050
🎯 Take Profit: $112.017
🛑 Stop Loss: $110.083
Bulls are stepping in! Watch for continued volume and price strength to confirm the breakout. Stay disciplined, manage your risk, and trade smart.
DYOR – Always follow your risk management strategy.
#AAVE #cryptotrading #Binance
5
·
--
Bullish
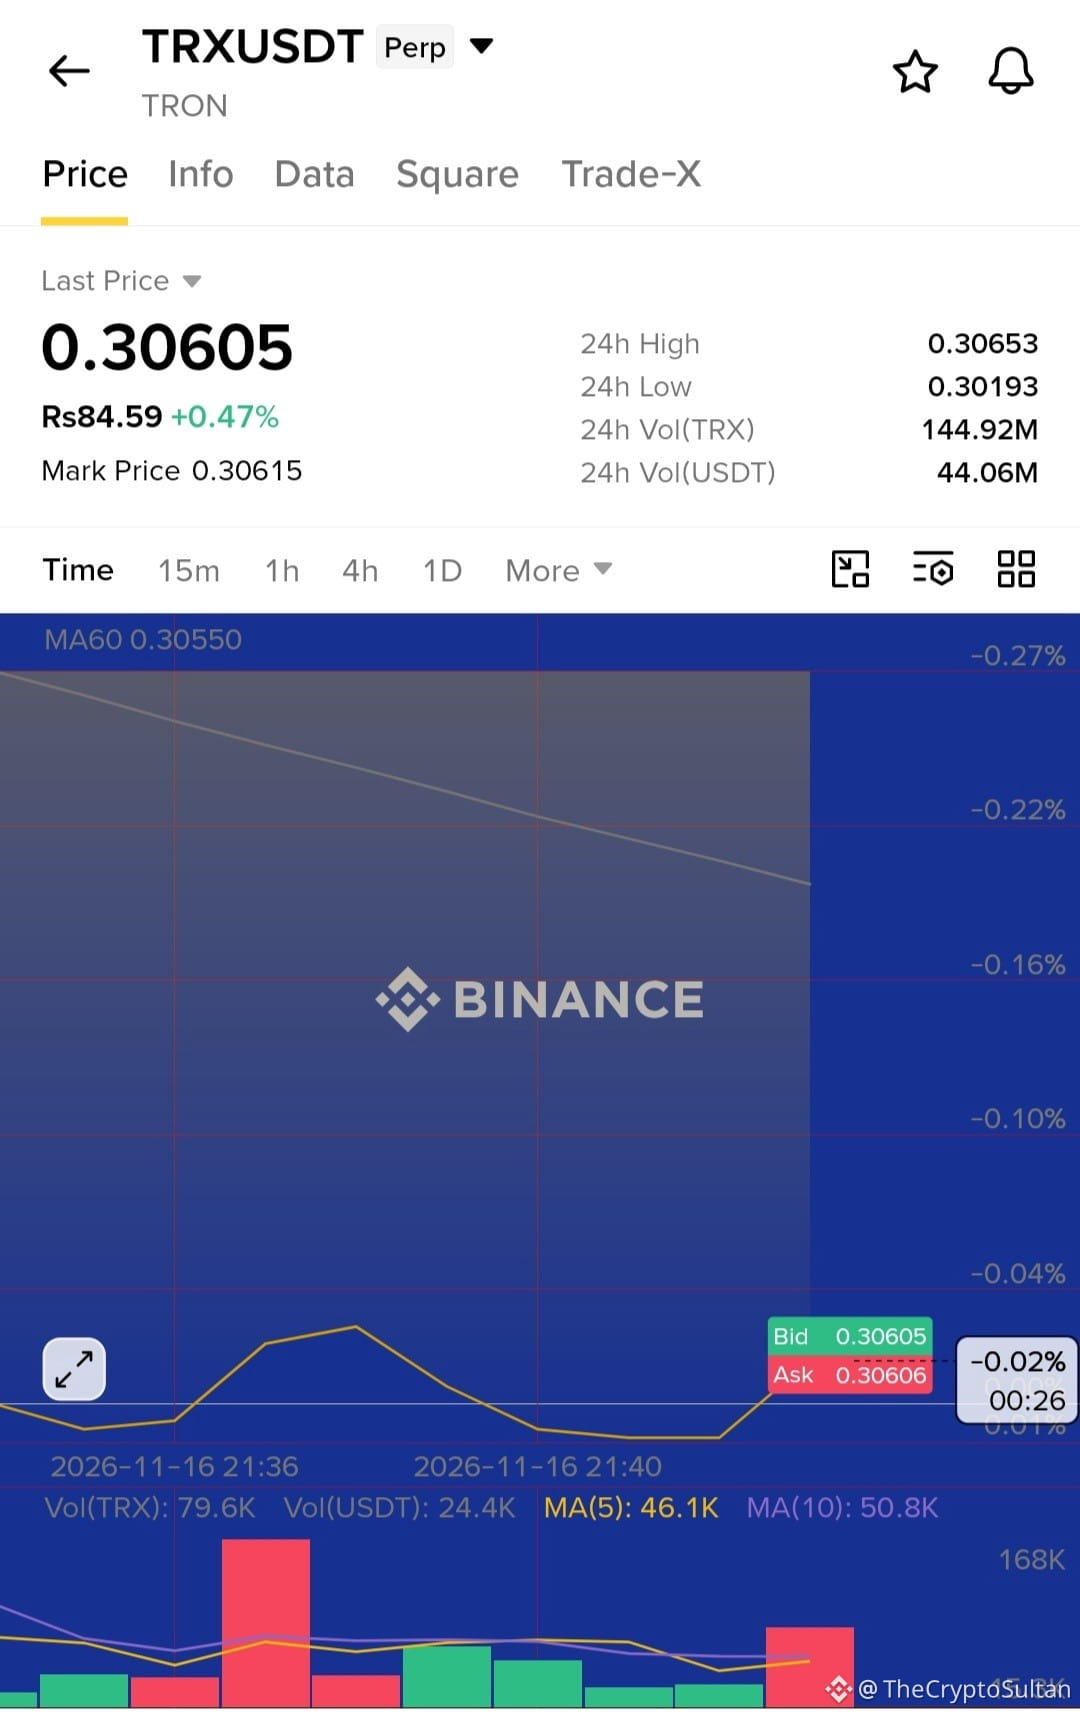
🚀 $TRX BULLISH MOMENTUM – $0.3100 IN SIGHT! 📈
TRON ($TRX) is showing strong buying pressure, with bulls attempting to take control. A confirmed breakout above $0.3067 could trigger another upward move toward the $0.3100 target.
🔥 TRX LONG TRADE SETUP
🟢 Entry Zone: $0.3058 – $0.3063
🛑 Stop Loss: $0.3045
🎯 Take Profit Targets:
TP1: $0.3070
TP2: $0.3080
TP3: $0.3100
📊 Watch the $0.3067 breakout level closely. Strong volume and confirmation could support further upside momentum.
Trade smart, manage your risk, and always do your own research (DYOR).
#TRX #Tron #cryptotrading
{future}(TRXUSDT)
🚀 $TRX BULLISH MOMENTUM – $0.3100 IN SIGHT! 📈
TRON ($TRX ) is showing strong buying pressure, with bulls attempting to take control. A confirmed breakout above $0.3067 could trigger another upward move toward the $0.3100 target.
🔥 TRX LONG TRADE SETUP
🟢 Entry Zone: $0.3058 – $0.3063
🛑 Stop Loss: $0.3045
🎯 Take Profit Targets:
TP1: $0.3070
TP2: $0.3080
TP3: $0.3100
📊 Watch the $0.3067 breakout level closely. Strong volume and confirmation could support further upside momentum.
Trade smart, manage your risk, and always do your own research (DYOR).
#TRX #Tron #cryptotrading
TRON ($TRX ) is showing strong buying pressure, with bulls attempting to take control. A confirmed breakout above $0.3067 could trigger another upward move toward the $0.3100 target.
🔥 TRX LONG TRADE SETUP
🟢 Entry Zone: $0.3058 – $0.3063
🛑 Stop Loss: $0.3045
🎯 Take Profit Targets:
TP1: $0.3070
TP2: $0.3080
TP3: $0.3100
📊 Watch the $0.3067 breakout level closely. Strong volume and confirmation could support further upside momentum.
Trade smart, manage your risk, and always do your own research (DYOR).
#TRX #Tron #cryptotrading
9
Log in to explore more content
Join global crypto users on Binance Square
⚡️ Get latest and useful information about crypto.
💬 Trusted by the world’s largest crypto exchange.
👍 Discover real insights from verified creators.
Email / Phone number
Trending Topics
NvidiaBeatsEstimatesWith$130BQ4Outlook
17,261 views
229 Discussing
Nvidia Beats With $115.8 Billion in Revenue, Guides to $130 Billion and Adds $150 Billion Buyback
Binance News
·70 Likes
·47.7k views
AnthropicIPOPriceCouldExceed$80
22,019 views
197 Discussing
RussiaCentralBankAddsAlfaBankToCryptoExchangeRegister
0 views
20 Discussing