

The Crypto Basic
7.8k Posts

The Crypto Basic
 Square Verified+
Report
Block User
Your Ultimate Crypto News Source
0 Following
36.4K+ Followers
165.9K+ Liked
Posts

Article
"Ripple’s Large XRP Holdings Matter, but Do Not Rule Out Higher Prices"#XRP exchange withdrawals alone may not create a supply shock, as Ripple still controls billions of XRP and scheduled escrow releases continue adding available supply.
Why Falling Exchange XRP Supply Alone May Not Be Enough to Trigger a Supply Shock
XRP holders have increasingly focused on exchange balances as a potential catalyst for higher prices, arguing that continued withdrawals could eventually leave trading platforms short of tokens. However, XRP’s wider supply structure shows why falling exchange reserves alone do not guarantee a supply shock. Ripple still controls billions of XRP, while scheduled escrow releases continue adding tokens to the company’s available holdings.
The argument does require an important correction: Ripple no longer controls half of XRP’s original 100 billion supply.
Ripple’s latest official disclosure, dated June 30, showed the company controlling 37.656 billion XRP, or roughly 37.7% of the original supply. Of this amount, 32.6 billion XRP was locked in on-ledger escrow, leaving roughly 5.06 billion XRP outside escrow within Ripple’s reported holdings.
Ripple Cannot Access All Its XRP at Once
The distinction between Ripple’s liquid holdings and escrowed XRP is important.
XRP locked in escrow cannot simply be moved whenever Ripple wants. The XRPL itself enforces the release schedule, meaning the company must wait until the programmed unlock date before accessing those tokens.
Ripple originally placed 55 billion XRP into escrow in 2017, with scheduled releases of up to 1 billion XRP per month. Tokens that are not used can be returned to new escrow contracts, pushing their availability further into the future.
This process continued on Oct. 1, when 1 billion XRP was released across four transactions. Ripple subsequently returned 700 million XRP to escrow, leaving 300 million from the gross monthly release outside the newly created locks.
That does not mean 300 million XRP was immediately sold. Released tokens can remain in Ripple wallets or be used for investments, ecosystem activity, institutional transactions, and other purposes.
Latest XRPScan data placed the amount still locked in escrow at roughly 31.845 billion XRP.
Exchanges Do Not Need to Run Out of XRP for Scarcity to Matter
A genuine supply squeeze also does not require XRP to completely disappear from Binance, Coinbase or other exchanges.
What matters is the amount of XRP readily offered for sale relative to incoming demand. An exchange could hold hundreds of millions of XRP and still experience tighter liquidity if buyers consistently absorb available sell orders faster than sellers replace them.
However, recent Binance data has moved in the opposite direction. The XRP Binance Scarcity Index recently fell to around -0.94, its lowest level since January 2025, indicating that XRP had become relatively more abundant on the exchange.
This suggests that exchange supply conditions can reverse even after periods of large withdrawals.
Escrow Creates a Predictable Source of Future XRP
Ripple’s escrow therefore remains relevant to the supply-shock argument because XRP continues to become available on a predetermined schedule.
It does not give Ripple unlimited tokens or the ability to release escrowed XRP whenever it chooses. Still, monthly unlocks mean part of the locked supply can gradually become available over time.
This can moderate scarcity if released XRP eventually reaches exchanges, institutions, market makers, or other market participants.
Yet escrow releases alone do not establish XRP’s price direction. XRP surged roughly 280% during Q4 2024 despite the same escrow mechanism operating throughout the rally.
Ultimately, XRP price depends on the balance between new demand and the amount holders are willing to sell. Ripple’s remaining supply can influence that equation, but the data does not support the claim that its holdings make a future XRP supply squeeze impossible—or that XRP can never rise because exchanges will always have tokens available.
#Crypto
"Ripple’s Large XRP Holdings Matter, but Do Not Rule Out Higher Prices"
#XRP exchange withdrawals alone may not create a supply shock, as Ripple still controls billions of XRP and scheduled escrow releases continue adding available supply.
Why Falling Exchange XRP Supply Alone May Not Be Enough to Trigger a Supply Shock
XRP holders have increasingly focused on exchange balances as a potential catalyst for higher prices, arguing that continued withdrawals could eventually leave trading platforms short of tokens. However, XRP’s wider supply structure shows why falling exchange reserves alone do not guarantee a supply shock. Ripple still controls billions of XRP, while scheduled escrow releases continue adding tokens to the company’s available holdings.
The argument does require an important correction: Ripple no longer controls half of XRP’s original 100 billion supply.
Ripple’s latest official disclosure, dated June 30, showed the company controlling 37.656 billion XRP, or roughly 37.7% of the original supply. Of this amount, 32.6 billion XRP was locked in on-ledger escrow, leaving roughly 5.06 billion XRP outside escrow within Ripple’s reported holdings.
Ripple Cannot Access All Its XRP at Once
The distinction between Ripple’s liquid holdings and escrowed XRP is important.
XRP locked in escrow cannot simply be moved whenever Ripple wants. The XRPL itself enforces the release schedule, meaning the company must wait until the programmed unlock date before accessing those tokens.
Ripple originally placed 55 billion XRP into escrow in 2017, with scheduled releases of up to 1 billion XRP per month. Tokens that are not used can be returned to new escrow contracts, pushing their availability further into the future.
This process continued on Oct. 1, when 1 billion XRP was released across four transactions. Ripple subsequently returned 700 million XRP to escrow, leaving 300 million from the gross monthly release outside the newly created locks.
That does not mean 300 million XRP was immediately sold. Released tokens can remain in Ripple wallets or be used for investments, ecosystem activity, institutional transactions, and other purposes.
Latest XRPScan data placed the amount still locked in escrow at roughly 31.845 billion XRP.
Exchanges Do Not Need to Run Out of XRP for Scarcity to Matter
A genuine supply squeeze also does not require XRP to completely disappear from Binance, Coinbase or other exchanges.
What matters is the amount of XRP readily offered for sale relative to incoming demand. An exchange could hold hundreds of millions of XRP and still experience tighter liquidity if buyers consistently absorb available sell orders faster than sellers replace them.
However, recent Binance data has moved in the opposite direction. The XRP Binance Scarcity Index recently fell to around -0.94, its lowest level since January 2025, indicating that XRP had become relatively more abundant on the exchange.
This suggests that exchange supply conditions can reverse even after periods of large withdrawals.
Escrow Creates a Predictable Source of Future XRP
Ripple’s escrow therefore remains relevant to the supply-shock argument because XRP continues to become available on a predetermined schedule.
It does not give Ripple unlimited tokens or the ability to release escrowed XRP whenever it chooses. Still, monthly unlocks mean part of the locked supply can gradually become available over time.
This can moderate scarcity if released XRP eventually reaches exchanges, institutions, market makers, or other market participants.
Yet escrow releases alone do not establish XRP’s price direction. XRP surged roughly 280% during Q4 2024 despite the same escrow mechanism operating throughout the rally.
Ultimately, XRP price depends on the balance between new demand and the amount holders are willing to sell. Ripple’s remaining supply can influence that equation, but the data does not support the claim that its holdings make a future XRP supply squeeze impossible—or that XRP can never rise because exchanges will always have tokens available.
#Crypto
Why Falling Exchange XRP Supply Alone May Not Be Enough to Trigger a Supply Shock
XRP holders have increasingly focused on exchange balances as a potential catalyst for higher prices, arguing that continued withdrawals could eventually leave trading platforms short of tokens. However, XRP’s wider supply structure shows why falling exchange reserves alone do not guarantee a supply shock. Ripple still controls billions of XRP, while scheduled escrow releases continue adding tokens to the company’s available holdings.
The argument does require an important correction: Ripple no longer controls half of XRP’s original 100 billion supply.
Ripple’s latest official disclosure, dated June 30, showed the company controlling 37.656 billion XRP, or roughly 37.7% of the original supply. Of this amount, 32.6 billion XRP was locked in on-ledger escrow, leaving roughly 5.06 billion XRP outside escrow within Ripple’s reported holdings.
Ripple Cannot Access All Its XRP at Once
The distinction between Ripple’s liquid holdings and escrowed XRP is important.
XRP locked in escrow cannot simply be moved whenever Ripple wants. The XRPL itself enforces the release schedule, meaning the company must wait until the programmed unlock date before accessing those tokens.
Ripple originally placed 55 billion XRP into escrow in 2017, with scheduled releases of up to 1 billion XRP per month. Tokens that are not used can be returned to new escrow contracts, pushing their availability further into the future.
This process continued on Oct. 1, when 1 billion XRP was released across four transactions. Ripple subsequently returned 700 million XRP to escrow, leaving 300 million from the gross monthly release outside the newly created locks.
That does not mean 300 million XRP was immediately sold. Released tokens can remain in Ripple wallets or be used for investments, ecosystem activity, institutional transactions, and other purposes.
Latest XRPScan data placed the amount still locked in escrow at roughly 31.845 billion XRP.
Exchanges Do Not Need to Run Out of XRP for Scarcity to Matter
A genuine supply squeeze also does not require XRP to completely disappear from Binance, Coinbase or other exchanges.
What matters is the amount of XRP readily offered for sale relative to incoming demand. An exchange could hold hundreds of millions of XRP and still experience tighter liquidity if buyers consistently absorb available sell orders faster than sellers replace them.
However, recent Binance data has moved in the opposite direction. The XRP Binance Scarcity Index recently fell to around -0.94, its lowest level since January 2025, indicating that XRP had become relatively more abundant on the exchange.
This suggests that exchange supply conditions can reverse even after periods of large withdrawals.
Escrow Creates a Predictable Source of Future XRP
Ripple’s escrow therefore remains relevant to the supply-shock argument because XRP continues to become available on a predetermined schedule.
It does not give Ripple unlimited tokens or the ability to release escrowed XRP whenever it chooses. Still, monthly unlocks mean part of the locked supply can gradually become available over time.
This can moderate scarcity if released XRP eventually reaches exchanges, institutions, market makers, or other market participants.
Yet escrow releases alone do not establish XRP’s price direction. XRP surged roughly 280% during Q4 2024 despite the same escrow mechanism operating throughout the rally.
Ultimately, XRP price depends on the balance between new demand and the amount holders are willing to sell. Ripple’s remaining supply can influence that equation, but the data does not support the claim that its holdings make a future XRP supply squeeze impossible—or that XRP can never rise because exchanges will always have tokens available.
#Crypto
252
Verified

Article
"VirtualBacon Founder Sees 3X Potential for Cardano Despite ADA Slower Outlook This Cycle"VirtualBacon founder Dennis Liu has pushed back against claims that Cardano is dead, arguing that ADA could potentially triple from its current level.
In a recent commentary, Liu maintained that Cardano still has room for significant gains. Although he does not expect ADA to outperform most other cryptocurrencies this cycle, he pointed to Bitcoin’s potential for another major move as a reason to remain optimistic about the asset.
Liu Sees 3X Potential for ADA
Liu argued that Bitcoin still has at least another 2X move ahead and suggested that ADA could potentially deliver an even larger percentage gain.
“I don’t think it beats most coins this cycle, but Bitcoin still has at least a double left to run, and I see no reason ADA can’t at least triple,” Liu remarked.
At the time of his commentary, ADA was trading at around $0.2437. Therefore, a 3X increase from that level would place the token at $0.7311.
Such a move would represent a significant recovery for ADA. The token last traded around the $0.73 area in October 2025, meaning a return to that level would take ADA back to a price range it has not revisited in several months.
Experts Dismiss Cardano’s “Dead Blockchain” Narrative
Liu’s comments come as Cardano continues to face criticism over its price performance and network adoption.
ADA has fallen substantially from its $3.10 all-time high, leaving the cryptocurrency in roughly the $0.20–$0.25 range. As a result, skeptics have used its prolonged decline to question whether Cardano can regain its previous market relevance.
Critics have also highlighted Cardano’s transaction activity compared with competing networks. Cardano has processed around 124 million transactions, while Ethereum and Solana have recorded transaction counts in the billions.
However, Cardano supporters continue to reject the dead blockchain narrative. DexHunter, for instance, has previously argued that the network and token remain active. Similarly, market analyst Eric Van Tassel has suggested that ADA could be approaching a major breakout after maintaining a rising macro support trend for roughly nine years.
Moreover, Cardano founder Charles Hoskinson has continued to express optimism about ADA’s long-term prospects, projecting its return to the top-10 ranking.
ADA Continues to Underperform in the Near Term
Despite the longer-term optimism, ADA’s recent price performance remains subdued.
The token traded above $0.25 in recent days before falling back below that level. At press time, ADA had declined 3.59% over 24 hours, highlighting the selling pressure still weighing on the cryptocurrency.
Meanwhile, Cardano-related token Midnight (NIGHT) moved in the opposite direction. The token surged more than 24%, making it the biggest gainer among the top 100 cryptocurrencies at the time.
#CryptonewswithJack
"VirtualBacon Founder Sees 3X Potential for Cardano Despite ADA Slower Outlook This Cycle"
VirtualBacon founder Dennis Liu has pushed back against claims that Cardano is dead, arguing that ADA could potentially triple from its current level.
In a recent commentary, Liu maintained that Cardano still has room for significant gains. Although he does not expect ADA to outperform most other cryptocurrencies this cycle, he pointed to Bitcoin’s potential for another major move as a reason to remain optimistic about the asset.
Liu Sees 3X Potential for ADA
Liu argued that Bitcoin still has at least another 2X move ahead and suggested that ADA could potentially deliver an even larger percentage gain.
“I don’t think it beats most coins this cycle, but Bitcoin still has at least a double left to run, and I see no reason ADA can’t at least triple,” Liu remarked.
At the time of his commentary, ADA was trading at around $0.2437. Therefore, a 3X increase from that level would place the token at $0.7311.
Such a move would represent a significant recovery for ADA. The token last traded around the $0.73 area in October 2025, meaning a return to that level would take ADA back to a price range it has not revisited in several months.
Experts Dismiss Cardano’s “Dead Blockchain” Narrative
Liu’s comments come as Cardano continues to face criticism over its price performance and network adoption.
ADA has fallen substantially from its $3.10 all-time high, leaving the cryptocurrency in roughly the $0.20–$0.25 range. As a result, skeptics have used its prolonged decline to question whether Cardano can regain its previous market relevance.
Critics have also highlighted Cardano’s transaction activity compared with competing networks. Cardano has processed around 124 million transactions, while Ethereum and Solana have recorded transaction counts in the billions.
However, Cardano supporters continue to reject the dead blockchain narrative. DexHunter, for instance, has previously argued that the network and token remain active. Similarly, market analyst Eric Van Tassel has suggested that ADA could be approaching a major breakout after maintaining a rising macro support trend for roughly nine years.
Moreover, Cardano founder Charles Hoskinson has continued to express optimism about ADA’s long-term prospects, projecting its return to the top-10 ranking.
ADA Continues to Underperform in the Near Term
Despite the longer-term optimism, ADA’s recent price performance remains subdued.
The token traded above $0.25 in recent days before falling back below that level. At press time, ADA had declined 3.59% over 24 hours, highlighting the selling pressure still weighing on the cryptocurrency.
Meanwhile, Cardano-related token Midnight (NIGHT) moved in the opposite direction. The token surged more than 24%, making it the biggest gainer among the top 100 cryptocurrencies at the time.
#CryptonewswithJack
In a recent commentary, Liu maintained that Cardano still has room for significant gains. Although he does not expect ADA to outperform most other cryptocurrencies this cycle, he pointed to Bitcoin’s potential for another major move as a reason to remain optimistic about the asset.
Liu Sees 3X Potential for ADA
Liu argued that Bitcoin still has at least another 2X move ahead and suggested that ADA could potentially deliver an even larger percentage gain.
“I don’t think it beats most coins this cycle, but Bitcoin still has at least a double left to run, and I see no reason ADA can’t at least triple,” Liu remarked.
At the time of his commentary, ADA was trading at around $0.2437. Therefore, a 3X increase from that level would place the token at $0.7311.
Such a move would represent a significant recovery for ADA. The token last traded around the $0.73 area in October 2025, meaning a return to that level would take ADA back to a price range it has not revisited in several months.
Experts Dismiss Cardano’s “Dead Blockchain” Narrative
Liu’s comments come as Cardano continues to face criticism over its price performance and network adoption.
ADA has fallen substantially from its $3.10 all-time high, leaving the cryptocurrency in roughly the $0.20–$0.25 range. As a result, skeptics have used its prolonged decline to question whether Cardano can regain its previous market relevance.
Critics have also highlighted Cardano’s transaction activity compared with competing networks. Cardano has processed around 124 million transactions, while Ethereum and Solana have recorded transaction counts in the billions.
However, Cardano supporters continue to reject the dead blockchain narrative. DexHunter, for instance, has previously argued that the network and token remain active. Similarly, market analyst Eric Van Tassel has suggested that ADA could be approaching a major breakout after maintaining a rising macro support trend for roughly nine years.
Moreover, Cardano founder Charles Hoskinson has continued to express optimism about ADA’s long-term prospects, projecting its return to the top-10 ranking.
ADA Continues to Underperform in the Near Term
Despite the longer-term optimism, ADA’s recent price performance remains subdued.
The token traded above $0.25 in recent days before falling back below that level. At press time, ADA had declined 3.59% over 24 hours, highlighting the selling pressure still weighing on the cryptocurrency.
Meanwhile, Cardano-related token Midnight (NIGHT) moved in the opposite direction. The token surged more than 24%, making it the biggest gainer among the top 100 cryptocurrencies at the time.
#CryptonewswithJack
803

Article
"XRP Rejected at $1.52: Why $1.46 Is Now the Critical Level for a Year-End Rally"#XRP price is facing selling pressure after a failed breakout left buyers struggling to hold the $1.46 support level.
Analyst ChartNerd believes a break below this level puts XRP on track for further losses before the end of 2026.
In a recent post on X, ChartNerd said XRP’s bullish breakout had failed after the price dropped below key Fibonacci levels. Now, buyers need to defend the $1.45–$1.46 area for XRP to recover and move back above the 50-week exponential moving average (EMA).
This is the same support zone he highlighted earlier. His latest warning puts XRP at a key turning point: holding this level supports a recovery, while losing it opens the door to further declines.
At press time, XRP is hovering around $1.48, dipping by 3.5% over the past day. The coin reached $1.55 during this period but quickly retraced to lower levels.
XRP Price Faces Resistance Below
ChartNerd’s chart shows XRP trading in a narrow range, with a downward-sloping resistance line preventing a recovery. Support sits around $1.46.
The pattern resembles a descending triangle. Sellers are pushing the price lower, while buyers are defending the same support level. For XRP to improve its outlook, the price needs to break above the downward trendline and hold there.
The bigger concern is the downside. A break below $1.46 would weaken the current support structure and send the price lower. Meanwhile, holding above it gives buyers another opportunity to push higher, while breaking below it signals further downside.
$1.52 EMA Rejection Keeps Lower Prices in Focus
In another post, ChartNerd described two paths for XRP by the end of the year. Both depend on whether XRP moves back above the 50-week EMA, which sits around $1.52.
If XRP continues getting rejected at $1.52 and fails to hold above it on weekly closes, ChartNerd says the price heads toward the lower-$1 range by year-end.
This would extend the damage from XRP’s failed breakout. Instead of recovering, the token would continue forming lower highs as sellers maintain control. A brief move above $1.52 is not enough. XRP needs to remain above this level to confirm that the downtrend is weakening.
Meanwhile, ChartNerd does not say XRP price will definitely fall to the lower-$1 range. He identifies it as an outcome tied to continued weakness below the 50-week EMA.
What Improves XRP Year-End Outlook?
Despite the bearish warning, ChartNerd also sees a recovery path for XRP. If XRP moves above the 50-week EMA and then rises toward $1.80, the token would form a higher low before the end of 2026.
A higher low means the price finds support above its previous major low. This signals weakening selling pressure and strengthening demand. For XRP, that setup would suggest the recent decline is part of a recovery.
But XRP first needs to hold the $1.45–$1.46 support zone, reclaim $1.52, and then advance toward $1.80. Until it reclaims those levels, downside pressure remains intact.
#CryptoNewss
"XRP Rejected at $1.52: Why $1.46 Is Now the Critical Level for a Year-End Rally"
#XRP price is facing selling pressure after a failed breakout left buyers struggling to hold the $1.46 support level.
Analyst ChartNerd believes a break below this level puts XRP on track for further losses before the end of 2026.
In a recent post on X, ChartNerd said XRP’s bullish breakout had failed after the price dropped below key Fibonacci levels. Now, buyers need to defend the $1.45–$1.46 area for XRP to recover and move back above the 50-week exponential moving average (EMA).
This is the same support zone he highlighted earlier. His latest warning puts XRP at a key turning point: holding this level supports a recovery, while losing it opens the door to further declines.
At press time, XRP is hovering around $1.48, dipping by 3.5% over the past day. The coin reached $1.55 during this period but quickly retraced to lower levels.
XRP Price Faces Resistance Below
ChartNerd’s chart shows XRP trading in a narrow range, with a downward-sloping resistance line preventing a recovery. Support sits around $1.46.
The pattern resembles a descending triangle. Sellers are pushing the price lower, while buyers are defending the same support level. For XRP to improve its outlook, the price needs to break above the downward trendline and hold there.
The bigger concern is the downside. A break below $1.46 would weaken the current support structure and send the price lower. Meanwhile, holding above it gives buyers another opportunity to push higher, while breaking below it signals further downside.
$1.52 EMA Rejection Keeps Lower Prices in Focus
In another post, ChartNerd described two paths for XRP by the end of the year. Both depend on whether XRP moves back above the 50-week EMA, which sits around $1.52.
If XRP continues getting rejected at $1.52 and fails to hold above it on weekly closes, ChartNerd says the price heads toward the lower-$1 range by year-end.
This would extend the damage from XRP’s failed breakout. Instead of recovering, the token would continue forming lower highs as sellers maintain control. A brief move above $1.52 is not enough. XRP needs to remain above this level to confirm that the downtrend is weakening.
Meanwhile, ChartNerd does not say XRP price will definitely fall to the lower-$1 range. He identifies it as an outcome tied to continued weakness below the 50-week EMA.
What Improves XRP Year-End Outlook?
Despite the bearish warning, ChartNerd also sees a recovery path for XRP. If XRP moves above the 50-week EMA and then rises toward $1.80, the token would form a higher low before the end of 2026.
A higher low means the price finds support above its previous major low. This signals weakening selling pressure and strengthening demand. For XRP, that setup would suggest the recent decline is part of a recovery.
But XRP first needs to hold the $1.45–$1.46 support zone, reclaim $1.52, and then advance toward $1.80. Until it reclaims those levels, downside pressure remains intact.
#CryptoNewss
Analyst ChartNerd believes a break below this level puts XRP on track for further losses before the end of 2026.
In a recent post on X, ChartNerd said XRP’s bullish breakout had failed after the price dropped below key Fibonacci levels. Now, buyers need to defend the $1.45–$1.46 area for XRP to recover and move back above the 50-week exponential moving average (EMA).
This is the same support zone he highlighted earlier. His latest warning puts XRP at a key turning point: holding this level supports a recovery, while losing it opens the door to further declines.
At press time, XRP is hovering around $1.48, dipping by 3.5% over the past day. The coin reached $1.55 during this period but quickly retraced to lower levels.
XRP Price Faces Resistance Below
ChartNerd’s chart shows XRP trading in a narrow range, with a downward-sloping resistance line preventing a recovery. Support sits around $1.46.
The pattern resembles a descending triangle. Sellers are pushing the price lower, while buyers are defending the same support level. For XRP to improve its outlook, the price needs to break above the downward trendline and hold there.
The bigger concern is the downside. A break below $1.46 would weaken the current support structure and send the price lower. Meanwhile, holding above it gives buyers another opportunity to push higher, while breaking below it signals further downside.
$1.52 EMA Rejection Keeps Lower Prices in Focus
In another post, ChartNerd described two paths for XRP by the end of the year. Both depend on whether XRP moves back above the 50-week EMA, which sits around $1.52.
If XRP continues getting rejected at $1.52 and fails to hold above it on weekly closes, ChartNerd says the price heads toward the lower-$1 range by year-end.
This would extend the damage from XRP’s failed breakout. Instead of recovering, the token would continue forming lower highs as sellers maintain control. A brief move above $1.52 is not enough. XRP needs to remain above this level to confirm that the downtrend is weakening.
Meanwhile, ChartNerd does not say XRP price will definitely fall to the lower-$1 range. He identifies it as an outcome tied to continued weakness below the 50-week EMA.
What Improves XRP Year-End Outlook?
Despite the bearish warning, ChartNerd also sees a recovery path for XRP. If XRP moves above the 50-week EMA and then rises toward $1.80, the token would form a higher low before the end of 2026.
A higher low means the price finds support above its previous major low. This signals weakening selling pressure and strengthening demand. For XRP, that setup would suggest the recent decline is part of a recovery.
But XRP first needs to hold the $1.45–$1.46 support zone, reclaim $1.52, and then advance toward $1.80. Until it reclaims those levels, downside pressure remains intact.
#CryptoNewss
264
Article
"Quant (QNT) Price Outlook: Is a $409 Breakout Coming in the Next 2–3 Days?"Quant (QNT) is approaching a decision point over the next two to three days as a triangle pattern moves toward a breakout or breakdown.
Technical analyst @MWi_EW on X says QNT price has followed his expected path so far, bouncing from the 0.786 Fibonacci retracement level.
In a post on X, the analyst said QNT had reached the 0.786 level and bounced, keeping the bullish outlook intact. However, the triangle is now close to a breakout point, making the next price move critical.
He has also identified $287 as the key level QNT needs to reclaim before the next major rally gets underway.
QNT Triangle at a Breakout or Breakdown
QNT is trading inside a triangle pattern on the two-hour chart. The pattern is defined by a downward-sloping resistance line and an upward-sloping support line.
The upper trendline has repeatedly capped QNT’s upside, while the lower trendline continues to provide support at progressively higher levels.
As the two trendlines converge, QNT’s trading range continues to tighten. This setup puts the cryptocurrency directly in position for a sharp move once the triangle breaks.
The chart marks $245.84 as the 0.618 Fibonacci level and $223.84 as the 0.786 level. QNT recently bounced from the lower Fibonacci level, preserving the bullish structure. The next confirmation comes from a break above the descending resistance line.
The analyst has also identified $286.88 as a critical price level. A move above $286.88 followed by sustained trading above it would signal that buyers are regaining control.
On the downside, a break below the rising support line would weaken the bullish structure and expose QNT to lower levels. The previous low around $196 remains the major downside level to watch.
Why $287 Is Still Important for Quant
MWi_EW’s latest update builds on his October 1 analysis, when he said QNT needed to reclaim $287 and turn the level into support.
At the time, Quant had been rejected at $287, preventing the price from extending higher. Despite that rejection, the analyst maintained that the bullish setup remained intact as long as QNT stayed inside the two-hour triangle.
In a September 29 post, he said a break above $287 would trigger the next upward move. He also warned that a move below the two-hour EMA would weaken the setup. A drop below $196 would invalidate the bullish outlook outlined in his analysis.
For now, QNT remains above the key downside level but has yet to reclaim $287. The next major bullish confirmation therefore remains a sustained move above $287.
Analyst Points to $409 and $475 Price
If QNT price breaks above the triangle and reclaims $287, MWi_EW’s chart points to higher levels around $409.18 and $475.01. Reaching them requires QNT to clear several resistance levels along the way.
QNT recently surged from roughly $65 in mid-September to about $373 on September 27, representing a gain of 474% in around two weeks. The subsequent pullback also demonstrated how quickly QNT can reverse after an aggressive rally.
What Happens If QNT Breaks Down?
The triangle has two clear outcomes: an upside breakout or a downside breakdown. A break below the rising support line would weaken the bullish structure and put the $223.84 Fibonacci level into focus.
Continued selling would bring $196 into focus as the critical downside level. A break below $196 would invalidate the bullish setup described by the analyst.
Right now, QNT is inside the triangle, with the price action approaching a key inflection point. The next two to three days are critical for determining whether QNT breaks higher or resumes its decline.
#CryptoNewsCommunity
"Quant (QNT) Price Outlook: Is a $409 Breakout Coming in the Next 2–3 Days?"
Quant (QNT) is approaching a decision point over the next two to three days as a triangle pattern moves toward a breakout or breakdown.
Technical analyst @MWi_EW on X says QNT price has followed his expected path so far, bouncing from the 0.786 Fibonacci retracement level.
In a post on X, the analyst said QNT had reached the 0.786 level and bounced, keeping the bullish outlook intact. However, the triangle is now close to a breakout point, making the next price move critical.
He has also identified $287 as the key level QNT needs to reclaim before the next major rally gets underway.
QNT Triangle at a Breakout or Breakdown
QNT is trading inside a triangle pattern on the two-hour chart. The pattern is defined by a downward-sloping resistance line and an upward-sloping support line.
The upper trendline has repeatedly capped QNT’s upside, while the lower trendline continues to provide support at progressively higher levels.
As the two trendlines converge, QNT’s trading range continues to tighten. This setup puts the cryptocurrency directly in position for a sharp move once the triangle breaks.
The chart marks $245.84 as the 0.618 Fibonacci level and $223.84 as the 0.786 level. QNT recently bounced from the lower Fibonacci level, preserving the bullish structure. The next confirmation comes from a break above the descending resistance line.
The analyst has also identified $286.88 as a critical price level. A move above $286.88 followed by sustained trading above it would signal that buyers are regaining control.
On the downside, a break below the rising support line would weaken the bullish structure and expose QNT to lower levels. The previous low around $196 remains the major downside level to watch.
Why $287 Is Still Important for Quant
MWi_EW’s latest update builds on his October 1 analysis, when he said QNT needed to reclaim $287 and turn the level into support.
At the time, Quant had been rejected at $287, preventing the price from extending higher. Despite that rejection, the analyst maintained that the bullish setup remained intact as long as QNT stayed inside the two-hour triangle.
In a September 29 post, he said a break above $287 would trigger the next upward move. He also warned that a move below the two-hour EMA would weaken the setup. A drop below $196 would invalidate the bullish outlook outlined in his analysis.
For now, QNT remains above the key downside level but has yet to reclaim $287. The next major bullish confirmation therefore remains a sustained move above $287.
Analyst Points to $409 and $475 Price
If QNT price breaks above the triangle and reclaims $287, MWi_EW’s chart points to higher levels around $409.18 and $475.01. Reaching them requires QNT to clear several resistance levels along the way.
QNT recently surged from roughly $65 in mid-September to about $373 on September 27, representing a gain of 474% in around two weeks. The subsequent pullback also demonstrated how quickly QNT can reverse after an aggressive rally.
What Happens If QNT Breaks Down?
The triangle has two clear outcomes: an upside breakout or a downside breakdown. A break below the rising support line would weaken the bullish structure and put the $223.84 Fibonacci level into focus.
Continued selling would bring $196 into focus as the critical downside level. A break below $196 would invalidate the bullish setup described by the analyst.
Right now, QNT is inside the triangle, with the price action approaching a key inflection point. The next two to three days are critical for determining whether QNT breaks higher or resumes its decline.
#CryptoNewsCommunity
Technical analyst @MWi_EW on X says QNT price has followed his expected path so far, bouncing from the 0.786 Fibonacci retracement level.
In a post on X, the analyst said QNT had reached the 0.786 level and bounced, keeping the bullish outlook intact. However, the triangle is now close to a breakout point, making the next price move critical.
He has also identified $287 as the key level QNT needs to reclaim before the next major rally gets underway.
QNT Triangle at a Breakout or Breakdown
QNT is trading inside a triangle pattern on the two-hour chart. The pattern is defined by a downward-sloping resistance line and an upward-sloping support line.
The upper trendline has repeatedly capped QNT’s upside, while the lower trendline continues to provide support at progressively higher levels.
As the two trendlines converge, QNT’s trading range continues to tighten. This setup puts the cryptocurrency directly in position for a sharp move once the triangle breaks.
The chart marks $245.84 as the 0.618 Fibonacci level and $223.84 as the 0.786 level. QNT recently bounced from the lower Fibonacci level, preserving the bullish structure. The next confirmation comes from a break above the descending resistance line.
The analyst has also identified $286.88 as a critical price level. A move above $286.88 followed by sustained trading above it would signal that buyers are regaining control.
On the downside, a break below the rising support line would weaken the bullish structure and expose QNT to lower levels. The previous low around $196 remains the major downside level to watch.
Why $287 Is Still Important for Quant
MWi_EW’s latest update builds on his October 1 analysis, when he said QNT needed to reclaim $287 and turn the level into support.
At the time, Quant had been rejected at $287, preventing the price from extending higher. Despite that rejection, the analyst maintained that the bullish setup remained intact as long as QNT stayed inside the two-hour triangle.
In a September 29 post, he said a break above $287 would trigger the next upward move. He also warned that a move below the two-hour EMA would weaken the setup. A drop below $196 would invalidate the bullish outlook outlined in his analysis.
For now, QNT remains above the key downside level but has yet to reclaim $287. The next major bullish confirmation therefore remains a sustained move above $287.
Analyst Points to $409 and $475 Price
If QNT price breaks above the triangle and reclaims $287, MWi_EW’s chart points to higher levels around $409.18 and $475.01. Reaching them requires QNT to clear several resistance levels along the way.
QNT recently surged from roughly $65 in mid-September to about $373 on September 27, representing a gain of 474% in around two weeks. The subsequent pullback also demonstrated how quickly QNT can reverse after an aggressive rally.
What Happens If QNT Breaks Down?
The triangle has two clear outcomes: an upside breakout or a downside breakdown. A break below the rising support line would weaken the bullish structure and put the $223.84 Fibonacci level into focus.
Continued selling would bring $196 into focus as the critical downside level. A break below $196 would invalidate the bullish setup described by the analyst.
Right now, QNT is inside the triangle, with the price action approaching a key inflection point. The next two to three days are critical for determining whether QNT breaks higher or resumes its decline.
#CryptoNewsCommunity
1
1.4k
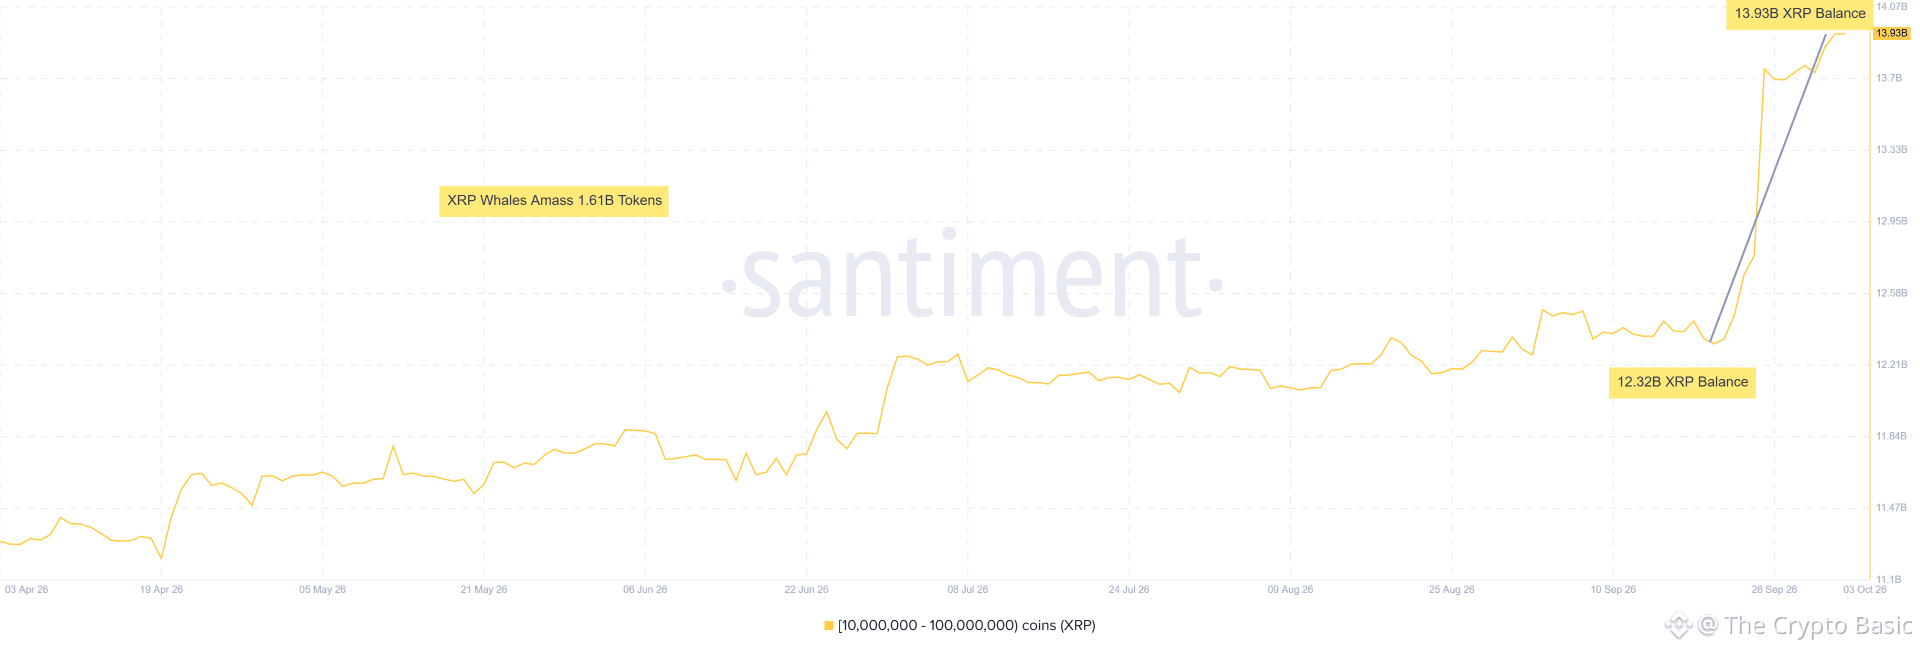
XRP whales have procured over 1.6 billion tokens over the past two weeks, as the market shows early signs of a recovery.
After dropping to a low of $1.25 on Sept. 16, XRP embarked on a rebound campaign that built on the momentum witnessed between Aug. 19 and 23. The rebound continued until the $1.6569 local top on Sept. 23, before a pullback ensued.
XRP Whales Add 1.6B+ XRP
Now, fresh data shows that during the recovery effort, large XRP whales went on a shopping spree, accumulating more tokens. Specifically, whales holding between 10 million and 100 million XRP have added more than 1.6 billion tokens to their cumulative balance in the past two weeks.
Data sourced by market intelligence platform Santiment confirms this. Notably, as of Sept. 20, amid the price recovery push, these XRP whales held a cumulative balance of 12.32 billion tokens worth an excess of $17.3 billion at the time. Before then, their figure had ranged between 12.1 billion and 12.5 billion XRP.
#Crypto
XRP whales have procured over 1.6 billion tokens over the past two weeks, as the market shows early signs of a recovery.
After dropping to a low of $1.25 on Sept. 16, XRP embarked on a rebound campaign that built on the momentum witnessed between Aug. 19 and 23. The rebound continued until the $1.6569 local top on Sept. 23, before a pullback ensued.
XRP Whales Add 1.6B+ XRP
Now, fresh data shows that during the recovery effort, large XRP whales went on a shopping spree, accumulating more tokens. Specifically, whales holding between 10 million and 100 million XRP have added more than 1.6 billion tokens to their cumulative balance in the past two weeks.
Data sourced by market intelligence platform Santiment confirms this. Notably, as of Sept. 20, amid the price recovery push, these XRP whales held a cumulative balance of 12.32 billion tokens worth an excess of $17.3 billion at the time. Before then, their figure had ranged between 12.1 billion and 12.5 billion XRP.
#Crypto
After dropping to a low of $1.25 on Sept. 16, XRP embarked on a rebound campaign that built on the momentum witnessed between Aug. 19 and 23. The rebound continued until the $1.6569 local top on Sept. 23, before a pullback ensued.
XRP Whales Add 1.6B+ XRP
Now, fresh data shows that during the recovery effort, large XRP whales went on a shopping spree, accumulating more tokens. Specifically, whales holding between 10 million and 100 million XRP have added more than 1.6 billion tokens to their cumulative balance in the past two weeks.
Data sourced by market intelligence platform Santiment confirms this. Notably, as of Sept. 20, amid the price recovery push, these XRP whales held a cumulative balance of 12.32 billion tokens worth an excess of $17.3 billion at the time. Before then, their figure had ranged between 12.1 billion and 12.5 billion XRP.
#Crypto
1
359
Article
"Citi Raises Strategy Price Target to $240 as Higher Bitcoin Forecast Lifts MSTR Outlook"Citi raises its Strategy price target to $240 from $136 as a higher Bitcoin forecast and expected mNAV expansion strengthen its MSTR outlook.
Citi has raised its price target for Strategy (MSTR) to $240 from $136 while keeping a Buy rating on the stock. The revision follows the bank’s higher Bitcoin forecast, with Citi now expecting BTC to reach about $113,400 over the next 12 months.
The new MSTR target represents a 76.5% increase from Citi’s previous $136 estimate. With Strategy closing around $160.50 on Oct. 1, a move to $240 would require roughly another 49.5% gain.
Citi’s valuation framework splits that potential upside between a higher Bitcoin price and an expansion in the premium investors are willing to pay for Strategy relative to its underlying BTC holdings.
Bitcoin Appreciation Accounts for Most of Citi’s MSTR Upside
Citi sees about 34% of MSTR’s potential upside coming from Bitcoin appreciation.
That assumption follows the bank’s decision to raise its 12-month Bitcoin target by roughly 39%, from $82,000 to approximately $113,400.
Strategy’s stock has historically moved closely with Bitcoin because BTC represents the core asset on its balance sheet. The company also uses equity, preferred securities, and debt to fund its treasury strategy, which can amplify changes in Bitcoin value at the common-stock level.
This means Citi’s higher BTC forecast directly increases the value it assigns to MSTR.
Citi Also Expects Strategy’s mNAV Premium to Expand
Another 16% of the expected upside comes from Citi’s assumption that Strategy’s mNAV multiple will increase.
mNAV compares Strategy’s market valuation with the net value of its Bitcoin holdings and other balance-sheet items. A figure above 1.0 means investors are valuing MSTR at a premium to the underlying net assets.
Citi’s updated model assumes an mNAV of about 1.24x.
The bank also increased what it calls its Bitcoin Yield Multiple to 4.0x from 2.5x, giving Strategy a higher valuation for its ability to increase Bitcoin exposure per share through capital-market activity.
The two components broadly explain Citi’s new MSTR target. A roughly 34% benefit from its Bitcoin assumption combined with about 16% from mNAV expansion produces close to the 50% upside needed to move MSTR from around $160.50 to $240.
Strategy Remains Highly Sensitive to Bitcoin
Citi’s target therefore depends heavily on Bitcoin reaching the bank’s higher forecast and MSTR maintaining a premium to its underlying BTC value.
If Bitcoin underperforms the $113,400 assumption or Strategy’s mNAV contracts instead of expanding, the valuation model would change. Conversely, stronger Bitcoin performance or a larger MSTR premium could alter the upside case.
For now, Citi’s latest update raises both sides of the equation: a higher Bitcoin forecast and a higher valuation multiple for Strategy, resulting in the jump from a $136 MSTR target to $240.
#CryptoNewsFlash
"Citi Raises Strategy Price Target to $240 as Higher Bitcoin Forecast Lifts MSTR Outlook"
Citi raises its Strategy price target to $240 from $136 as a higher Bitcoin forecast and expected mNAV expansion strengthen its MSTR outlook.
Citi has raised its price target for Strategy (MSTR) to $240 from $136 while keeping a Buy rating on the stock. The revision follows the bank’s higher Bitcoin forecast, with Citi now expecting BTC to reach about $113,400 over the next 12 months.
The new MSTR target represents a 76.5% increase from Citi’s previous $136 estimate. With Strategy closing around $160.50 on Oct. 1, a move to $240 would require roughly another 49.5% gain.
Citi’s valuation framework splits that potential upside between a higher Bitcoin price and an expansion in the premium investors are willing to pay for Strategy relative to its underlying BTC holdings.
Bitcoin Appreciation Accounts for Most of Citi’s MSTR Upside
Citi sees about 34% of MSTR’s potential upside coming from Bitcoin appreciation.
That assumption follows the bank’s decision to raise its 12-month Bitcoin target by roughly 39%, from $82,000 to approximately $113,400.
Strategy’s stock has historically moved closely with Bitcoin because BTC represents the core asset on its balance sheet. The company also uses equity, preferred securities, and debt to fund its treasury strategy, which can amplify changes in Bitcoin value at the common-stock level.
This means Citi’s higher BTC forecast directly increases the value it assigns to MSTR.
Citi Also Expects Strategy’s mNAV Premium to Expand
Another 16% of the expected upside comes from Citi’s assumption that Strategy’s mNAV multiple will increase.
mNAV compares Strategy’s market valuation with the net value of its Bitcoin holdings and other balance-sheet items. A figure above 1.0 means investors are valuing MSTR at a premium to the underlying net assets.
Citi’s updated model assumes an mNAV of about 1.24x.
The bank also increased what it calls its Bitcoin Yield Multiple to 4.0x from 2.5x, giving Strategy a higher valuation for its ability to increase Bitcoin exposure per share through capital-market activity.
The two components broadly explain Citi’s new MSTR target. A roughly 34% benefit from its Bitcoin assumption combined with about 16% from mNAV expansion produces close to the 50% upside needed to move MSTR from around $160.50 to $240.
Strategy Remains Highly Sensitive to Bitcoin
Citi’s target therefore depends heavily on Bitcoin reaching the bank’s higher forecast and MSTR maintaining a premium to its underlying BTC value.
If Bitcoin underperforms the $113,400 assumption or Strategy’s mNAV contracts instead of expanding, the valuation model would change. Conversely, stronger Bitcoin performance or a larger MSTR premium could alter the upside case.
For now, Citi’s latest update raises both sides of the equation: a higher Bitcoin forecast and a higher valuation multiple for Strategy, resulting in the jump from a $136 MSTR target to $240.
#CryptoNewsFlash
Citi has raised its price target for Strategy (MSTR) to $240 from $136 while keeping a Buy rating on the stock. The revision follows the bank’s higher Bitcoin forecast, with Citi now expecting BTC to reach about $113,400 over the next 12 months.
The new MSTR target represents a 76.5% increase from Citi’s previous $136 estimate. With Strategy closing around $160.50 on Oct. 1, a move to $240 would require roughly another 49.5% gain.
Citi’s valuation framework splits that potential upside between a higher Bitcoin price and an expansion in the premium investors are willing to pay for Strategy relative to its underlying BTC holdings.
Bitcoin Appreciation Accounts for Most of Citi’s MSTR Upside
Citi sees about 34% of MSTR’s potential upside coming from Bitcoin appreciation.
That assumption follows the bank’s decision to raise its 12-month Bitcoin target by roughly 39%, from $82,000 to approximately $113,400.
Strategy’s stock has historically moved closely with Bitcoin because BTC represents the core asset on its balance sheet. The company also uses equity, preferred securities, and debt to fund its treasury strategy, which can amplify changes in Bitcoin value at the common-stock level.
This means Citi’s higher BTC forecast directly increases the value it assigns to MSTR.
Citi Also Expects Strategy’s mNAV Premium to Expand
Another 16% of the expected upside comes from Citi’s assumption that Strategy’s mNAV multiple will increase.
mNAV compares Strategy’s market valuation with the net value of its Bitcoin holdings and other balance-sheet items. A figure above 1.0 means investors are valuing MSTR at a premium to the underlying net assets.
Citi’s updated model assumes an mNAV of about 1.24x.
The bank also increased what it calls its Bitcoin Yield Multiple to 4.0x from 2.5x, giving Strategy a higher valuation for its ability to increase Bitcoin exposure per share through capital-market activity.
The two components broadly explain Citi’s new MSTR target. A roughly 34% benefit from its Bitcoin assumption combined with about 16% from mNAV expansion produces close to the 50% upside needed to move MSTR from around $160.50 to $240.
Strategy Remains Highly Sensitive to Bitcoin
Citi’s target therefore depends heavily on Bitcoin reaching the bank’s higher forecast and MSTR maintaining a premium to its underlying BTC value.
If Bitcoin underperforms the $113,400 assumption or Strategy’s mNAV contracts instead of expanding, the valuation model would change. Conversely, stronger Bitcoin performance or a larger MSTR premium could alter the upside case.
For now, Citi’s latest update raises both sides of the equation: a higher Bitcoin forecast and a higher valuation multiple for Strategy, resulting in the jump from a $136 MSTR target to $240.
#CryptoNewsFlash
142

Article
"AppLovin Stock Falls Below 52-Week Low as TRO Bid Against Unity Denied"AppLovin Corp. (NASDAQ: APP) shares fell 4.54% to $268.54 in Friday pre-market trading, putting the stock below Thursday’s newly established 52-week low of $275.13.
The decline came as two developments added to the backdrop. San Francisco Superior Court denied AppLovin’s request for a temporary restraining order against Unity on Thursday, according to eMarketer. Wells Fargo also cast doubt on a recent surge in AppLovin Pixel installations.
APP closed Thursday at $281.31, down 3.14%, marking its eighth consecutive lower regular-market close. The streak began Sept. 22, after the stock closed at $330.17 on Sept. 21, leaving shares down about 14.8% over the eight-session run.
AppLovin Sought Immediate Restrictions on Unity’s Ad Quality Data Collection
AppLovin filed a JAMS arbitration demand on Sept. 27 asserting claims including breach of contract, interference, trade-secret misappropriation and unfair competition, then sought temporary court relief through its Sept. 29 TRO application.
AppLovin alleges Unity’s Ad Quality software collected ad creative, user and device information, impression revenue and engagement data tied to ads it served, and that Unity used AppLovin-related data in models competing in mobile advertising auctions.
AppLovin asked the court to temporarily stop Unity from collecting or using the categories of information its application identifies as protected data through Ad Quality. The proposed order set a five-business-day deadline to halt the disputed collection and 30 days to modify the SDK.
Unity disputes AppLovin’s allegations, saying the data is collected with publishers’ express permission and that, for MAX publishers, Ad Quality does nothing unless they affirmatively enable it.
The Thursday denial concerns AppLovin’s request for provisional court relief, not a final determination of those allegations. The underlying arbitration claims remain unresolved.
The court decision also followed separate scrutiny of AppLovin’s expansion into web-based e-commerce advertising. AppLovin has disclosed that it began broadening its customer base to include web-based e-commerce advertisers in 2024, while Wells Fargo has been tracking Pixel installations as a visible indicator of that expansion.
Wells Fargo Questioned Whether the Pixel Surge Reflected Real Acceleration
Wells Fargo said roughly 85% of sites adding the Pixel over the previous two weeks showed no measurable traffic. Its traffic-weighted analysis did not show a meaningful inflection in Pixel adoption, while the firm said nearly all recent additions were Asia-Pacific Shopify storefronts.
Against that backdrop, Wells said the apparent Pixel inflection “appears to be a false start.” The firm maintained an Equal Weight rating and a $325 price target.
Meanwhile, AppLovin Tokenized Stock (APPon) was trading around $266.87, down roughly 8.47% over the previous 24 hours, according to CoinMarketCap. The tokenized market price is a related market observation and does not establish a causal relationship with the Nasdaq-listed shares.
#CryptoNewss
"AppLovin Stock Falls Below 52-Week Low as TRO Bid Against Unity Denied"
AppLovin Corp. (NASDAQ: APP) shares fell 4.54% to $268.54 in Friday pre-market trading, putting the stock below Thursday’s newly established 52-week low of $275.13.
The decline came as two developments added to the backdrop. San Francisco Superior Court denied AppLovin’s request for a temporary restraining order against Unity on Thursday, according to eMarketer. Wells Fargo also cast doubt on a recent surge in AppLovin Pixel installations.
APP closed Thursday at $281.31, down 3.14%, marking its eighth consecutive lower regular-market close. The streak began Sept. 22, after the stock closed at $330.17 on Sept. 21, leaving shares down about 14.8% over the eight-session run.
AppLovin Sought Immediate Restrictions on Unity’s Ad Quality Data Collection
AppLovin filed a JAMS arbitration demand on Sept. 27 asserting claims including breach of contract, interference, trade-secret misappropriation and unfair competition, then sought temporary court relief through its Sept. 29 TRO application.
AppLovin alleges Unity’s Ad Quality software collected ad creative, user and device information, impression revenue and engagement data tied to ads it served, and that Unity used AppLovin-related data in models competing in mobile advertising auctions.
AppLovin asked the court to temporarily stop Unity from collecting or using the categories of information its application identifies as protected data through Ad Quality. The proposed order set a five-business-day deadline to halt the disputed collection and 30 days to modify the SDK.
Unity disputes AppLovin’s allegations, saying the data is collected with publishers’ express permission and that, for MAX publishers, Ad Quality does nothing unless they affirmatively enable it.
The Thursday denial concerns AppLovin’s request for provisional court relief, not a final determination of those allegations. The underlying arbitration claims remain unresolved.
The court decision also followed separate scrutiny of AppLovin’s expansion into web-based e-commerce advertising. AppLovin has disclosed that it began broadening its customer base to include web-based e-commerce advertisers in 2024, while Wells Fargo has been tracking Pixel installations as a visible indicator of that expansion.
Wells Fargo Questioned Whether the Pixel Surge Reflected Real Acceleration
Wells Fargo said roughly 85% of sites adding the Pixel over the previous two weeks showed no measurable traffic. Its traffic-weighted analysis did not show a meaningful inflection in Pixel adoption, while the firm said nearly all recent additions were Asia-Pacific Shopify storefronts.
Against that backdrop, Wells said the apparent Pixel inflection “appears to be a false start.” The firm maintained an Equal Weight rating and a $325 price target.
Meanwhile, AppLovin Tokenized Stock (APPon) was trading around $266.87, down roughly 8.47% over the previous 24 hours, according to CoinMarketCap. The tokenized market price is a related market observation and does not establish a causal relationship with the Nasdaq-listed shares.
#CryptoNewss
The decline came as two developments added to the backdrop. San Francisco Superior Court denied AppLovin’s request for a temporary restraining order against Unity on Thursday, according to eMarketer. Wells Fargo also cast doubt on a recent surge in AppLovin Pixel installations.
APP closed Thursday at $281.31, down 3.14%, marking its eighth consecutive lower regular-market close. The streak began Sept. 22, after the stock closed at $330.17 on Sept. 21, leaving shares down about 14.8% over the eight-session run.
AppLovin Sought Immediate Restrictions on Unity’s Ad Quality Data Collection
AppLovin filed a JAMS arbitration demand on Sept. 27 asserting claims including breach of contract, interference, trade-secret misappropriation and unfair competition, then sought temporary court relief through its Sept. 29 TRO application.
AppLovin alleges Unity’s Ad Quality software collected ad creative, user and device information, impression revenue and engagement data tied to ads it served, and that Unity used AppLovin-related data in models competing in mobile advertising auctions.
AppLovin asked the court to temporarily stop Unity from collecting or using the categories of information its application identifies as protected data through Ad Quality. The proposed order set a five-business-day deadline to halt the disputed collection and 30 days to modify the SDK.
Unity disputes AppLovin’s allegations, saying the data is collected with publishers’ express permission and that, for MAX publishers, Ad Quality does nothing unless they affirmatively enable it.
The Thursday denial concerns AppLovin’s request for provisional court relief, not a final determination of those allegations. The underlying arbitration claims remain unresolved.
The court decision also followed separate scrutiny of AppLovin’s expansion into web-based e-commerce advertising. AppLovin has disclosed that it began broadening its customer base to include web-based e-commerce advertisers in 2024, while Wells Fargo has been tracking Pixel installations as a visible indicator of that expansion.
Wells Fargo Questioned Whether the Pixel Surge Reflected Real Acceleration
Wells Fargo said roughly 85% of sites adding the Pixel over the previous two weeks showed no measurable traffic. Its traffic-weighted analysis did not show a meaningful inflection in Pixel adoption, while the firm said nearly all recent additions were Asia-Pacific Shopify storefronts.
Against that backdrop, Wells said the apparent Pixel inflection “appears to be a false start.” The firm maintained an Equal Weight rating and a $325 price target.
Meanwhile, AppLovin Tokenized Stock (APPon) was trading around $266.87, down roughly 8.47% over the previous 24 hours, according to CoinMarketCap. The tokenized market price is a related market observation and does not establish a causal relationship with the Nasdaq-listed shares.
#CryptoNewss
133
Partly True

Article
"Former BlackRock VP Reveals What Fueled Quant (QNT) 472% Breakout"Former BlackRock vice president and Milk Road podcast co-host John Gillen has identified several factors he believes contributed to Quant’s (QNT) dramatic price breakout.
For context, QNT staged a remarkable rally last month, climbing from around $65 in mid-September to $372 on September 27. This represented a 472.3% increase and sparked significant discussion across the crypto market.
Against this backdrop, Gillen attributed the rally to a combination of institutional interest, scarce tokenomics, and increasing recognition of Quant’s role in financial infrastructure.
In particular, Gillen highlighted Quant’s involvement in The Clearing House’s On-Chain Money Initiative. The initiative aims to support the clearing and settlement of tokenized deposits while connecting them with existing payment networks, including RTP and CHIPS.
According to Gillen, Quant’s involvement in the initiative provides important institutional validation for its technology.
QNT’s Limited Supply Adds to Demand
Gillen also identified Quant’s tokenomics as another factor behind QNT’s strong market response.
QNT has a maximum supply of 14.9 million tokens, with more than 12 million already in circulation. As a result, the asset has a relatively limited supply compared to many crypto projects that maintain large allocations for venture capital investors, teams, or early holders.
Gillen argued that QNT therefore faces less potential selling pressure from locked tokens and scheduled token releases than some other projects.
Consequently, he linked the token’s scarcity to its price reaction as interest in Quant’s technology and institutional adoption increased.
Quant’s Overledger Technology Strengthens the Case
Furthermore, Gillen highlighted Quant’s Overledger technology as another important part of the narrative.
He described Overledger as an advanced infrastructure solution that has undergone extensive institutional evaluation. Gillen also pointed to Quant founder Gilbert Verdian’s background in cybersecurity and technology, including his previous role as head of cybersecurity for the UK Treasury.
According to Gillen, Quant’s patented technology, institutional relationships, and leadership experience have helped distinguish the project from other speculative digital assets.
QNT Surges 472% Before Pullback
These developments coincided with QNT’s dramatic price increase. The token traded around $65 for much of the previous month before climbing to $372 on September 27, 2026.
From the $65 level, the move represented a 472.3% increase. However, QNT has since retraced significantly and has fallen below the $300 mark. At press time, QNT trades around $234, down 20.5% over 24 hours while remaining up 134% over the past week. Its market cap stands at $2.81 billion, placing it in the 36th position globally, according to CoinMarketCap rankings.
Meanwhile, trading activity has also weakened following the rally. QNT’s 24-hour trading volume fell 43% to $468.73 million at the time of writing.
#CryptoNews🚀🔥V
"Former BlackRock VP Reveals What Fueled Quant (QNT) 472% Breakout"
Former BlackRock vice president and Milk Road podcast co-host John Gillen has identified several factors he believes contributed to Quant’s (QNT) dramatic price breakout.
For context, QNT staged a remarkable rally last month, climbing from around $65 in mid-September to $372 on September 27. This represented a 472.3% increase and sparked significant discussion across the crypto market.
Against this backdrop, Gillen attributed the rally to a combination of institutional interest, scarce tokenomics, and increasing recognition of Quant’s role in financial infrastructure.
In particular, Gillen highlighted Quant’s involvement in The Clearing House’s On-Chain Money Initiative. The initiative aims to support the clearing and settlement of tokenized deposits while connecting them with existing payment networks, including RTP and CHIPS.
According to Gillen, Quant’s involvement in the initiative provides important institutional validation for its technology.
QNT’s Limited Supply Adds to Demand
Gillen also identified Quant’s tokenomics as another factor behind QNT’s strong market response.
QNT has a maximum supply of 14.9 million tokens, with more than 12 million already in circulation. As a result, the asset has a relatively limited supply compared to many crypto projects that maintain large allocations for venture capital investors, teams, or early holders.
Gillen argued that QNT therefore faces less potential selling pressure from locked tokens and scheduled token releases than some other projects.
Consequently, he linked the token’s scarcity to its price reaction as interest in Quant’s technology and institutional adoption increased.
Quant’s Overledger Technology Strengthens the Case
Furthermore, Gillen highlighted Quant’s Overledger technology as another important part of the narrative.
He described Overledger as an advanced infrastructure solution that has undergone extensive institutional evaluation. Gillen also pointed to Quant founder Gilbert Verdian’s background in cybersecurity and technology, including his previous role as head of cybersecurity for the UK Treasury.
According to Gillen, Quant’s patented technology, institutional relationships, and leadership experience have helped distinguish the project from other speculative digital assets.
QNT Surges 472% Before Pullback
These developments coincided with QNT’s dramatic price increase. The token traded around $65 for much of the previous month before climbing to $372 on September 27, 2026.
From the $65 level, the move represented a 472.3% increase. However, QNT has since retraced significantly and has fallen below the $300 mark. At press time, QNT trades around $234, down 20.5% over 24 hours while remaining up 134% over the past week. Its market cap stands at $2.81 billion, placing it in the 36th position globally, according to CoinMarketCap rankings.
Meanwhile, trading activity has also weakened following the rally. QNT’s 24-hour trading volume fell 43% to $468.73 million at the time of writing.
#CryptoNews🚀🔥V
For context, QNT staged a remarkable rally last month, climbing from around $65 in mid-September to $372 on September 27. This represented a 472.3% increase and sparked significant discussion across the crypto market.
Against this backdrop, Gillen attributed the rally to a combination of institutional interest, scarce tokenomics, and increasing recognition of Quant’s role in financial infrastructure.
In particular, Gillen highlighted Quant’s involvement in The Clearing House’s On-Chain Money Initiative. The initiative aims to support the clearing and settlement of tokenized deposits while connecting them with existing payment networks, including RTP and CHIPS.
According to Gillen, Quant’s involvement in the initiative provides important institutional validation for its technology.
QNT’s Limited Supply Adds to Demand
Gillen also identified Quant’s tokenomics as another factor behind QNT’s strong market response.
QNT has a maximum supply of 14.9 million tokens, with more than 12 million already in circulation. As a result, the asset has a relatively limited supply compared to many crypto projects that maintain large allocations for venture capital investors, teams, or early holders.
Gillen argued that QNT therefore faces less potential selling pressure from locked tokens and scheduled token releases than some other projects.
Consequently, he linked the token’s scarcity to its price reaction as interest in Quant’s technology and institutional adoption increased.
Quant’s Overledger Technology Strengthens the Case
Furthermore, Gillen highlighted Quant’s Overledger technology as another important part of the narrative.
He described Overledger as an advanced infrastructure solution that has undergone extensive institutional evaluation. Gillen also pointed to Quant founder Gilbert Verdian’s background in cybersecurity and technology, including his previous role as head of cybersecurity for the UK Treasury.
According to Gillen, Quant’s patented technology, institutional relationships, and leadership experience have helped distinguish the project from other speculative digital assets.
QNT Surges 472% Before Pullback
These developments coincided with QNT’s dramatic price increase. The token traded around $65 for much of the previous month before climbing to $372 on September 27, 2026.
From the $65 level, the move represented a 472.3% increase. However, QNT has since retraced significantly and has fallen below the $300 mark. At press time, QNT trades around $234, down 20.5% over 24 hours while remaining up 134% over the past week. Its market cap stands at $2.81 billion, placing it in the 36th position globally, according to CoinMarketCap rankings.
Meanwhile, trading activity has also weakened following the rally. QNT’s 24-hour trading volume fell 43% to $468.73 million at the time of writing.
#CryptoNews🚀🔥V
1.1k
Verified

Article
"Western Digital Stock Falls as Toshiba Targets 30% HDD Share With $380M AI Capacity Push"Western Digital Corp. (NASDAQ: WDC) stock fell about 13% to $402.11 in pre-market trading Friday, with a Nikkei report detailing Toshiba’s planned expansion of HDD capacity for AI data centers.
Western Digital closed Thursday’s regular session at $462.56, up 1.78%. Meanwhile, Western Digital Tokenized bStocks (WDCB) was trading at $402.18, down 9.85% over the past 24 hours, according to CoinMarketCap.
Toshiba’s medium-term objective is to raise its HDD market share by storage capacity to 30% from just over 10%, Nikkei reported. The publication also said Toshiba plans to invest about 60 billion yen, or roughly $380 million, in its Philippine HDD operations. Nikkei said Toshiba’s last major investment in HDD production was about five years ago.
Later Friday, Toshiba said its Philippine unit had recently begun manufacturing nearline HDDs on an expanded Laguna Technopark production line and made its first shipment from the line. The company said it aims to nearly double annual production capacity by FY2027 compared with FY2025 on a storage-capacity basis.
Toshiba’s Expansion Includes Higher-Capacity Drives
The expansion extends beyond manufacturing volume. Toshiba aims to begin mass production of 65-terabyte-class HDDs in 2030, with 100-terabyte-class drives planned later. The Philippine expansion will also support products with up to 40% more storage capacity per drive.
That capacity roadmap follows Toshiba’s recent push into larger nearline drives for hyperscale and cloud customers. In March, the company began sampling its M12 Series nearline HDDs with capacities of 30 TB to 34 TB. It also planned to sample conventional magnetic recording models of up to 28 TB during the third quarter of 2026. Toshiba cited expanding cloud services and data-intensive AI workloads among the drivers of storage growth.
For Western Digital, the competitive relevance is direct. The company identifies Toshiba and Seagate as its HDD competitors. It also identifies cloud as its largest and fastest-growing end market, supplying high-capacity enterprise drives to cloud and data-center customers.
Western Digital generated $11.49 billion of its $12.92 billion fiscal 2026 revenue from its Cloud business, equal to about 89% of total revenue.
Western Digital’s Cloud Exposure and Customer Concentration
That cloud exposure is concentrated among a relatively small customer base. Western Digital’s top 10 customers accounted for 73% of revenue, while three customers individually represented at least 10%.
At the same time, much of Western Digital’s nearer-term business is covered by existing long-term agreements. CFO Kris Sennesael said on Sept. 9 that the vast majority of calendar/fiscal 2027 was under LTAs, with some of 2028 and a smaller portion of 2029 also covered. He said the agreements commit base volumes while preserving some upside volume and pricing flexibility.
Toshiba’s expansion comes against a backdrop of strong cloud-storage demand for Western Digital. Fiscal fourth-quarter revenue rose 44% year over year to $3.75 billion, while GAAP gross margin expanded to 54.1% from 41.0% a year earlier.
For the first fiscal quarter of 2027, Western Digital guided revenue of $4.1 billion, plus or minus $100 million, and a non-GAAP gross margin of 55% to 56%.
#CryptoNewsFlash
"Western Digital Stock Falls as Toshiba Targets 30% HDD Share With $380M AI Capacity Push"
Western Digital Corp. (NASDAQ: WDC) stock fell about 13% to $402.11 in pre-market trading Friday, with a Nikkei report detailing Toshiba’s planned expansion of HDD capacity for AI data centers.
Western Digital closed Thursday’s regular session at $462.56, up 1.78%. Meanwhile, Western Digital Tokenized bStocks (WDCB) was trading at $402.18, down 9.85% over the past 24 hours, according to CoinMarketCap.
Toshiba’s medium-term objective is to raise its HDD market share by storage capacity to 30% from just over 10%, Nikkei reported. The publication also said Toshiba plans to invest about 60 billion yen, or roughly $380 million, in its Philippine HDD operations. Nikkei said Toshiba’s last major investment in HDD production was about five years ago.
Later Friday, Toshiba said its Philippine unit had recently begun manufacturing nearline HDDs on an expanded Laguna Technopark production line and made its first shipment from the line. The company said it aims to nearly double annual production capacity by FY2027 compared with FY2025 on a storage-capacity basis.
Toshiba’s Expansion Includes Higher-Capacity Drives
The expansion extends beyond manufacturing volume. Toshiba aims to begin mass production of 65-terabyte-class HDDs in 2030, with 100-terabyte-class drives planned later. The Philippine expansion will also support products with up to 40% more storage capacity per drive.
That capacity roadmap follows Toshiba’s recent push into larger nearline drives for hyperscale and cloud customers. In March, the company began sampling its M12 Series nearline HDDs with capacities of 30 TB to 34 TB. It also planned to sample conventional magnetic recording models of up to 28 TB during the third quarter of 2026. Toshiba cited expanding cloud services and data-intensive AI workloads among the drivers of storage growth.
For Western Digital, the competitive relevance is direct. The company identifies Toshiba and Seagate as its HDD competitors. It also identifies cloud as its largest and fastest-growing end market, supplying high-capacity enterprise drives to cloud and data-center customers.
Western Digital generated $11.49 billion of its $12.92 billion fiscal 2026 revenue from its Cloud business, equal to about 89% of total revenue.
Western Digital’s Cloud Exposure and Customer Concentration
That cloud exposure is concentrated among a relatively small customer base. Western Digital’s top 10 customers accounted for 73% of revenue, while three customers individually represented at least 10%.
At the same time, much of Western Digital’s nearer-term business is covered by existing long-term agreements. CFO Kris Sennesael said on Sept. 9 that the vast majority of calendar/fiscal 2027 was under LTAs, with some of 2028 and a smaller portion of 2029 also covered. He said the agreements commit base volumes while preserving some upside volume and pricing flexibility.
Toshiba’s expansion comes against a backdrop of strong cloud-storage demand for Western Digital. Fiscal fourth-quarter revenue rose 44% year over year to $3.75 billion, while GAAP gross margin expanded to 54.1% from 41.0% a year earlier.
For the first fiscal quarter of 2027, Western Digital guided revenue of $4.1 billion, plus or minus $100 million, and a non-GAAP gross margin of 55% to 56%.
#CryptoNewsFlash
Western Digital closed Thursday’s regular session at $462.56, up 1.78%. Meanwhile, Western Digital Tokenized bStocks (WDCB) was trading at $402.18, down 9.85% over the past 24 hours, according to CoinMarketCap.
Toshiba’s medium-term objective is to raise its HDD market share by storage capacity to 30% from just over 10%, Nikkei reported. The publication also said Toshiba plans to invest about 60 billion yen, or roughly $380 million, in its Philippine HDD operations. Nikkei said Toshiba’s last major investment in HDD production was about five years ago.
Later Friday, Toshiba said its Philippine unit had recently begun manufacturing nearline HDDs on an expanded Laguna Technopark production line and made its first shipment from the line. The company said it aims to nearly double annual production capacity by FY2027 compared with FY2025 on a storage-capacity basis.
Toshiba’s Expansion Includes Higher-Capacity Drives
The expansion extends beyond manufacturing volume. Toshiba aims to begin mass production of 65-terabyte-class HDDs in 2030, with 100-terabyte-class drives planned later. The Philippine expansion will also support products with up to 40% more storage capacity per drive.
That capacity roadmap follows Toshiba’s recent push into larger nearline drives for hyperscale and cloud customers. In March, the company began sampling its M12 Series nearline HDDs with capacities of 30 TB to 34 TB. It also planned to sample conventional magnetic recording models of up to 28 TB during the third quarter of 2026. Toshiba cited expanding cloud services and data-intensive AI workloads among the drivers of storage growth.
For Western Digital, the competitive relevance is direct. The company identifies Toshiba and Seagate as its HDD competitors. It also identifies cloud as its largest and fastest-growing end market, supplying high-capacity enterprise drives to cloud and data-center customers.
Western Digital generated $11.49 billion of its $12.92 billion fiscal 2026 revenue from its Cloud business, equal to about 89% of total revenue.
Western Digital’s Cloud Exposure and Customer Concentration
That cloud exposure is concentrated among a relatively small customer base. Western Digital’s top 10 customers accounted for 73% of revenue, while three customers individually represented at least 10%.
At the same time, much of Western Digital’s nearer-term business is covered by existing long-term agreements. CFO Kris Sennesael said on Sept. 9 that the vast majority of calendar/fiscal 2027 was under LTAs, with some of 2028 and a smaller portion of 2029 also covered. He said the agreements commit base volumes while preserving some upside volume and pricing flexibility.
Toshiba’s expansion comes against a backdrop of strong cloud-storage demand for Western Digital. Fiscal fourth-quarter revenue rose 44% year over year to $3.75 billion, while GAAP gross margin expanded to 54.1% from 41.0% a year earlier.
For the first fiscal quarter of 2027, Western Digital guided revenue of $4.1 billion, plus or minus $100 million, and a non-GAAP gross margin of 55% to 56%.
#CryptoNewsFlash
953
#Cardano Network Activity Surges as Daily Transactions Rise 43% to 7-Day High.
According to Chainspect, Cardano handled 33,467 transactions on September 30, 2026, a seven-day daily high.
Transaction activity grew from 23,400 to 33,467 per day, with about 190,000 transactions processed between September 24 and 30, 2026.
#CryptoNewsCommunity
#Cardano Network Activity Surges as Daily Transactions Rise 43% to 7-Day High.
According to Chainspect, Cardano handled 33,467 transactions on September 30, 2026, a seven-day daily high.
Transaction activity grew from 23,400 to 33,467 per day, with about 190,000 transactions processed between September 24 and 30, 2026.
#CryptoNewsCommunity
According to Chainspect, Cardano handled 33,467 transactions on September 30, 2026, a seven-day daily high.
Transaction activity grew from 23,400 to 33,467 per day, with about 190,000 transactions processed between September 24 and 30, 2026.
#CryptoNewsCommunity
307
Citi boosts its Strategy ($MSTR) price target from $136 to $240, backed by a higher #Bitcoin forecast and expected mNAV expansion.
About 34% of MSTR's potential upside, according to Citi, comes from Bitcoin appreciation. This follows the bank's move to lift its 12-month Bitcoin target roughly 39%, from $82,000 to about $113,400.
Citi expects another 16% of the upside from a higher mNAV. That ratio compares Strategy's market value with its net assets, and above 1.0 means MSTR trades at a premium. Citi’s updated model assumes about 1.24x.
Citi boosts its Strategy ($MSTR) price target from $136 to $240, backed by a higher #Bitcoin forecast and expected mNAV expansion.
About 34% of MSTR's potential upside, according to Citi, comes from Bitcoin appreciation. This follows the bank's move to lift its 12-month Bitcoin target roughly 39%, from $82,000 to about $113,400.
Citi expects another 16% of the upside from a higher mNAV. That ratio compares Strategy's market value with its net assets, and above 1.0 means MSTR trades at a premium. Citi’s updated model assumes about 1.24x.
About 34% of MSTR's potential upside, according to Citi, comes from Bitcoin appreciation. This follows the bank's move to lift its 12-month Bitcoin target roughly 39%, from $82,000 to about $113,400.
Citi expects another 16% of the upside from a higher mNAV. That ratio compares Strategy's market value with its net assets, and above 1.0 means MSTR trades at a premium. Citi’s updated model assumes about 1.24x.
224

Article
"Crypto Price Analysis, BTC, ETH, XRP, QNT and LIT, October 2"Bitcoin tests resistance as Ethereum and XRP consolidate, while Quant and Lighter retreat. Key chart levels and conditional scenarios for October 2, 2026.
Bitcoin Tests $85,520 After a Stronger Daily Close
Bitcoin closed October 1 at $84,842, gaining 1.51% from the previous session’s $83,578. The daily high of $85,183 remained below the $85,210–$85,520 resistance zone identified in yesterday’s report, so the completed candle preserved the existing range.
Friday’s later $85,551 quote edged above that zone. This is an intraday move; it does not establish a daily closing breakout. The distinction matters because September 30 also saw price push higher before retreating into the close.
The 20-day simple moving average rose from approximately $81,302 to $81,684. Price remains above this rising average, supporting the broader recovery from mid-September even as the shorter-term range remains unresolved.
A daily close above $85,520, followed by a successful retest, would strengthen the case for revisiting the September 21–23 highs around $87,250–$87,330. A close back inside the range would leave that upside scenario unconfirmed.
On the downside, October 1’s $83,182 low is the nearest session reference, followed by the $82,580–$82,950 support area. Losing $82,580 on a daily close would weaken the consolidation and bring the rising 20-day average into focus.
Ethereum’s MACD Improves Beneath $2,743 Resistance
Ethereum ended October 1 at $2,705.30, up 0.77% from $2,684.57. Its $2,720.25 session high remained beneath the $2,737–$2,743 resistance cluster, leaving the same ceiling in place despite a firmer close.
Four-hour MACD, using 12, 26 and 9-period settings, offers a cautiously stronger short-term reading. The MACD line crossed above its signal on the completed candle ending October 1 at 12:00 UTC and remained above it through the chart cutoff.
At 00:00 UTC on October 2, the line stood near 2.95 and the signal near 0.78. The positive histogram widened from 1.44 to 2.17 over the latest bar. That expansion reflects improving momentum after the crossover, rather than a new crossover on the final candle. Both lines were above zero.
Price confirmation remains separate. A daily close above $2,743 would reopen the $2,787–$2,804 September highs. A subsequent fall below the reclaimed resistance would weaken that breakout scenario.
October 1’s $2,674 low provides an initial support reference. Below it, the $2,635–$2,658 area contains several recent session lows. A daily close below $2,635 would break that support structure and undercut the improving short-term momentum signal.
XRP Holds Above Its Bollinger Midpoint
XRP again closed near $1.49 on October 1 after trading between approximately $1.48 and $1.51. The rounded daily feed shows little change from September 30, while Friday’s later quote of $1.51 still sat beneath the established $1.53–$1.56 resistance band.
Daily Bollinger Bands, calculated with a 20-day simple moving average and two population standard deviations, place the midpoint near $1.448. The upper band stood near $1.629 and the lower band near $1.267 at the completed daily close.
XRP remains above the midpoint but has not reclaimed the recent horizontal highs. The bands provide context for the trading range; being above their midpoint alone does not confirm that another advance has started.
The midpoint now overlaps the lower edge of the $1.45–$1.47 support zone. A daily close below $1.45 would weaken this base and expose earlier trading areas near $1.41 and $1.37. The lower band is a changing volatility measure, not an automatic downside destination.
Conversely, a daily close above $1.56 would clear the nearby resistance band and support a retest of $1.61–$1.66. A return below $1.53 after such a break would weaken the recovery case. Compared with yesterday, the principal horizontal levels remain intact.
Quant Loses Yesterday’s Retracement Support
Quant’s October 1 candle closed at $245.16, down 14.54% from $286.87. The session reached $305.07 before falling to $242.22, leaving the close near the day’s low and below the $261.50–$276.75 retracement area discussed yesterday.
The Fibonacci anchors remain the September 28 low of $196.87 and September 30 high of $326.12. Measuring the pullback from that upward swing gives $276.75 at 38.2%, $261.50 at 50%, and $246.24 at 61.8%.
The completed daily close fell just below the 61.8% level. Friday’s $250.12 quote subsequently recovered above it, but a live reclaim does not yet reverse the daily loss of support.
Holding the $242.22 session low and closing back above $246.24 would be an initial stabilization signal. A stronger recovery would require a close above $261.50, followed by a challenge to $276.75. The former support area therefore becomes the immediate recovery test.
A daily close below $242.22 would instead leave the September 29 low of $205.52 and September 28 low of $196.87 as the next visible references. That downside scenario would weaken if QNT reclaimed and held $261.50.
Lighter Remains Near Its Recent Lows
Lighter closed October 1 at $3.81, down 3.54% from $3.95. Its daily high stalled at $4.11 for a second consecutive session, while the $3.76 low remained above the September 29–30 lows of $3.65–$3.66.
The daily sequence shows a decline from September 24’s $5.54 high toward those lows, with repeated lower highs preceding the latest consolidation. The two sessions capped at $4.11 have not yet reversed that structure.
Four-hour RSI, calculated over 14 periods with Wilder smoothing, fell from 38.90 to 36.17 on the latest completed candle. The reading remains below the neutral 50 line, indicating subdued momentum, but above the conventional 30 oversold threshold. It does not establish a reversal signal.
A daily close above $4.11 would be the first clearer recovery confirmation. Holding that level could bring the earlier $4.32–$4.45 trading area back into view; RSI recovering above 50 would provide supporting momentum evidence.
A daily close below $3.65 would break the recent floor and invalidate the developing base. The available daily window contains no lower established swing low, so a deeper technical target is not assigned. Any recovery above $4.11 would lose credibility if price subsequently fell back below $3.95.
#CryptoNewsCommunity
"Crypto Price Analysis, BTC, ETH, XRP, QNT and LIT, October 2"
Bitcoin tests resistance as Ethereum and XRP consolidate, while Quant and Lighter retreat. Key chart levels and conditional scenarios for October 2, 2026.
Bitcoin Tests $85,520 After a Stronger Daily Close
Bitcoin closed October 1 at $84,842, gaining 1.51% from the previous session’s $83,578. The daily high of $85,183 remained below the $85,210–$85,520 resistance zone identified in yesterday’s report, so the completed candle preserved the existing range.
Friday’s later $85,551 quote edged above that zone. This is an intraday move; it does not establish a daily closing breakout. The distinction matters because September 30 also saw price push higher before retreating into the close.
The 20-day simple moving average rose from approximately $81,302 to $81,684. Price remains above this rising average, supporting the broader recovery from mid-September even as the shorter-term range remains unresolved.
A daily close above $85,520, followed by a successful retest, would strengthen the case for revisiting the September 21–23 highs around $87,250–$87,330. A close back inside the range would leave that upside scenario unconfirmed.
On the downside, October 1’s $83,182 low is the nearest session reference, followed by the $82,580–$82,950 support area. Losing $82,580 on a daily close would weaken the consolidation and bring the rising 20-day average into focus.
Ethereum’s MACD Improves Beneath $2,743 Resistance
Ethereum ended October 1 at $2,705.30, up 0.77% from $2,684.57. Its $2,720.25 session high remained beneath the $2,737–$2,743 resistance cluster, leaving the same ceiling in place despite a firmer close.
Four-hour MACD, using 12, 26 and 9-period settings, offers a cautiously stronger short-term reading. The MACD line crossed above its signal on the completed candle ending October 1 at 12:00 UTC and remained above it through the chart cutoff.
At 00:00 UTC on October 2, the line stood near 2.95 and the signal near 0.78. The positive histogram widened from 1.44 to 2.17 over the latest bar. That expansion reflects improving momentum after the crossover, rather than a new crossover on the final candle. Both lines were above zero.
Price confirmation remains separate. A daily close above $2,743 would reopen the $2,787–$2,804 September highs. A subsequent fall below the reclaimed resistance would weaken that breakout scenario.
October 1’s $2,674 low provides an initial support reference. Below it, the $2,635–$2,658 area contains several recent session lows. A daily close below $2,635 would break that support structure and undercut the improving short-term momentum signal.
XRP Holds Above Its Bollinger Midpoint
XRP again closed near $1.49 on October 1 after trading between approximately $1.48 and $1.51. The rounded daily feed shows little change from September 30, while Friday’s later quote of $1.51 still sat beneath the established $1.53–$1.56 resistance band.
Daily Bollinger Bands, calculated with a 20-day simple moving average and two population standard deviations, place the midpoint near $1.448. The upper band stood near $1.629 and the lower band near $1.267 at the completed daily close.
XRP remains above the midpoint but has not reclaimed the recent horizontal highs. The bands provide context for the trading range; being above their midpoint alone does not confirm that another advance has started.
The midpoint now overlaps the lower edge of the $1.45–$1.47 support zone. A daily close below $1.45 would weaken this base and expose earlier trading areas near $1.41 and $1.37. The lower band is a changing volatility measure, not an automatic downside destination.
Conversely, a daily close above $1.56 would clear the nearby resistance band and support a retest of $1.61–$1.66. A return below $1.53 after such a break would weaken the recovery case. Compared with yesterday, the principal horizontal levels remain intact.
Quant Loses Yesterday’s Retracement Support
Quant’s October 1 candle closed at $245.16, down 14.54% from $286.87. The session reached $305.07 before falling to $242.22, leaving the close near the day’s low and below the $261.50–$276.75 retracement area discussed yesterday.
The Fibonacci anchors remain the September 28 low of $196.87 and September 30 high of $326.12. Measuring the pullback from that upward swing gives $276.75 at 38.2%, $261.50 at 50%, and $246.24 at 61.8%.
The completed daily close fell just below the 61.8% level. Friday’s $250.12 quote subsequently recovered above it, but a live reclaim does not yet reverse the daily loss of support.
Holding the $242.22 session low and closing back above $246.24 would be an initial stabilization signal. A stronger recovery would require a close above $261.50, followed by a challenge to $276.75. The former support area therefore becomes the immediate recovery test.
A daily close below $242.22 would instead leave the September 29 low of $205.52 and September 28 low of $196.87 as the next visible references. That downside scenario would weaken if QNT reclaimed and held $261.50.
Lighter Remains Near Its Recent Lows
Lighter closed October 1 at $3.81, down 3.54% from $3.95. Its daily high stalled at $4.11 for a second consecutive session, while the $3.76 low remained above the September 29–30 lows of $3.65–$3.66.
The daily sequence shows a decline from September 24’s $5.54 high toward those lows, with repeated lower highs preceding the latest consolidation. The two sessions capped at $4.11 have not yet reversed that structure.
Four-hour RSI, calculated over 14 periods with Wilder smoothing, fell from 38.90 to 36.17 on the latest completed candle. The reading remains below the neutral 50 line, indicating subdued momentum, but above the conventional 30 oversold threshold. It does not establish a reversal signal.
A daily close above $4.11 would be the first clearer recovery confirmation. Holding that level could bring the earlier $4.32–$4.45 trading area back into view; RSI recovering above 50 would provide supporting momentum evidence.
A daily close below $3.65 would break the recent floor and invalidate the developing base. The available daily window contains no lower established swing low, so a deeper technical target is not assigned. Any recovery above $4.11 would lose credibility if price subsequently fell back below $3.95.
#CryptoNewsCommunity
Bitcoin Tests $85,520 After a Stronger Daily Close
Bitcoin closed October 1 at $84,842, gaining 1.51% from the previous session’s $83,578. The daily high of $85,183 remained below the $85,210–$85,520 resistance zone identified in yesterday’s report, so the completed candle preserved the existing range.
Friday’s later $85,551 quote edged above that zone. This is an intraday move; it does not establish a daily closing breakout. The distinction matters because September 30 also saw price push higher before retreating into the close.
The 20-day simple moving average rose from approximately $81,302 to $81,684. Price remains above this rising average, supporting the broader recovery from mid-September even as the shorter-term range remains unresolved.
A daily close above $85,520, followed by a successful retest, would strengthen the case for revisiting the September 21–23 highs around $87,250–$87,330. A close back inside the range would leave that upside scenario unconfirmed.
On the downside, October 1’s $83,182 low is the nearest session reference, followed by the $82,580–$82,950 support area. Losing $82,580 on a daily close would weaken the consolidation and bring the rising 20-day average into focus.
Ethereum’s MACD Improves Beneath $2,743 Resistance
Ethereum ended October 1 at $2,705.30, up 0.77% from $2,684.57. Its $2,720.25 session high remained beneath the $2,737–$2,743 resistance cluster, leaving the same ceiling in place despite a firmer close.
Four-hour MACD, using 12, 26 and 9-period settings, offers a cautiously stronger short-term reading. The MACD line crossed above its signal on the completed candle ending October 1 at 12:00 UTC and remained above it through the chart cutoff.
At 00:00 UTC on October 2, the line stood near 2.95 and the signal near 0.78. The positive histogram widened from 1.44 to 2.17 over the latest bar. That expansion reflects improving momentum after the crossover, rather than a new crossover on the final candle. Both lines were above zero.
Price confirmation remains separate. A daily close above $2,743 would reopen the $2,787–$2,804 September highs. A subsequent fall below the reclaimed resistance would weaken that breakout scenario.
October 1’s $2,674 low provides an initial support reference. Below it, the $2,635–$2,658 area contains several recent session lows. A daily close below $2,635 would break that support structure and undercut the improving short-term momentum signal.
XRP Holds Above Its Bollinger Midpoint
XRP again closed near $1.49 on October 1 after trading between approximately $1.48 and $1.51. The rounded daily feed shows little change from September 30, while Friday’s later quote of $1.51 still sat beneath the established $1.53–$1.56 resistance band.
Daily Bollinger Bands, calculated with a 20-day simple moving average and two population standard deviations, place the midpoint near $1.448. The upper band stood near $1.629 and the lower band near $1.267 at the completed daily close.
XRP remains above the midpoint but has not reclaimed the recent horizontal highs. The bands provide context for the trading range; being above their midpoint alone does not confirm that another advance has started.
The midpoint now overlaps the lower edge of the $1.45–$1.47 support zone. A daily close below $1.45 would weaken this base and expose earlier trading areas near $1.41 and $1.37. The lower band is a changing volatility measure, not an automatic downside destination.
Conversely, a daily close above $1.56 would clear the nearby resistance band and support a retest of $1.61–$1.66. A return below $1.53 after such a break would weaken the recovery case. Compared with yesterday, the principal horizontal levels remain intact.
Quant Loses Yesterday’s Retracement Support
Quant’s October 1 candle closed at $245.16, down 14.54% from $286.87. The session reached $305.07 before falling to $242.22, leaving the close near the day’s low and below the $261.50–$276.75 retracement area discussed yesterday.
The Fibonacci anchors remain the September 28 low of $196.87 and September 30 high of $326.12. Measuring the pullback from that upward swing gives $276.75 at 38.2%, $261.50 at 50%, and $246.24 at 61.8%.
The completed daily close fell just below the 61.8% level. Friday’s $250.12 quote subsequently recovered above it, but a live reclaim does not yet reverse the daily loss of support.
Holding the $242.22 session low and closing back above $246.24 would be an initial stabilization signal. A stronger recovery would require a close above $261.50, followed by a challenge to $276.75. The former support area therefore becomes the immediate recovery test.
A daily close below $242.22 would instead leave the September 29 low of $205.52 and September 28 low of $196.87 as the next visible references. That downside scenario would weaken if QNT reclaimed and held $261.50.
Lighter Remains Near Its Recent Lows
Lighter closed October 1 at $3.81, down 3.54% from $3.95. Its daily high stalled at $4.11 for a second consecutive session, while the $3.76 low remained above the September 29–30 lows of $3.65–$3.66.
The daily sequence shows a decline from September 24’s $5.54 high toward those lows, with repeated lower highs preceding the latest consolidation. The two sessions capped at $4.11 have not yet reversed that structure.
Four-hour RSI, calculated over 14 periods with Wilder smoothing, fell from 38.90 to 36.17 on the latest completed candle. The reading remains below the neutral 50 line, indicating subdued momentum, but above the conventional 30 oversold threshold. It does not establish a reversal signal.
A daily close above $4.11 would be the first clearer recovery confirmation. Holding that level could bring the earlier $4.32–$4.45 trading area back into view; RSI recovering above 50 would provide supporting momentum evidence.
A daily close below $3.65 would break the recent floor and invalidate the developing base. The available daily window contains no lower established swing low, so a deeper technical target is not assigned. Any recovery above $4.11 would lose credibility if price subsequently fell back below $3.95.
#CryptoNewsCommunity
669
Nike (NYSE: $NKE) stock tumbled 10.25% to $31.55 premarket on Friday after weaker-than-expected fiscal first-quarter revenue and a full-year sales forecast showing a much steeper decline than Wall Street had expected.
The company also noted that the planned Dunk pullback trimmed Sportswear revenue by around $200 million for the quarter.
Nike expects full-year revenue to fall by a high-single-digit percentage, well below the average analyst estimate of about a 2% decline.
#Crypto
Nike (NYSE: $NKE) stock tumbled 10.25% to $31.55 premarket on Friday after weaker-than-expected fiscal first-quarter revenue and a full-year sales forecast showing a much steeper decline than Wall Street had expected.
The company also noted that the planned Dunk pullback trimmed Sportswear revenue by around $200 million for the quarter.
Nike expects full-year revenue to fall by a high-single-digit percentage, well below the average analyst estimate of about a 2% decline.
#Crypto
The company also noted that the planned Dunk pullback trimmed Sportswear revenue by around $200 million for the quarter.
Nike expects full-year revenue to fall by a high-single-digit percentage, well below the average analyst estimate of about a 2% decline.
#Crypto
294
Charles Hoskinson, the founder of Cardano, has pushed back against criticism that he should be responsible for driving adoption and delivering measurable growth across the Cardano ecosystem.
The clarification followed comments from a market commentator who criticized Hoskinson and argued that Cardano’s leadership should focus less on issues outside its core expertise and instead prioritize adoption, developer activity, scalability, liquidity, and real-world usage.
Hoskinson Rejects Responsibility for Cardano Adoption
Responding to the criticism, Hoskinson emphasized that Cardano operates as a decentralized network and that he does not hold an official leadership position within the blockchain.
Charles Hoskinson, the founder of Cardano, has pushed back against criticism that he should be responsible for driving adoption and delivering measurable growth across the Cardano ecosystem.
The clarification followed comments from a market commentator who criticized Hoskinson and argued that Cardano’s leadership should focus less on issues outside its core expertise and instead prioritize adoption, developer activity, scalability, liquidity, and real-world usage.
Hoskinson Rejects Responsibility for Cardano Adoption
Responding to the criticism, Hoskinson emphasized that Cardano operates as a decentralized network and that he does not hold an official leadership position within the blockchain.
The clarification followed comments from a market commentator who criticized Hoskinson and argued that Cardano’s leadership should focus less on issues outside its core expertise and instead prioritize adoption, developer activity, scalability, liquidity, and real-world usage.
Hoskinson Rejects Responsibility for Cardano Adoption
Responding to the criticism, Hoskinson emphasized that Cardano operates as a decentralized network and that he does not hold an official leadership position within the blockchain.

1
331
Article
"Accenture Stock Jumps 23% to $226; Jefferies and TD Cowen Keep $190, $173 Targets"Accenture plc (NYSE: ACN) shares jumped over 23% to $226.05 in Thursday pre-market trading after the company topped fiscal fourth-quarter revenue expectations and issued a fiscal 2027 growth outlook of 3% to 6% in local currency.
The rally lifted the shares above price targets maintained by two analysts after the results. Jefferies reiterated a Hold rating with a $190 target, while TD Cowen maintained its Hold rating and $173 target. Both targets were below the $216.34 pre-market price. Accenture had closed Wednesday’s regular session at $183.37, up 3.53%.
Jefferies, TD Cowen Focus on Organic Growth and M&A Contribution
Jefferies’ post-earnings view centered on the underlying organic growth implied by Accenture’s fiscal 2027 outlook. Accenture guided to total local-currency revenue growth of 3% to 6%, while Chief Financial Officer Angie Park said acquisitions are expected to contribute 2.5 percentage points to fiscal 2027 growth. Based on that contribution, Jefferies treated the outlook as implying roughly 0.5% to 3.5% organic growth and noted that the implied range was about 50 basis points above expectations.
Accenture did not provide a separate organic-growth range.
TD Cowen, meanwhile, highlighted the acquisition contribution embedded in the outlook. The firm described the outlook as including roughly 2 to 2.5 percentage points from M&A and said the fourth-quarter results exceeded both its estimates and more cautious expectations heading into the report.
On the broader demand backdrop, management said discretionary spending did not materially change during the fourth quarter. For fiscal 2027, the upper end of the revenue range assumes discretionary spending remains stable or improves slightly, while the lower end allows for deterioration.
Q4 Revenue, EPS and Bookings Support the Earnings Rally
The earnings report behind Thursday’s share-price move showed fourth-quarter revenue of $18.68 billion, up 6% in U.S. dollars and 7% in local currency. The result exceeded Accenture’s own $17.75 billion to $18.40 billion guidance range and the $18.03 billion analyst average cited by Reuters.
Diluted earnings per share were $3.29, up 46% from $2.25 a year earlier and 9% compared with the prior-year adjusted figure of $3.03. New bookings reached $22.17 billion, rising 4% in U.S. dollars and 5% in local currency. Consulting bookings were $9.40 billion, and managed-services bookings were $12.77 billion.
Consulting revenue rose 6% to $9.28 billion, while managed-services revenue increased 7% to $9.40 billion. For fiscal 2027, Accenture expects diluted EPS of $14.39 to $14.81, an operating margin of 15.9% to 16.1%, and free cash flow of $11.0 billion to $11.8 billion.
Separately, Accenture Tokenized Stock (Ondo), or ACNon, was trading at $222.85, up 21.24% over the previous 24 hours, according to CoinMarketCap. ACNon is part of the broader tokenized stocks market and is designed to provide economic exposure similar to Accenture shares while remaining separate from the NYSE-listed ACN security.
#CryptonewswithJack
"Accenture Stock Jumps 23% to $226; Jefferies and TD Cowen Keep $190, $173 Targets"
Accenture plc (NYSE: ACN) shares jumped over 23% to $226.05 in Thursday pre-market trading after the company topped fiscal fourth-quarter revenue expectations and issued a fiscal 2027 growth outlook of 3% to 6% in local currency.
The rally lifted the shares above price targets maintained by two analysts after the results. Jefferies reiterated a Hold rating with a $190 target, while TD Cowen maintained its Hold rating and $173 target. Both targets were below the $216.34 pre-market price. Accenture had closed Wednesday’s regular session at $183.37, up 3.53%.
Jefferies, TD Cowen Focus on Organic Growth and M&A Contribution
Jefferies’ post-earnings view centered on the underlying organic growth implied by Accenture’s fiscal 2027 outlook. Accenture guided to total local-currency revenue growth of 3% to 6%, while Chief Financial Officer Angie Park said acquisitions are expected to contribute 2.5 percentage points to fiscal 2027 growth. Based on that contribution, Jefferies treated the outlook as implying roughly 0.5% to 3.5% organic growth and noted that the implied range was about 50 basis points above expectations.
Accenture did not provide a separate organic-growth range.
TD Cowen, meanwhile, highlighted the acquisition contribution embedded in the outlook. The firm described the outlook as including roughly 2 to 2.5 percentage points from M&A and said the fourth-quarter results exceeded both its estimates and more cautious expectations heading into the report.
On the broader demand backdrop, management said discretionary spending did not materially change during the fourth quarter. For fiscal 2027, the upper end of the revenue range assumes discretionary spending remains stable or improves slightly, while the lower end allows for deterioration.
Q4 Revenue, EPS and Bookings Support the Earnings Rally
The earnings report behind Thursday’s share-price move showed fourth-quarter revenue of $18.68 billion, up 6% in U.S. dollars and 7% in local currency. The result exceeded Accenture’s own $17.75 billion to $18.40 billion guidance range and the $18.03 billion analyst average cited by Reuters.
Diluted earnings per share were $3.29, up 46% from $2.25 a year earlier and 9% compared with the prior-year adjusted figure of $3.03. New bookings reached $22.17 billion, rising 4% in U.S. dollars and 5% in local currency. Consulting bookings were $9.40 billion, and managed-services bookings were $12.77 billion.
Consulting revenue rose 6% to $9.28 billion, while managed-services revenue increased 7% to $9.40 billion. For fiscal 2027, Accenture expects diluted EPS of $14.39 to $14.81, an operating margin of 15.9% to 16.1%, and free cash flow of $11.0 billion to $11.8 billion.
Separately, Accenture Tokenized Stock (Ondo), or ACNon, was trading at $222.85, up 21.24% over the previous 24 hours, according to CoinMarketCap. ACNon is part of the broader tokenized stocks market and is designed to provide economic exposure similar to Accenture shares while remaining separate from the NYSE-listed ACN security.
#CryptonewswithJack
The rally lifted the shares above price targets maintained by two analysts after the results. Jefferies reiterated a Hold rating with a $190 target, while TD Cowen maintained its Hold rating and $173 target. Both targets were below the $216.34 pre-market price. Accenture had closed Wednesday’s regular session at $183.37, up 3.53%.
Jefferies, TD Cowen Focus on Organic Growth and M&A Contribution
Jefferies’ post-earnings view centered on the underlying organic growth implied by Accenture’s fiscal 2027 outlook. Accenture guided to total local-currency revenue growth of 3% to 6%, while Chief Financial Officer Angie Park said acquisitions are expected to contribute 2.5 percentage points to fiscal 2027 growth. Based on that contribution, Jefferies treated the outlook as implying roughly 0.5% to 3.5% organic growth and noted that the implied range was about 50 basis points above expectations.
Accenture did not provide a separate organic-growth range.
TD Cowen, meanwhile, highlighted the acquisition contribution embedded in the outlook. The firm described the outlook as including roughly 2 to 2.5 percentage points from M&A and said the fourth-quarter results exceeded both its estimates and more cautious expectations heading into the report.
On the broader demand backdrop, management said discretionary spending did not materially change during the fourth quarter. For fiscal 2027, the upper end of the revenue range assumes discretionary spending remains stable or improves slightly, while the lower end allows for deterioration.
Q4 Revenue, EPS and Bookings Support the Earnings Rally
The earnings report behind Thursday’s share-price move showed fourth-quarter revenue of $18.68 billion, up 6% in U.S. dollars and 7% in local currency. The result exceeded Accenture’s own $17.75 billion to $18.40 billion guidance range and the $18.03 billion analyst average cited by Reuters.
Diluted earnings per share were $3.29, up 46% from $2.25 a year earlier and 9% compared with the prior-year adjusted figure of $3.03. New bookings reached $22.17 billion, rising 4% in U.S. dollars and 5% in local currency. Consulting bookings were $9.40 billion, and managed-services bookings were $12.77 billion.
Consulting revenue rose 6% to $9.28 billion, while managed-services revenue increased 7% to $9.40 billion. For fiscal 2027, Accenture expects diluted EPS of $14.39 to $14.81, an operating margin of 15.9% to 16.1%, and free cash flow of $11.0 billion to $11.8 billion.
Separately, Accenture Tokenized Stock (Ondo), or ACNon, was trading at $222.85, up 21.24% over the previous 24 hours, according to CoinMarketCap. ACNon is part of the broader tokenized stocks market and is designed to provide economic exposure similar to Accenture shares while remaining separate from the NYSE-listed ACN security.
#CryptonewswithJack
260
Article
"AST SpaceMobile Stock Rises; Spacecraft Production Sequence Reaches BlueBird 50"AST SpaceMobile (NASDAQ: ASTS) shares rose 2.09% to $60.09 in Thursday premarket trading following fresh spacecraft and manufacturing updates.
The stock closed Wednesday at $58.86, down 0.91%. Separately, AST SpaceMobile Tokenized bStocks (ASTSB) was trading at $60.56, up 1.33% over the past 24 hours, according to CoinMarketCap.
AST SpaceMobile said BlueBirds 14, 15, and 16 have left its Texas facility and are being transported to Cape Canaveral. The company did not announce a launch date for the three satellites in the update.
Meanwhile, the company reposted an update from Chairman and CEO Abel Avellan saying BlueBird 11 is fully deployed. Avellan said all 13 satellites in orbit, representing about 20,000 square feet of phased arrays, are performing as planned.
More Than 20 Spacecraft Structures Are Being Integrated
The same convoy update included a broader manufacturing milestone in Midland, Texas. AST SpaceMobile said its production sequence has now reached BlueBird 50, with more than 20 spacecraft structures being integrated as part of its assembly process.
The BlueBird 50 milestone extends the company’s disclosed manufacturing sequence beyond two earlier updates. In its Aug. 10 second-quarter business update, AST SpaceMobile said BlueBirds 17 through 46 were in various stages of production and assembly. The company later said production had advanced through BlueBird 48.
The progression shows how far AST SpaceMobile has advanced in manufacturing, not how many spacecraft it has completed. Spacecraft within that sequence remain at different stages of production and assembly, while BlueBirds 14, 15, and 16 have already moved into the transport stage.
#CryptonewswithJack
"AST SpaceMobile Stock Rises; Spacecraft Production Sequence Reaches BlueBird 50"
AST SpaceMobile (NASDAQ: ASTS) shares rose 2.09% to $60.09 in Thursday premarket trading following fresh spacecraft and manufacturing updates.
The stock closed Wednesday at $58.86, down 0.91%. Separately, AST SpaceMobile Tokenized bStocks (ASTSB) was trading at $60.56, up 1.33% over the past 24 hours, according to CoinMarketCap.
AST SpaceMobile said BlueBirds 14, 15, and 16 have left its Texas facility and are being transported to Cape Canaveral. The company did not announce a launch date for the three satellites in the update.
Meanwhile, the company reposted an update from Chairman and CEO Abel Avellan saying BlueBird 11 is fully deployed. Avellan said all 13 satellites in orbit, representing about 20,000 square feet of phased arrays, are performing as planned.
More Than 20 Spacecraft Structures Are Being Integrated
The same convoy update included a broader manufacturing milestone in Midland, Texas. AST SpaceMobile said its production sequence has now reached BlueBird 50, with more than 20 spacecraft structures being integrated as part of its assembly process.
The BlueBird 50 milestone extends the company’s disclosed manufacturing sequence beyond two earlier updates. In its Aug. 10 second-quarter business update, AST SpaceMobile said BlueBirds 17 through 46 were in various stages of production and assembly. The company later said production had advanced through BlueBird 48.
The progression shows how far AST SpaceMobile has advanced in manufacturing, not how many spacecraft it has completed. Spacecraft within that sequence remain at different stages of production and assembly, while BlueBirds 14, 15, and 16 have already moved into the transport stage.
#CryptonewswithJack
The stock closed Wednesday at $58.86, down 0.91%. Separately, AST SpaceMobile Tokenized bStocks (ASTSB) was trading at $60.56, up 1.33% over the past 24 hours, according to CoinMarketCap.
AST SpaceMobile said BlueBirds 14, 15, and 16 have left its Texas facility and are being transported to Cape Canaveral. The company did not announce a launch date for the three satellites in the update.
Meanwhile, the company reposted an update from Chairman and CEO Abel Avellan saying BlueBird 11 is fully deployed. Avellan said all 13 satellites in orbit, representing about 20,000 square feet of phased arrays, are performing as planned.
More Than 20 Spacecraft Structures Are Being Integrated
The same convoy update included a broader manufacturing milestone in Midland, Texas. AST SpaceMobile said its production sequence has now reached BlueBird 50, with more than 20 spacecraft structures being integrated as part of its assembly process.
The BlueBird 50 milestone extends the company’s disclosed manufacturing sequence beyond two earlier updates. In its Aug. 10 second-quarter business update, AST SpaceMobile said BlueBirds 17 through 46 were in various stages of production and assembly. The company later said production had advanced through BlueBird 48.
The progression shows how far AST SpaceMobile has advanced in manufacturing, not how many spacecraft it has completed. Spacecraft within that sequence remain at different stages of production and assembly, while BlueBirds 14, 15, and 16 have already moved into the transport stage.
#CryptonewswithJack
157
#XRP Ledger Surpasses 10 Million x402 Payments Less Than Three Months After 1 Million Milestone.
According to J. Ayo Akinyele, RippleX's Head of Engineering, the network is now processing about 500K payments daily on a seven-day average.
Akinyele credited the rising use of AI agents as a key reason for the sudden spike in activity.
#CryptoNewss
#XRP Ledger Surpasses 10 Million x402 Payments Less Than Three Months After 1 Million Milestone.
According to J. Ayo Akinyele, RippleX's Head of Engineering, the network is now processing about 500K payments daily on a seven-day average.
Akinyele credited the rising use of AI agents as a key reason for the sudden spike in activity.
#CryptoNewss
According to J. Ayo Akinyele, RippleX's Head of Engineering, the network is now processing about 500K payments daily on a seven-day average.
Akinyele credited the rising use of AI agents as a key reason for the sudden spike in activity.
#CryptoNewss
131

Article
"Crypto Price Analysis BTC, ETH, XRP, QNT, NEAR, October 1: Bitcoin Holds Range as NEAR Rebounds"Bitcoin, Ethereum and XRP hold below resistance as NEAR rebounds and Quant consolidates. Explore technical levels and price scenarios for October 1, 2026.
Bitcoin, Ethereum and XRP opened October with modest rolling 24-hour gains, while NEAR Protocol outperformed the group and Quant remained nearly unchanged. The completed daily charts showed different conditions: Bitcoin remained inside its recent consolidation, Ethereum and XRP stayed below nearby resistance, and NEAR recovered much of its latest pullback.
Quant and NEAR join today’s coverage because both appeared in CoinGecko’s search-trending list and ranked inside its top 100 by market capitalization. NEAR ranked 21st and Quant 32nd in the market snapshot. A trending-search listing measures attention and is distinct from a ranking of price gainers.
Bitcoin Fails to Hold Above the Previous Resistance Zone
Bitcoin closed September 30 at $83,578, down 0.07% from $83,640 a day earlier. The session reached $85,518, temporarily exceeding the $85,210 upper resistance boundary identified in the previous report, before ending back below it. That intraday move did not become a confirmed daily breakout.
The latest high expands immediate resistance to approximately $85,210–$85,520. A completed daily close above $85,520, followed by a hold of the reclaimed area, would strengthen the case for another test of the September highs around $87,250–$87,330.
Support remains near $82,580–$82,950, encompassing the September 28 and September 30 lows. Beneath it, the rising 20-day simple moving average stood near $81,302. A daily close below $82,580 would weaken the range and bring that average into focus.
Four-hour MACD, using 12,26,9 settings, remained mixed as the candle closed at 00:00 UTC. The MACD line was approximately -88.63, above its -116.44 signal line but still below zero. Its positive histogram narrowed from 34.24 to 27.81, indicating that the latest improvement relative to the signal line was losing pace.
Ethereum Holds Above Its 20-Day Average but Below $2,743
Ethereum closed September 30 at $2,684.57, gaining 0.27%. Its $2,736.98 session high remained below the approximately $2,743 resistance level highlighted in the previous report.
Daily Bollinger Bands, calculated using a 20-day simple moving average and two standard deviations, had a midpoint near $2,610.17 and an upper band near $2,833.57. ETH price closed above the midpoint and inside the bands, with nearby horizontal resistance still separating price from the higher band.
Fibonacci retracements of the advance from September 15’s $2,361.16 low to September 21’s $2,804.42 high place the 23.6% level near $2,699.81 and the 38.2% level near $2,635.09. The latter closely matches the recent support floor around $2,635.
A daily close above $2,743 would put the $2,787–$2,804 highs back in view. Only a further break of that area would support an extension toward the upper Bollinger Band, whose value changes with subsequent closes.
Conversely, a close below $2,635 would weaken the consolidation and expose the 20-day average near $2,610, followed by the 50% retracement near $2,583.
XRP’s $1.45–$1.47 Support Remains in Focus
XRP finished September 30 near $1.49 after reaching approximately $1.54. The close remained near the preceding session’s level and below the $1.53–$1.56 resistance band identified in the previous report.
The 20-day simple moving average rose to about $1.44. Fibonacci retracements of the advance from the September 16 low of $1.25 to the September 23 high of $1.66 provide additional reference points: approximately $1.50 at 38.2%, $1.46 at 50%, and $1.41 at 61.8%.
The 50% retracement falls within the established $1.45–$1.47 support area, while the moving average sits just beneath it. A completed close below this support band would weaken the current structure; a further loss of the average would bring the $1.41 retracement into focus.
On the upside, reclaiming $1.50 would be an initial improvement, but a close above $1.56 would be needed to clear the broader resistance band and nearby 23.6% retracement. Holding that reclaimed area would support a retest of $1.61–$1.66. A return below $1.53 after a breakout would weaken that recovery scenario.
Quant’s Daily Recovery Meets Softer Four-Hour Momentum
Quant closed September 30 at $286.87, up 7.36% from $267.20. The session climbed to $326.12 before retreating into the close. Its nearly flat rolling 24-hour return at the later snapshot measures a different window from that completed daily gain.
Fibonacci retracements of the rebound from September 28’s $196.87 low to September 30’s $326.12 high place the 23.6% level at $295.62, the 38.2% level at $276.75 and the 50% level at $261.50. The daily close sat between the first two levels, although the subsequent spot quote was back above $295.62.
The latest completed four-hour MACD line fell below its signal line, with the histogram turning from +0.32 to -1.28. Both lines remained above zero, distinguishing the loss of momentum relative to the signal from a move below the MACD baseline.
A daily reclaim of $295.62 would support another attempt at $318.36–$326.12. A confirmed break above $326.12 would reopen the September 27 high near $358.20. Failure to hold $276.75 would instead expose the September 30 low of $263.45 and nearby $261.50 retracement.
NEAR Recovers Toward Its September High
NEAR closed September 30 at $5.34, up 9.20% from $4.89. The session high of $5.49 remained below September 27’s $5.57 peak, so the rebound had not yet produced a confirmed breakout above the recent high.
Four-hour MACD showed improving momentum at the common chart cutoff. Its line stood near 0.109, above the 0.078 signal line, while the positive histogram increased from approximately 0.026 to 0.031. Unlike Bitcoin, both NEAR readings were above zero.
The $5.16–$5.19 area, containing earlier daily highs, is the first area to watch for a successful support retest. Holding above it would preserve the rebound toward $5.49–$5.57. A return below $5.16 would weaken the recovery, with the September 30 low at $4.84 and September 29 low at $4.55 providing lower reference points.
For a conditional upside scenario, two-point Fibonacci extensions of the recovery from September 29’s $4.55 low to September 30’s $5.49 high stand near $5.75 at 1.272 and $6.07 at 1.618. Those levels become relevant if NEAR first closes above $5.57 and holds the breakout area; they are projected extensions, not confirmed price destinations.
#CryptoNewsFlash
"Crypto Price Analysis BTC, ETH, XRP, QNT, NEAR, October 1: Bitcoin Holds Range as NEAR Rebounds"
Bitcoin, Ethereum and XRP hold below resistance as NEAR rebounds and Quant consolidates. Explore technical levels and price scenarios for October 1, 2026.
Bitcoin, Ethereum and XRP opened October with modest rolling 24-hour gains, while NEAR Protocol outperformed the group and Quant remained nearly unchanged. The completed daily charts showed different conditions: Bitcoin remained inside its recent consolidation, Ethereum and XRP stayed below nearby resistance, and NEAR recovered much of its latest pullback.
Quant and NEAR join today’s coverage because both appeared in CoinGecko’s search-trending list and ranked inside its top 100 by market capitalization. NEAR ranked 21st and Quant 32nd in the market snapshot. A trending-search listing measures attention and is distinct from a ranking of price gainers.
Bitcoin Fails to Hold Above the Previous Resistance Zone
Bitcoin closed September 30 at $83,578, down 0.07% from $83,640 a day earlier. The session reached $85,518, temporarily exceeding the $85,210 upper resistance boundary identified in the previous report, before ending back below it. That intraday move did not become a confirmed daily breakout.
The latest high expands immediate resistance to approximately $85,210–$85,520. A completed daily close above $85,520, followed by a hold of the reclaimed area, would strengthen the case for another test of the September highs around $87,250–$87,330.
Support remains near $82,580–$82,950, encompassing the September 28 and September 30 lows. Beneath it, the rising 20-day simple moving average stood near $81,302. A daily close below $82,580 would weaken the range and bring that average into focus.
Four-hour MACD, using 12,26,9 settings, remained mixed as the candle closed at 00:00 UTC. The MACD line was approximately -88.63, above its -116.44 signal line but still below zero. Its positive histogram narrowed from 34.24 to 27.81, indicating that the latest improvement relative to the signal line was losing pace.
Ethereum Holds Above Its 20-Day Average but Below $2,743
Ethereum closed September 30 at $2,684.57, gaining 0.27%. Its $2,736.98 session high remained below the approximately $2,743 resistance level highlighted in the previous report.
Daily Bollinger Bands, calculated using a 20-day simple moving average and two standard deviations, had a midpoint near $2,610.17 and an upper band near $2,833.57. ETH price closed above the midpoint and inside the bands, with nearby horizontal resistance still separating price from the higher band.
Fibonacci retracements of the advance from September 15’s $2,361.16 low to September 21’s $2,804.42 high place the 23.6% level near $2,699.81 and the 38.2% level near $2,635.09. The latter closely matches the recent support floor around $2,635.
A daily close above $2,743 would put the $2,787–$2,804 highs back in view. Only a further break of that area would support an extension toward the upper Bollinger Band, whose value changes with subsequent closes.
Conversely, a close below $2,635 would weaken the consolidation and expose the 20-day average near $2,610, followed by the 50% retracement near $2,583.
XRP’s $1.45–$1.47 Support Remains in Focus
XRP finished September 30 near $1.49 after reaching approximately $1.54. The close remained near the preceding session’s level and below the $1.53–$1.56 resistance band identified in the previous report.
The 20-day simple moving average rose to about $1.44. Fibonacci retracements of the advance from the September 16 low of $1.25 to the September 23 high of $1.66 provide additional reference points: approximately $1.50 at 38.2%, $1.46 at 50%, and $1.41 at 61.8%.
The 50% retracement falls within the established $1.45–$1.47 support area, while the moving average sits just beneath it. A completed close below this support band would weaken the current structure; a further loss of the average would bring the $1.41 retracement into focus.
On the upside, reclaiming $1.50 would be an initial improvement, but a close above $1.56 would be needed to clear the broader resistance band and nearby 23.6% retracement. Holding that reclaimed area would support a retest of $1.61–$1.66. A return below $1.53 after a breakout would weaken that recovery scenario.
Quant’s Daily Recovery Meets Softer Four-Hour Momentum
Quant closed September 30 at $286.87, up 7.36% from $267.20. The session climbed to $326.12 before retreating into the close. Its nearly flat rolling 24-hour return at the later snapshot measures a different window from that completed daily gain.
Fibonacci retracements of the rebound from September 28’s $196.87 low to September 30’s $326.12 high place the 23.6% level at $295.62, the 38.2% level at $276.75 and the 50% level at $261.50. The daily close sat between the first two levels, although the subsequent spot quote was back above $295.62.
The latest completed four-hour MACD line fell below its signal line, with the histogram turning from +0.32 to -1.28. Both lines remained above zero, distinguishing the loss of momentum relative to the signal from a move below the MACD baseline.
A daily reclaim of $295.62 would support another attempt at $318.36–$326.12. A confirmed break above $326.12 would reopen the September 27 high near $358.20. Failure to hold $276.75 would instead expose the September 30 low of $263.45 and nearby $261.50 retracement.
NEAR Recovers Toward Its September High
NEAR closed September 30 at $5.34, up 9.20% from $4.89. The session high of $5.49 remained below September 27’s $5.57 peak, so the rebound had not yet produced a confirmed breakout above the recent high.
Four-hour MACD showed improving momentum at the common chart cutoff. Its line stood near 0.109, above the 0.078 signal line, while the positive histogram increased from approximately 0.026 to 0.031. Unlike Bitcoin, both NEAR readings were above zero.
The $5.16–$5.19 area, containing earlier daily highs, is the first area to watch for a successful support retest. Holding above it would preserve the rebound toward $5.49–$5.57. A return below $5.16 would weaken the recovery, with the September 30 low at $4.84 and September 29 low at $4.55 providing lower reference points.
For a conditional upside scenario, two-point Fibonacci extensions of the recovery from September 29’s $4.55 low to September 30’s $5.49 high stand near $5.75 at 1.272 and $6.07 at 1.618. Those levels become relevant if NEAR first closes above $5.57 and holds the breakout area; they are projected extensions, not confirmed price destinations.
#CryptoNewsFlash
Bitcoin, Ethereum and XRP opened October with modest rolling 24-hour gains, while NEAR Protocol outperformed the group and Quant remained nearly unchanged. The completed daily charts showed different conditions: Bitcoin remained inside its recent consolidation, Ethereum and XRP stayed below nearby resistance, and NEAR recovered much of its latest pullback.
Quant and NEAR join today’s coverage because both appeared in CoinGecko’s search-trending list and ranked inside its top 100 by market capitalization. NEAR ranked 21st and Quant 32nd in the market snapshot. A trending-search listing measures attention and is distinct from a ranking of price gainers.
Bitcoin Fails to Hold Above the Previous Resistance Zone
Bitcoin closed September 30 at $83,578, down 0.07% from $83,640 a day earlier. The session reached $85,518, temporarily exceeding the $85,210 upper resistance boundary identified in the previous report, before ending back below it. That intraday move did not become a confirmed daily breakout.
The latest high expands immediate resistance to approximately $85,210–$85,520. A completed daily close above $85,520, followed by a hold of the reclaimed area, would strengthen the case for another test of the September highs around $87,250–$87,330.
Support remains near $82,580–$82,950, encompassing the September 28 and September 30 lows. Beneath it, the rising 20-day simple moving average stood near $81,302. A daily close below $82,580 would weaken the range and bring that average into focus.
Four-hour MACD, using 12,26,9 settings, remained mixed as the candle closed at 00:00 UTC. The MACD line was approximately -88.63, above its -116.44 signal line but still below zero. Its positive histogram narrowed from 34.24 to 27.81, indicating that the latest improvement relative to the signal line was losing pace.
Ethereum Holds Above Its 20-Day Average but Below $2,743
Ethereum closed September 30 at $2,684.57, gaining 0.27%. Its $2,736.98 session high remained below the approximately $2,743 resistance level highlighted in the previous report.
Daily Bollinger Bands, calculated using a 20-day simple moving average and two standard deviations, had a midpoint near $2,610.17 and an upper band near $2,833.57. ETH price closed above the midpoint and inside the bands, with nearby horizontal resistance still separating price from the higher band.
Fibonacci retracements of the advance from September 15’s $2,361.16 low to September 21’s $2,804.42 high place the 23.6% level near $2,699.81 and the 38.2% level near $2,635.09. The latter closely matches the recent support floor around $2,635.
A daily close above $2,743 would put the $2,787–$2,804 highs back in view. Only a further break of that area would support an extension toward the upper Bollinger Band, whose value changes with subsequent closes.
Conversely, a close below $2,635 would weaken the consolidation and expose the 20-day average near $2,610, followed by the 50% retracement near $2,583.
XRP’s $1.45–$1.47 Support Remains in Focus
XRP finished September 30 near $1.49 after reaching approximately $1.54. The close remained near the preceding session’s level and below the $1.53–$1.56 resistance band identified in the previous report.
The 20-day simple moving average rose to about $1.44. Fibonacci retracements of the advance from the September 16 low of $1.25 to the September 23 high of $1.66 provide additional reference points: approximately $1.50 at 38.2%, $1.46 at 50%, and $1.41 at 61.8%.
The 50% retracement falls within the established $1.45–$1.47 support area, while the moving average sits just beneath it. A completed close below this support band would weaken the current structure; a further loss of the average would bring the $1.41 retracement into focus.
On the upside, reclaiming $1.50 would be an initial improvement, but a close above $1.56 would be needed to clear the broader resistance band and nearby 23.6% retracement. Holding that reclaimed area would support a retest of $1.61–$1.66. A return below $1.53 after a breakout would weaken that recovery scenario.
Quant’s Daily Recovery Meets Softer Four-Hour Momentum
Quant closed September 30 at $286.87, up 7.36% from $267.20. The session climbed to $326.12 before retreating into the close. Its nearly flat rolling 24-hour return at the later snapshot measures a different window from that completed daily gain.
Fibonacci retracements of the rebound from September 28’s $196.87 low to September 30’s $326.12 high place the 23.6% level at $295.62, the 38.2% level at $276.75 and the 50% level at $261.50. The daily close sat between the first two levels, although the subsequent spot quote was back above $295.62.
The latest completed four-hour MACD line fell below its signal line, with the histogram turning from +0.32 to -1.28. Both lines remained above zero, distinguishing the loss of momentum relative to the signal from a move below the MACD baseline.
A daily reclaim of $295.62 would support another attempt at $318.36–$326.12. A confirmed break above $326.12 would reopen the September 27 high near $358.20. Failure to hold $276.75 would instead expose the September 30 low of $263.45 and nearby $261.50 retracement.
NEAR Recovers Toward Its September High
NEAR closed September 30 at $5.34, up 9.20% from $4.89. The session high of $5.49 remained below September 27’s $5.57 peak, so the rebound had not yet produced a confirmed breakout above the recent high.
Four-hour MACD showed improving momentum at the common chart cutoff. Its line stood near 0.109, above the 0.078 signal line, while the positive histogram increased from approximately 0.026 to 0.031. Unlike Bitcoin, both NEAR readings were above zero.
The $5.16–$5.19 area, containing earlier daily highs, is the first area to watch for a successful support retest. Holding above it would preserve the rebound toward $5.49–$5.57. A return below $5.16 would weaken the recovery, with the September 30 low at $4.84 and September 29 low at $4.55 providing lower reference points.
For a conditional upside scenario, two-point Fibonacci extensions of the recovery from September 29’s $4.55 low to September 30’s $5.49 high stand near $5.75 at 1.272 and $6.07 at 1.618. Those levels become relevant if NEAR first closes above $5.57 and holds the breakout area; they are projected extensions, not confirmed price destinations.
#CryptoNewsFlash
376
Micron Micron Technology Inc. (NASDAQ: $MU
) is down 0.37% to roughly $1,061 in Thursday's premarket session, after ending Wednesday essentially unchanged at $1,065.11.
Micron slipped despite beating Wall Street estimates for its fiscal fourth quarter and forecasting fiscal first-quarter 2027 revenue above expectations.
Micron posted fourth-quarter revenue of $54.23 billion and non-GAAP diluted EPS of $33.42, versus estimates of about $51.33 billion and $31.72.
#Crypto
Micron Micron Technology Inc. (NASDAQ: $MU
) is down 0.37% to roughly $1,061 in Thursday's premarket session, after ending Wednesday essentially unchanged at $1,065.11.
Micron slipped despite beating Wall Street estimates for its fiscal fourth quarter and forecasting fiscal first-quarter 2027 revenue above expectations.
Micron posted fourth-quarter revenue of $54.23 billion and non-GAAP diluted EPS of $33.42, versus estimates of about $51.33 billion and $31.72.
#Crypto
) is down 0.37% to roughly $1,061 in Thursday's premarket session, after ending Wednesday essentially unchanged at $1,065.11.
Micron slipped despite beating Wall Street estimates for its fiscal fourth quarter and forecasting fiscal first-quarter 2027 revenue above expectations.
Micron posted fourth-quarter revenue of $54.23 billion and non-GAAP diluted EPS of $33.42, versus estimates of about $51.33 billion and $31.72.
#Crypto
1
518
Moderna Inc. (NASDAQ: MRNA) shares fell 8.57% to $186.03 in Wednesday premarket trading after Citi downgraded the stock. The firm moved Moderna from Neutral to Sell, saying a share price around $200 would imply roughly $26 billion in annual oncology sales.
The decline followed a 3.13% gain Tuesday, when Moderna closed at $203.46 after reaching a new 52-week high of $208.90. At $187.76, the premarket price was about 10.1% below Tuesday’s intraday high.
Meanwhile, Moderna Tokenized bStock (MRNAB) was trading at $187.79, down 3.91% over the previous 24 hours, according to CoinMarketCap. Because MRNAB trades around the clock, its 24-hour percentage change covers a different period from Moderna’s Nasdaq premarket move.
#CryptonewswithJack
Moderna Inc. (NASDAQ: MRNA) shares fell 8.57% to $186.03 in Wednesday premarket trading after Citi downgraded the stock. The firm moved Moderna from Neutral to Sell, saying a share price around $200 would imply roughly $26 billion in annual oncology sales.
The decline followed a 3.13% gain Tuesday, when Moderna closed at $203.46 after reaching a new 52-week high of $208.90. At $187.76, the premarket price was about 10.1% below Tuesday’s intraday high.
Meanwhile, Moderna Tokenized bStock (MRNAB) was trading at $187.79, down 3.91% over the previous 24 hours, according to CoinMarketCap. Because MRNAB trades around the clock, its 24-hour percentage change covers a different period from Moderna’s Nasdaq premarket move.
#CryptonewswithJack
The decline followed a 3.13% gain Tuesday, when Moderna closed at $203.46 after reaching a new 52-week high of $208.90. At $187.76, the premarket price was about 10.1% below Tuesday’s intraday high.
Meanwhile, Moderna Tokenized bStock (MRNAB) was trading at $187.79, down 3.91% over the previous 24 hours, according to CoinMarketCap. Because MRNAB trades around the clock, its 24-hour percentage change covers a different period from Moderna’s Nasdaq premarket move.
#CryptonewswithJack
127
Log in to explore more content
Join global crypto users on Binance Square
⚡️ Get latest and useful information about crypto.
💬 Trusted by the world’s largest crypto exchange.
👍 Discover real insights from verified creators.
Email / Phone number
Trending Topics
ADAGains10%Above$0.27
681 views
40 Discussing
#ADAGains10%Above$0.27
$ADA IS FINALLY WAKING UP 👀
Cardano's $ADA just jumped 10% in 24 hours, pushing above $0.27 for the first time since May.
The move comes as attention builds around Cardano's RealFi ecosystem and the upcoming Dijkstra scalability upgrade.
After months of slow price action, $ADA is suddenly back on traders' radar.
#ADA #Cardano #crypto #altcoins
Albertc07
·0 Likes
·121 views
ETHUp70%InQ3ButLiquidityFalls
10,022 views
225 Discussing
EthStakingExitQueueHits2026High
4,056 views
253 Discussing