
Treder Expart
581 Posts

Treder Expart
Report
Block User
22 Following
29 Followers
102 Liked
Posts
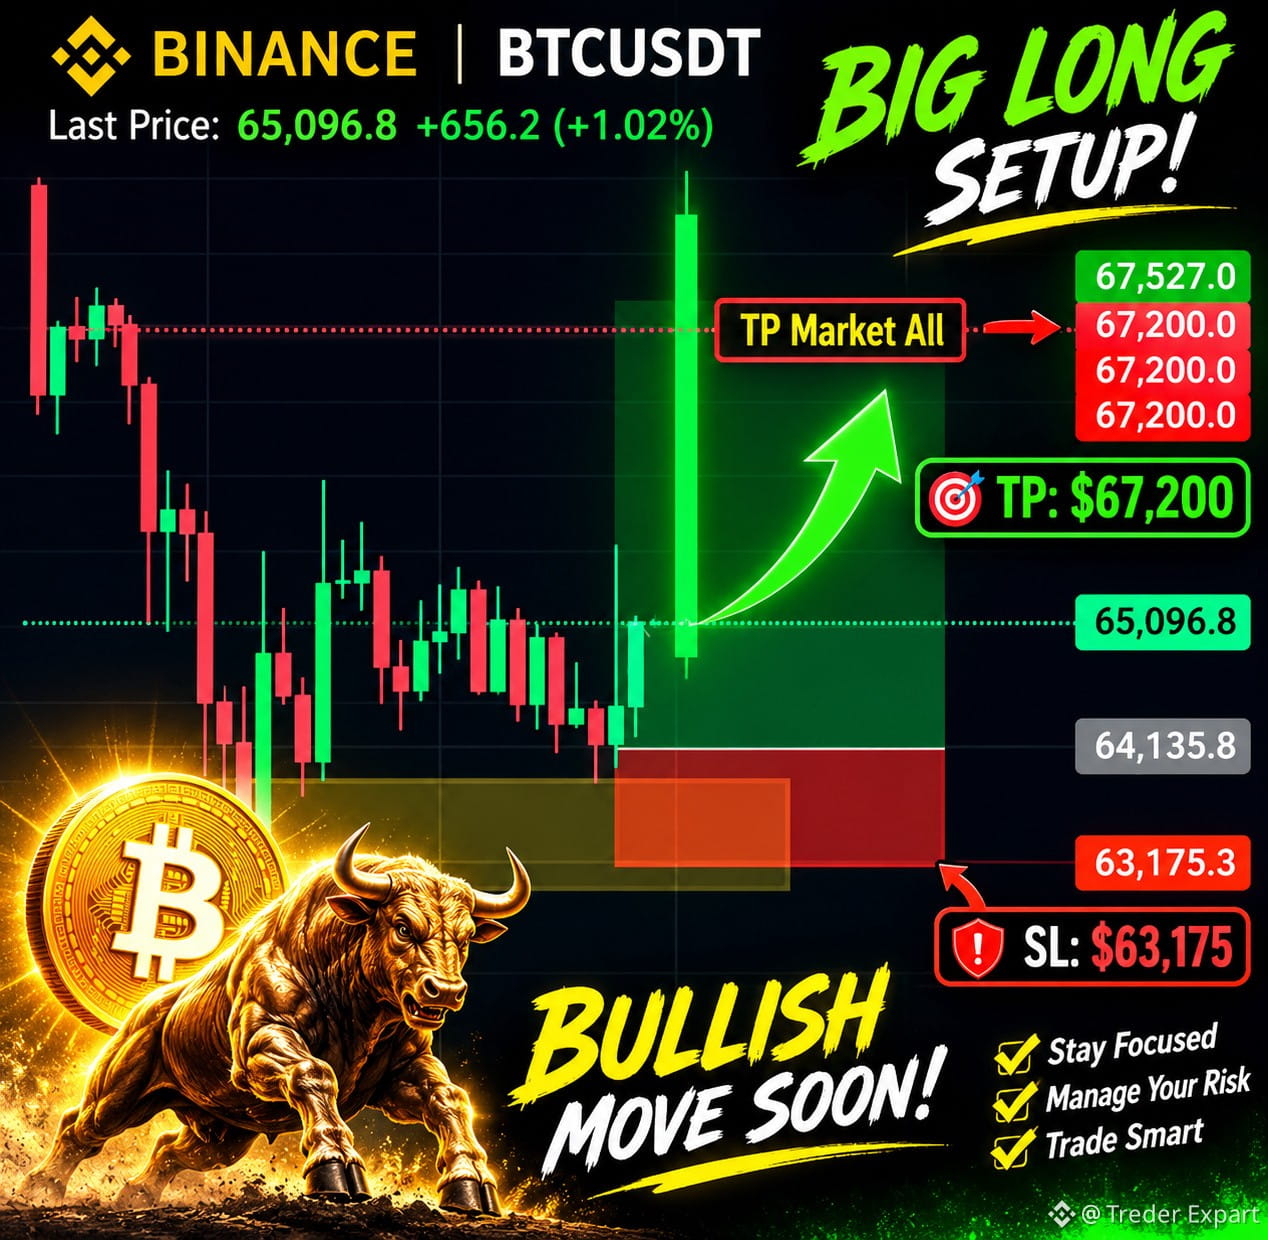
THE SHAKEOUT IS PART OF THE GAME!
Everything happening in the market could be shaking out weak hands before the next massive crypto rally.
$BTC → $200,000 $ETH → $5,000 Altcoins → Potential 30x–50x opportunities
The real question is: Will you stay patient while the market tests your conviction, or exit before the next big move?
Strong hands stay focused. Smart traders manage risk.
The next bull run could be legendary!
BTC #ETH Altcoins #CryptoBullRun Binance
THE SHAKEOUT IS PART OF THE GAME!
Everything happening in the market could be shaking out weak hands before the next massive crypto rally.
$BTC → $200,000 $ETH → $5,000 Altcoins → Potential 30x–50x opportunities
The real question is: Will you stay patient while the market tests your conviction, or exit before the next big move?
Strong hands stay focused. Smart traders manage risk.
The next bull run could be legendary!
BTC #ETH Altcoins #CryptoBullRun Binance
Everything happening in the market could be shaking out weak hands before the next massive crypto rally.
$BTC → $200,000 $ETH → $5,000 Altcoins → Potential 30x–50x opportunities
The real question is: Will you stay patient while the market tests your conviction, or exit before the next big move?
Strong hands stay focused. Smart traders manage risk.
The next bull run could be legendary!
BTC #ETH Altcoins #CryptoBullRun Binance
3
🚨 BTC & ETH AT A CRITICAL TURNING POINT!
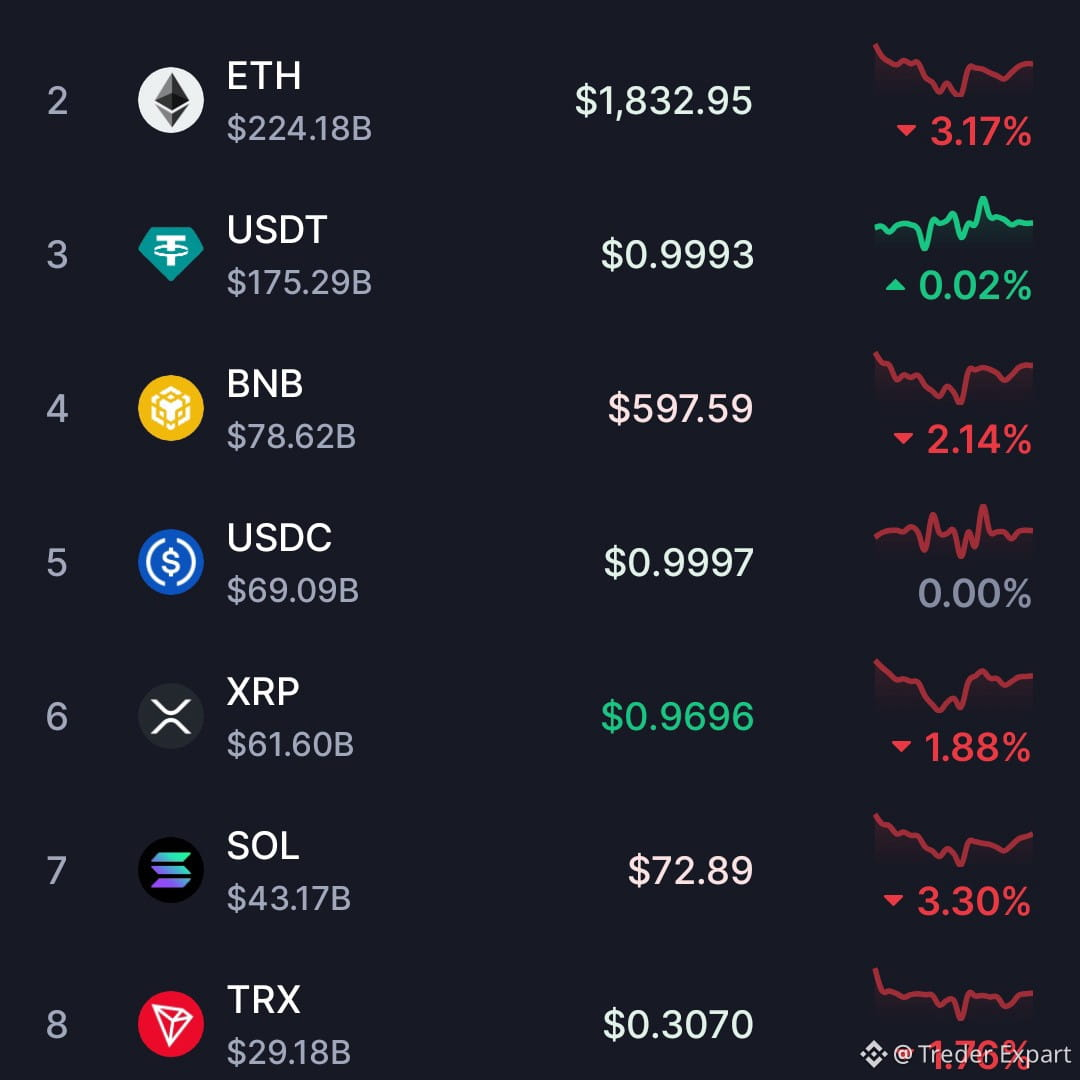
Fam, the big question is: $BTC to $70,000 and $ETH to $2,000, or another massive dump?
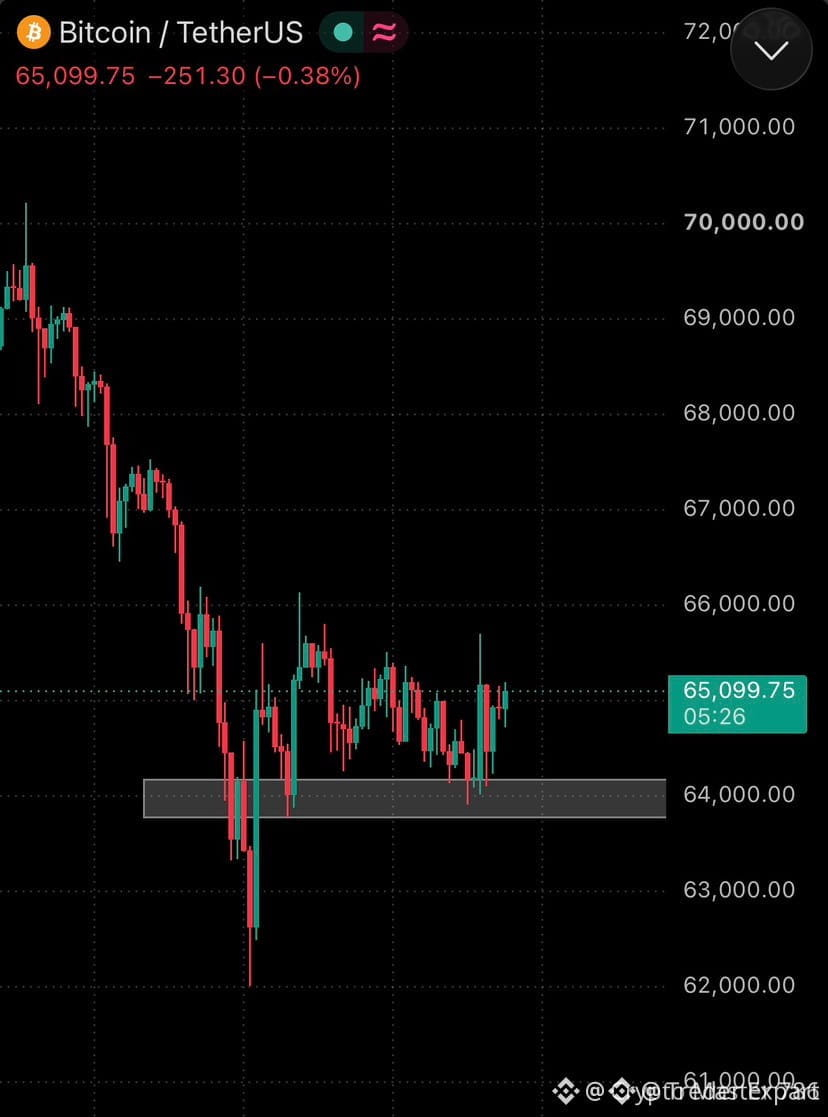
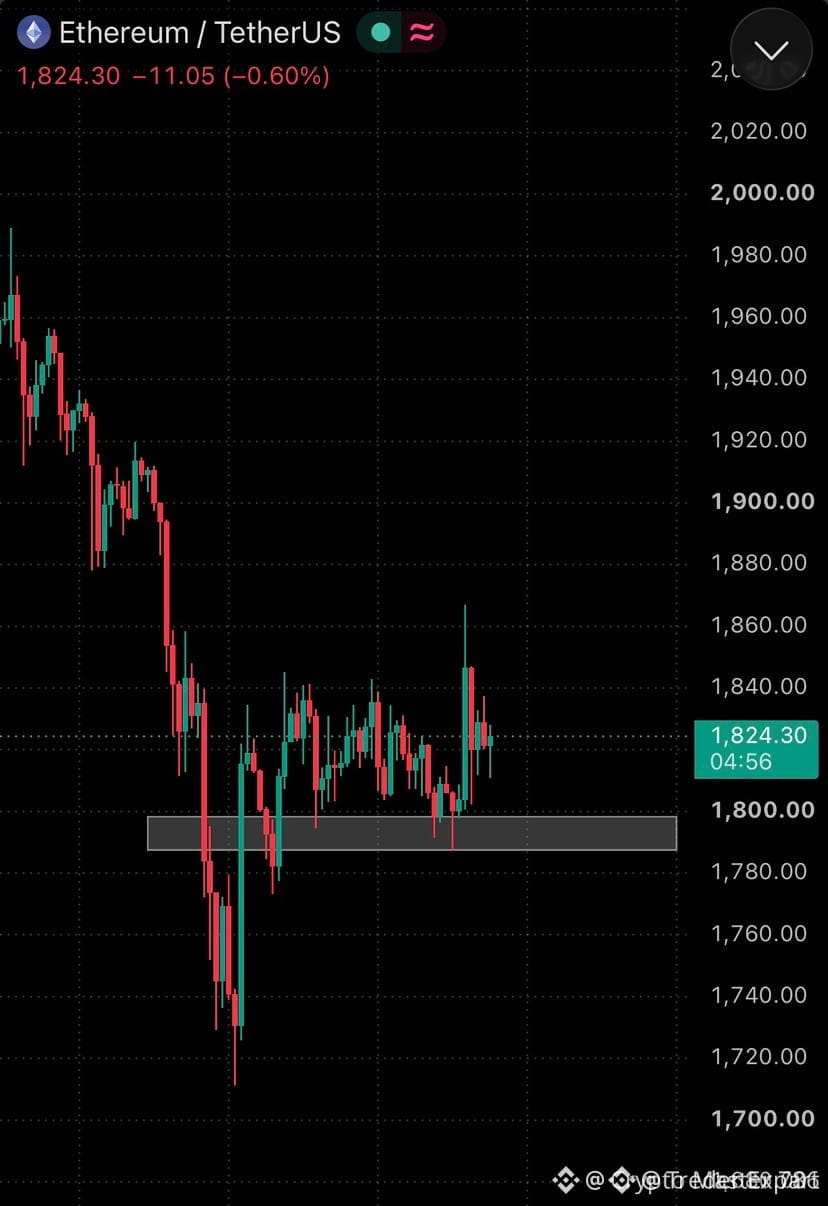
After the recent heavy sell-off, both Bitcoin and Ethereum are approaching crucial support zones.
Current Market Levels:
$BTC : Around $65,100
$ETH: Around $1,824
Bulls are trying to defend support, but a strong recovery is still waiting for confirmation.
Two Possible Scenarios: Bullish: BTC targets $70K | ETH targets $2K. Bearish: Another breakdown could trigger a fresh wave of selling.
My strategy: No unnecessary entries. Stay patient, protect your capital, and wait for clear confirmation before taking a position.
The next move could be HUGE!
What do you think, fam? BULLISH RECOVERY or ANOTHER BIG DUMP?
#BTC #ETH Bitcoin #Ethereum CryptoMarket Binance
🚨 BTC & ETH AT A CRITICAL TURNING POINT!
Fam, the big question is: $BTC to $70,000 and $ETH to $2,000, or another massive dump?
After the recent heavy sell-off, both Bitcoin and Ethereum are approaching crucial support zones.
Current Market Levels:
$BTC : Around $65,100
$ETH: Around $1,824
Bulls are trying to defend support, but a strong recovery is still waiting for confirmation.
Two Possible Scenarios: Bullish: BTC targets $70K | ETH targets $2K. Bearish: Another breakdown could trigger a fresh wave of selling.
My strategy: No unnecessary entries. Stay patient, protect your capital, and wait for clear confirmation before taking a position.
The next move could be HUGE!
What do you think, fam? BULLISH RECOVERY or ANOTHER BIG DUMP?
#BTC #ETH Bitcoin #Ethereum CryptoMarket Binance
Fam, the big question is: $BTC to $70,000 and $ETH to $2,000, or another massive dump?
After the recent heavy sell-off, both Bitcoin and Ethereum are approaching crucial support zones.
Current Market Levels:
$BTC : Around $65,100
$ETH: Around $1,824
Bulls are trying to defend support, but a strong recovery is still waiting for confirmation.
Two Possible Scenarios: Bullish: BTC targets $70K | ETH targets $2K. Bearish: Another breakdown could trigger a fresh wave of selling.
My strategy: No unnecessary entries. Stay patient, protect your capital, and wait for clear confirmation before taking a position.
The next move could be HUGE!
What do you think, fam? BULLISH RECOVERY or ANOTHER BIG DUMP?
#BTC #ETH Bitcoin #Ethereum CryptoMarket Binance
7
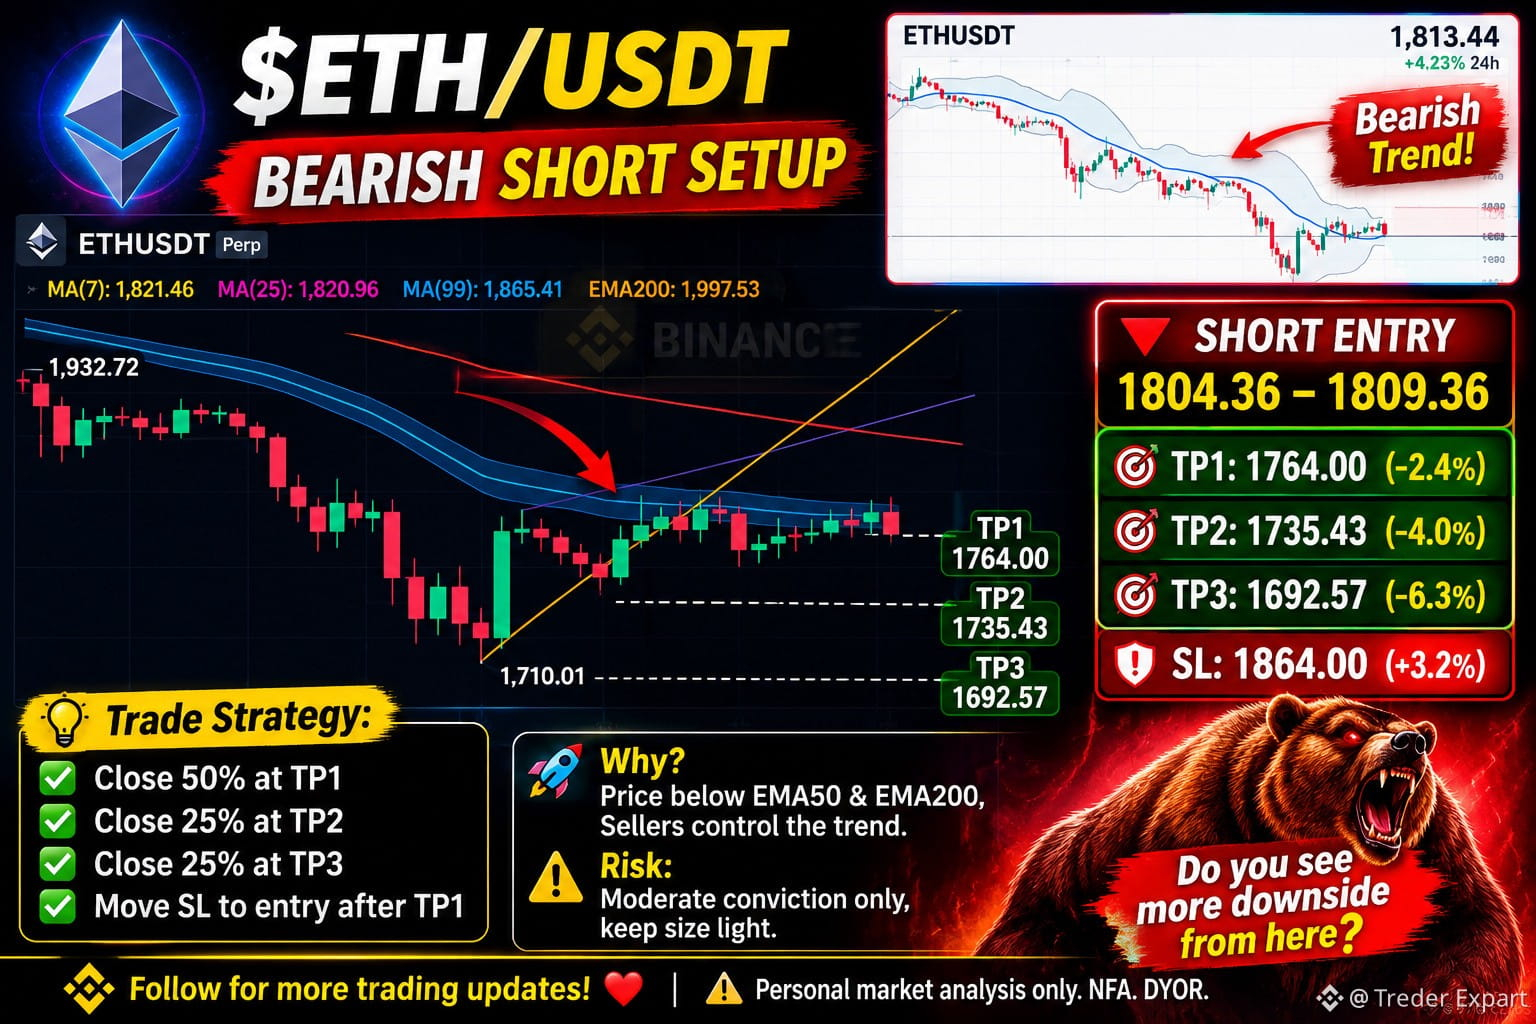
$ETH /USDT — BEARISH SHORT SETUP
The 4H chart is showing a clear bearish structure!
ETH remains below EMA50 and EMA200, indicating that sellers are still dominating the trend.
SHORT ENTRY: 1804.36 – 1809.36
TAKE PROFIT TARGETS:
TP1: 1764.00 (-2.4%)
TP2: 1735.43 (-4.0%)
TP3: 1692.57 (-6.3%)
STOP LOSS: 1864.00 (+3.2%)
TRADE STRATEGY:
Close 50% at TP1.
Close 25% at TP2.
Close remaining 25% at TP3.
Move SL to breakeven after TP1.
RISK MANAGEMENT: Moderate conviction setup. Keep your position size small and manage risk carefully.
ETH is showing relative strength compared with BTC (+1.33% over 24H), so watch for a possible bounce before entering.
What's your prediction? Will ETH continue dumping or surprise the bears with a reversal?
Follow for more trading updates!
Personal market analysis only. NFA. DYOR.
Educational content only — not investment advice or a recommendation to buy, sell, deposit, or withdraw any asset. No paid promotions or referral/affiliate links.
$ETH /USDT — BEARISH SHORT SETUP
The 4H chart is showing a clear bearish structure!
ETH remains below EMA50 and EMA200, indicating that sellers are still dominating the trend.
SHORT ENTRY: 1804.36 – 1809.36
TAKE PROFIT TARGETS:
TP1: 1764.00 (-2.4%)
TP2: 1735.43 (-4.0%)
TP3: 1692.57 (-6.3%)
STOP LOSS: 1864.00 (+3.2%)
TRADE STRATEGY:
Close 50% at TP1.
Close 25% at TP2.
Close remaining 25% at TP3.
Move SL to breakeven after TP1.
RISK MANAGEMENT: Moderate conviction setup. Keep your position size small and manage risk carefully.
ETH is showing relative strength compared with BTC (+1.33% over 24H), so watch for a possible bounce before entering.
What's your prediction? Will ETH continue dumping or surprise the bears with a reversal?
Follow for more trading updates!
Personal market analysis only. NFA. DYOR.
Educational content only — not investment advice or a recommendation to buy, sell, deposit, or withdraw any asset. No paid promotions or referral/affiliate links.
The 4H chart is showing a clear bearish structure!
ETH remains below EMA50 and EMA200, indicating that sellers are still dominating the trend.
SHORT ENTRY: 1804.36 – 1809.36
TAKE PROFIT TARGETS:
TP1: 1764.00 (-2.4%)
TP2: 1735.43 (-4.0%)
TP3: 1692.57 (-6.3%)
STOP LOSS: 1864.00 (+3.2%)
TRADE STRATEGY:
Close 50% at TP1.
Close 25% at TP2.
Close remaining 25% at TP3.
Move SL to breakeven after TP1.
RISK MANAGEMENT: Moderate conviction setup. Keep your position size small and manage risk carefully.
ETH is showing relative strength compared with BTC (+1.33% over 24H), so watch for a possible bounce before entering.
What's your prediction? Will ETH continue dumping or surprise the bears with a reversal?
Follow for more trading updates!
Personal market analysis only. NFA. DYOR.
Educational content only — not investment advice or a recommendation to buy, sell, deposit, or withdraw any asset. No paid promotions or referral/affiliate links.
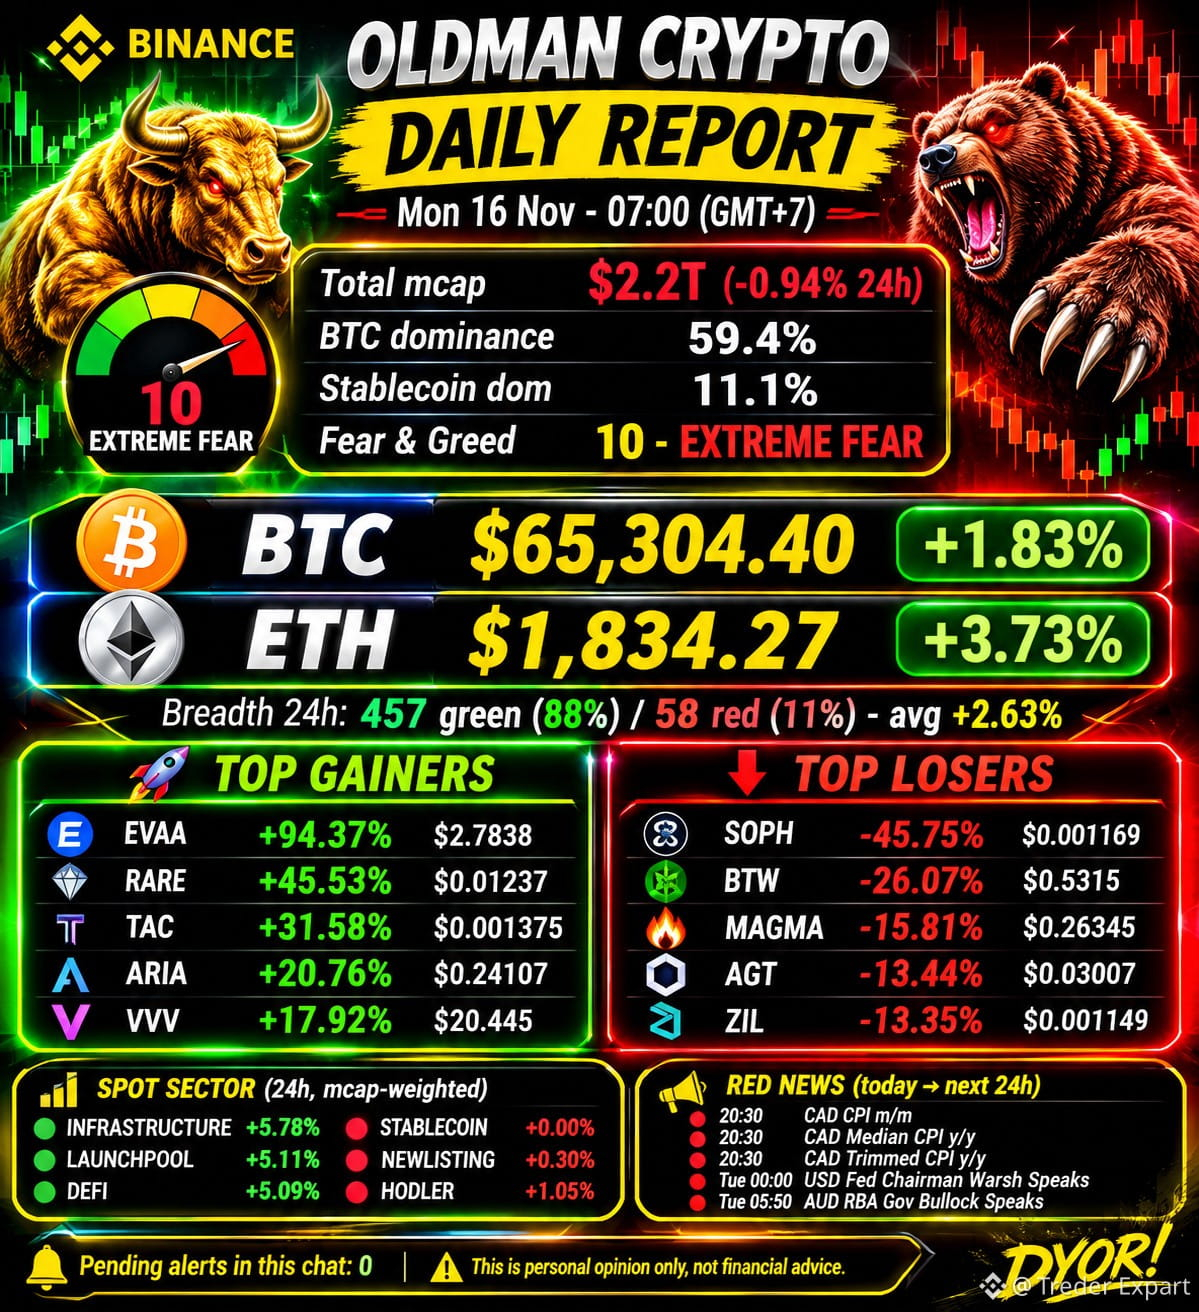
CRYPTO DAILY MARKET REPORT
Monday, November 16 | 07:00 (GMT+7)
GLOBAL MARKET OVERVIEW
Total Market Cap: $2.2T (-0.94% in 24H)
₿ BTC Dominance: 59.4%
⟠ ETH Dominance: 10.1%
Stablecoin Dominance: 11.1% (USDT + USDC)
Fear & Greed Index: 10 — EXTREME FEAR
MAJOR CRYPTO PRICES
₿ BTC: $65,304.40 (+1.83%)
⟠ ETH: $1,834.27 (+3.73%)
MARKET BREADTH (24H)
Gainers: 457 (88%)
Losers: 58 (11%)
Average Performance: +2.63%
Total Pairs: 518
TOP FUTURES GAINERS (24H)
EVAA: +94.37% | $2.7838
RARE: +45.53% | $0.01237
TAC: +31.58% | $0.001375
ARIA: +20.76% | $0.24107
VVV: +17.92% | $20.445
TOP FUTURES LOSERS (24H)
SOPH: -45.75% | $0.001169
BTW: -26.07% | $0.5315
MAGMA: -15.81% | $0.26345
AGT: -13.44% | $0.03007
ZIL: -13.35% | $0.001149
SPOT SECTOR PERFORMANCE (24H)
Infrastructure: +5.76%
Launchpool: +5.11%
DeFi: +5.09%
Stablecoin: +0.00%
New Listing: +0.30%
HODLER: +1.05%
UPCOMING HIGH-IMPACT ECONOMIC EVENTS
20:30 — CAD CPI m/m
20:30 — CAD Median CPI y/y
20:30 — CAD Trimmed CPI y/y
Tuesday 00:00 — USD Fed Chairman Warsh Speaks
Tuesday 05:50 — AUD RBA Governor Bullock Speaks
Pending Alerts: 0
MARKET TAKEAWAY
The market is showing mixed signals. BTC and ETH are gaining, while the Fear & Greed Index remains at Extreme Fear.
Some futures altcoins are experiencing massive gains, while others continue facing heavy selling pressure.
Stay alert, manage your risk, and watch upcoming economic events!
Personal opinions only. Not financial advice or a recommendation to buy or sell. Crypto trading involves significant risk. DYOR and take full responsibility for your decisions. No coin promotion.
#Bitcoin Crypto #DailyReport MarketUpdate #Binance
CRYPTO DAILY MARKET REPORT
Monday, November 16 | 07:00 (GMT+7)
GLOBAL MARKET OVERVIEW
Total Market Cap: $2.2T (-0.94% in 24H)
₿ BTC Dominance: 59.4%
⟠ ETH Dominance: 10.1%
Stablecoin Dominance: 11.1% (USDT + USDC)
Fear & Greed Index: 10 — EXTREME FEAR
MAJOR CRYPTO PRICES
₿ BTC: $65,304.40 (+1.83%)
⟠ ETH: $1,834.27 (+3.73%)
MARKET BREADTH (24H)
Gainers: 457 (88%)
Losers: 58 (11%)
Average Performance: +2.63%
Total Pairs: 518
TOP FUTURES GAINERS (24H)
EVAA: +94.37% | $2.7838
RARE: +45.53% | $0.01237
TAC: +31.58% | $0.001375
ARIA: +20.76% | $0.24107
VVV: +17.92% | $20.445
TOP FUTURES LOSERS (24H)
SOPH: -45.75% | $0.001169
BTW: -26.07% | $0.5315
MAGMA: -15.81% | $0.26345
AGT: -13.44% | $0.03007
ZIL: -13.35% | $0.001149
SPOT SECTOR PERFORMANCE (24H)
Infrastructure: +5.76%
Launchpool: +5.11%
DeFi: +5.09%
Stablecoin: +0.00%
New Listing: +0.30%
HODLER: +1.05%
UPCOMING HIGH-IMPACT ECONOMIC EVENTS
20:30 — CAD CPI m/m
20:30 — CAD Median CPI y/y
20:30 — CAD Trimmed CPI y/y
Tuesday 00:00 — USD Fed Chairman Warsh Speaks
Tuesday 05:50 — AUD RBA Governor Bullock Speaks
Pending Alerts: 0
MARKET TAKEAWAY
The market is showing mixed signals. BTC and ETH are gaining, while the Fear & Greed Index remains at Extreme Fear.
Some futures altcoins are experiencing massive gains, while others continue facing heavy selling pressure.
Stay alert, manage your risk, and watch upcoming economic events!
Personal opinions only. Not financial advice or a recommendation to buy or sell. Crypto trading involves significant risk. DYOR and take full responsibility for your decisions. No coin promotion.
#Bitcoin Crypto #DailyReport MarketUpdate #Binance
Monday, November 16 | 07:00 (GMT+7)
GLOBAL MARKET OVERVIEW
Total Market Cap: $2.2T (-0.94% in 24H)
₿ BTC Dominance: 59.4%
⟠ ETH Dominance: 10.1%
Stablecoin Dominance: 11.1% (USDT + USDC)
Fear & Greed Index: 10 — EXTREME FEAR
MAJOR CRYPTO PRICES
₿ BTC: $65,304.40 (+1.83%)
⟠ ETH: $1,834.27 (+3.73%)
MARKET BREADTH (24H)
Gainers: 457 (88%)
Losers: 58 (11%)
Average Performance: +2.63%
Total Pairs: 518
TOP FUTURES GAINERS (24H)
EVAA: +94.37% | $2.7838
RARE: +45.53% | $0.01237
TAC: +31.58% | $0.001375
ARIA: +20.76% | $0.24107
VVV: +17.92% | $20.445
TOP FUTURES LOSERS (24H)
SOPH: -45.75% | $0.001169
BTW: -26.07% | $0.5315
MAGMA: -15.81% | $0.26345
AGT: -13.44% | $0.03007
ZIL: -13.35% | $0.001149
SPOT SECTOR PERFORMANCE (24H)
Infrastructure: +5.76%
Launchpool: +5.11%
DeFi: +5.09%
Stablecoin: +0.00%
New Listing: +0.30%
HODLER: +1.05%
UPCOMING HIGH-IMPACT ECONOMIC EVENTS
20:30 — CAD CPI m/m
20:30 — CAD Median CPI y/y
20:30 — CAD Trimmed CPI y/y
Tuesday 00:00 — USD Fed Chairman Warsh Speaks
Tuesday 05:50 — AUD RBA Governor Bullock Speaks
Pending Alerts: 0
MARKET TAKEAWAY
The market is showing mixed signals. BTC and ETH are gaining, while the Fear & Greed Index remains at Extreme Fear.
Some futures altcoins are experiencing massive gains, while others continue facing heavy selling pressure.
Stay alert, manage your risk, and watch upcoming economic events!
Personal opinions only. Not financial advice or a recommendation to buy or sell. Crypto trading involves significant risk. DYOR and take full responsibility for your decisions. No coin promotion.
#Bitcoin Crypto #DailyReport MarketUpdate #Binance
10
THE CRYPTO MARKET IS GETTING HARDER — LOOK AT THE BIGGER PICTURE!
Sometimes, you need to look at the market from the opposite perspective to understand what's really happening.
This downturn has been brutal, and so far, the recovery has been extremely weak.
The warning signs started appearing back in October:
Smaller exchanges began facing financial trouble and shutting down.
Another exchange suffered a major security breach.
Midterm election developments added further uncertainty to the market.
Interest rate concerns continued putting pressure on risk assets.
US stocks remained near elevated levels, increasing market uncertainty.
NVIDIA and the AI sector faced growing attention amid leadership and capital-flow speculation.
Anthropic's potential public-market ambitions added another layer of uncertainty around investment flows.
For struggling crypto investors, it feels like one negative development after another.
The reality is that market sentiment has changed dramatically.
Crypto is becoming increasingly difficult to enjoy when volatility rises, confidence weakens, and recovery attempts keep failing.
Not every dip is an opportunity. Not every rally means a new bull run.
Sometimes, protecting your capital is more important than chasing profits.
Stay patient. Manage your risk. Protect your principal.
#Bitcoin CryptoMarket #BTC Trading #CryptoNews RiskManagement
THE CRYPTO MARKET IS GETTING HARDER — LOOK AT THE BIGGER PICTURE!
Sometimes, you need to look at the market from the opposite perspective to understand what's really happening.
This downturn has been brutal, and so far, the recovery has been extremely weak.
The warning signs started appearing back in October:
Smaller exchanges began facing financial trouble and shutting down.
Another exchange suffered a major security breach.
Midterm election developments added further uncertainty to the market.
Interest rate concerns continued putting pressure on risk assets.
US stocks remained near elevated levels, increasing market uncertainty.
NVIDIA and the AI sector faced growing attention amid leadership and capital-flow speculation.
Anthropic's potential public-market ambitions added another layer of uncertainty around investment flows.
For struggling crypto investors, it feels like one negative development after another.
The reality is that market sentiment has changed dramatically.
Crypto is becoming increasingly difficult to enjoy when volatility rises, confidence weakens, and recovery attempts keep failing.
Not every dip is an opportunity. Not every rally means a new bull run.
Sometimes, protecting your capital is more important than chasing profits.
Stay patient. Manage your risk. Protect your principal.
#Bitcoin CryptoMarket #BTC Trading #CryptoNews RiskManagement
Sometimes, you need to look at the market from the opposite perspective to understand what's really happening.
This downturn has been brutal, and so far, the recovery has been extremely weak.
The warning signs started appearing back in October:
Smaller exchanges began facing financial trouble and shutting down.
Another exchange suffered a major security breach.
Midterm election developments added further uncertainty to the market.
Interest rate concerns continued putting pressure on risk assets.
US stocks remained near elevated levels, increasing market uncertainty.
NVIDIA and the AI sector faced growing attention amid leadership and capital-flow speculation.
Anthropic's potential public-market ambitions added another layer of uncertainty around investment flows.
For struggling crypto investors, it feels like one negative development after another.
The reality is that market sentiment has changed dramatically.
Crypto is becoming increasingly difficult to enjoy when volatility rises, confidence weakens, and recovery attempts keep failing.
Not every dip is an opportunity. Not every rally means a new bull run.
Sometimes, protecting your capital is more important than chasing profits.
Stay patient. Manage your risk. Protect your principal.
#Bitcoin CryptoMarket #BTC Trading #CryptoNews RiskManagement
30
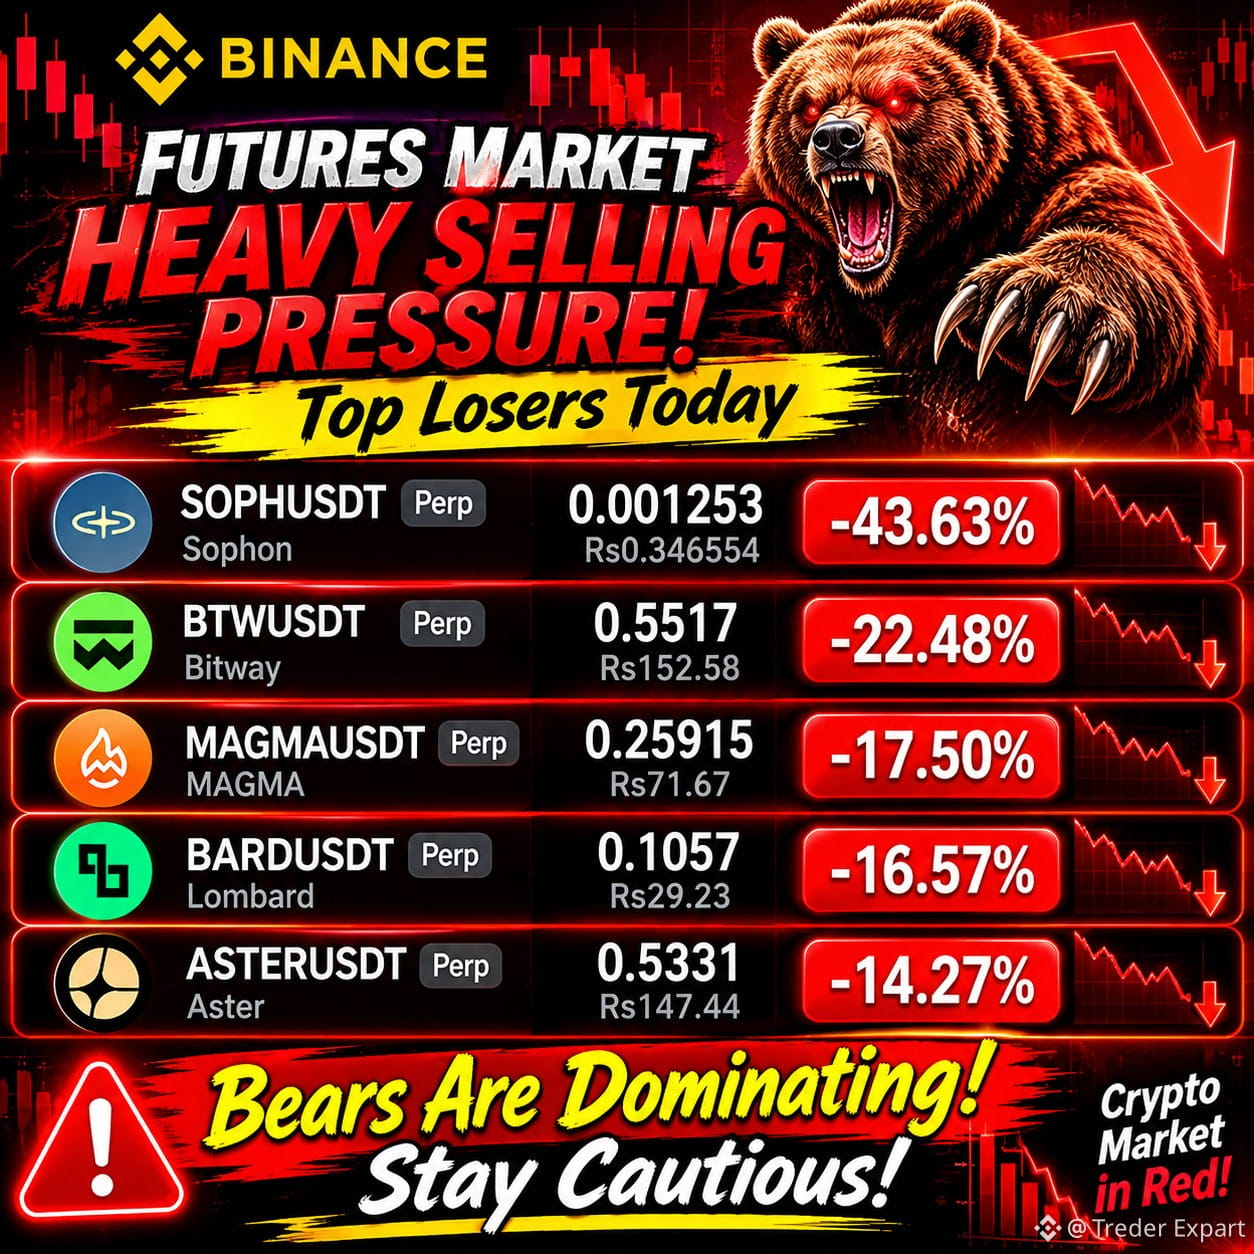
🚨 FUTURES MARKET UNDER HEAVY SELLING PRESSURE!
Bears are taking control, and several altcoins are facing massive losses!
$SOPH : Down a staggering 43.63% $BTW : Facing strong selling pressure $MAGMA : Bears are gaining momentum
Sellers are dominating these markets, and volatility could increase further.
Don't rush into trades. Watch key support levels and manage your risk carefully.
The bears are in control. Stay alert!
#Crypto FuturesTrading #SOPH #BTW #MAGMA Binance
🚨 FUTURES MARKET UNDER HEAVY SELLING PRESSURE!
Bears are taking control, and several altcoins are facing massive losses!
$SOPH : Down a staggering 43.63% $BTW : Facing strong selling pressure $MAGMA : Bears are gaining momentum
Sellers are dominating these markets, and volatility could increase further.
Don't rush into trades. Watch key support levels and manage your risk carefully.
The bears are in control. Stay alert!
#Crypto FuturesTrading #SOPH #BTW #MAGMA Binance
Bears are taking control, and several altcoins are facing massive losses!
$SOPH : Down a staggering 43.63% $BTW : Facing strong selling pressure $MAGMA : Bears are gaining momentum
Sellers are dominating these markets, and volatility could increase further.
Don't rush into trades. Watch key support levels and manage your risk carefully.
The bears are in control. Stay alert!
#Crypto FuturesTrading #SOPH #BTW #MAGMA Binance
49
🚨 NVIDIA SHOCKING NEWS! JENSEN HUANG COULD BE MAKING A COMEBACK!
November 16 — A major development is reportedly unfolding around NVIDIA ($NVDA).
According to the Financial Times, Jensen Huang is considering a possible return to NVIDIA as CEO.
Here's what makes this story even more interesting:
→ Huang has reportedly discussed the possibility of returning with close associates.
→ His allies are reportedly forming a “WAR ROOM” of influential Silicon Valley executives.
→ The group aims to lobby for his reinstatement.
→ They are also seeking support from the White House.
If this reported comeback effort gains momentum, it could become a major development for NVIDIA and the broader AI industry.
Could Jensen Huang's potential return reshape NVIDIA's future?
Keep watching. This story could get BIG!
$NVDA | #NVIDIA #JensenHuang AI #TechNews StockMarket
🚨 NVIDIA SHOCKING NEWS! JENSEN HUANG COULD BE MAKING A COMEBACK!
November 16 — A major development is reportedly unfolding around NVIDIA ($NVDA ).
According to the Financial Times, Jensen Huang is considering a possible return to NVIDIA as CEO.
Here's what makes this story even more interesting:
→ Huang has reportedly discussed the possibility of returning with close associates.
→ His allies are reportedly forming a “WAR ROOM” of influential Silicon Valley executives.
→ The group aims to lobby for his reinstatement.
→ They are also seeking support from the White House.
If this reported comeback effort gains momentum, it could become a major development for NVIDIA and the broader AI industry.
Could Jensen Huang's potential return reshape NVIDIA's future?
Keep watching. This story could get BIG!
$NVDA | #NVIDIA #JensenHuang AI #TechNews StockMarket
November 16 — A major development is reportedly unfolding around NVIDIA ($NVDA ).
According to the Financial Times, Jensen Huang is considering a possible return to NVIDIA as CEO.
Here's what makes this story even more interesting:
→ Huang has reportedly discussed the possibility of returning with close associates.
→ His allies are reportedly forming a “WAR ROOM” of influential Silicon Valley executives.
→ The group aims to lobby for his reinstatement.
→ They are also seeking support from the White House.
If this reported comeback effort gains momentum, it could become a major development for NVIDIA and the broader AI industry.
Could Jensen Huang's potential return reshape NVIDIA's future?
Keep watching. This story could get BIG!
$NVDA | #NVIDIA #JensenHuang AI #TechNews StockMarket
56
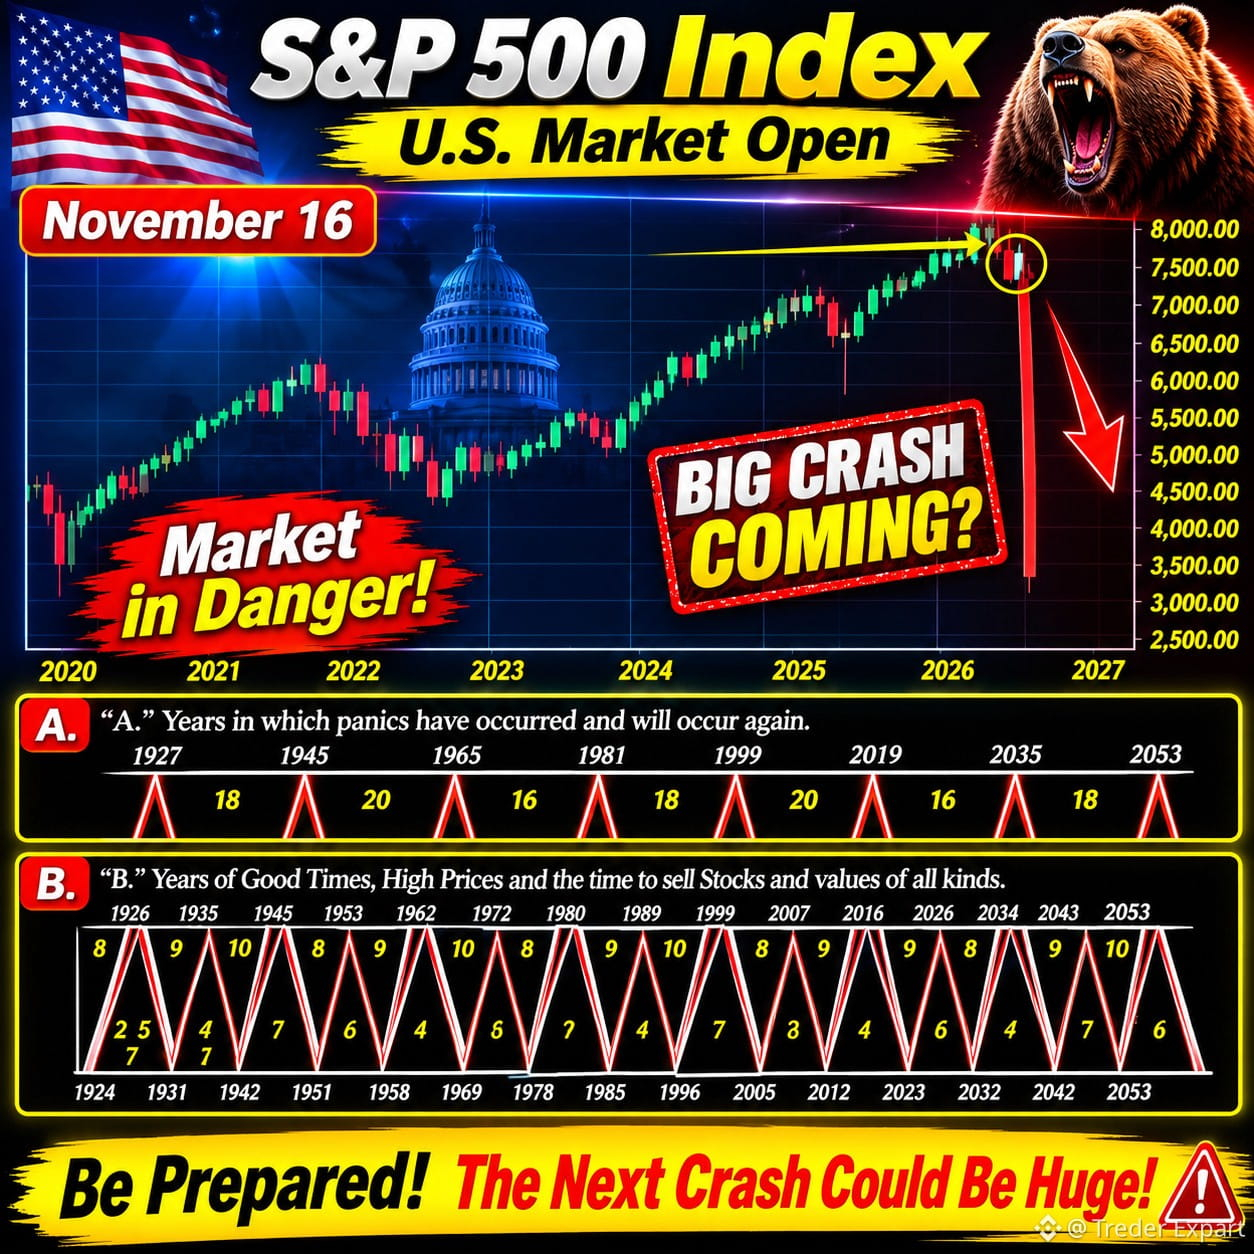
🚨 GLOBAL MARKET WARNING: SOMETHING BIG IS HAPPENING BEHIND THE SCENES!
Everyone is focused on the AI bubble, rising inflation, and Bitcoin's recent crash.
But the real danger may be coming from somewhere most investors aren't watching: THE GLOBAL BOND MARKET.
Here are the warning signs you shouldn't ignore:
China and Japan are selling massive amounts of US government bonds.
US Treasury yields are rising rapidly.
Inflation remains a serious concern.
China's AI stocks have plunged nearly 50%.
The Federal Reserve is injecting billions in liquidity to support financial market stability.
Tensions around the Strait of Hormuz are creating major risks for global oil supplies.
But here's where things get REALLY interesting.
When major countries sell US bonds, other investors must absorb that supply.
But new buyers may demand higher returns, pushing Treasury yields even higher.
And that creates a dangerous chain reaction:
→ Higher yields make borrowing more expensive. → Businesses and consumers face increasing financial pressure. → Stocks, real estate, and crypto could experience additional selling pressure. → Rising oil prices could fuel another inflation wave. → Persistent inflation could force the Fed to keep interest rates higher for longer.
And don't overlook China's AI sector.
If confidence in AI companies continues to weaken, selling pressure could spread across global markets.
Now look at the Federal Reserve.
Adding liquidity may help stabilize financial markets, but it doesn't automatically solve inflation.
That's the real dilemma.
The global economy could be facing a difficult combination of rising yields, persistent inflation, geopolitical risks, and weakening investor confidence.
Most investors are watching Bitcoin and stock prices.
But the bigger warning signals may be hiding in the bond market, Treasury yields, and global liquidity.
Watch the bigger picture. The next major market move could surprise millions of investors.
Are you prepared?
$BTC | $SOL | $ETH
#Bitcoin #Crypto
🚨 GLOBAL MARKET WARNING: SOMETHING BIG IS HAPPENING BEHIND THE SCENES!
Everyone is focused on the AI bubble, rising inflation, and Bitcoin's recent crash.
But the real danger may be coming from somewhere most investors aren't watching: THE GLOBAL BOND MARKET.
Here are the warning signs you shouldn't ignore:
China and Japan are selling massive amounts of US government bonds.
US Treasury yields are rising rapidly.
Inflation remains a serious concern.
China's AI stocks have plunged nearly 50%.
The Federal Reserve is injecting billions in liquidity to support financial market stability.
Tensions around the Strait of Hormuz are creating major risks for global oil supplies.
But here's where things get REALLY interesting.
When major countries sell US bonds, other investors must absorb that supply.
But new buyers may demand higher returns, pushing Treasury yields even higher.
And that creates a dangerous chain reaction:
→ Higher yields make borrowing more expensive. → Businesses and consumers face increasing financial pressure. → Stocks, real estate, and crypto could experience additional selling pressure. → Rising oil prices could fuel another inflation wave. → Persistent inflation could force the Fed to keep interest rates higher for longer.
And don't overlook China's AI sector.
If confidence in AI companies continues to weaken, selling pressure could spread across global markets.
Now look at the Federal Reserve.
Adding liquidity may help stabilize financial markets, but it doesn't automatically solve inflation.
That's the real dilemma.
The global economy could be facing a difficult combination of rising yields, persistent inflation, geopolitical risks, and weakening investor confidence.
Most investors are watching Bitcoin and stock prices.
But the bigger warning signals may be hiding in the bond market, Treasury yields, and global liquidity.
Watch the bigger picture. The next major market move could surprise millions of investors.
Are you prepared?
$BTC | $SOL | $ETH
#Bitcoin #Crypto
Everyone is focused on the AI bubble, rising inflation, and Bitcoin's recent crash.
But the real danger may be coming from somewhere most investors aren't watching: THE GLOBAL BOND MARKET.
Here are the warning signs you shouldn't ignore:
China and Japan are selling massive amounts of US government bonds.
US Treasury yields are rising rapidly.
Inflation remains a serious concern.
China's AI stocks have plunged nearly 50%.
The Federal Reserve is injecting billions in liquidity to support financial market stability.
Tensions around the Strait of Hormuz are creating major risks for global oil supplies.
But here's where things get REALLY interesting.
When major countries sell US bonds, other investors must absorb that supply.
But new buyers may demand higher returns, pushing Treasury yields even higher.
And that creates a dangerous chain reaction:
→ Higher yields make borrowing more expensive. → Businesses and consumers face increasing financial pressure. → Stocks, real estate, and crypto could experience additional selling pressure. → Rising oil prices could fuel another inflation wave. → Persistent inflation could force the Fed to keep interest rates higher for longer.
And don't overlook China's AI sector.
If confidence in AI companies continues to weaken, selling pressure could spread across global markets.
Now look at the Federal Reserve.
Adding liquidity may help stabilize financial markets, but it doesn't automatically solve inflation.
That's the real dilemma.
The global economy could be facing a difficult combination of rising yields, persistent inflation, geopolitical risks, and weakening investor confidence.
Most investors are watching Bitcoin and stock prices.
But the bigger warning signals may be hiding in the bond market, Treasury yields, and global liquidity.
Watch the bigger picture. The next major market move could surprise millions of investors.
Are you prepared?
$BTC | $SOL | $ETH
#Bitcoin #Crypto
69
Most chart analysts spend their entire day staring at candlesticks, chasing indicators, and guessing whether the market will go up or down. Honestly, don't take every prediction seriously. Most of them are just noise.
REAL TRADING IS MUCH BIGGER THAN CANDLESTICK CHARTS.
Do you understand how global events impact the crypto market?
One statement from Trump about Iran can trigger massive volatility. One major move from a tech giant can shake investor sentiment and send billions flowing in or out of the market.
These are the macro factors every serious trader should understand.
Can your candlestick charts tell you:
Who was accumulating Bitcoin and who was distributing in 2021?
Which major players are influencing liquidity in 2026?
Who is actually making money while retail traders keep losing?
Where institutional capital is flowing next?
When you ignore fundamentals, global politics, liquidity, and institutional activity, you're trading with only half the picture.
CHARTS SHOW PRICE ACTION. FUNDAMENTALS EXPLAIN THE BIGGER STORY.
Staring at charts 24/7 and blindly predicting green or red candles isn't a trading strategy. It's gambling.
Successful trading requires independent thinking, a strong understanding of the global economy, market psychology, and the ability to connect real-world events with market movements.
Recently, several analysts noticed my copy-trading account gaining traction and wanted a share of the profits. Things didn't go as they expected, and some of their followers started paying attention to my approach instead.
I'm not interested in competing for attention.
My focus is simple: understand the market, follow the money, manage risk, and execute with conviction.
STOP CHASING CANDLES. START UNDERSTANDING THE MARKET.
#Bitcoin #CryptoTrading #MarketAnalysis #Fundamentals #MacroEconomics #TradingStrategy
Most chart analysts spend their entire day staring at candlesticks, chasing indicators, and guessing whether the market will go up or down. Honestly, don't take every prediction seriously. Most of them are just noise.
REAL TRADING IS MUCH BIGGER THAN CANDLESTICK CHARTS.
Do you understand how global events impact the crypto market?
One statement from Trump about Iran can trigger massive volatility. One major move from a tech giant can shake investor sentiment and send billions flowing in or out of the market.
These are the macro factors every serious trader should understand.
Can your candlestick charts tell you:
Who was accumulating Bitcoin and who was distributing in 2021?
Which major players are influencing liquidity in 2026?
Who is actually making money while retail traders keep losing?
Where institutional capital is flowing next?
When you ignore fundamentals, global politics, liquidity, and institutional activity, you're trading with only half the picture.
CHARTS SHOW PRICE ACTION. FUNDAMENTALS EXPLAIN THE BIGGER STORY.
Staring at charts 24/7 and blindly predicting green or red candles isn't a trading strategy. It's gambling.
Successful trading requires independent thinking, a strong understanding of the global economy, market psychology, and the ability to connect real-world events with market movements.
Recently, several analysts noticed my copy-trading account gaining traction and wanted a share of the profits. Things didn't go as they expected, and some of their followers started paying attention to my approach instead.
I'm not interested in competing for attention.
My focus is simple: understand the market, follow the money, manage risk, and execute with conviction.
STOP CHASING CANDLES. START UNDERSTANDING THE MARKET.
#Bitcoin #CryptoTrading #MarketAnalysis #Fundamentals #MacroEconomics #TradingStrategy
REAL TRADING IS MUCH BIGGER THAN CANDLESTICK CHARTS.
Do you understand how global events impact the crypto market?
One statement from Trump about Iran can trigger massive volatility. One major move from a tech giant can shake investor sentiment and send billions flowing in or out of the market.
These are the macro factors every serious trader should understand.
Can your candlestick charts tell you:
Who was accumulating Bitcoin and who was distributing in 2021?
Which major players are influencing liquidity in 2026?
Who is actually making money while retail traders keep losing?
Where institutional capital is flowing next?
When you ignore fundamentals, global politics, liquidity, and institutional activity, you're trading with only half the picture.
CHARTS SHOW PRICE ACTION. FUNDAMENTALS EXPLAIN THE BIGGER STORY.
Staring at charts 24/7 and blindly predicting green or red candles isn't a trading strategy. It's gambling.
Successful trading requires independent thinking, a strong understanding of the global economy, market psychology, and the ability to connect real-world events with market movements.
Recently, several analysts noticed my copy-trading account gaining traction and wanted a share of the profits. Things didn't go as they expected, and some of their followers started paying attention to my approach instead.
I'm not interested in competing for attention.
My focus is simple: understand the market, follow the money, manage risk, and execute with conviction.
STOP CHASING CANDLES. START UNDERSTANDING THE MARKET.
#Bitcoin #CryptoTrading #MarketAnalysis #Fundamentals #MacroEconomics #TradingStrategy
82
Another brutal one-sided dump!
The crypto market can be ruthless, but there's still love and positivity in this world.
Stay strong, keep smiling, and enjoy the journey.
Cheers, everyone!
Crypto #Bitcoin Trading #StayStrong
Another brutal one-sided dump!
The crypto market can be ruthless, but there's still love and positivity in this world.
Stay strong, keep smiling, and enjoy the journey.
Cheers, everyone!
Crypto #Bitcoin Trading #StayStrong
The crypto market can be ruthless, but there's still love and positivity in this world.
Stay strong, keep smiling, and enjoy the journey.
Cheers, everyone!
Crypto #Bitcoin Trading #StayStrong

8
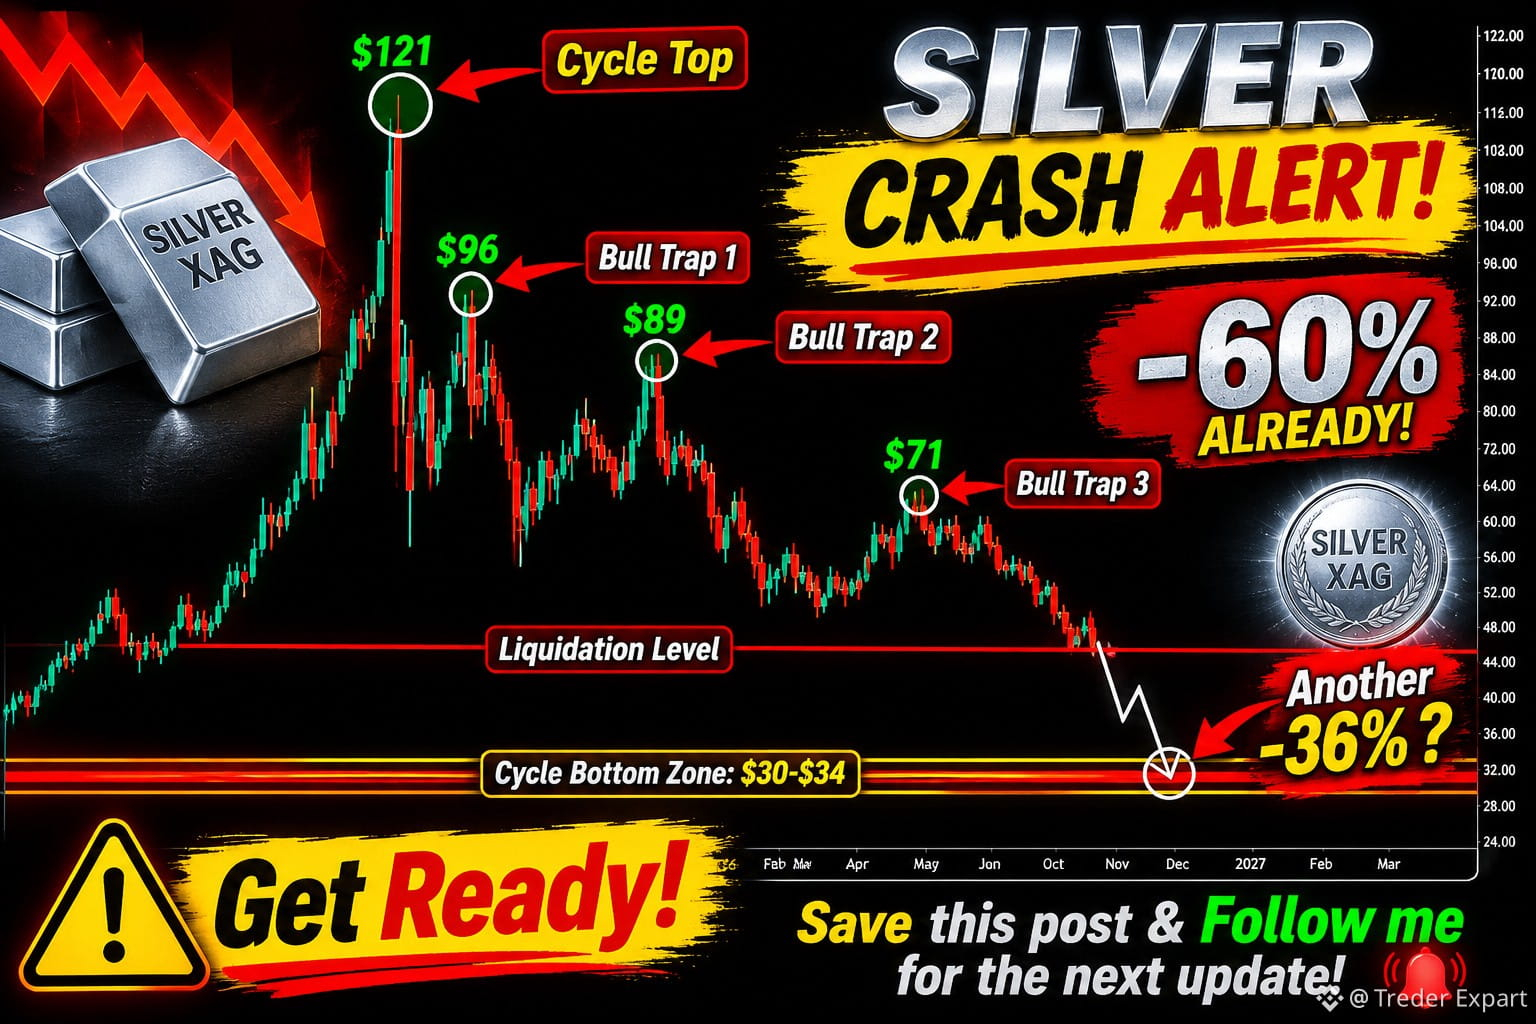
🚨 SILVER CRASH ALERT!
SILVER HAS PLUNGED BY 60% — AND THERE'S A REASON!
I warned about this potential crash 11 MONTHS AGO. Now, Silver appears to be entering another critical liquidation phase.
Most traders believe the worst is already over.
But what if they're wrong?
According to this chart, another potential 36% downside move could be ahead.
Stay alert. The next move could surprise everyone!
Save this post and revisit it later.
Follow me and turn on notifications so you don't miss my next update.
I'll share every major development right here!
#SILVER #XAGUSD #PreciousMetals #MarketCrash #Trading
🚨 SILVER CRASH ALERT!
SILVER HAS PLUNGED BY 60% — AND THERE'S A REASON!
I warned about this potential crash 11 MONTHS AGO. Now, Silver appears to be entering another critical liquidation phase.
Most traders believe the worst is already over.
But what if they're wrong?
According to this chart, another potential 36% downside move could be ahead.
Stay alert. The next move could surprise everyone!
Save this post and revisit it later.
Follow me and turn on notifications so you don't miss my next update.
I'll share every major development right here!
#SILVER #XAGUSD #PreciousMetals #MarketCrash #Trading
SILVER HAS PLUNGED BY 60% — AND THERE'S A REASON!
I warned about this potential crash 11 MONTHS AGO. Now, Silver appears to be entering another critical liquidation phase.
Most traders believe the worst is already over.
But what if they're wrong?
According to this chart, another potential 36% downside move could be ahead.
Stay alert. The next move could surprise everyone!
Save this post and revisit it later.
Follow me and turn on notifications so you don't miss my next update.
I'll share every major development right here!
#SILVER #XAGUSD #PreciousMetals #MarketCrash #Trading
60
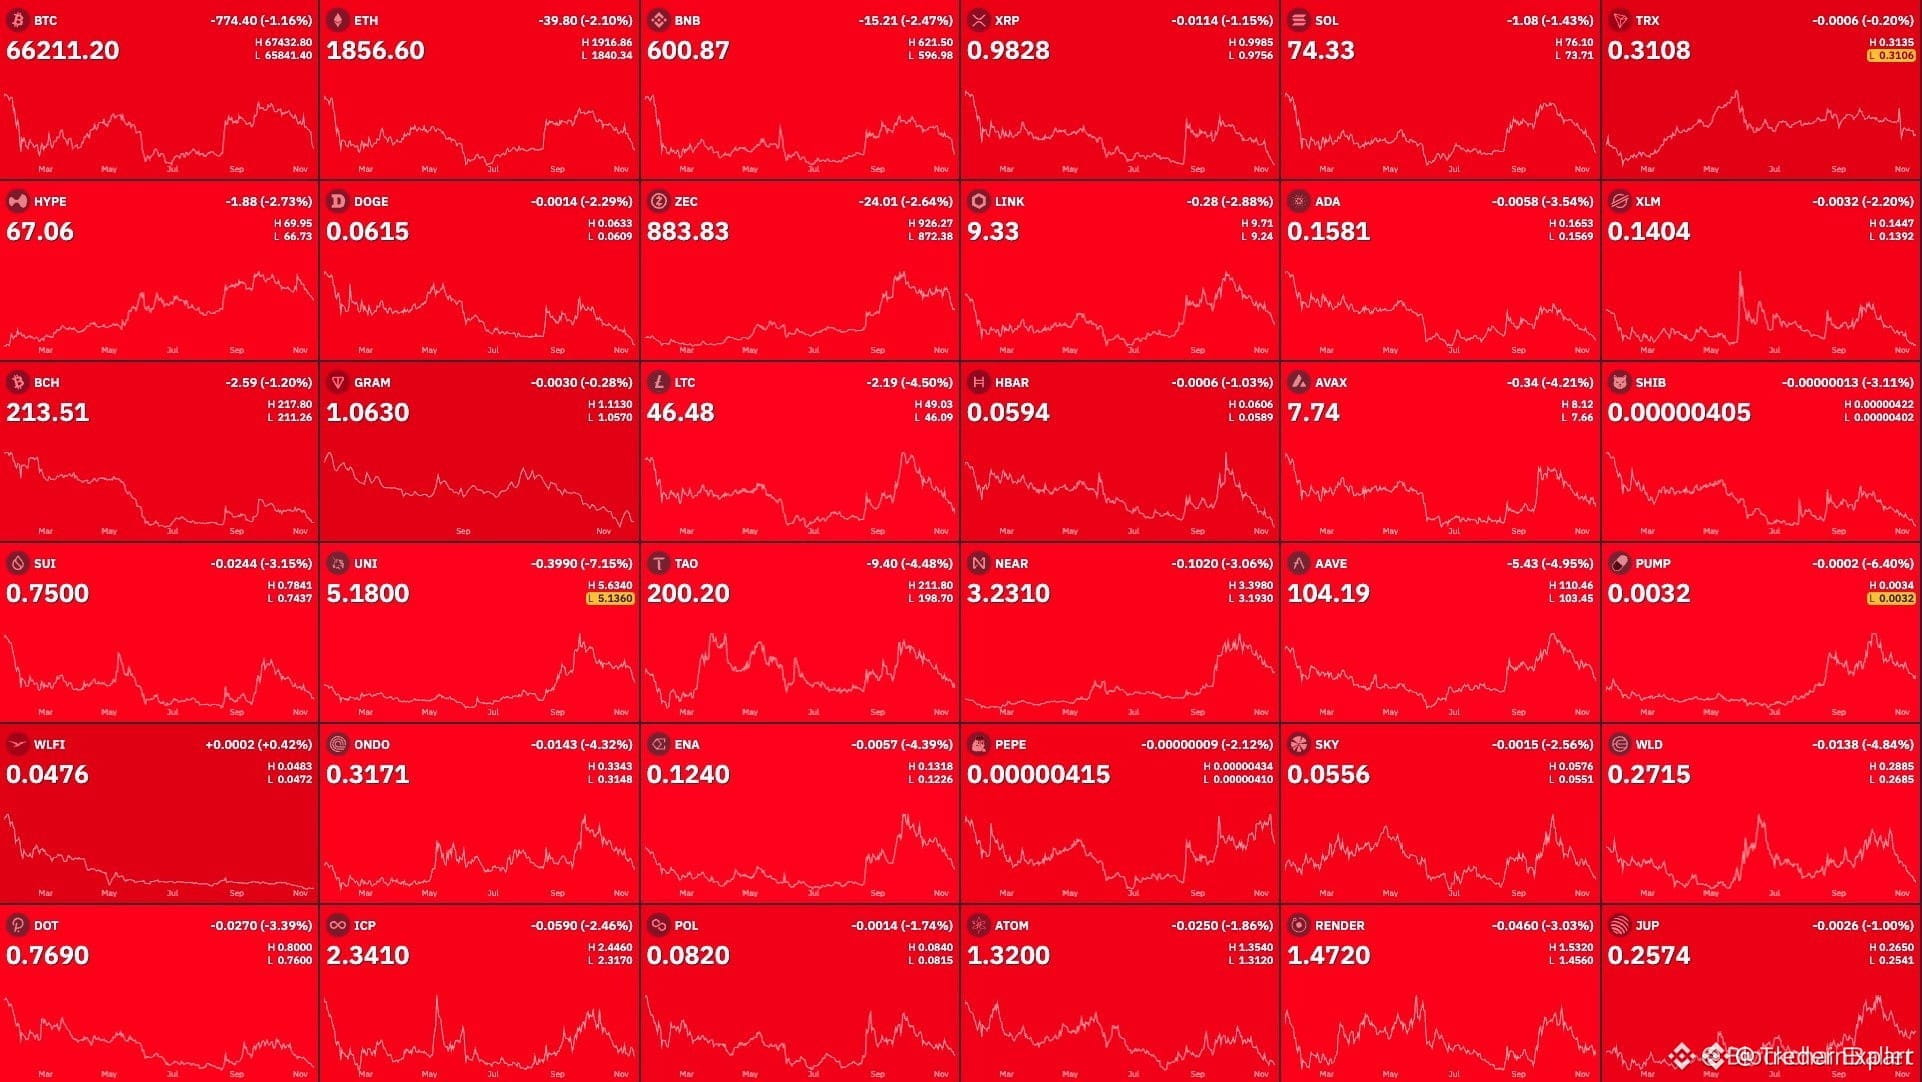
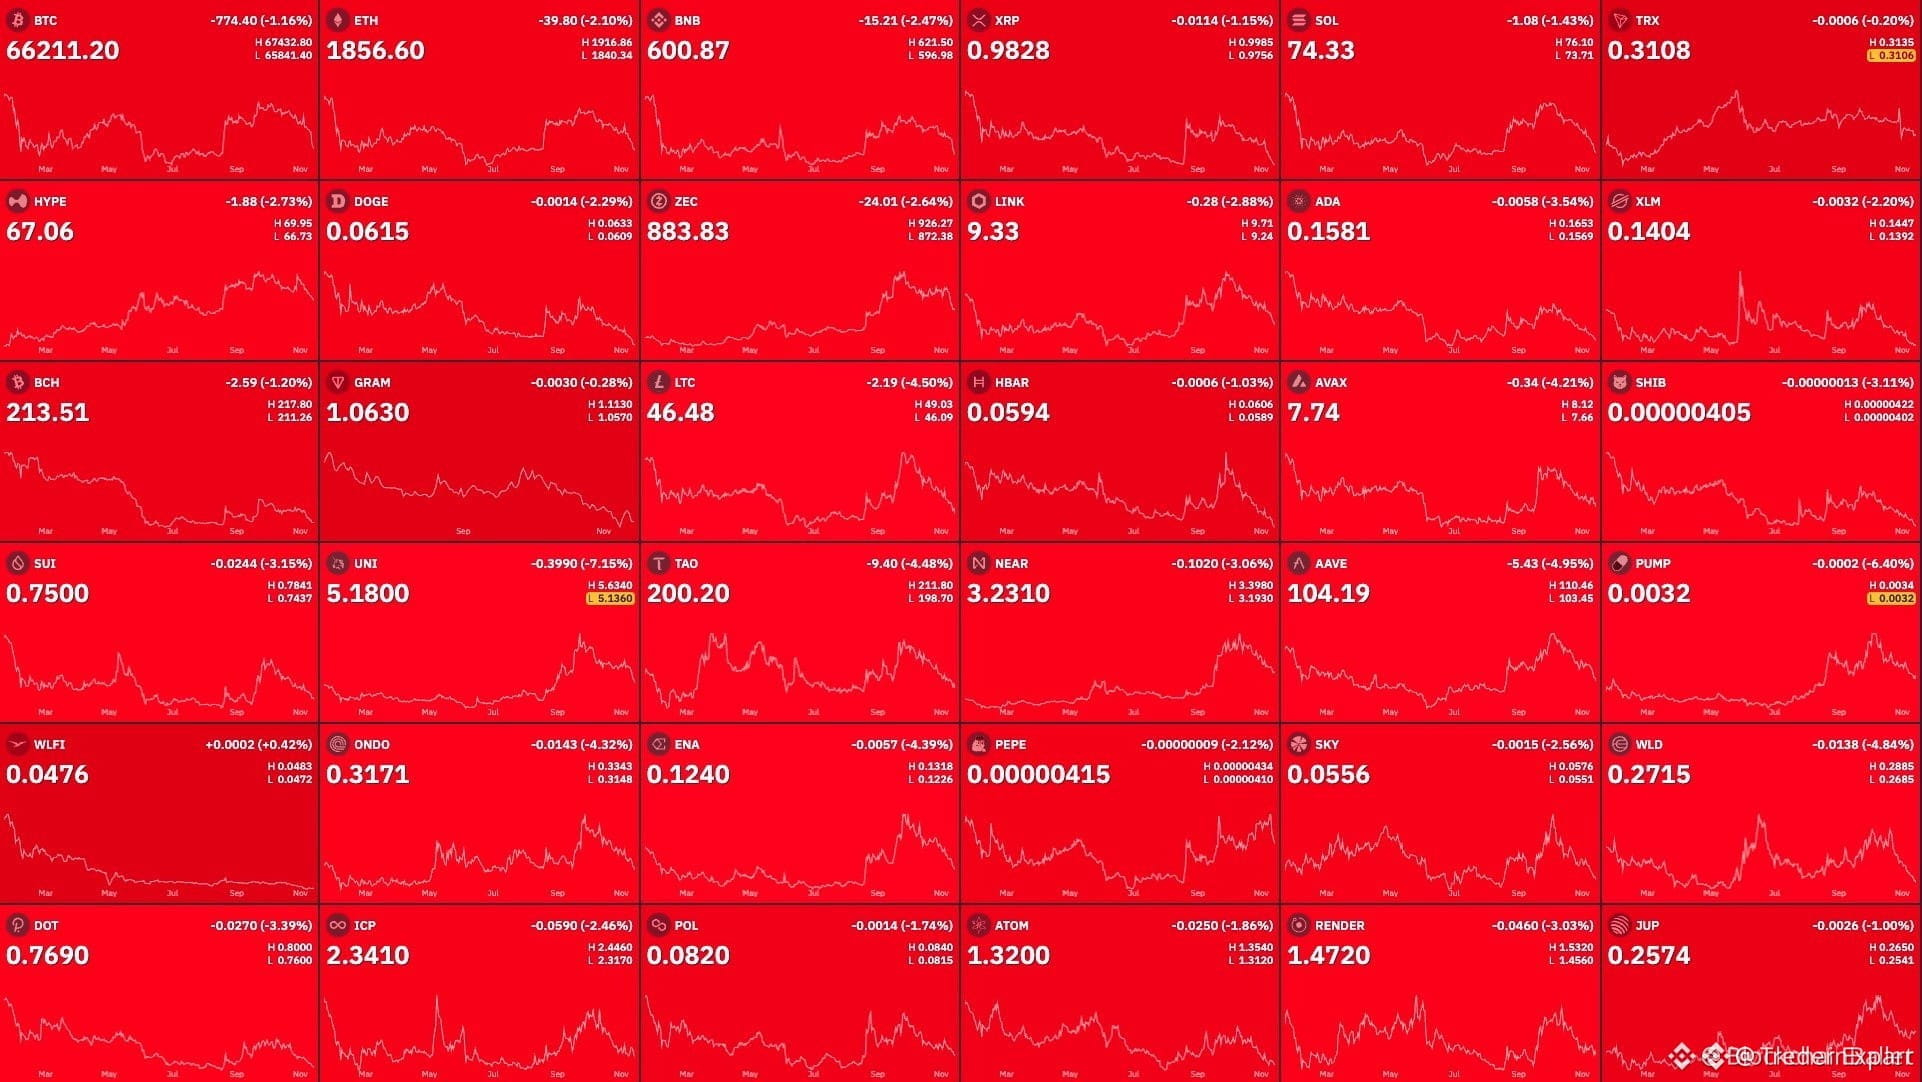
🚨 BITCOIN CRASH ALERT! 📉🔥
$BTC has plunged below the $66,000 level!
💥 Nearly $180 MILLION in long positions liquidated in just 15 minutes!
The market is turning brutal. Bulls are getting crushed, and volatility is heating up!
Stay alert. Protect your capital. Don't get caught off guard!
#BTC #Bitcoin #CryptoCrash #Liquidations #Binance
🚨 BITCOIN CRASH ALERT! 📉🔥
$BTC has plunged below the $66,000 level!
💥 Nearly $180 MILLION in long positions liquidated in just 15 minutes!
The market is turning brutal. Bulls are getting crushed, and volatility is heating up!
Stay alert. Protect your capital. Don't get caught off guard!
#BTC #Bitcoin #CryptoCrash #Liquidations #Binance
$BTC has plunged below the $66,000 level!
💥 Nearly $180 MILLION in long positions liquidated in just 15 minutes!
The market is turning brutal. Bulls are getting crushed, and volatility is heating up!
Stay alert. Protect your capital. Don't get caught off guard!
#BTC #Bitcoin #CryptoCrash #Liquidations #Binance
47
Damn, if the price drops any lower, I honestly don’t know how much more I can take. I might be forced to sell at the worst possible moment—the bottom.
Damn, if the price drops any lower, I honestly don’t know how much more I can take. I might be forced to sell at the worst possible moment—the bottom.

58
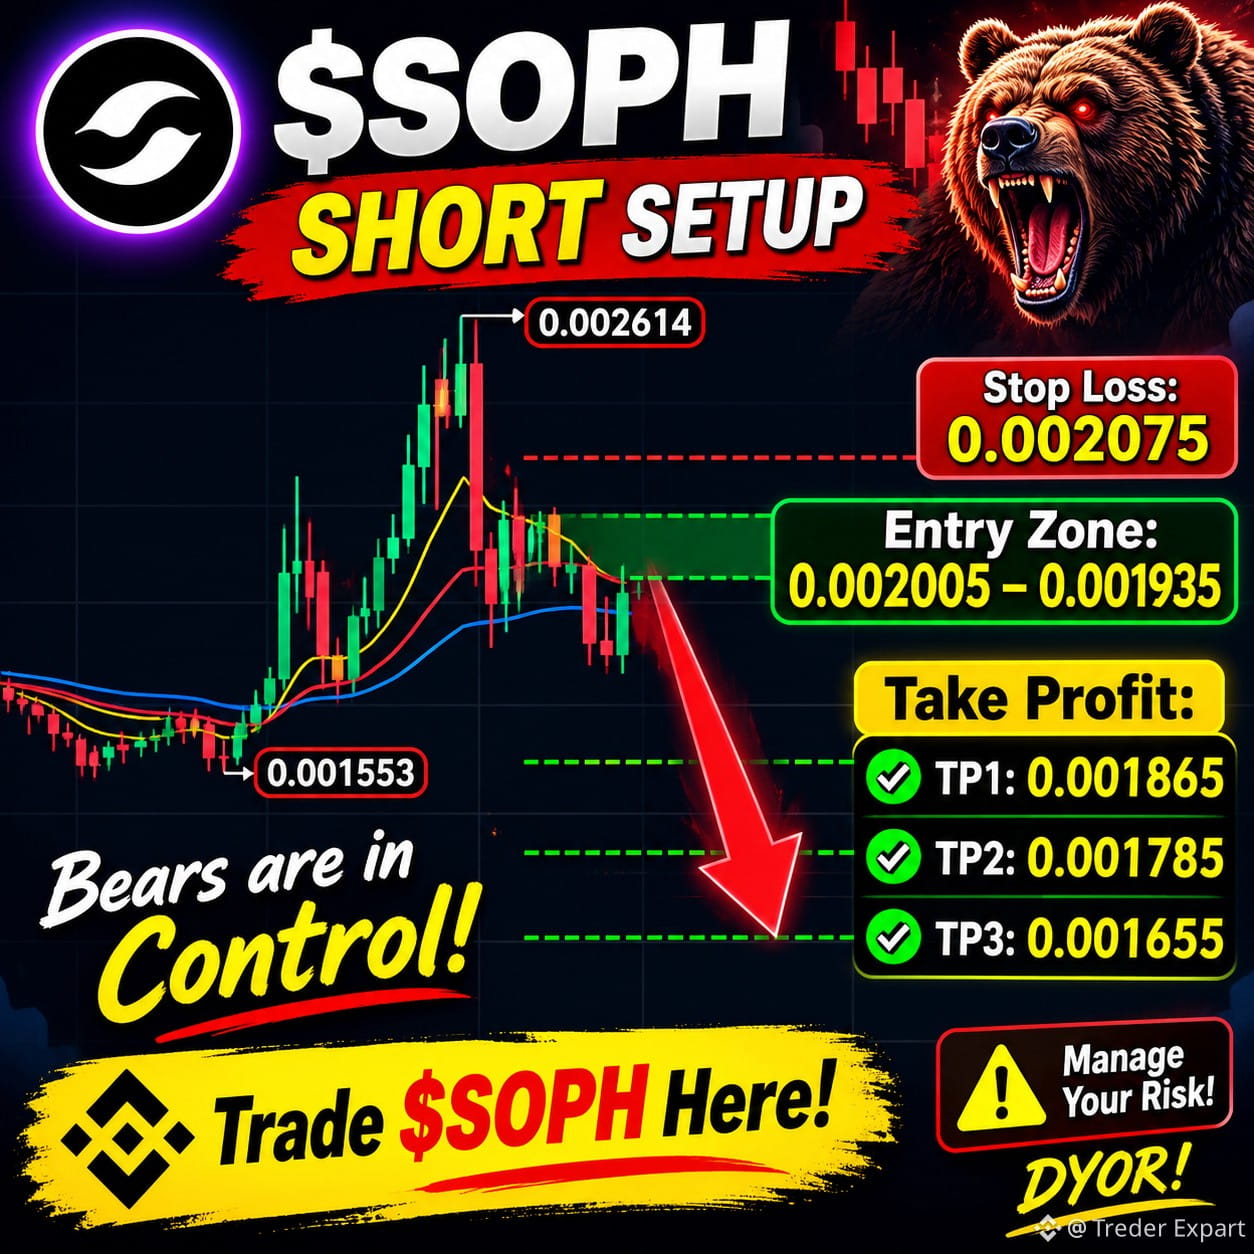
🚨 $SOPH SHORT SETUP ALERT!
Bears are watching closely! A potential downside move is on the radar.
Entry Zone: 0.002005 – 0.001935
Take Profit Targets: 🎯 TP1: 0.001865 TP2: 0.001785 🎯 TP3: 0.001655
🛑 Stop Loss: 0.002075
Stay disciplined and manage your risk!
Trade $SOPH Here!
#SOPH #SHORT #CryptoTrading #Binance #TradingSignals
🚨 $SOPH SHORT SETUP ALERT!
Bears are watching closely! A potential downside move is on the radar.
Entry Zone: 0.002005 – 0.001935
Take Profit Targets: 🎯 TP1: 0.001865 TP2: 0.001785 🎯 TP3: 0.001655
🛑 Stop Loss: 0.002075
Stay disciplined and manage your risk!
Trade $SOPH Here!
#SOPH #SHORT #CryptoTrading #Binance #TradingSignals
Bears are watching closely! A potential downside move is on the radar.
Entry Zone: 0.002005 – 0.001935
Take Profit Targets: 🎯 TP1: 0.001865 TP2: 0.001785 🎯 TP3: 0.001655
🛑 Stop Loss: 0.002075
Stay disciplined and manage your risk!
Trade $SOPH Here!
#SOPH #SHORT #CryptoTrading #Binance #TradingSignals
71
🧧 $5,000 USDC GIVEAWAY!
Get ready for an exclusive preview of what’s coming to #BinanceBlockchainWeek 2026!
Discover the latest insights, exciting ideas, and future of blockchain straight from the industry leaders.
Featuring: @Yi He Eowyn Chen Jessica Walker
Join the “Road to Binance Blockchain Week” LIVE session and be among the first to hear what’s next!
Set your reminder now and don’t miss out!
#Binance #Crypto #Blockchain #USDC #Giveaway
🧧 $5,000 USDC GIVEAWAY!
Get ready for an exclusive preview of what’s coming to #BinanceBlockchainWeek 2026!
Discover the latest insights, exciting ideas, and future of blockchain straight from the industry leaders.
Featuring: @Yi He Eowyn Chen Jessica Walker
Join the “Road to Binance Blockchain Week” LIVE session and be among the first to hear what’s next!
Set your reminder now and don’t miss out!
#Binance #Crypto #Blockchain #USDC #Giveaway
Get ready for an exclusive preview of what’s coming to #BinanceBlockchainWeek 2026!
Discover the latest insights, exciting ideas, and future of blockchain straight from the industry leaders.
Featuring: @Yi He Eowyn Chen Jessica Walker
Join the “Road to Binance Blockchain Week” LIVE session and be among the first to hear what’s next!
Set your reminder now and don’t miss out!
#Binance #Crypto #Blockchain #USDC #Giveaway

10
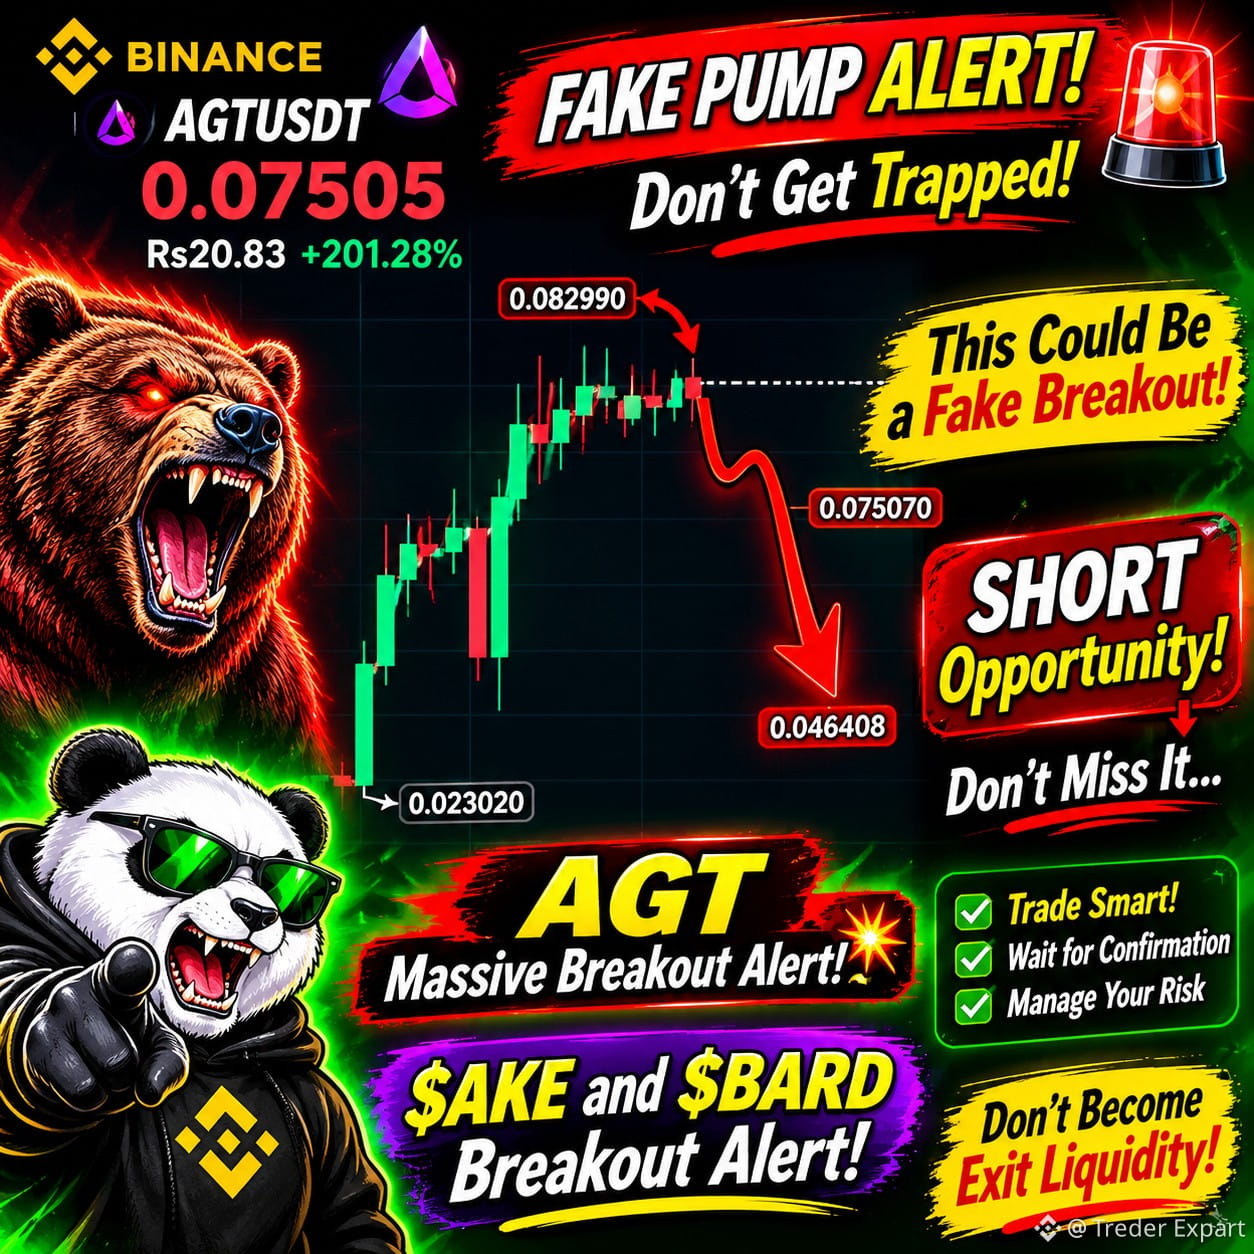
🚨 FAKE PUMP ALERT — DON'T GET TRAPPED!
Guys, don't blindly chase the LONG!
This could be a fake breakout designed to trap late buyers.
$AGT — MASSIVE BREAKOUT ALERT!
Watch for the SHORT opportunity. Don't miss the train!
$AKE & $BARD — BREAKOUT ALERT!
Both coins are showing interesting price action. Keep your eyes on these charts!
Stay alert, wait for confirmation, and manage your risk.
Trade smart. Don't become exit liquidity!
#AGT #AKE BARD #CryptoTrading Binance #Breakout
🚨 FAKE PUMP ALERT — DON'T GET TRAPPED!
Guys, don't blindly chase the LONG!
This could be a fake breakout designed to trap late buyers.
$AGT — MASSIVE BREAKOUT ALERT!
Watch for the SHORT opportunity. Don't miss the train!
$AKE & $BARD — BREAKOUT ALERT!
Both coins are showing interesting price action. Keep your eyes on these charts!
Stay alert, wait for confirmation, and manage your risk.
Trade smart. Don't become exit liquidity!
#AGT #AKE BARD #CryptoTrading Binance #Breakout
Guys, don't blindly chase the LONG!
This could be a fake breakout designed to trap late buyers.
$AGT — MASSIVE BREAKOUT ALERT!
Watch for the SHORT opportunity. Don't miss the train!
$AKE & $BARD — BREAKOUT ALERT!
Both coins are showing interesting price action. Keep your eyes on these charts!
Stay alert, wait for confirmation, and manage your risk.
Trade smart. Don't become exit liquidity!
#AGT #AKE BARD #CryptoTrading Binance #Breakout
24
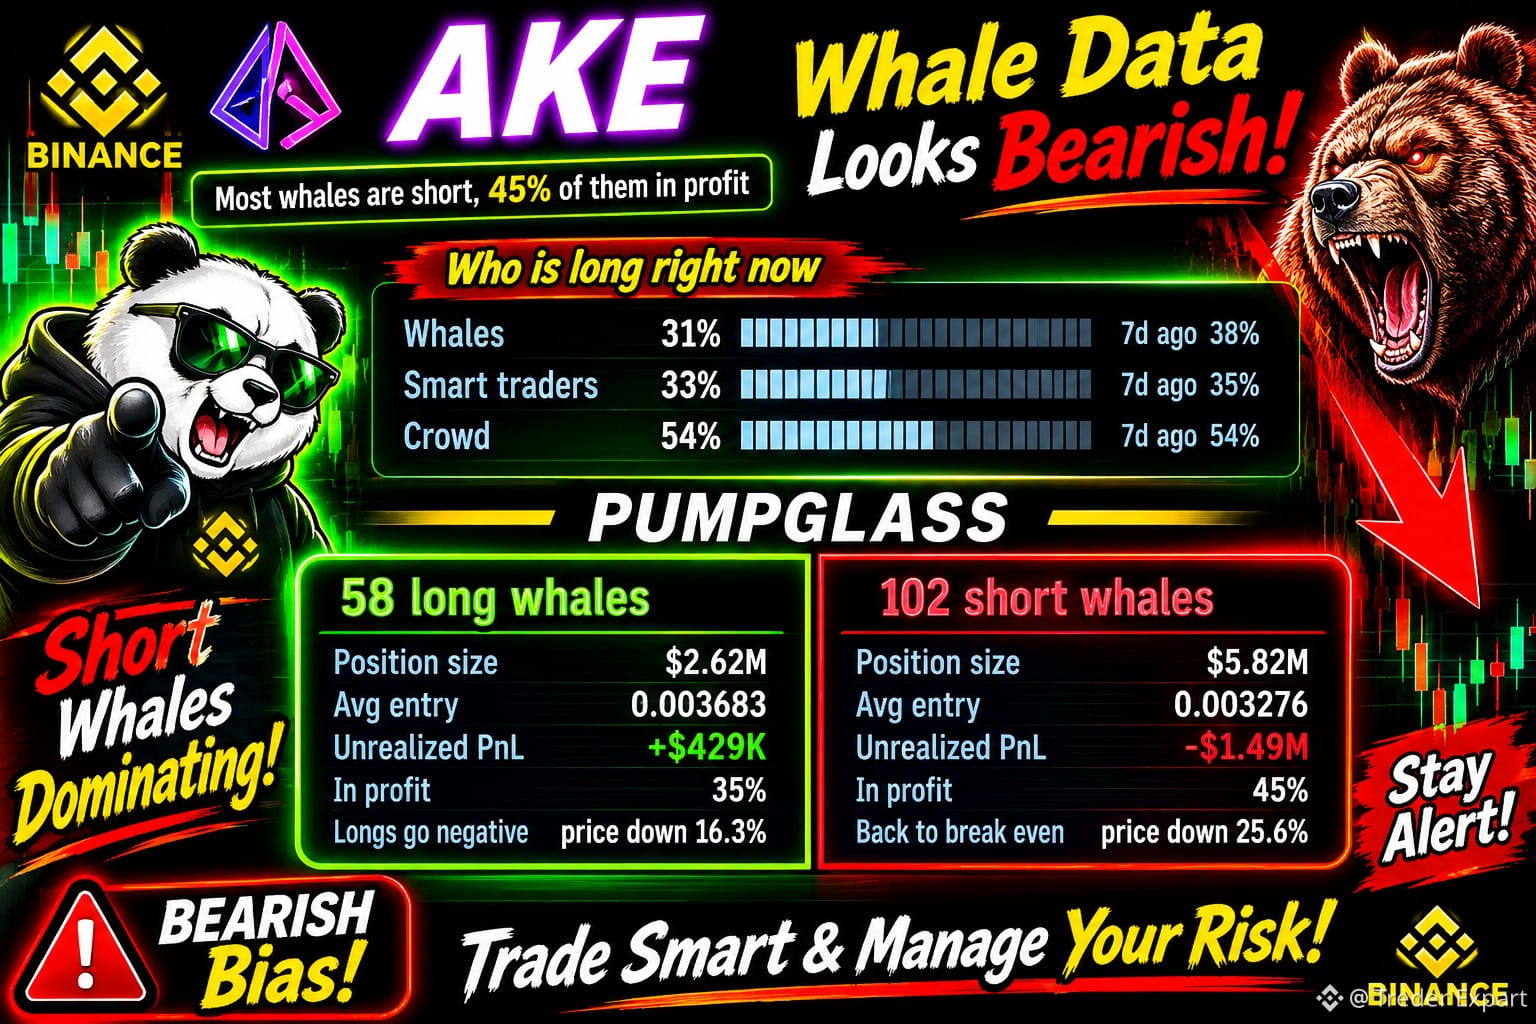
I think $AKE is due for a sharp pullback after that 85% pump.....
Right now it's at $0.004571.
I am watching $0.0048 to $0.0056 for a strong bearish rejection.
102 whales are short with $5.82M in positions, while 54% of retail is still long.
Open interest is climbing so this setup is getting even more volatile.
My bias is a dump toward $0.0040, then $0.0035, and possibly $0.0030 if sellers take over.
But short whales are already down $1.49M, so another squeeze is still possible. A clean breakout above $0.0056 would flip my view.
No rejection, no short.
I think $AKE is due for a sharp pullback after that 85% pump.....
Right now it's at $0.004571.
I am watching $0.0048 to $0.0056 for a strong bearish rejection.
102 whales are short with $5.82M in positions, while 54% of retail is still long.
Open interest is climbing so this setup is getting even more volatile.
My bias is a dump toward $0.0040, then $0.0035, and possibly $0.0030 if sellers take over.
But short whales are already down $1.49M, so another squeeze is still possible. A clean breakout above $0.0056 would flip my view.
No rejection, no short.
Right now it's at $0.004571.
I am watching $0.0048 to $0.0056 for a strong bearish rejection.
102 whales are short with $5.82M in positions, while 54% of retail is still long.
Open interest is climbing so this setup is getting even more volatile.
My bias is a dump toward $0.0040, then $0.0035, and possibly $0.0030 if sellers take over.
But short whales are already down $1.49M, so another squeeze is still possible. A clean breakout above $0.0056 would flip my view.
No rejection, no short.
15
Log in to explore more content
Join global crypto users on Binance Square
⚡️ Get latest and useful information about crypto.
💬 Trusted by the world’s largest crypto exchange.
👍 Discover real insights from verified creators.
Email / Phone number
Trending Topics
A Packed Week of Earnings and Data Tests Markets
68,063 views
428 Discussing
Nvidia Earnings, Fed Minutes and Anthropic IPO Set to Test AI Stocks and Crypto
Binance News
·146 Likes
·24.2k views
AnthropicIPOTestsInvestorAppetiteForAI
133,741 views
1,474 Discussing
NvidiaBoardNotConsideringHuang’sReturnasCEO
1,929 views
55 Discussing