
Antick_io
20 Posts

Antick_io
Report
Block User
1 Following
17 Followers
30 Liked
Posts
All
Quotes
Videos
·
--
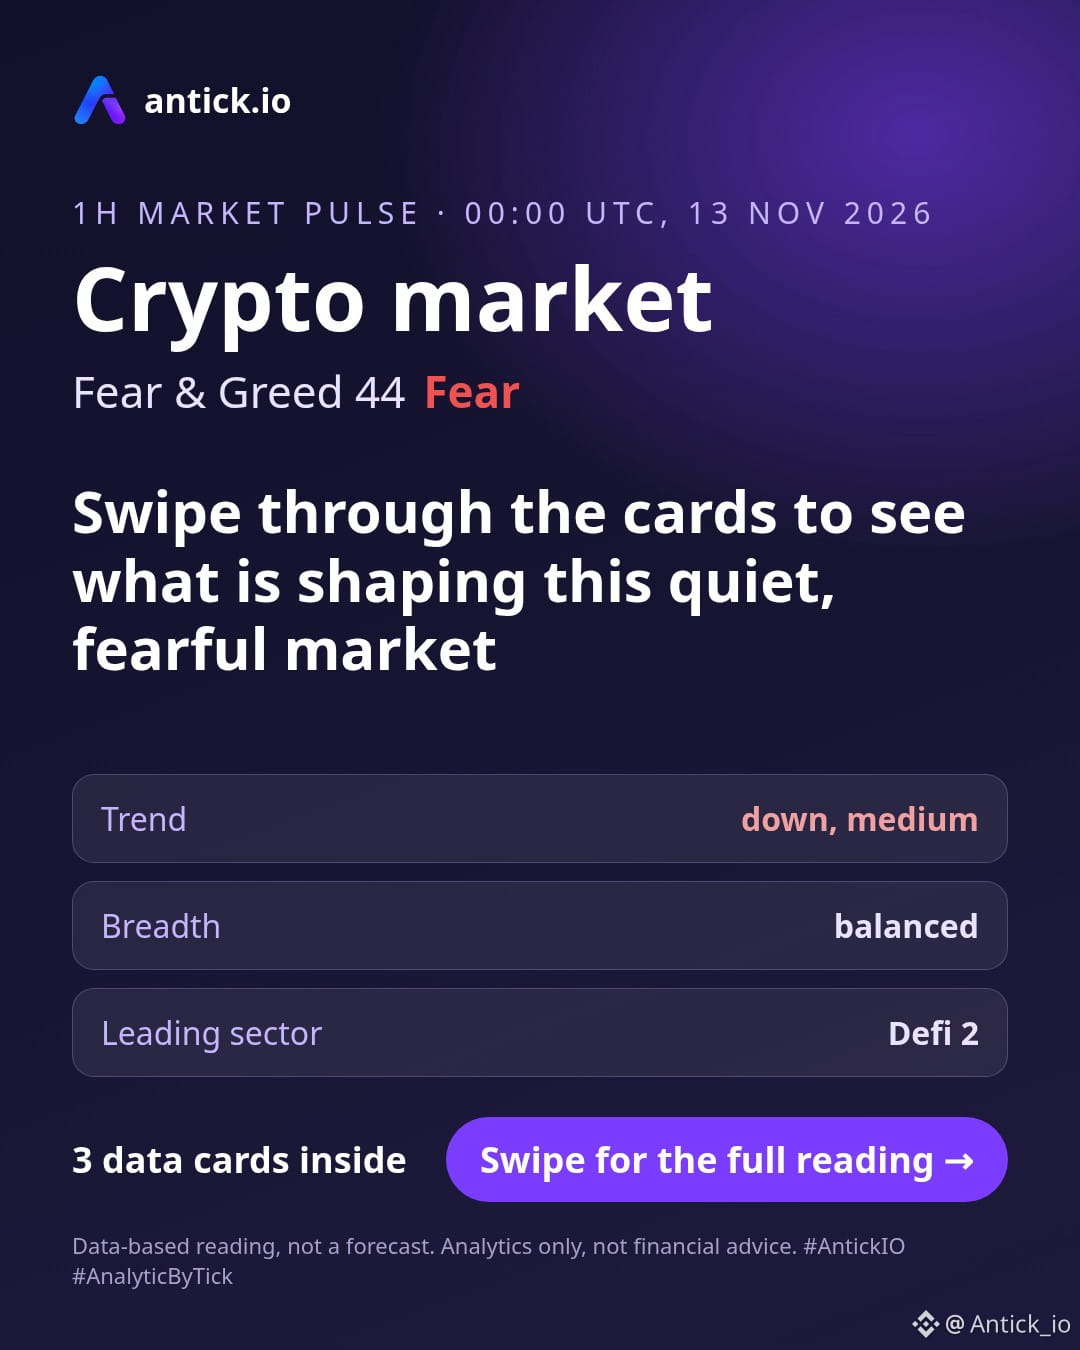
Crypto market on the 1H, data as of 00:00 UTC, 13 Nov 2026
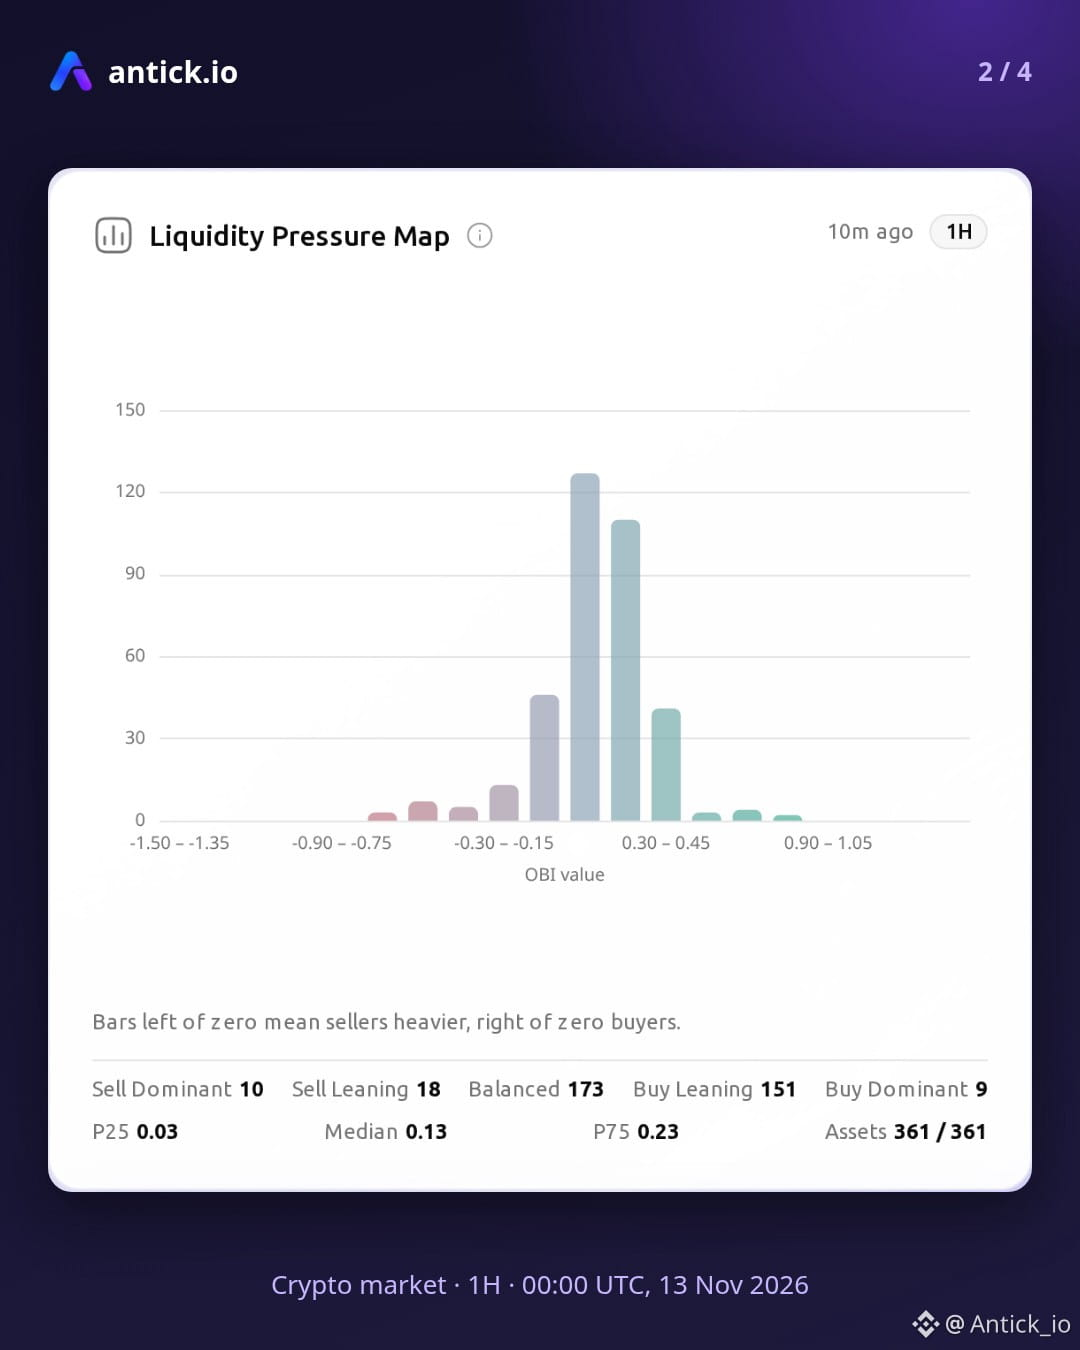
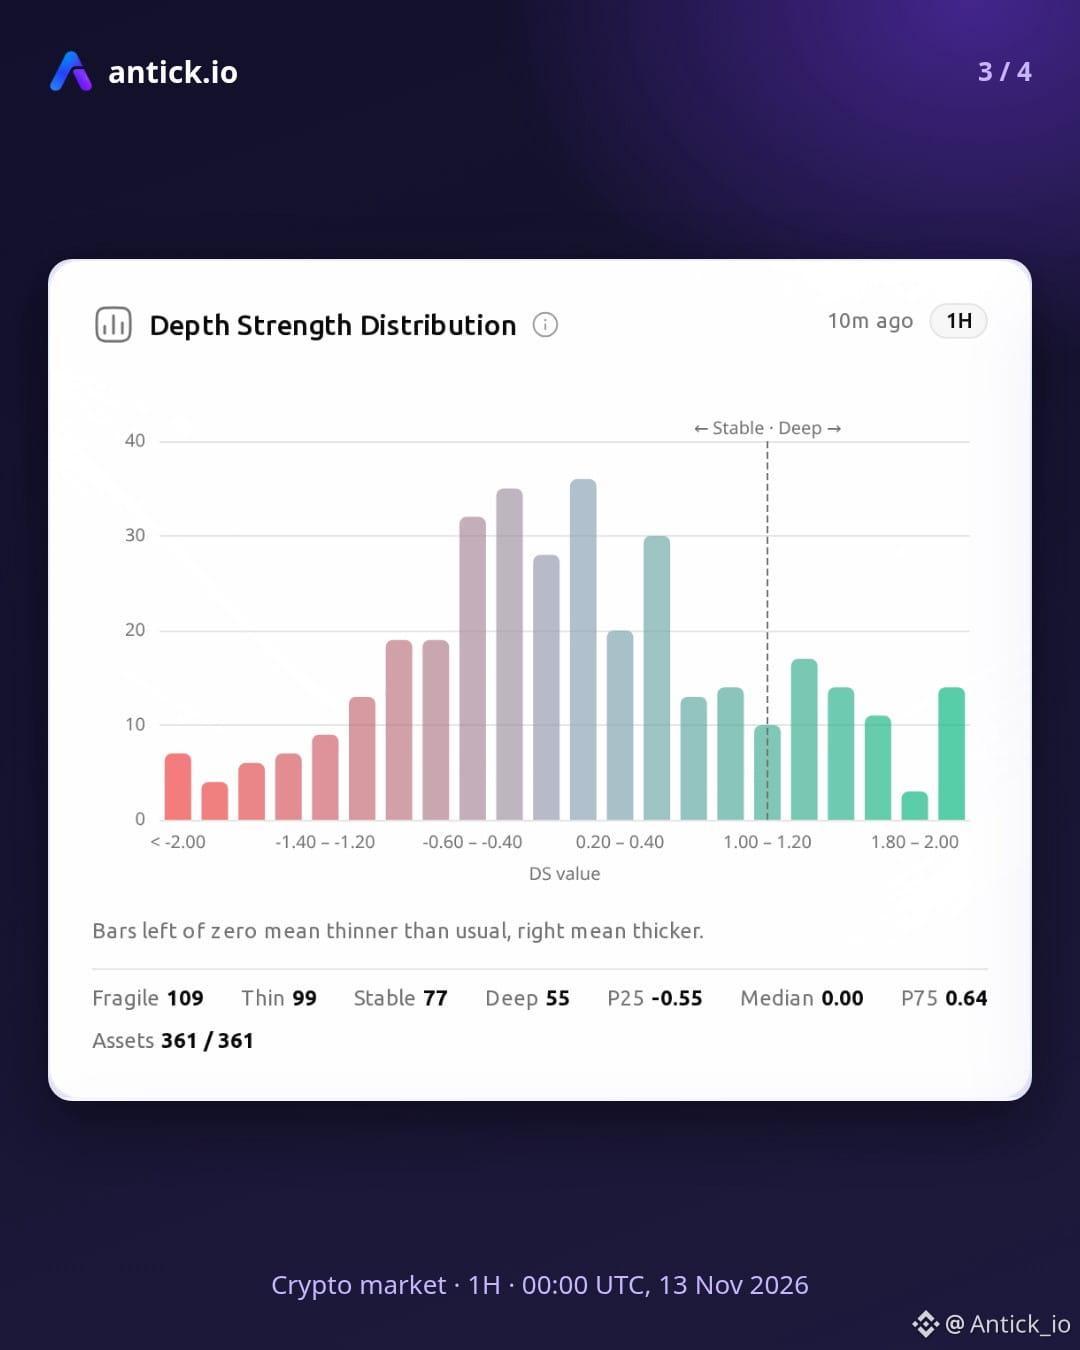
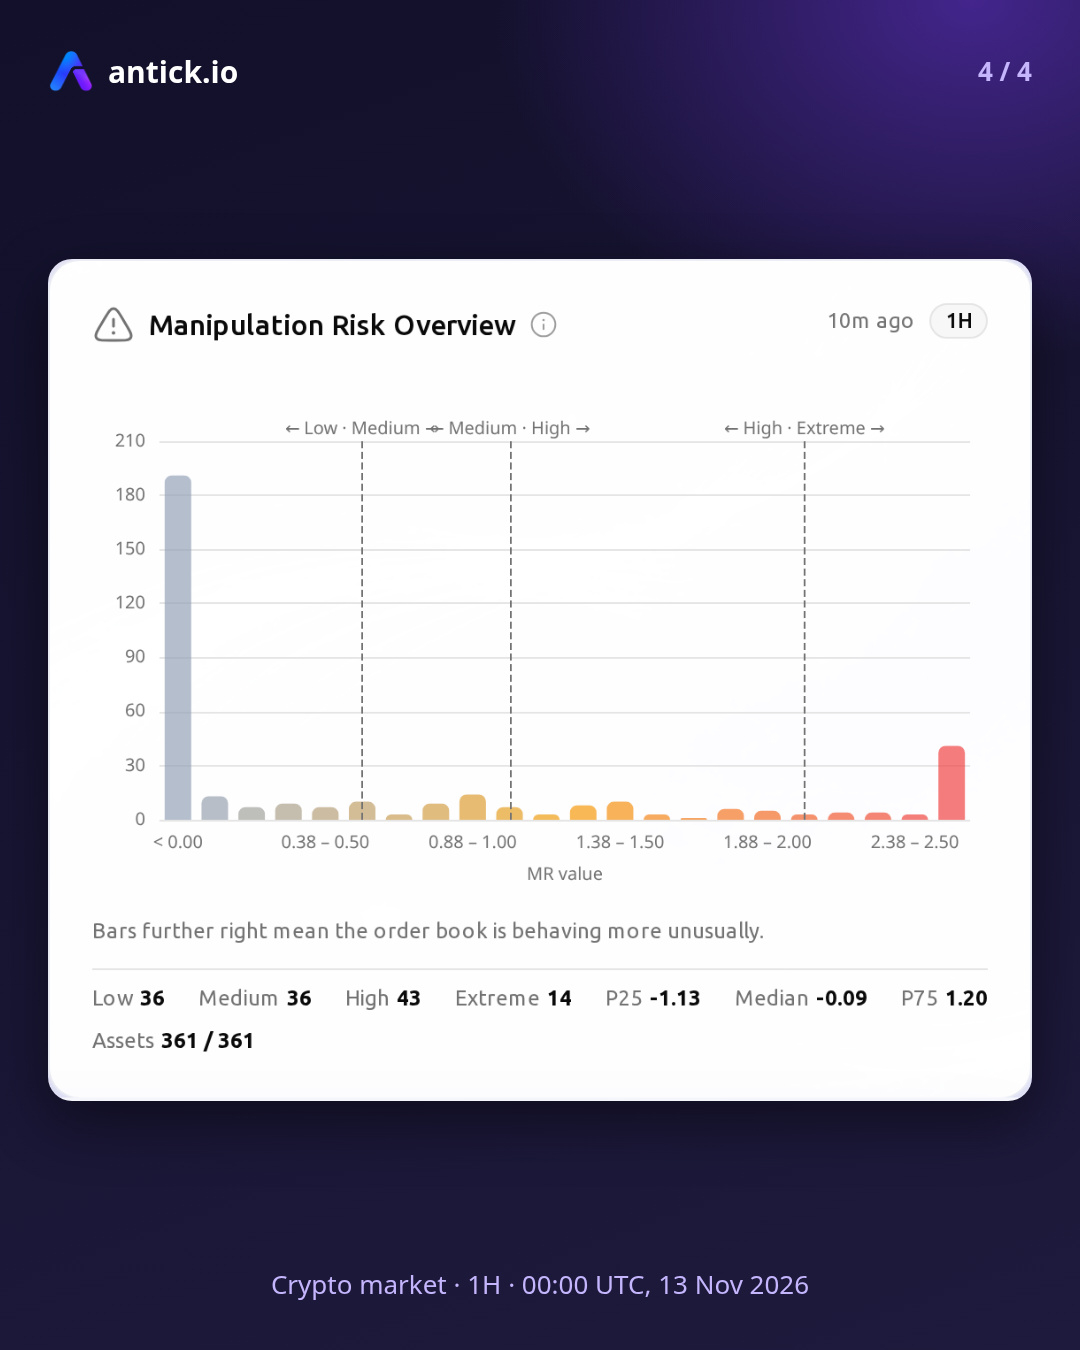
A careful reader would start with the compression zone, where the hourly trend points down with medium strength, breadth and bias both sit balanced, and sentiment reads Fear. DeFi, Bitcoin, and identity lead the sector board, all on neutral rotation, while made-in-america, AI, and privacy stand out as rising narratives. Should the rising AI and privacy narratives draw attention while the Fear reading eases, a rebound higher out of the compression could take shape. If the medium hourly downtrend holds instead and sector rotation stays neutral, a pullback toward lower levels could unfold. The Liquidity Pressure Map, Depth Strength Distribution, and Manipulation Risk Overview cards are where to check which of these conditions appears first.
Fear & Greed: 44, Fear
Breadth: 160 up, 145 down, 56 flat
Trend over the 1D8H window: down, medium (-2.96%)
Leading sectors: Defi 2, Bitcoin, Identity
Data-based reading, not a forecast. Analytics only, not financial advice.
#AntickIO #AnalyticByTick #CryptoMarket
Crypto market on the 1H, data as of 00:00 UTC, 13 Nov 2026
A careful reader would start with the compression zone, where the hourly trend points down with medium strength, breadth and bias both sit balanced, and sentiment reads Fear. DeFi, Bitcoin, and identity lead the sector board, all on neutral rotation, while made-in-america, AI, and privacy stand out as rising narratives. Should the rising AI and privacy narratives draw attention while the Fear reading eases, a rebound higher out of the compression could take shape. If the medium hourly downtrend holds instead and sector rotation stays neutral, a pullback toward lower levels could unfold. The Liquidity Pressure Map, Depth Strength Distribution, and Manipulation Risk Overview cards are where to check which of these conditions appears first.
Fear & Greed: 44, Fear
Breadth: 160 up, 145 down, 56 flat
Trend over the 1D8H window: down, medium (-2.96%)
Leading sectors: Defi 2, Bitcoin, Identity
Data-based reading, not a forecast. Analytics only, not financial advice.
#AntickIO #AnalyticByTick #CryptoMarket
A careful reader would start with the compression zone, where the hourly trend points down with medium strength, breadth and bias both sit balanced, and sentiment reads Fear. DeFi, Bitcoin, and identity lead the sector board, all on neutral rotation, while made-in-america, AI, and privacy stand out as rising narratives. Should the rising AI and privacy narratives draw attention while the Fear reading eases, a rebound higher out of the compression could take shape. If the medium hourly downtrend holds instead and sector rotation stays neutral, a pullback toward lower levels could unfold. The Liquidity Pressure Map, Depth Strength Distribution, and Manipulation Risk Overview cards are where to check which of these conditions appears first.
Fear & Greed: 44, Fear
Breadth: 160 up, 145 down, 56 flat
Trend over the 1D8H window: down, medium (-2.96%)
Leading sectors: Defi 2, Bitcoin, Identity
Data-based reading, not a forecast. Analytics only, not financial advice.
#AntickIO #AnalyticByTick #CryptoMarket
60
·
--
$DODO · 1H · Data as of 22:00 UTC, 12 Nov 2026
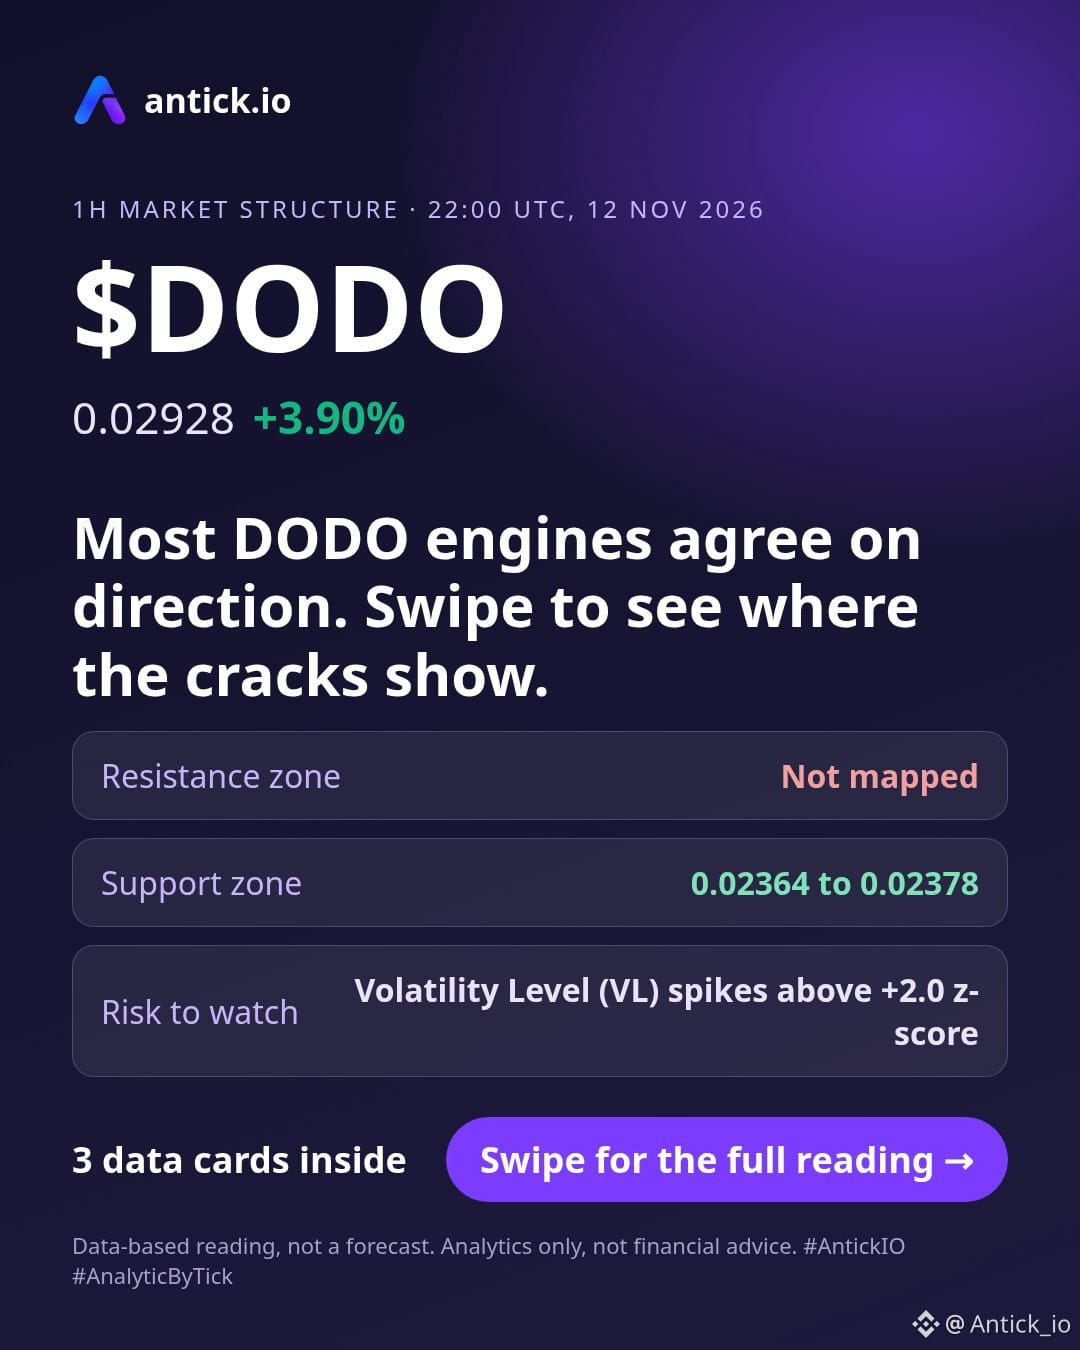
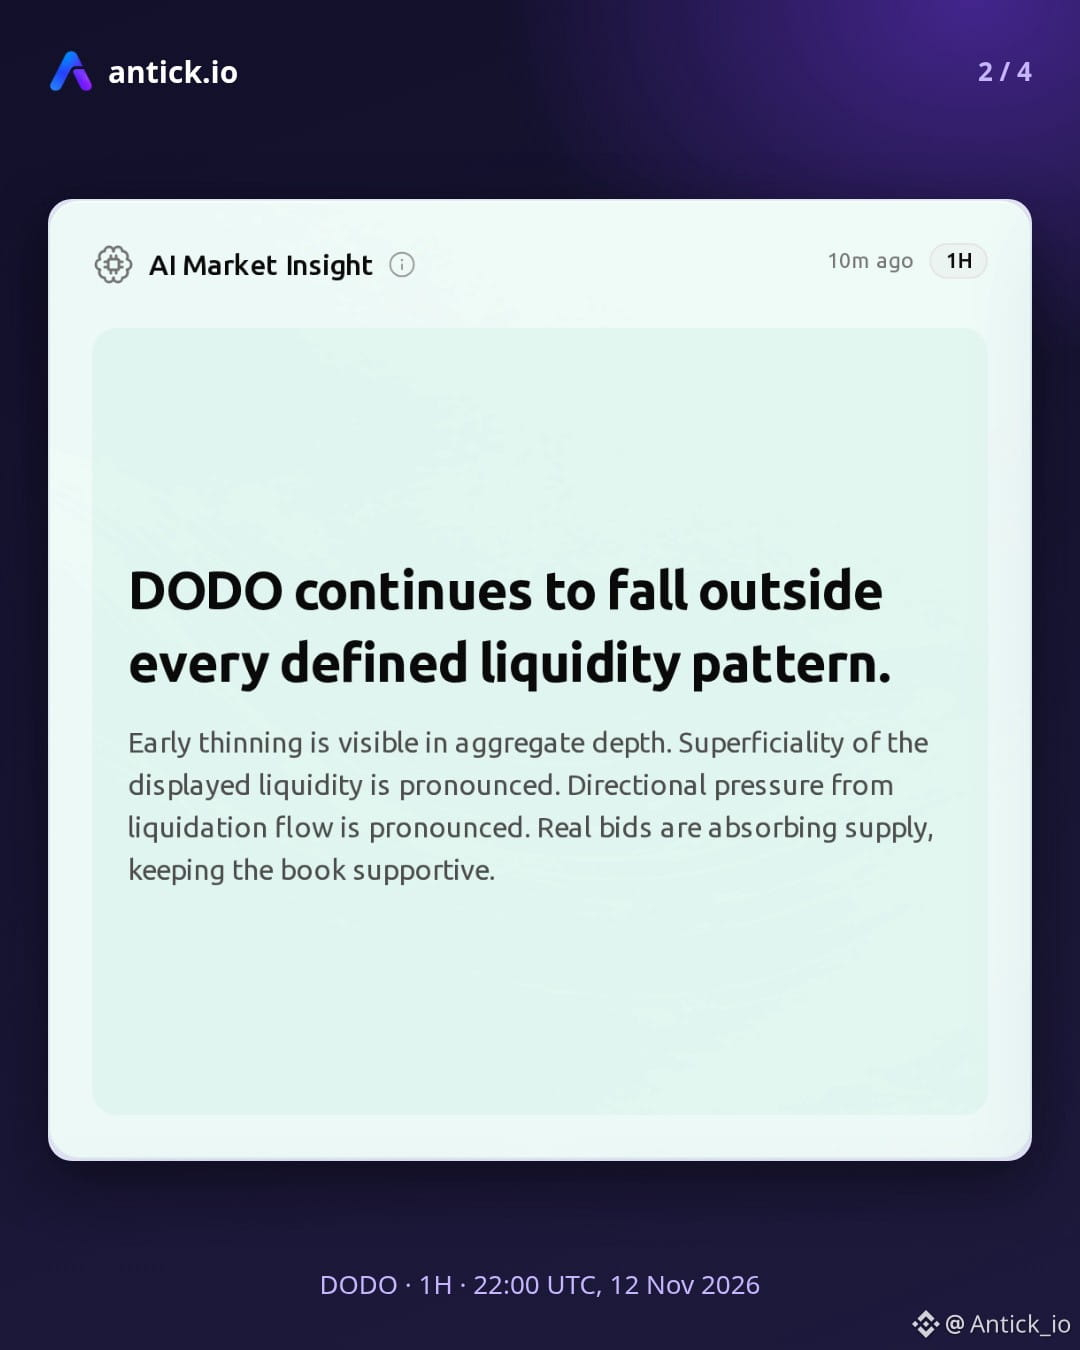
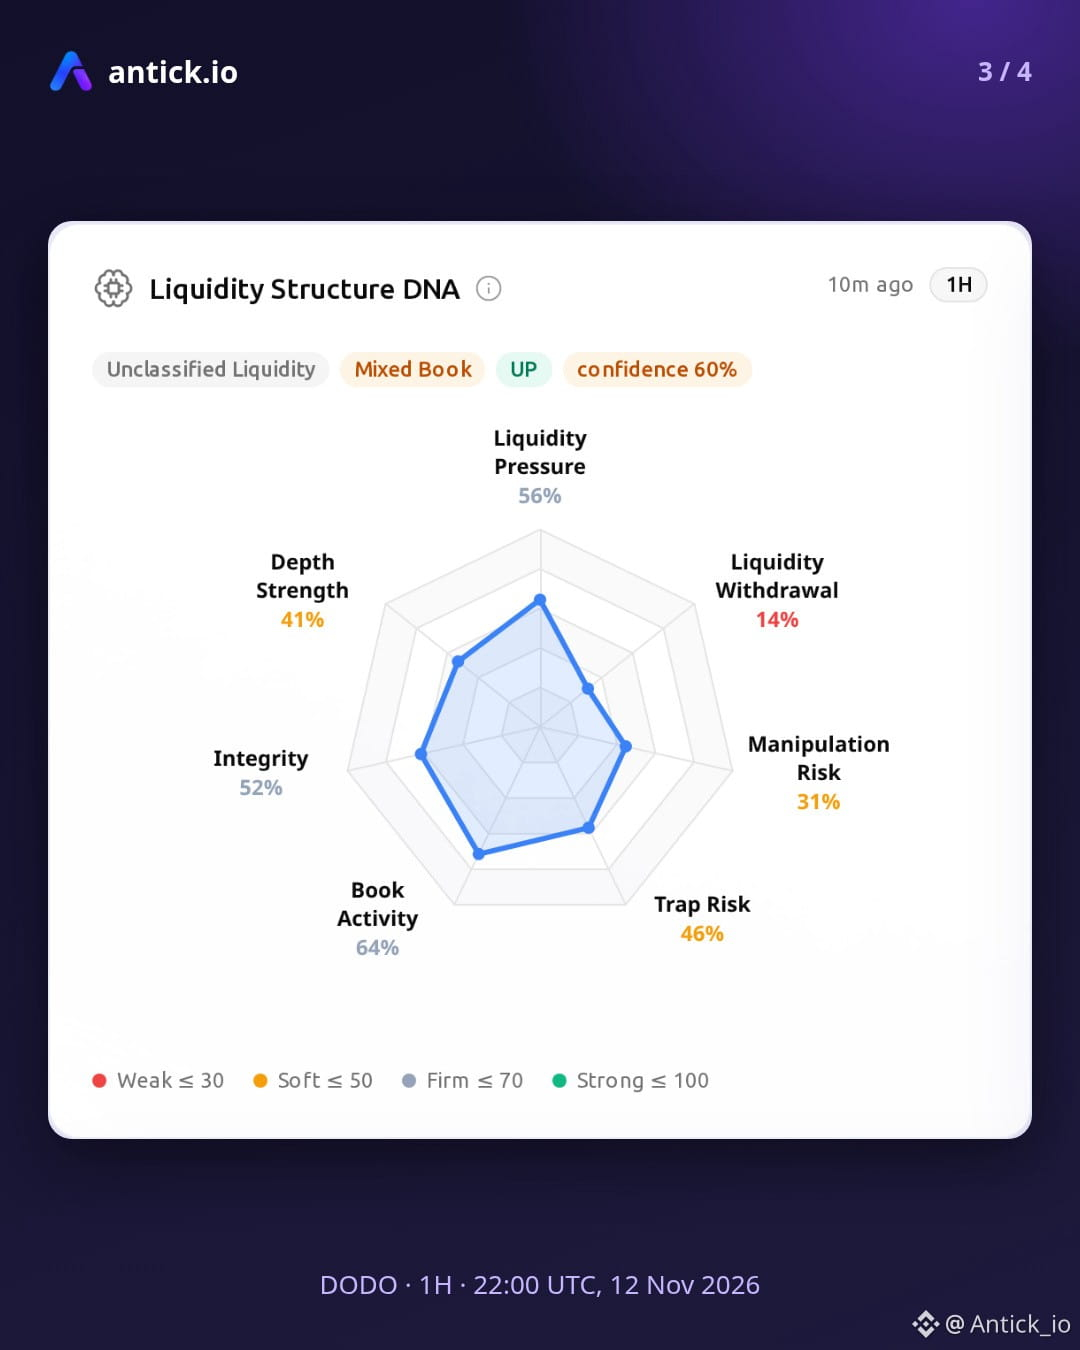
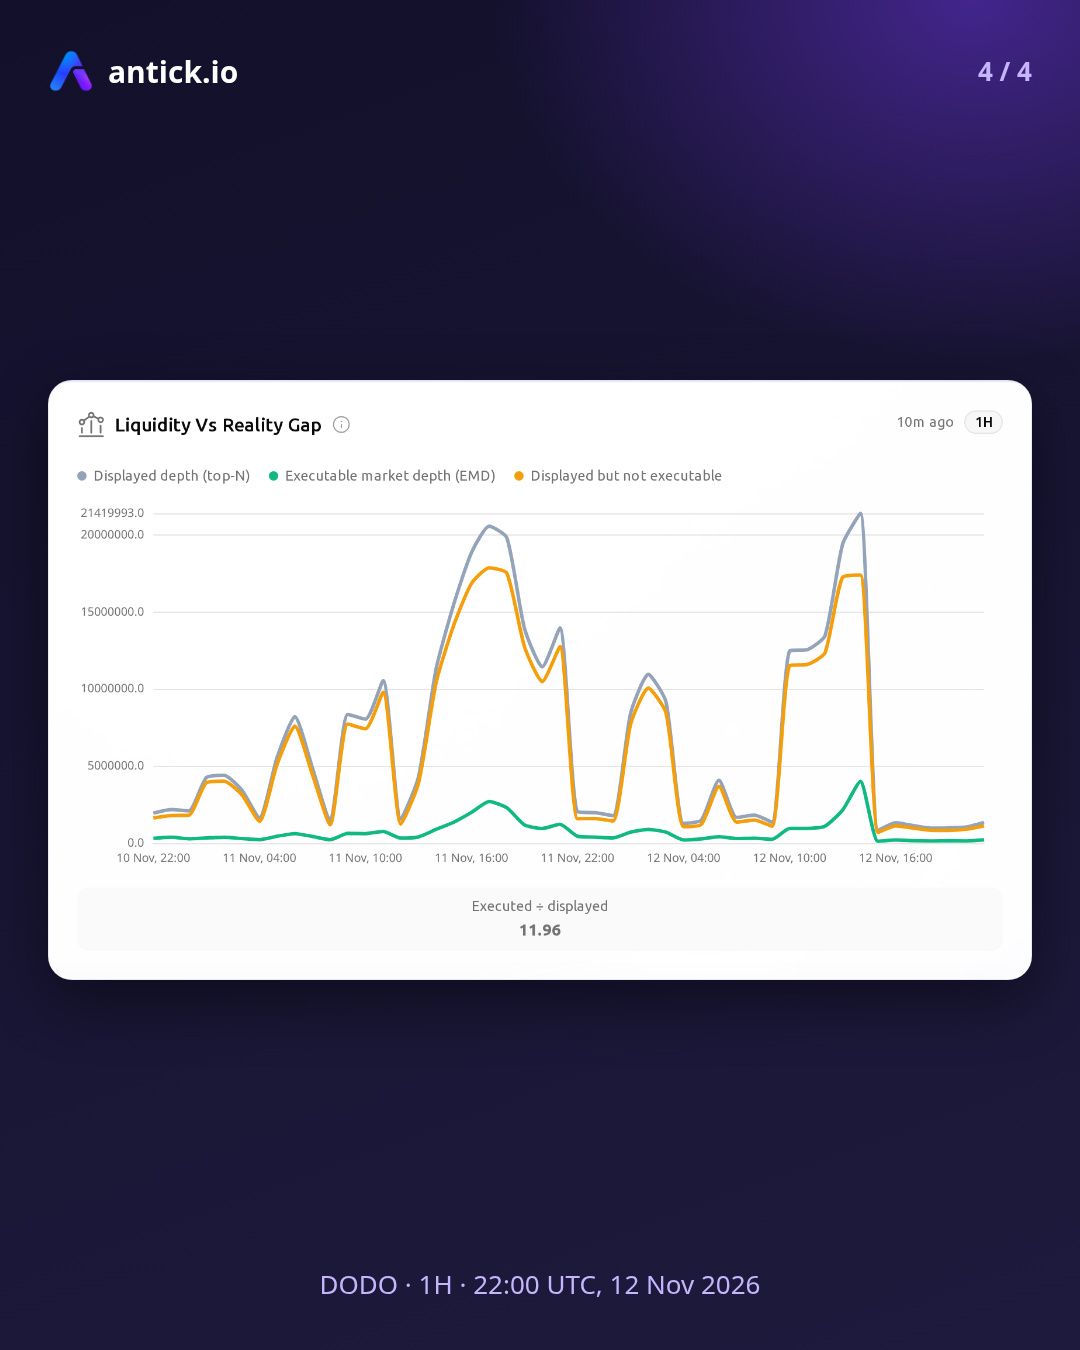
The AI Market Insight card shows a firm bullish reading on the short timeframe, with nearly every engine pointing the same way. For DODO, market structure is trending and moves in clean alignment across timeframes, so the readings lean to the upside. Still, the Liquidity Structure DNA card shows liquidity outside every defined pattern, and the breakout attempt lacks clean follow-through. The downside remains possible.
Risk conditions:
- Volatility Level (VL) spikes above +2.0 z-score
- Distribution Pressure (DP) exceeds ±0.1
Invalidation zones:
- Upside reading weakens on a 1H close below 0.02364 to 0.02378
- Cross-timeframe alignment (CTAC) breaks below 0.45
Data-based reading, not a forecast. Analytics only, not financial advice.
$DODO #DODO #AntickIO #AnalyticByTick #OnChainData
$DODO · 1H · Data as of 22:00 UTC, 12 Nov 2026
The AI Market Insight card shows a firm bullish reading on the short timeframe, with nearly every engine pointing the same way. For DODO, market structure is trending and moves in clean alignment across timeframes, so the readings lean to the upside. Still, the Liquidity Structure DNA card shows liquidity outside every defined pattern, and the breakout attempt lacks clean follow-through. The downside remains possible.
Risk conditions:
- Volatility Level (VL) spikes above +2.0 z-score
- Distribution Pressure (DP) exceeds ±0.1
Invalidation zones:
- Upside reading weakens on a 1H close below 0.02364 to 0.02378
- Cross-timeframe alignment (CTAC) breaks below 0.45
Data-based reading, not a forecast. Analytics only, not financial advice.
$DODO #DODO #AntickIO #AnalyticByTick #OnChainData
The AI Market Insight card shows a firm bullish reading on the short timeframe, with nearly every engine pointing the same way. For DODO, market structure is trending and moves in clean alignment across timeframes, so the readings lean to the upside. Still, the Liquidity Structure DNA card shows liquidity outside every defined pattern, and the breakout attempt lacks clean follow-through. The downside remains possible.
Risk conditions:
- Volatility Level (VL) spikes above +2.0 z-score
- Distribution Pressure (DP) exceeds ±0.1
Invalidation zones:
- Upside reading weakens on a 1H close below 0.02364 to 0.02378
- Cross-timeframe alignment (CTAC) breaks below 0.45
Data-based reading, not a forecast. Analytics only, not financial advice.
$DODO #DODO #AntickIO #AnalyticByTick #OnChainData
1
99
·
--
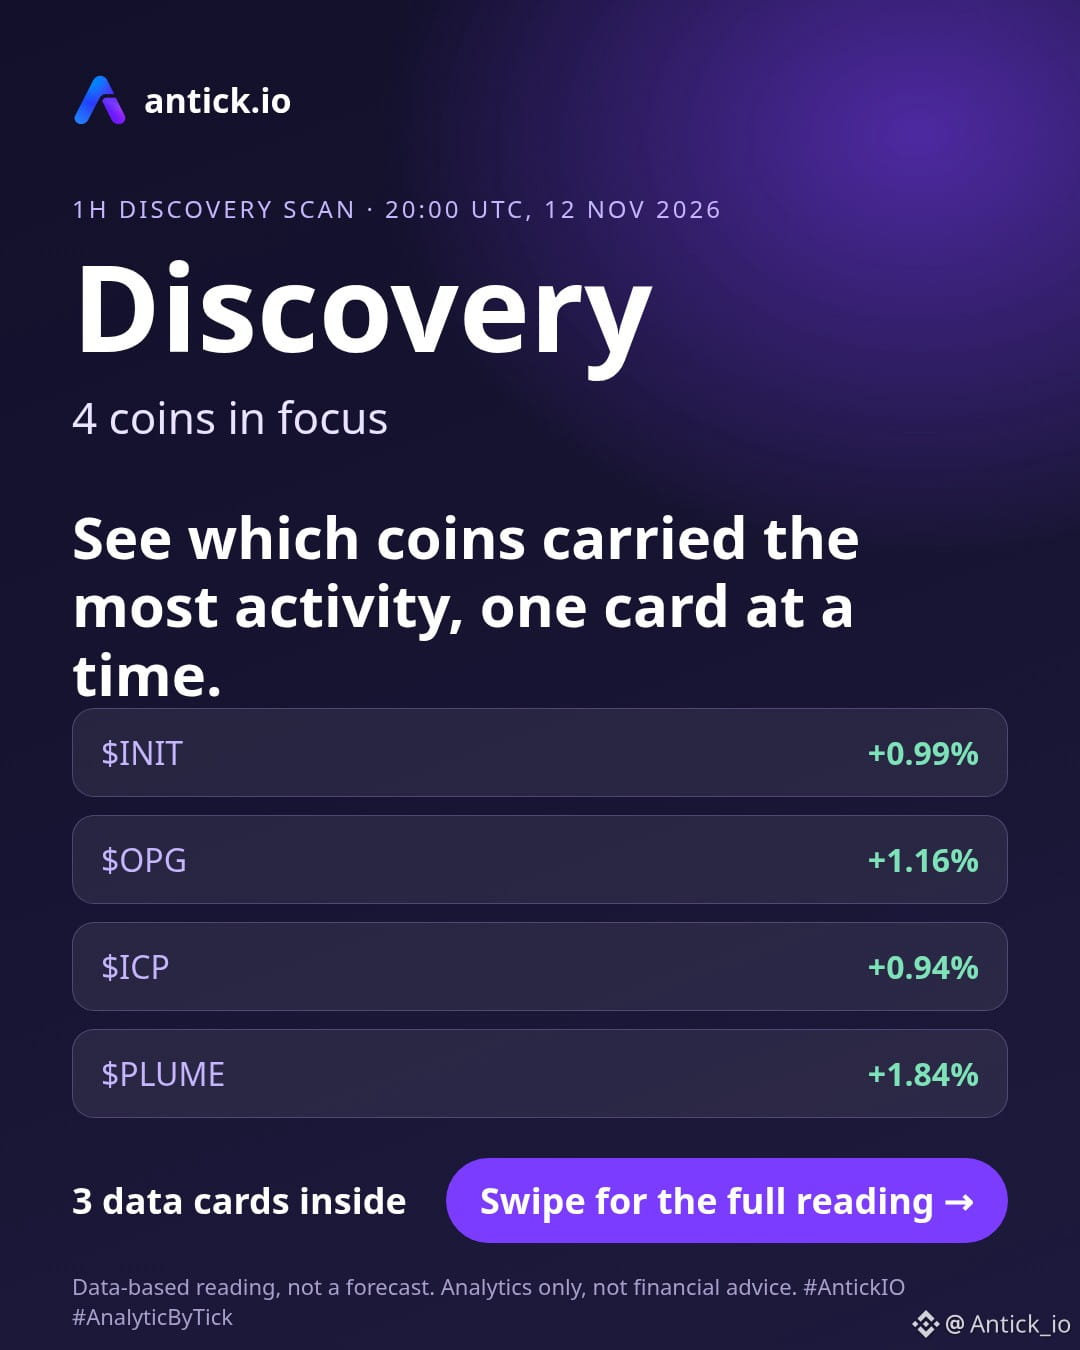
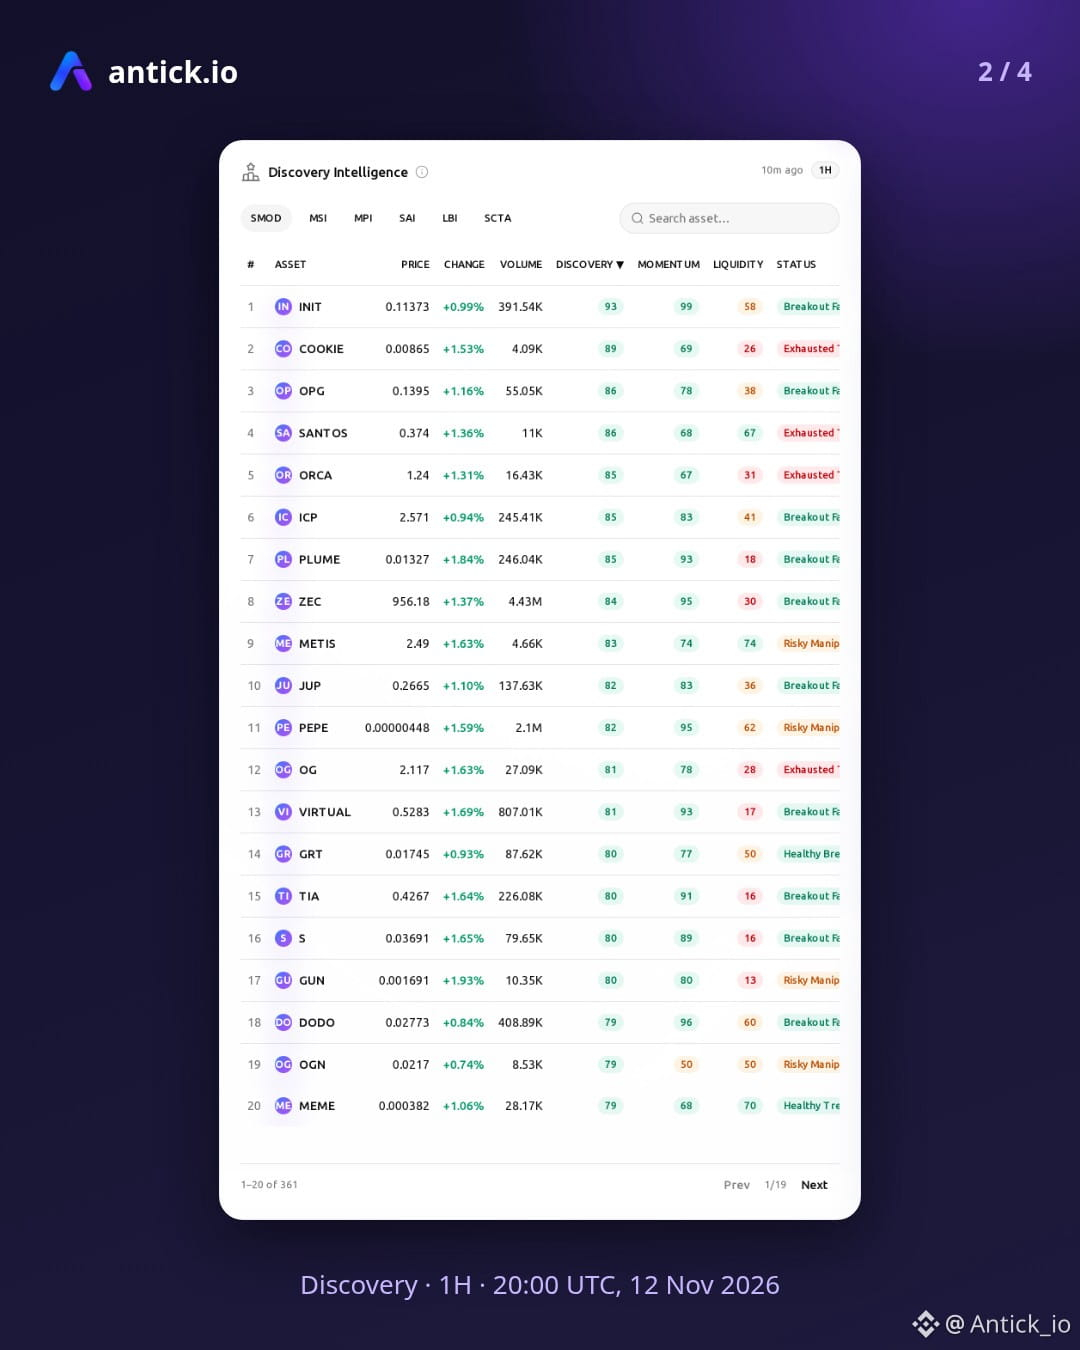
Discovery scan: $INIT $OPG ICP PLUME · 1H check · data as of 20:00 UTC, 12 Nov 2026
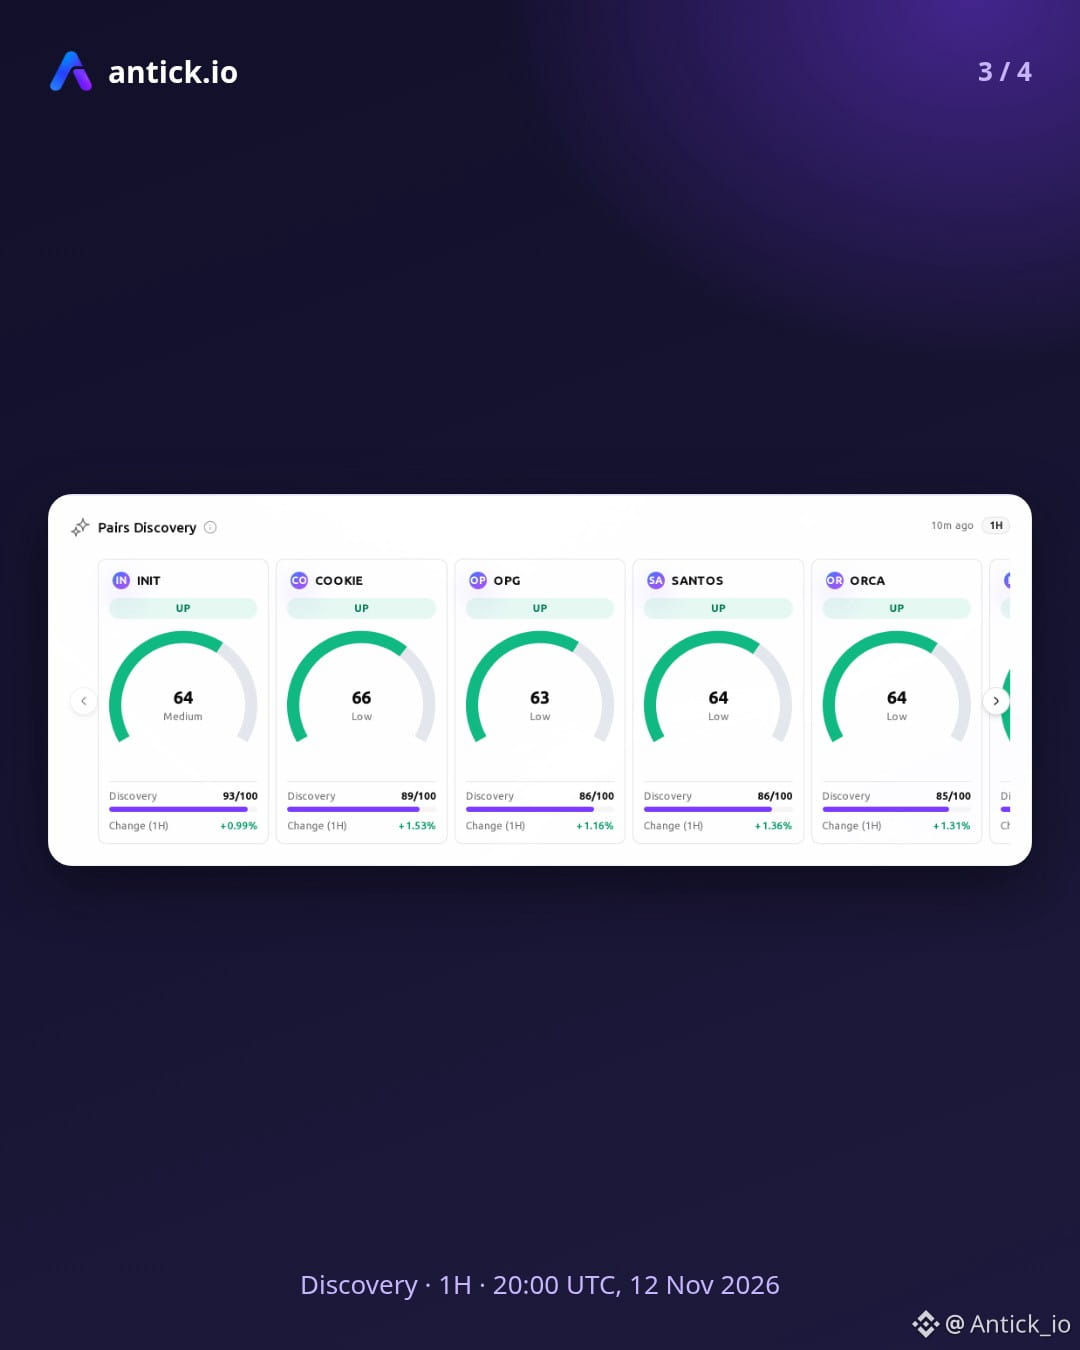
INIT moved up with split engines and a transitioning state, so a rebound could extend if follow-through appears, or a pullback could develop if it does not. OPG shows a breakout attempt without clean follow-through and low confidence; higher prices could come if engines confirm, and lower prices could come if they do not. ICP is ranging after its move up, and a bounce could form on a break above the range just as a drop could form on a break below it. PLUME sits in a transitioning state with most engines unconfirmed, leaving upside possible if confirmation arrives and downside possible if it stays absent.
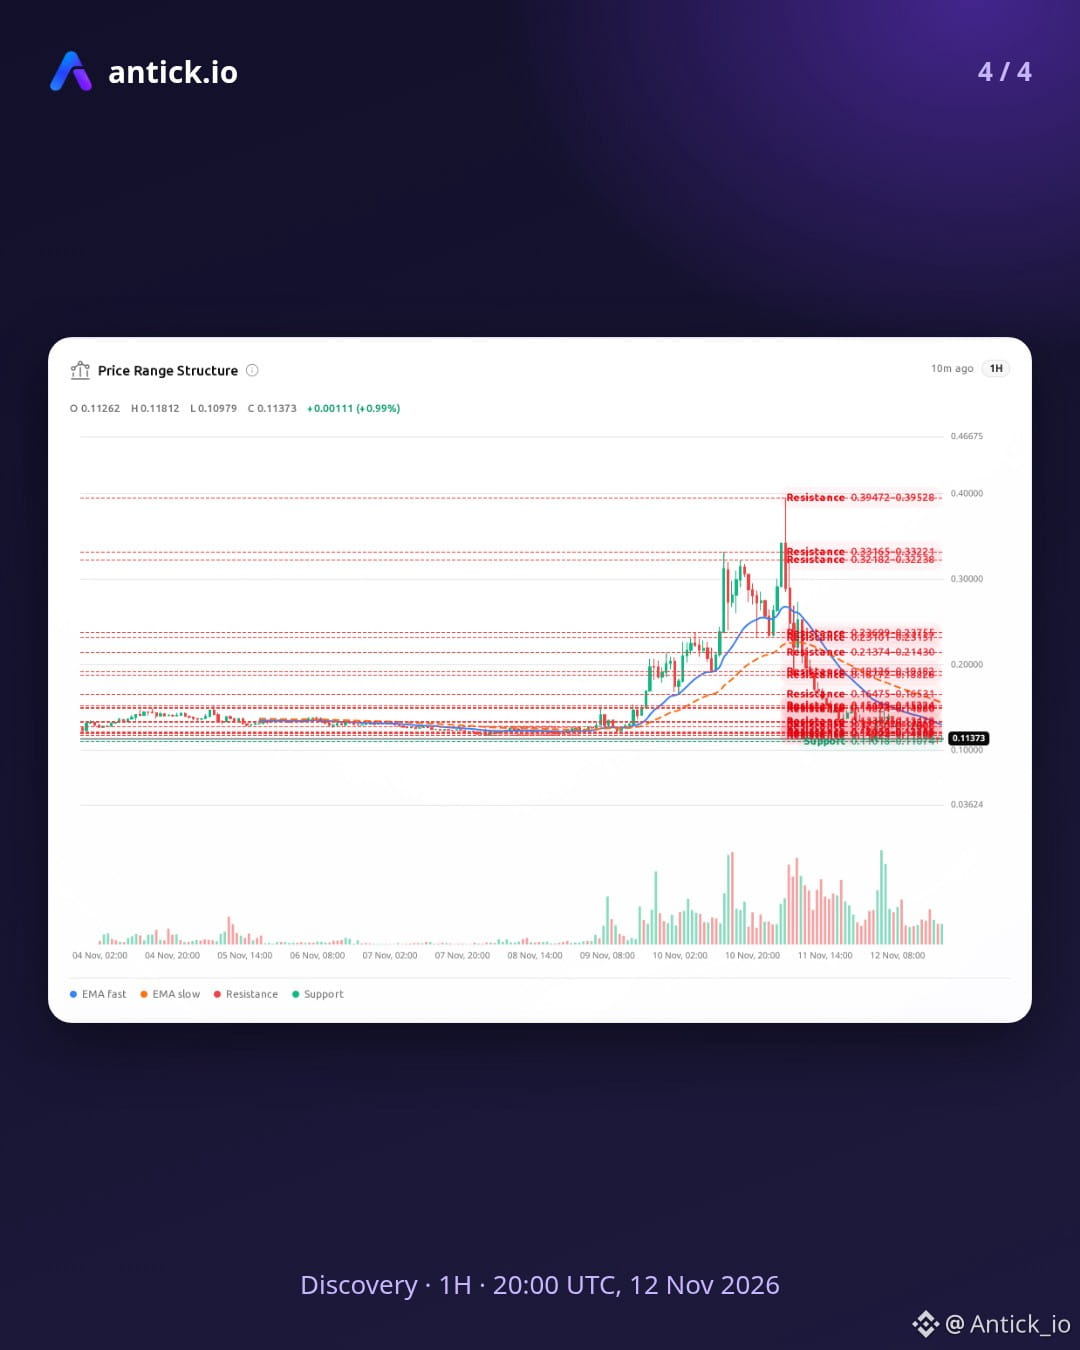
$INIT: 0.11373 (+0.99% on the 1H), support 0.11018 to 0.11074, resistance 0.11724 to 0.11807
$OPG: 0.1395 (+1.16% on the 1H), support 0.13585 to 0.13655, resistance 0.13915 to 0.13985
ICP: 2.571 (+0.94% on the 1H), support 2.5546 to 2.5674, resistance 2.5816 to 2.5944
PLUME: 0.01327 (+1.84% on the 1H), support 0.0131 to 0.01321, resistance 0.01324 to 0.01335
Data-based reading, not a forecast. Analytics only, not financial advice.
$INIT $OPG ICP PLUME #AntickIO #AnalyticByTick #CryptoDiscovery
Discovery scan: $INIT $OPG ICP PLUME · 1H check · data as of 20:00 UTC, 12 Nov 2026
INIT moved up with split engines and a transitioning state, so a rebound could extend if follow-through appears, or a pullback could develop if it does not. OPG shows a breakout attempt without clean follow-through and low confidence; higher prices could come if engines confirm, and lower prices could come if they do not. ICP is ranging after its move up, and a bounce could form on a break above the range just as a drop could form on a break below it. PLUME sits in a transitioning state with most engines unconfirmed, leaving upside possible if confirmation arrives and downside possible if it stays absent.
$INIT : 0.11373 (+0.99% on the 1H), support 0.11018 to 0.11074, resistance 0.11724 to 0.11807
$OPG : 0.1395 (+1.16% on the 1H), support 0.13585 to 0.13655, resistance 0.13915 to 0.13985
ICP: 2.571 (+0.94% on the 1H), support 2.5546 to 2.5674, resistance 2.5816 to 2.5944
PLUME: 0.01327 (+1.84% on the 1H), support 0.0131 to 0.01321, resistance 0.01324 to 0.01335
Data-based reading, not a forecast. Analytics only, not financial advice.
$INIT $OPG ICP PLUME #AntickIO #AnalyticByTick #CryptoDiscovery
INIT moved up with split engines and a transitioning state, so a rebound could extend if follow-through appears, or a pullback could develop if it does not. OPG shows a breakout attempt without clean follow-through and low confidence; higher prices could come if engines confirm, and lower prices could come if they do not. ICP is ranging after its move up, and a bounce could form on a break above the range just as a drop could form on a break below it. PLUME sits in a transitioning state with most engines unconfirmed, leaving upside possible if confirmation arrives and downside possible if it stays absent.
$INIT : 0.11373 (+0.99% on the 1H), support 0.11018 to 0.11074, resistance 0.11724 to 0.11807
$OPG : 0.1395 (+1.16% on the 1H), support 0.13585 to 0.13655, resistance 0.13915 to 0.13985
ICP: 2.571 (+0.94% on the 1H), support 2.5546 to 2.5674, resistance 2.5816 to 2.5944
PLUME: 0.01327 (+1.84% on the 1H), support 0.0131 to 0.01321, resistance 0.01324 to 0.01335
Data-based reading, not a forecast. Analytics only, not financial advice.
$INIT $OPG ICP PLUME #AntickIO #AnalyticByTick #CryptoDiscovery
443
·
--
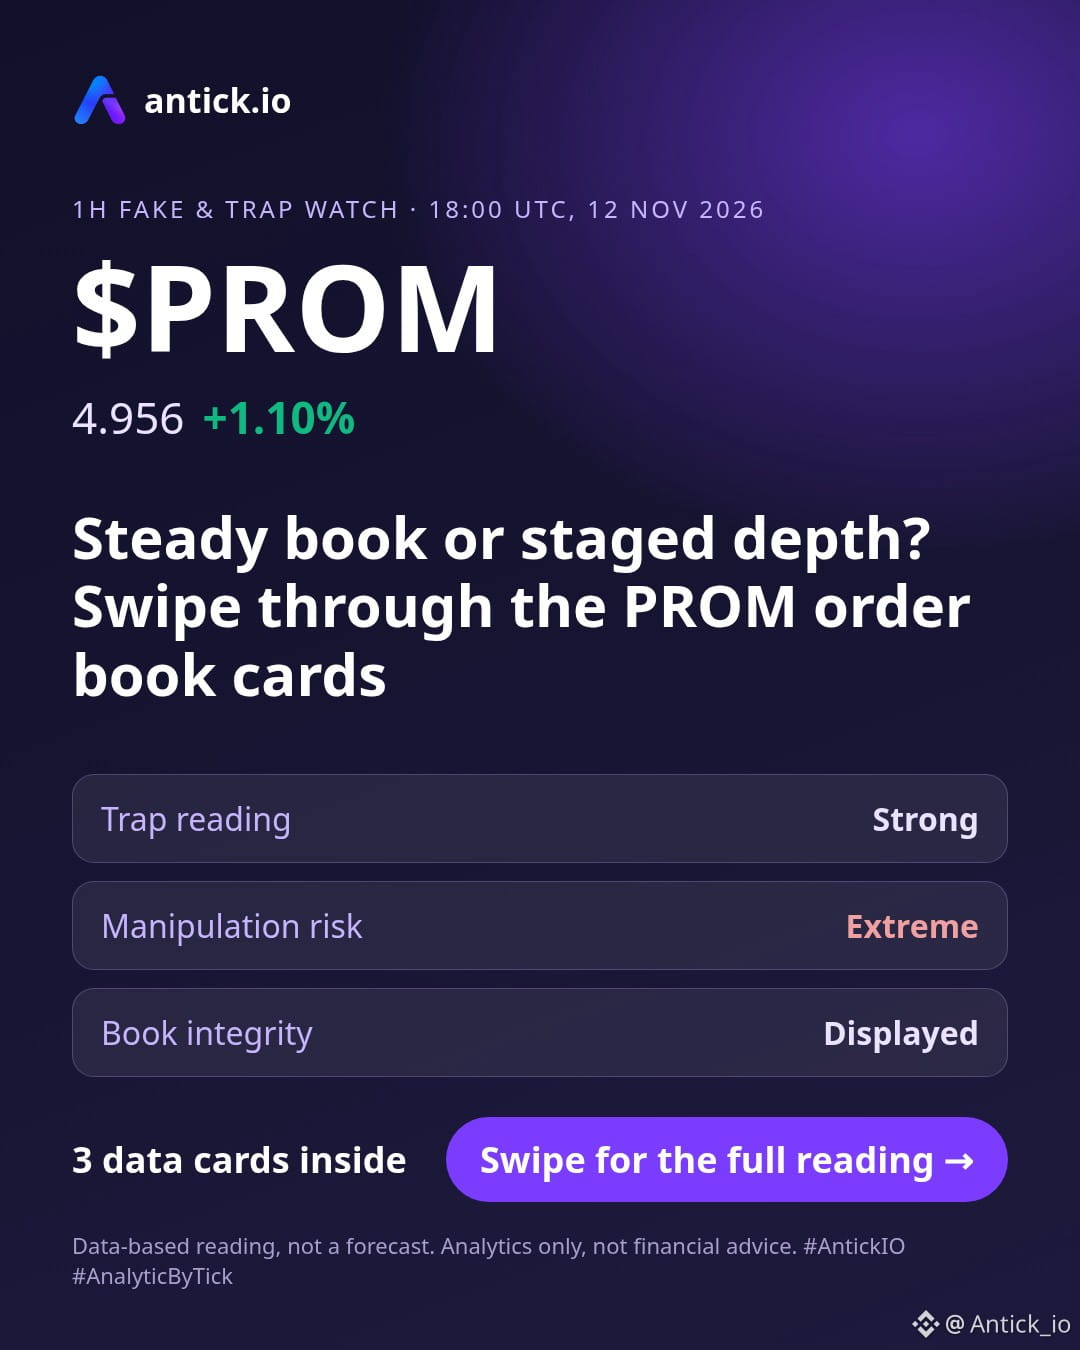
1H read | Order book watch: $PROM | data as of 18:00 UTC, 12 Nov 2026
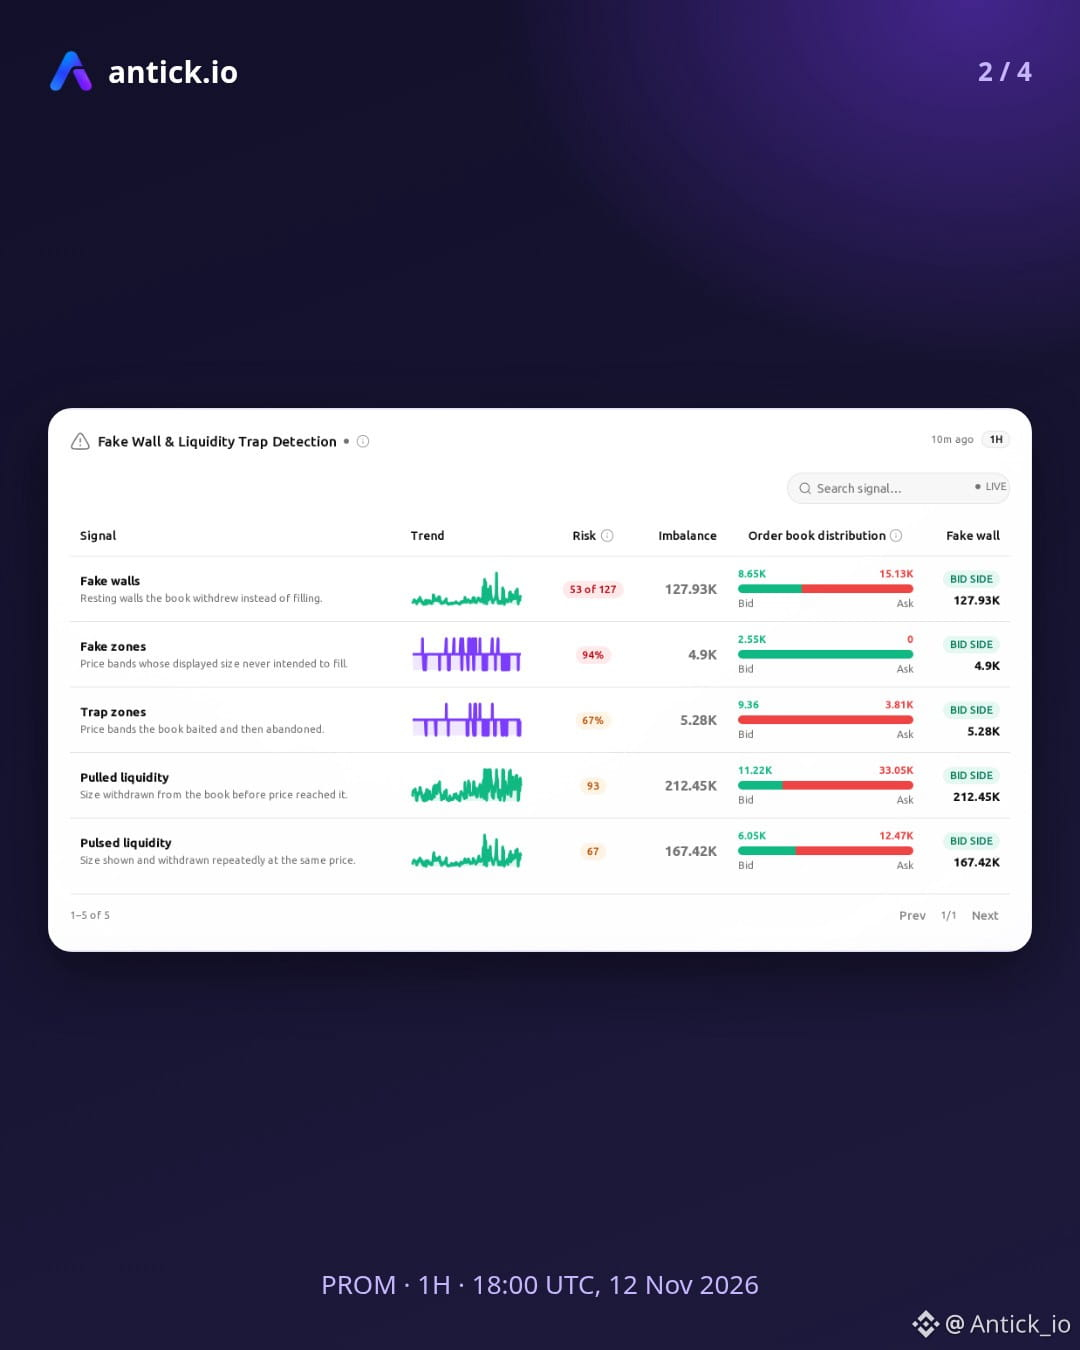
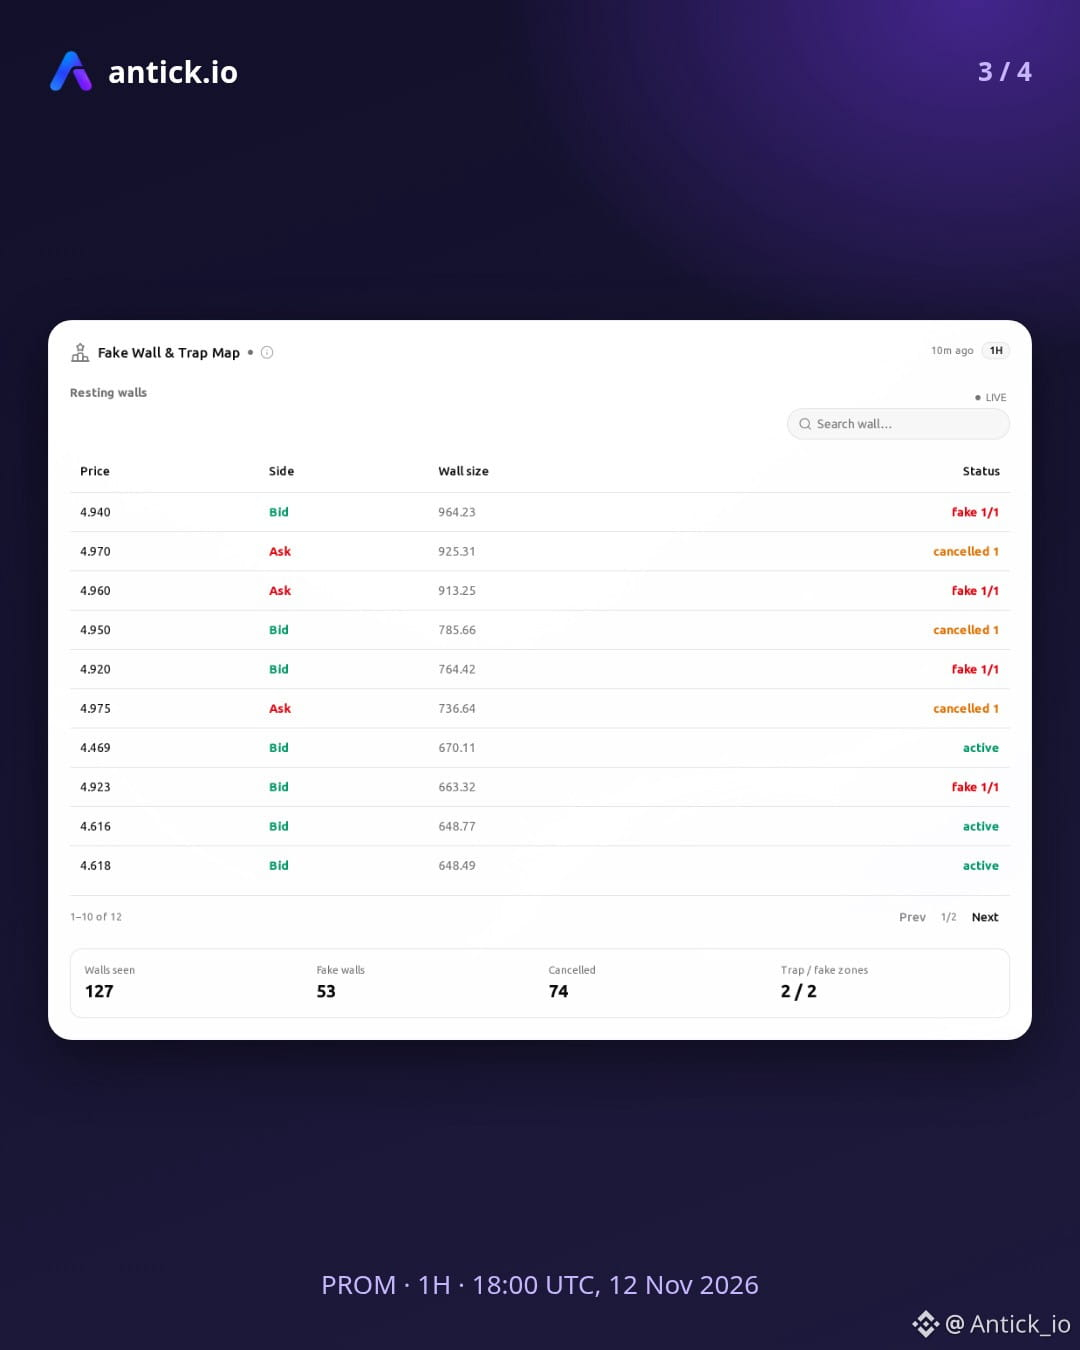
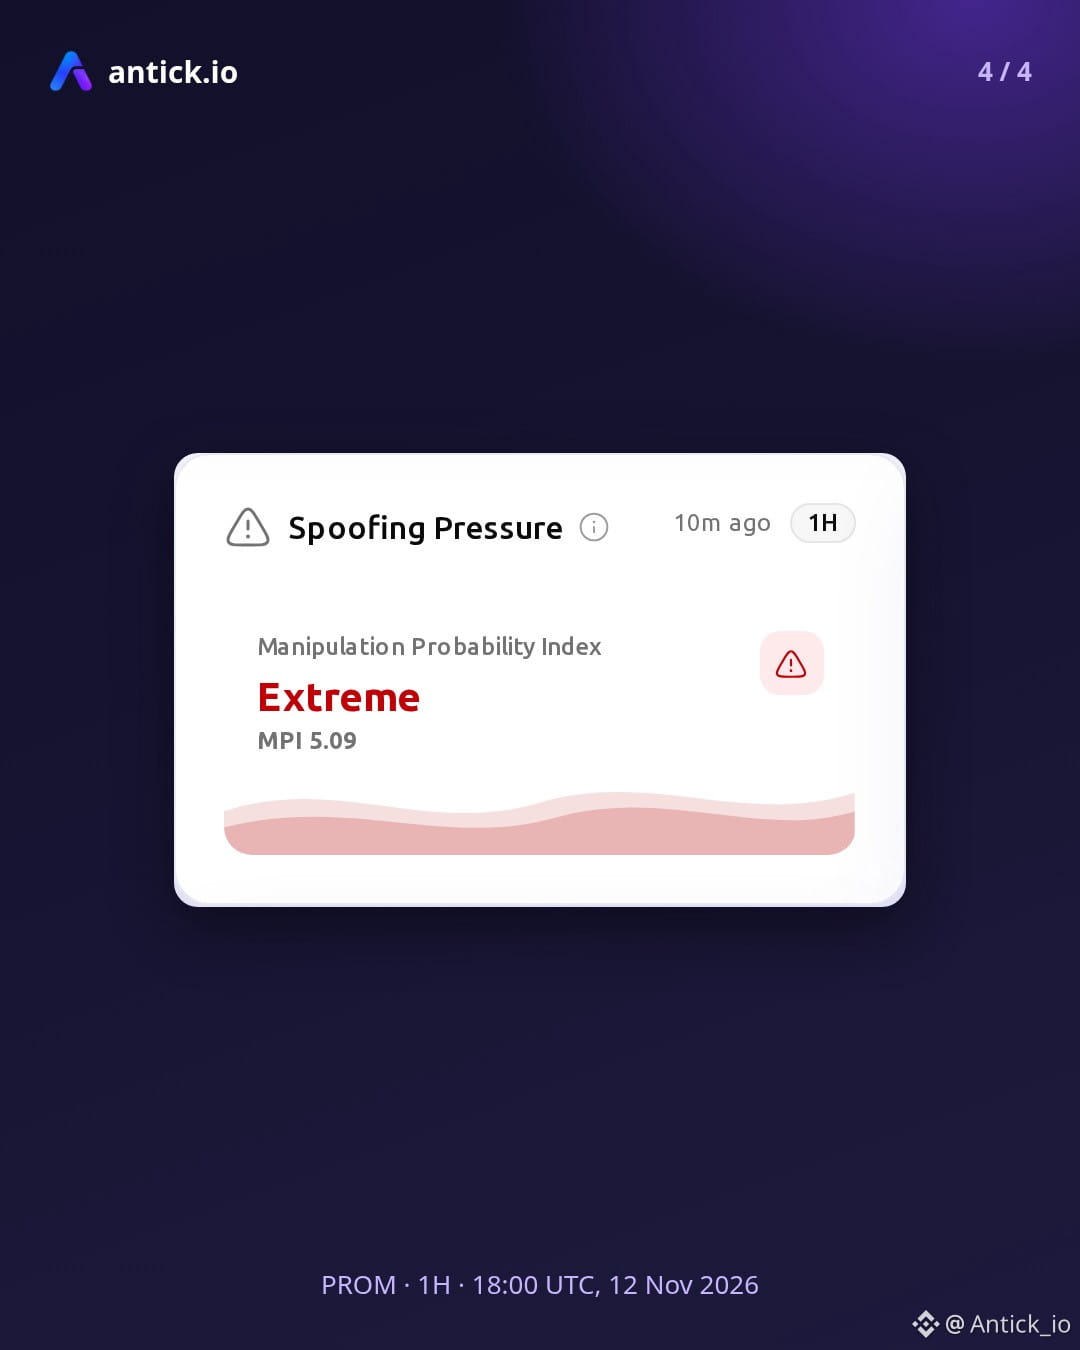
PROM book readings agree on stability: depth reads Deep, activity is Stable, and withdrawal shows None. They split on trust: the trap reading is Strong, manipulation risk reads Extreme, integrity is marked Displayed, and the Mixed Book regime fits no defined liquidity pattern. That gap is a reason to treat the visible walls with care. If deep depth and the lack of withdrawals keep holding, the book could leave room for a rebound higher. Should offer-side pressure and the strong trap reading weigh more, the book could leave room for a pullback lower. These readings describe how real the book looks, not where price is heading.
Risks to watch:
▸ State Stability (SS) turns negative, regime shift risk
▸ Cross-timeframe alignment (CTAC) falls below 0.45, higher timeframes stop confirming
Zones:
▸ Upside reading weakens on a 1H close below 4.8996 to 4.9244
▸ Downside reading weakens on a 1H close above 4.9576 to 4.9824
Data-based reading, not a forecast. Analytics only, not financial advice.
$PROM #PROM #AntickIO #AnalyticByTick #OrderBook
1H read | Order book watch: $PROM | data as of 18:00 UTC, 12 Nov 2026
PROM book readings agree on stability: depth reads Deep, activity is Stable, and withdrawal shows None. They split on trust: the trap reading is Strong, manipulation risk reads Extreme, integrity is marked Displayed, and the Mixed Book regime fits no defined liquidity pattern. That gap is a reason to treat the visible walls with care. If deep depth and the lack of withdrawals keep holding, the book could leave room for a rebound higher. Should offer-side pressure and the strong trap reading weigh more, the book could leave room for a pullback lower. These readings describe how real the book looks, not where price is heading.
Risks to watch:
▸ State Stability (SS) turns negative, regime shift risk
▸ Cross-timeframe alignment (CTAC) falls below 0.45, higher timeframes stop confirming
Zones:
▸ Upside reading weakens on a 1H close below 4.8996 to 4.9244
▸ Downside reading weakens on a 1H close above 4.9576 to 4.9824
Data-based reading, not a forecast. Analytics only, not financial advice.
$PROM #PROM #AntickIO #AnalyticByTick #OrderBook
PROM book readings agree on stability: depth reads Deep, activity is Stable, and withdrawal shows None. They split on trust: the trap reading is Strong, manipulation risk reads Extreme, integrity is marked Displayed, and the Mixed Book regime fits no defined liquidity pattern. That gap is a reason to treat the visible walls with care. If deep depth and the lack of withdrawals keep holding, the book could leave room for a rebound higher. Should offer-side pressure and the strong trap reading weigh more, the book could leave room for a pullback lower. These readings describe how real the book looks, not where price is heading.
Risks to watch:
▸ State Stability (SS) turns negative, regime shift risk
▸ Cross-timeframe alignment (CTAC) falls below 0.45, higher timeframes stop confirming
Zones:
▸ Upside reading weakens on a 1H close below 4.8996 to 4.9244
▸ Downside reading weakens on a 1H close above 4.9576 to 4.9824
Data-based reading, not a forecast. Analytics only, not financial advice.
$PROM #PROM #AntickIO #AnalyticByTick #OrderBook
57
·
--
Crypto market on the 1H, data as of 16:00 UTC, 12 Nov 2026
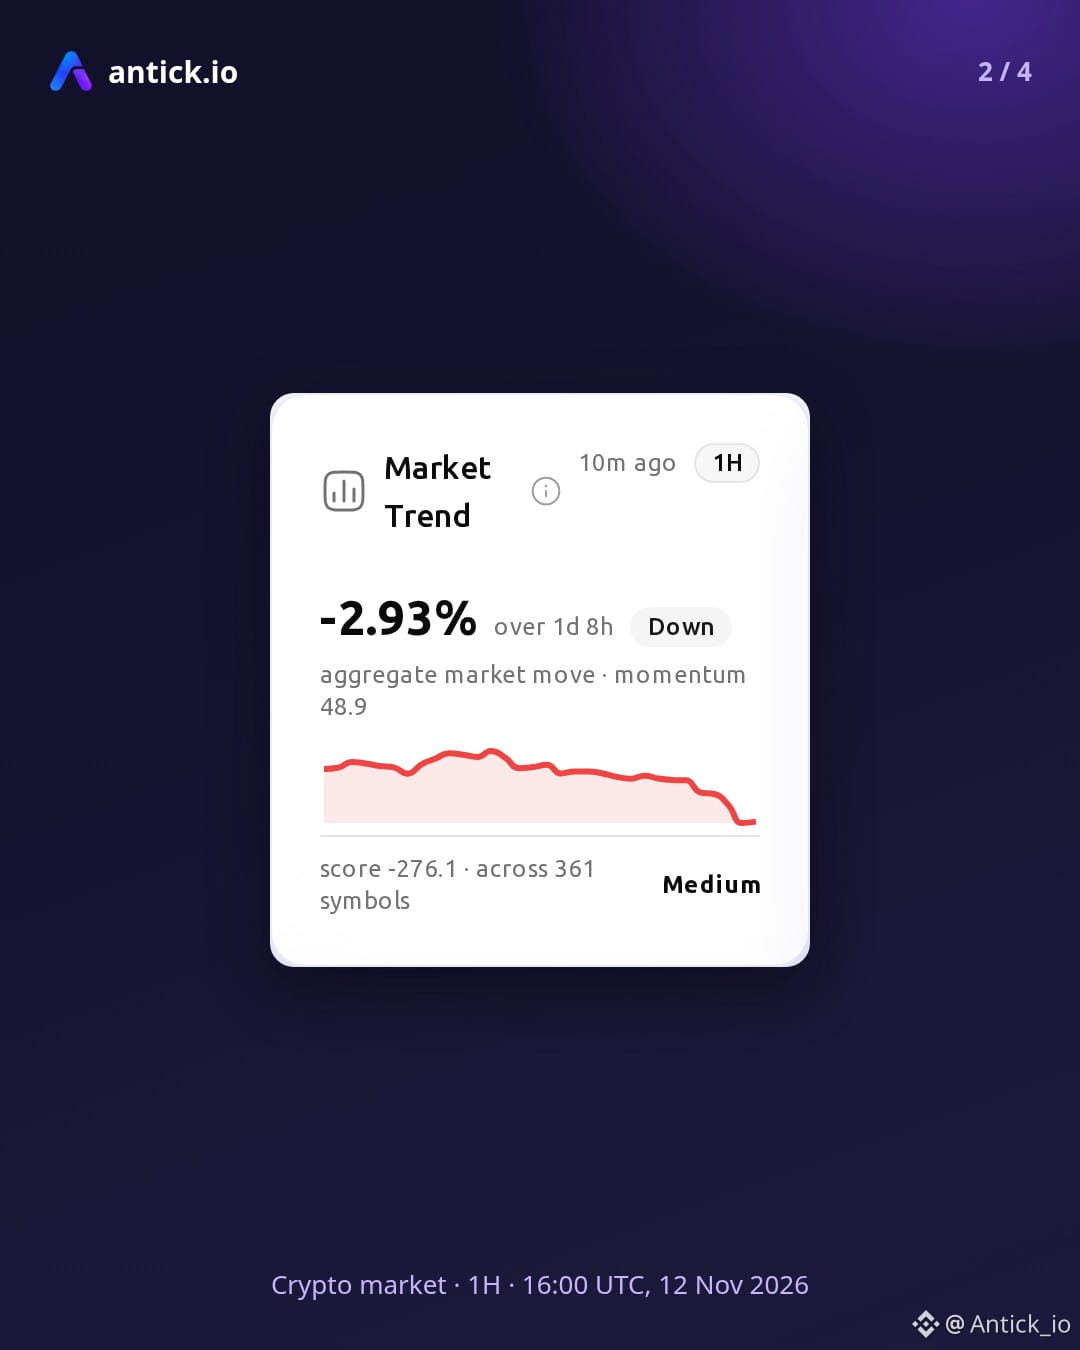
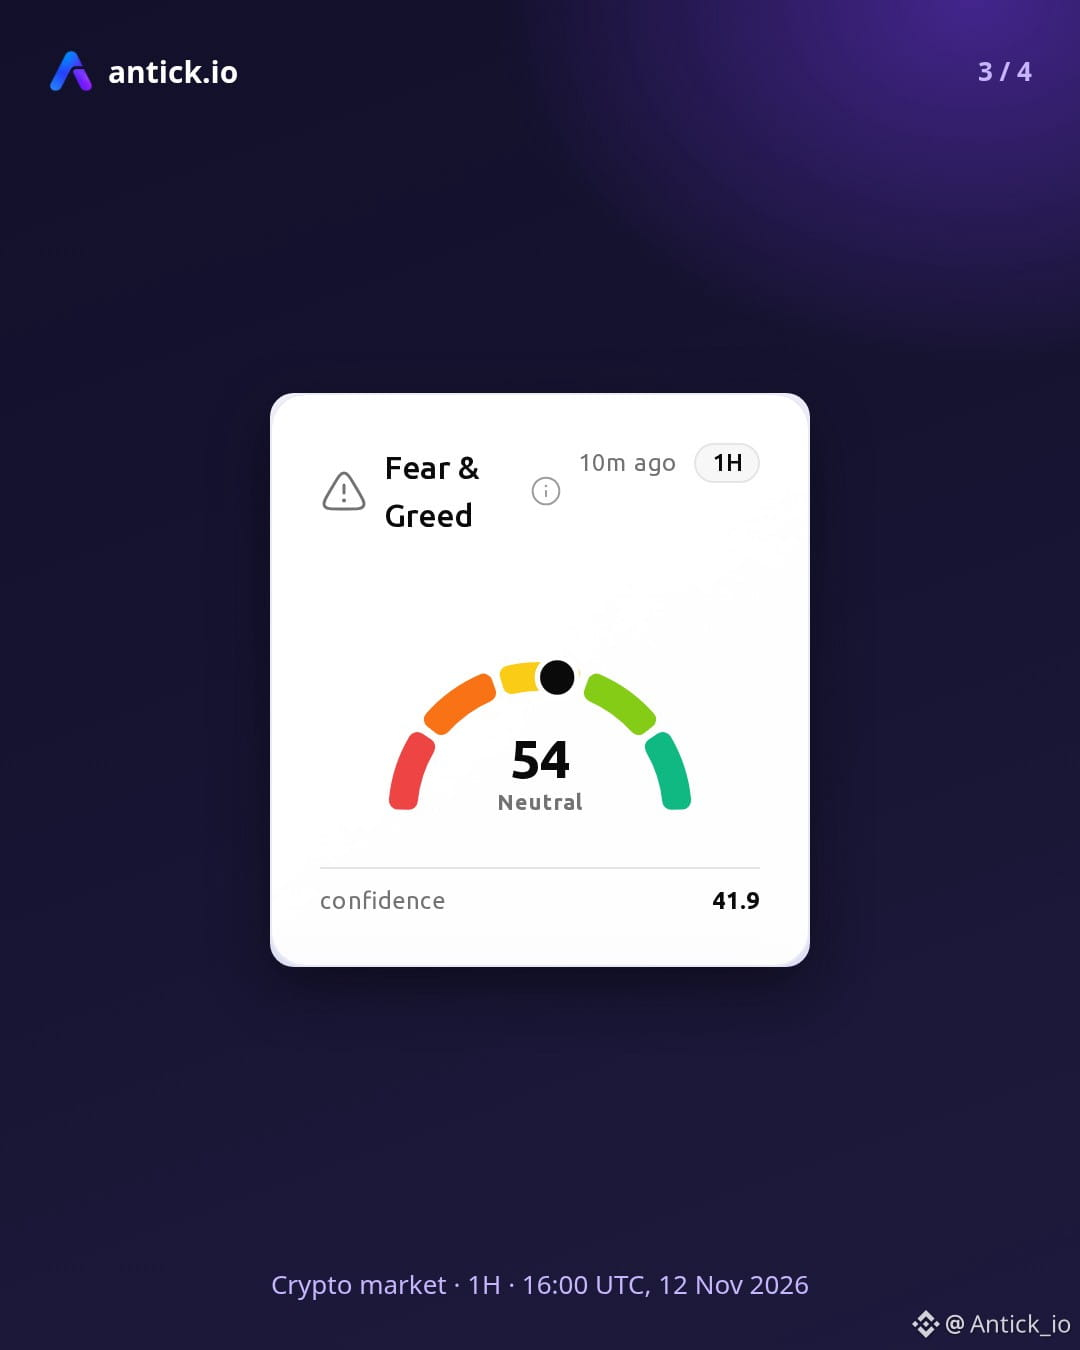
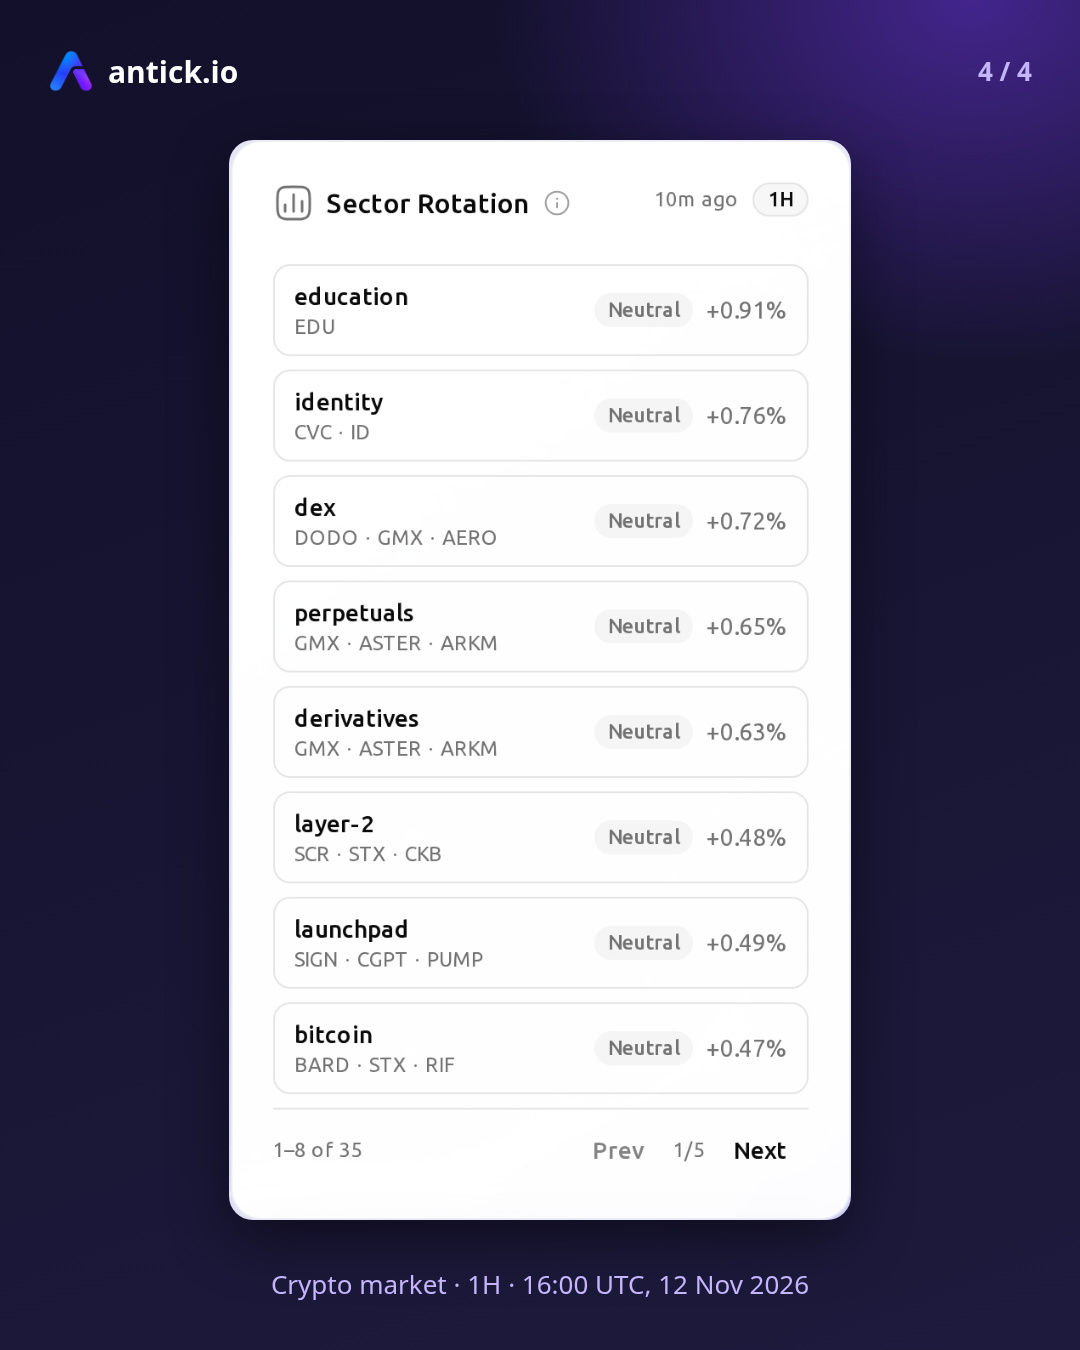
Can a bullish undercurrent hold its ground against a falling hourly trend? On the hourly chart the trend points down with medium strength, Fear and Greed reads Neutral, and the market sits in a compression zone. If bullish breadth and a bullish bias gain traction, a recovery out of the compression could unfold, while if the downward direction and its medium strength stay in control, a move lower could unfold instead. Rotation looks neutral across the leading sectors of education, identity, and dex, while made-in-america, ai, and rwa lead the trending narratives, all marked Rising.
Fear & Greed: 54, Neutral
Breadth: 269 up, 64 down, 28 flat
Trend over the 1D8H window: down, medium (-2.93%)
Leading sectors: Education, Identity, DEX
Data-based reading, not a forecast. Analytics only, not financial advice.
#AntickIO #AnalyticByTick #MarketPulse
Crypto market on the 1H, data as of 16:00 UTC, 12 Nov 2026
Can a bullish undercurrent hold its ground against a falling hourly trend? On the hourly chart the trend points down with medium strength, Fear and Greed reads Neutral, and the market sits in a compression zone. If bullish breadth and a bullish bias gain traction, a recovery out of the compression could unfold, while if the downward direction and its medium strength stay in control, a move lower could unfold instead. Rotation looks neutral across the leading sectors of education, identity, and dex, while made-in-america, ai, and rwa lead the trending narratives, all marked Rising.
Fear & Greed: 54, Neutral
Breadth: 269 up, 64 down, 28 flat
Trend over the 1D8H window: down, medium (-2.93%)
Leading sectors: Education, Identity, DEX
Data-based reading, not a forecast. Analytics only, not financial advice.
#AntickIO #AnalyticByTick #MarketPulse
Can a bullish undercurrent hold its ground against a falling hourly trend? On the hourly chart the trend points down with medium strength, Fear and Greed reads Neutral, and the market sits in a compression zone. If bullish breadth and a bullish bias gain traction, a recovery out of the compression could unfold, while if the downward direction and its medium strength stay in control, a move lower could unfold instead. Rotation looks neutral across the leading sectors of education, identity, and dex, while made-in-america, ai, and rwa lead the trending narratives, all marked Rising.
Fear & Greed: 54, Neutral
Breadth: 269 up, 64 down, 28 flat
Trend over the 1D8H window: down, medium (-2.93%)
Leading sectors: Education, Identity, DEX
Data-based reading, not a forecast. Analytics only, not financial advice.
#AntickIO #AnalyticByTick #MarketPulse

134
·
--
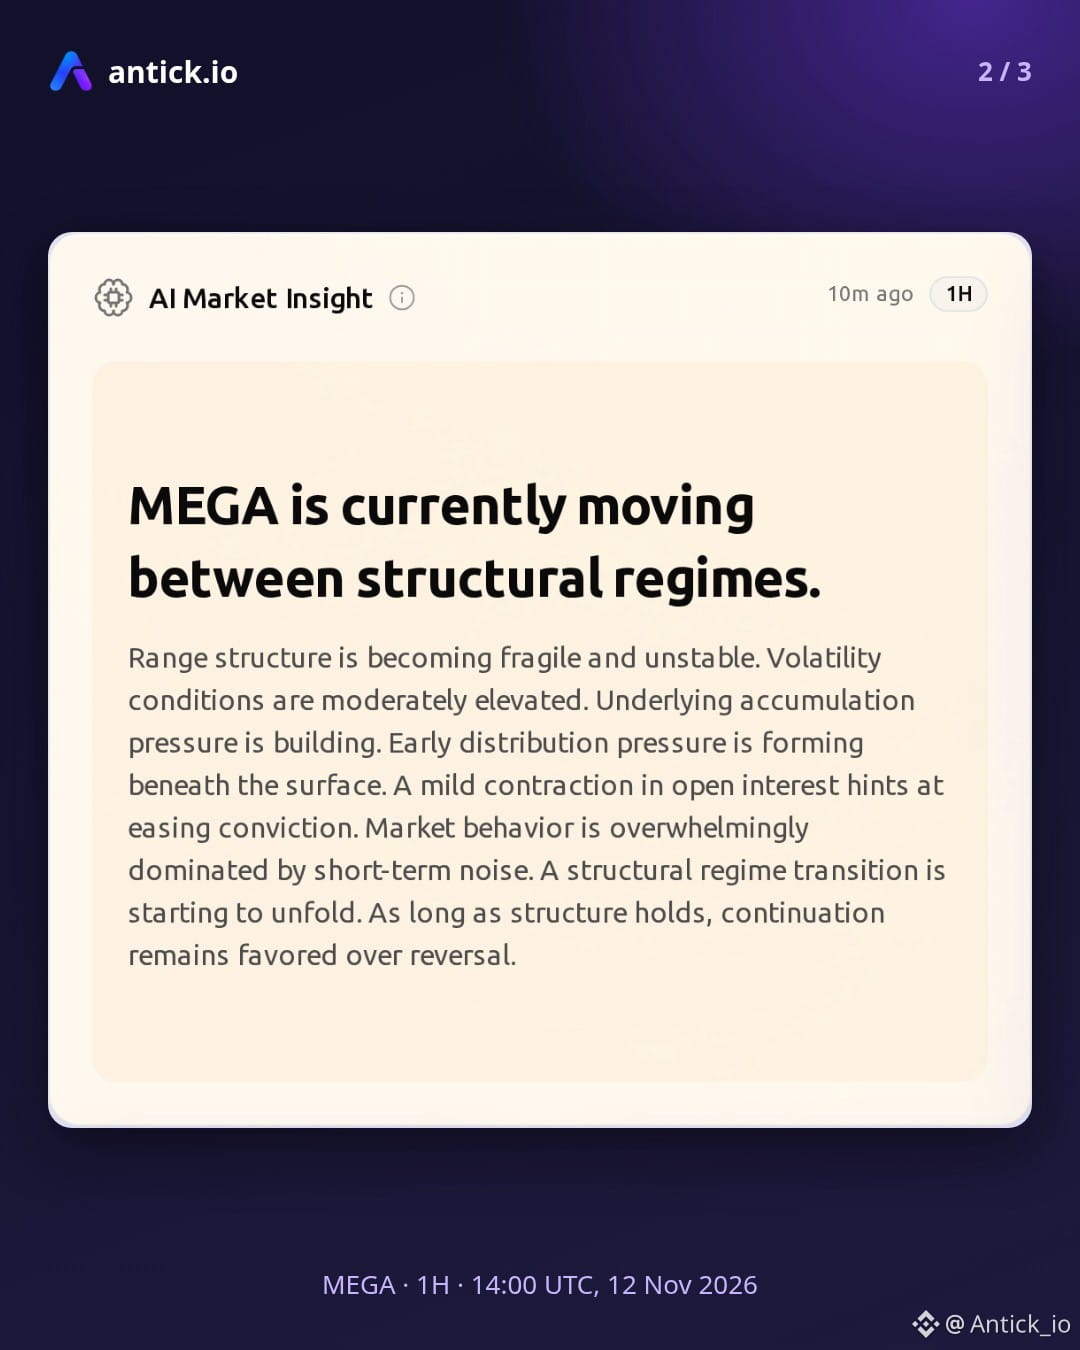
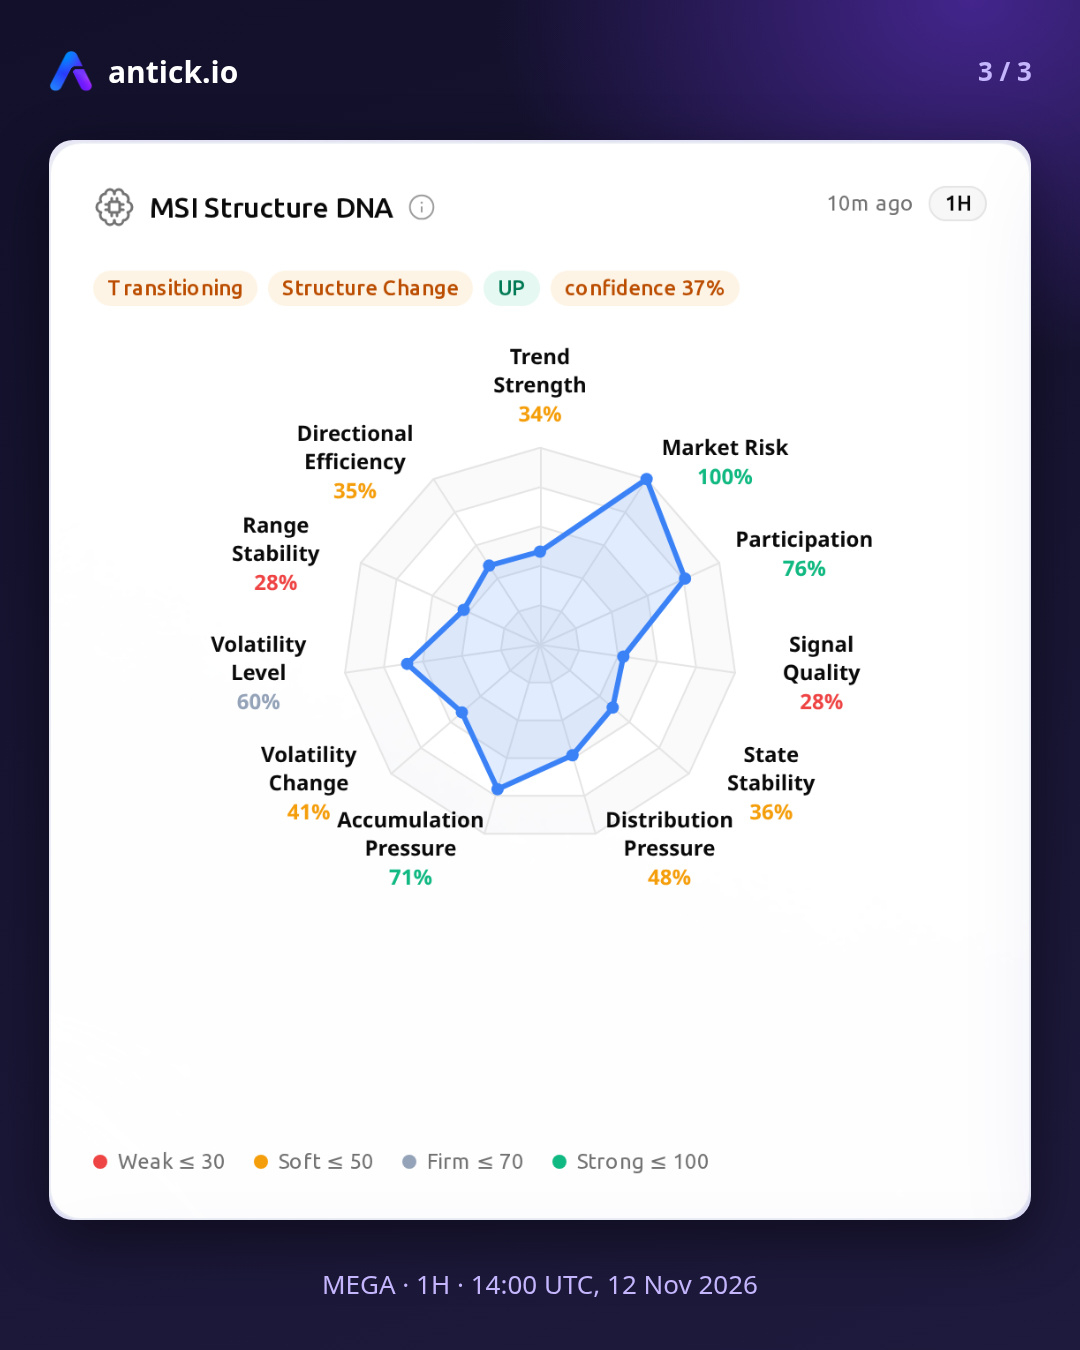
$MEGA · 1H · Data as of 14:00 UTC, 12 Nov 2026
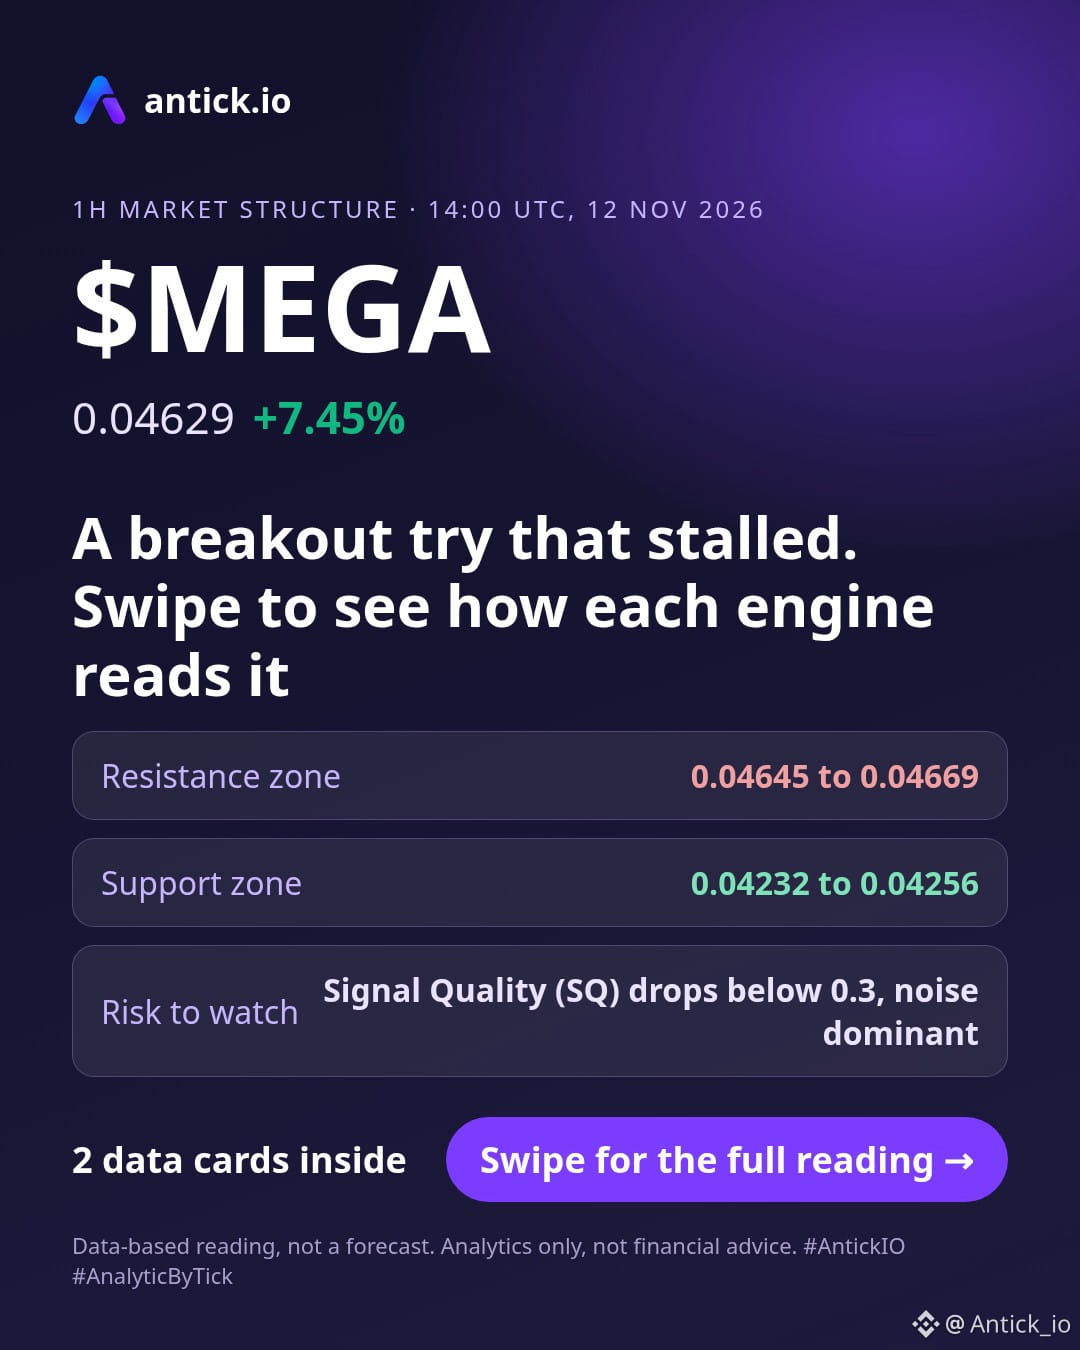
The clearest reading on MEGA's hourly chart is a breakout attempt that lacks clean follow-through, while the structure engine shows a regime in transition. If the structure change keeps breaking upward and cautious participation keeps building, a move to the upside remains possible. If the breakout stays unconfirmed and the neutral, non-accumulating structure keeps reversing, a pullback lower also remains possible. Tension between timeframes is building and the order book shows no defined liquidity pattern, so neither path has clear backing yet.
Risk conditions:
- Signal Quality (SQ) drops below 0.3, noise dominant
- Distribution Pressure (DP) exceeds ±0.1
Invalidation zones:
- Upside reading weakens on a 1H close below 0.04232 to 0.04256
- Downside reading weakens on a 1H close above 0.04645 to 0.04669
Data-based reading, not a forecast. Analytics only, not financial advice.
$MEGA #MEGA #AntickIO #AnalyticByTick #CryptoAnalytics
$MEGA · 1H · Data as of 14:00 UTC, 12 Nov 2026
The clearest reading on MEGA's hourly chart is a breakout attempt that lacks clean follow-through, while the structure engine shows a regime in transition. If the structure change keeps breaking upward and cautious participation keeps building, a move to the upside remains possible. If the breakout stays unconfirmed and the neutral, non-accumulating structure keeps reversing, a pullback lower also remains possible. Tension between timeframes is building and the order book shows no defined liquidity pattern, so neither path has clear backing yet.
Risk conditions:
- Signal Quality (SQ) drops below 0.3, noise dominant
- Distribution Pressure (DP) exceeds ±0.1
Invalidation zones:
- Upside reading weakens on a 1H close below 0.04232 to 0.04256
- Downside reading weakens on a 1H close above 0.04645 to 0.04669
Data-based reading, not a forecast. Analytics only, not financial advice.
$MEGA #MEGA #AntickIO #AnalyticByTick #CryptoAnalytics
The clearest reading on MEGA's hourly chart is a breakout attempt that lacks clean follow-through, while the structure engine shows a regime in transition. If the structure change keeps breaking upward and cautious participation keeps building, a move to the upside remains possible. If the breakout stays unconfirmed and the neutral, non-accumulating structure keeps reversing, a pullback lower also remains possible. Tension between timeframes is building and the order book shows no defined liquidity pattern, so neither path has clear backing yet.
Risk conditions:
- Signal Quality (SQ) drops below 0.3, noise dominant
- Distribution Pressure (DP) exceeds ±0.1
Invalidation zones:
- Upside reading weakens on a 1H close below 0.04232 to 0.04256
- Downside reading weakens on a 1H close above 0.04645 to 0.04669
Data-based reading, not a forecast. Analytics only, not financial advice.
$MEGA #MEGA #AntickIO #AnalyticByTick #CryptoAnalytics
139
·
--
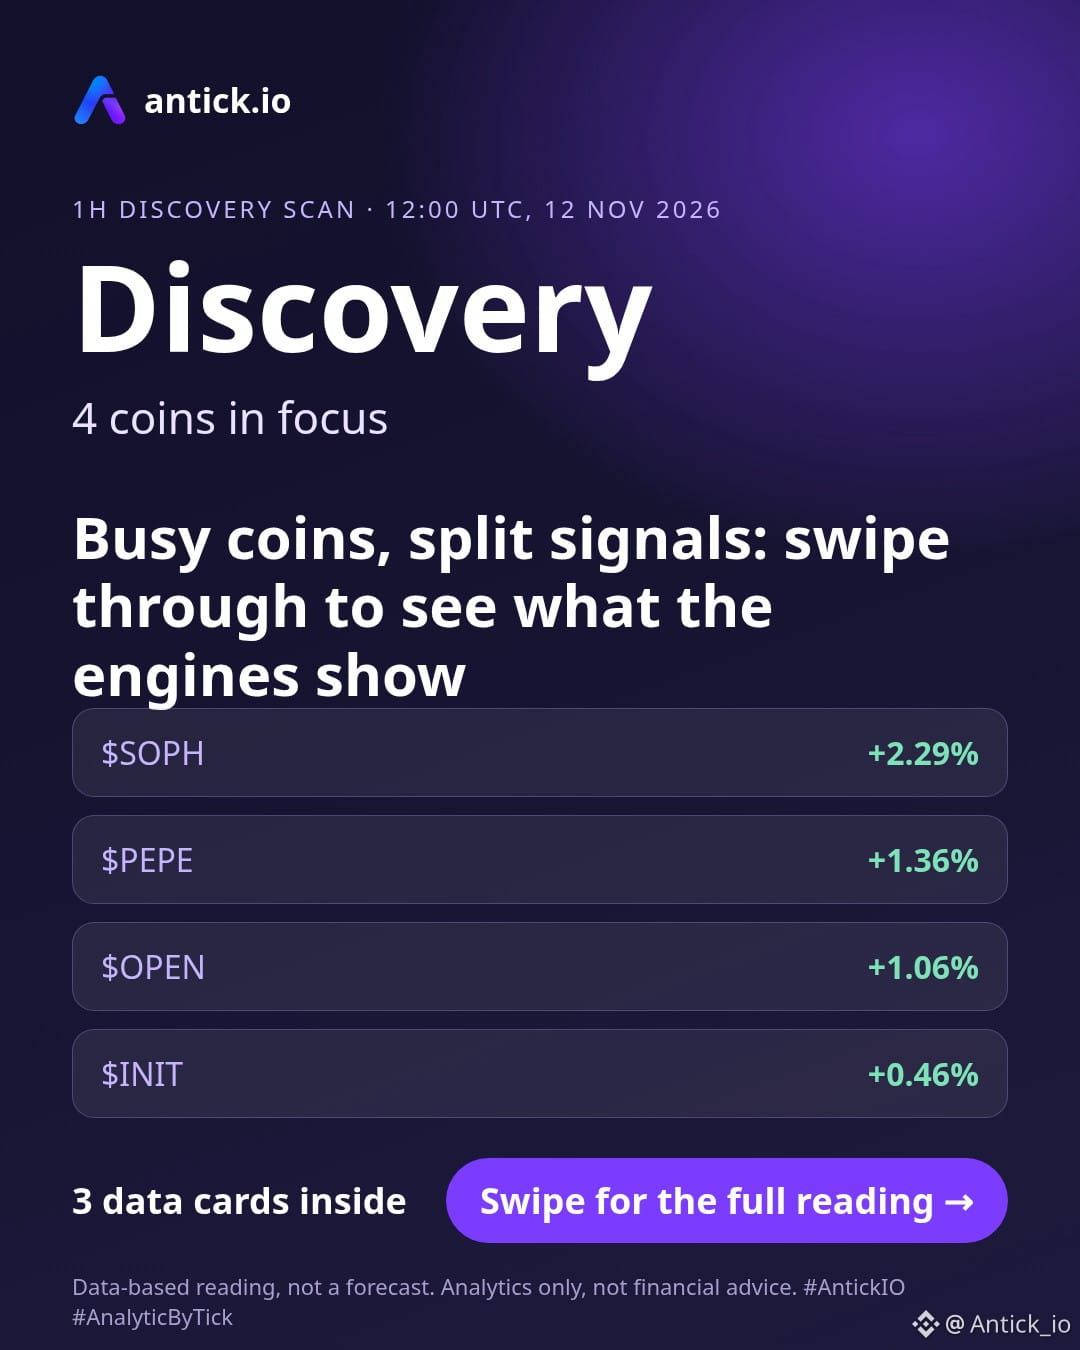
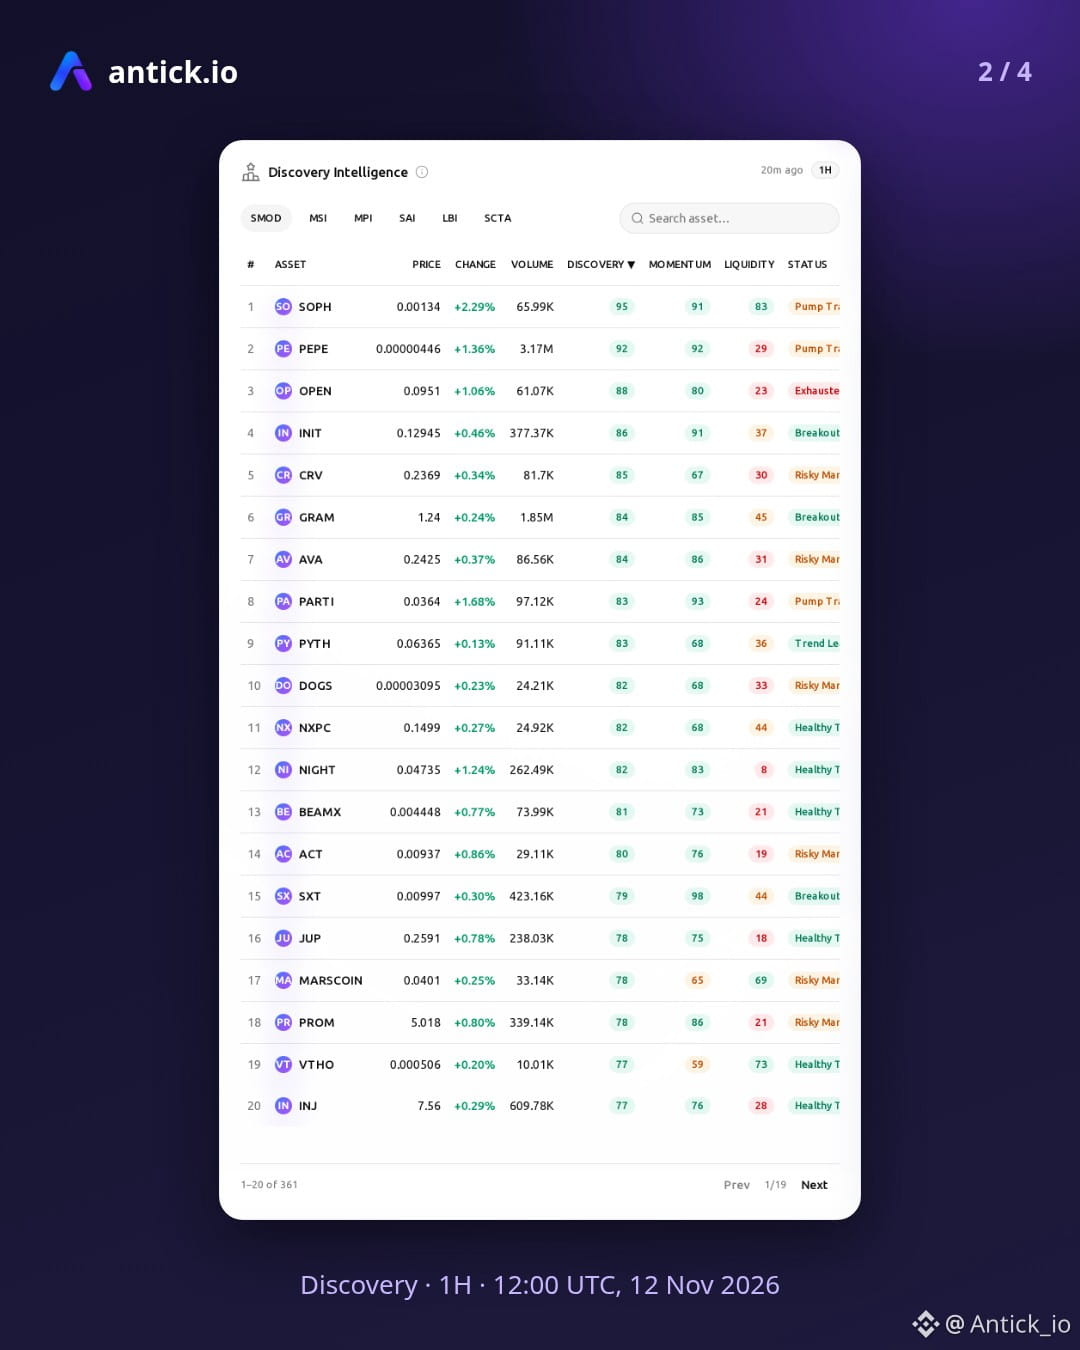
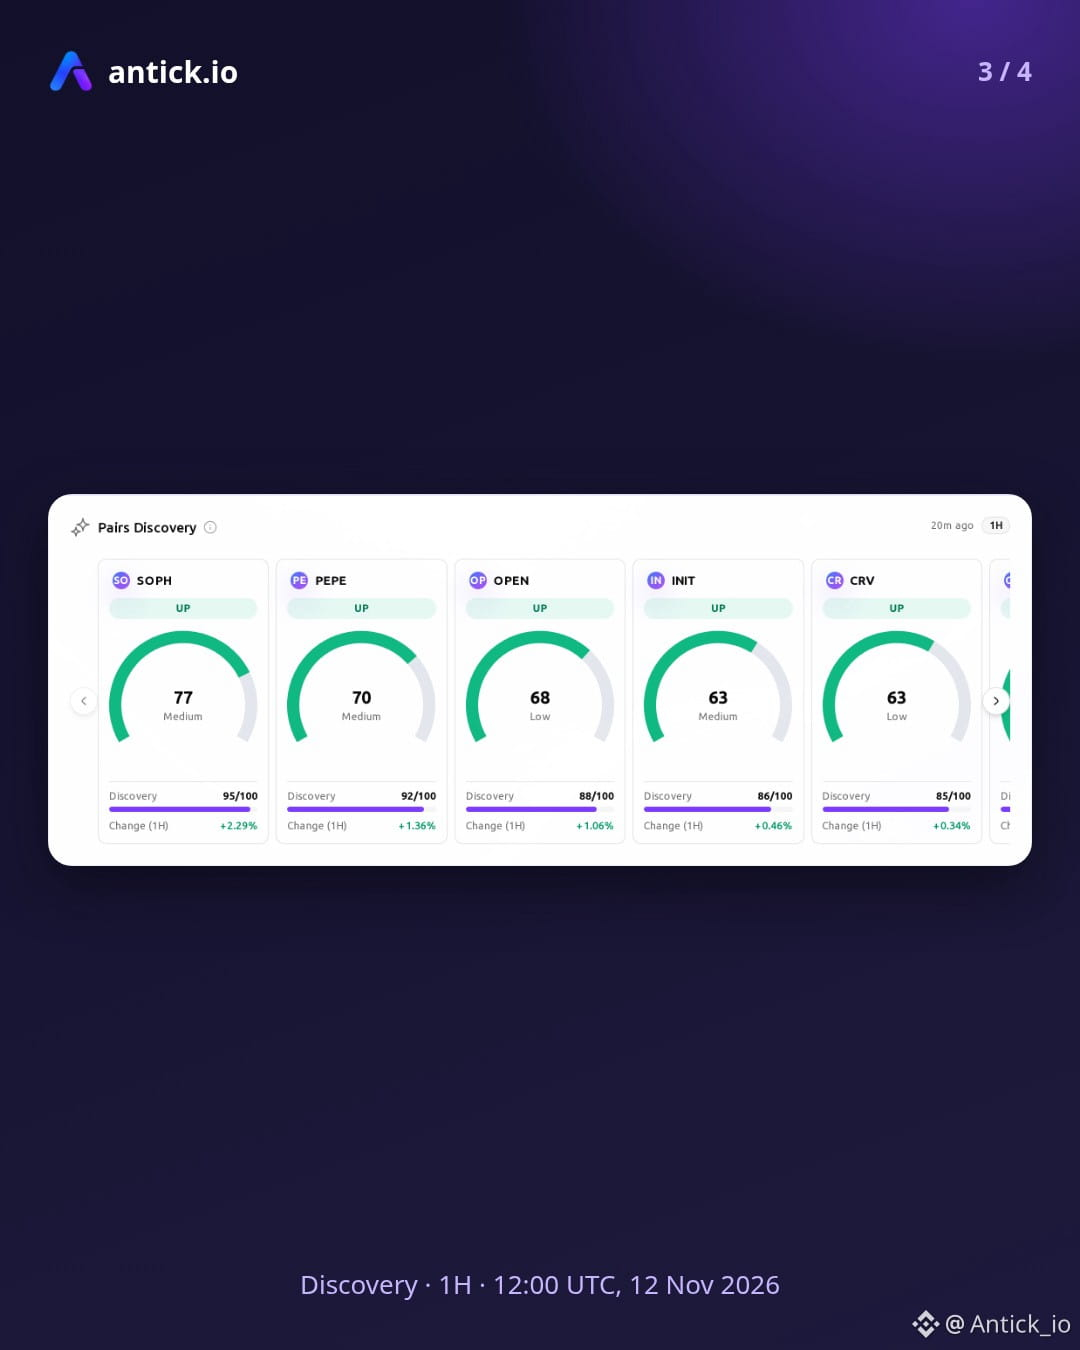
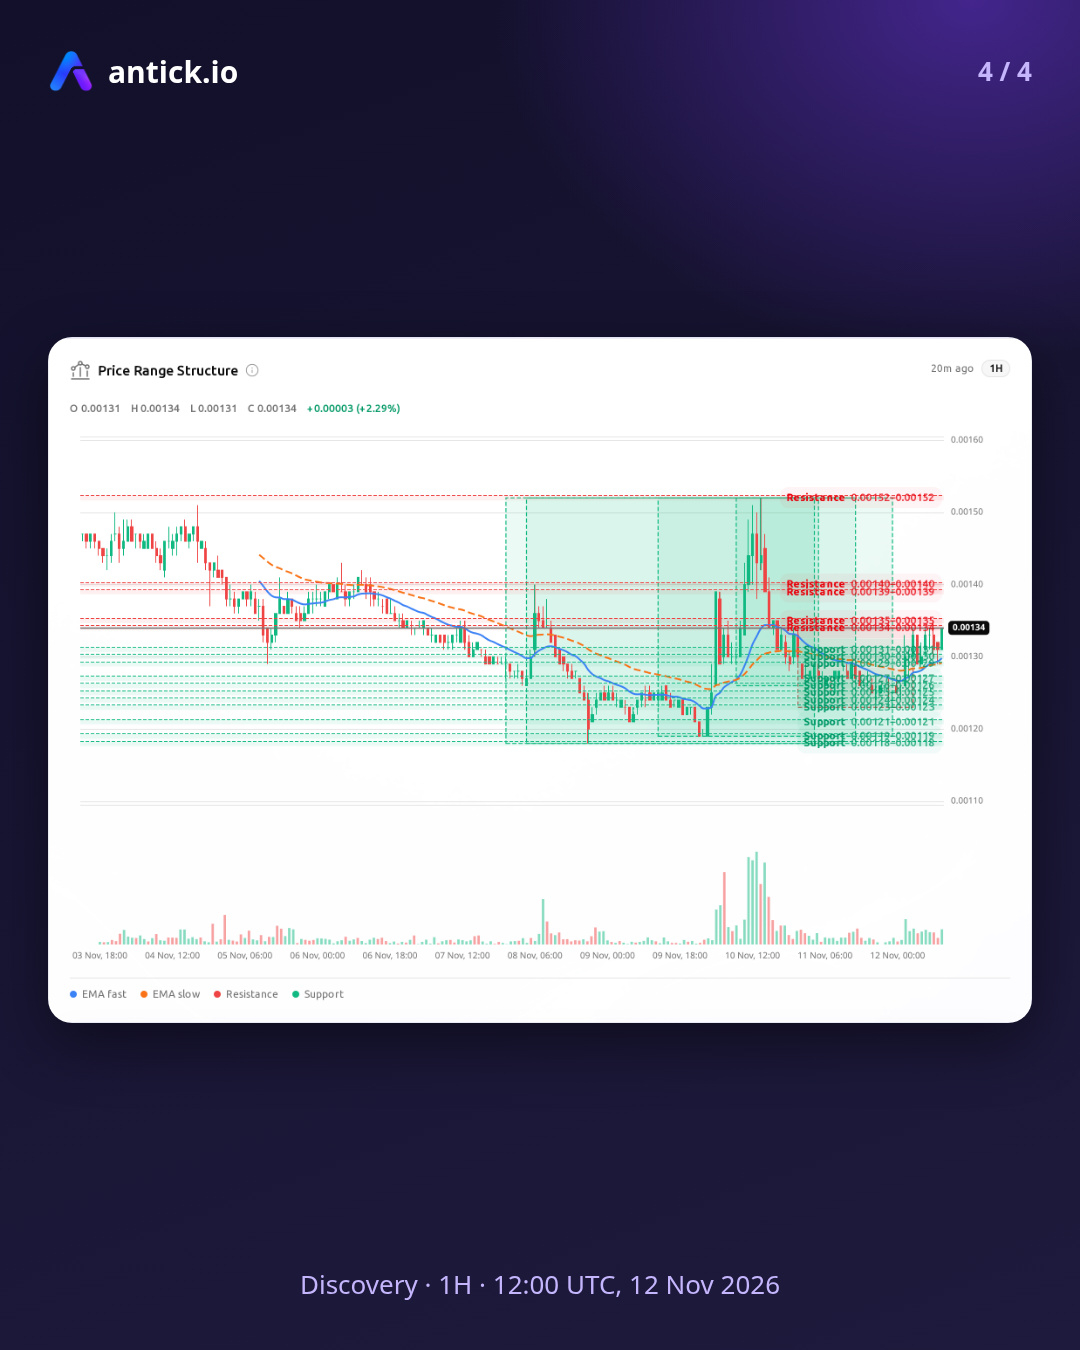
Discovery scan: $SOPH $PEPE OPEN INIT · 1H · Data as of 12:00 UTC, 12 Nov 2026
Every coin in this hourly packet moved up, yet each verdict is split, with price action leading and most engines not yet confirming. SOPH tilts bullish with a Transitioning core, though its pump signal carries trap risk at moderate confidence. PEPE moved up even as its balance tilts bearish, and its pump signal is also flagged for trap risk at moderate confidence within a Transitioning core. OPEN keeps a bullish tilt inside a Chaotic core, but trend quality appears to be weakening and may be late-stage, with low confidence in that read. INIT moved up while holding a slight bearish edge, as its breakout attempt lacks clean follow-through at moderate confidence in a Transitioning core. If the engines begin confirming what price is showing and the Transitioning cores settle, these movers could extend higher. Should the trap-risk flags hold and the weak follow-through persist, the same names could slip into a pullback.
$SOPH: 0.00134 (+2.29% on the 1H), support 0.00130665 to 0.00131335, resistance 0.00133665 to 0.00134335
$PEPE: 0.00000446 (+1.36% on the 1H), resistance 0.00000449 to 0.00000451
OPEN: 0.0951 (+1.06% on the 1H), support 0.09306 to 0.09354, resistance 0.09686 to 0.09734
INIT: 0.12945 (+0.46% on the 1H), support 0.12746 to 0.12865, resistance 0.1319 to 0.13254
Data-based reading, not a forecast. Analytics only, not financial advice.
$SOPH $PEPE OPEN INIT #AntickIO #AnalyticByTick #CryptoDiscovery
Discovery scan: $SOPH $PEPE OPEN INIT · 1H · Data as of 12:00 UTC, 12 Nov 2026
Every coin in this hourly packet moved up, yet each verdict is split, with price action leading and most engines not yet confirming. SOPH tilts bullish with a Transitioning core, though its pump signal carries trap risk at moderate confidence. PEPE moved up even as its balance tilts bearish, and its pump signal is also flagged for trap risk at moderate confidence within a Transitioning core. OPEN keeps a bullish tilt inside a Chaotic core, but trend quality appears to be weakening and may be late-stage, with low confidence in that read. INIT moved up while holding a slight bearish edge, as its breakout attempt lacks clean follow-through at moderate confidence in a Transitioning core. If the engines begin confirming what price is showing and the Transitioning cores settle, these movers could extend higher. Should the trap-risk flags hold and the weak follow-through persist, the same names could slip into a pullback.
$SOPH : 0.00134 (+2.29% on the 1H), support 0.00130665 to 0.00131335, resistance 0.00133665 to 0.00134335
$PEPE : 0.00000446 (+1.36% on the 1H), resistance 0.00000449 to 0.00000451
OPEN: 0.0951 (+1.06% on the 1H), support 0.09306 to 0.09354, resistance 0.09686 to 0.09734
INIT: 0.12945 (+0.46% on the 1H), support 0.12746 to 0.12865, resistance 0.1319 to 0.13254
Data-based reading, not a forecast. Analytics only, not financial advice.
$SOPH $PEPE OPEN INIT #AntickIO #AnalyticByTick #CryptoDiscovery
Every coin in this hourly packet moved up, yet each verdict is split, with price action leading and most engines not yet confirming. SOPH tilts bullish with a Transitioning core, though its pump signal carries trap risk at moderate confidence. PEPE moved up even as its balance tilts bearish, and its pump signal is also flagged for trap risk at moderate confidence within a Transitioning core. OPEN keeps a bullish tilt inside a Chaotic core, but trend quality appears to be weakening and may be late-stage, with low confidence in that read. INIT moved up while holding a slight bearish edge, as its breakout attempt lacks clean follow-through at moderate confidence in a Transitioning core. If the engines begin confirming what price is showing and the Transitioning cores settle, these movers could extend higher. Should the trap-risk flags hold and the weak follow-through persist, the same names could slip into a pullback.
$SOPH : 0.00134 (+2.29% on the 1H), support 0.00130665 to 0.00131335, resistance 0.00133665 to 0.00134335
$PEPE : 0.00000446 (+1.36% on the 1H), resistance 0.00000449 to 0.00000451
OPEN: 0.0951 (+1.06% on the 1H), support 0.09306 to 0.09354, resistance 0.09686 to 0.09734
INIT: 0.12945 (+0.46% on the 1H), support 0.12746 to 0.12865, resistance 0.1319 to 0.13254
Data-based reading, not a forecast. Analytics only, not financial advice.
$SOPH $PEPE OPEN INIT #AntickIO #AnalyticByTick #CryptoDiscovery
449
·
--
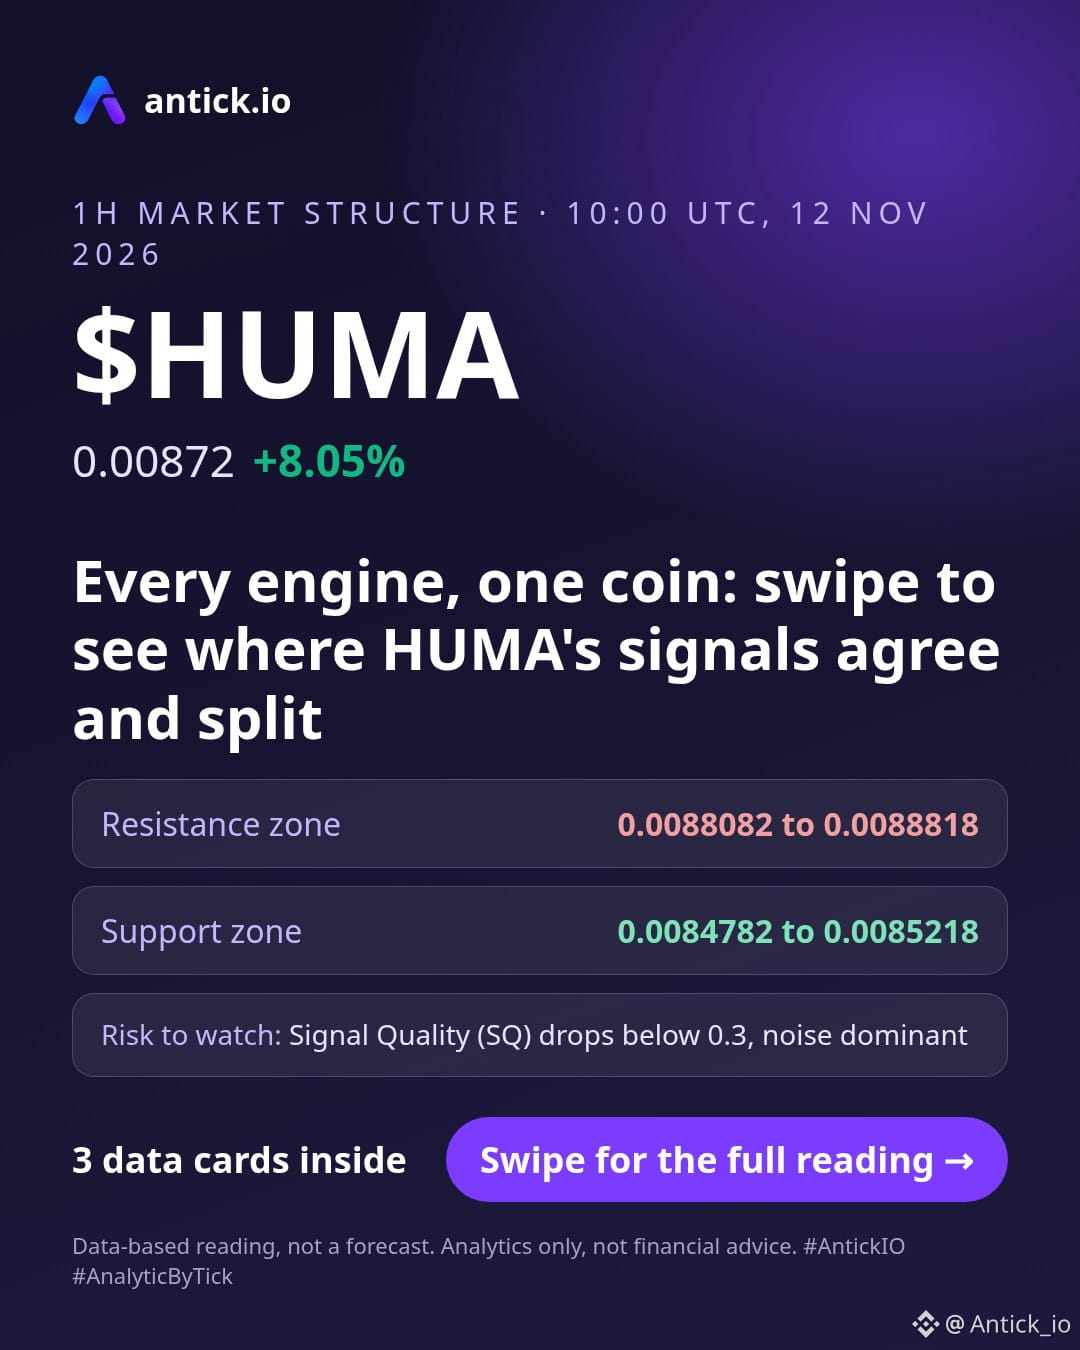
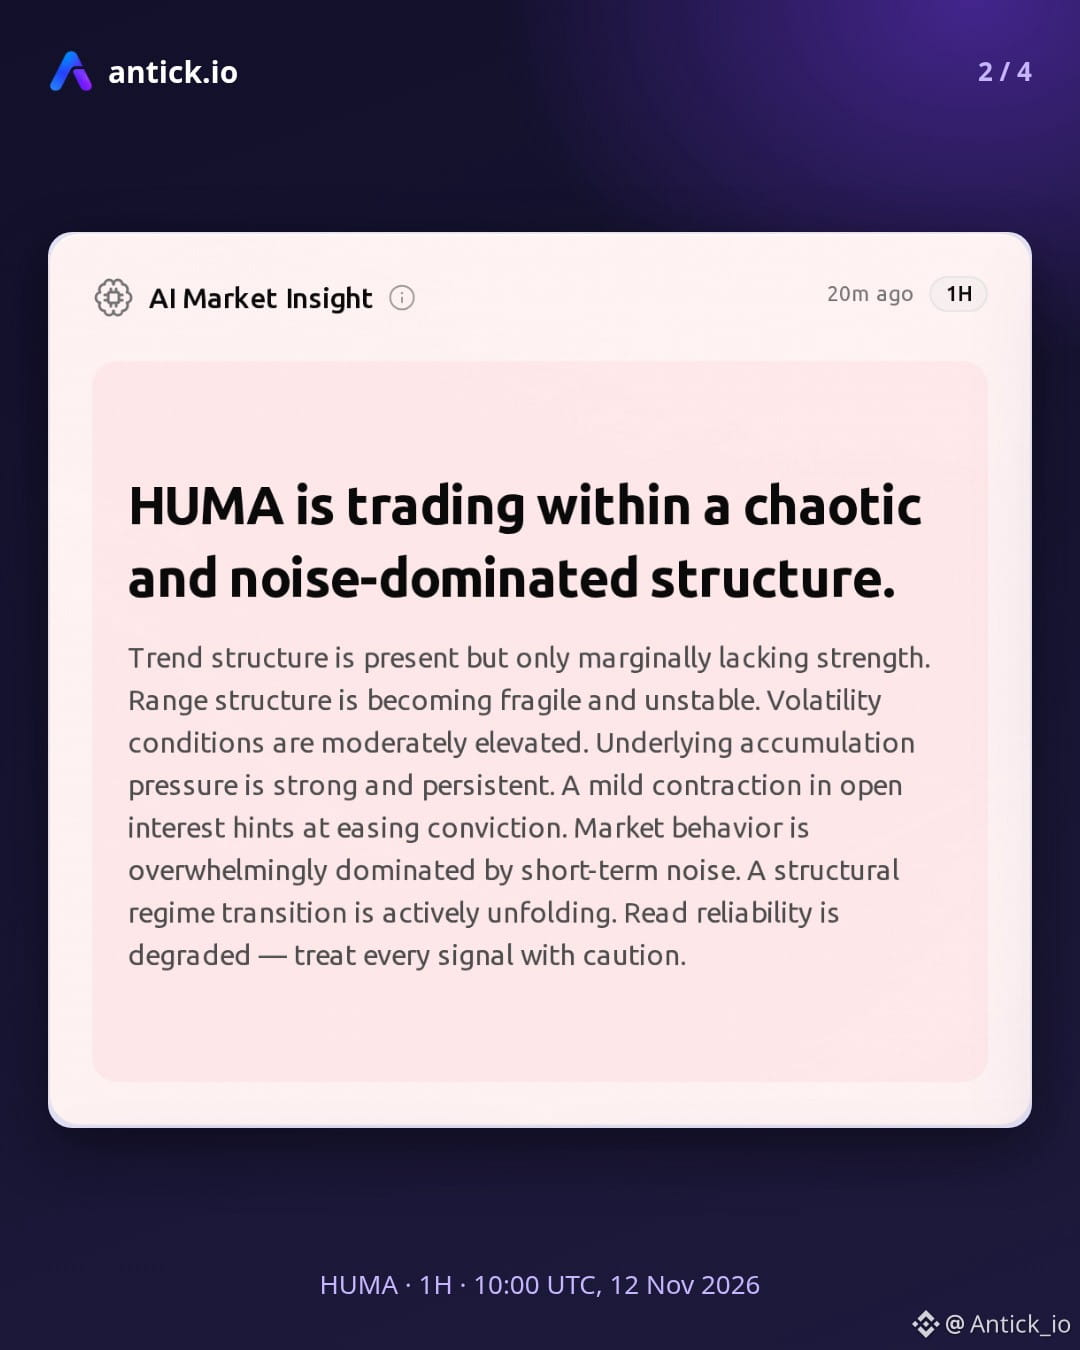
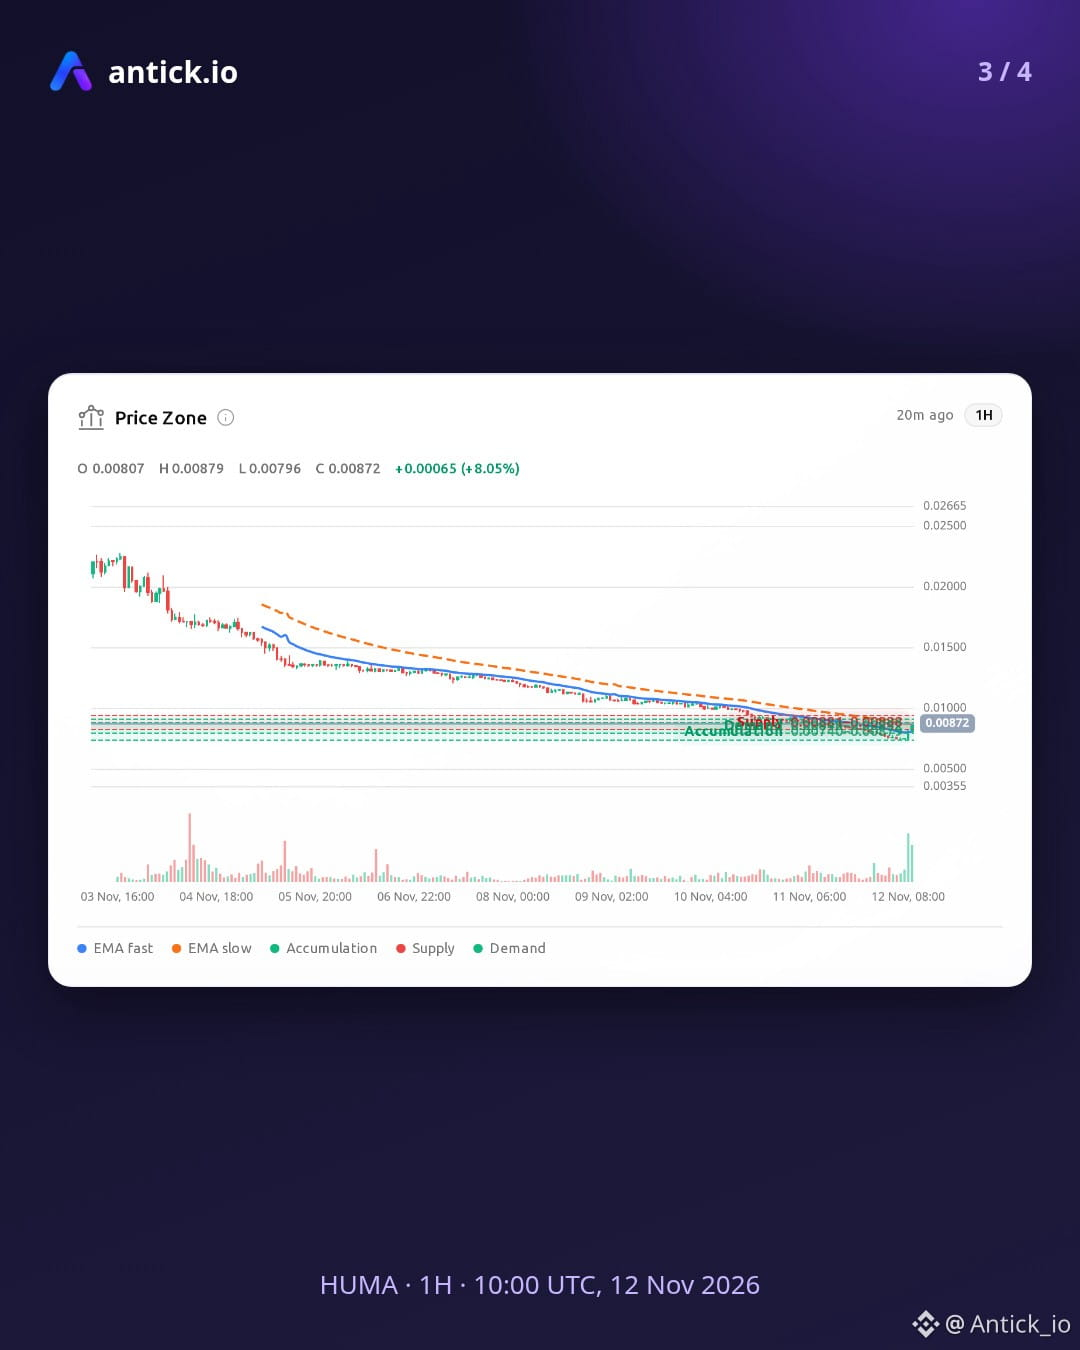
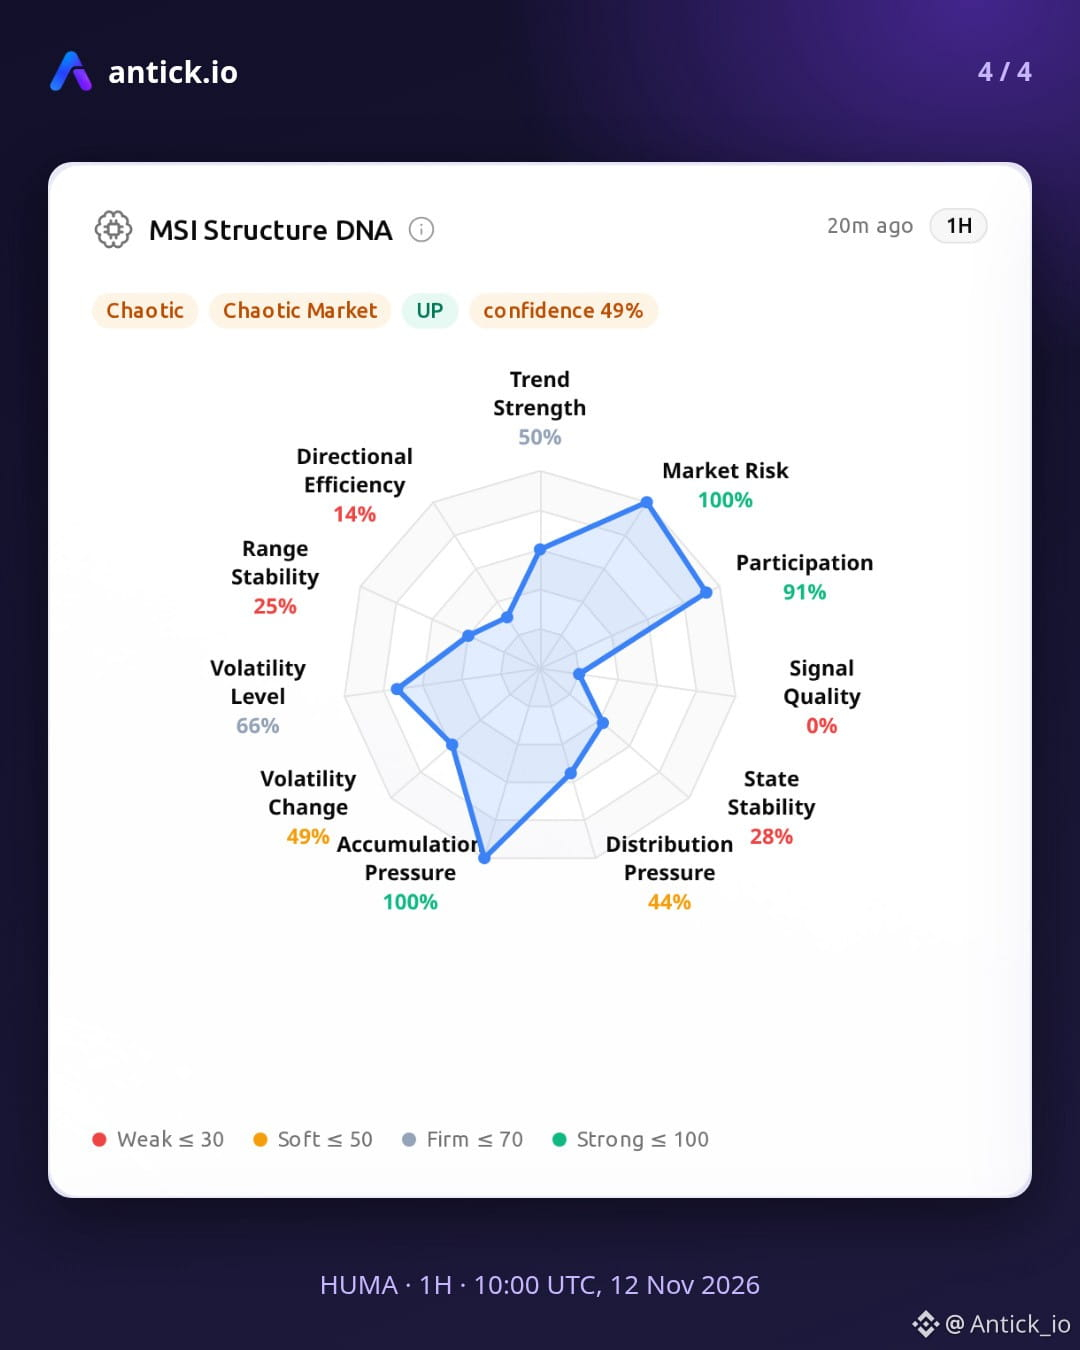
$HUMA · 1H · Data as of 10:00 UTC, 12 Nov 2026
HUMA shows mixed engine readings, with confirmation still limited. There is a possibility of a move higher if liquidity keeps chasing price and the chaotic structure keeps breaking upward. There is also a possibility of a move lower if fear-driven behavior keeps dominating and the overextended move against the higher-timeframe structure starts to unwind.
Risk conditions:
- Signal Quality (SQ) drops below 0.3, noise dominant
- State Stability (SS) turns negative, regime shift risk
Invalidation zones:
- Upside reading weakens on a 1H close below 0.0084782 to 0.0085218
- Downside reading weakens on a 1H close above 0.0088082 to 0.0088818
Data-based reading, not a forecast. Analytics only, not financial advice.
$HUMA #HUMA #AntickIO #AnalyticByTick #MarketData
$HUMA · 1H · Data as of 10:00 UTC, 12 Nov 2026
HUMA shows mixed engine readings, with confirmation still limited. There is a possibility of a move higher if liquidity keeps chasing price and the chaotic structure keeps breaking upward. There is also a possibility of a move lower if fear-driven behavior keeps dominating and the overextended move against the higher-timeframe structure starts to unwind.
Risk conditions:
- Signal Quality (SQ) drops below 0.3, noise dominant
- State Stability (SS) turns negative, regime shift risk
Invalidation zones:
- Upside reading weakens on a 1H close below 0.0084782 to 0.0085218
- Downside reading weakens on a 1H close above 0.0088082 to 0.0088818
Data-based reading, not a forecast. Analytics only, not financial advice.
$HUMA #HUMA #AntickIO #AnalyticByTick #MarketData
HUMA shows mixed engine readings, with confirmation still limited. There is a possibility of a move higher if liquidity keeps chasing price and the chaotic structure keeps breaking upward. There is also a possibility of a move lower if fear-driven behavior keeps dominating and the overextended move against the higher-timeframe structure starts to unwind.
Risk conditions:
- Signal Quality (SQ) drops below 0.3, noise dominant
- State Stability (SS) turns negative, regime shift risk
Invalidation zones:
- Upside reading weakens on a 1H close below 0.0084782 to 0.0085218
- Downside reading weakens on a 1H close above 0.0088082 to 0.0088818
Data-based reading, not a forecast. Analytics only, not financial advice.
$HUMA #HUMA #AntickIO #AnalyticByTick #MarketData
1
759
·
--
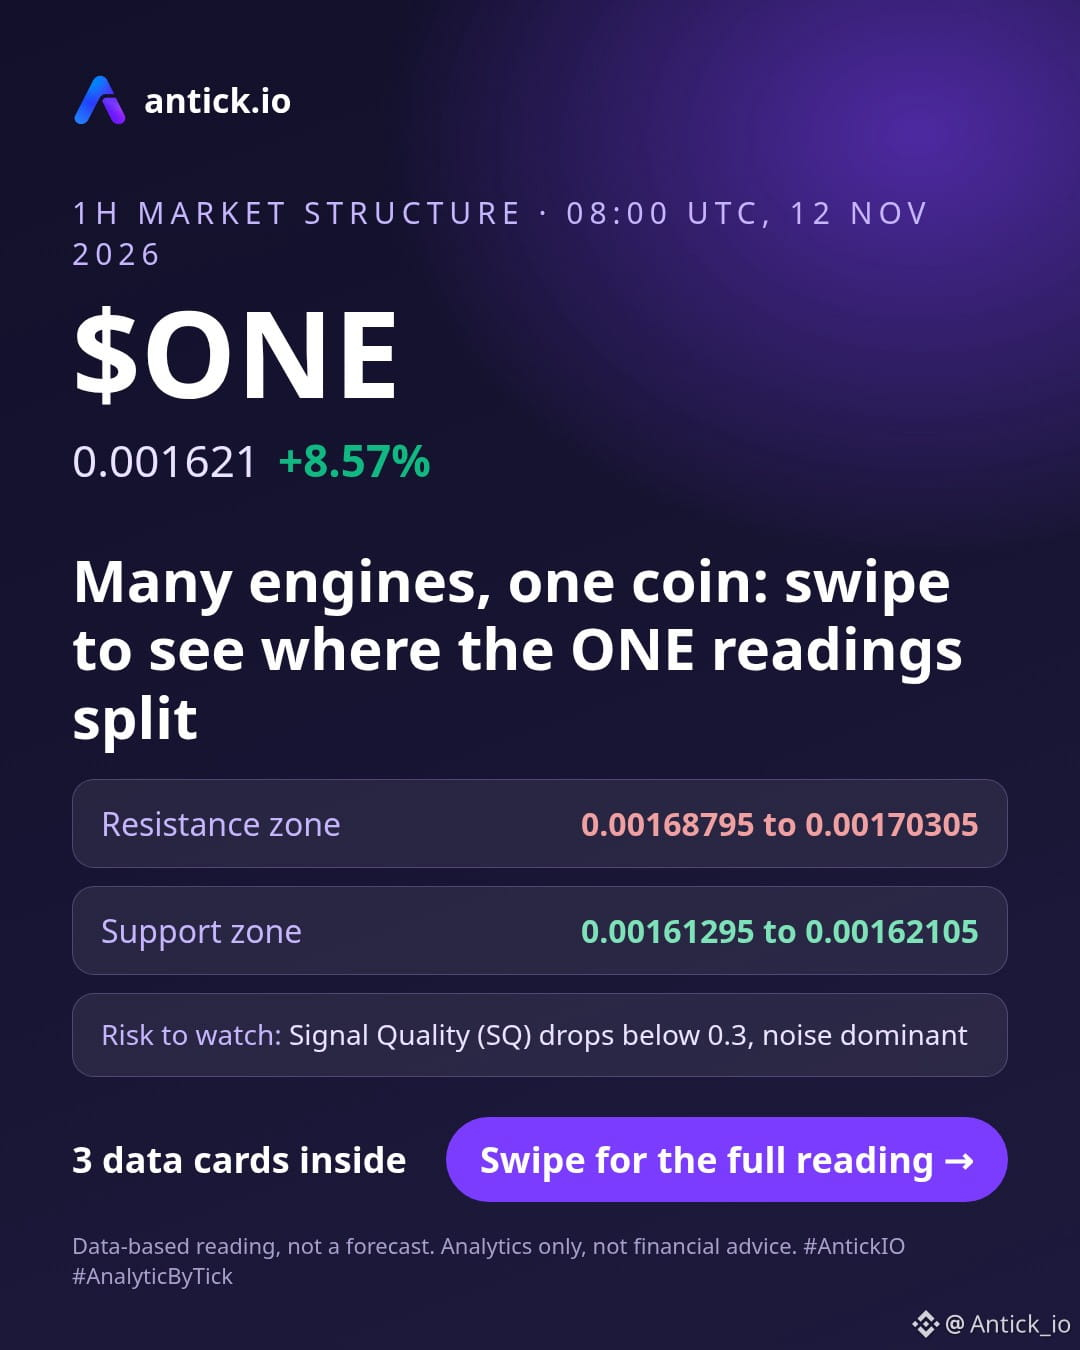
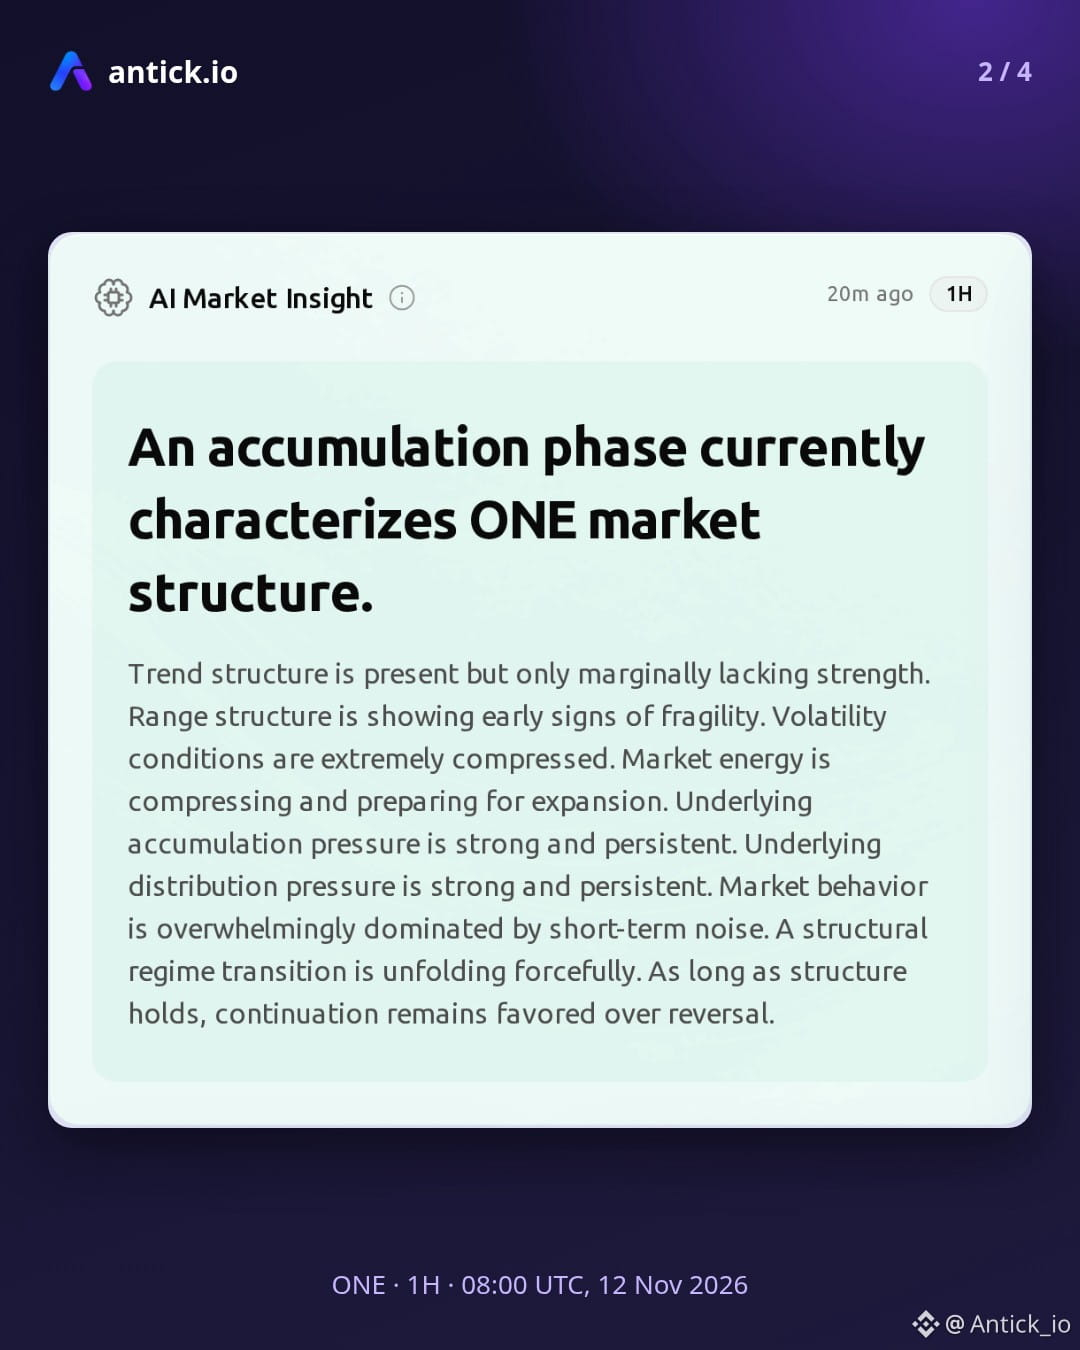
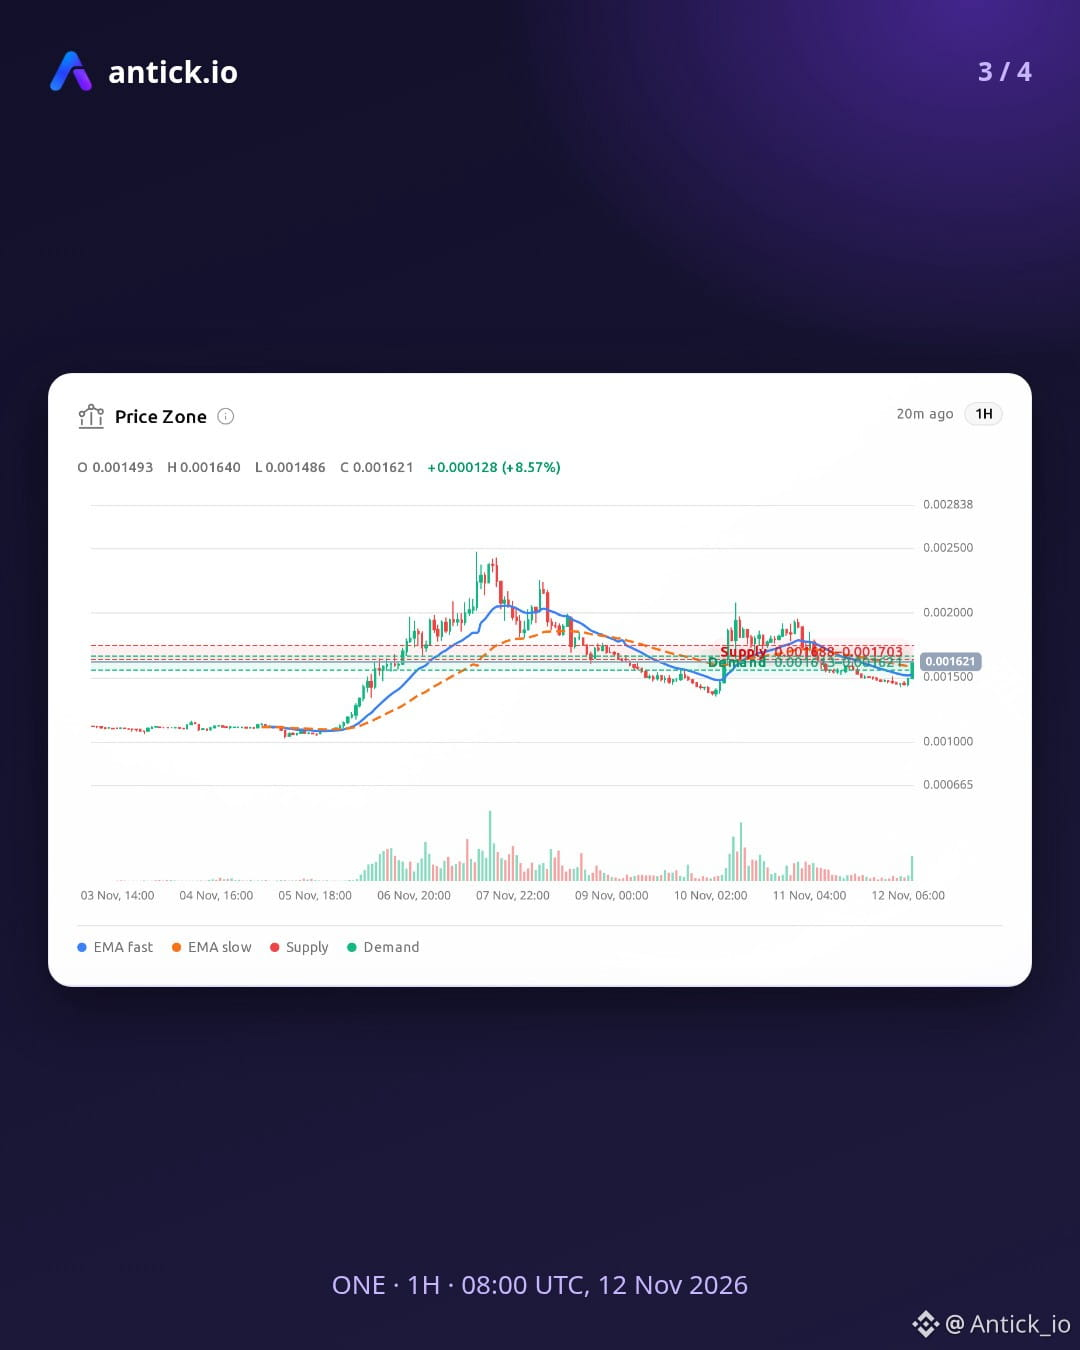
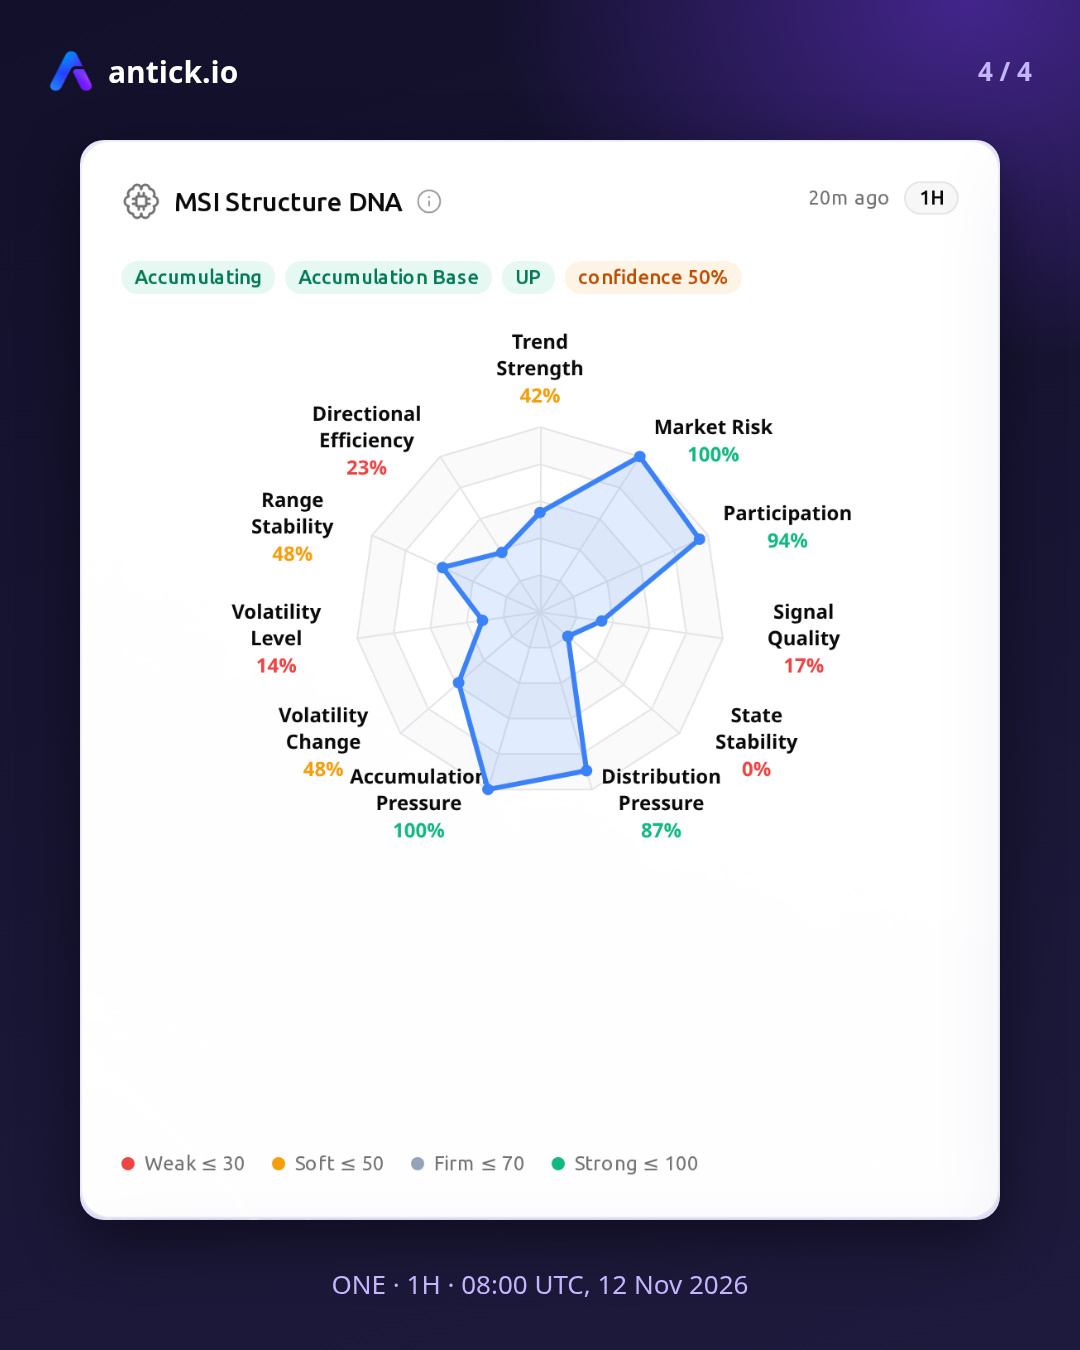
$ONE · 1H · Data as of 08:00 UTC, 12 Nov 2026
Engine readings for ONE are split, with structural tension building between timeframes. There is a possibility of a move higher if the accumulation base keeps building and the order book bias stays up. There is also a possibility of a move lower if the euphoric retail conditions keep cracking and the breakout attempt stays without clean follow-through.
Risk conditions:
- Signal Quality (SQ) drops below 0.3, noise dominant
- Distribution Pressure (DP) exceeds ±0.1
Invalidation zones:
- Upside reading weakens on a 1H close below 0.00161295 to 0.00162105
- Downside reading weakens on a 1H close above 0.00168795 to 0.00170305
Data-based reading, not a forecast. Analytics only, not financial advice.
$ONE #ONE #AntickIO #AnalyticByTick #OnChainData
$ONE · 1H · Data as of 08:00 UTC, 12 Nov 2026
Engine readings for ONE are split, with structural tension building between timeframes. There is a possibility of a move higher if the accumulation base keeps building and the order book bias stays up. There is also a possibility of a move lower if the euphoric retail conditions keep cracking and the breakout attempt stays without clean follow-through.
Risk conditions:
- Signal Quality (SQ) drops below 0.3, noise dominant
- Distribution Pressure (DP) exceeds ±0.1
Invalidation zones:
- Upside reading weakens on a 1H close below 0.00161295 to 0.00162105
- Downside reading weakens on a 1H close above 0.00168795 to 0.00170305
Data-based reading, not a forecast. Analytics only, not financial advice.
$ONE #ONE #AntickIO #AnalyticByTick #OnChainData
Engine readings for ONE are split, with structural tension building between timeframes. There is a possibility of a move higher if the accumulation base keeps building and the order book bias stays up. There is also a possibility of a move lower if the euphoric retail conditions keep cracking and the breakout attempt stays without clean follow-through.
Risk conditions:
- Signal Quality (SQ) drops below 0.3, noise dominant
- Distribution Pressure (DP) exceeds ±0.1
Invalidation zones:
- Upside reading weakens on a 1H close below 0.00161295 to 0.00162105
- Downside reading weakens on a 1H close above 0.00168795 to 0.00170305
Data-based reading, not a forecast. Analytics only, not financial advice.
$ONE #ONE #AntickIO #AnalyticByTick #OnChainData
380
·
--
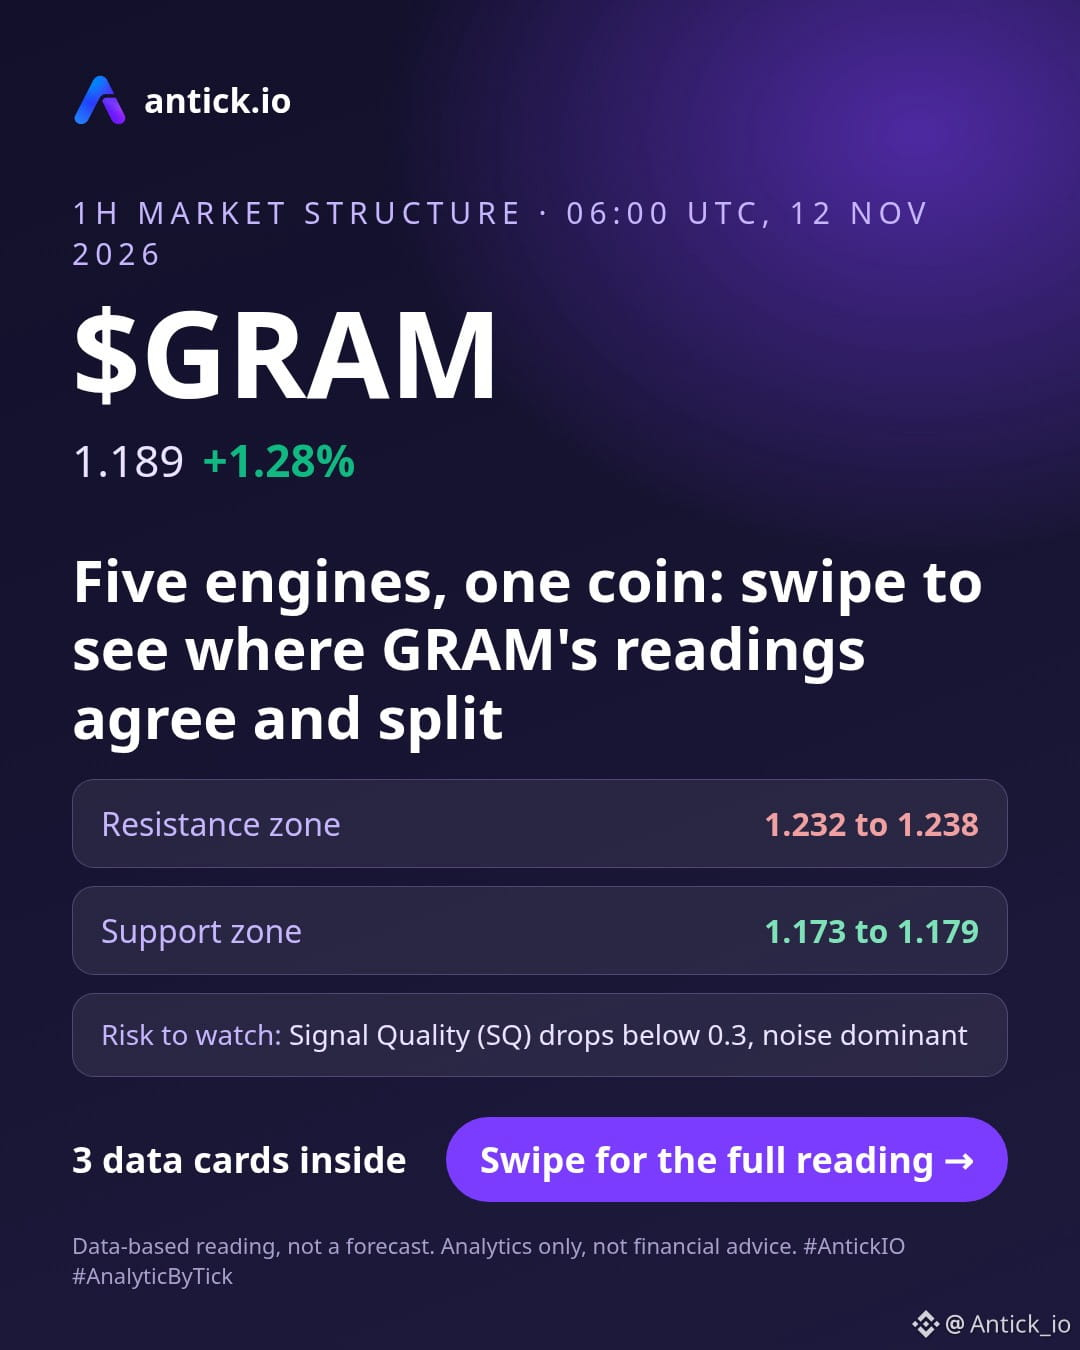
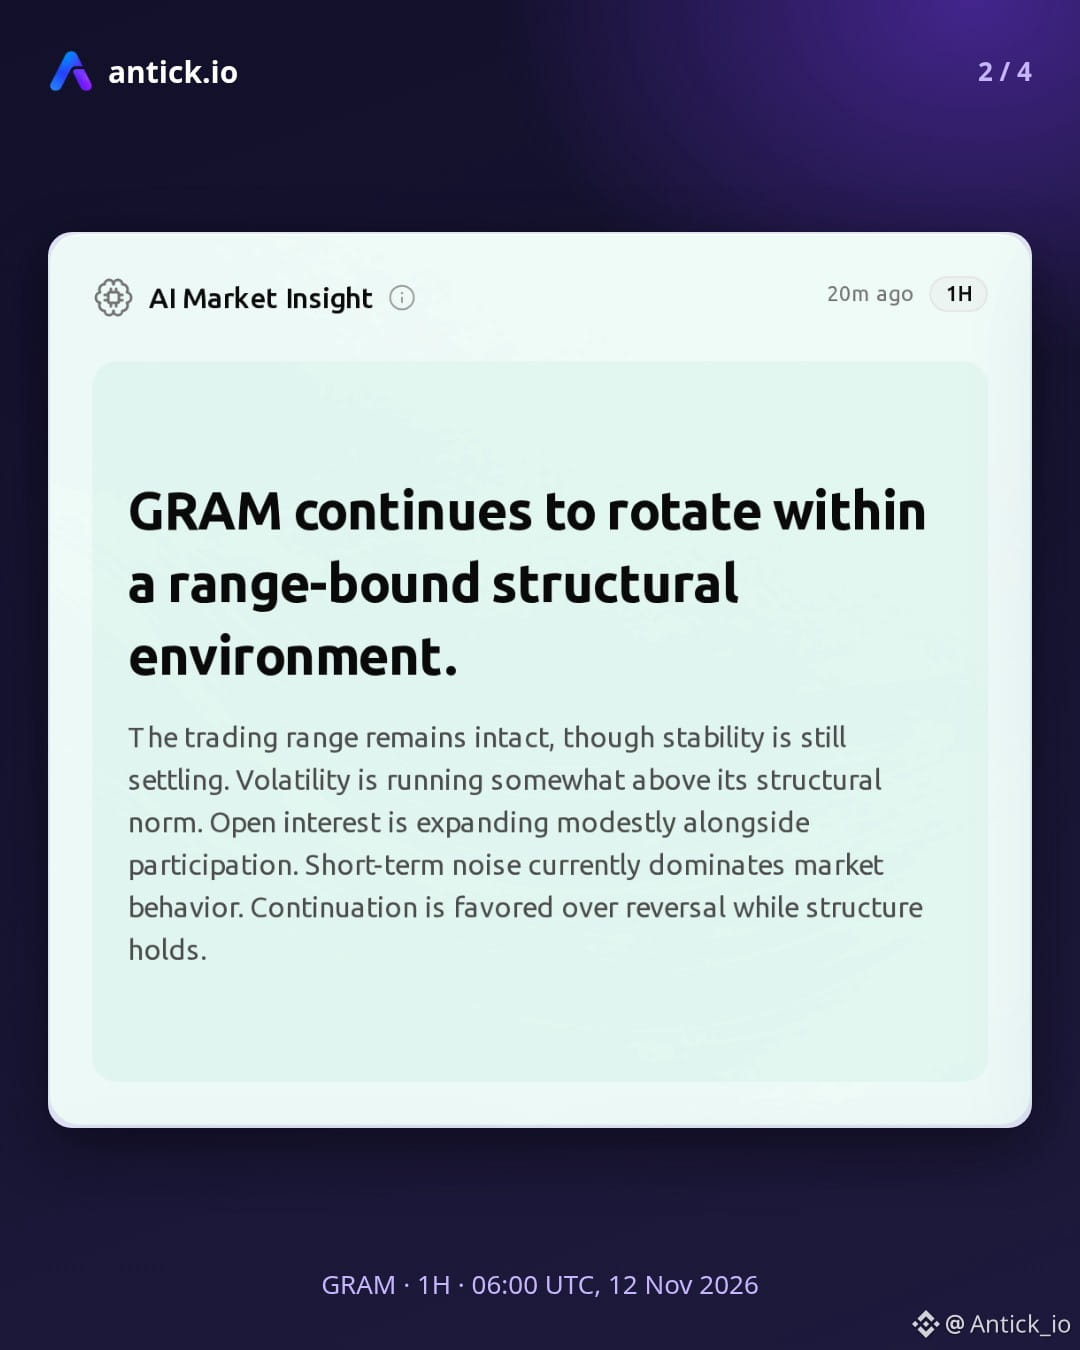
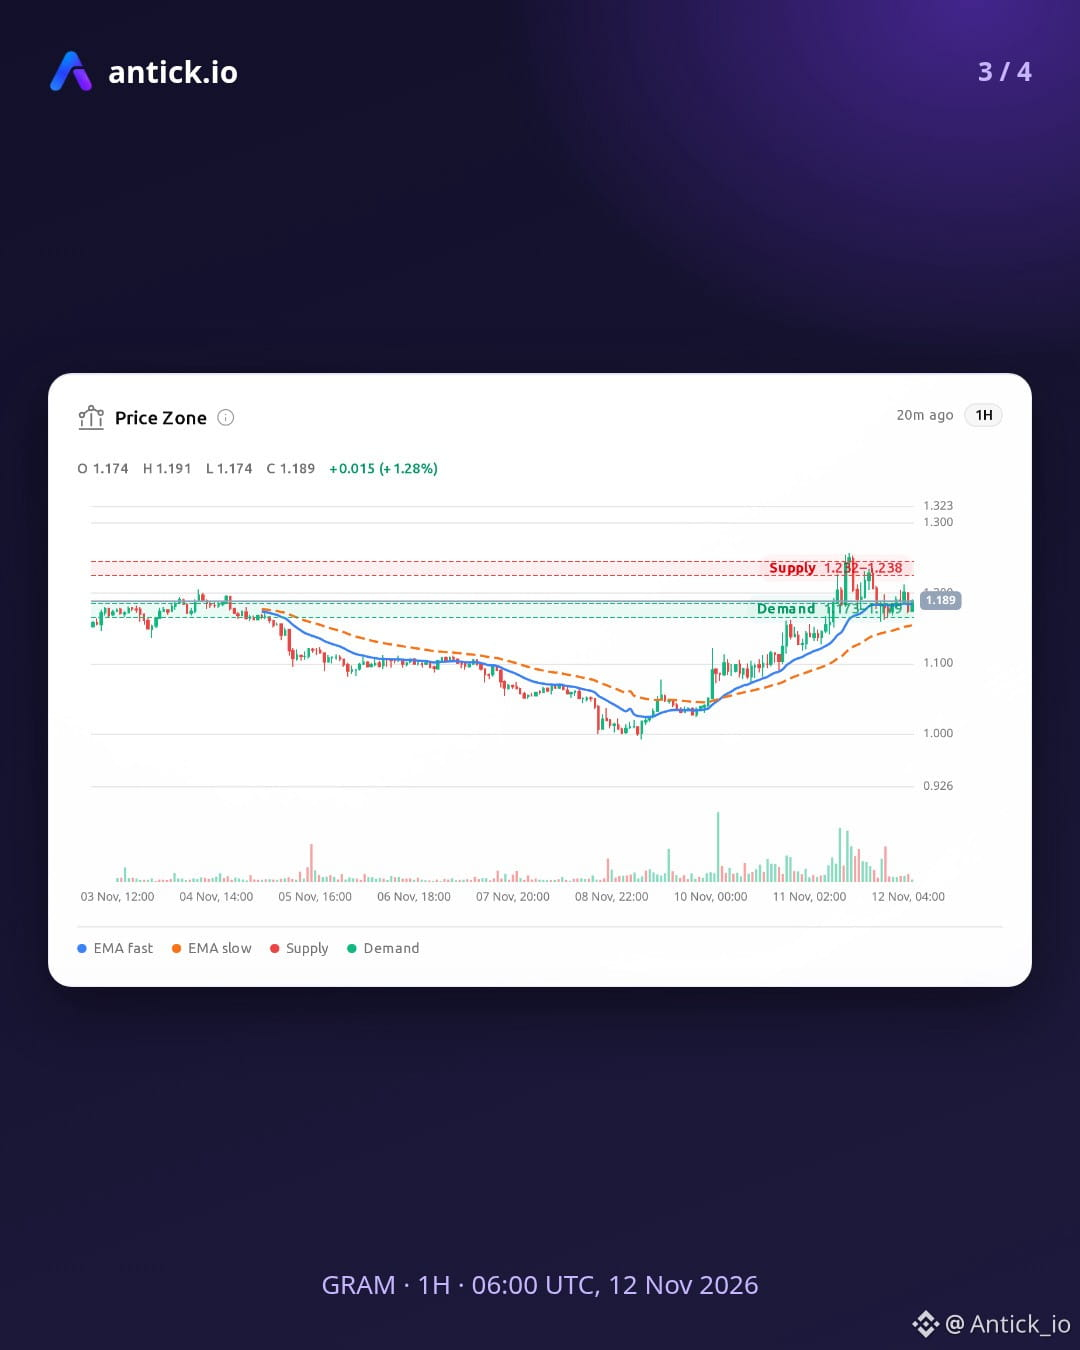
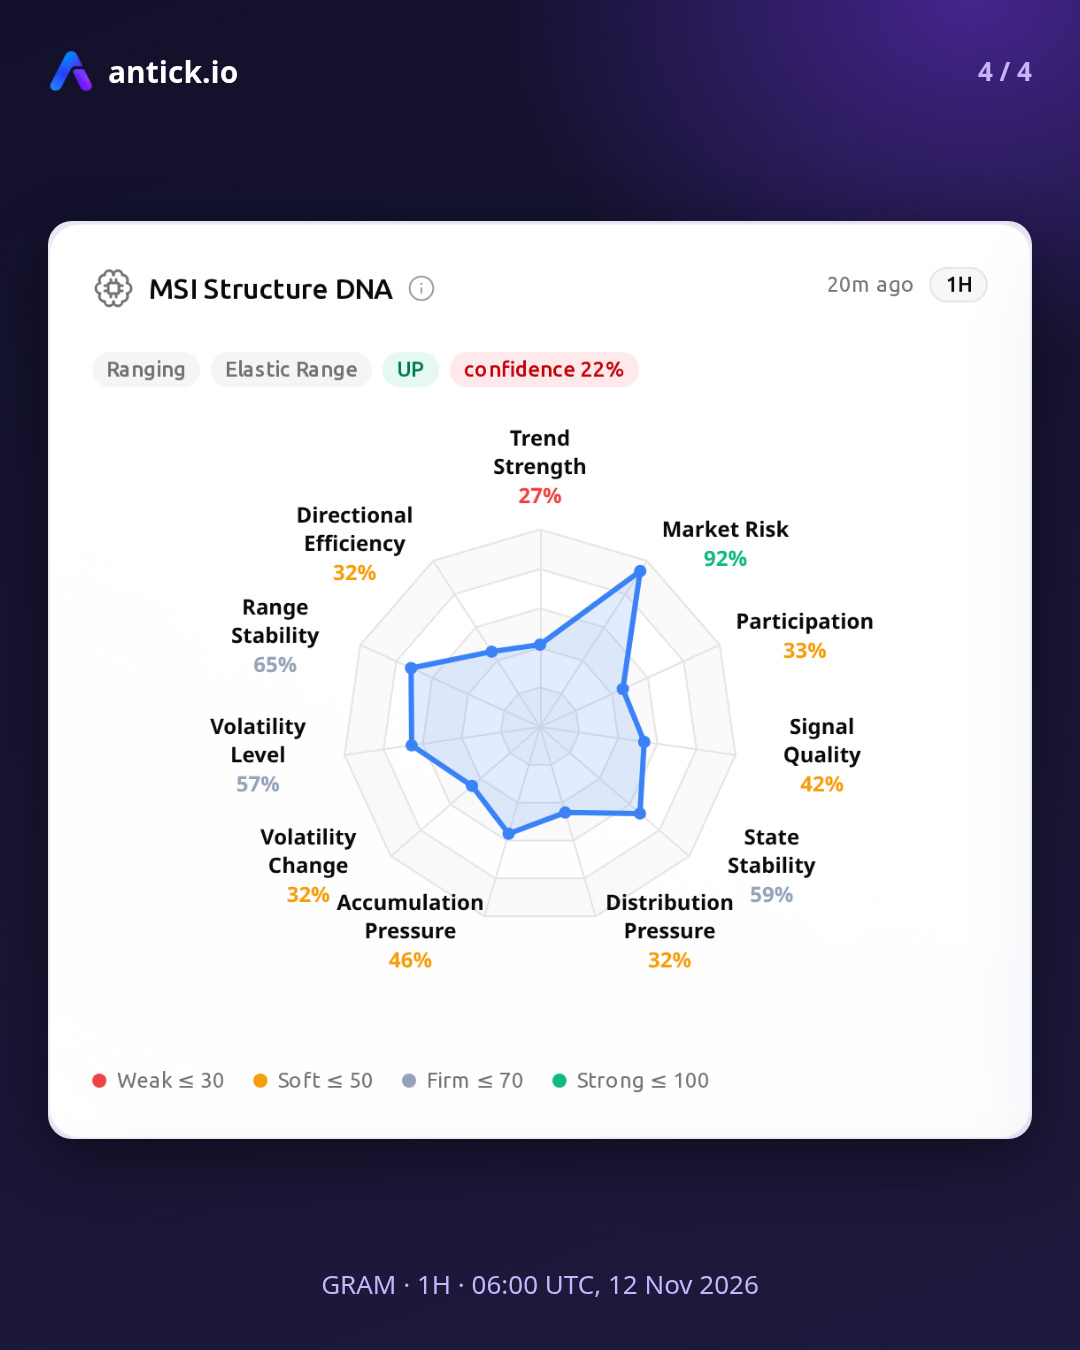
$GRAM · 1H · Data as of 06:00 UTC, 12 Nov 2026
There is a possibility of a push toward resistance if GRAM's emerging accumulation structure and its holding range stay intact. A slide toward support is also possible if the multi-timeframe structural breakdown and the breakout attempt without clean follow-through stay in control. Participation in GRAM remains cautious, so either path could still develop from here.
Risk conditions:
- Signal Quality (SQ) drops below 0.3, noise dominant
- Manipulation ratio (MR) rises above 1.50, book is being shaped
Invalidation zones:
- Upside reading weakens on a 1H close below 1.173 to 1.179
- Downside reading weakens on a 1H close above 1.232 to 1.238
Data-based reading, not a forecast. Analytics only, not financial advice.
$GRAM #GRAM #AntickIO #AnalyticByTick #CryptoAnalytics
$GRAM · 1H · Data as of 06:00 UTC, 12 Nov 2026
There is a possibility of a push toward resistance if GRAM's emerging accumulation structure and its holding range stay intact. A slide toward support is also possible if the multi-timeframe structural breakdown and the breakout attempt without clean follow-through stay in control. Participation in GRAM remains cautious, so either path could still develop from here.
Risk conditions:
- Signal Quality (SQ) drops below 0.3, noise dominant
- Manipulation ratio (MR) rises above 1.50, book is being shaped
Invalidation zones:
- Upside reading weakens on a 1H close below 1.173 to 1.179
- Downside reading weakens on a 1H close above 1.232 to 1.238
Data-based reading, not a forecast. Analytics only, not financial advice.
$GRAM #GRAM #AntickIO #AnalyticByTick #CryptoAnalytics
There is a possibility of a push toward resistance if GRAM's emerging accumulation structure and its holding range stay intact. A slide toward support is also possible if the multi-timeframe structural breakdown and the breakout attempt without clean follow-through stay in control. Participation in GRAM remains cautious, so either path could still develop from here.
Risk conditions:
- Signal Quality (SQ) drops below 0.3, noise dominant
- Manipulation ratio (MR) rises above 1.50, book is being shaped
Invalidation zones:
- Upside reading weakens on a 1H close below 1.173 to 1.179
- Downside reading weakens on a 1H close above 1.232 to 1.238
Data-based reading, not a forecast. Analytics only, not financial advice.
$GRAM #GRAM #AntickIO #AnalyticByTick #CryptoAnalytics
3
362
·
--
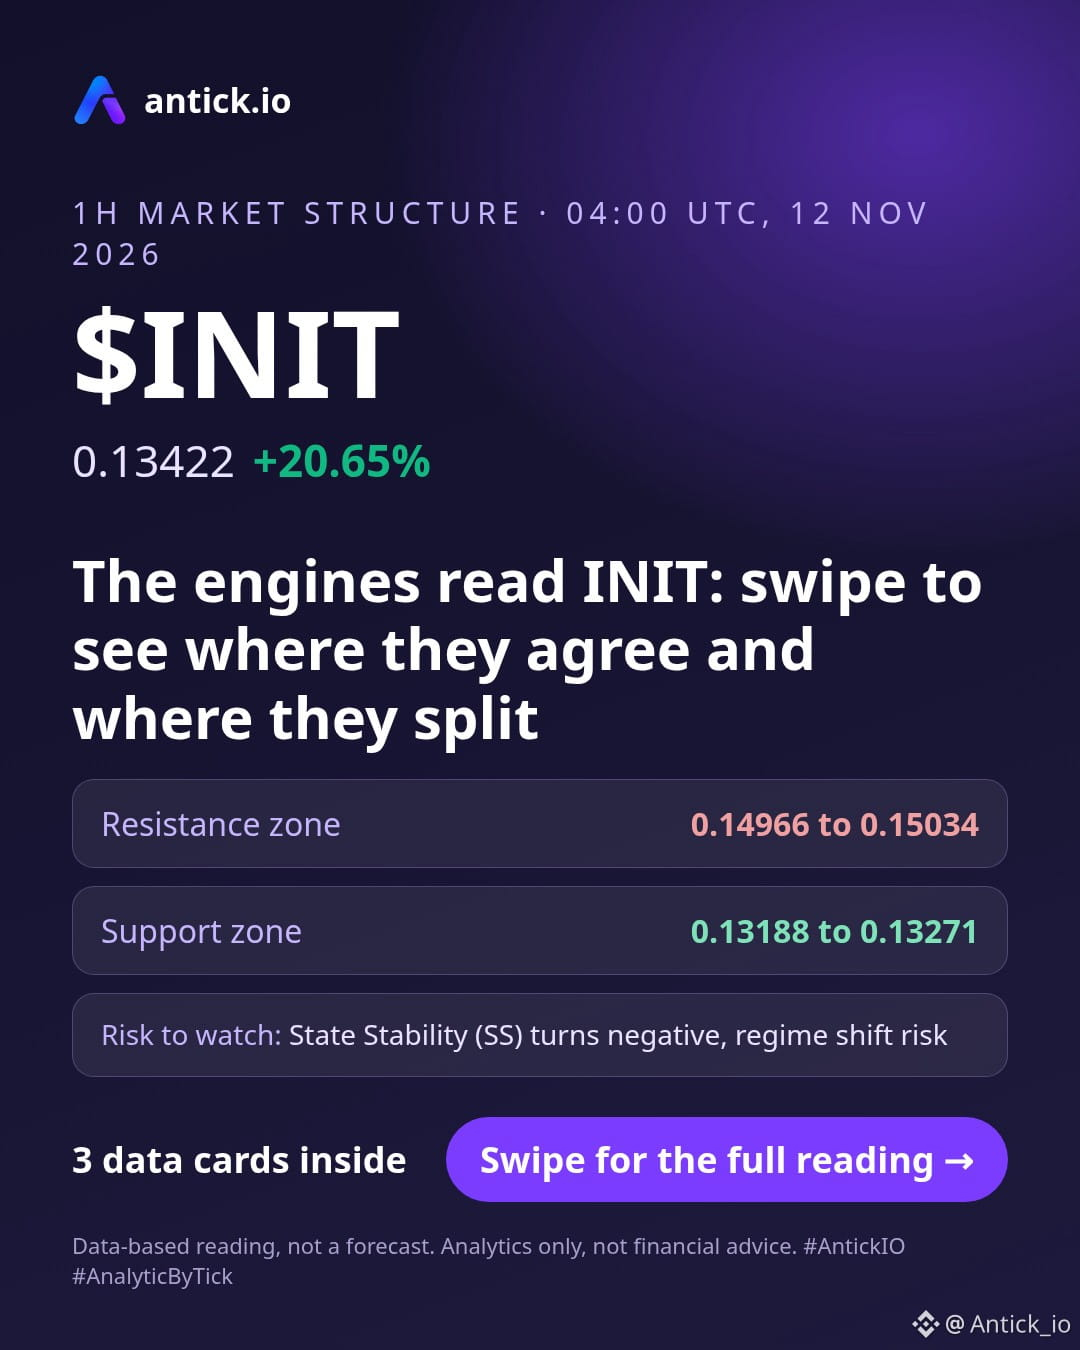
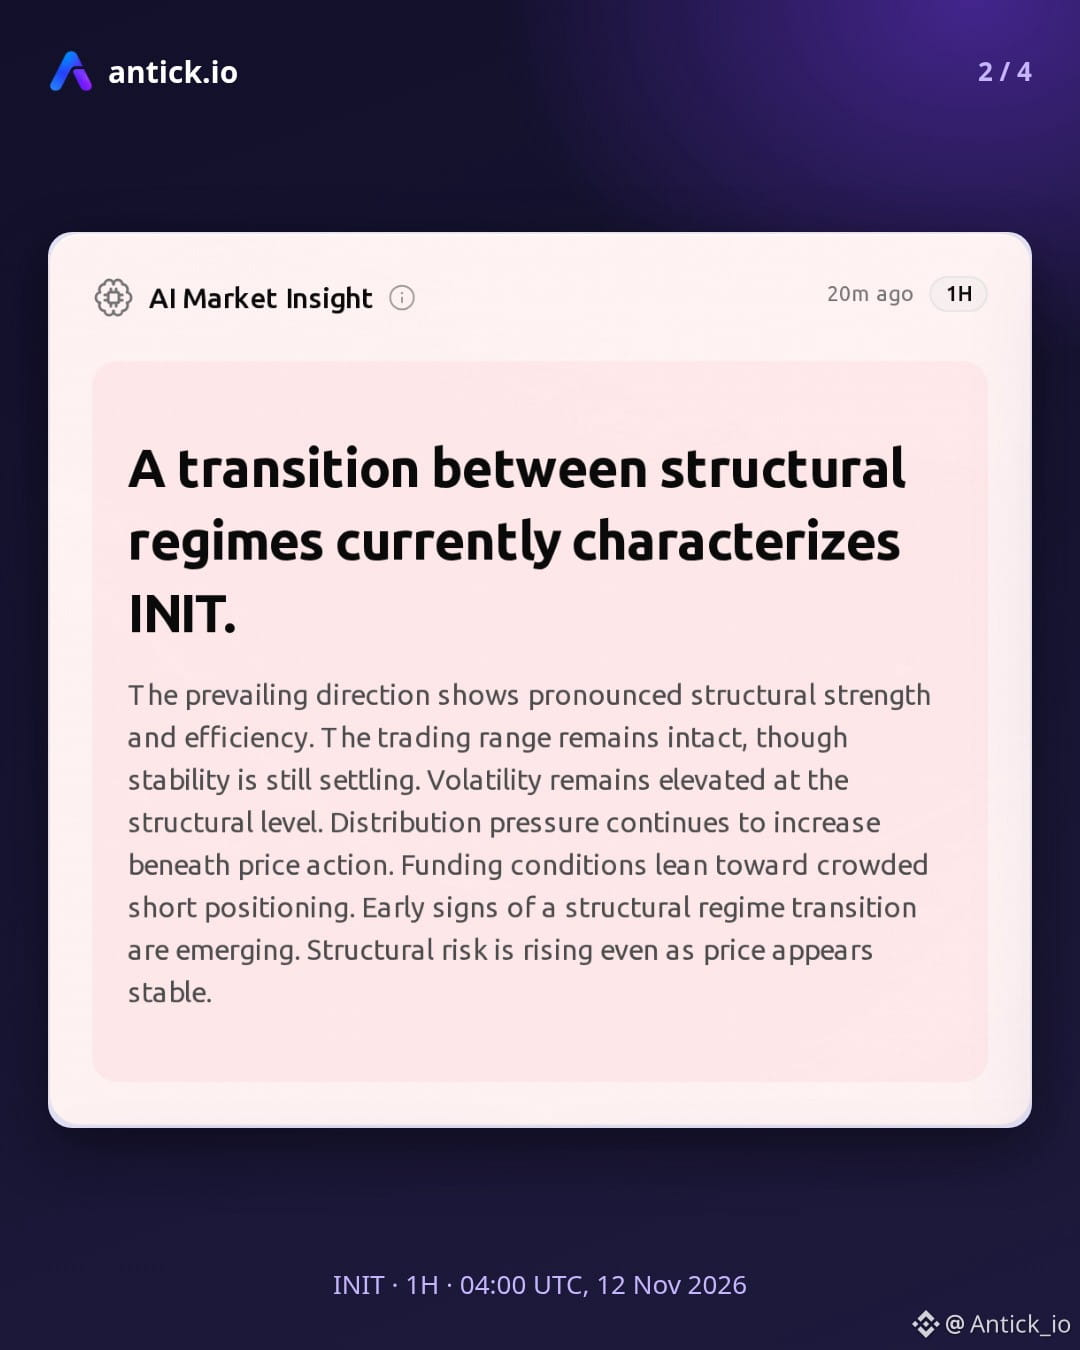
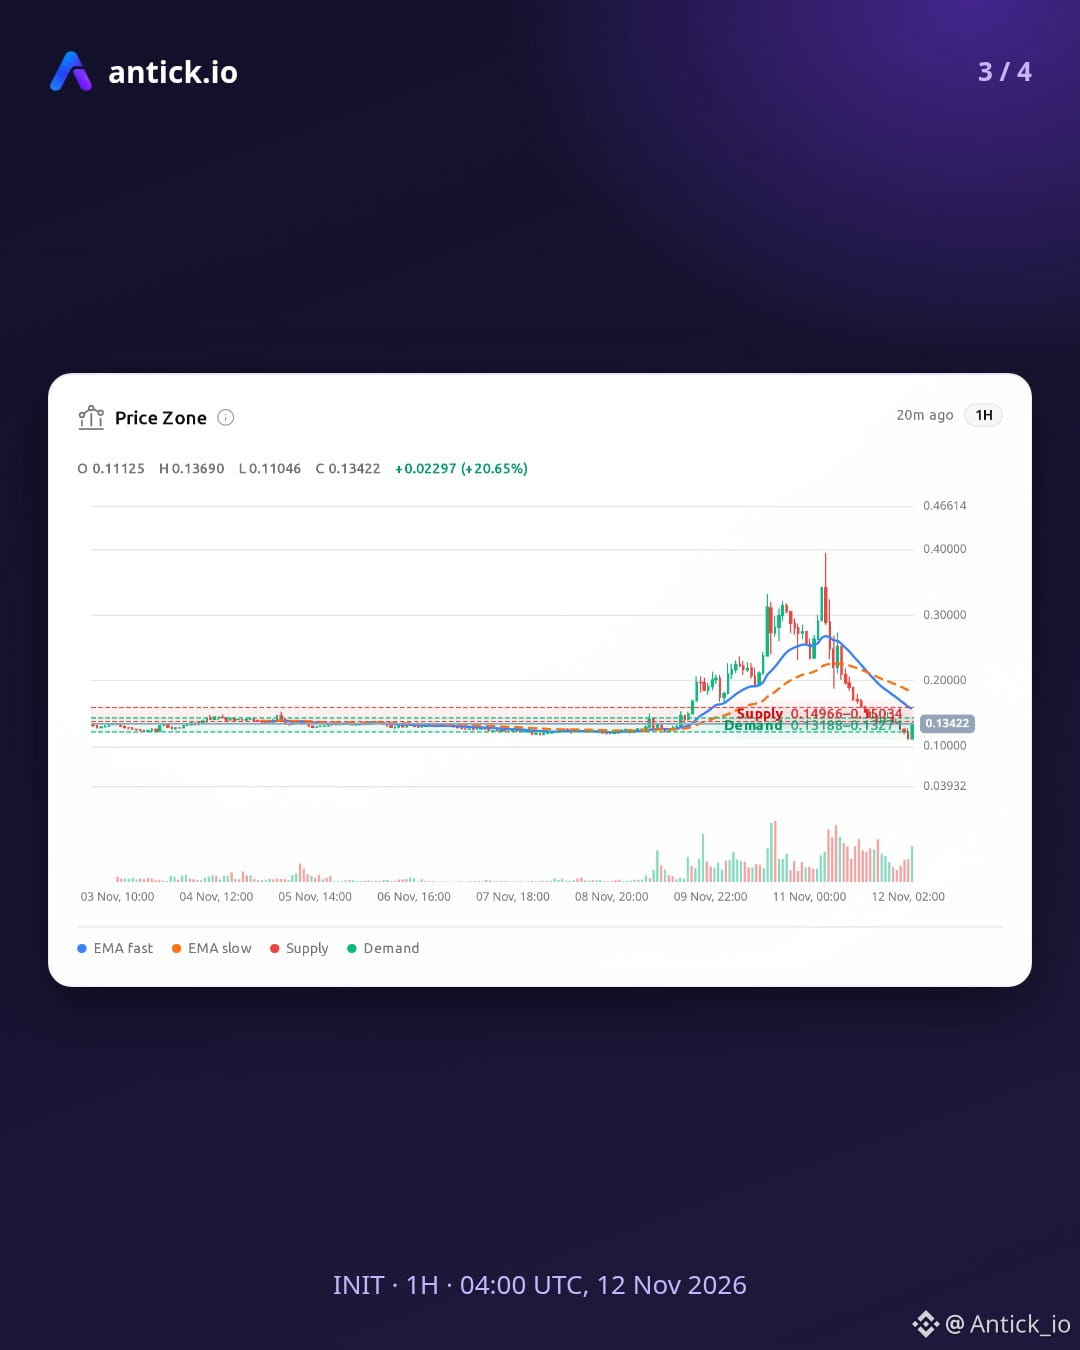
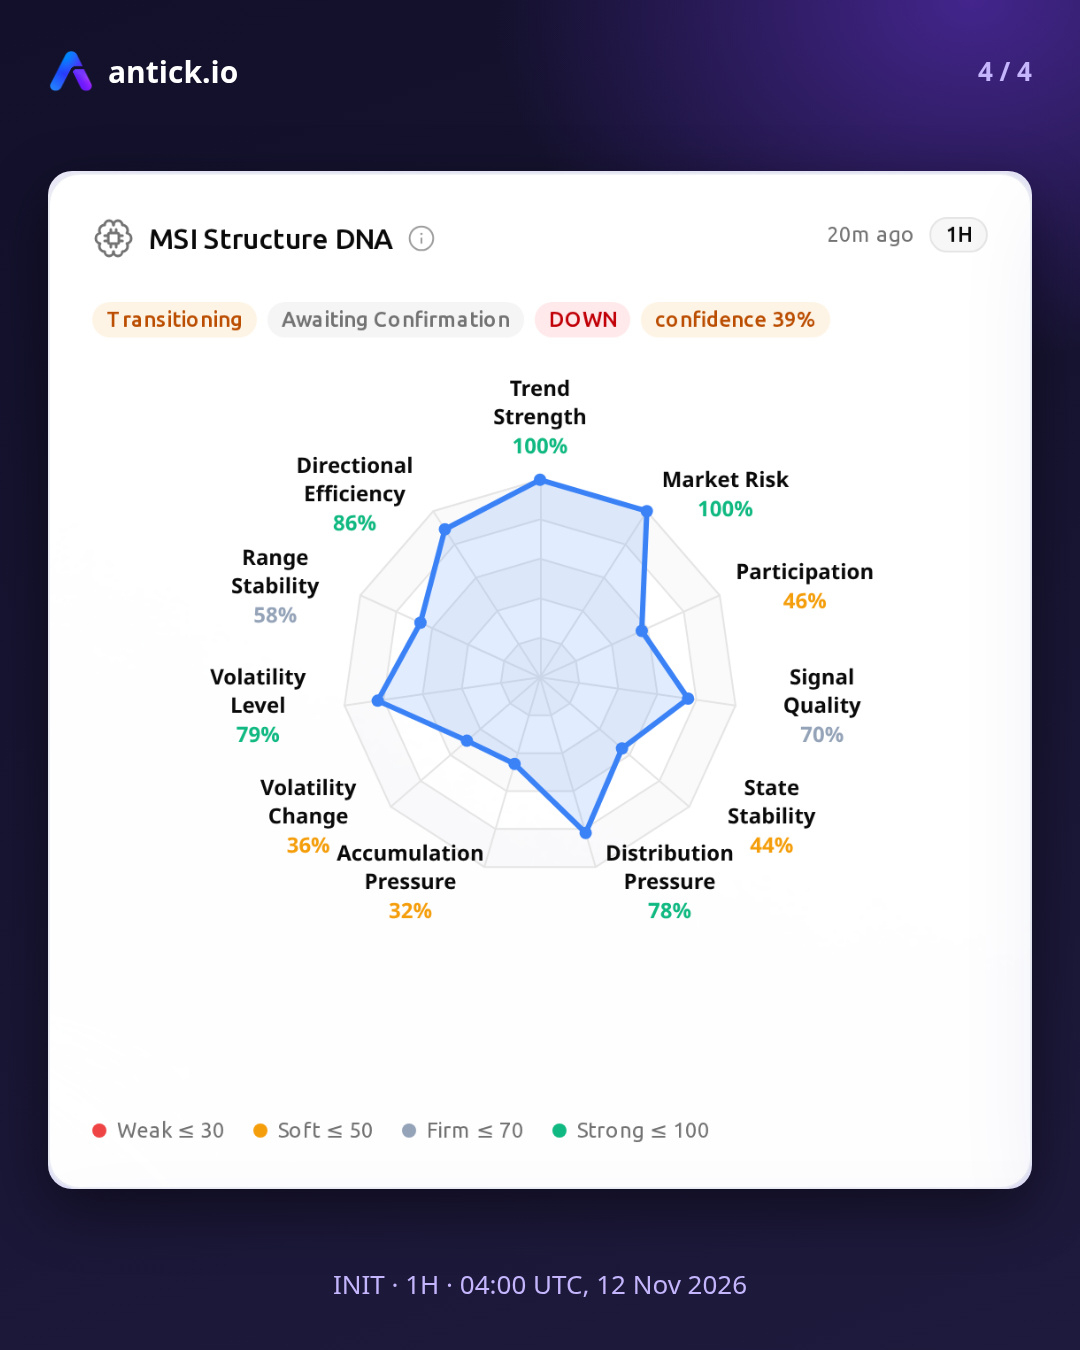
$INIT · 1H · Data as of 04:00 UTC, 12 Nov 2026
INIT is in a transition between structural regimes, and the engines are split between fear, balance and breakout signals. There is a possibility of a recovery higher if the balanced order book holds and the breakout pressure gains quality. A slide lower also remains possible if the fear-driven behavior persists and the pullback within the trend extends.
Risk conditions:
- State Stability (SS) turns negative, regime shift risk
- Awareness drops below 0.3, crowd complacent while price moves
Invalidation zones:
- Upside reading weakens on a 1H close below 0.13188 to 0.13271
- Downside reading weakens on a 1H close above 0.14966 to 0.15034
Data-based reading, not a forecast. Analytics only, not financial advice.
$INIT #INIT #AntickIO #AnalyticByTick #MarketStructure
$INIT · 1H · Data as of 04:00 UTC, 12 Nov 2026
INIT is in a transition between structural regimes, and the engines are split between fear, balance and breakout signals. There is a possibility of a recovery higher if the balanced order book holds and the breakout pressure gains quality. A slide lower also remains possible if the fear-driven behavior persists and the pullback within the trend extends.
Risk conditions:
- State Stability (SS) turns negative, regime shift risk
- Awareness drops below 0.3, crowd complacent while price moves
Invalidation zones:
- Upside reading weakens on a 1H close below 0.13188 to 0.13271
- Downside reading weakens on a 1H close above 0.14966 to 0.15034
Data-based reading, not a forecast. Analytics only, not financial advice.
$INIT #INIT #AntickIO #AnalyticByTick #MarketStructure
INIT is in a transition between structural regimes, and the engines are split between fear, balance and breakout signals. There is a possibility of a recovery higher if the balanced order book holds and the breakout pressure gains quality. A slide lower also remains possible if the fear-driven behavior persists and the pullback within the trend extends.
Risk conditions:
- State Stability (SS) turns negative, regime shift risk
- Awareness drops below 0.3, crowd complacent while price moves
Invalidation zones:
- Upside reading weakens on a 1H close below 0.13188 to 0.13271
- Downside reading weakens on a 1H close above 0.14966 to 0.15034
Data-based reading, not a forecast. Analytics only, not financial advice.
$INIT #INIT #AntickIO #AnalyticByTick #MarketStructure
2
638
·
--
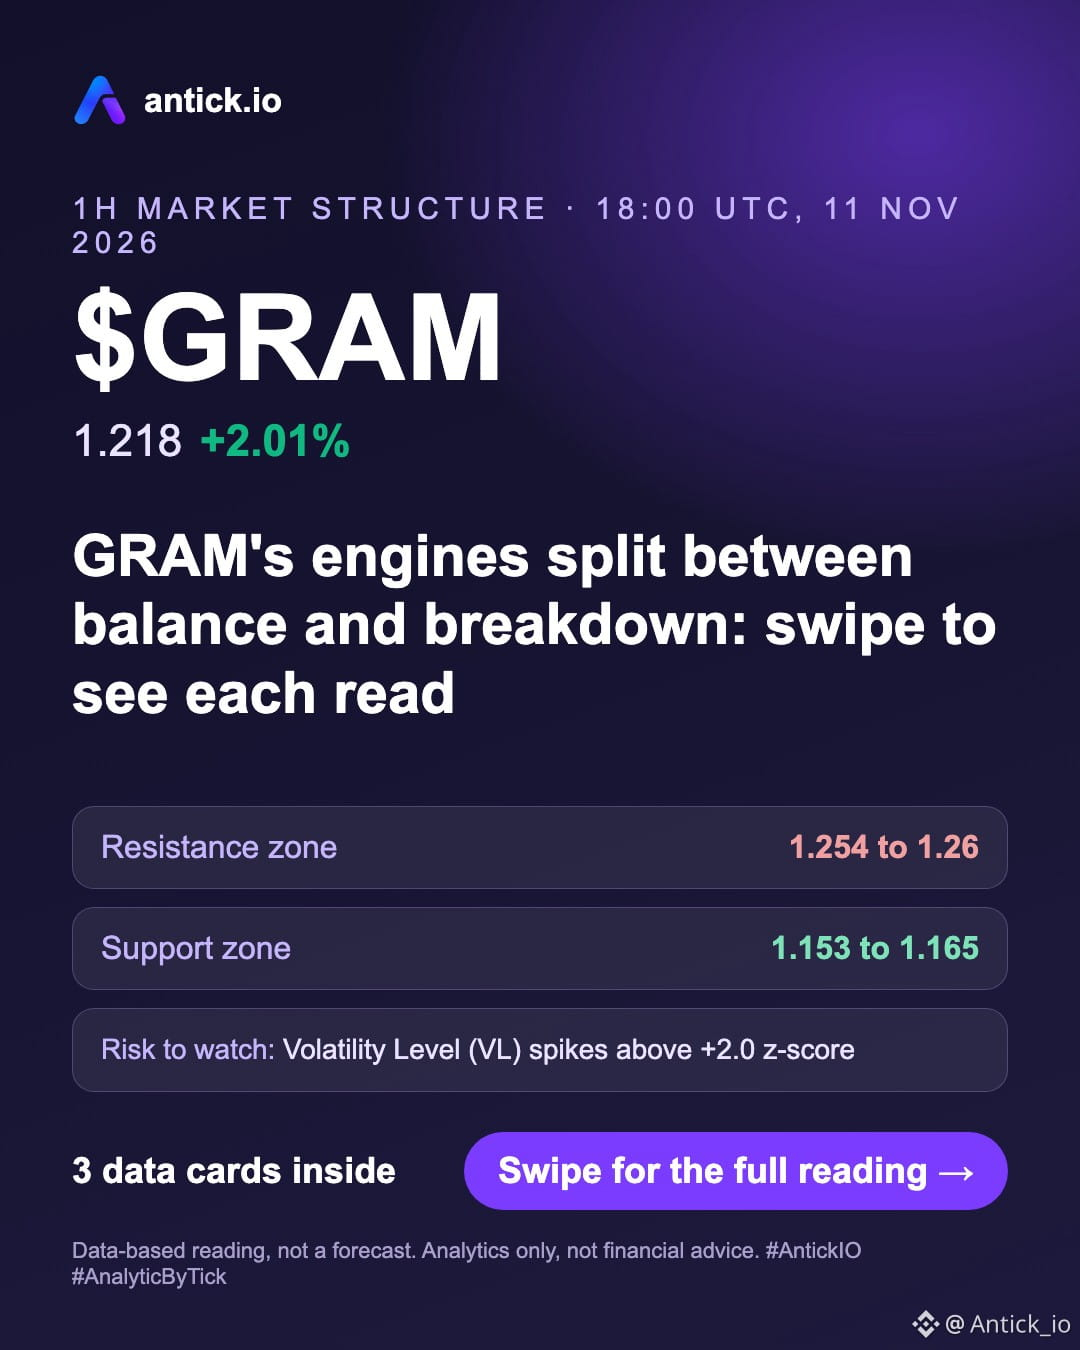
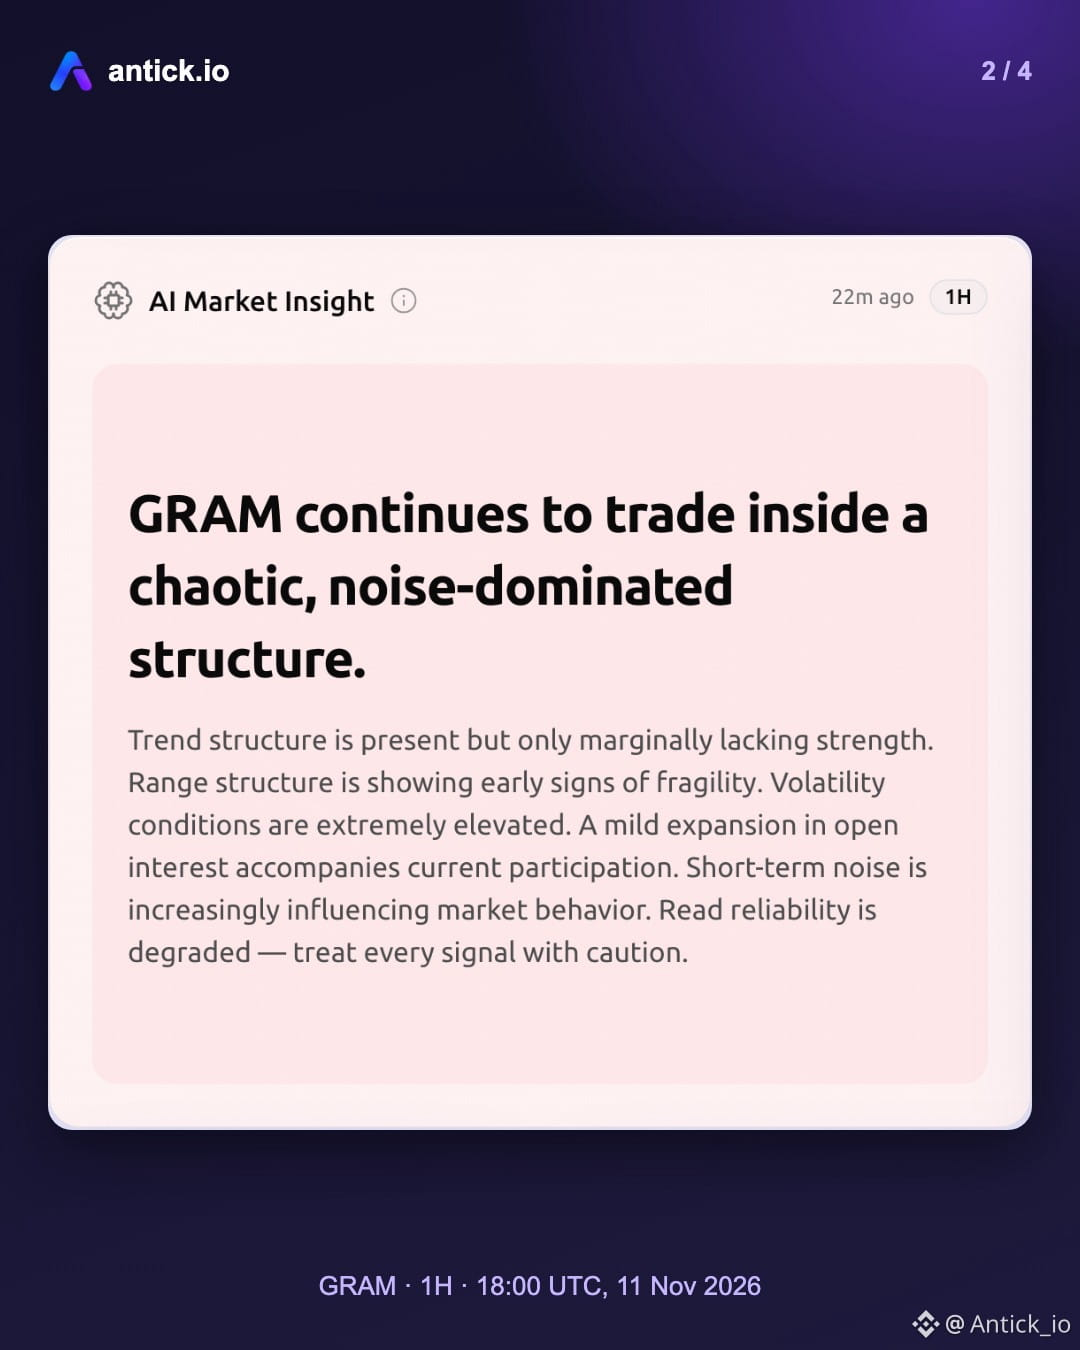
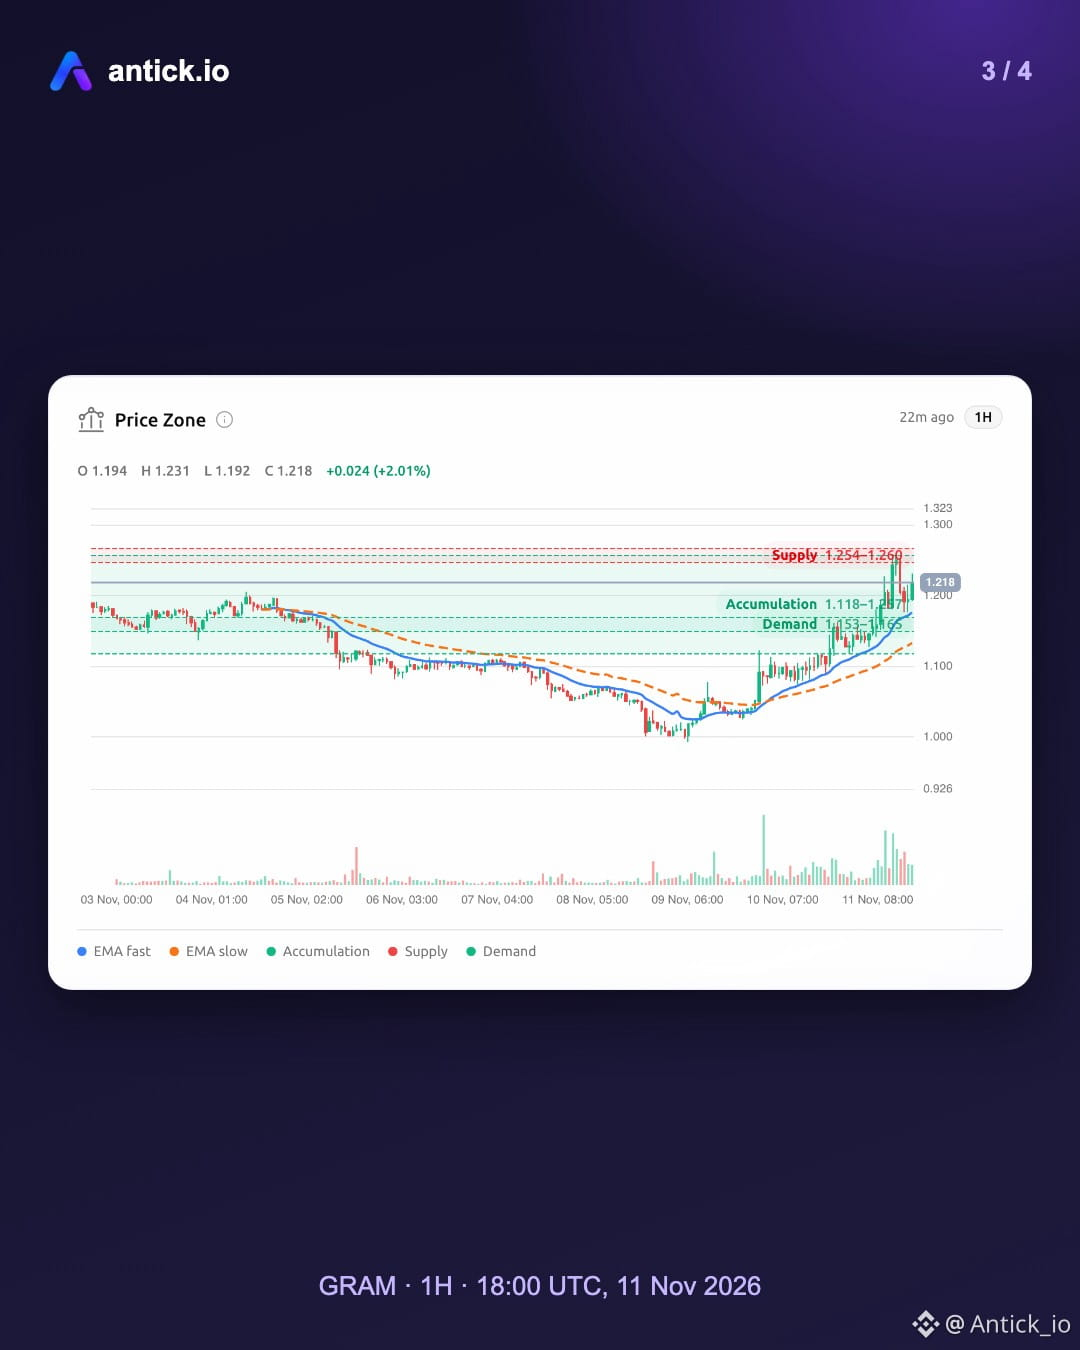
$GRAM · 1H · Data as of 18:00 UTC, 11 Nov 2026
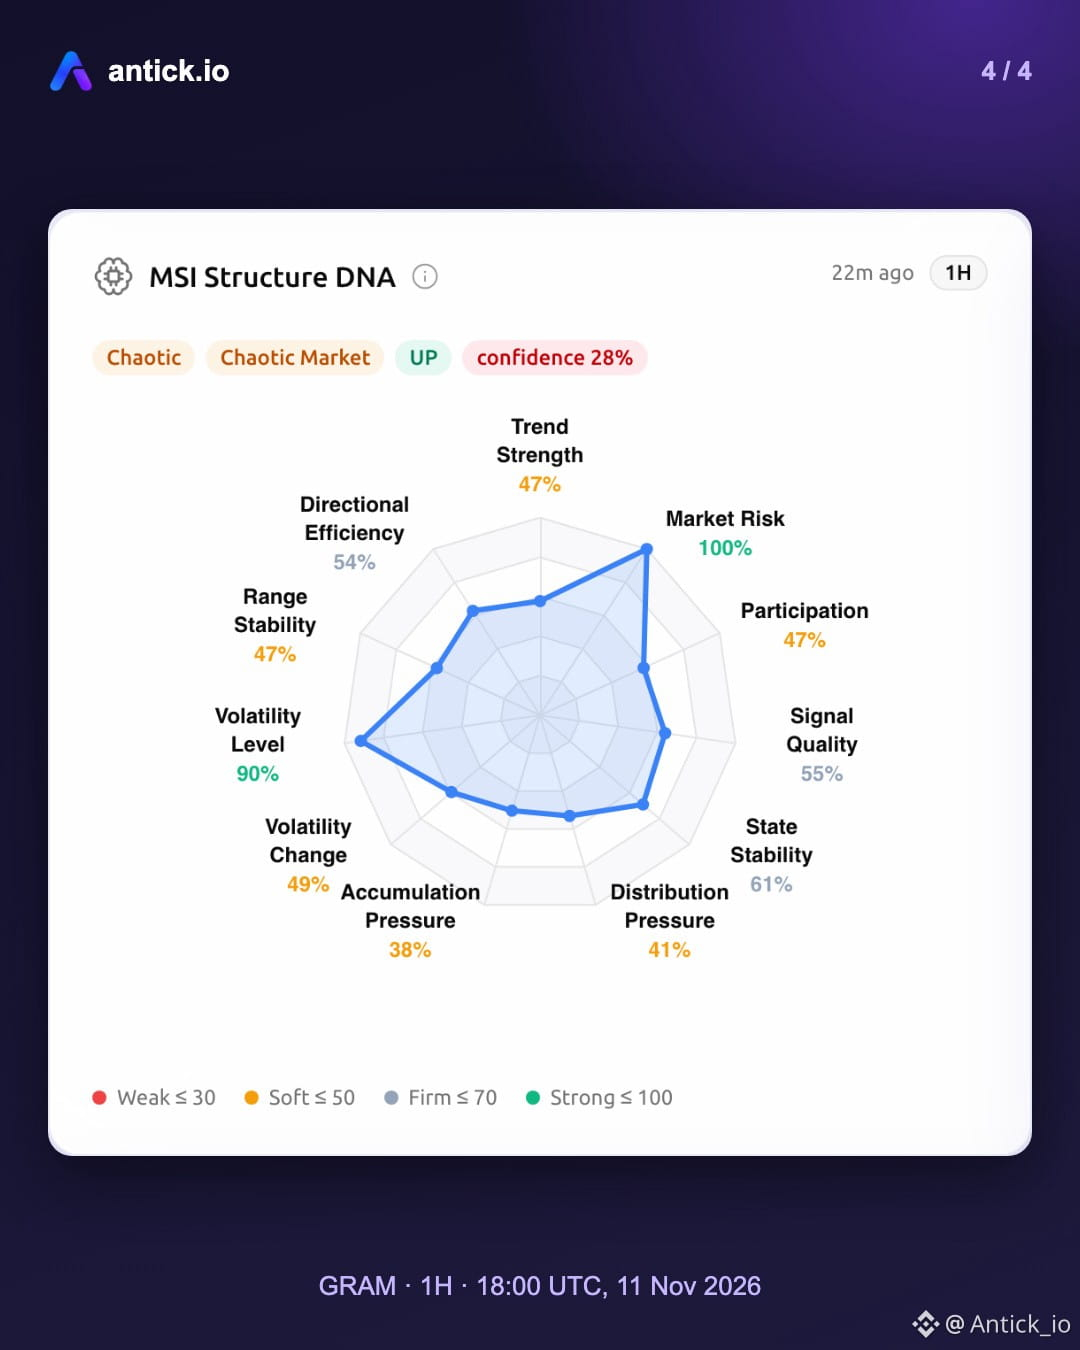
Readings on GRAM are mixed, and the latest breakout attempt lacks clean follow-through. There is a possibility of a move higher if the balanced order book and the upward bias across most engines hold. A move lower also remains possible if the fear-driven behavior and the multi-timeframe structural breakdown hold.
Risk conditions:
- Volatility Level (VL) spikes above +2.0 z-score
- Signal Quality (SQ) drops below 0.3, noise dominant
Invalidation zones:
- Upside reading weakens on a 1H close below 1.153 to 1.165
- Downside reading weakens on a 1H close above 1.254 to 1.26
Data-based reading, not a forecast. Analytics only, not financial advice.
$GRAM #GRAM #AntickIO #AnalyticByTick #MarketStructure
$GRAM · 1H · Data as of 18:00 UTC, 11 Nov 2026
Readings on GRAM are mixed, and the latest breakout attempt lacks clean follow-through. There is a possibility of a move higher if the balanced order book and the upward bias across most engines hold. A move lower also remains possible if the fear-driven behavior and the multi-timeframe structural breakdown hold.
Risk conditions:
- Volatility Level (VL) spikes above +2.0 z-score
- Signal Quality (SQ) drops below 0.3, noise dominant
Invalidation zones:
- Upside reading weakens on a 1H close below 1.153 to 1.165
- Downside reading weakens on a 1H close above 1.254 to 1.26
Data-based reading, not a forecast. Analytics only, not financial advice.
$GRAM #GRAM #AntickIO #AnalyticByTick #MarketStructure
Readings on GRAM are mixed, and the latest breakout attempt lacks clean follow-through. There is a possibility of a move higher if the balanced order book and the upward bias across most engines hold. A move lower also remains possible if the fear-driven behavior and the multi-timeframe structural breakdown hold.
Risk conditions:
- Volatility Level (VL) spikes above +2.0 z-score
- Signal Quality (SQ) drops below 0.3, noise dominant
Invalidation zones:
- Upside reading weakens on a 1H close below 1.153 to 1.165
- Downside reading weakens on a 1H close above 1.254 to 1.26
Data-based reading, not a forecast. Analytics only, not financial advice.
$GRAM #GRAM #AntickIO #AnalyticByTick #MarketStructure
1
212
·
--
Remeber to always check every timeframe for what asset you watch so you can validate your trading strategy on antick.io
$GNS $HOLO $BTC
#CryptoAnalysis #CryptoTrends #CryptoMarketWatch #Antick #AntickIO #AnalyticByTick
Remeber to always check every timeframe for what asset you watch so you can validate your trading strategy on antick.io
$GNS $HOLO $BTC
#CryptoAnalysis #CryptoTrends #CryptoMarketWatch #Antick #AntickIO #AnalyticByTick
$GNS $HOLO $BTC
#CryptoAnalysis #CryptoTrends #CryptoMarketWatch #Antick #AntickIO #AnalyticByTick
92
·
--
Bearish
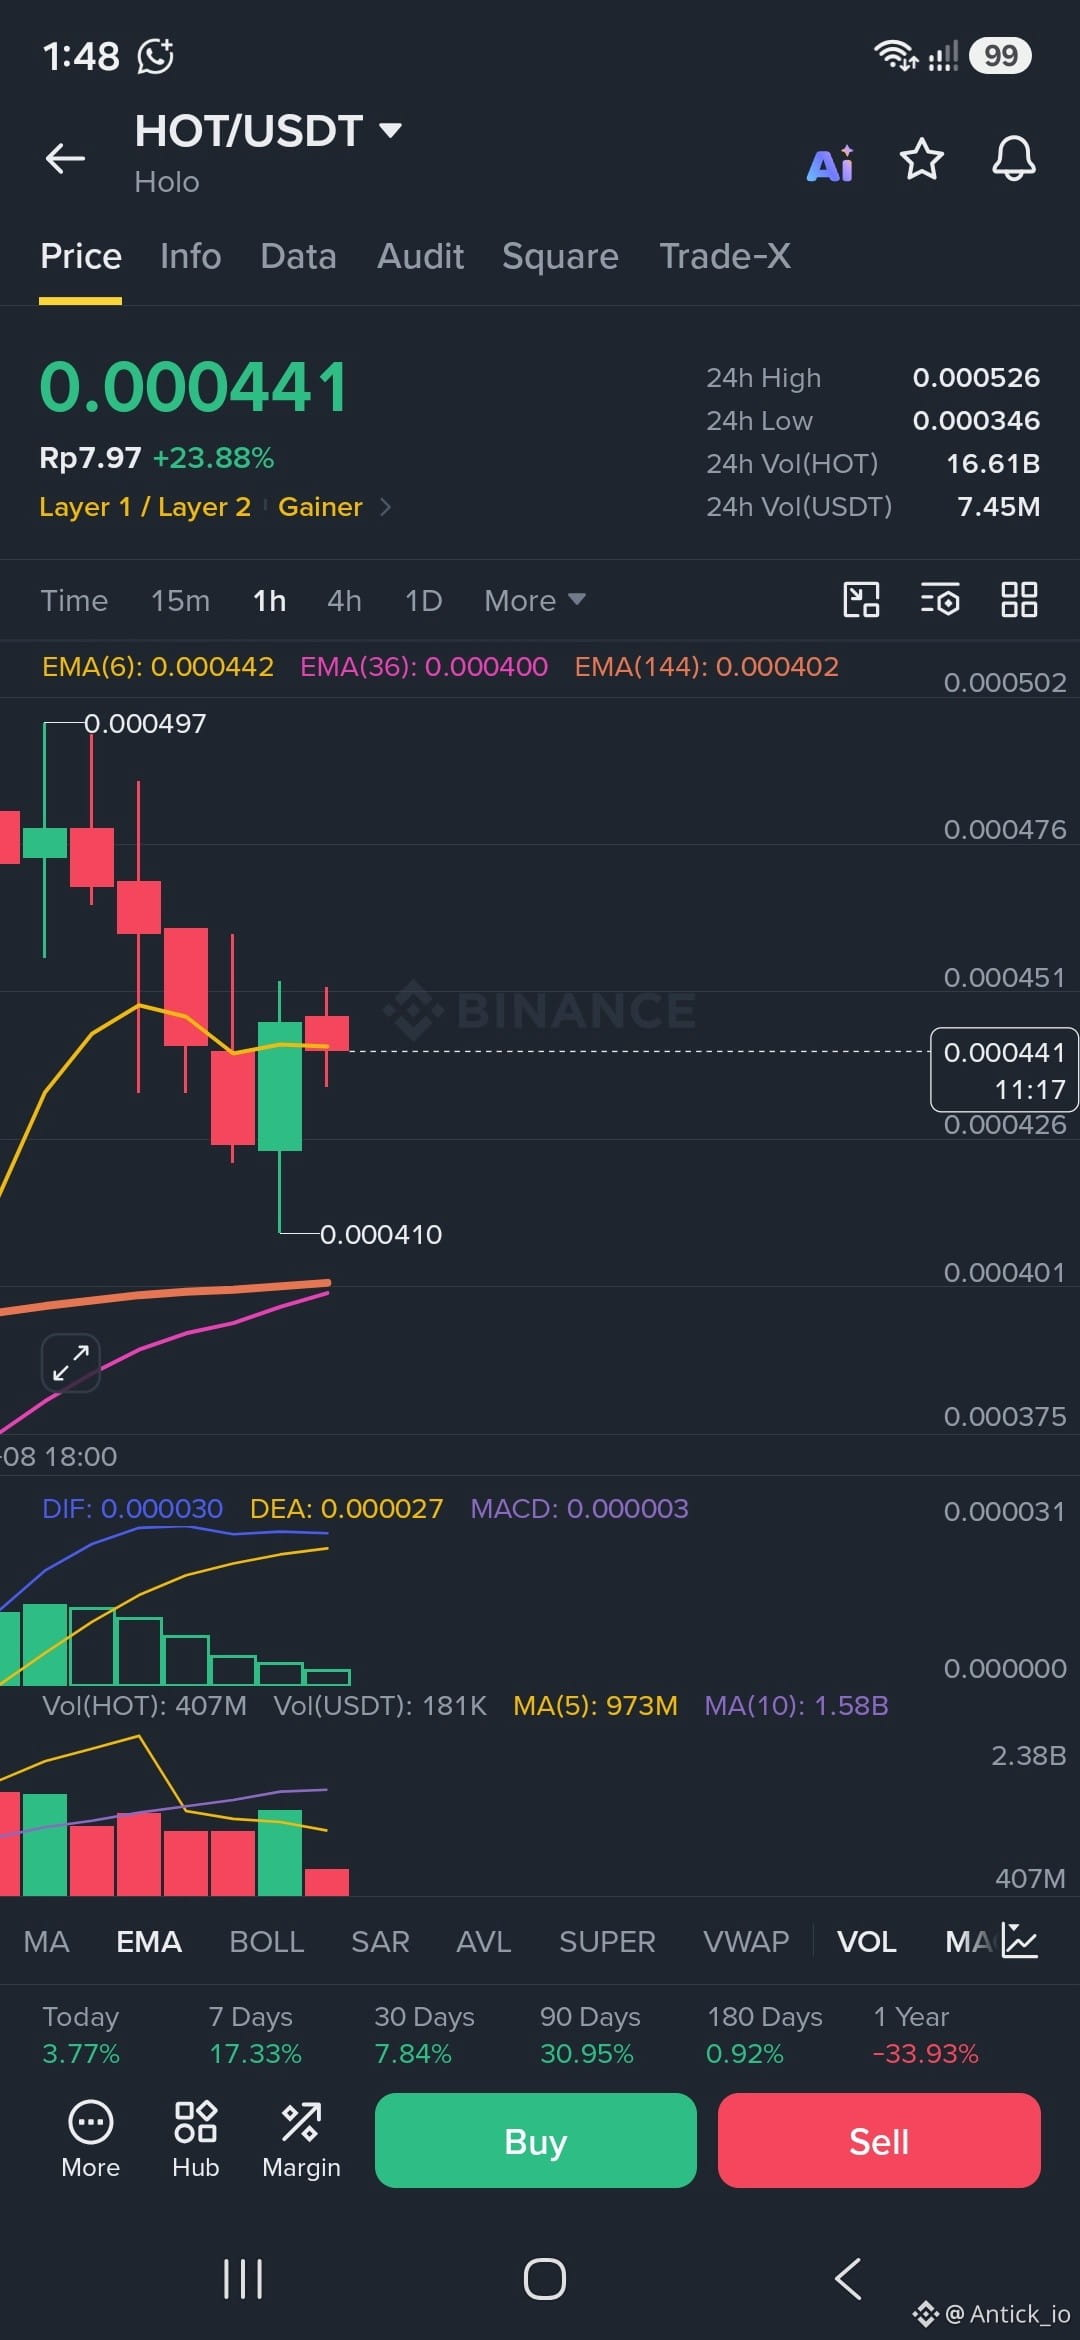
seems like my post 1hour ago for $HOT follow.the trend i spoke about.
#BTC #CryptoStrategies #CryptoAnalysis #TradingTools #crypto
seems like my post 1hour ago for $HOT follow.the trend i spoke about.
#BTC #CryptoStrategies #CryptoAnalysis #TradingTools #crypto
#BTC #CryptoStrategies #CryptoAnalysis #TradingTools #crypto
Antick_io
·
--
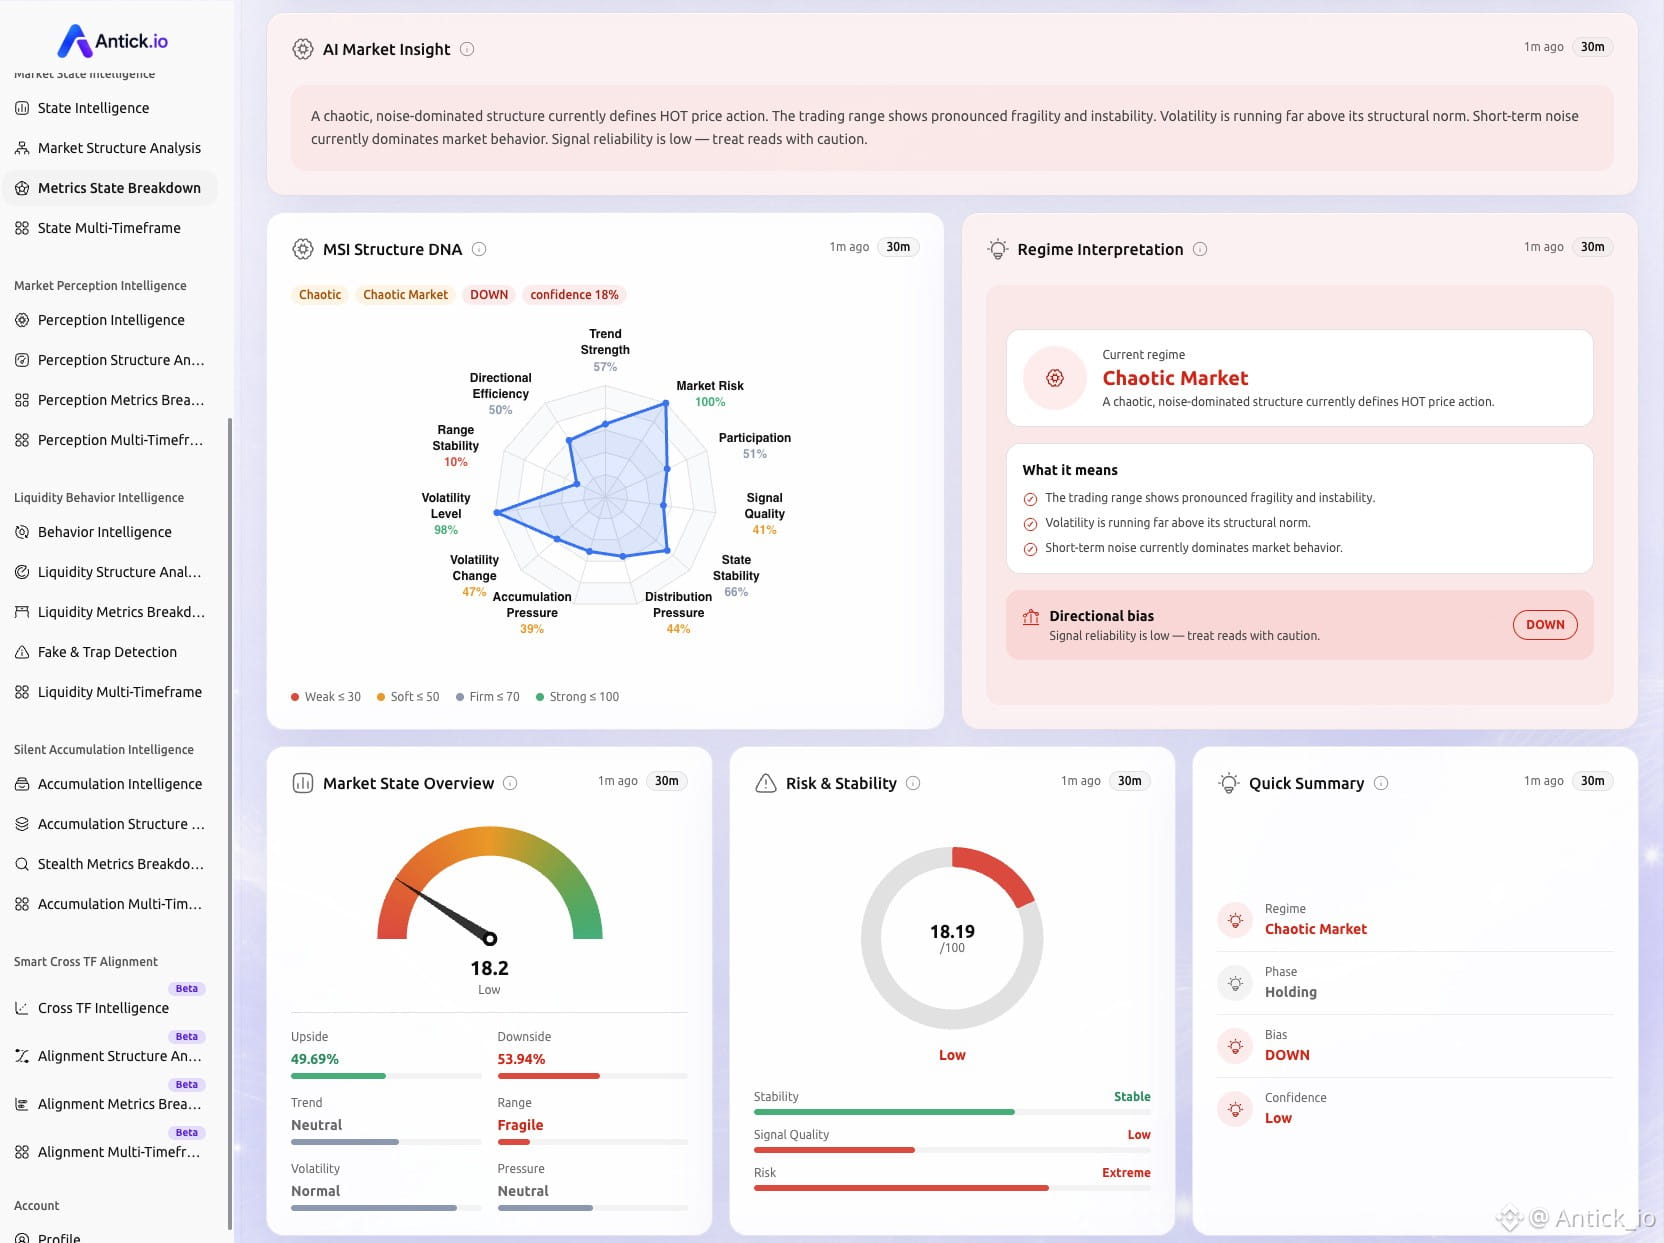
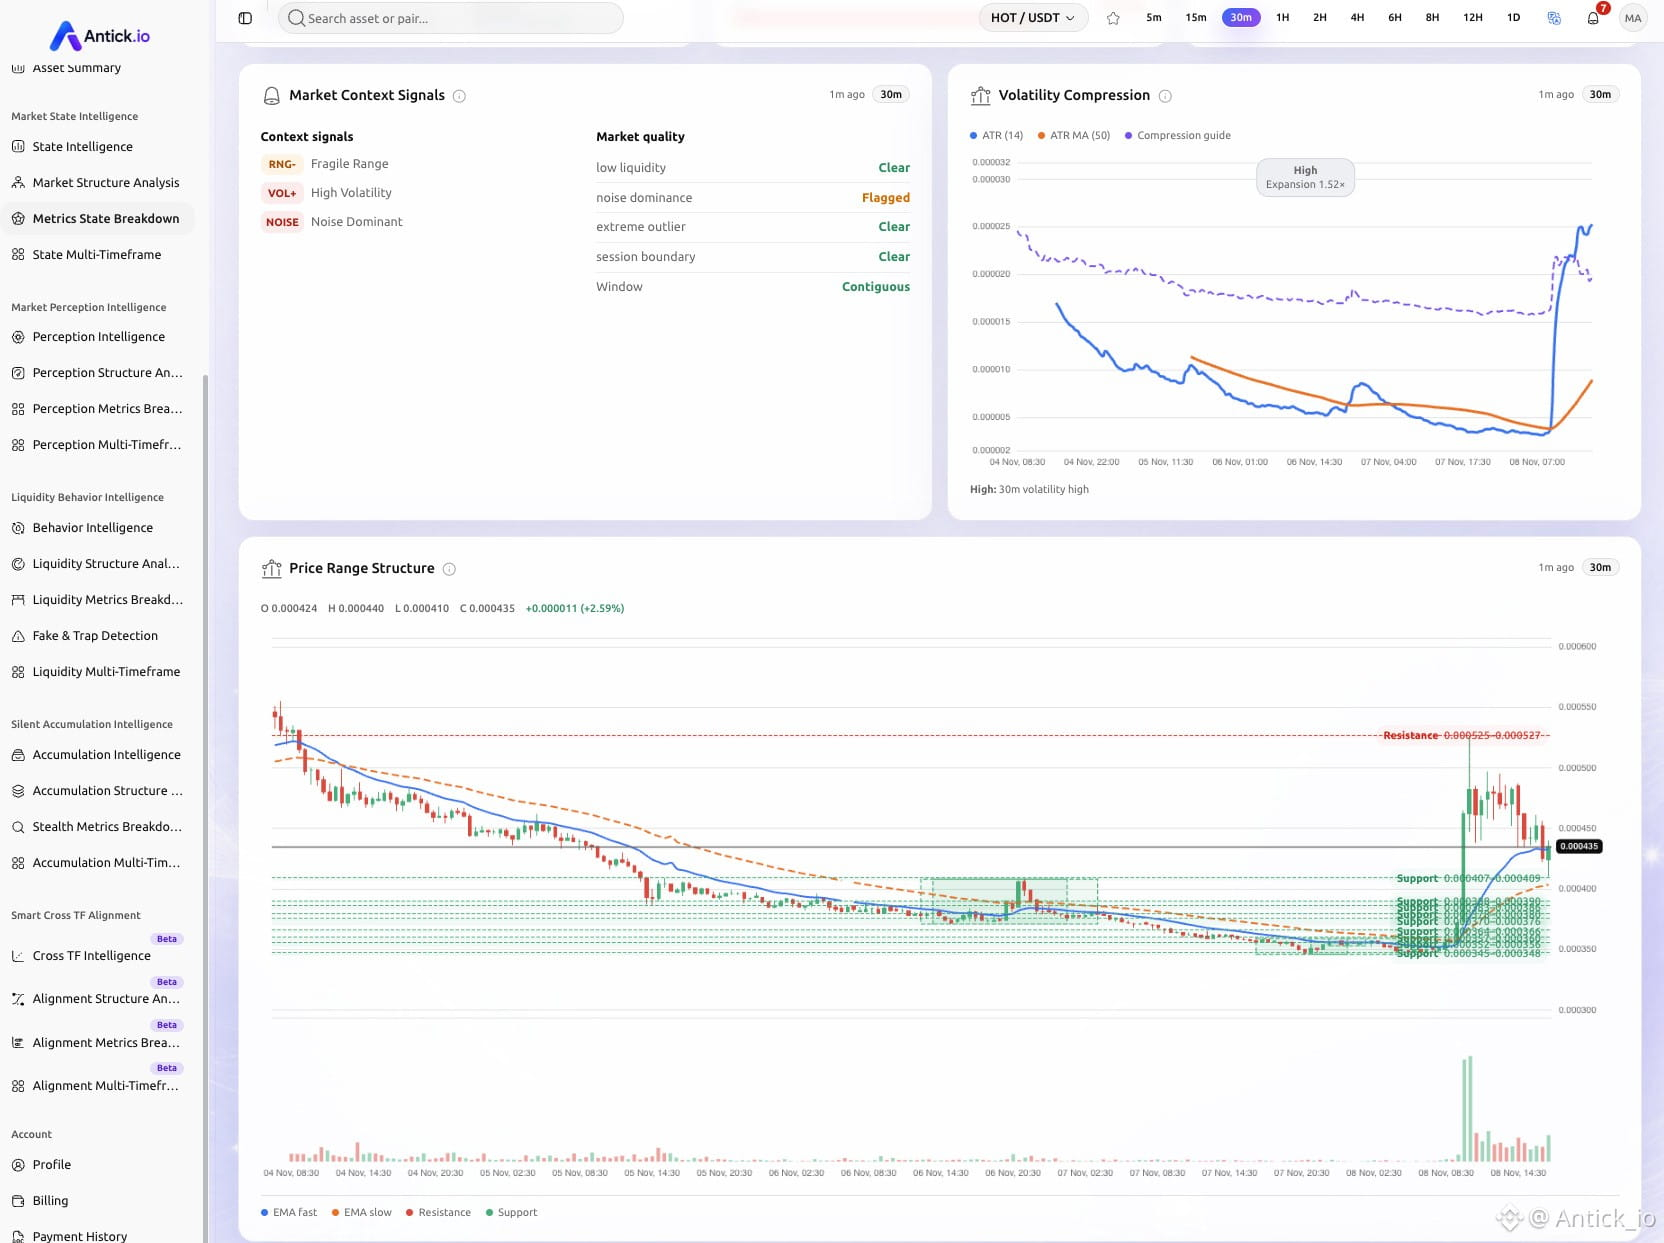
Antick.io Analytic say's on Market Structure Analysis for HOT/USDT 30m Data Insight on 17:30 UTC+0:
$HOT is currently trapped in a "Chaotic Market" regime, characterized by a staggering 100% Market Risk and a fragile trading range. The data shows extreme conditions: Volatility Level is running at 98% with a 1.52x high expansion rate, driven heavily by low liquidity and short-term noise dominance.
We are seeing a slight DOWN bias, with downside pressure (53.94%) edging out upside potential (49.69%). The current price is hovering around 0.000435, with critical structural support at 0.000407 and heavy resistance near 0.000525.
However, signal confidence is critically low at just 18%. The system strictly advises treating all reads with extreme caution, as the market is highly unstable.
Disclaimer: This analysis is for informational purposes only and does not constitute financial advice. Cryptocurrency markets are highly volatile. Always DYOR before trading.
$GNS #Antick #AntickIO #CryptoAnalysis
$HOT is currently trapped in a "Chaotic Market" regime, characterized by a staggering 100% Market Risk and a fragile trading range. The data shows extreme conditions: Volatility Level is running at 98% with a 1.52x high expansion rate, driven heavily by low liquidity and short-term noise dominance.
We are seeing a slight DOWN bias, with downside pressure (53.94%) edging out upside potential (49.69%). The current price is hovering around 0.000435, with critical structural support at 0.000407 and heavy resistance near 0.000525.
However, signal confidence is critically low at just 18%. The system strictly advises treating all reads with extreme caution, as the market is highly unstable.
Disclaimer: This analysis is for informational purposes only and does not constitute financial advice. Cryptocurrency markets are highly volatile. Always DYOR before trading.
$GNS #Antick #AntickIO #CryptoAnalysis
33
·
--
Antick.io Analytic say's on Market Structure Analysis for HOT/USDT 30m Data Insight on 17:30 UTC+0:
$HOT is currently trapped in a "Chaotic Market" regime, characterized by a staggering 100% Market Risk and a fragile trading range. The data shows extreme conditions: Volatility Level is running at 98% with a 1.52x high expansion rate, driven heavily by low liquidity and short-term noise dominance.
We are seeing a slight DOWN bias, with downside pressure (53.94%) edging out upside potential (49.69%). The current price is hovering around 0.000435, with critical structural support at 0.000407 and heavy resistance near 0.000525.
However, signal confidence is critically low at just 18%. The system strictly advises treating all reads with extreme caution, as the market is highly unstable.
Disclaimer: This analysis is for informational purposes only and does not constitute financial advice. Cryptocurrency markets are highly volatile. Always DYOR before trading.
$GNS #Antick #AntickIO #CryptoAnalysis
Antick.io Analytic say's on Market Structure Analysis for HOT/USDT 30m Data Insight on 17:30 UTC+0:
$HOT is currently trapped in a "Chaotic Market" regime, characterized by a staggering 100% Market Risk and a fragile trading range. The data shows extreme conditions: Volatility Level is running at 98% with a 1.52x high expansion rate, driven heavily by low liquidity and short-term noise dominance.
We are seeing a slight DOWN bias, with downside pressure (53.94%) edging out upside potential (49.69%). The current price is hovering around 0.000435, with critical structural support at 0.000407 and heavy resistance near 0.000525.
However, signal confidence is critically low at just 18%. The system strictly advises treating all reads with extreme caution, as the market is highly unstable.
Disclaimer: This analysis is for informational purposes only and does not constitute financial advice. Cryptocurrency markets are highly volatile. Always DYOR before trading.
$GNS #Antick #AntickIO #CryptoAnalysis
$HOT is currently trapped in a "Chaotic Market" regime, characterized by a staggering 100% Market Risk and a fragile trading range. The data shows extreme conditions: Volatility Level is running at 98% with a 1.52x high expansion rate, driven heavily by low liquidity and short-term noise dominance.
We are seeing a slight DOWN bias, with downside pressure (53.94%) edging out upside potential (49.69%). The current price is hovering around 0.000435, with critical structural support at 0.000407 and heavy resistance near 0.000525.
However, signal confidence is critically low at just 18%. The system strictly advises treating all reads with extreme caution, as the market is highly unstable.
Disclaimer: This analysis is for informational purposes only and does not constitute financial advice. Cryptocurrency markets are highly volatile. Always DYOR before trading.
$GNS #Antick #AntickIO #CryptoAnalysis
1
57
·
--
Are you trading, or are you just guessing? 📉
The market doesn’t care about your gut feelings. The difference between struggling traders and consistently profitable ones comes down to one thing: Validation.
Before you risk real capital, you need to know your strategy actually works. That's where antick.io comes in. With our deep trading analysis, you can refine and validate your edge.
It’s the ultimate arsenal every modern trader needs to survive and thrive today. 🚀📊
Ready to stop gambling and start trading smart!
#TradingStrategy #DayTraderLife #AntickIO #TradingSetup #CryptoCommunity
Are you trading, or are you just guessing? 📉
The market doesn’t care about your gut feelings. The difference between struggling traders and consistently profitable ones comes down to one thing: Validation.
Before you risk real capital, you need to know your strategy actually works. That's where antick.io comes in. With our deep trading analysis, you can refine and validate your edge.
It’s the ultimate arsenal every modern trader needs to survive and thrive today. 🚀📊
Ready to stop gambling and start trading smart!
#TradingStrategy #DayTraderLife #AntickIO #TradingSetup #CryptoCommunity
The market doesn’t care about your gut feelings. The difference between struggling traders and consistently profitable ones comes down to one thing: Validation.
Before you risk real capital, you need to know your strategy actually works. That's where antick.io comes in. With our deep trading analysis, you can refine and validate your edge.
It’s the ultimate arsenal every modern trader needs to survive and thrive today. 🚀📊
Ready to stop gambling and start trading smart!
#TradingStrategy #DayTraderLife #AntickIO #TradingSetup #CryptoCommunity
83
·
--
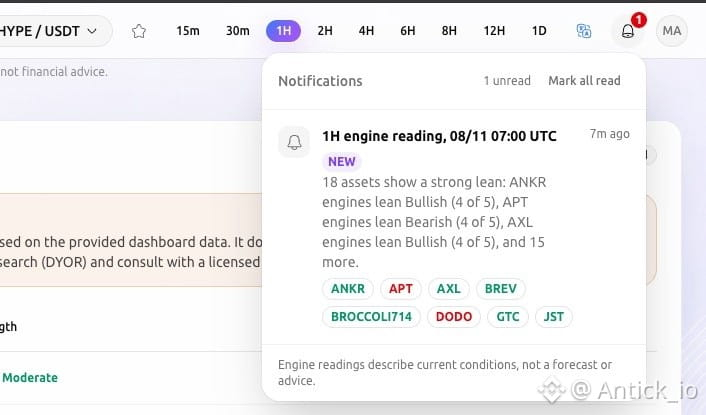
Now you can get notification for asset that standout or have a significant move on antick.io
$BROCCOLI714 $BTC $ETH
#TradingAnalysis #TradingStrategies💼💰 #Antick #AntickIO
Now you can get notification for asset that standout or have a significant move on antick.io
$BROCCOLI714 $BTC $ETH
#TradingAnalysis #TradingStrategies💼💰 #Antick #AntickIO
$BROCCOLI714 $BTC $ETH
#TradingAnalysis #TradingStrategies💼💰 #Antick #AntickIO
261
·
--
That buy wall you trust? It might be fake. 👀
Big players stack orders, then pull them before price arrives.
Antick.io shows you live:
🟣 Fake walls & trap zones
🔻 Pulled liquidity
🟢🔴 Bullish/bearish scenarios
⚠️ Risk alerts before the move
🧠 AI insight, 5m to 1D
Stop trading the bait. Start free at antick.io 🎯
Disclaimer: Not financial advice.
#Antick #CryptoTrading #OrderBook #Bitcoin #ETH #OrderFlow #FakeWall #TradingTools
$CYPHB $MITO $BTC
That buy wall you trust? It might be fake. 👀
Big players stack orders, then pull them before price arrives.
Antick.io shows you live:
🟣 Fake walls & trap zones
🔻 Pulled liquidity
🟢🔴 Bullish/bearish scenarios
⚠️ Risk alerts before the move
🧠 AI insight, 5m to 1D
Stop trading the bait. Start free at antick.io 🎯
Disclaimer: Not financial advice.
#Antick #CryptoTrading #OrderBook #Bitcoin #ETH #OrderFlow #FakeWall #TradingTools
$CYPHB $MITO $BTC
Big players stack orders, then pull them before price arrives.
Antick.io shows you live:
🟣 Fake walls & trap zones
🔻 Pulled liquidity
🟢🔴 Bullish/bearish scenarios
⚠️ Risk alerts before the move
🧠 AI insight, 5m to 1D
Stop trading the bait. Start free at antick.io 🎯
Disclaimer: Not financial advice.
#Antick #CryptoTrading #OrderBook #Bitcoin #ETH #OrderFlow #FakeWall #TradingTools
$CYPHB $MITO $BTC
72
·
--
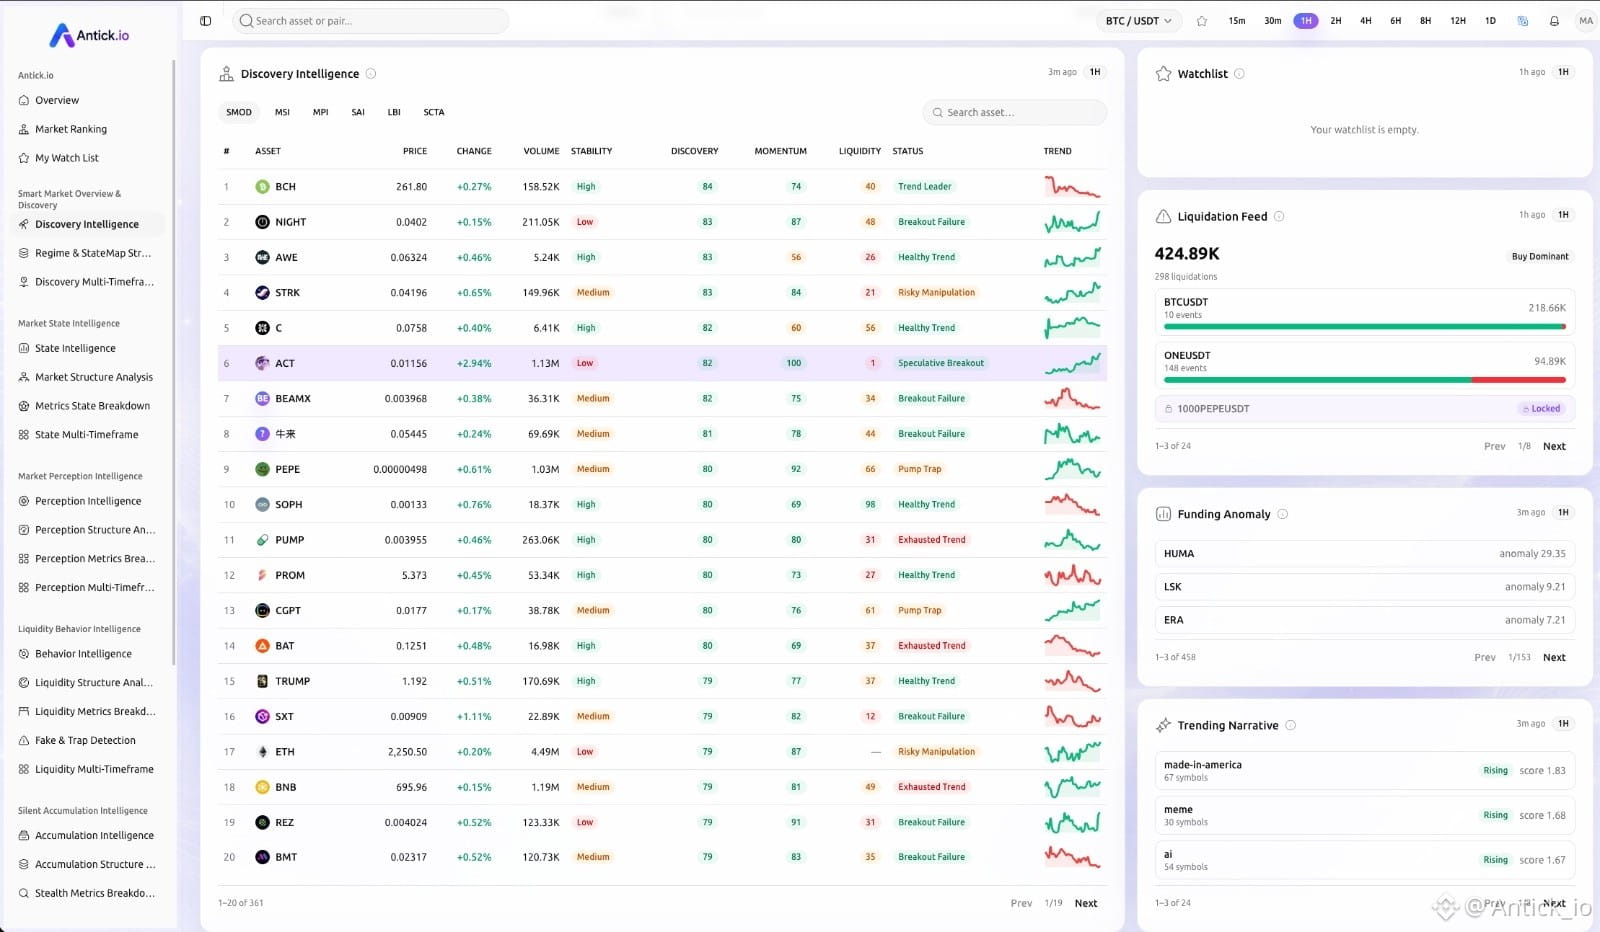
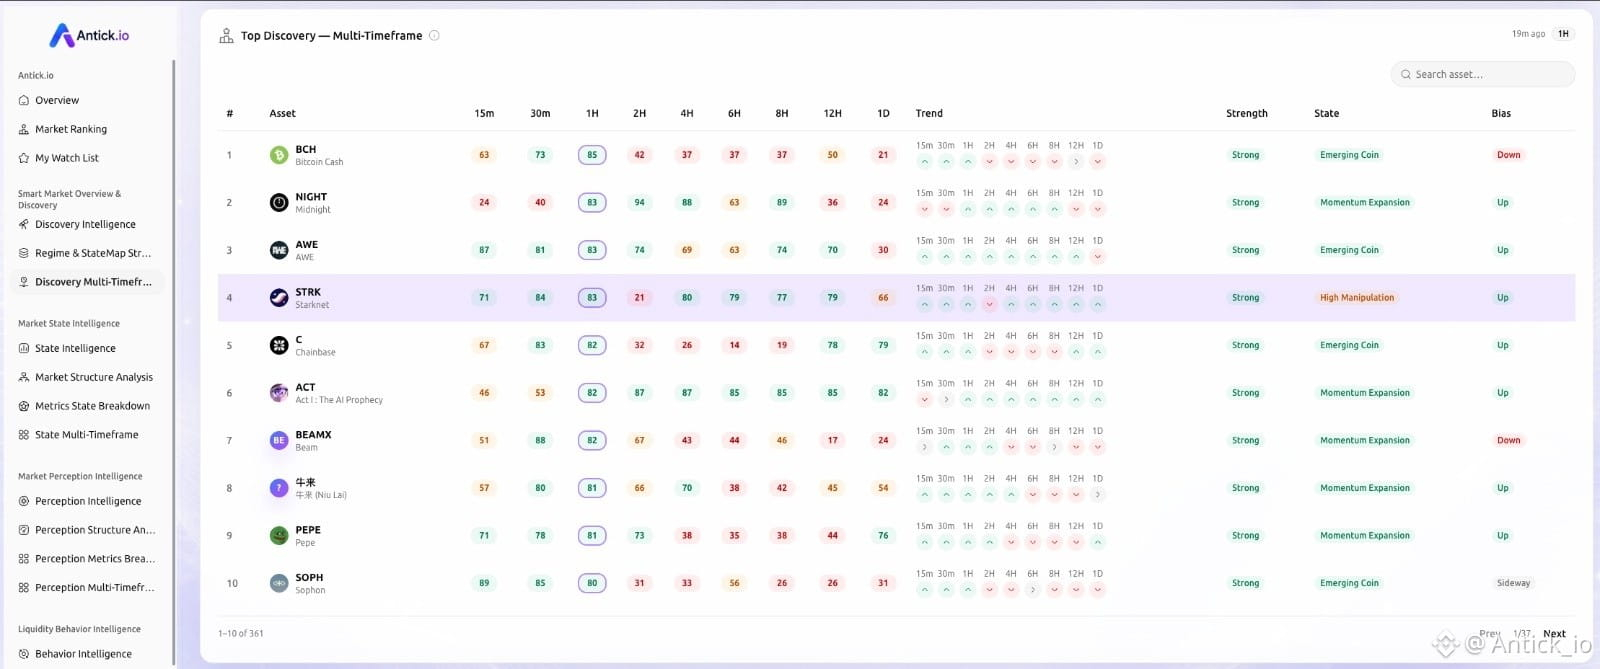
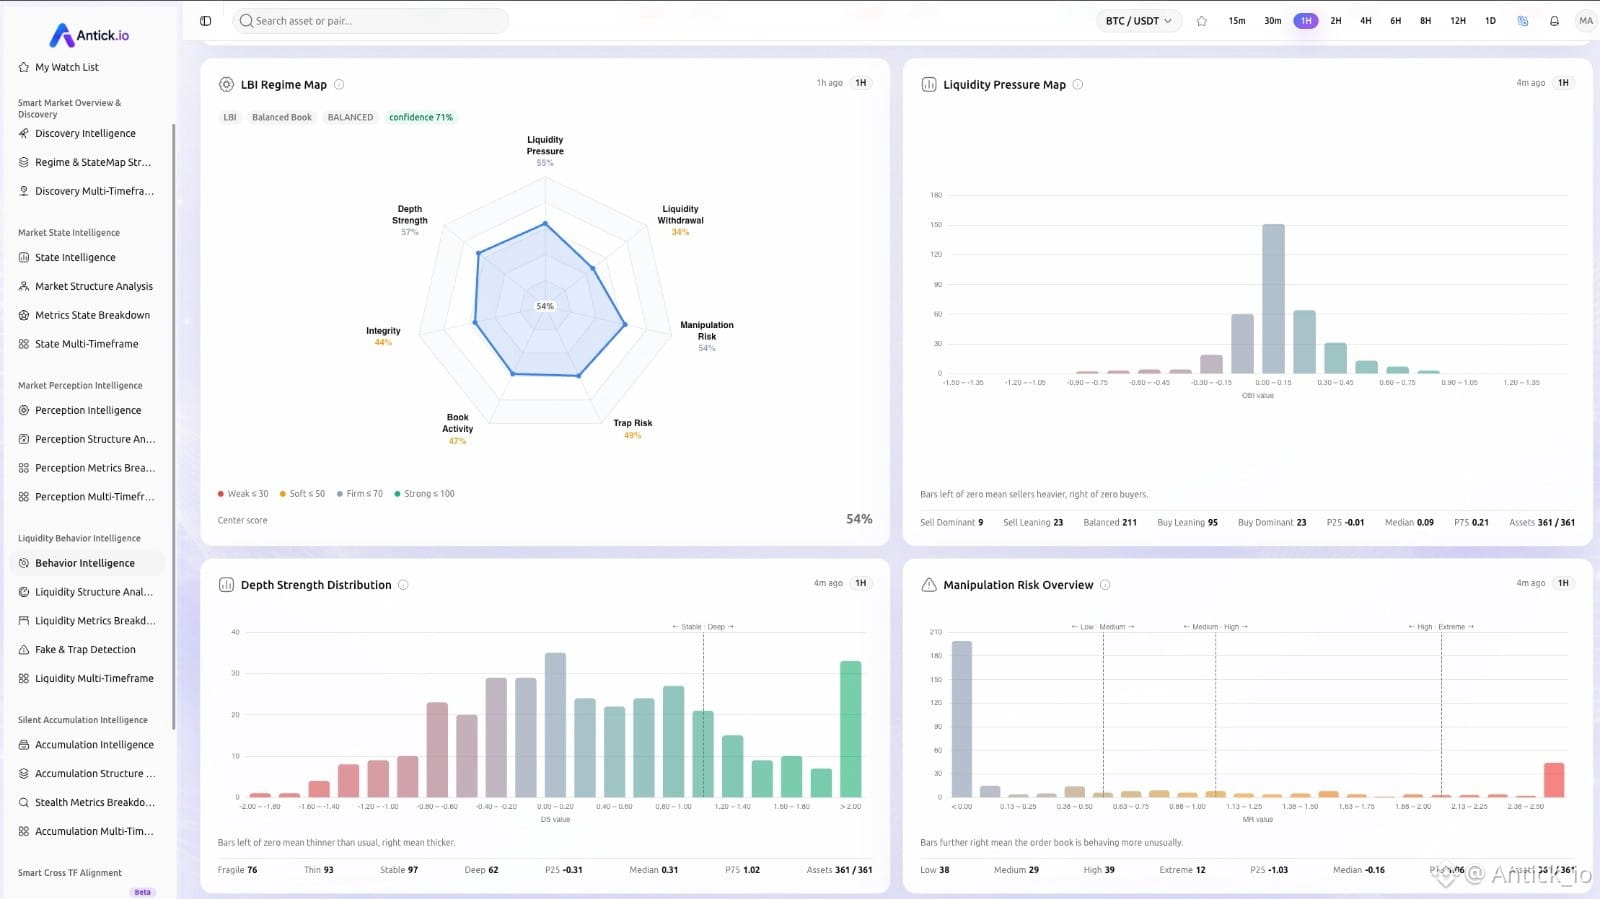
📊 1H | 09:00 UTC Data Insight
The market order book is currently Balanced with 71% confidence, but caution is needed as Manipulation Risk spikes to 94%.
Watch $STRK closely: it displays an 'Up' bias and strong multi-timeframe discovery, yet is heavily flagged for High Manipulation. Meanwhile, BCH stands out as a Trend Leader, andACT is signaling a Speculative Breakout. Stay cautious in the markets!
Disclaimer: This is data-driven analysis and not financial advice.
#BTC #Antick $CYPHB $MITO
📊 1H | 09:00 UTC Data Insight
The market order book is currently Balanced with 71% confidence, but caution is needed as Manipulation Risk spikes to 94%.
Watch $STRK closely: it displays an 'Up' bias and strong multi-timeframe discovery, yet is heavily flagged for High Manipulation. Meanwhile, BCH stands out as a Trend Leader, andACT is signaling a Speculative Breakout. Stay cautious in the markets!
Disclaimer: This is data-driven analysis and not financial advice.
#BTC #Antick $CYPHB $MITO
The market order book is currently Balanced with 71% confidence, but caution is needed as Manipulation Risk spikes to 94%.
Watch $STRK closely: it displays an 'Up' bias and strong multi-timeframe discovery, yet is heavily flagged for High Manipulation. Meanwhile, BCH stands out as a Trend Leader, andACT is signaling a Speculative Breakout. Stay cautious in the markets!
Disclaimer: This is data-driven analysis and not financial advice.
#BTC #Antick $CYPHB $MITO
1
628
Log in to explore more content
Join global crypto users on Binance Square
⚡️ Get latest and useful information about crypto.
💬 Trusted by the world’s largest crypto exchange.
👍 Discover real insights from verified creators.
Email / Phone number
Trending Topics
HuangExitNvidiaStrategyInFocus
91,002 views
998 Discussing
STOCKS | Nvidia’s Jensen Huang Resigns, Colette Kress Named as Interim CEO
Binance News
·24 Likes
·35.3k views
AnthropicRejectsIPODelayValuationinQuestion
694,342 views
5,258 Discussing
BitMineReports$6.3BNetLossForFiscal2026
11,601 views
123 Discussing