

EquityPlainTalk
1.1k Posts

EquityPlainTalk
Report
Block User
Clear, common-sense market notes for U.S. stock investors navigating noise, data, and human behavior.
0 Following
137 Followers
271 Liked
Posts
Partly True
Market breadth is flashing warning signs.
Over 58% of $SPX stocks now trading below their 200-day moving average—the weakest breadth reading since May.
This isn't about the index level. It's about what's happening beneath the surface. When more than half the market is underwater on a longer-term basis, it tells you participation is thin and the rally is being carried by fewer names.
Breadth deterioration like this often precedes choppier conditions or deeper pullbacks. Not a crash signal, but a reminder that internal health matters more than headline numbers.
Watch how this evolves over the next few weeks.
Market breadth is flashing warning signs.
Over 58% of $SPX stocks now trading below their 200-day moving average—the weakest breadth reading since May.
This isn't about the index level. It's about what's happening beneath the surface. When more than half the market is underwater on a longer-term basis, it tells you participation is thin and the rally is being carried by fewer names.
Breadth deterioration like this often precedes choppier conditions or deeper pullbacks. Not a crash signal, but a reminder that internal health matters more than headline numbers.
Watch how this evolves over the next few weeks.
Over 58% of $SPX stocks now trading below their 200-day moving average—the weakest breadth reading since May.
This isn't about the index level. It's about what's happening beneath the surface. When more than half the market is underwater on a longer-term basis, it tells you participation is thin and the rally is being carried by fewer names.
Breadth deterioration like this often precedes choppier conditions or deeper pullbacks. Not a crash signal, but a reminder that internal health matters more than headline numbers.
Watch how this evolves over the next few weeks.
2
789
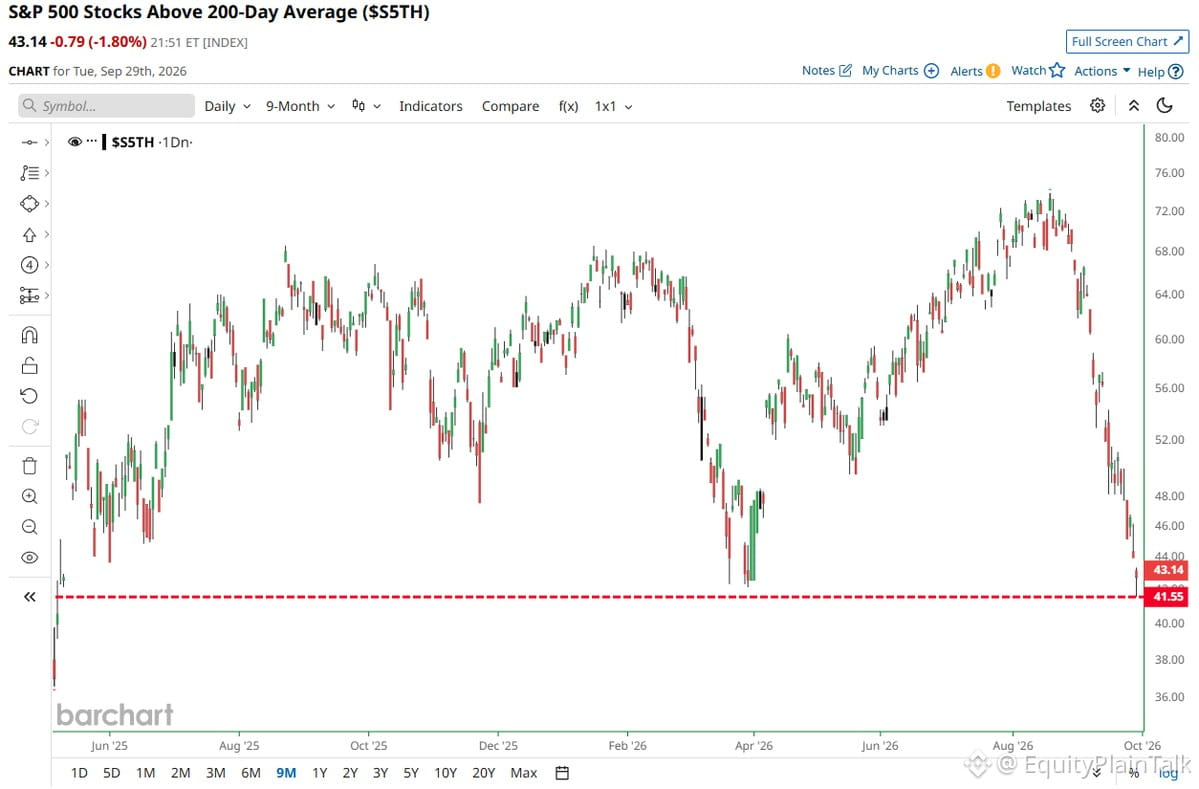
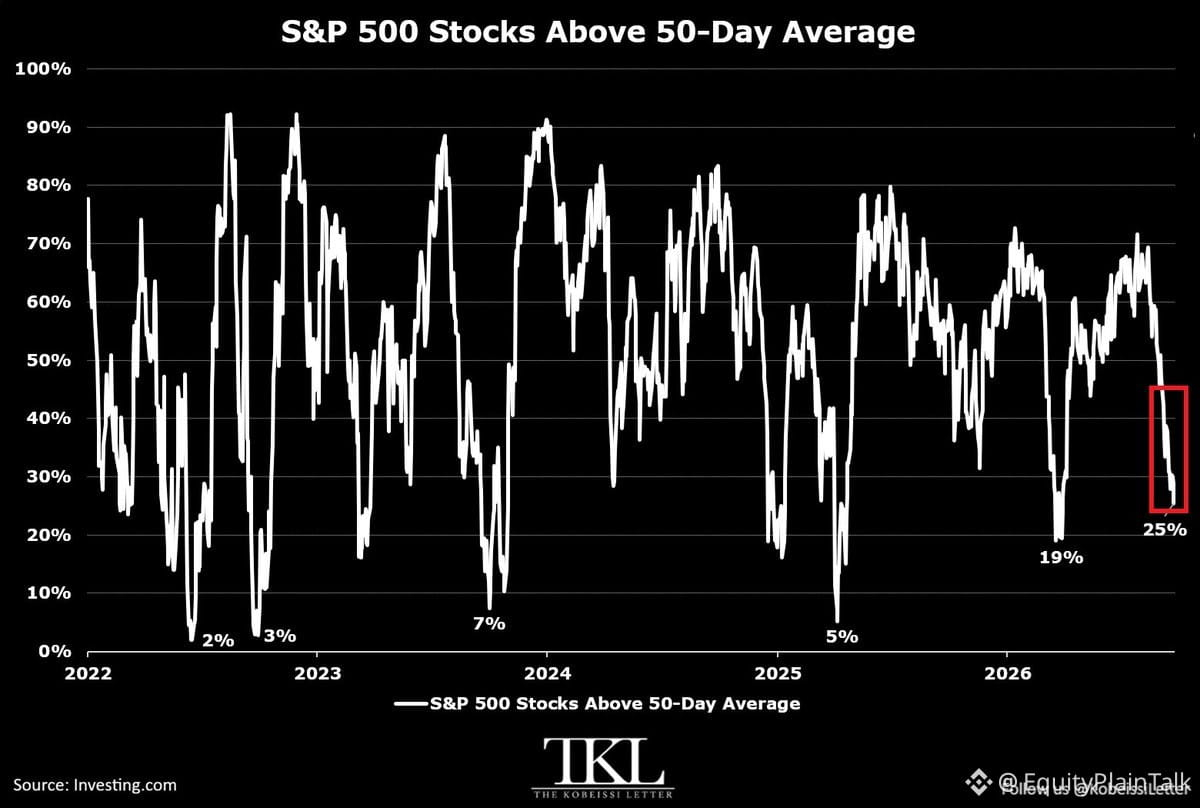
Market breadth is flashing warning signs.
Only 25% of $SPX stocks now trade above their 50-day moving average — lowest since early April. That's a sharp drop from 70% in mid-August.
Meanwhile, just 47% sit above their 200-day MA, also matching April lows.
New 52-week lows have outnumbered new highs on the NYSE for 10 straight days — and in 14 of the last 15 sessions.
This isn't a healthy pullback. It's a broad erosion beneath the surface. When fewer stocks participate in a rally, the market becomes fragile. Right now, we're seeing the opposite of a rally — we're seeing distribution.
If you're holding positions, pay attention to what's working and what's not. Breadth matters more than headlines.
Market breadth is flashing warning signs.
Only 25% of $SPX stocks now trade above their 50-day moving average — lowest since early April. That's a sharp drop from 70% in mid-August.
Meanwhile, just 47% sit above their 200-day MA, also matching April lows.
New 52-week lows have outnumbered new highs on the NYSE for 10 straight days — and in 14 of the last 15 sessions.
This isn't a healthy pullback. It's a broad erosion beneath the surface. When fewer stocks participate in a rally, the market becomes fragile. Right now, we're seeing the opposite of a rally — we're seeing distribution.
If you're holding positions, pay attention to what's working and what's not. Breadth matters more than headlines.
Only 25% of $SPX stocks now trade above their 50-day moving average — lowest since early April. That's a sharp drop from 70% in mid-August.
Meanwhile, just 47% sit above their 200-day MA, also matching April lows.
New 52-week lows have outnumbered new highs on the NYSE for 10 straight days — and in 14 of the last 15 sessions.
This isn't a healthy pullback. It's a broad erosion beneath the surface. When fewer stocks participate in a rally, the market becomes fragile. Right now, we're seeing the opposite of a rally — we're seeing distribution.
If you're holding positions, pay attention to what's working and what's not. Breadth matters more than headlines.
24
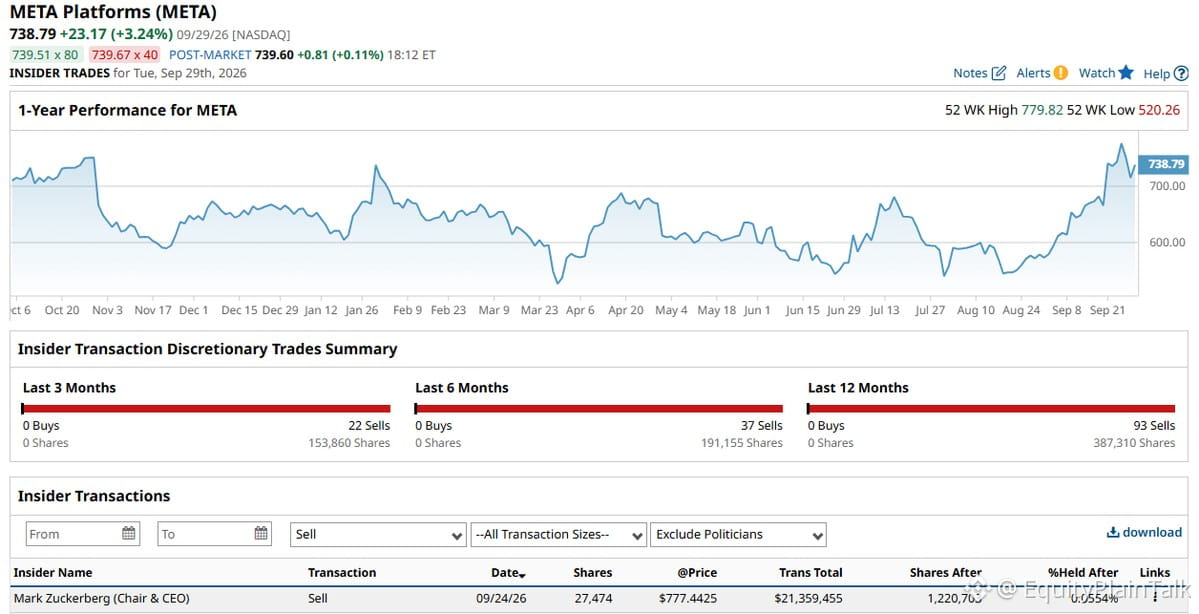
Zuckerberg just dumped $21.4M of $META shares—first insider sale in over a year.
Timing's interesting. Stock's been on a tear, up ~60% over the past year. Could be routine diversification, tax planning, or just taking chips off after a monster run.
Insider sales aren't always bearish signals, especially for CEOs with concentrated positions. But when someone who hasn't sold in 12+ months suddenly exits $21M? Worth noting.
Watch if this becomes a pattern or stays a one-off. One sale doesn't make a trend, but it's a data point.
Zuckerberg just dumped $21.4M of $META shares—first insider sale in over a year.
Timing's interesting. Stock's been on a tear, up ~60% over the past year. Could be routine diversification, tax planning, or just taking chips off after a monster run.
Insider sales aren't always bearish signals, especially for CEOs with concentrated positions. But when someone who hasn't sold in 12+ months suddenly exits $21M? Worth noting.
Watch if this becomes a pattern or stays a one-off. One sale doesn't make a trend, but it's a data point.
Timing's interesting. Stock's been on a tear, up ~60% over the past year. Could be routine diversification, tax planning, or just taking chips off after a monster run.
Insider sales aren't always bearish signals, especially for CEOs with concentrated positions. But when someone who hasn't sold in 12+ months suddenly exits $21M? Worth noting.
Watch if this becomes a pattern or stays a one-off. One sale doesn't make a trend, but it's a data point.
1
329
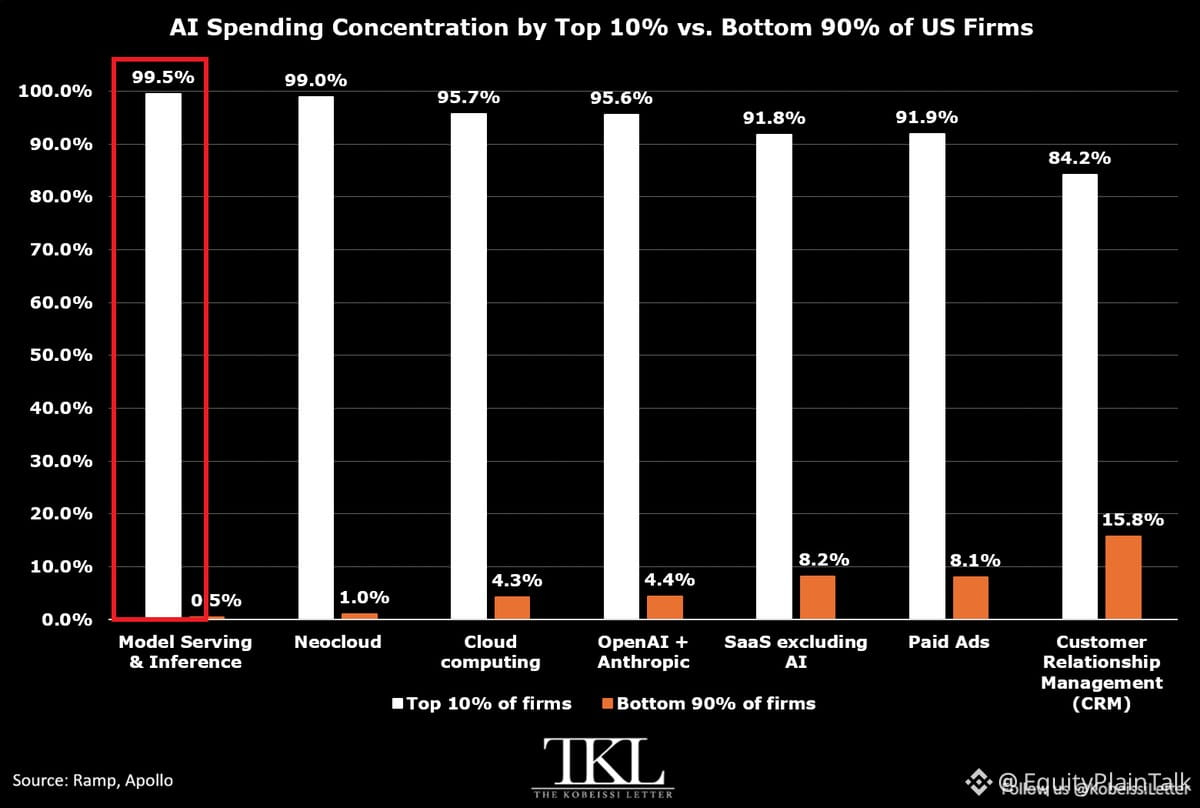
AI spending isn't spreading out—it's piling up at the top.
10% of US software companies now pay for GPU infrastructure, up from under 4% two years ago. Most of that jump? Model inference—the computing power to actually run AI and handle requests.
But here's the thing: the top 10% of spenders control 99.5% of model-serving dollars and 99% of specialized AI cloud spend. They also own 95%+ of OpenAI, Anthropic, and general cloud budgets.
More companies are dipping their toes in AI. But the real money? Still locked in with the heavyweights.
This matters for cloud providers, chip makers, and anyone betting on broad AI monetization. Adoption is widening, but revenue concentration hasn't budged.
AI spending isn't spreading out—it's piling up at the top.
10% of US software companies now pay for GPU infrastructure, up from under 4% two years ago. Most of that jump? Model inference—the computing power to actually run AI and handle requests.
But here's the thing: the top 10% of spenders control 99.5% of model-serving dollars and 99% of specialized AI cloud spend. They also own 95%+ of OpenAI, Anthropic, and general cloud budgets.
More companies are dipping their toes in AI. But the real money? Still locked in with the heavyweights.
This matters for cloud providers, chip makers, and anyone betting on broad AI monetization. Adoption is widening, but revenue concentration hasn't budged.
10% of US software companies now pay for GPU infrastructure, up from under 4% two years ago. Most of that jump? Model inference—the computing power to actually run AI and handle requests.
But here's the thing: the top 10% of spenders control 99.5% of model-serving dollars and 99% of specialized AI cloud spend. They also own 95%+ of OpenAI, Anthropic, and general cloud budgets.
More companies are dipping their toes in AI. But the real money? Still locked in with the heavyweights.
This matters for cloud providers, chip makers, and anyone betting on broad AI monetization. Adoption is widening, but revenue concentration hasn't budged.
203
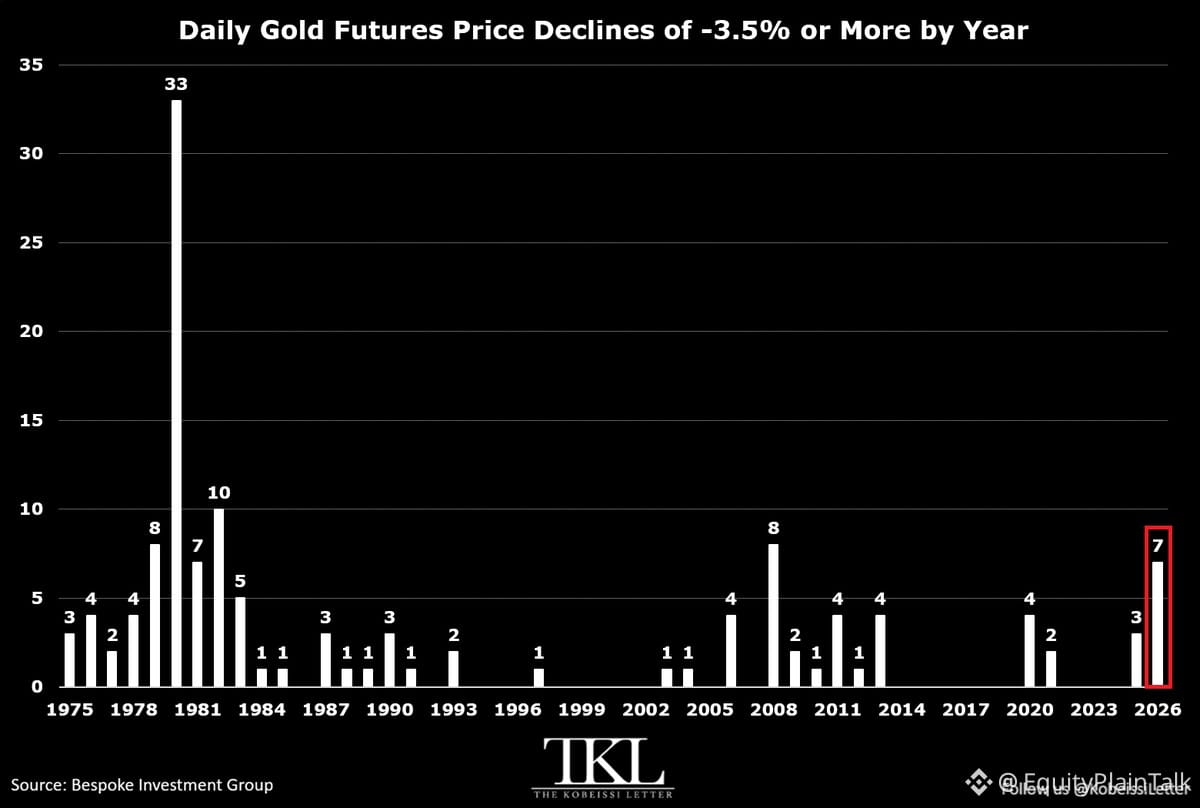
Gold is having one of its wildest years in decades.
Seven trading sessions this year have seen drops of 3.5% or more—the most since 2008. We're already more than double last year's count with three months still to go.
For context, 1980 holds the record at 33 such sessions. If the current pace holds, 2026 could be the most volatile year for gold since 1982.
Despite being a traditional safe haven, gold is down 5.4% year-to-date and on track for its first annual decline since 2022. This follows its best year since 1979.
What's driving this? The bond market. Rising yields and shifting rate expectations are creating unprecedented volatility in what's supposed to be a stability asset.
When bonds move, gold feels it.
Gold is having one of its wildest years in decades.
Seven trading sessions this year have seen drops of 3.5% or more—the most since 2008. We're already more than double last year's count with three months still to go.
For context, 1980 holds the record at 33 such sessions. If the current pace holds, 2026 could be the most volatile year for gold since 1982.
Despite being a traditional safe haven, gold is down 5.4% year-to-date and on track for its first annual decline since 2022. This follows its best year since 1979.
What's driving this? The bond market. Rising yields and shifting rate expectations are creating unprecedented volatility in what's supposed to be a stability asset.
When bonds move, gold feels it.
Seven trading sessions this year have seen drops of 3.5% or more—the most since 2008. We're already more than double last year's count with three months still to go.
For context, 1980 holds the record at 33 such sessions. If the current pace holds, 2026 could be the most volatile year for gold since 1982.
Despite being a traditional safe haven, gold is down 5.4% year-to-date and on track for its first annual decline since 2022. This follows its best year since 1979.
What's driving this? The bond market. Rising yields and shifting rate expectations are creating unprecedented volatility in what's supposed to be a stability asset.
When bonds move, gold feels it.
189
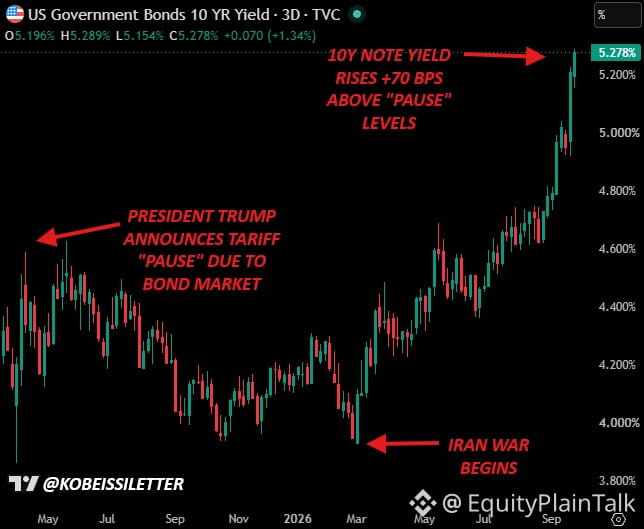
Trump paused tariffs in April when the 10-year yield hit 4.60%. He even admitted he was "watching" the bond market—basically said the quiet part out loud.
Now? The 10-year is trading 70 basis points higher than that April peak. That's 5.30%+.
So what changed? Either the Treasury has thrown in the towel on managing yields, or the bond market stopped caring about tariff headlines altogether.
Either way, this is a very different setup than April. Rates are screaming higher despite no new trade war escalation. That's not policy risk—that's inflation expectations, deficit concerns, or both.
Bond vigilantes might actually be back.
Trump paused tariffs in April when the 10-year yield hit 4.60%. He even admitted he was "watching" the bond market—basically said the quiet part out loud.
Now? The 10-year is trading 70 basis points higher than that April peak. That's 5.30%+.
So what changed? Either the Treasury has thrown in the towel on managing yields, or the bond market stopped caring about tariff headlines altogether.
Either way, this is a very different setup than April. Rates are screaming higher despite no new trade war escalation. That's not policy risk—that's inflation expectations, deficit concerns, or both.
Bond vigilantes might actually be back.
Now? The 10-year is trading 70 basis points higher than that April peak. That's 5.30%+.
So what changed? Either the Treasury has thrown in the towel on managing yields, or the bond market stopped caring about tariff headlines altogether.
Either way, this is a very different setup than April. Rates are screaming higher despite no new trade war escalation. That's not policy risk—that's inflation expectations, deficit concerns, or both.
Bond vigilantes might actually be back.
IEFETF+0.14%
78
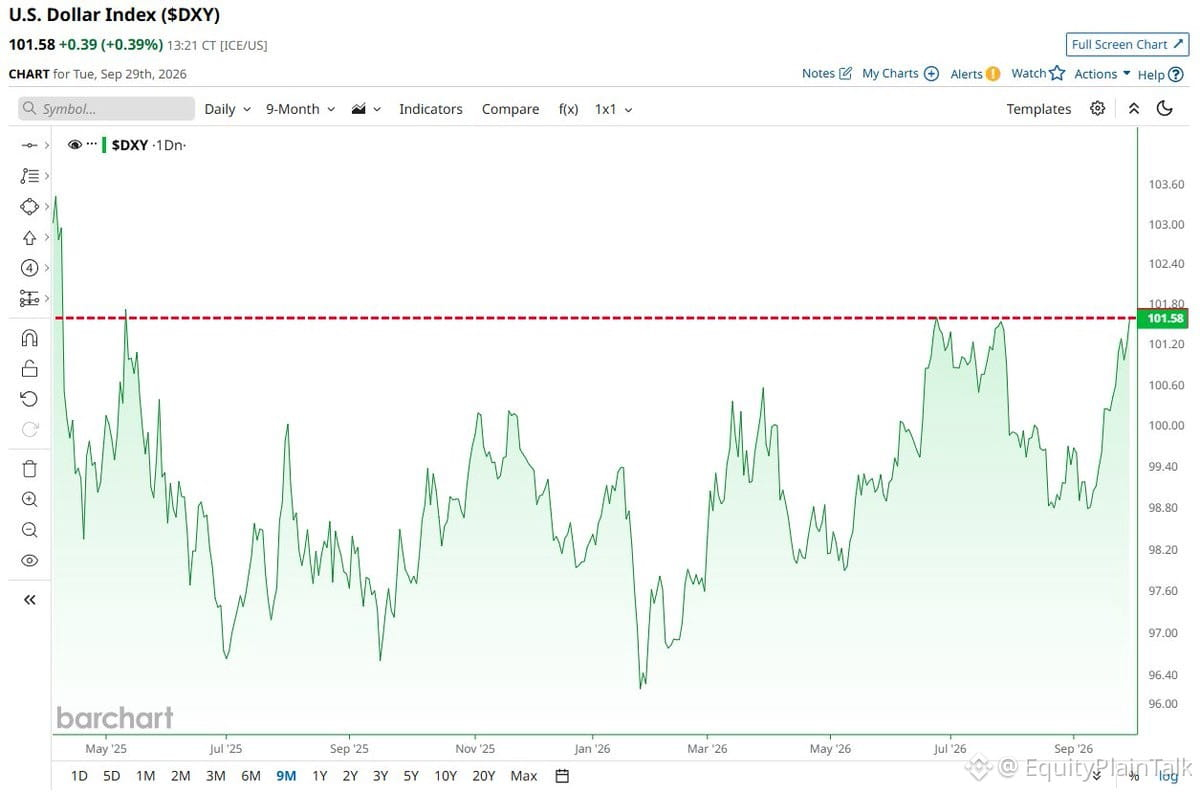
The dollar is quietly creeping toward its strongest close since April. This matters for everything—import costs, earnings for multinationals, emerging market debt, commodity prices.
A stronger $DXY usually pressures stocks with heavy overseas revenue. Watch tech and industrials. It also makes gold and oil cheaper in dollar terms, but harder for foreign buyers.
If the dollar keeps climbing, expect more talk about Fed policy, rate differentials, and whether this strength is sustainable or just a short-term flight to safety.
Strong dollar = headwind for S&P earnings. Simple as that.
The dollar is quietly creeping toward its strongest close since April. This matters for everything—import costs, earnings for multinationals, emerging market debt, commodity prices.
A stronger $DXY usually pressures stocks with heavy overseas revenue. Watch tech and industrials. It also makes gold and oil cheaper in dollar terms, but harder for foreign buyers.
If the dollar keeps climbing, expect more talk about Fed policy, rate differentials, and whether this strength is sustainable or just a short-term flight to safety.
Strong dollar = headwind for S&P earnings. Simple as that.
A stronger $DXY usually pressures stocks with heavy overseas revenue. Watch tech and industrials. It also makes gold and oil cheaper in dollar terms, but harder for foreign buyers.
If the dollar keeps climbing, expect more talk about Fed policy, rate differentials, and whether this strength is sustainable or just a short-term flight to safety.
Strong dollar = headwind for S&P earnings. Simple as that.
12
U.S. Strategic Petroleum Reserve just dropped another 800k barrels last week—now sitting at 283.8 million, lowest since 1982.
That's 27 weeks straight of declines. We're down over 132 million barrels from the peak.
Now the Trump admin is looking to sell up to 40 million more barrels from the SPR. If that goes through, we could fall below 250 million.
Context: America's emergency oil cushion is thinner than it's been in four decades. Whether that's strategic repositioning or a real vulnerability depends on your view of energy security vs. budget priorities.
Either way, the math is simple—reserves keep shrinking, and we're playing with historically low levels.
U.S. Strategic Petroleum Reserve just dropped another 800k barrels last week—now sitting at 283.8 million, lowest since 1982.
That's 27 weeks straight of declines. We're down over 132 million barrels from the peak.
Now the Trump admin is looking to sell up to 40 million more barrels from the SPR. If that goes through, we could fall below 250 million.
Context: America's emergency oil cushion is thinner than it's been in four decades. Whether that's strategic repositioning or a real vulnerability depends on your view of energy security vs. budget priorities.
Either way, the math is simple—reserves keep shrinking, and we're playing with historically low levels.
That's 27 weeks straight of declines. We're down over 132 million barrels from the peak.
Now the Trump admin is looking to sell up to 40 million more barrels from the SPR. If that goes through, we could fall below 250 million.
Context: America's emergency oil cushion is thinner than it's been in four decades. Whether that's strategic repositioning or a real vulnerability depends on your view of energy security vs. budget priorities.
Either way, the math is simple—reserves keep shrinking, and we're playing with historically low levels.
452
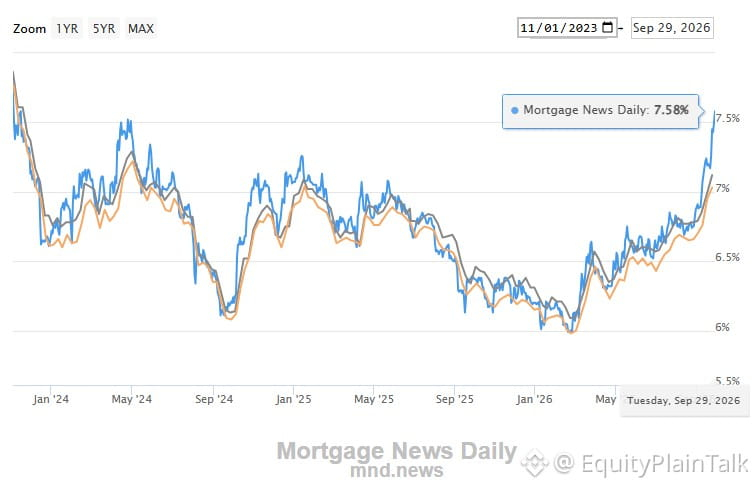
Mortgage rates just hit 7.58% for a 30-year fixed—highest we've seen since November 2023.
This matters because housing affordability was already stretched thin. Higher rates mean:
• Monthly payments jump significantly
• Fewer qualified buyers in the market
• Existing homeowners locked into lower rates won't sell
• Housing inventory stays tight
The ripple effects touch everything from home builders to consumer spending. When people can't afford homes or feel house-poor, they cut back elsewhere.
Keep an eye on homebuilder stocks and consumer discretionary. This rate environment is reshaping who can participate in the housing market.
Mortgage rates just hit 7.58% for a 30-year fixed—highest we've seen since November 2023.
This matters because housing affordability was already stretched thin. Higher rates mean:
• Monthly payments jump significantly
• Fewer qualified buyers in the market
• Existing homeowners locked into lower rates won't sell
• Housing inventory stays tight
The ripple effects touch everything from home builders to consumer spending. When people can't afford homes or feel house-poor, they cut back elsewhere.
Keep an eye on homebuilder stocks and consumer discretionary. This rate environment is reshaping who can participate in the housing market.
This matters because housing affordability was already stretched thin. Higher rates mean:
• Monthly payments jump significantly
• Fewer qualified buyers in the market
• Existing homeowners locked into lower rates won't sell
• Housing inventory stays tight
The ripple effects touch everything from home builders to consumer spending. When people can't afford homes or feel house-poor, they cut back elsewhere.
Keep an eye on homebuilder stocks and consumer discretionary. This rate environment is reshaping who can participate in the housing market.
46
The bond market just flipped the script in a big way.
9 months ago, traders expected 100 bps of rate CUTS by June 2027. Now? They're pricing in 4 more rate HIKES — a total swing of 225 basis points.
The 10-year Treasury yield has jumped nearly 70 bps in just 30 days, hitting levels not seen since June 2002. And here's the kicker: zero comment from the Trump Administration. The Treasury tried to step in, failed, and now sits silent while long-term yields explode.
The bond market is acting like we're back in a 7%+ inflation environment where the Fed might start hiking 50 bps at a time.
This pace isn't sustainable. Something has to give — either inflation expectations cool off, policy changes, or we're in for a rougher ride than most expect.
The bond market just flipped the script in a big way.
9 months ago, traders expected 100 bps of rate CUTS by June 2027. Now? They're pricing in 4 more rate HIKES — a total swing of 225 basis points.
The 10-year Treasury yield has jumped nearly 70 bps in just 30 days, hitting levels not seen since June 2002. And here's the kicker: zero comment from the Trump Administration. The Treasury tried to step in, failed, and now sits silent while long-term yields explode.
The bond market is acting like we're back in a 7%+ inflation environment where the Fed might start hiking 50 bps at a time.
This pace isn't sustainable. Something has to give — either inflation expectations cool off, policy changes, or we're in for a rougher ride than most expect.
9 months ago, traders expected 100 bps of rate CUTS by June 2027. Now? They're pricing in 4 more rate HIKES — a total swing of 225 basis points.
The 10-year Treasury yield has jumped nearly 70 bps in just 30 days, hitting levels not seen since June 2002. And here's the kicker: zero comment from the Trump Administration. The Treasury tried to step in, failed, and now sits silent while long-term yields explode.
The bond market is acting like we're back in a 7%+ inflation environment where the Fed might start hiking 50 bps at a time.
This pace isn't sustainable. Something has to give — either inflation expectations cool off, policy changes, or we're in for a rougher ride than most expect.
TLTETF+0.69%
IEFETF+0.14%
89
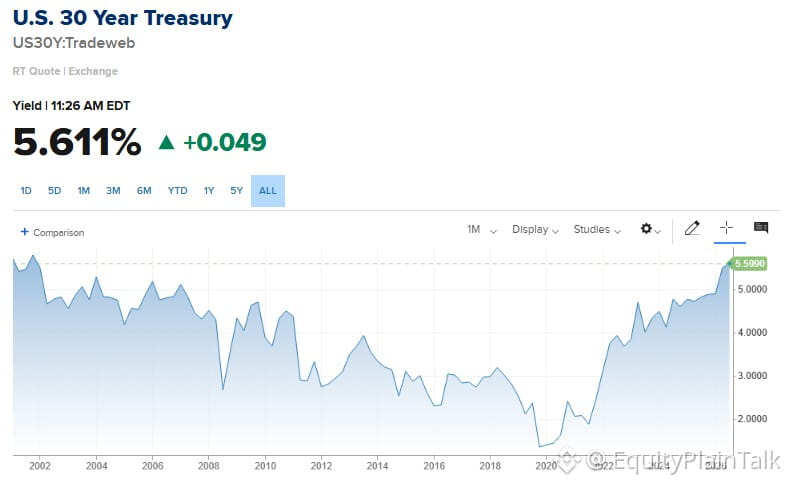
30-year Treasury yield just hit 5.61% — highest since 2002.
That's over two decades. Think about what this means:
• Mortgage rates staying elevated
• Refinancing window shut for most homeowners
• Long-duration bonds getting crushed
• Growth stocks facing persistent headwinds
When borrowing costs stay this high for this long, something eventually breaks. The question isn't if, it's where.
Keep an eye on regional banks, commercial real estate, and any company rolling over debt in the next 12 months.
30-year Treasury yield just hit 5.61% — highest since 2002.
That's over two decades. Think about what this means:
• Mortgage rates staying elevated
• Refinancing window shut for most homeowners
• Long-duration bonds getting crushed
• Growth stocks facing persistent headwinds
When borrowing costs stay this high for this long, something eventually breaks. The question isn't if, it's where.
Keep an eye on regional banks, commercial real estate, and any company rolling over debt in the next 12 months.
That's over two decades. Think about what this means:
• Mortgage rates staying elevated
• Refinancing window shut for most homeowners
• Long-duration bonds getting crushed
• Growth stocks facing persistent headwinds
When borrowing costs stay this high for this long, something eventually breaks. The question isn't if, it's where.
Keep an eye on regional banks, commercial real estate, and any company rolling over debt in the next 12 months.
TLTETF+0.69%
40
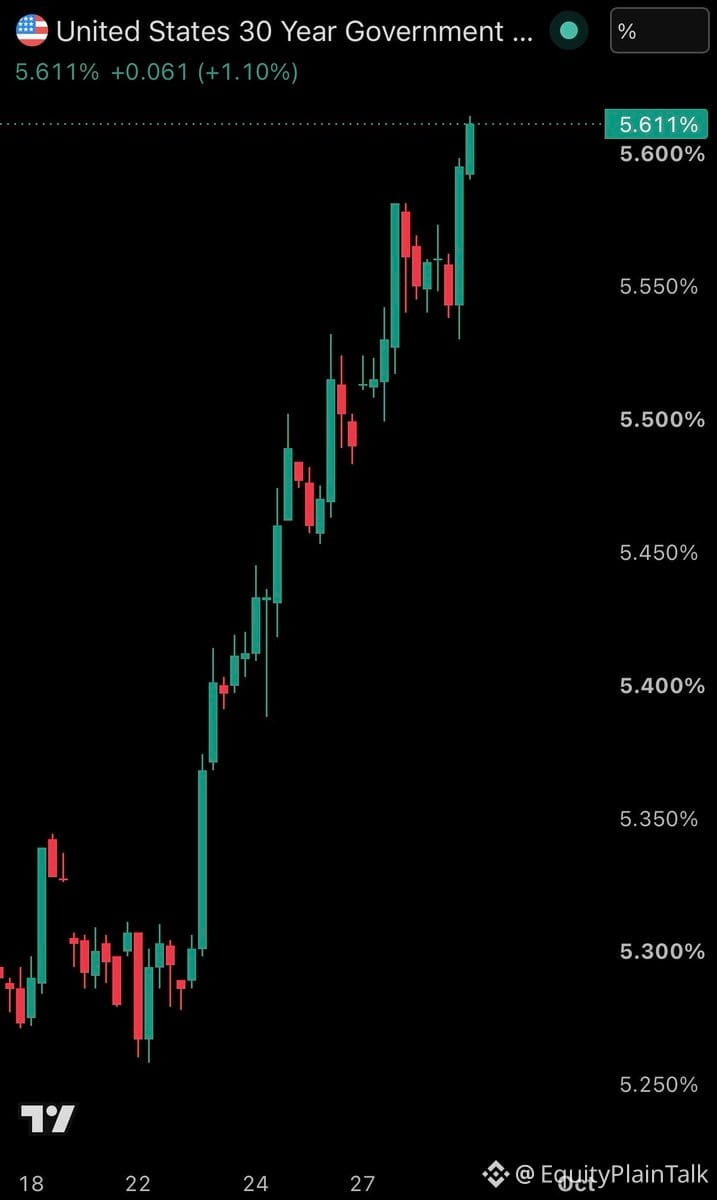
30-year Treasury yield just crossed 5.60% — first time since June 2002.
That's a 36 basis point spike in a month.
Mortgage rates are climbing fast. We're looking at 8% mortgages hitting next week if this holds.
Borrowing costs are getting real heavy, real quick. Housing market's about to feel it.
30-year Treasury yield just crossed 5.60% — first time since June 2002.
That's a 36 basis point spike in a month.
Mortgage rates are climbing fast. We're looking at 8% mortgages hitting next week if this holds.
Borrowing costs are getting real heavy, real quick. Housing market's about to feel it.
That's a 36 basis point spike in a month.
Mortgage rates are climbing fast. We're looking at 8% mortgages hitting next week if this holds.
Borrowing costs are getting real heavy, real quick. Housing market's about to feel it.
TLTETF+0.69%
101
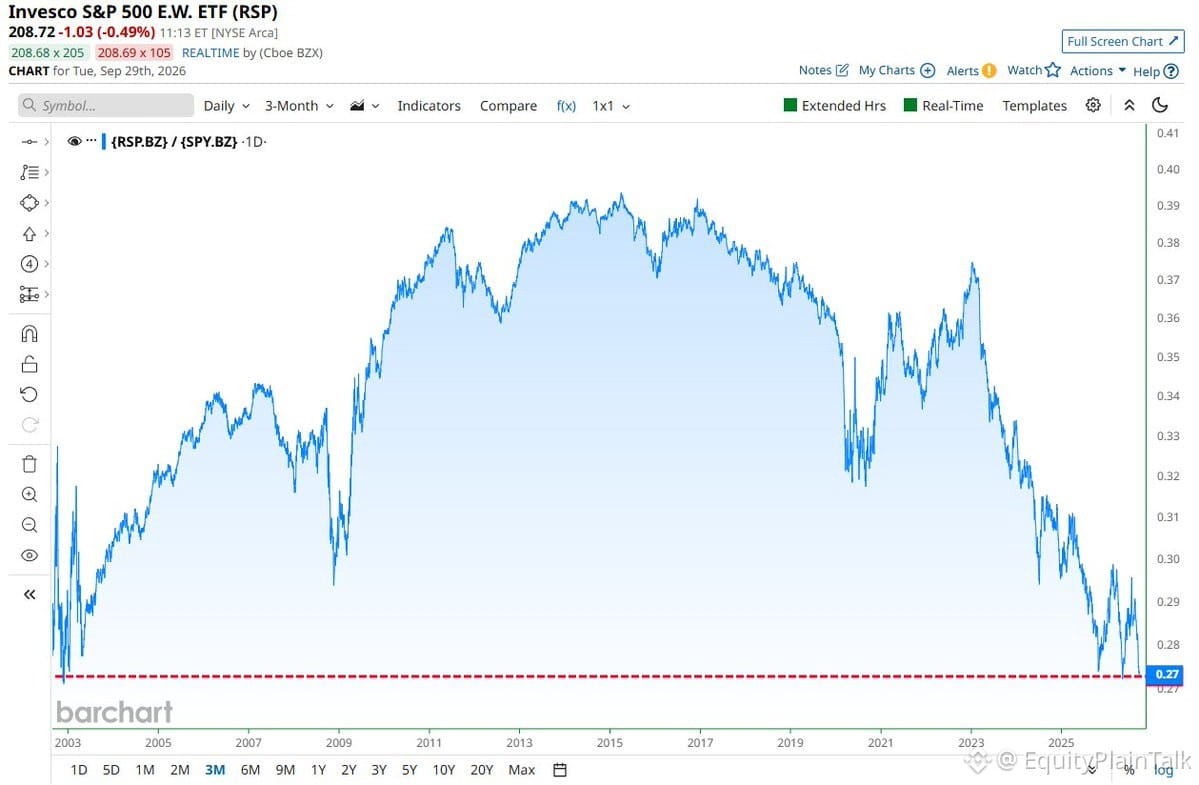
The equal-weight $SPY is now lagging the market-cap weighted version by the widest gap since 2002.
What this tells us: concentration risk is real. A handful of mega-cap names are doing all the heavy lifting while the average stock is getting left behind.
This kind of divergence historically doesn't last forever. Either the leaders pull back, or the laggards catch up. Worth watching how this plays out—especially if we see any rotation into broader market participation.
The equal-weight $SPY is now lagging the market-cap weighted version by the widest gap since 2002.
What this tells us: concentration risk is real. A handful of mega-cap names are doing all the heavy lifting while the average stock is getting left behind.
This kind of divergence historically doesn't last forever. Either the leaders pull back, or the laggards catch up. Worth watching how this plays out—especially if we see any rotation into broader market participation.
What this tells us: concentration risk is real. A handful of mega-cap names are doing all the heavy lifting while the average stock is getting left behind.
This kind of divergence historically doesn't last forever. Either the leaders pull back, or the laggards catch up. Worth watching how this plays out—especially if we see any rotation into broader market participation.
44
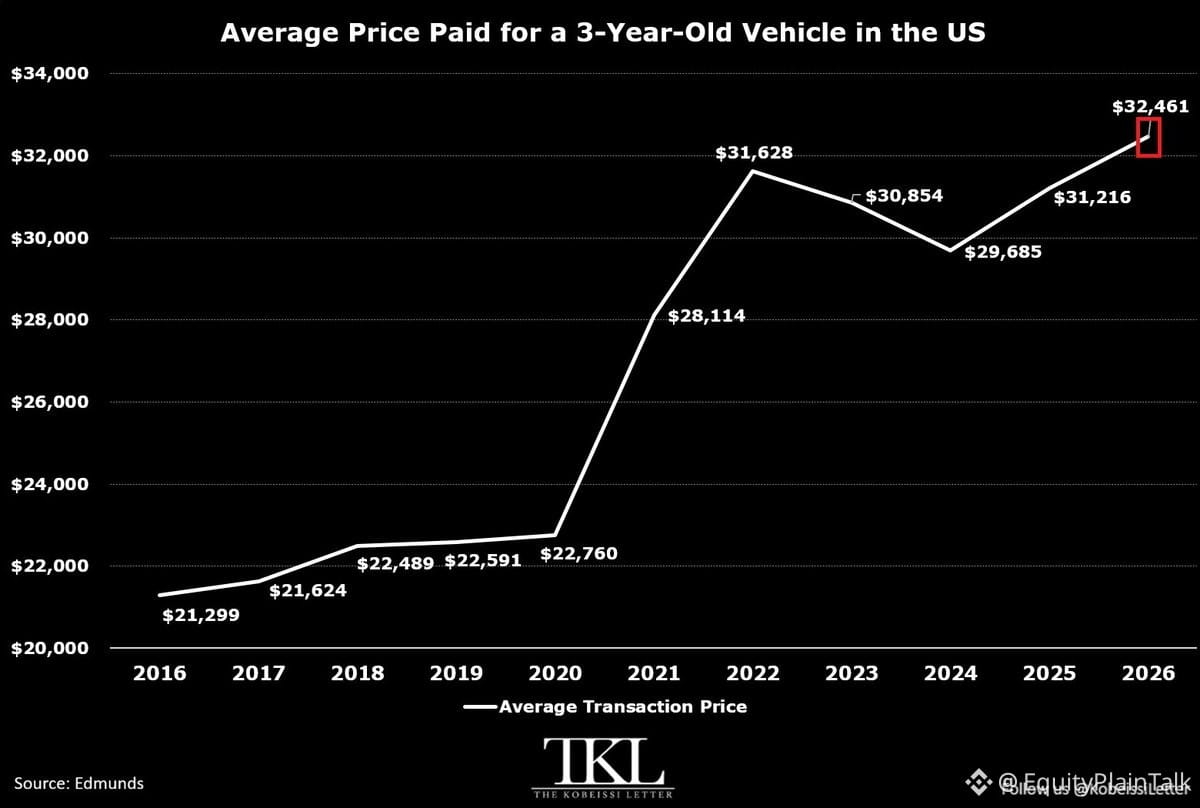
The used car market just hit a new breaking point.
A 3-year-old vehicle now costs $32,461 on average—a fresh all-time high, topping the 2022 peak of $31,628.
Since 2020, prices are up $9,701 (+43%). That's not inflation. That's a structural shift in what middle-class Americans can afford.
The real damage is at the bottom. A $10k–$15k budget used to get you a 5-year-old car with 58,000 miles in 2019. Today? You're looking at a 9-year-old vehicle with 98,000 miles.
Used cars were supposed to be the accessible option. Now even that's slipping out of reach for millions of households.
This isn't just about cars. It's about mobility, job access, and basic economic participation. When the entry point keeps rising, fewer people can play the game.
The used car market just hit a new breaking point.
A 3-year-old vehicle now costs $32,461 on average—a fresh all-time high, topping the 2022 peak of $31,628.
Since 2020, prices are up $9,701 (+43%). That's not inflation. That's a structural shift in what middle-class Americans can afford.
The real damage is at the bottom. A $10k–$15k budget used to get you a 5-year-old car with 58,000 miles in 2019. Today? You're looking at a 9-year-old vehicle with 98,000 miles.
Used cars were supposed to be the accessible option. Now even that's slipping out of reach for millions of households.
This isn't just about cars. It's about mobility, job access, and basic economic participation. When the entry point keeps rising, fewer people can play the game.
A 3-year-old vehicle now costs $32,461 on average—a fresh all-time high, topping the 2022 peak of $31,628.
Since 2020, prices are up $9,701 (+43%). That's not inflation. That's a structural shift in what middle-class Americans can afford.
The real damage is at the bottom. A $10k–$15k budget used to get you a 5-year-old car with 58,000 miles in 2019. Today? You're looking at a 9-year-old vehicle with 98,000 miles.
Used cars were supposed to be the accessible option. Now even that's slipping out of reach for millions of households.
This isn't just about cars. It's about mobility, job access, and basic economic participation. When the entry point keeps rising, fewer people can play the game.
1
1.2k
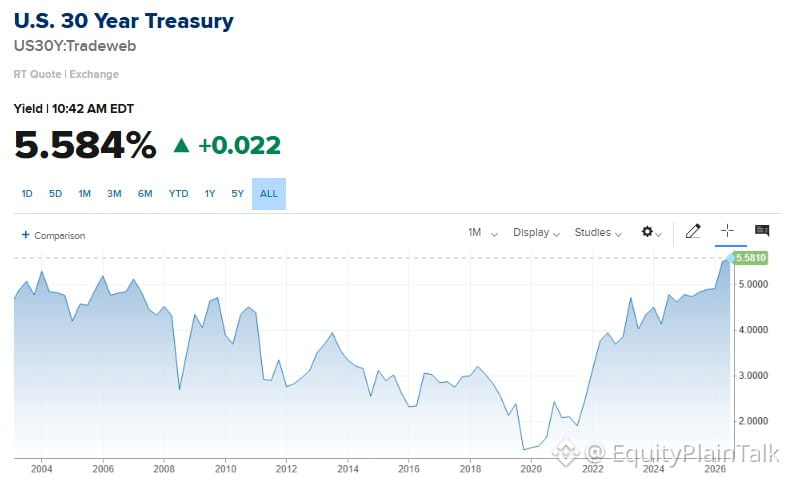
30-year Treasury yield just hit its highest level since 2002. That's over 22 years.
Bond market is screaming something. Either inflation expectations are sticky, or investors are demanding more premium to hold long-dated debt, or both.
This matters for stocks. Higher long-term rates = higher discount rates = lower valuations, especially for growth names that live far out on the cash flow curve.
Real estate, utilities, high-dividend plays—all feel the squeeze when the 30-year moves like this.
Keep an eye on how equities react if this holds. We've seen rallies pause when the long end gets uncomfortable.
30-year Treasury yield just hit its highest level since 2002. That's over 22 years.
Bond market is screaming something. Either inflation expectations are sticky, or investors are demanding more premium to hold long-dated debt, or both.
This matters for stocks. Higher long-term rates = higher discount rates = lower valuations, especially for growth names that live far out on the cash flow curve.
Real estate, utilities, high-dividend plays—all feel the squeeze when the 30-year moves like this.
Keep an eye on how equities react if this holds. We've seen rallies pause when the long end gets uncomfortable.
Bond market is screaming something. Either inflation expectations are sticky, or investors are demanding more premium to hold long-dated debt, or both.
This matters for stocks. Higher long-term rates = higher discount rates = lower valuations, especially for growth names that live far out on the cash flow curve.
Real estate, utilities, high-dividend plays—all feel the squeeze when the 30-year moves like this.
Keep an eye on how equities react if this holds. We've seen rallies pause when the long end gets uncomfortable.
TLTETF+0.69%
66
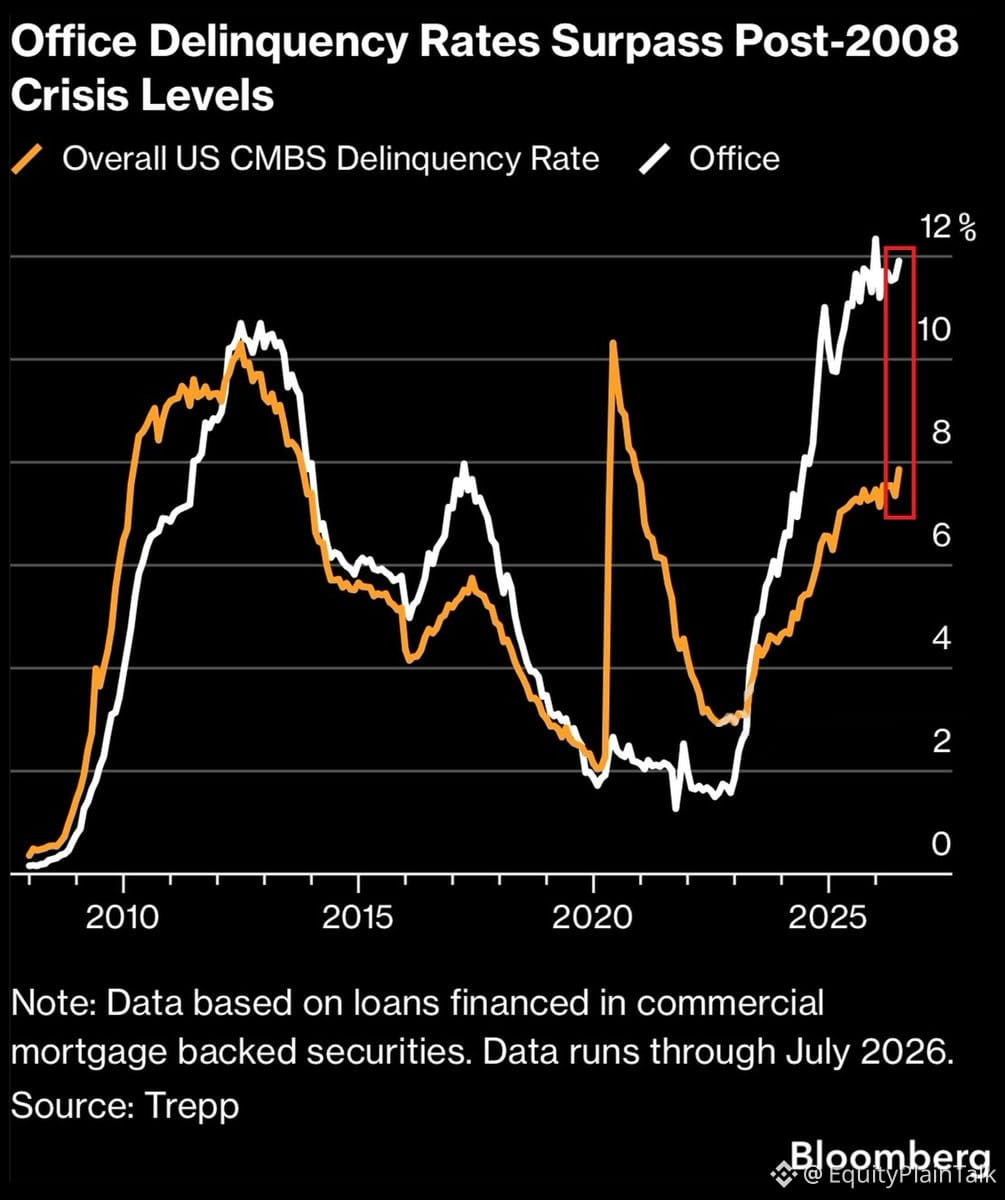
Office CMBS delinquencies hit 12.0% in August—just shy of the all-time high of 12.3% from January. That's 6x higher than early 2023 and worse than the post-2008 peak of 10.8%.
Overall US CMBS delinquencies doubled since 2022 to 7.9%—highest in 13 years outside the pandemic.
Commercial real estate stress isn't easing. It's accelerating. Office buildings especially are getting hammered as remote work reshapes demand and higher rates squeeze refinancing.
This isn't just a headline. It's a structural shift playing out in slow motion across balance sheets, regional banks, and property valuations.
Office CMBS delinquencies hit 12.0% in August—just shy of the all-time high of 12.3% from January. That's 6x higher than early 2023 and worse than the post-2008 peak of 10.8%.
Overall US CMBS delinquencies doubled since 2022 to 7.9%—highest in 13 years outside the pandemic.
Commercial real estate stress isn't easing. It's accelerating. Office buildings especially are getting hammered as remote work reshapes demand and higher rates squeeze refinancing.
This isn't just a headline. It's a structural shift playing out in slow motion across balance sheets, regional banks, and property valuations.
Overall US CMBS delinquencies doubled since 2022 to 7.9%—highest in 13 years outside the pandemic.
Commercial real estate stress isn't easing. It's accelerating. Office buildings especially are getting hammered as remote work reshapes demand and higher rates squeeze refinancing.
This isn't just a headline. It's a structural shift playing out in slow motion across balance sheets, regional banks, and property valuations.
61
Foreign money is flooding into US stocks at a historic pace.
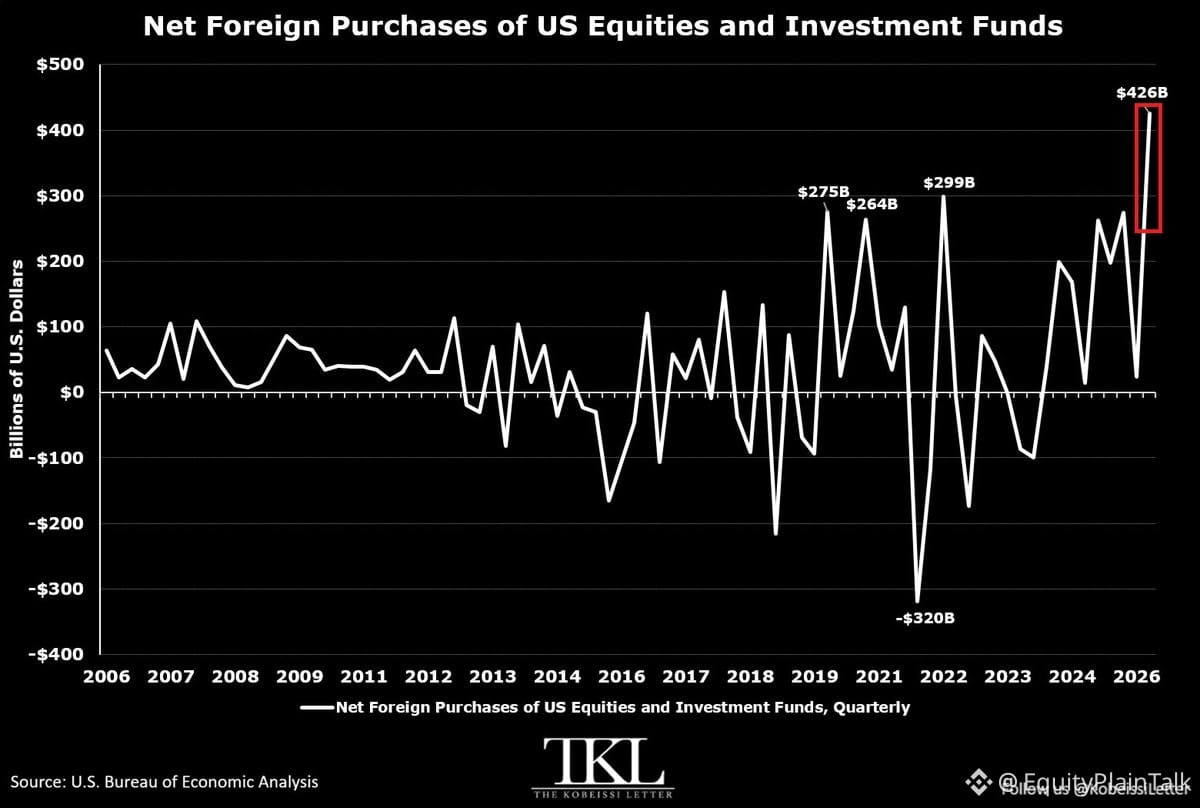
Q2 2026: +$426B net bought by foreign investors — the largest quarterly purchase ever recorded. Previous record was +$299B back in Q2 2022.
That's 9 straight quarters of net buying, totaling +$1.6T.
Over the trailing 12 months through July: +$942B into US equities and investment funds — the biggest rolling annual total since Treasury data began in 1985.
Meanwhile, foreign appetite for US debt cooled a bit. They bought +$188B in bonds in Q2, down from +$314B in Q1.
The pattern is clear: global capital wants exposure to American equities. Whether it's AI hype, relative growth strength, or dollar stability, foreign investors are voting with their wallets.
This kind of sustained inflow provides a structural bid under the market. It also raises questions about what happens if sentiment shifts or if other markets become more attractive. For now, though, the US remains the magnet.
Foreign money is flooding into US stocks at a historic pace.
Q2 2026: +$426B net bought by foreign investors — the largest quarterly purchase ever recorded. Previous record was +$299B back in Q2 2022.
That's 9 straight quarters of net buying, totaling +$1.6T.
Over the trailing 12 months through July: +$942B into US equities and investment funds — the biggest rolling annual total since Treasury data began in 1985.
Meanwhile, foreign appetite for US debt cooled a bit. They bought +$188B in bonds in Q2, down from +$314B in Q1.
The pattern is clear: global capital wants exposure to American equities. Whether it's AI hype, relative growth strength, or dollar stability, foreign investors are voting with their wallets.
This kind of sustained inflow provides a structural bid under the market. It also raises questions about what happens if sentiment shifts or if other markets become more attractive. For now, though, the US remains the magnet.
Q2 2026: +$426B net bought by foreign investors — the largest quarterly purchase ever recorded. Previous record was +$299B back in Q2 2022.
That's 9 straight quarters of net buying, totaling +$1.6T.
Over the trailing 12 months through July: +$942B into US equities and investment funds — the biggest rolling annual total since Treasury data began in 1985.
Meanwhile, foreign appetite for US debt cooled a bit. They bought +$188B in bonds in Q2, down from +$314B in Q1.
The pattern is clear: global capital wants exposure to American equities. Whether it's AI hype, relative growth strength, or dollar stability, foreign investors are voting with their wallets.
This kind of sustained inflow provides a structural bid under the market. It also raises questions about what happens if sentiment shifts or if other markets become more attractive. For now, though, the US remains the magnet.
60
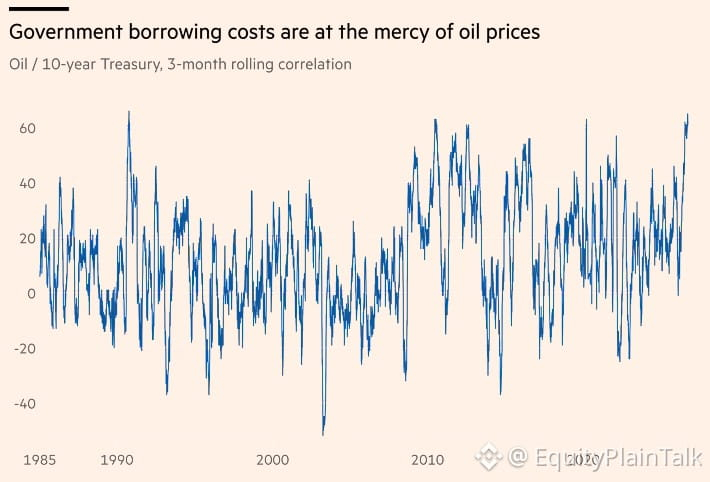
Oil and Treasury yields moving in lockstep like we haven't seen since 1988.
What's driving this? Inflation expectations. When oil spikes, markets price in hotter inflation → Fed stays tighter → yields climb. When oil drops, the opposite.
This correlation matters because it shows markets are hyper-focused on one thing: whether inflation is truly under control or just taking a breather.
Watch crude. It's basically telling you where rates are headed next.
Oil and Treasury yields moving in lockstep like we haven't seen since 1988.
What's driving this? Inflation expectations. When oil spikes, markets price in hotter inflation → Fed stays tighter → yields climb. When oil drops, the opposite.
This correlation matters because it shows markets are hyper-focused on one thing: whether inflation is truly under control or just taking a breather.
Watch crude. It's basically telling you where rates are headed next.
What's driving this? Inflation expectations. When oil spikes, markets price in hotter inflation → Fed stays tighter → yields climb. When oil drops, the opposite.
This correlation matters because it shows markets are hyper-focused on one thing: whether inflation is truly under control or just taking a breather.
Watch crude. It's basically telling you where rates are headed next.
242
Partly True
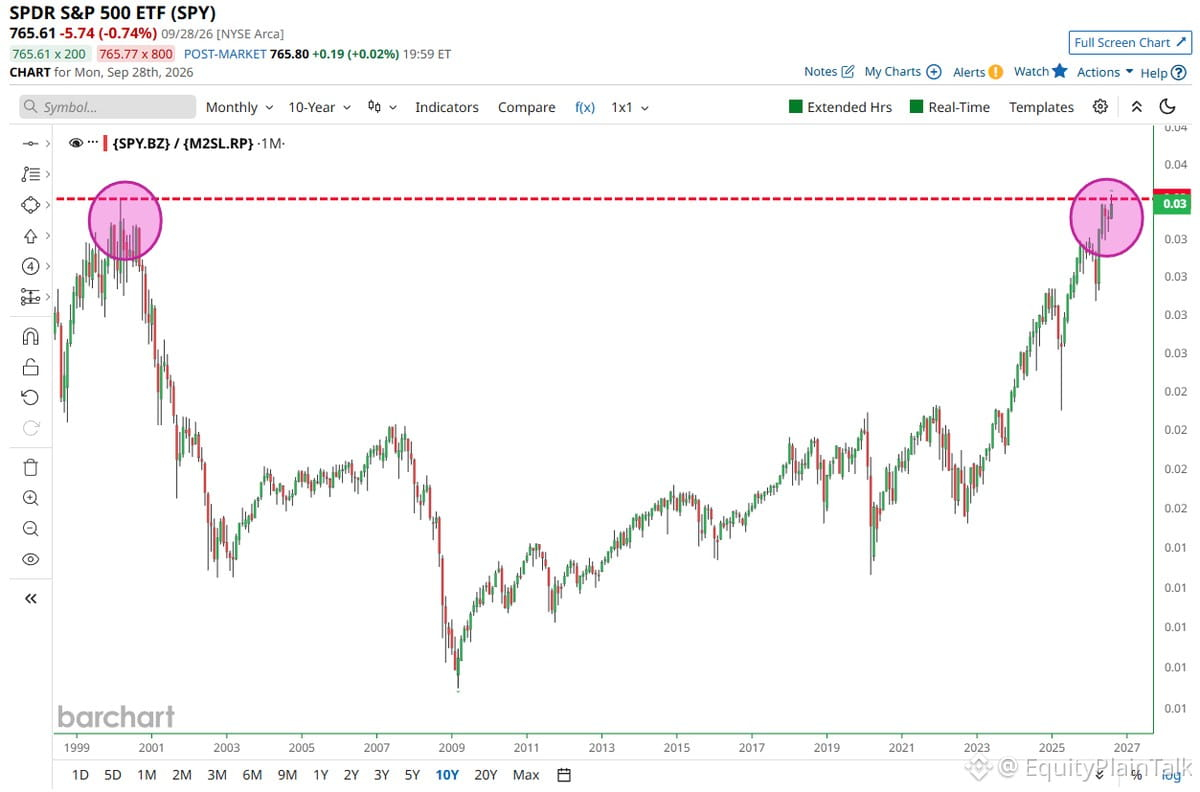
The S&P 500 relative to M2 money supply just broke above the dot-com bubble peak.
That's wild when you think about it. Back in 2000, stocks were expensive relative to the actual money floating around the system. We're now past that level.
What does this mean? Stocks have gotten pricey compared to liquidity. When the ratio gets stretched, it usually doesn't end quietly. Either money supply needs to catch up, or stock prices need to cool off.
Not saying we crash tomorrow. But historically, when this ratio spikes, the market finds a way to rebalance. Worth watching closely.
The S&P 500 relative to M2 money supply just broke above the dot-com bubble peak.
That's wild when you think about it. Back in 2000, stocks were expensive relative to the actual money floating around the system. We're now past that level.
What does this mean? Stocks have gotten pricey compared to liquidity. When the ratio gets stretched, it usually doesn't end quietly. Either money supply needs to catch up, or stock prices need to cool off.
Not saying we crash tomorrow. But historically, when this ratio spikes, the market finds a way to rebalance. Worth watching closely.
That's wild when you think about it. Back in 2000, stocks were expensive relative to the actual money floating around the system. We're now past that level.
What does this mean? Stocks have gotten pricey compared to liquidity. When the ratio gets stretched, it usually doesn't end quietly. Either money supply needs to catch up, or stock prices need to cool off.
Not saying we crash tomorrow. But historically, when this ratio spikes, the market finds a way to rebalance. Worth watching closely.
2
883
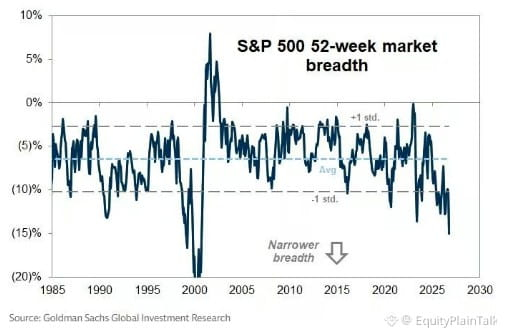
Market breadth is flashing warning signs.
The median $SPX stock is now trading 16% below its 52-week high. That's the weakest breadth we've seen since the Dot Com Bubble.
What does this mean? While the index itself might look fine thanks to a handful of mega-caps, the average stock is quietly bleeding. It's the classic "narrow market" setup where fewer and fewer names are doing the heavy lifting.
This kind of divergence has historically been a yellow flag. When breadth deteriorates this much, it often precedes broader weakness. Not a guarantee, but definitely something to watch.
If you're heavily concentrated in a few winners, might be worth checking how the rest of your portfolio is holding up.
Market breadth is flashing warning signs.
The median $SPX stock is now trading 16% below its 52-week high. That's the weakest breadth we've seen since the Dot Com Bubble.
What does this mean? While the index itself might look fine thanks to a handful of mega-caps, the average stock is quietly bleeding. It's the classic "narrow market" setup where fewer and fewer names are doing the heavy lifting.
This kind of divergence has historically been a yellow flag. When breadth deteriorates this much, it often precedes broader weakness. Not a guarantee, but definitely something to watch.
If you're heavily concentrated in a few winners, might be worth checking how the rest of your portfolio is holding up.
The median $SPX stock is now trading 16% below its 52-week high. That's the weakest breadth we've seen since the Dot Com Bubble.
What does this mean? While the index itself might look fine thanks to a handful of mega-caps, the average stock is quietly bleeding. It's the classic "narrow market" setup where fewer and fewer names are doing the heavy lifting.
This kind of divergence has historically been a yellow flag. When breadth deteriorates this much, it often precedes broader weakness. Not a guarantee, but definitely something to watch.
If you're heavily concentrated in a few winners, might be worth checking how the rest of your portfolio is holding up.
96
Log in to explore more content
Join global crypto users on Binance Square
⚡️ Get latest and useful information about crypto.
💬 Trusted by the world’s largest crypto exchange.
👍 Discover real insights from verified creators.
Email / Phone number
Trending Topics
QNTRises287%
771 views
69 Discussing
#qntrises287%
🚨 $QNT JUST EXPLODED +287%! 🚀🔥
Quant is making a massive move, sending traders into full FOMO mode. 👀
📈 +287% SURGE
🔥 Momentum accelerating
🐂 Bulls taking control
🎯 Now the BIG question: WHAT’S NEXT?
After a move this explosive, traders are watching closely to see whether $QNT can keep the bullish trend going or enter a cooldown.
NEW ATH NEXT? 👀🚀
👇 What’s your next $QNT target?
#QNT #Quant #crypto
Faizan Crypto Learner
·0 Likes
·149 views
TrumpRejectsAIRulesForVoluntaryAudits
4,486 views
227 Discussing
BitgetHotWalletBreachTiedToThirdPartySecurityFlaw
2,253 views
170 Discussing